Brownstown, IN Map & Demographics
Brownstown Map
Brownstown Overview
$30,692
PER CAPITA INCOME
$64,342
AVG FAMILY INCOME
$60,393
AVG HOUSEHOLD INCOME
32.8%
WAGE / INCOME GAP [ % ]
67.2¢/ $1
WAGE / INCOME GAP [ $ ]
0.43
INEQUALITY / GINI INDEX
3,015
TOTAL POPULATION
1,414
MALE POPULATION
1,601
FEMALE POPULATION
88.32
MALES / 100 FEMALES
113.22
FEMALES / 100 MALES
45.3
MEDIAN AGE
2.9
AVG FAMILY SIZE
2.4
AVG HOUSEHOLD SIZE
1,178
LABOR FORCE [ PEOPLE ]
51.1%
PERCENT IN LABOR FORCE
1.9%
UNEMPLOYMENT RATE
Brownstown Zip Codes
Brownstown Area Codes
Income in Brownstown
Income Overview in Brownstown
Per Capita Income in Brownstown is $30,692, while median incomes of families and households are $64,342 and $60,393 respectively.
| Characteristic | Number | Measure |
| Per Capita Income | 3,015 | $30,692 |
| Median Family Income | 812 | $64,342 |
| Mean Family Income | 812 | $91,518 |
| Median Household Income | 1,184 | $60,393 |
| Mean Household Income | 1,184 | $76,739 |
| Income Deficit | 812 | $0 |
| Wage / Income Gap (%) | 3,015 | 32.79% |
| Wage / Income Gap ($) | 3,015 | 67.21¢ per $1 |
| Gini / Inequality Index | 3,015 | 0.43 |
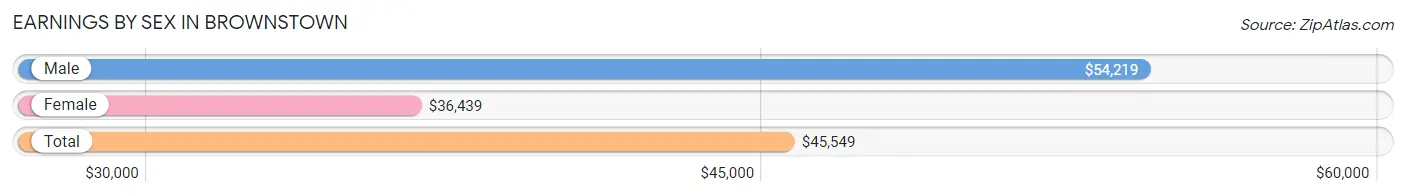
Earnings by Sex in Brownstown
Average Earnings in Brownstown are $45,549, $54,219 for men and $36,439 for women, a difference of 32.8%.
| Sex | Number | Average Earnings |
| Male | 578 (46.2%) | $54,219 |
| Female | 672 (53.8%) | $36,439 |
| Total | 1,250 (100.0%) | $45,549 |
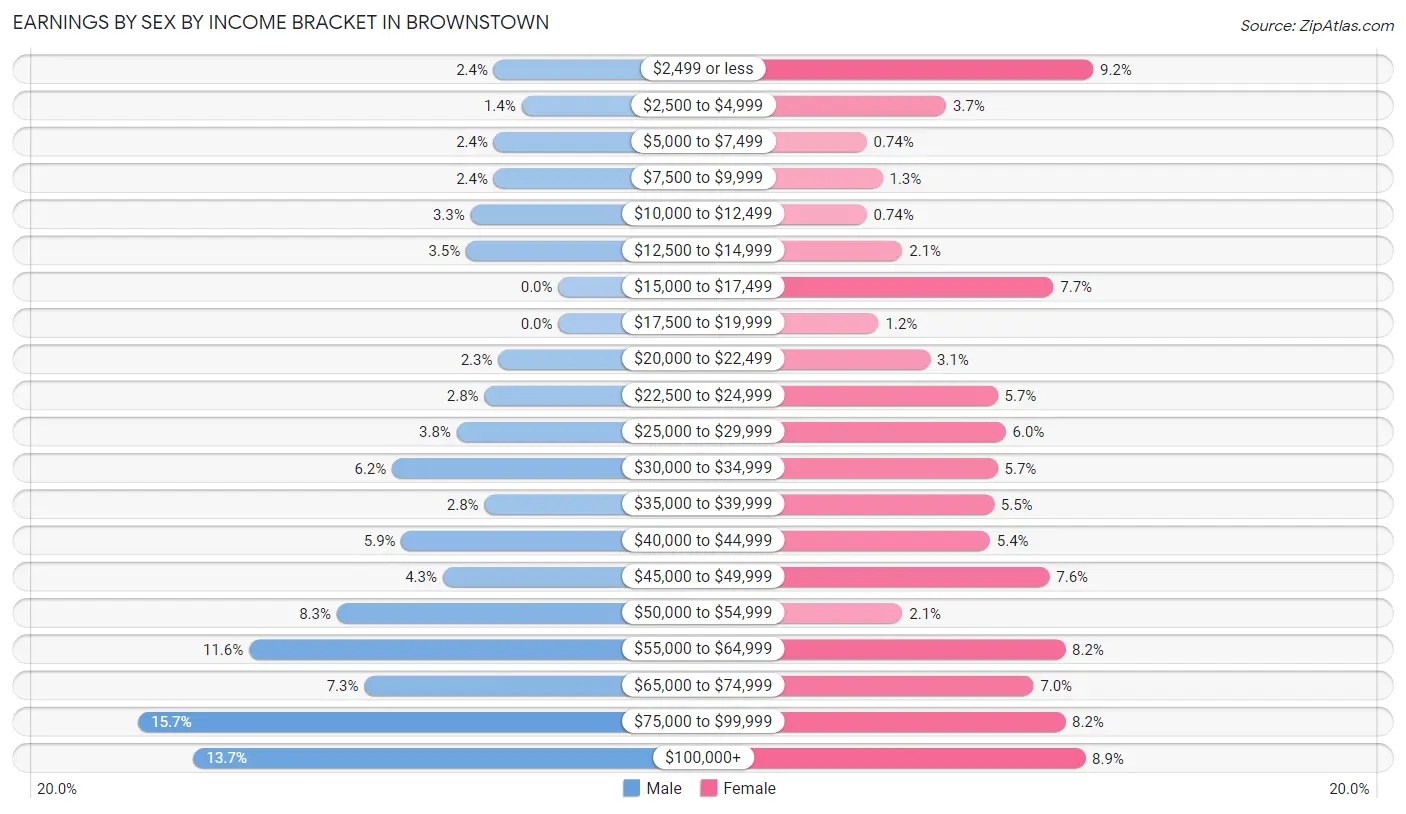
Earnings by Sex by Income Bracket in Brownstown
The most common earnings brackets in Brownstown are $75,000 to $99,999 for men (91 | 15.7%) and $2,499 or less for women (62 | 9.2%).
| Income | Male | Female |
| $2,499 or less | 14 (2.4%) | 62 (9.2%) |
| $2,500 to $4,999 | 8 (1.4%) | 25 (3.7%) |
| $5,000 to $7,499 | 14 (2.4%) | 5 (0.7%) |
| $7,500 to $9,999 | 14 (2.4%) | 9 (1.3%) |
| $10,000 to $12,499 | 19 (3.3%) | 5 (0.7%) |
| $12,500 to $14,999 | 20 (3.5%) | 14 (2.1%) |
| $15,000 to $17,499 | 0 (0.0%) | 52 (7.7%) |
| $17,500 to $19,999 | 0 (0.0%) | 8 (1.2%) |
| $20,000 to $22,499 | 13 (2.2%) | 21 (3.1%) |
| $22,500 to $24,999 | 16 (2.8%) | 38 (5.7%) |
| $25,000 to $29,999 | 22 (3.8%) | 40 (5.9%) |
| $30,000 to $34,999 | 36 (6.2%) | 38 (5.7%) |
| $35,000 to $39,999 | 16 (2.8%) | 37 (5.5%) |
| $40,000 to $44,999 | 34 (5.9%) | 36 (5.4%) |
| $45,000 to $49,999 | 25 (4.3%) | 51 (7.6%) |
| $50,000 to $54,999 | 48 (8.3%) | 14 (2.1%) |
| $55,000 to $64,999 | 67 (11.6%) | 55 (8.2%) |
| $65,000 to $74,999 | 42 (7.3%) | 47 (7.0%) |
| $75,000 to $99,999 | 91 (15.7%) | 55 (8.2%) |
| $100,000+ | 79 (13.7%) | 60 (8.9%) |
| Total | 578 (100.0%) | 672 (100.0%) |
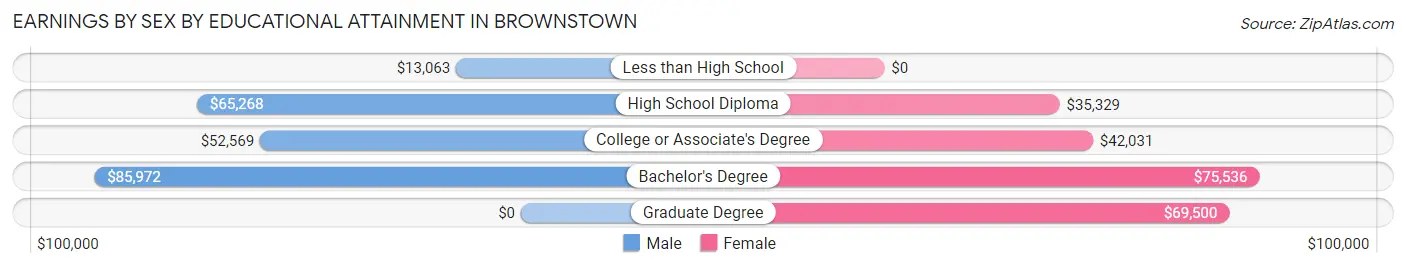
Earnings by Sex by Educational Attainment in Brownstown
Average earnings in Brownstown are $55,972 for men and $43,558 for women, a difference of 22.2%. Men with an educational attainment of bachelor's degree enjoy the highest average annual earnings of $85,972, while those with less than high school education earn the least with $13,063. Women with an educational attainment of bachelor's degree earn the most with the average annual earnings of $75,536, while those with high school diploma education have the smallest earnings of $35,329.
| Educational Attainment | Male Income | Female Income |
| Less than High School | $13,063 | $0 |
| High School Diploma | $65,268 | $35,329 |
| College or Associate's Degree | $52,569 | $42,031 |
| Bachelor's Degree | $85,972 | $75,536 |
| Graduate Degree | - | - |
| Total | $55,972 | $43,558 |
Family Income in Brownstown
Family Income Brackets in Brownstown
According to the Brownstown family income data, there are 180 families falling into the $50,000 to $74,999 income range, which is the most common income bracket and makes up 22.2% of all families. Conversely, the less than $10,000 income bracket is the least frequent group with only 9 families (1.1%) belonging to this category.
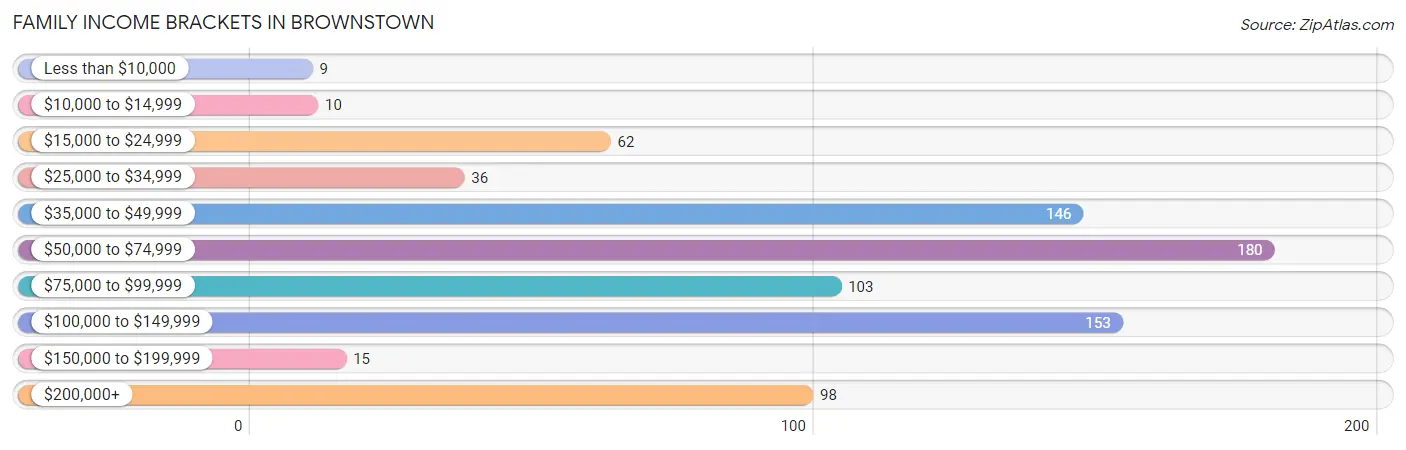
| Income Bracket | # Families | % Families |
| Less than $10,000 | 9 | 1.1% |
| $10,000 to $14,999 | 10 | 1.2% |
| $15,000 to $24,999 | 62 | 7.6% |
| $25,000 to $34,999 | 36 | 4.4% |
| $35,000 to $49,999 | 146 | 18.0% |
| $50,000 to $74,999 | 180 | 22.2% |
| $75,000 to $99,999 | 103 | 12.7% |
| $100,000 to $149,999 | 153 | 18.8% |
| $150,000 to $199,999 | 15 | 1.8% |
| $200,000+ | 98 | 12.1% |
Family Income by Famaliy Size in Brownstown
4-person families (76 | 9.4%) account for the highest median family income in Brownstown with $120,714 per family, while 4-person families (76 | 9.4%) have the highest median income of $30,178 per family member.
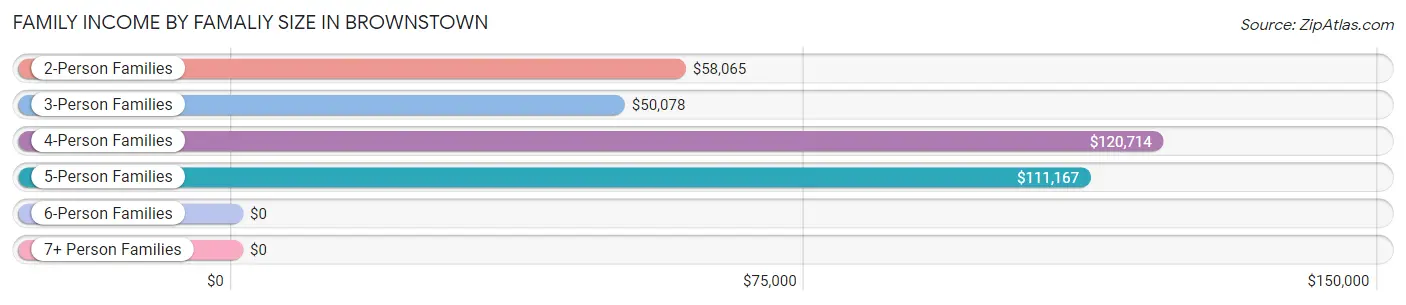
| Income Bracket | # Families | Median Income |
| 2-Person Families | 453 (55.8%) | $58,065 |
| 3-Person Families | 113 (13.9%) | $50,078 |
| 4-Person Families | 76 (9.4%) | $120,714 |
| 5-Person Families | 124 (15.3%) | $111,167 |
| 6-Person Families | 7 (0.9%) | $0 |
| 7+ Person Families | 39 (4.8%) | $0 |
| Total | 812 (100.0%) | $64,342 |
Family Income by Number of Earners in Brownstown
The median family income in Brownstown is $64,342, with families comprising 3+ earners (59) having the highest median family income of $207,708, while families with no earners (209) have the lowest median family income of $39,163, accounting for 7.3% and 25.7% of families, respectively.
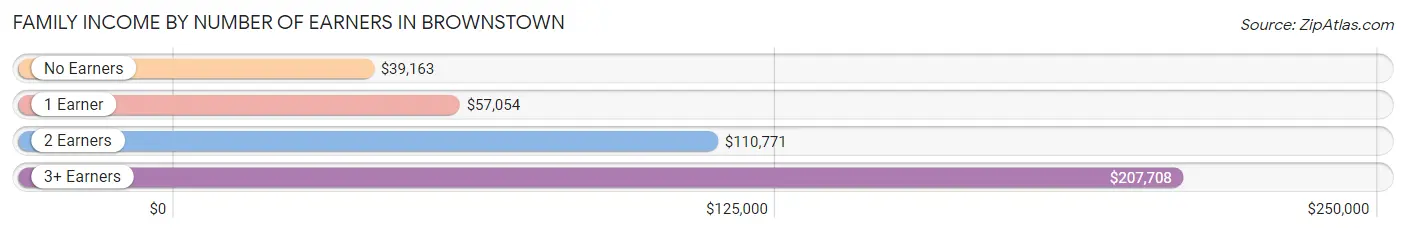
| Number of Earners | # Families | Median Income |
| No Earners | 209 (25.7%) | $39,163 |
| 1 Earner | 265 (32.6%) | $57,054 |
| 2 Earners | 279 (34.4%) | $110,771 |
| 3+ Earners | 59 (7.3%) | $207,708 |
| Total | 812 (100.0%) | $64,342 |
Household Income in Brownstown
Household Income Brackets in Brownstown
With 260 households falling in the category, the $50,000 to $74,999 income range is the most frequent in Brownstown, accounting for 22.0% of all households. In contrast, only 15 households (1.3%) fall into the $150,000 to $199,999 income bracket, making it the least populous group.
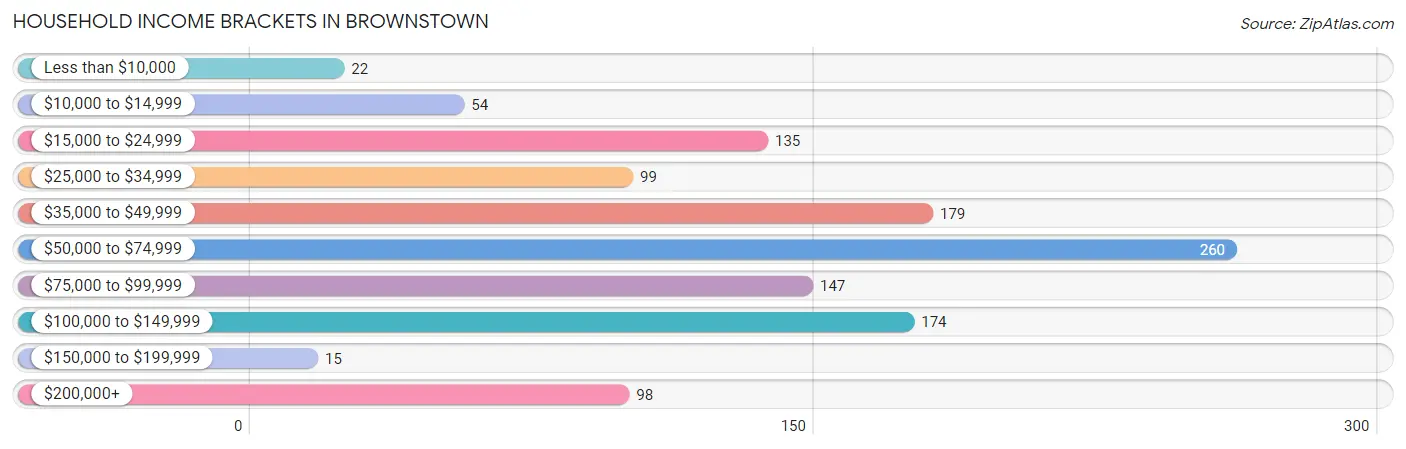
| Income Bracket | # Households | % Households |
| Less than $10,000 | 22 | 1.9% |
| $10,000 to $14,999 | 54 | 4.6% |
| $15,000 to $24,999 | 135 | 11.4% |
| $25,000 to $34,999 | 99 | 8.4% |
| $35,000 to $49,999 | 179 | 15.1% |
| $50,000 to $74,999 | 260 | 22.0% |
| $75,000 to $99,999 | 147 | 12.4% |
| $100,000 to $149,999 | 174 | 14.7% |
| $150,000 to $199,999 | 15 | 1.3% |
| $200,000+ | 98 | 8.3% |
Household Income by Householder Age in Brownstown
The median household income in Brownstown is $60,393, with the highest median household income of $91,544 found in the 25 to 44 years age bracket for the primary householder. A total of 265 households (22.4%) fall into this category. Meanwhile, the 15 to 24 years age bracket for the primary householder has the lowest median household income of $0, with 22 households (1.9%) in this group.
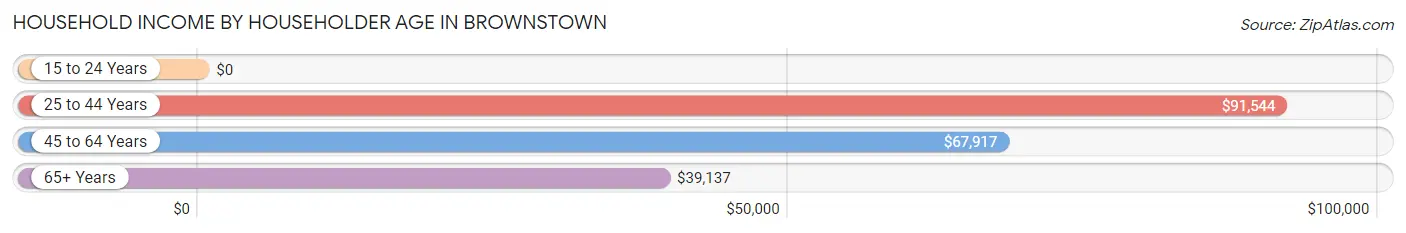
| Income Bracket | # Households | Median Income |
| 15 to 24 Years | 22 (1.9%) | $0 |
| 25 to 44 Years | 265 (22.4%) | $91,544 |
| 45 to 64 Years | 407 (34.4%) | $67,917 |
| 65+ Years | 490 (41.4%) | $39,137 |
| Total | 1,184 (100.0%) | $60,393 |
Poverty in Brownstown
Income Below Poverty by Sex and Age in Brownstown
With 12.8% poverty level for males and 11.8% for females among the residents of Brownstown, 5 year old males and 16 and 17 year old females are the most vulnerable to poverty, with 12 males (63.2%) and 7 females (29.2%) in their respective age groups living below the poverty level.
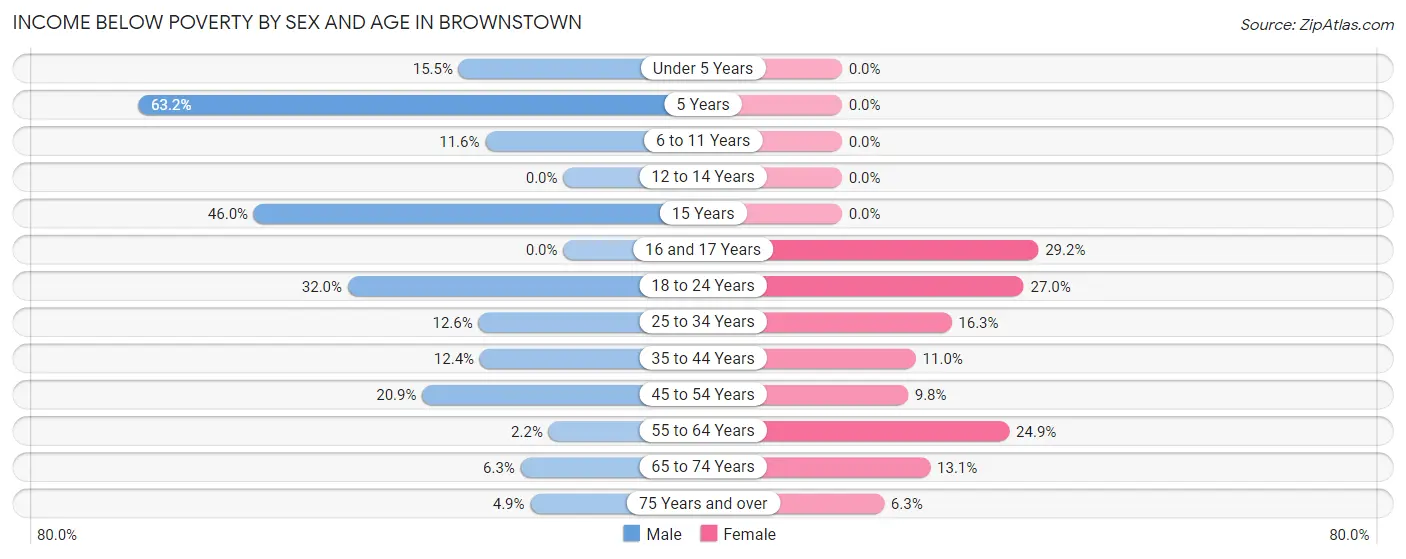
| Age Bracket | Male | Female |
| Under 5 Years | 16 (15.5%) | 0 (0.0%) |
| 5 Years | 12 (63.2%) | 0 (0.0%) |
| 6 to 11 Years | 16 (11.6%) | 0 (0.0%) |
| 12 to 14 Years | 0 (0.0%) | 0 (0.0%) |
| 15 Years | 17 (46.0%) | 0 (0.0%) |
| 16 and 17 Years | 0 (0.0%) | 7 (29.2%) |
| 18 to 24 Years | 16 (32.0%) | 27 (27.0%) |
| 25 to 34 Years | 18 (12.6%) | 27 (16.3%) |
| 35 to 44 Years | 14 (12.4%) | 17 (11.0%) |
| 45 to 54 Years | 40 (20.9%) | 20 (9.8%) |
| 55 to 64 Years | 2 (2.2%) | 42 (24.8%) |
| 65 to 74 Years | 17 (6.3%) | 32 (13.1%) |
| 75 Years and over | 7 (4.9%) | 7 (6.2%) |
| Total | 175 (12.8%) | 179 (11.8%) |
Income Above Poverty by Sex and Age in Brownstown
According to the poverty statistics in Brownstown, males aged 12 to 14 years and females aged under 5 years are the age groups that are most secure financially, with 100.0% of males and 100.0% of females in these age groups living above the poverty line.
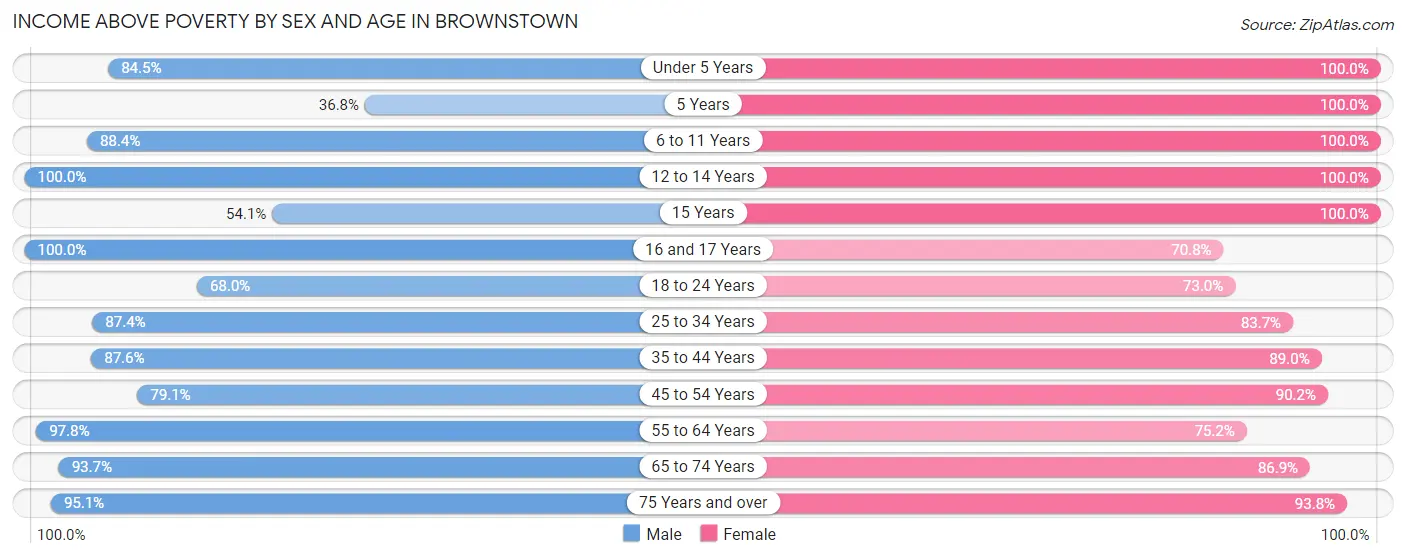
| Age Bracket | Male | Female |
| Under 5 Years | 87 (84.5%) | 85 (100.0%) |
| 5 Years | 7 (36.8%) | 65 (100.0%) |
| 6 to 11 Years | 122 (88.4%) | 81 (100.0%) |
| 12 to 14 Years | 51 (100.0%) | 71 (100.0%) |
| 15 Years | 20 (54.0%) | 39 (100.0%) |
| 16 and 17 Years | 22 (100.0%) | 17 (70.8%) |
| 18 to 24 Years | 34 (68.0%) | 73 (73.0%) |
| 25 to 34 Years | 125 (87.4%) | 139 (83.7%) |
| 35 to 44 Years | 99 (87.6%) | 138 (89.0%) |
| 45 to 54 Years | 151 (79.1%) | 184 (90.2%) |
| 55 to 64 Years | 90 (97.8%) | 127 (75.1%) |
| 65 to 74 Years | 251 (93.7%) | 212 (86.9%) |
| 75 Years and over | 136 (95.1%) | 105 (93.8%) |
| Total | 1,195 (87.2%) | 1,336 (88.2%) |
Income Below Poverty Among Married-Couple Families in Brownstown
The poverty statistics for married-couple families in Brownstown show that 1.0% or 6 of the total 622 families live below the poverty line. Families with no children have the highest poverty rate of 1.5%, comprising of 6 families. On the other hand, families with 1 or 2 children have the lowest poverty rate of 0.0%, which includes 0 families.
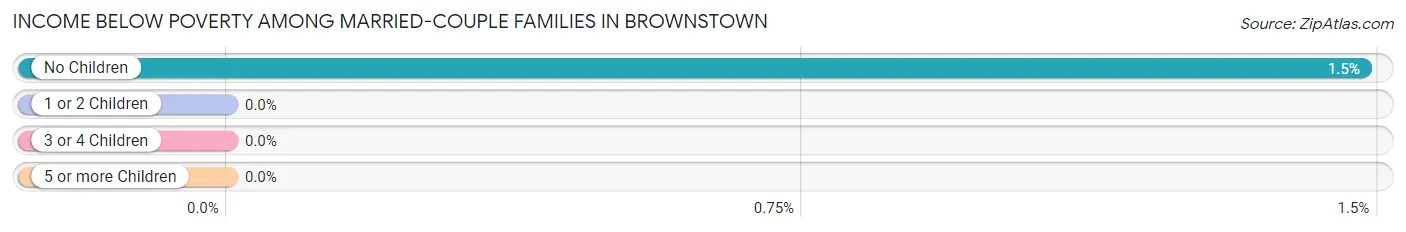
| Children | Above Poverty | Below Poverty |
| No Children | 400 (98.5%) | 6 (1.5%) |
| 1 or 2 Children | 126 (100.0%) | 0 (0.0%) |
| 3 or 4 Children | 51 (100.0%) | 0 (0.0%) |
| 5 or more Children | 39 (100.0%) | 0 (0.0%) |
| Total | 616 (99.0%) | 6 (1.0%) |
Income Below Poverty Among Single-Parent Households in Brownstown
According to the poverty data in Brownstown, 12.5% or 6 single-father households and 44.4% or 63 single-mother households are living below the poverty line. Among single-father households, those with 1 or 2 children have the highest poverty rate, with 6 households (27.3%) experiencing poverty. Likewise, among single-mother households, those with 1 or 2 children have the highest poverty rate, with 42 households (63.6%) falling below the poverty line.
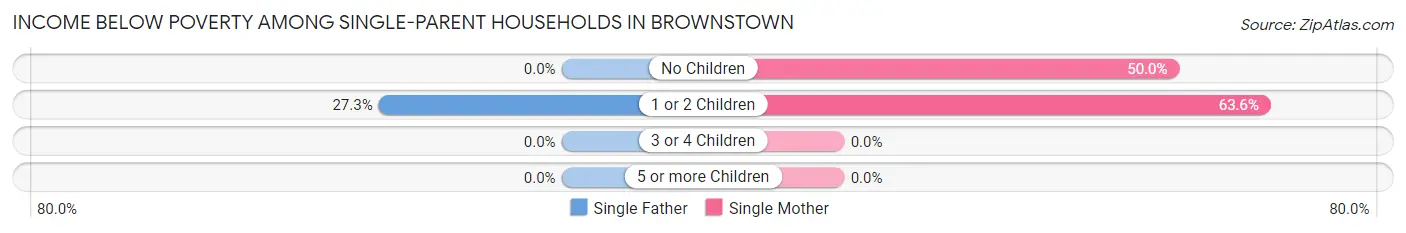
| Children | Single Father | Single Mother |
| No Children | 0 (0.0%) | 21 (50.0%) |
| 1 or 2 Children | 6 (27.3%) | 42 (63.6%) |
| 3 or 4 Children | 0 (0.0%) | 0 (0.0%) |
| 5 or more Children | 0 (0.0%) | 0 (0.0%) |
| Total | 6 (12.5%) | 63 (44.4%) |
Income Below Poverty Among Married-Couple vs Single-Parent Households in Brownstown
The poverty data for Brownstown shows that 6 of the married-couple family households (1.0%) and 69 of the single-parent households (36.3%) are living below the poverty level. Within the married-couple family households, those with no children have the highest poverty rate, with 6 households (1.5%) falling below the poverty line. Among the single-parent households, those with 1 or 2 children have the highest poverty rate, with 48 household (54.5%) living below poverty.
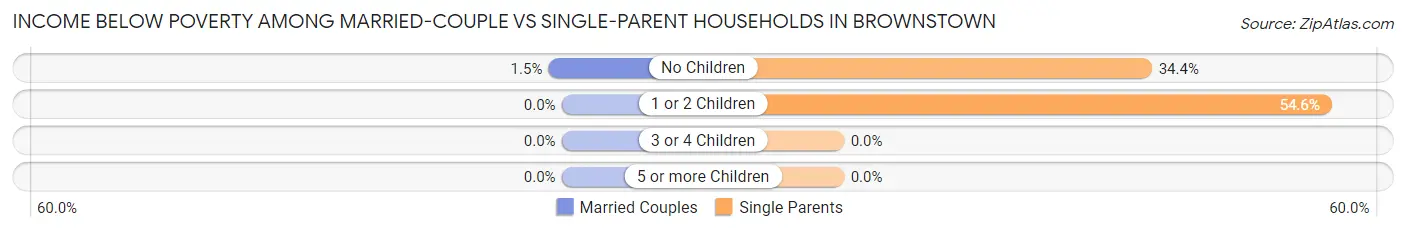
| Children | Married-Couple Families | Single-Parent Households |
| No Children | 6 (1.5%) | 21 (34.4%) |
| 1 or 2 Children | 0 (0.0%) | 48 (54.5%) |
| 3 or 4 Children | 0 (0.0%) | 0 (0.0%) |
| 5 or more Children | 0 (0.0%) | 0 (0.0%) |
| Total | 6 (1.0%) | 69 (36.3%) |
Race in Brownstown
The most populous races in Brownstown are White / Caucasian (2,990 | 99.2%), Asian (20 | 0.7%), and Black / African American (4 | 0.1%).
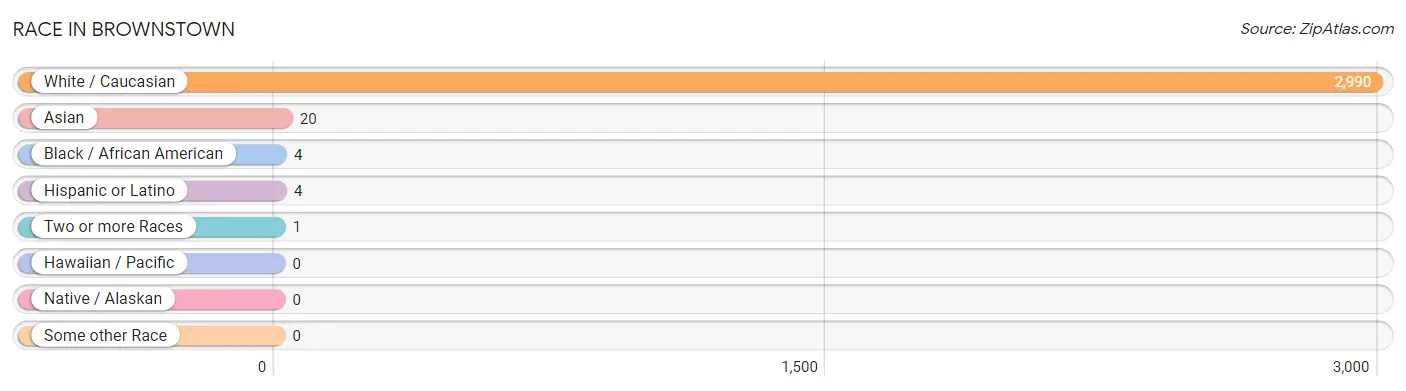
| Race | # Population | % Population |
| Asian | 20 | 0.7% |
| Black / African American | 4 | 0.1% |
| Hawaiian / Pacific | 0 | 0.0% |
| Hispanic or Latino | 4 | 0.1% |
| Native / Alaskan | 0 | 0.0% |
| White / Caucasian | 2,990 | 99.2% |
| Two or more Races | 1 | 0.0% |
| Some other Race | 0 | 0.0% |
| Total | 3,015 | 100.0% |
Ancestry in Brownstown
The most populous ancestries reported in Brownstown are German (807 | 26.8%), English (358 | 11.9%), Irish (335 | 11.1%), American (220 | 7.3%), and Welsh (112 | 3.7%), together accounting for 60.8% of all Brownstown residents.
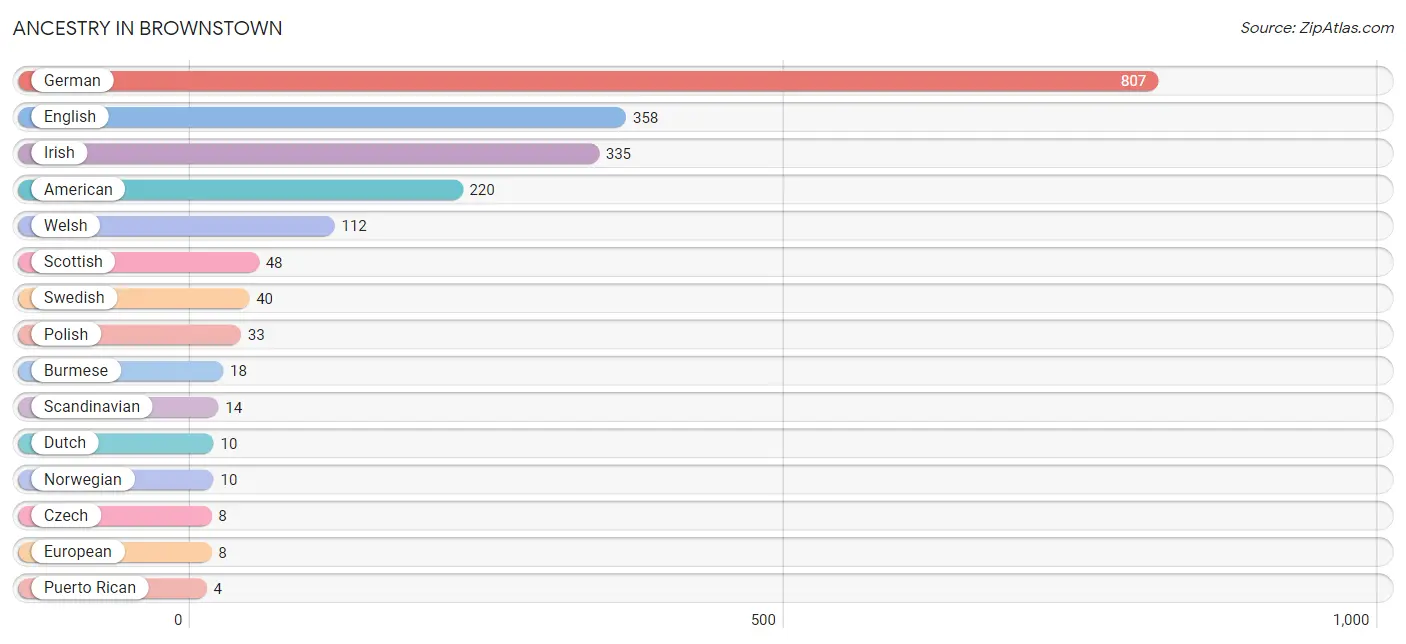
| Ancestry | # Population | % Population |
| American | 220 | 7.3% |
| British | 3 | 0.1% |
| Burmese | 18 | 0.6% |
| Cherokee | 1 | 0.0% |
| Czech | 8 | 0.3% |
| Dutch | 10 | 0.3% |
| English | 358 | 11.9% |
| European | 8 | 0.3% |
| German | 807 | 26.8% |
| Indian (Asian) | 2 | 0.1% |
| Irish | 335 | 11.1% |
| Norwegian | 10 | 0.3% |
| Polish | 33 | 1.1% |
| Puerto Rican | 4 | 0.1% |
| Scandinavian | 14 | 0.5% |
| Scottish | 48 | 1.6% |
| Swedish | 40 | 1.3% |
| Welsh | 112 | 3.7% | View All 18 Rows |
Immigrants in Brownstown
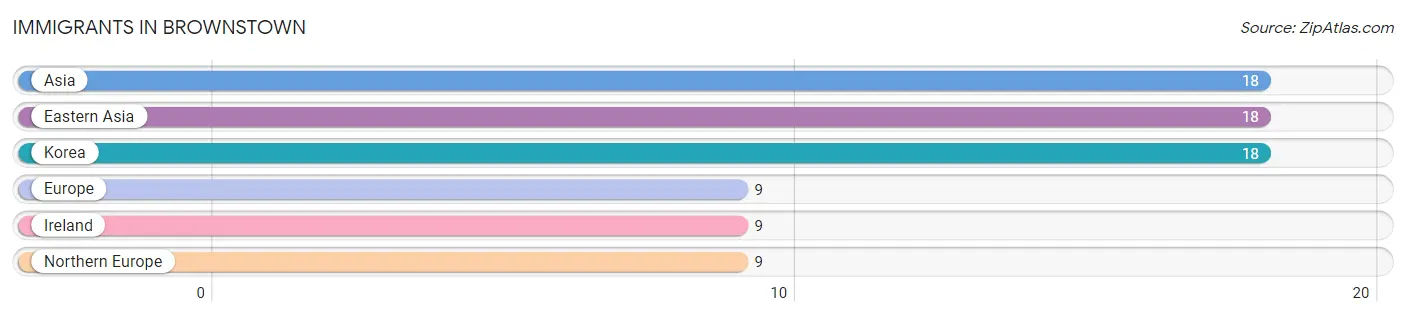
The most numerous immigrant groups reported in Brownstown came from Asia (18 | 0.6%), Eastern Asia (18 | 0.6%), Korea (18 | 0.6%), Europe (9 | 0.3%), and Ireland (9 | 0.3%), together accounting for 2.4% of all Brownstown residents.
| Immigration Origin | # Population | % Population |
| Asia | 18 | 0.6% |
| Eastern Asia | 18 | 0.6% |
| Europe | 9 | 0.3% |
| Ireland | 9 | 0.3% |
| Korea | 18 | 0.6% |
| Northern Europe | 9 | 0.3% | View All 6 Rows |
Sex and Age in Brownstown
Sex and Age in Brownstown
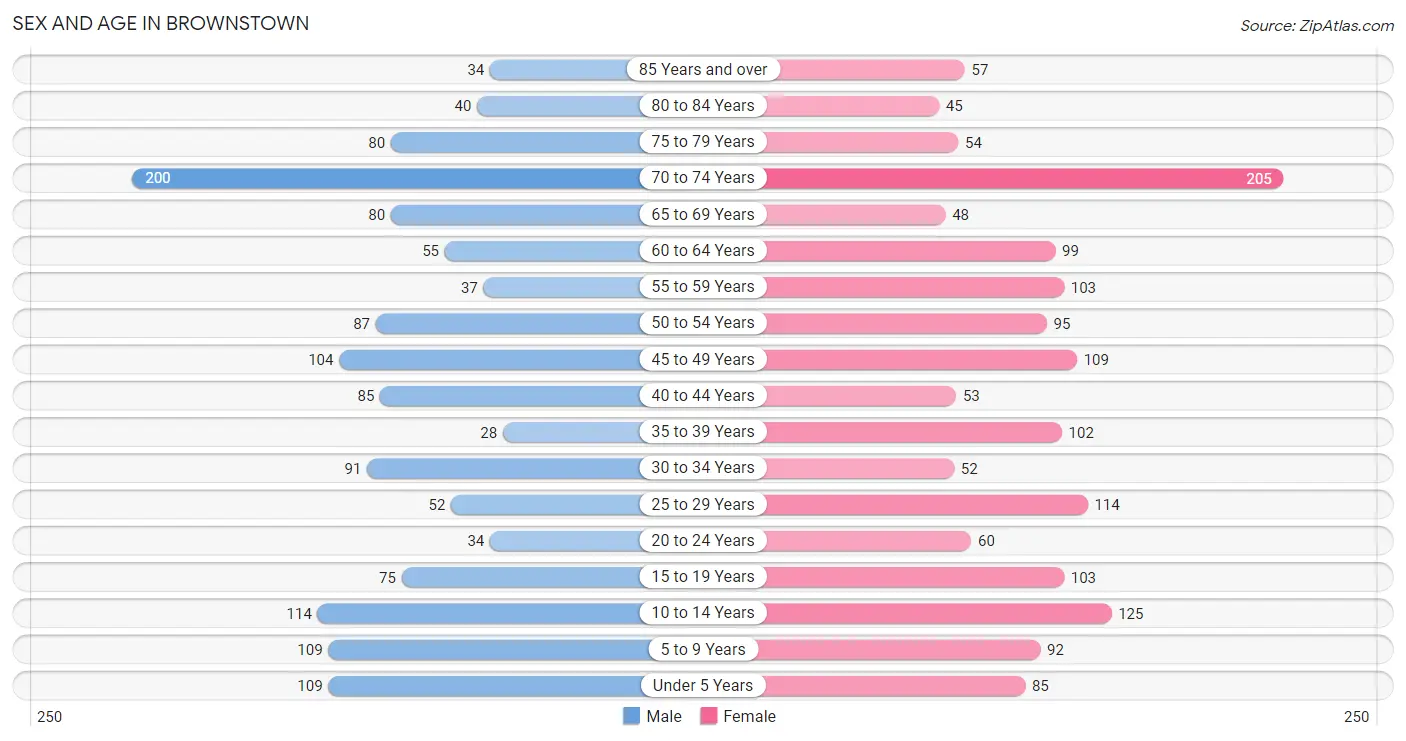
The most populous age groups in Brownstown are 70 to 74 Years (200 | 14.1%) for men and 70 to 74 Years (205 | 12.8%) for women.
| Age Bracket | Male | Female |
| Under 5 Years | 109 (7.7%) | 85 (5.3%) |
| 5 to 9 Years | 109 (7.7%) | 92 (5.8%) |
| 10 to 14 Years | 114 (8.1%) | 125 (7.8%) |
| 15 to 19 Years | 75 (5.3%) | 103 (6.4%) |
| 20 to 24 Years | 34 (2.4%) | 60 (3.7%) |
| 25 to 29 Years | 52 (3.7%) | 114 (7.1%) |
| 30 to 34 Years | 91 (6.4%) | 52 (3.3%) |
| 35 to 39 Years | 28 (2.0%) | 102 (6.4%) |
| 40 to 44 Years | 85 (6.0%) | 53 (3.3%) |
| 45 to 49 Years | 104 (7.4%) | 109 (6.8%) |
| 50 to 54 Years | 87 (6.1%) | 95 (5.9%) |
| 55 to 59 Years | 37 (2.6%) | 103 (6.4%) |
| 60 to 64 Years | 55 (3.9%) | 99 (6.2%) |
| 65 to 69 Years | 80 (5.7%) | 48 (3.0%) |
| 70 to 74 Years | 200 (14.1%) | 205 (12.8%) |
| 75 to 79 Years | 80 (5.7%) | 54 (3.4%) |
| 80 to 84 Years | 40 (2.8%) | 45 (2.8%) |
| 85 Years and over | 34 (2.4%) | 57 (3.6%) |
| Total | 1,414 (100.0%) | 1,601 (100.0%) |
Families and Households in Brownstown
Median Family Size in Brownstown
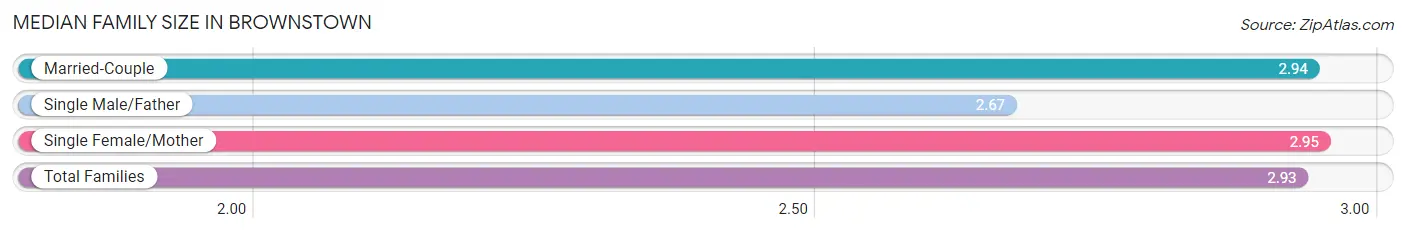
The median family size in Brownstown is 2.93 persons per family, with single female/mother families (142 | 17.5%) accounting for the largest median family size of 2.95 persons per family. On the other hand, single male/father families (48 | 5.9%) represent the smallest median family size with 2.67 persons per family.
| Family Type | # Families | Family Size |
| Married-Couple | 622 (76.6%) | 2.94 |
| Single Male/Father | 48 (5.9%) | 2.67 |
| Single Female/Mother | 142 (17.5%) | 2.95 |
| Total Families | 812 (100.0%) | 2.93 |
Median Household Size in Brownstown
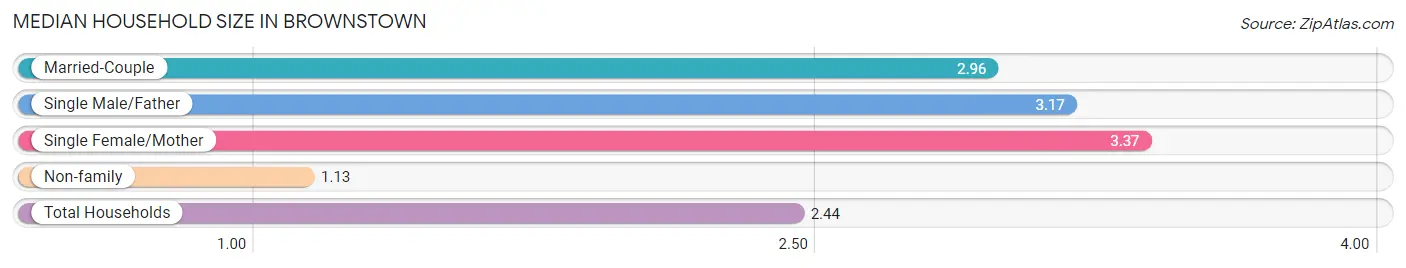
The median household size in Brownstown is 2.44 persons per household, with single female/mother households (142 | 12.0%) accounting for the largest median household size of 3.37 persons per household. non-family households (372 | 31.4%) represent the smallest median household size with 1.13 persons per household.
| Household Type | # Households | Household Size |
| Married-Couple | 622 (52.5%) | 2.96 |
| Single Male/Father | 48 (4.1%) | 3.17 |
| Single Female/Mother | 142 (12.0%) | 3.37 |
| Non-family | 372 (31.4%) | 1.13 |
| Total Households | 1,184 (100.0%) | 2.44 |
Household Size by Marriage Status in Brownstown
Out of a total of 1,184 households in Brownstown, 812 (68.6%) are family households, while 372 (31.4%) are nonfamily households. The most numerous type of family households are 2-person households, comprising 420, and the most common type of nonfamily households are 1-person households, comprising 335.
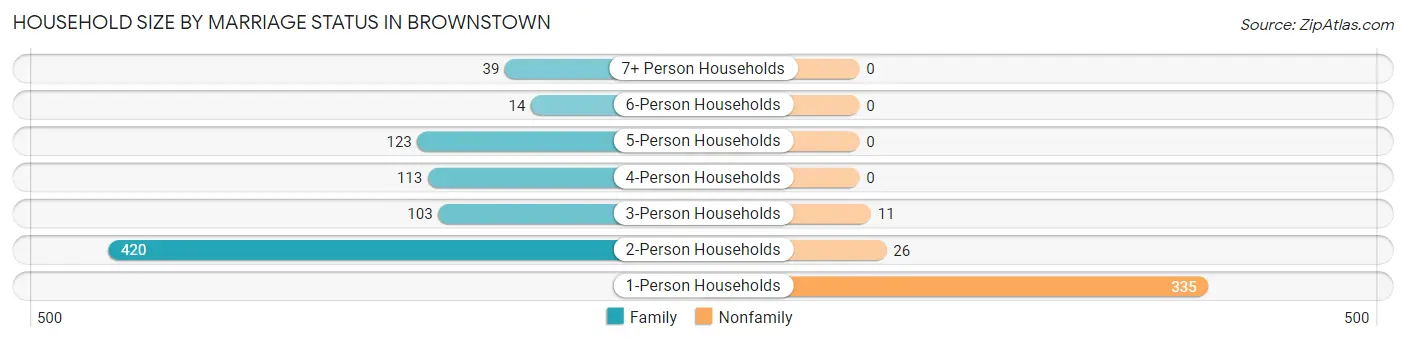
| Household Size | Family Households | Nonfamily Households |
| 1-Person Households | - | 335 (28.3%) |
| 2-Person Households | 420 (35.5%) | 26 (2.2%) |
| 3-Person Households | 103 (8.7%) | 11 (0.9%) |
| 4-Person Households | 113 (9.5%) | 0 (0.0%) |
| 5-Person Households | 123 (10.4%) | 0 (0.0%) |
| 6-Person Households | 14 (1.2%) | 0 (0.0%) |
| 7+ Person Households | 39 (3.3%) | 0 (0.0%) |
| Total | 812 (68.6%) | 372 (31.4%) |
Female Fertility in Brownstown
Fertility by Age in Brownstown
Average fertility rate in Brownstown is 54.0 births per 1,000 women. Women in the age bracket of 35 to 50 years have the highest fertility rate with 83.0 births per 1,000 women. Women in the age bracket of 35 to 50 years acount for 69.7% of all women with births.
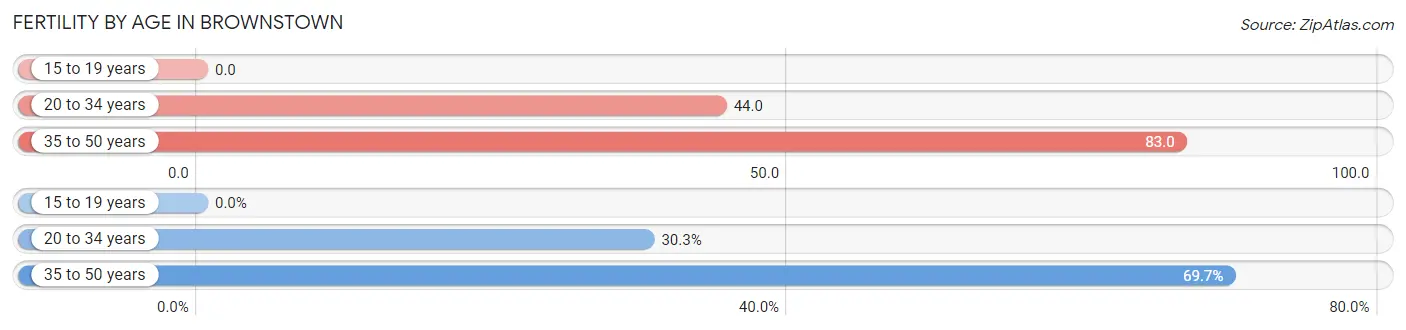
| Age Bracket | Women with Births | Births / 1,000 Women |
| 15 to 19 years | 0 (0.0%) | 0.0 |
| 20 to 34 years | 10 (30.3%) | 44.0 |
| 35 to 50 years | 23 (69.7%) | 83.0 |
| Total | 33 (100.0%) | 54.0 |
Fertility by Age by Marriage Status in Brownstown
69.7% of women with births (33) in Brownstown are married. The highest percentage of unmarried women with births falls into 20 to 34 years age bracket with 100.0% of them unmarried at the time of birth, while the lowest percentage of unmarried women with births belong to 35 to 50 years age bracket with 0.0% of them unmarried.
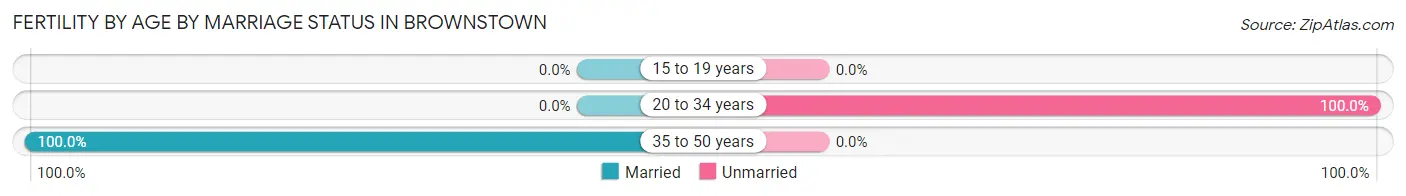
| Age Bracket | Married | Unmarried |
| 15 to 19 years | 0 (0.0%) | 0 (0.0%) |
| 20 to 34 years | 0 (0.0%) | 10 (100.0%) |
| 35 to 50 years | 23 (100.0%) | 0 (0.0%) |
| Total | 23 (69.7%) | 10 (30.3%) |
Fertility by Education in Brownstown
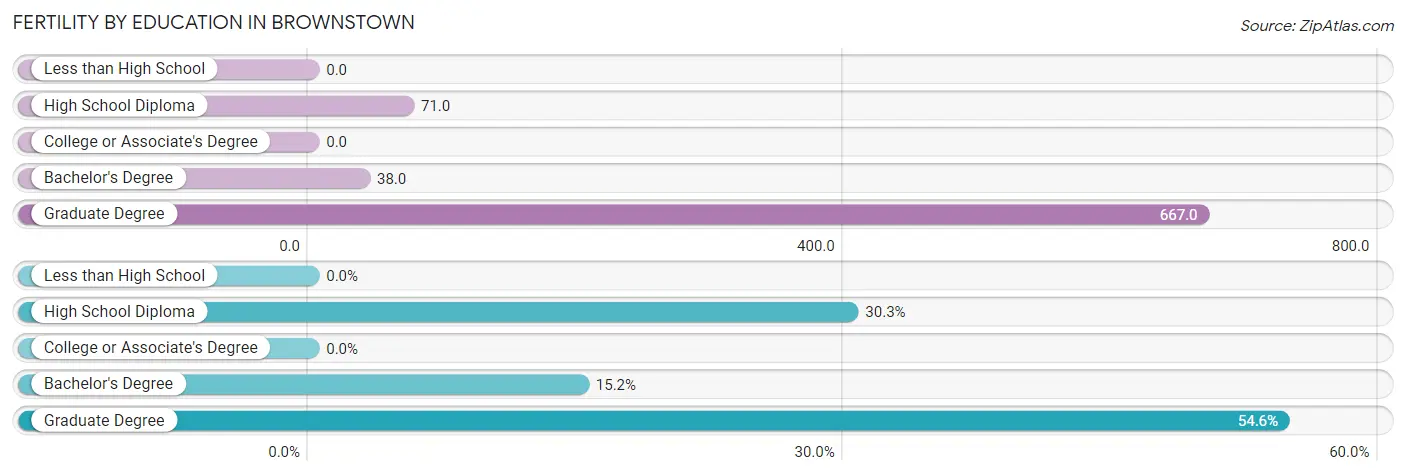
| Educational Attainment | Women with Births | Births / 1,000 Women |
| Less than High School | 0 (0.0%) | 0.0 |
| High School Diploma | 10 (30.3%) | 71.0 |
| College or Associate's Degree | 0 (0.0%) | 0.0 |
| Bachelor's Degree | 5 (15.1%) | 38.0 |
| Graduate Degree | 18 (54.5%) | 667.0 |
| Total | 33 (100.0%) | 54.0 |
Fertility by Education by Marriage Status in Brownstown
30.3% of women with births in Brownstown are unmarried. Women with the educational attainment of bachelor's degree are most likely to be married with 100.0% of them married at childbirth, while women with the educational attainment of high school diploma are least likely to be married with 100.0% of them unmarried at childbirth.
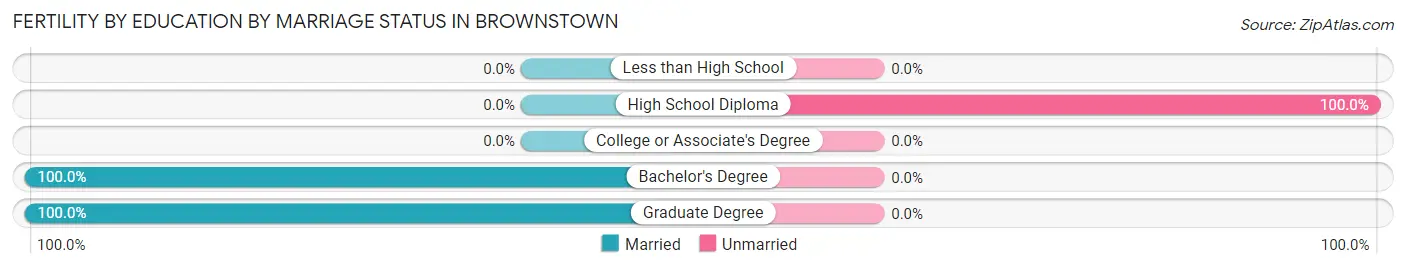
| Educational Attainment | Married | Unmarried |
| Less than High School | 0 (0.0%) | 0 (0.0%) |
| High School Diploma | 0 (0.0%) | 10 (100.0%) |
| College or Associate's Degree | 0 (0.0%) | 0 (0.0%) |
| Bachelor's Degree | 5 (100.0%) | 0 (0.0%) |
| Graduate Degree | 18 (100.0%) | 0 (0.0%) |
| Total | 23 (69.7%) | 10 (30.3%) |
Employment Characteristics in Brownstown
Employment by Class of Employer in Brownstown
Among the 1,104 employed individuals in Brownstown, private company employees (761 | 68.9%), local government employees (112 | 10.1%), and not-for-profit organizations (105 | 9.5%) make up the most common classes of employment.
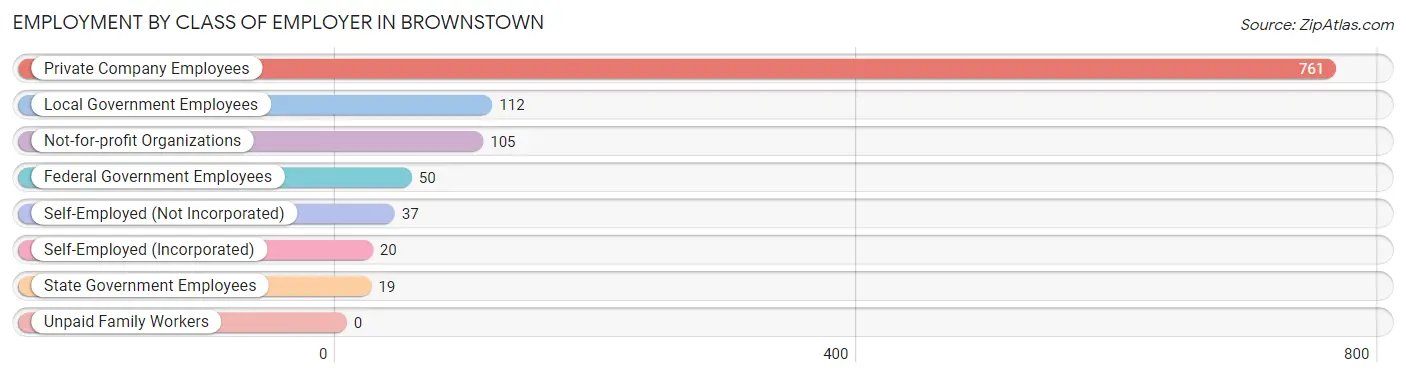
| Employer Class | # Employees | % Employees |
| Private Company Employees | 761 | 68.9% |
| Self-Employed (Incorporated) | 20 | 1.8% |
| Self-Employed (Not Incorporated) | 37 | 3.4% |
| Not-for-profit Organizations | 105 | 9.5% |
| Local Government Employees | 112 | 10.1% |
| State Government Employees | 19 | 1.7% |
| Federal Government Employees | 50 | 4.5% |
| Unpaid Family Workers | 0 | 0.0% |
| Total | 1,104 | 100.0% |
Employment Status by Age in Brownstown
According to the labor force statistics for Brownstown, out of the total population over 16 years of age (2,305), 51.1% or 1,178 individuals are in the labor force, with 1.9% or 22 of them unemployed. The age group with the highest labor force participation rate is 30 to 34 years, with 95.8% or 137 individuals in the labor force. Within the labor force, the 16 to 19 years age range has the highest percentage of unemployed individuals, with 34.2% or 13 of them being unemployed.
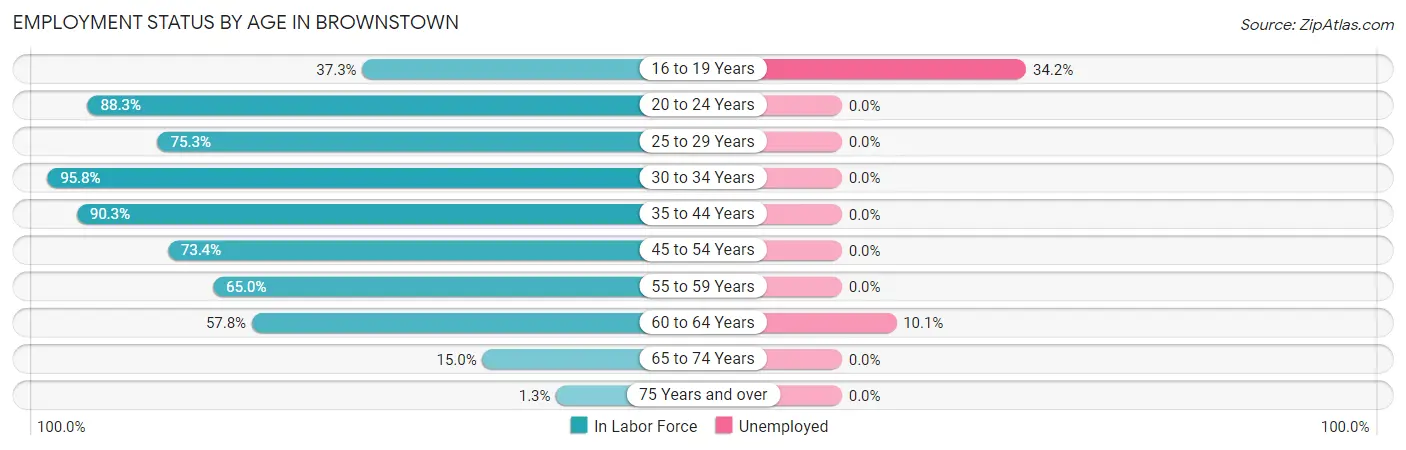
| Age Bracket | In Labor Force | Unemployed |
| 16 to 19 Years | 38 (37.3%) | 13 (34.2%) |
| 20 to 24 Years | 83 (88.3%) | 0 (0.0%) |
| 25 to 29 Years | 125 (75.3%) | 0 (0.0%) |
| 30 to 34 Years | 137 (95.8%) | 0 (0.0%) |
| 35 to 44 Years | 242 (90.3%) | 0 (0.0%) |
| 45 to 54 Years | 290 (73.4%) | 0 (0.0%) |
| 55 to 59 Years | 91 (65.0%) | 0 (0.0%) |
| 60 to 64 Years | 89 (57.8%) | 9 (10.1%) |
| 65 to 74 Years | 80 (15.0%) | 0 (0.0%) |
| 75 Years and over | 4 (1.3%) | 0 (0.0%) |
| Total | 1,178 (51.1%) | 22 (1.9%) |
Employment Status by Educational Attainment in Brownstown
According to labor force statistics for Brownstown, 76.9% of individuals (974) out of the total population between 25 and 64 years of age (1,266) are in the labor force, with 0.9% or 9 of them being unemployed. The group with the highest labor force participation rate are those with the educational attainment of bachelor's degree or higher, with 99.2% or 234 individuals in the labor force. Within the labor force, individuals with less than high school education have the highest percentage of unemployment, with 10.3% or 9 of them being unemployed.
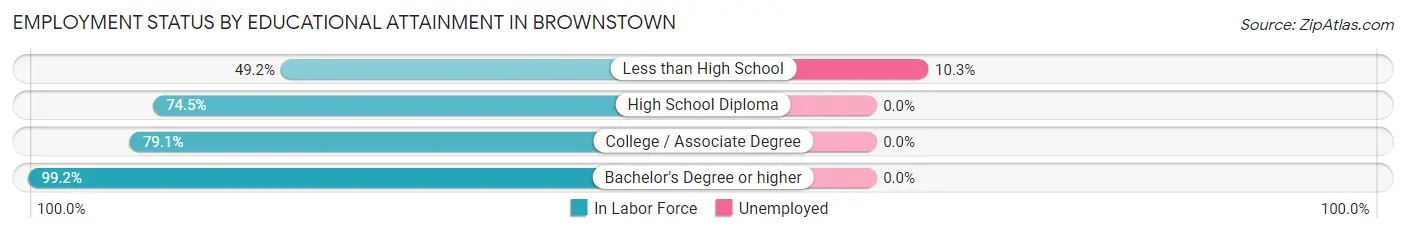
| Educational Attainment | In Labor Force | Unemployed |
| Less than High School | 87 (49.2%) | 18 (10.3%) |
| High School Diploma | 351 (74.5%) | 0 (0.0%) |
| College / Associate Degree | 302 (79.1%) | 0 (0.0%) |
| Bachelor's Degree or higher | 234 (99.2%) | 0 (0.0%) |
| Total | 974 (76.9%) | 11 (0.9%) |
Employment Occupations by Sex in Brownstown
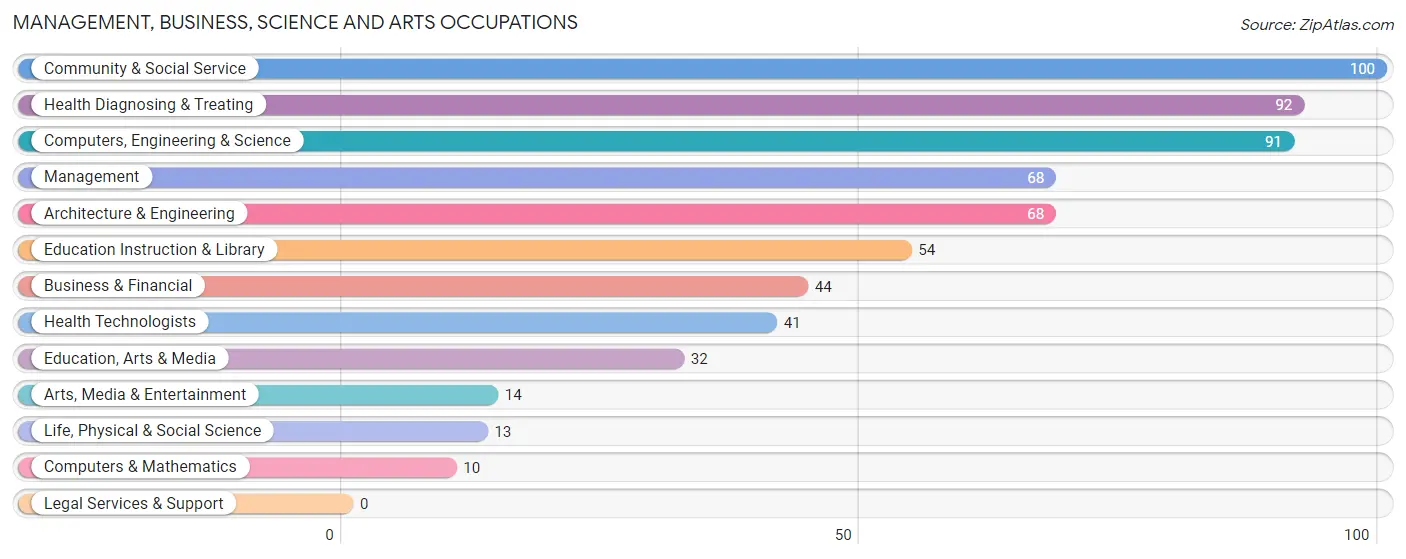
Management, Business, Science and Arts Occupations
The most common Management, Business, Science and Arts occupations in Brownstown are Community & Social Service (100 | 8.6%), Health Diagnosing & Treating (92 | 8.0%), Computers, Engineering & Science (91 | 7.9%), Management (68 | 5.9%), and Architecture & Engineering (68 | 5.9%).
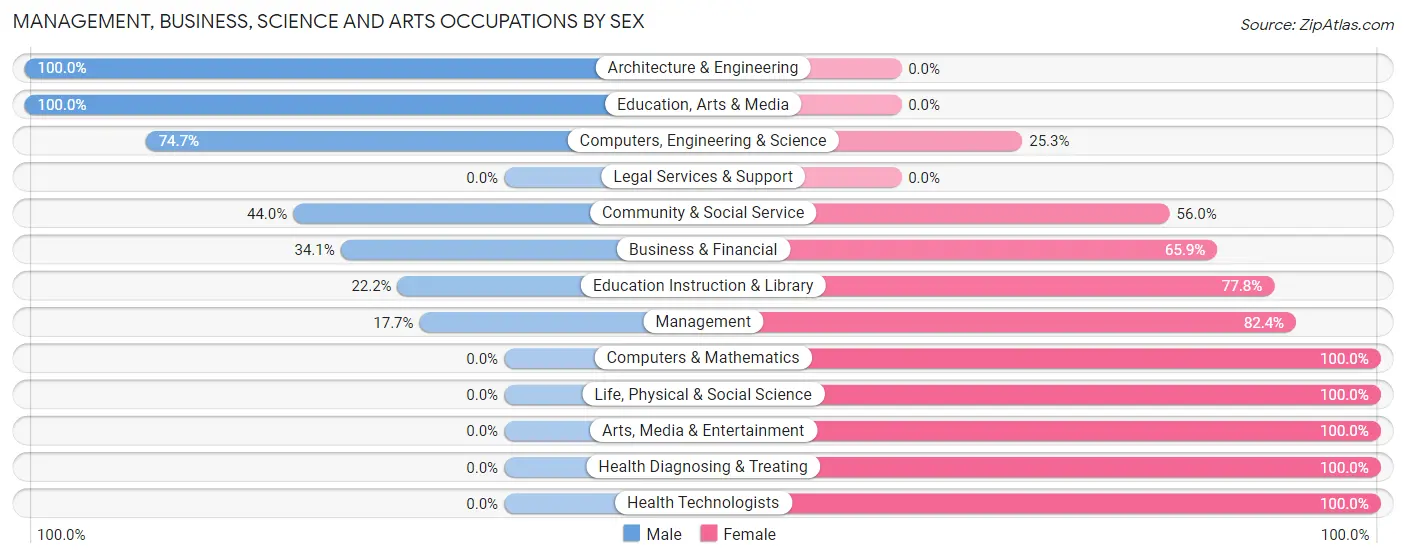
Management, Business, Science and Arts Occupations by Sex
Within the Management, Business, Science and Arts occupations in Brownstown, the most male-oriented occupations are Architecture & Engineering (100.0%), Education, Arts & Media (100.0%), and Computers, Engineering & Science (74.7%), while the most female-oriented occupations are Computers & Mathematics (100.0%), Life, Physical & Social Science (100.0%), and Arts, Media & Entertainment (100.0%).
| Occupation | Male | Female |
| Management | 12 (17.6%) | 56 (82.4%) |
| Business & Financial | 15 (34.1%) | 29 (65.9%) |
| Computers, Engineering & Science | 68 (74.7%) | 23 (25.3%) |
| Computers & Mathematics | 0 (0.0%) | 10 (100.0%) |
| Architecture & Engineering | 68 (100.0%) | 0 (0.0%) |
| Life, Physical & Social Science | 0 (0.0%) | 13 (100.0%) |
| Community & Social Service | 44 (44.0%) | 56 (56.0%) |
| Education, Arts & Media | 32 (100.0%) | 0 (0.0%) |
| Legal Services & Support | 0 (0.0%) | 0 (0.0%) |
| Education Instruction & Library | 12 (22.2%) | 42 (77.8%) |
| Arts, Media & Entertainment | 0 (0.0%) | 14 (100.0%) |
| Health Diagnosing & Treating | 0 (0.0%) | 92 (100.0%) |
| Health Technologists | 0 (0.0%) | 41 (100.0%) |
| Total (Category) | 139 (35.2%) | 256 (64.8%) |
| Total (Overall) | 555 (48.0%) | 602 (52.0%) |
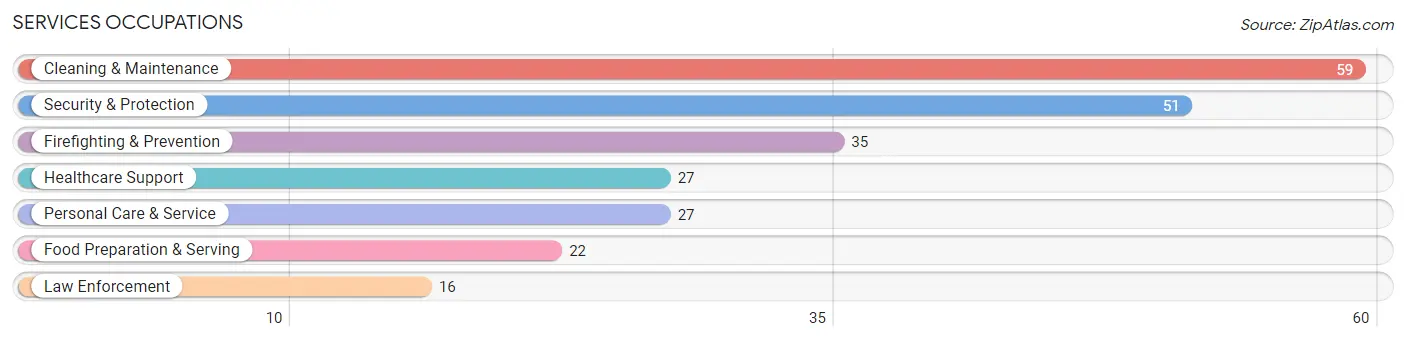
Services Occupations
The most common Services occupations in Brownstown are Cleaning & Maintenance (59 | 5.1%), Security & Protection (51 | 4.4%), Firefighting & Prevention (35 | 3.0%), Healthcare Support (27 | 2.3%), and Personal Care & Service (27 | 2.3%).
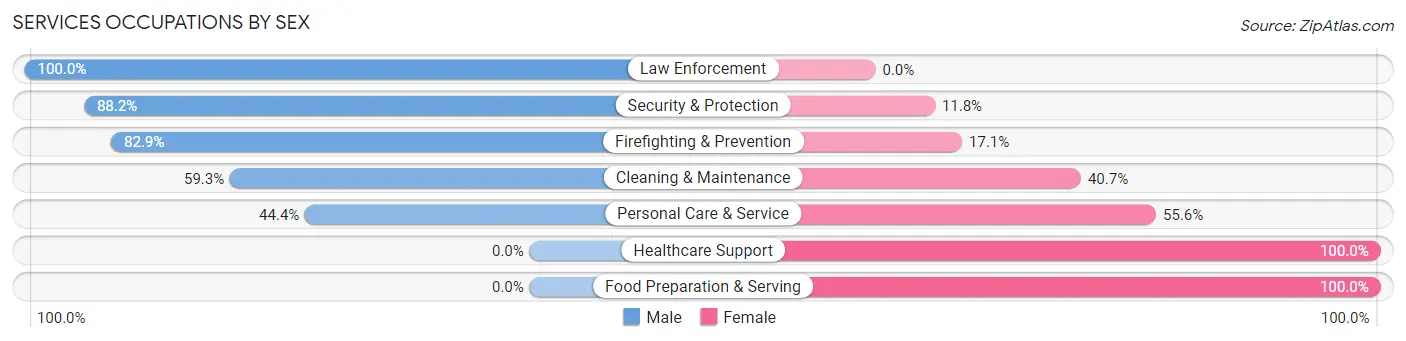
Services Occupations by Sex
Within the Services occupations in Brownstown, the most male-oriented occupations are Law Enforcement (100.0%), Security & Protection (88.2%), and Firefighting & Prevention (82.9%), while the most female-oriented occupations are Healthcare Support (100.0%), Food Preparation & Serving (100.0%), and Personal Care & Service (55.6%).
| Occupation | Male | Female |
| Healthcare Support | 0 (0.0%) | 27 (100.0%) |
| Security & Protection | 45 (88.2%) | 6 (11.8%) |
| Firefighting & Prevention | 29 (82.9%) | 6 (17.1%) |
| Law Enforcement | 16 (100.0%) | 0 (0.0%) |
| Food Preparation & Serving | 0 (0.0%) | 22 (100.0%) |
| Cleaning & Maintenance | 35 (59.3%) | 24 (40.7%) |
| Personal Care & Service | 12 (44.4%) | 15 (55.6%) |
| Total (Category) | 92 (49.5%) | 94 (50.5%) |
| Total (Overall) | 555 (48.0%) | 602 (52.0%) |
Sales and Office Occupations
The most common Sales and Office occupations in Brownstown are Office & Administration (161 | 13.9%), and Sales & Related (98 | 8.5%).
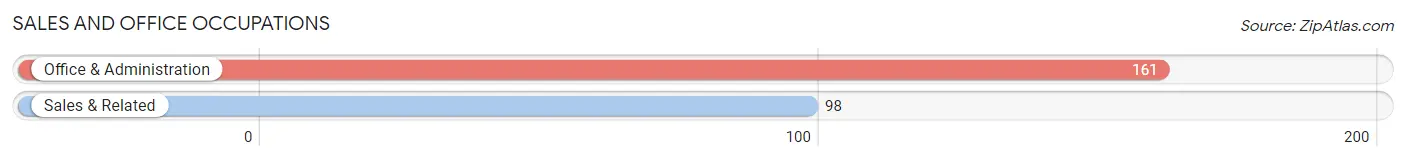
Sales and Office Occupations by Sex
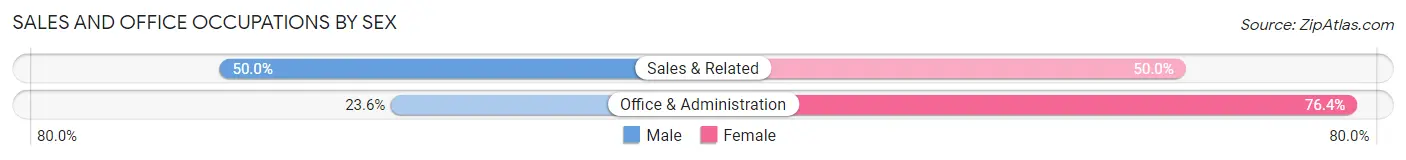
| Occupation | Male | Female |
| Sales & Related | 49 (50.0%) | 49 (50.0%) |
| Office & Administration | 38 (23.6%) | 123 (76.4%) |
| Total (Category) | 87 (33.6%) | 172 (66.4%) |
| Total (Overall) | 555 (48.0%) | 602 (52.0%) |
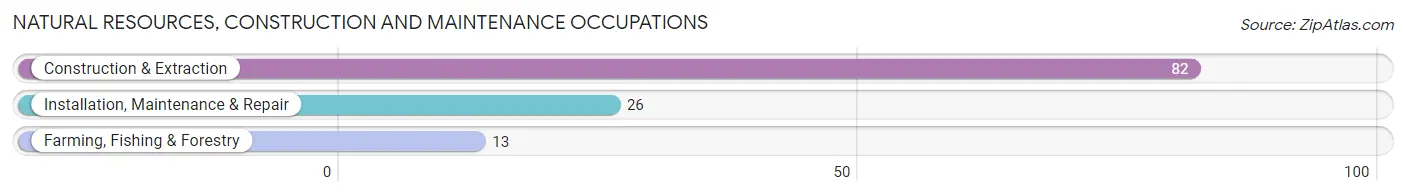
Natural Resources, Construction and Maintenance Occupations
The most common Natural Resources, Construction and Maintenance occupations in Brownstown are Construction & Extraction (82 | 7.1%), Installation, Maintenance & Repair (26 | 2.2%), and Farming, Fishing & Forestry (13 | 1.1%).
Natural Resources, Construction and Maintenance Occupations by Sex
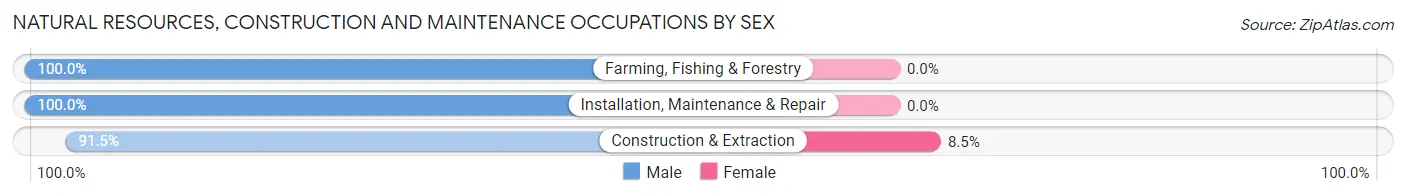
| Occupation | Male | Female |
| Farming, Fishing & Forestry | 13 (100.0%) | 0 (0.0%) |
| Construction & Extraction | 75 (91.5%) | 7 (8.5%) |
| Installation, Maintenance & Repair | 26 (100.0%) | 0 (0.0%) |
| Total (Category) | 114 (94.2%) | 7 (5.8%) |
| Total (Overall) | 555 (48.0%) | 602 (52.0%) |
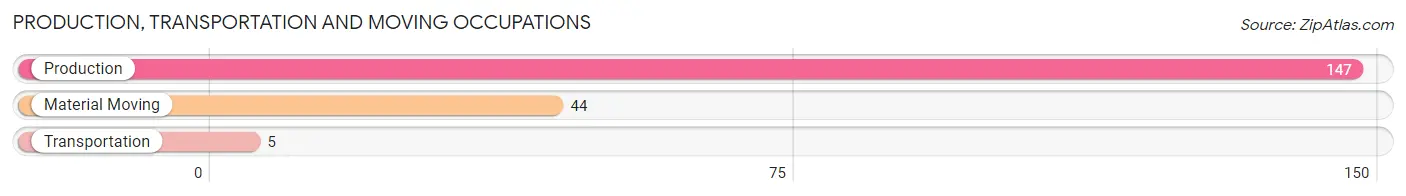
Production, Transportation and Moving Occupations
The most common Production, Transportation and Moving occupations in Brownstown are Production (147 | 12.7%), Material Moving (44 | 3.8%), and Transportation (5 | 0.4%).
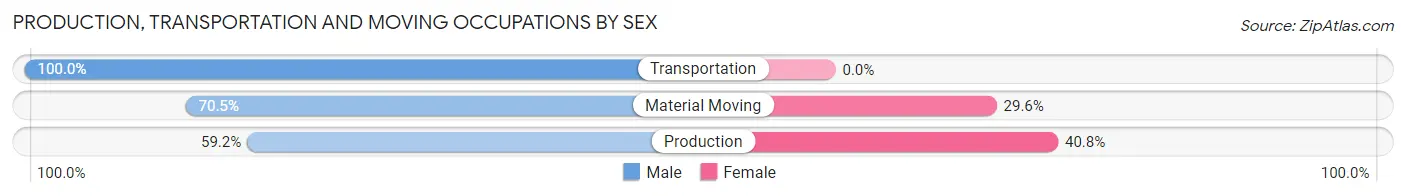
Production, Transportation and Moving Occupations by Sex
| Occupation | Male | Female |
| Production | 87 (59.2%) | 60 (40.8%) |
| Transportation | 5 (100.0%) | 0 (0.0%) |
| Material Moving | 31 (70.5%) | 13 (29.5%) |
| Total (Category) | 123 (62.8%) | 73 (37.2%) |
| Total (Overall) | 555 (48.0%) | 602 (52.0%) |
Employment Industries by Sex in Brownstown
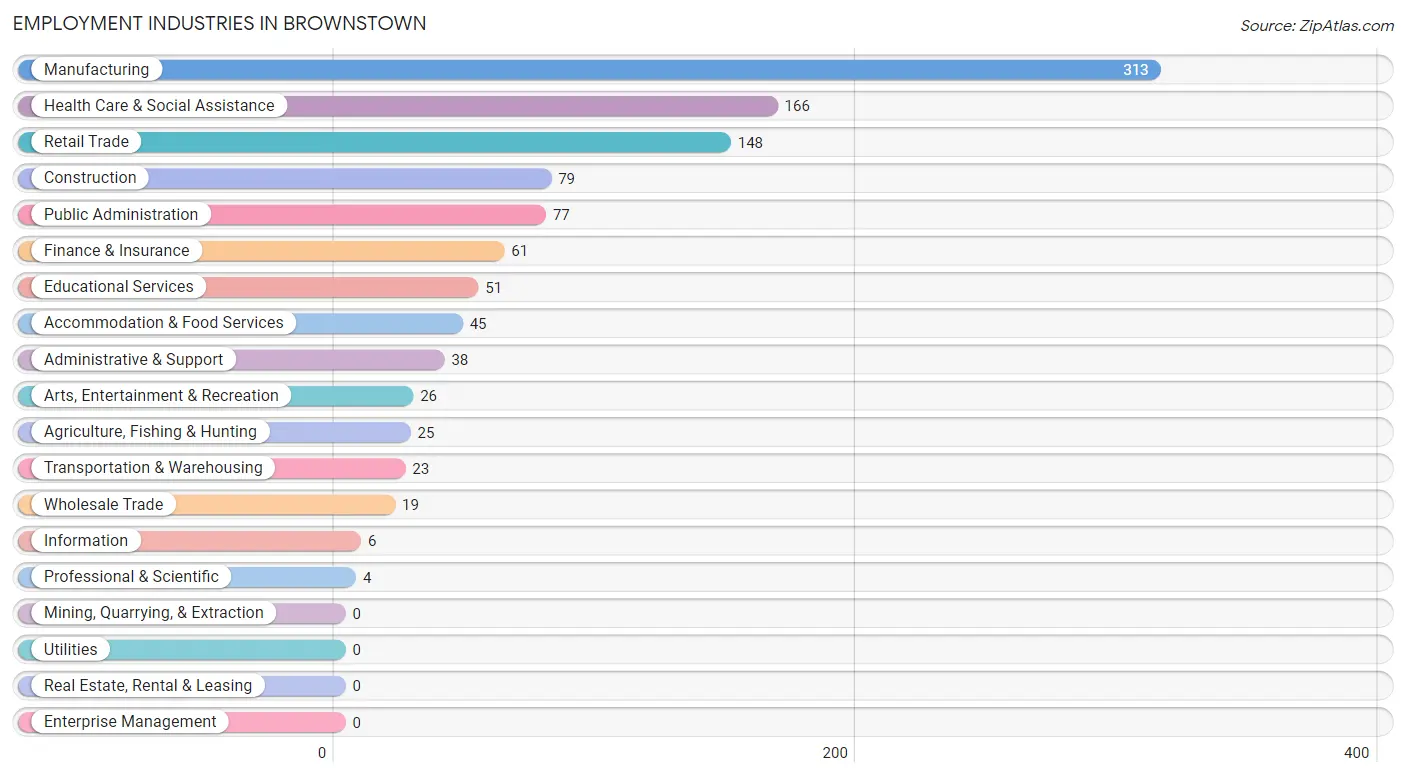
Employment Industries in Brownstown
The major employment industries in Brownstown include Manufacturing (313 | 27.1%), Health Care & Social Assistance (166 | 14.3%), Retail Trade (148 | 12.8%), Construction (79 | 6.8%), and Public Administration (77 | 6.7%).
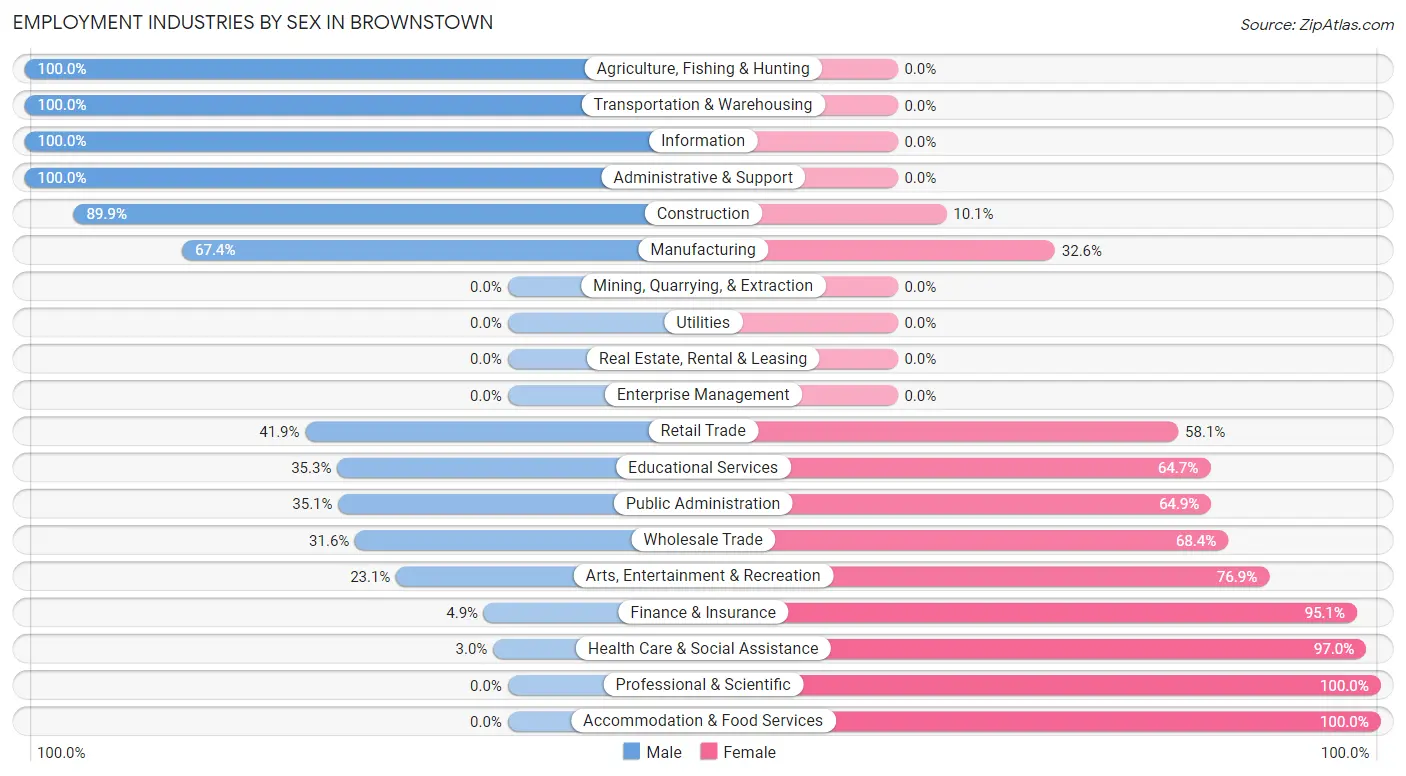
Employment Industries by Sex in Brownstown
The Brownstown industries that see more men than women are Agriculture, Fishing & Hunting (100.0%), Transportation & Warehousing (100.0%), and Information (100.0%), whereas the industries that tend to have a higher number of women are Professional & Scientific (100.0%), Accommodation & Food Services (100.0%), and Health Care & Social Assistance (97.0%).
| Industry | Male | Female |
| Agriculture, Fishing & Hunting | 25 (100.0%) | 0 (0.0%) |
| Mining, Quarrying, & Extraction | 0 (0.0%) | 0 (0.0%) |
| Construction | 71 (89.9%) | 8 (10.1%) |
| Manufacturing | 211 (67.4%) | 102 (32.6%) |
| Wholesale Trade | 6 (31.6%) | 13 (68.4%) |
| Retail Trade | 62 (41.9%) | 86 (58.1%) |
| Transportation & Warehousing | 23 (100.0%) | 0 (0.0%) |
| Utilities | 0 (0.0%) | 0 (0.0%) |
| Information | 6 (100.0%) | 0 (0.0%) |
| Finance & Insurance | 3 (4.9%) | 58 (95.1%) |
| Real Estate, Rental & Leasing | 0 (0.0%) | 0 (0.0%) |
| Professional & Scientific | 0 (0.0%) | 4 (100.0%) |
| Enterprise Management | 0 (0.0%) | 0 (0.0%) |
| Administrative & Support | 38 (100.0%) | 0 (0.0%) |
| Educational Services | 18 (35.3%) | 33 (64.7%) |
| Health Care & Social Assistance | 5 (3.0%) | 161 (97.0%) |
| Arts, Entertainment & Recreation | 6 (23.1%) | 20 (76.9%) |
| Accommodation & Food Services | 0 (0.0%) | 45 (100.0%) |
| Public Administration | 27 (35.1%) | 50 (64.9%) |
| Total | 555 (48.0%) | 602 (52.0%) |
Education in Brownstown
School Enrollment in Brownstown
The most common levels of schooling among the 723 students in Brownstown are middle school (205 | 28.3%), elementary school (180 | 24.9%), and high school (152 | 21.0%).
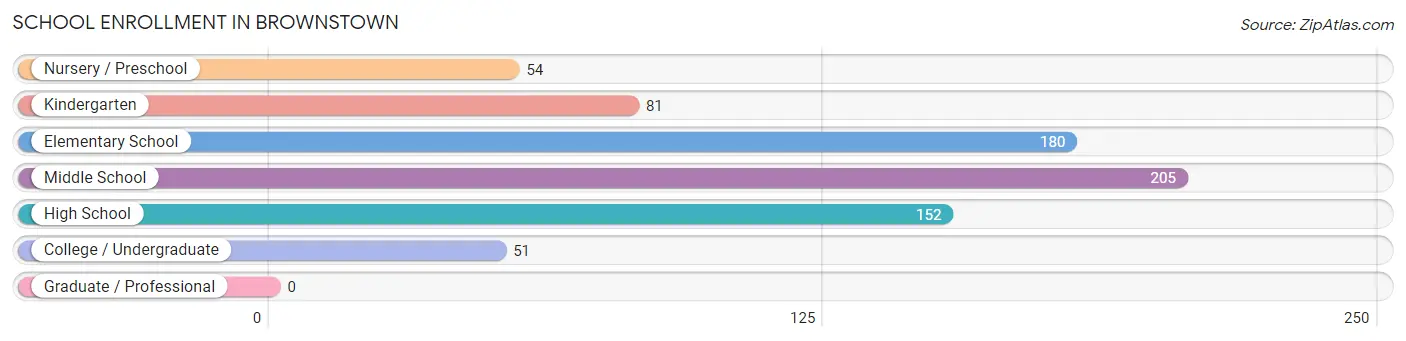
| School Level | # Students | % Students |
| Nursery / Preschool | 54 | 7.5% |
| Kindergarten | 81 | 11.2% |
| Elementary School | 180 | 24.9% |
| Middle School | 205 | 28.3% |
| High School | 152 | 21.0% |
| College / Undergraduate | 51 | 7.0% |
| Graduate / Professional | 0 | 0.0% |
| Total | 723 | 100.0% |
School Enrollment by Age by Funding Source in Brownstown
Out of a total of 723 students who are enrolled in schools in Brownstown, 211 (29.2%) attend a private institution, while the remaining 512 (70.8%) are enrolled in public schools. The age group of 3 to 4 year olds has the highest likelihood of being enrolled in private schools, with 77 (85.6% in the age bracket) enrolled. Conversely, the age group of 18 to 19 year olds has the lowest likelihood of being enrolled in a private school, with 27 (100.0% in the age bracket) attending a public institution.
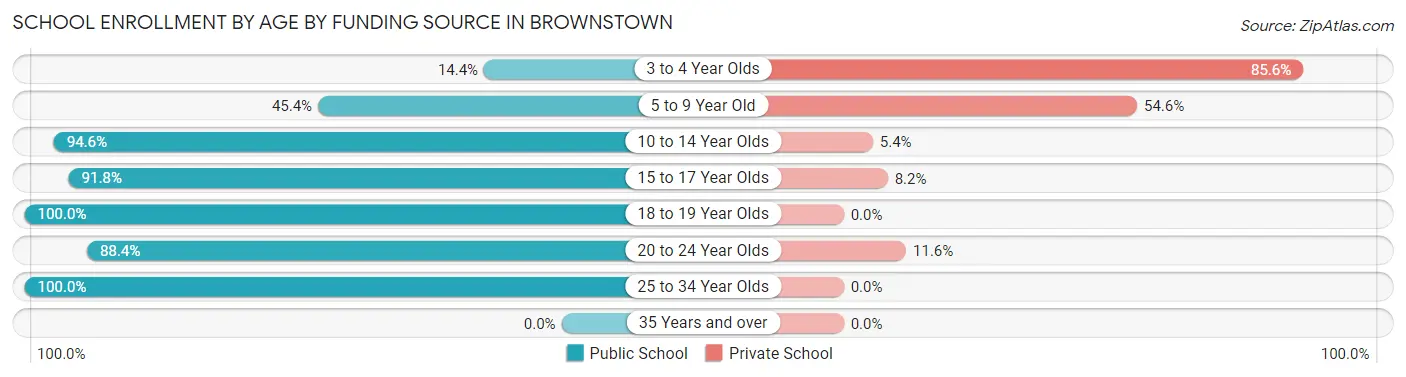
| Age Bracket | Public School | Private School |
| 3 to 4 Year Olds | 13 (14.4%) | 77 (85.6%) |
| 5 to 9 Year Old | 88 (45.4%) | 106 (54.6%) |
| 10 to 14 Year Olds | 226 (94.6%) | 13 (5.4%) |
| 15 to 17 Year Olds | 112 (91.8%) | 10 (8.2%) |
| 18 to 19 Year Olds | 27 (100.0%) | 0 (0.0%) |
| 20 to 24 Year Olds | 38 (88.4%) | 5 (11.6%) |
| 25 to 34 Year Olds | 8 (100.0%) | 0 (0.0%) |
| 35 Years and over | 0 (0.0%) | 0 (0.0%) |
| Total | 512 (70.8%) | 211 (29.2%) |
Educational Attainment by Field of Study in Brownstown
Business (119 | 32.3%), education (64 | 17.3%), science & technology (47 | 12.7%), social sciences (29 | 7.9%), and psychology (26 | 7.0%) are the most common fields of study among 369 individuals in Brownstown who have obtained a bachelor's degree or higher.
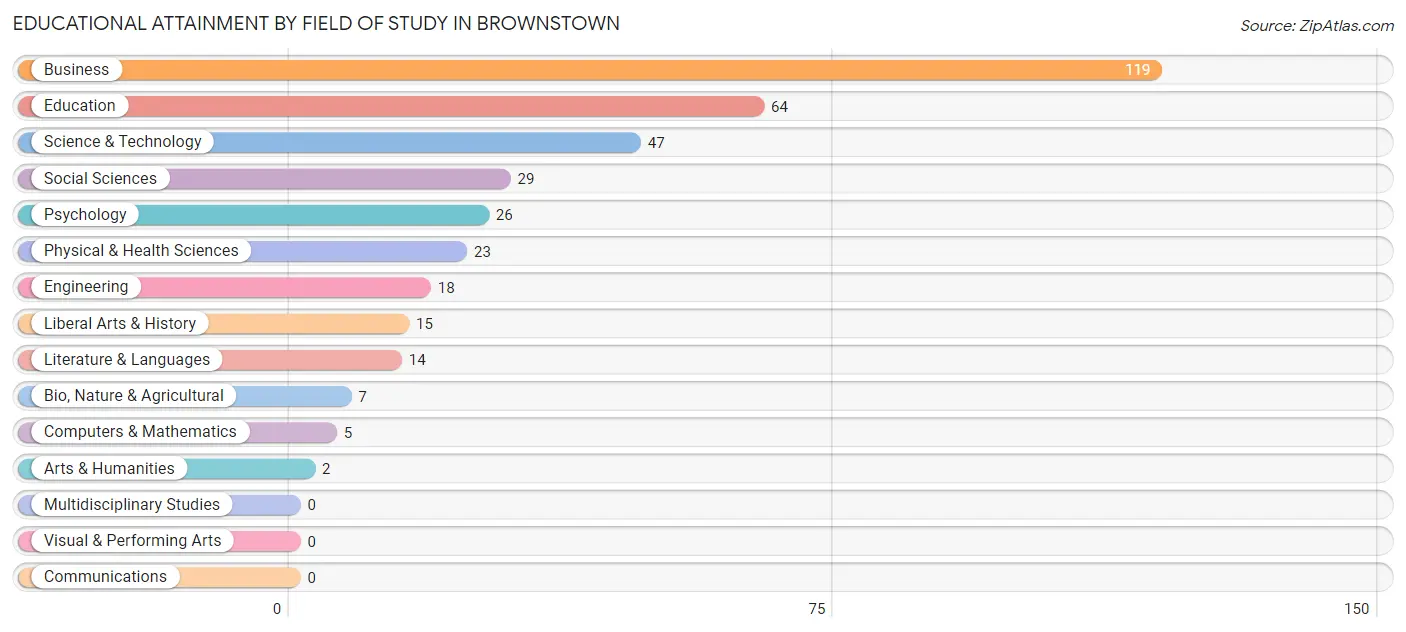
| Field of Study | # Graduates | % Graduates |
| Computers & Mathematics | 5 | 1.4% |
| Bio, Nature & Agricultural | 7 | 1.9% |
| Physical & Health Sciences | 23 | 6.2% |
| Psychology | 26 | 7.0% |
| Social Sciences | 29 | 7.9% |
| Engineering | 18 | 4.9% |
| Multidisciplinary Studies | 0 | 0.0% |
| Science & Technology | 47 | 12.7% |
| Business | 119 | 32.3% |
| Education | 64 | 17.3% |
| Literature & Languages | 14 | 3.8% |
| Liberal Arts & History | 15 | 4.1% |
| Visual & Performing Arts | 0 | 0.0% |
| Communications | 0 | 0.0% |
| Arts & Humanities | 2 | 0.5% |
| Total | 369 | 100.0% |
Transportation & Commute in Brownstown
Vehicle Availability by Sex in Brownstown
The most prevalent vehicle ownership categories in Brownstown are males with 2 vehicles (230, accounting for 43.7%) and females with 2 vehicles (253, making up 40.5%).
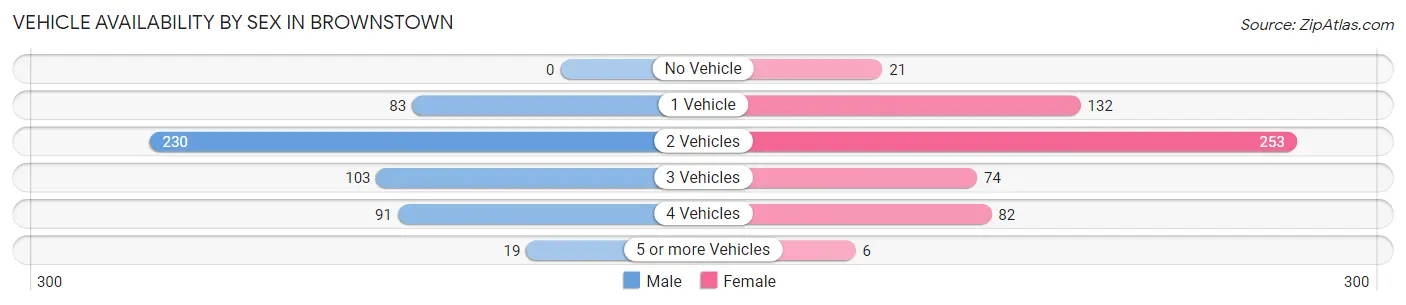
| Vehicles Available | Male | Female |
| No Vehicle | 0 (0.0%) | 21 (3.7%) |
| 1 Vehicle | 83 (15.8%) | 132 (23.2%) |
| 2 Vehicles | 230 (43.7%) | 253 (44.5%) |
| 3 Vehicles | 103 (19.6%) | 74 (13.0%) |
| 4 Vehicles | 91 (17.3%) | 82 (14.4%) |
| 5 or more Vehicles | 19 (3.6%) | 6 (1.1%) |
| Total | 526 (100.0%) | 568 (100.0%) |
Commute Time in Brownstown
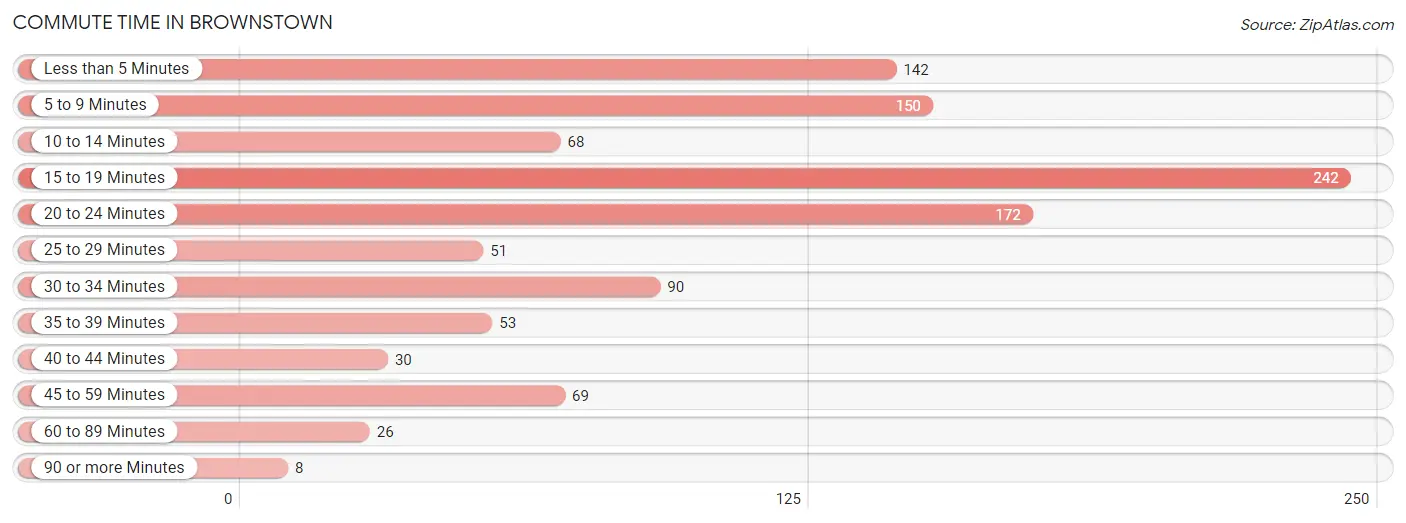
The most frequently occuring commute durations in Brownstown are 15 to 19 minutes (242 commuters, 22.0%), 20 to 24 minutes (172 commuters, 15.6%), and 5 to 9 minutes (150 commuters, 13.6%).
| Commute Time | # Commuters | % Commuters |
| Less than 5 Minutes | 142 | 12.9% |
| 5 to 9 Minutes | 150 | 13.6% |
| 10 to 14 Minutes | 68 | 6.2% |
| 15 to 19 Minutes | 242 | 22.0% |
| 20 to 24 Minutes | 172 | 15.6% |
| 25 to 29 Minutes | 51 | 4.6% |
| 30 to 34 Minutes | 90 | 8.2% |
| 35 to 39 Minutes | 53 | 4.8% |
| 40 to 44 Minutes | 30 | 2.7% |
| 45 to 59 Minutes | 69 | 6.3% |
| 60 to 89 Minutes | 26 | 2.4% |
| 90 or more Minutes | 8 | 0.7% |
Commute Time by Sex in Brownstown
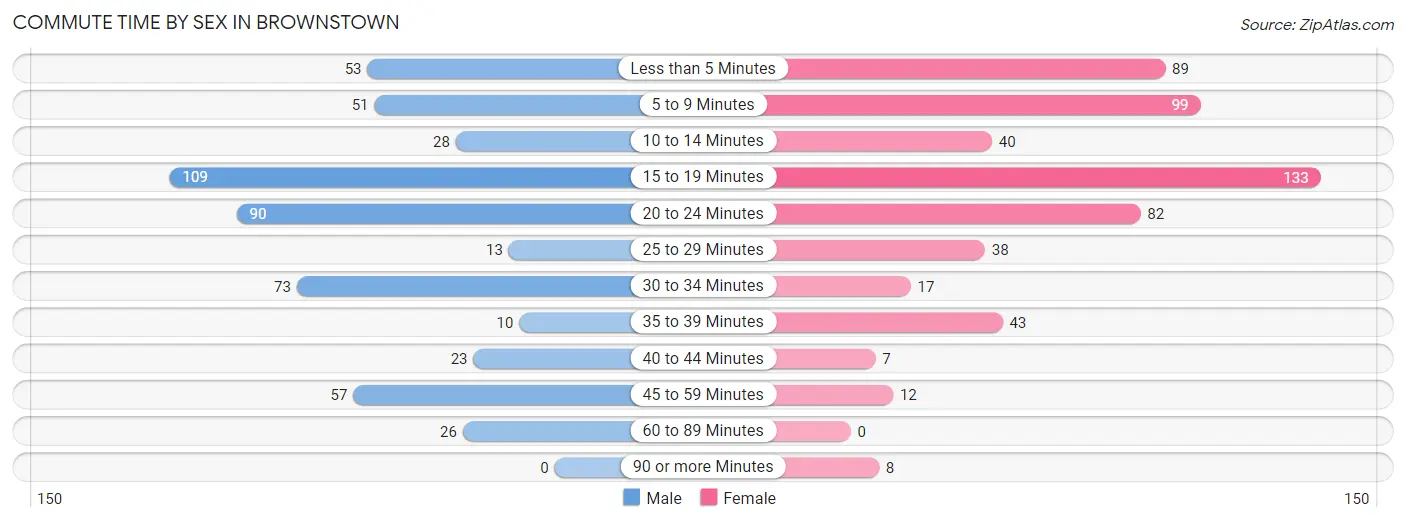
The most common commute times in Brownstown are 15 to 19 minutes (109 commuters, 20.4%) for males and 15 to 19 minutes (133 commuters, 23.4%) for females.
| Commute Time | Male | Female |
| Less than 5 Minutes | 53 (9.9%) | 89 (15.7%) |
| 5 to 9 Minutes | 51 (9.6%) | 99 (17.4%) |
| 10 to 14 Minutes | 28 (5.2%) | 40 (7.0%) |
| 15 to 19 Minutes | 109 (20.4%) | 133 (23.4%) |
| 20 to 24 Minutes | 90 (16.9%) | 82 (14.4%) |
| 25 to 29 Minutes | 13 (2.4%) | 38 (6.7%) |
| 30 to 34 Minutes | 73 (13.7%) | 17 (3.0%) |
| 35 to 39 Minutes | 10 (1.9%) | 43 (7.6%) |
| 40 to 44 Minutes | 23 (4.3%) | 7 (1.2%) |
| 45 to 59 Minutes | 57 (10.7%) | 12 (2.1%) |
| 60 to 89 Minutes | 26 (4.9%) | 0 (0.0%) |
| 90 or more Minutes | 0 (0.0%) | 8 (1.4%) |
Time of Departure to Work by Sex in Brownstown
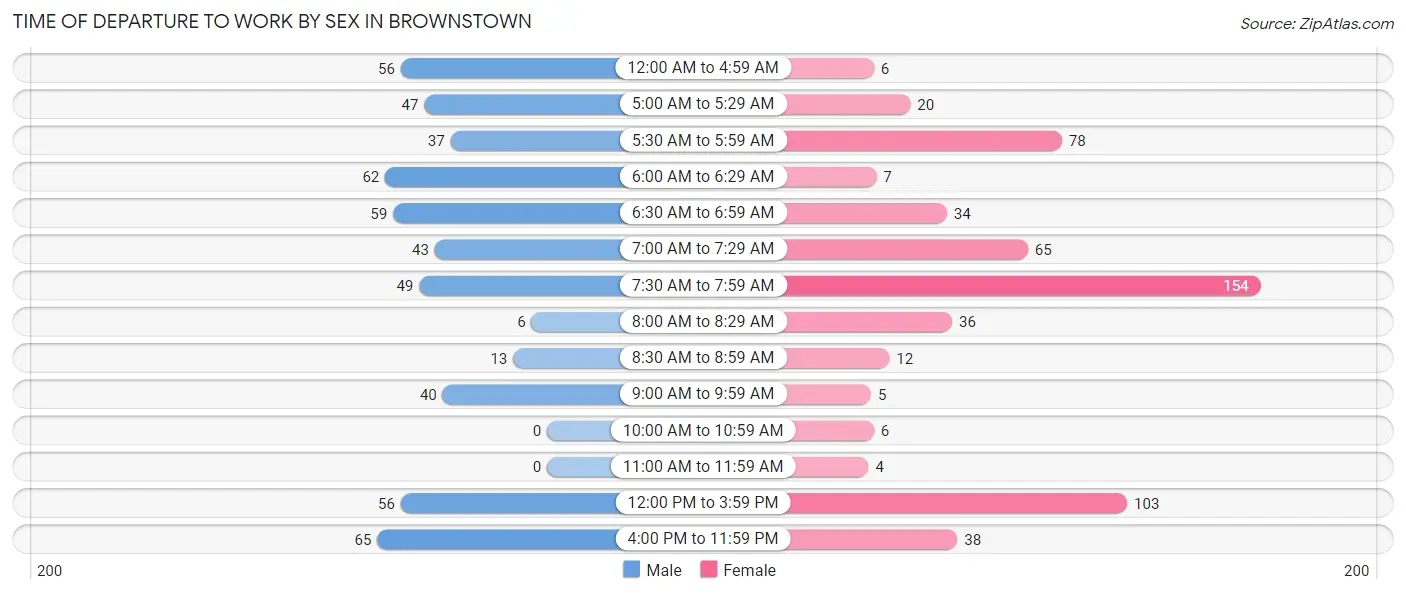
The most frequent times of departure to work in Brownstown are 4:00 PM to 11:59 PM (65, 12.2%) for males and 7:30 AM to 7:59 AM (154, 27.1%) for females.
| Time of Departure | Male | Female |
| 12:00 AM to 4:59 AM | 56 (10.5%) | 6 (1.1%) |
| 5:00 AM to 5:29 AM | 47 (8.8%) | 20 (3.5%) |
| 5:30 AM to 5:59 AM | 37 (6.9%) | 78 (13.7%) |
| 6:00 AM to 6:29 AM | 62 (11.6%) | 7 (1.2%) |
| 6:30 AM to 6:59 AM | 59 (11.1%) | 34 (6.0%) |
| 7:00 AM to 7:29 AM | 43 (8.1%) | 65 (11.4%) |
| 7:30 AM to 7:59 AM | 49 (9.2%) | 154 (27.1%) |
| 8:00 AM to 8:29 AM | 6 (1.1%) | 36 (6.3%) |
| 8:30 AM to 8:59 AM | 13 (2.4%) | 12 (2.1%) |
| 9:00 AM to 9:59 AM | 40 (7.5%) | 5 (0.9%) |
| 10:00 AM to 10:59 AM | 0 (0.0%) | 6 (1.1%) |
| 11:00 AM to 11:59 AM | 0 (0.0%) | 4 (0.7%) |
| 12:00 PM to 3:59 PM | 56 (10.5%) | 103 (18.1%) |
| 4:00 PM to 11:59 PM | 65 (12.2%) | 38 (6.7%) |
| Total | 533 (100.0%) | 568 (100.0%) |
Housing Occupancy in Brownstown
Occupancy by Ownership in Brownstown
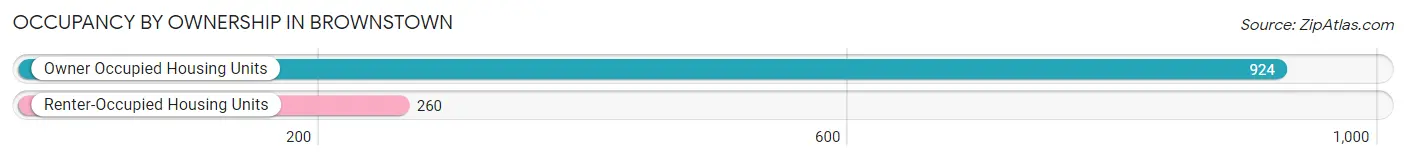
Of the total 1,184 dwellings in Brownstown, owner-occupied units account for 924 (78.0%), while renter-occupied units make up 260 (22.0%).
| Occupancy | # Housing Units | % Housing Units |
| Owner Occupied Housing Units | 924 | 78.0% |
| Renter-Occupied Housing Units | 260 | 22.0% |
| Total Occupied Housing Units | 1,184 | 100.0% |
Occupancy by Household Size in Brownstown
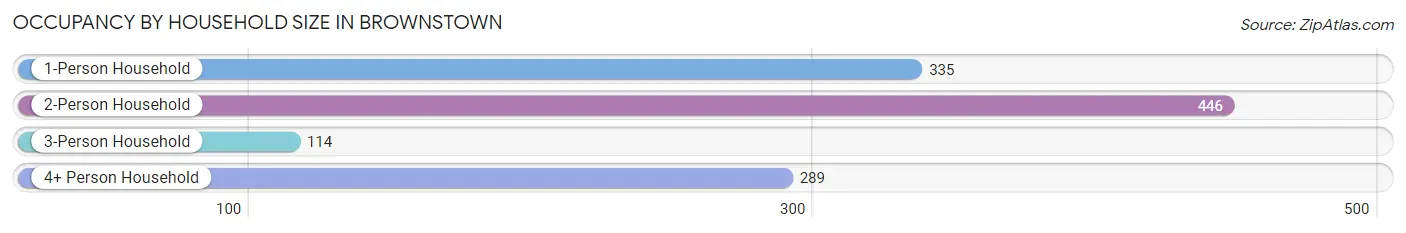
| Household Size | # Housing Units | % Housing Units |
| 1-Person Household | 335 | 28.3% |
| 2-Person Household | 446 | 37.7% |
| 3-Person Household | 114 | 9.6% |
| 4+ Person Household | 289 | 24.4% |
| Total Housing Units | 1,184 | 100.0% |
Occupancy by Ownership by Household Size in Brownstown
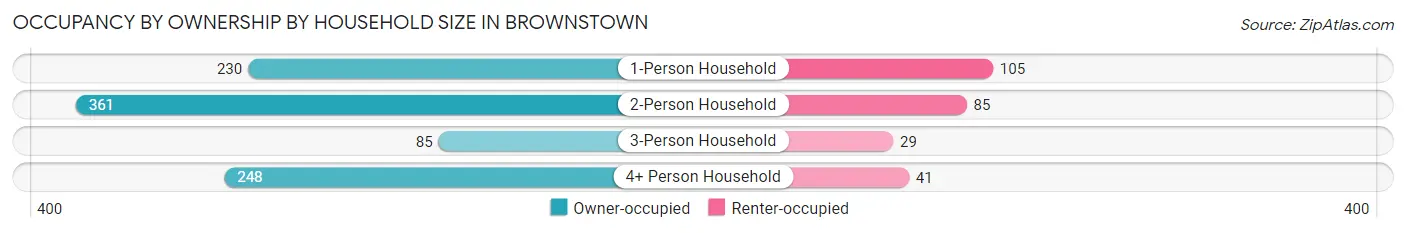
| Household Size | Owner-occupied | Renter-occupied |
| 1-Person Household | 230 (68.7%) | 105 (31.3%) |
| 2-Person Household | 361 (80.9%) | 85 (19.1%) |
| 3-Person Household | 85 (74.6%) | 29 (25.4%) |
| 4+ Person Household | 248 (85.8%) | 41 (14.2%) |
| Total Housing Units | 924 (78.0%) | 260 (22.0%) |
Occupancy by Educational Attainment in Brownstown
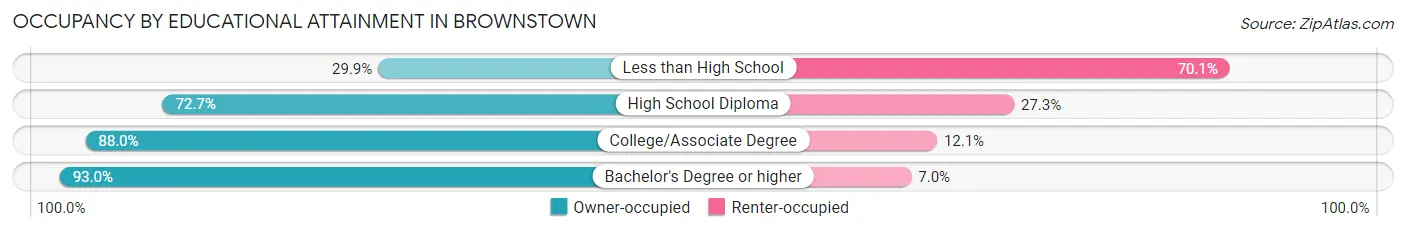
| Household Size | Owner-occupied | Renter-occupied |
| Less than High School | 32 (29.9%) | 75 (70.1%) |
| High School Diploma | 311 (72.7%) | 117 (27.3%) |
| College/Associate Degree | 394 (87.9%) | 54 (12.0%) |
| Bachelor's Degree or higher | 187 (93.0%) | 14 (7.0%) |
Occupancy by Age of Householder in Brownstown
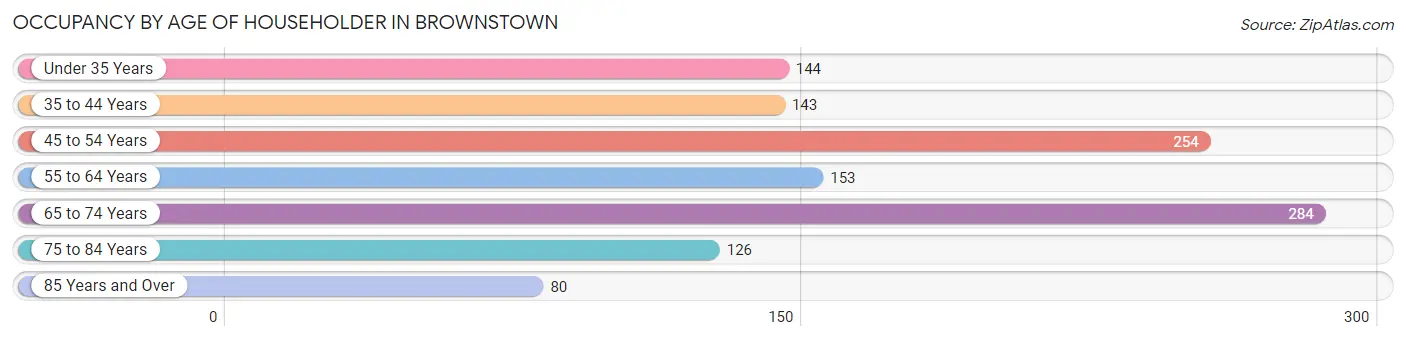
| Age Bracket | # Households | % Households |
| Under 35 Years | 144 | 12.2% |
| 35 to 44 Years | 143 | 12.1% |
| 45 to 54 Years | 254 | 21.4% |
| 55 to 64 Years | 153 | 12.9% |
| 65 to 74 Years | 284 | 24.0% |
| 75 to 84 Years | 126 | 10.6% |
| 85 Years and Over | 80 | 6.8% |
| Total | 1,184 | 100.0% |
Housing Finances in Brownstown
Median Income by Occupancy in Brownstown
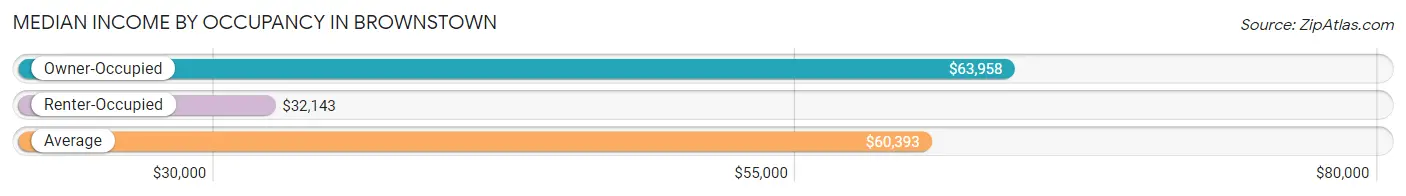
| Occupancy Type | # Households | Median Income |
| Owner-Occupied | 924 (78.0%) | $63,958 |
| Renter-Occupied | 260 (22.0%) | $32,143 |
| Average | 1,184 (100.0%) | $60,393 |
Occupancy by Householder Income Bracket in Brownstown
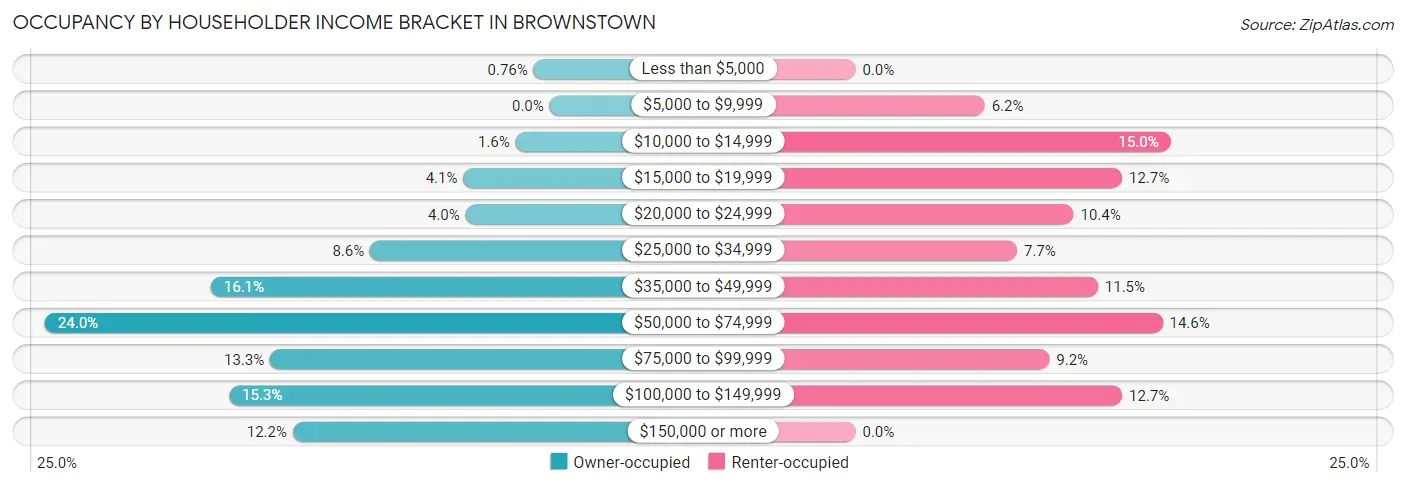
| Income Bracket | Owner-occupied | Renter-occupied |
| Less than $5,000 | 7 (0.8%) | 0 (0.0%) |
| $5,000 to $9,999 | 0 (0.0%) | 16 (6.1%) |
| $10,000 to $14,999 | 15 (1.6%) | 39 (15.0%) |
| $15,000 to $19,999 | 38 (4.1%) | 33 (12.7%) |
| $20,000 to $24,999 | 37 (4.0%) | 27 (10.4%) |
| $25,000 to $34,999 | 79 (8.6%) | 20 (7.7%) |
| $35,000 to $49,999 | 149 (16.1%) | 30 (11.5%) |
| $50,000 to $74,999 | 222 (24.0%) | 38 (14.6%) |
| $75,000 to $99,999 | 123 (13.3%) | 24 (9.2%) |
| $100,000 to $149,999 | 141 (15.3%) | 33 (12.7%) |
| $150,000 or more | 113 (12.2%) | 0 (0.0%) |
| Total | 924 (100.0%) | 260 (100.0%) |
Monthly Housing Cost Tiers in Brownstown
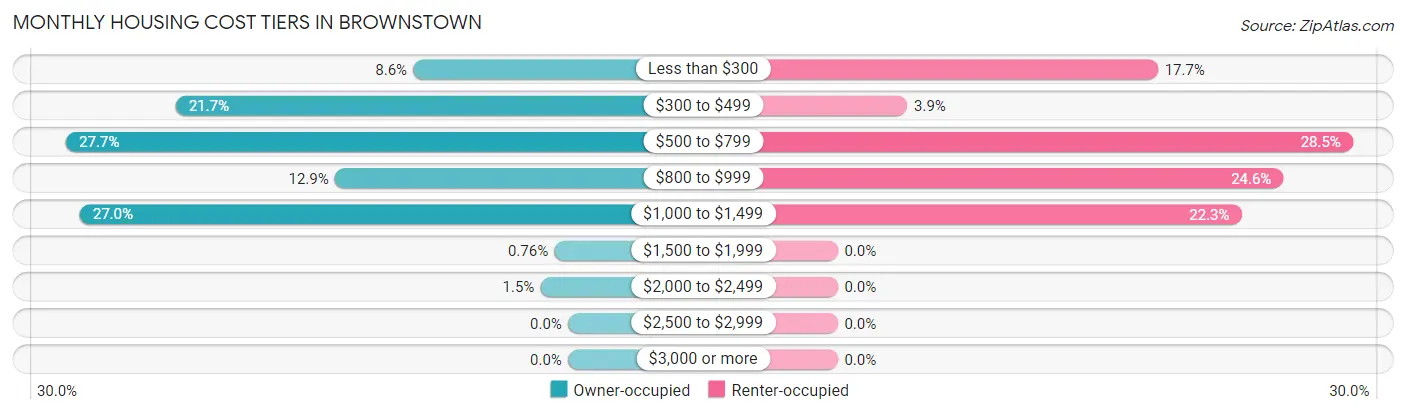
| Monthly Cost | Owner-occupied | Renter-occupied |
| Less than $300 | 79 (8.6%) | 46 (17.7%) |
| $300 to $499 | 200 (21.6%) | 10 (3.8%) |
| $500 to $799 | 256 (27.7%) | 74 (28.5%) |
| $800 to $999 | 119 (12.9%) | 64 (24.6%) |
| $1,000 to $1,499 | 249 (27.0%) | 58 (22.3%) |
| $1,500 to $1,999 | 7 (0.8%) | 0 (0.0%) |
| $2,000 to $2,499 | 14 (1.5%) | 0 (0.0%) |
| $2,500 to $2,999 | 0 (0.0%) | 0 (0.0%) |
| $3,000 or more | 0 (0.0%) | 0 (0.0%) |
| Total | 924 (100.0%) | 260 (100.0%) |
Physical Housing Characteristics in Brownstown
Housing Structures in Brownstown
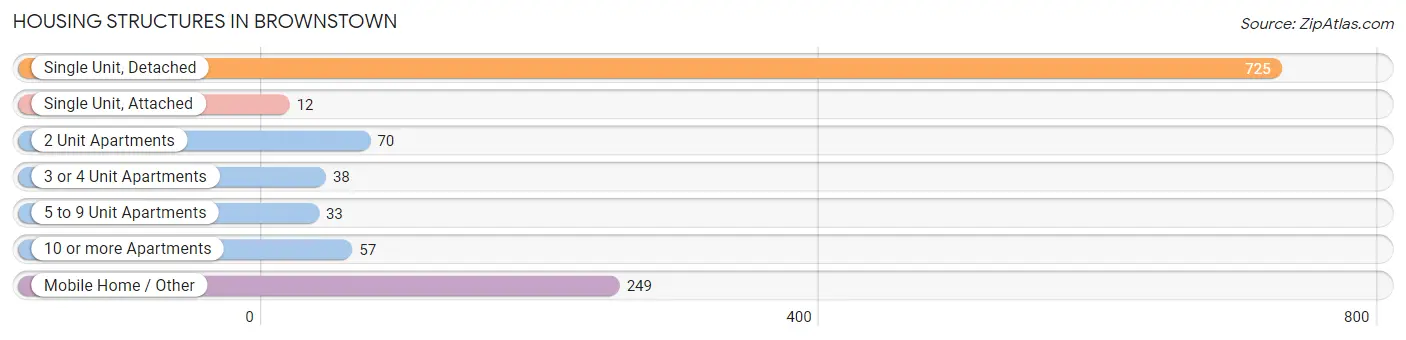
| Structure Type | # Housing Units | % Housing Units |
| Single Unit, Detached | 725 | 61.2% |
| Single Unit, Attached | 12 | 1.0% |
| 2 Unit Apartments | 70 | 5.9% |
| 3 or 4 Unit Apartments | 38 | 3.2% |
| 5 to 9 Unit Apartments | 33 | 2.8% |
| 10 or more Apartments | 57 | 4.8% |
| Mobile Home / Other | 249 | 21.0% |
| Total | 1,184 | 100.0% |
Housing Structures by Occupancy in Brownstown
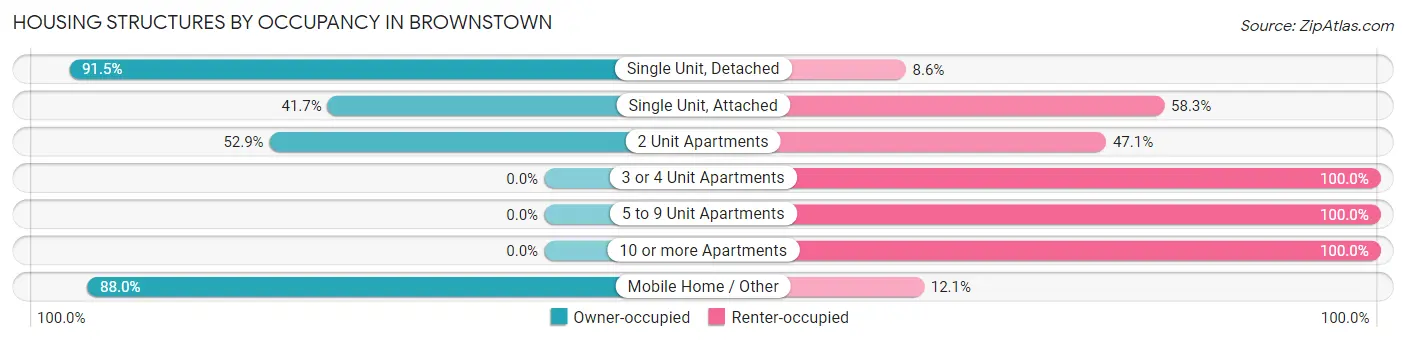
| Structure Type | Owner-occupied | Renter-occupied |
| Single Unit, Detached | 663 (91.4%) | 62 (8.6%) |
| Single Unit, Attached | 5 (41.7%) | 7 (58.3%) |
| 2 Unit Apartments | 37 (52.9%) | 33 (47.1%) |
| 3 or 4 Unit Apartments | 0 (0.0%) | 38 (100.0%) |
| 5 to 9 Unit Apartments | 0 (0.0%) | 33 (100.0%) |
| 10 or more Apartments | 0 (0.0%) | 57 (100.0%) |
| Mobile Home / Other | 219 (87.9%) | 30 (12.0%) |
| Total | 924 (78.0%) | 260 (22.0%) |
Housing Structures by Number of Rooms in Brownstown
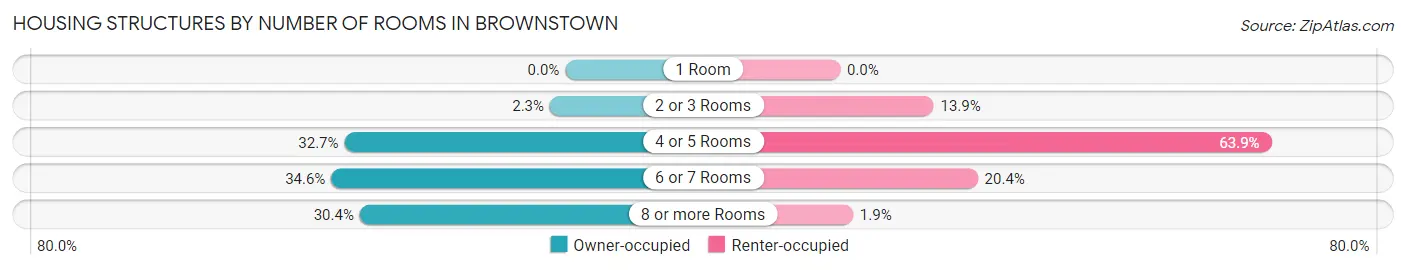
| Number of Rooms | Owner-occupied | Renter-occupied |
| 1 Room | 0 (0.0%) | 0 (0.0%) |
| 2 or 3 Rooms | 21 (2.3%) | 36 (13.9%) |
| 4 or 5 Rooms | 302 (32.7%) | 166 (63.8%) |
| 6 or 7 Rooms | 320 (34.6%) | 53 (20.4%) |
| 8 or more Rooms | 281 (30.4%) | 5 (1.9%) |
| Total | 924 (100.0%) | 260 (100.0%) |
Housing Structure by Heating Type in Brownstown
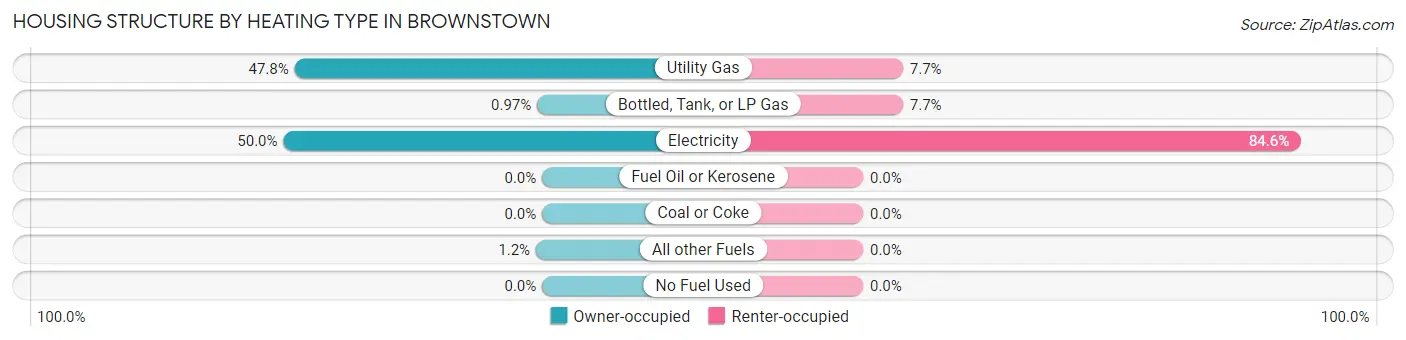
| Heating Type | Owner-occupied | Renter-occupied |
| Utility Gas | 442 (47.8%) | 20 (7.7%) |
| Bottled, Tank, or LP Gas | 9 (1.0%) | 20 (7.7%) |
| Electricity | 462 (50.0%) | 220 (84.6%) |
| Fuel Oil or Kerosene | 0 (0.0%) | 0 (0.0%) |
| Coal or Coke | 0 (0.0%) | 0 (0.0%) |
| All other Fuels | 11 (1.2%) | 0 (0.0%) |
| No Fuel Used | 0 (0.0%) | 0 (0.0%) |
| Total | 924 (100.0%) | 260 (100.0%) |
Household Vehicle Usage in Brownstown
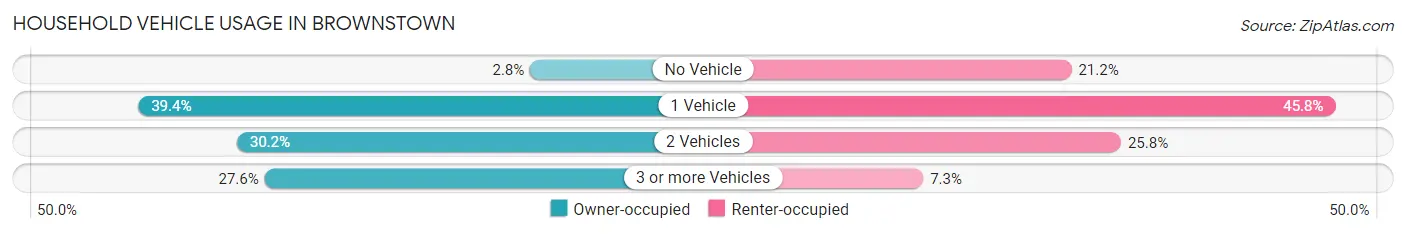
| Vehicles per Household | Owner-occupied | Renter-occupied |
| No Vehicle | 26 (2.8%) | 55 (21.1%) |
| 1 Vehicle | 364 (39.4%) | 119 (45.8%) |
| 2 Vehicles | 279 (30.2%) | 67 (25.8%) |
| 3 or more Vehicles | 255 (27.6%) | 19 (7.3%) |
| Total | 924 (100.0%) | 260 (100.0%) |
Real Estate & Mortgages in Brownstown
Real Estate and Mortgage Overview in Brownstown
| Characteristic | Without Mortgage | With Mortgage |
| Housing Units | 409 | 515 |
| Median Property Value | - | - |
| Median Household Income | $39,719 | $70 |
| Monthly Housing Costs | $452 | $0 |
| Real Estate Taxes | $199 | $24 |
Property Value by Mortgage Status in Brownstown
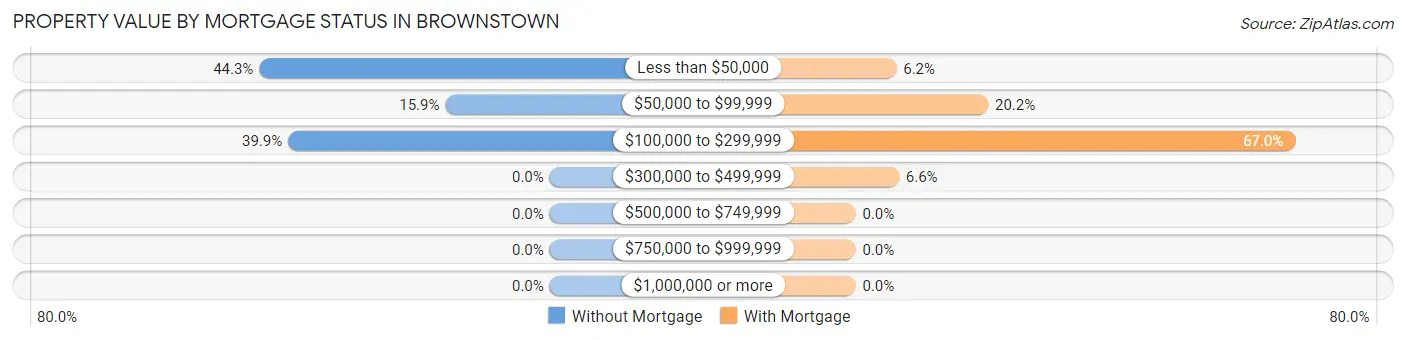
| Property Value | Without Mortgage | With Mortgage |
| Less than $50,000 | 181 (44.3%) | 32 (6.2%) |
| $50,000 to $99,999 | 65 (15.9%) | 104 (20.2%) |
| $100,000 to $299,999 | 163 (39.9%) | 345 (67.0%) |
| $300,000 to $499,999 | 0 (0.0%) | 34 (6.6%) |
| $500,000 to $749,999 | 0 (0.0%) | 0 (0.0%) |
| $750,000 to $999,999 | 0 (0.0%) | 0 (0.0%) |
| $1,000,000 or more | 0 (0.0%) | 0 (0.0%) |
| Total | 409 (100.0%) | 515 (100.0%) |
Household Income by Mortgage Status in Brownstown
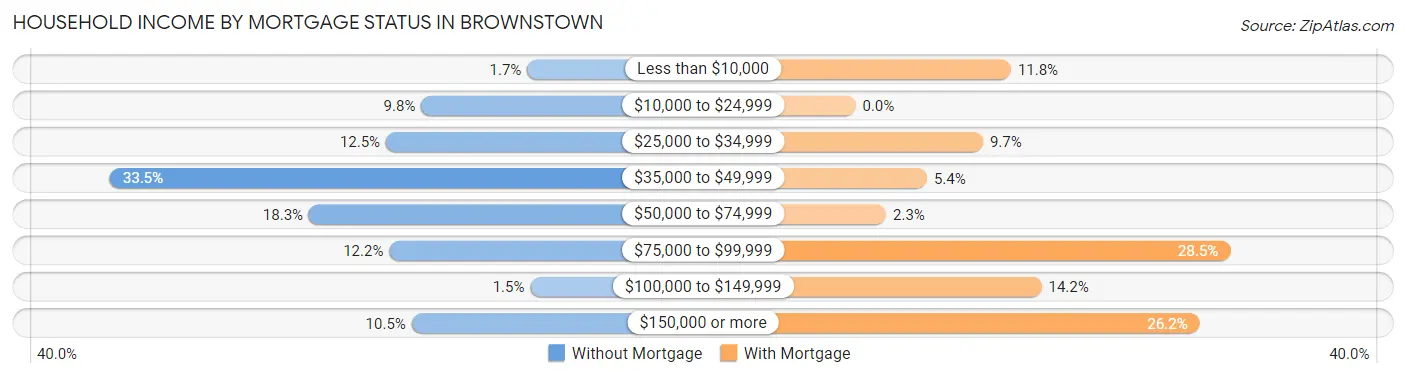
| Household Income | Without Mortgage | With Mortgage |
| Less than $10,000 | 7 (1.7%) | 61 (11.8%) |
| $10,000 to $24,999 | 40 (9.8%) | 0 (0.0%) |
| $25,000 to $34,999 | 51 (12.5%) | 50 (9.7%) |
| $35,000 to $49,999 | 137 (33.5%) | 28 (5.4%) |
| $50,000 to $74,999 | 75 (18.3%) | 12 (2.3%) |
| $75,000 to $99,999 | 50 (12.2%) | 147 (28.5%) |
| $100,000 to $149,999 | 6 (1.5%) | 73 (14.2%) |
| $150,000 or more | 43 (10.5%) | 135 (26.2%) |
| Total | 409 (100.0%) | 515 (100.0%) |
Property Value to Household Income Ratio in Brownstown
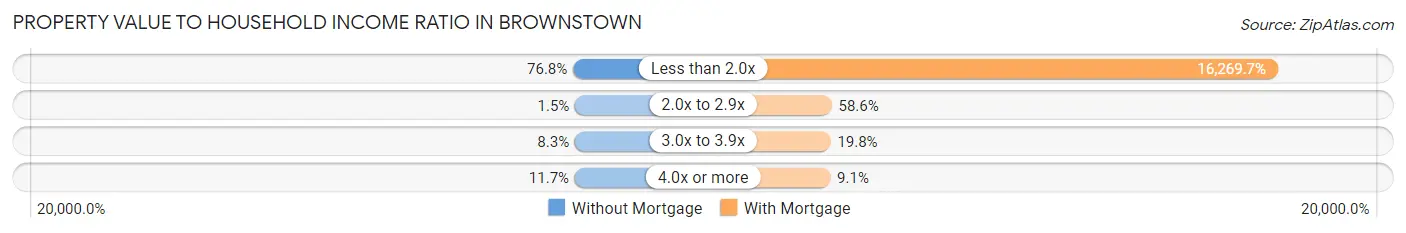
| Value-to-Income Ratio | Without Mortgage | With Mortgage |
| Less than 2.0x | 314 (76.8%) | 83,789 (16,269.7%) |
| 2.0x to 2.9x | 6 (1.5%) | 302 (58.6%) |
| 3.0x to 3.9x | 34 (8.3%) | 102 (19.8%) |
| 4.0x or more | 48 (11.7%) | 47 (9.1%) |
| Total | 409 (100.0%) | 515 (100.0%) |
Real Estate Taxes by Mortgage Status in Brownstown
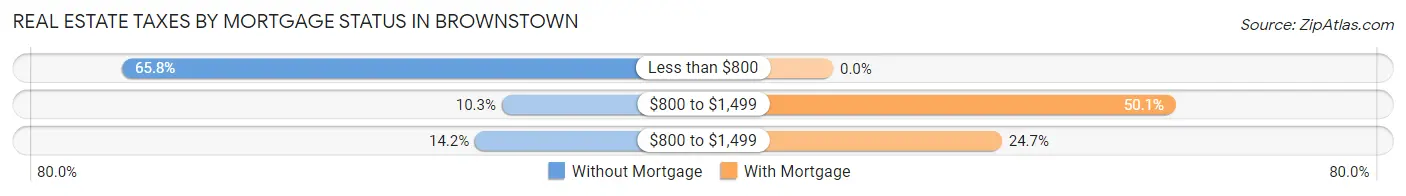
| Property Taxes | Without Mortgage | With Mortgage |
| Less than $800 | 269 (65.8%) | 0 (0.0%) |
| $800 to $1,499 | 42 (10.3%) | 258 (50.1%) |
| $800 to $1,499 | 58 (14.2%) | 127 (24.7%) |
| Total | 409 (100.0%) | 515 (100.0%) |
Health & Disability in Brownstown
Health Insurance Coverage by Age in Brownstown
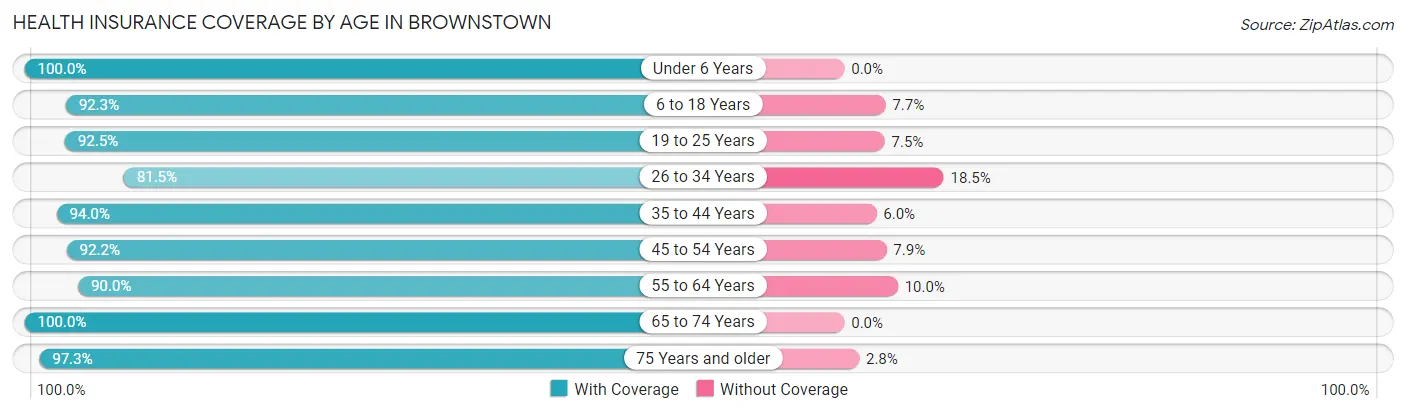
| Age Bracket | With Coverage | Without Coverage |
| Under 6 Years | 278 (100.0%) | 0 (0.0%) |
| 6 to 18 Years | 493 (92.3%) | 41 (7.7%) |
| 19 to 25 Years | 123 (92.5%) | 10 (7.5%) |
| 26 to 34 Years | 220 (81.5%) | 50 (18.5%) |
| 35 to 44 Years | 252 (94.0%) | 16 (6.0%) |
| 45 to 54 Years | 364 (92.1%) | 31 (7.9%) |
| 55 to 64 Years | 235 (90.0%) | 26 (10.0%) |
| 65 to 74 Years | 512 (100.0%) | 0 (0.0%) |
| 75 Years and older | 248 (97.3%) | 7 (2.8%) |
| Total | 2,725 (93.8%) | 181 (6.2%) |
Health Insurance Coverage by Citizenship Status in Brownstown
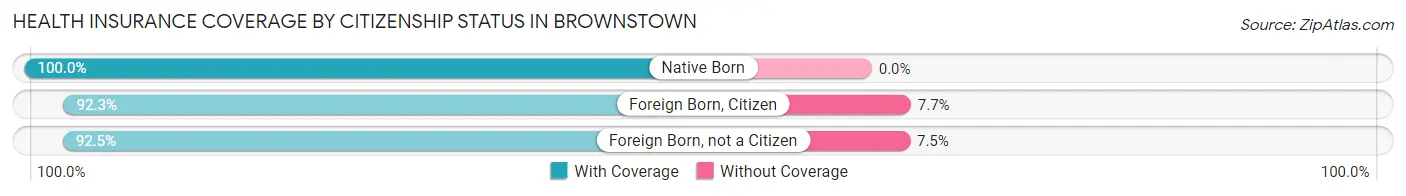
| Citizenship Status | With Coverage | Without Coverage |
| Native Born | 278 (100.0%) | 0 (0.0%) |
| Foreign Born, Citizen | 493 (92.3%) | 41 (7.7%) |
| Foreign Born, not a Citizen | 123 (92.5%) | 10 (7.5%) |
Health Insurance Coverage by Household Income in Brownstown
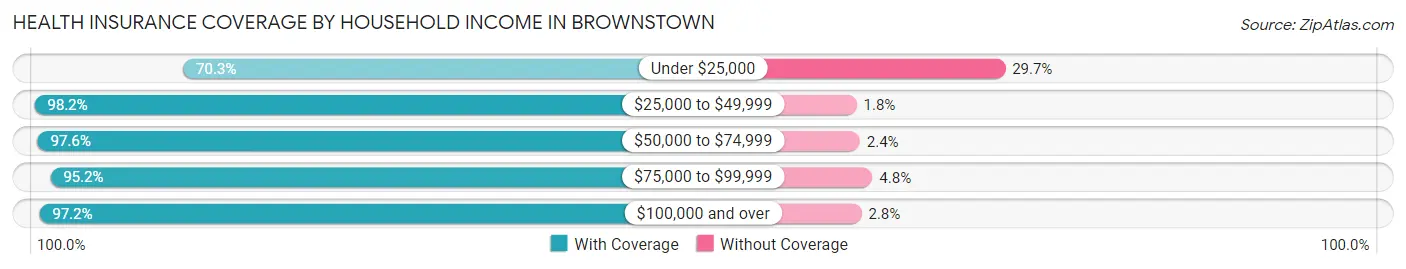
| Household Income | With Coverage | Without Coverage |
| Under $25,000 | 263 (70.3%) | 111 (29.7%) |
| $25,000 to $49,999 | 479 (98.2%) | 9 (1.8%) |
| $50,000 to $74,999 | 559 (97.6%) | 14 (2.4%) |
| $75,000 to $99,999 | 317 (95.2%) | 16 (4.8%) |
| $100,000 and over | 1,093 (97.2%) | 31 (2.8%) |
Public vs Private Health Insurance Coverage by Age in Brownstown
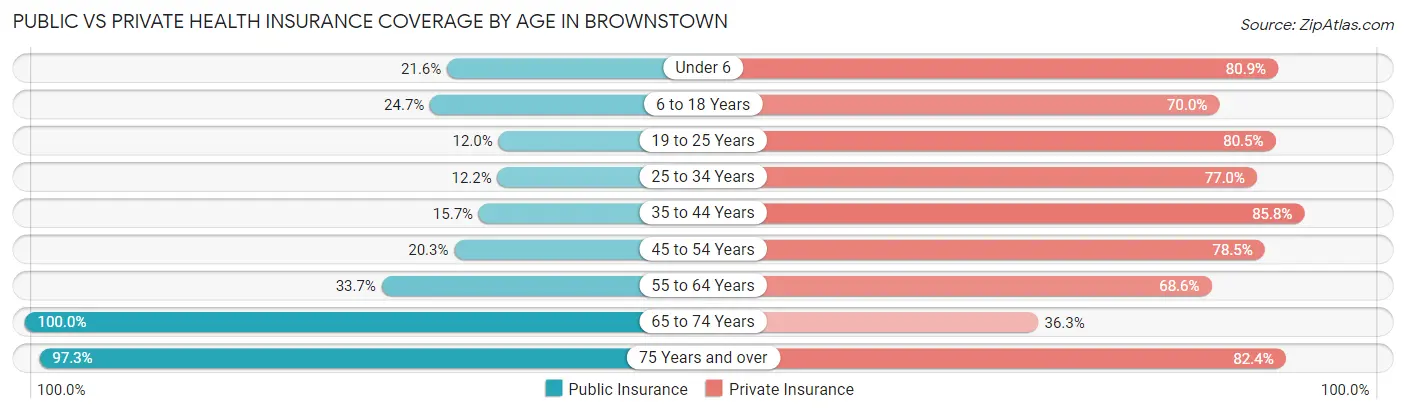
| Age Bracket | Public Insurance | Private Insurance |
| Under 6 | 60 (21.6%) | 225 (80.9%) |
| 6 to 18 Years | 132 (24.7%) | 374 (70.0%) |
| 19 to 25 Years | 16 (12.0%) | 107 (80.4%) |
| 25 to 34 Years | 33 (12.2%) | 208 (77.0%) |
| 35 to 44 Years | 42 (15.7%) | 230 (85.8%) |
| 45 to 54 Years | 80 (20.3%) | 310 (78.5%) |
| 55 to 64 Years | 88 (33.7%) | 179 (68.6%) |
| 65 to 74 Years | 512 (100.0%) | 186 (36.3%) |
| 75 Years and over | 248 (97.3%) | 210 (82.4%) |
| Total | 1,211 (41.7%) | 2,029 (69.8%) |
Disability Status by Sex by Age in Brownstown
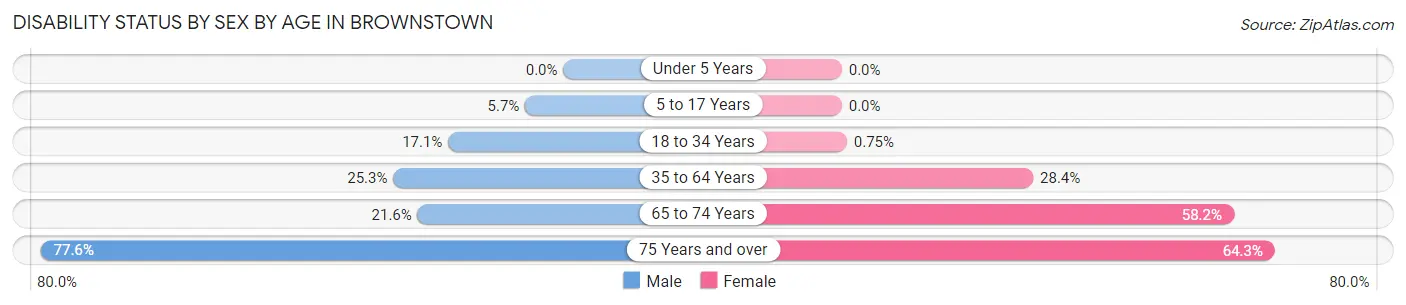
| Age Bracket | Male | Female |
| Under 5 Years | 0 (0.0%) | 0 (0.0%) |
| 5 to 17 Years | 16 (5.7%) | 0 (0.0%) |
| 18 to 34 Years | 33 (17.1%) | 2 (0.7%) |
| 35 to 64 Years | 100 (25.3%) | 150 (28.4%) |
| 65 to 74 Years | 58 (21.6%) | 142 (58.2%) |
| 75 Years and over | 111 (77.6%) | 72 (64.3%) |
Disability Class by Sex by Age in Brownstown
Disability Class: Hearing Difficulty
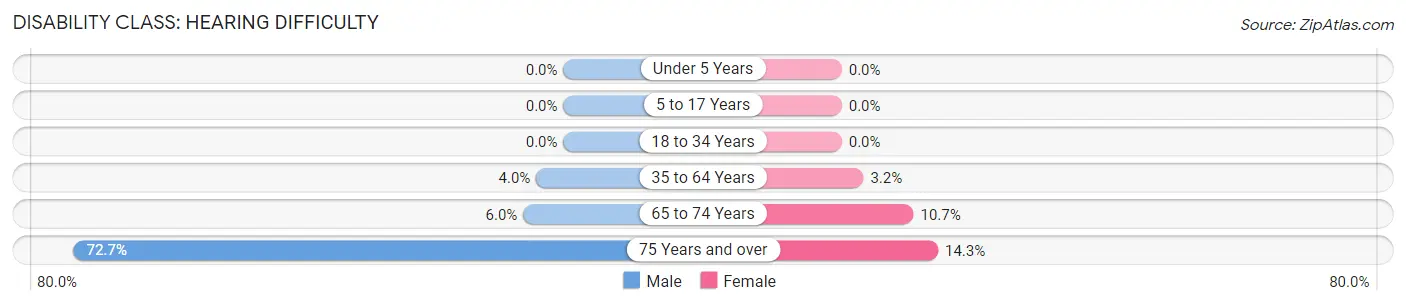
| Age Bracket | Male | Female |
| Under 5 Years | 0 (0.0%) | 0 (0.0%) |
| 5 to 17 Years | 0 (0.0%) | 0 (0.0%) |
| 18 to 34 Years | 0 (0.0%) | 0 (0.0%) |
| 35 to 64 Years | 16 (4.0%) | 17 (3.2%) |
| 65 to 74 Years | 16 (6.0%) | 26 (10.7%) |
| 75 Years and over | 104 (72.7%) | 16 (14.3%) |
Disability Class: Vision Difficulty
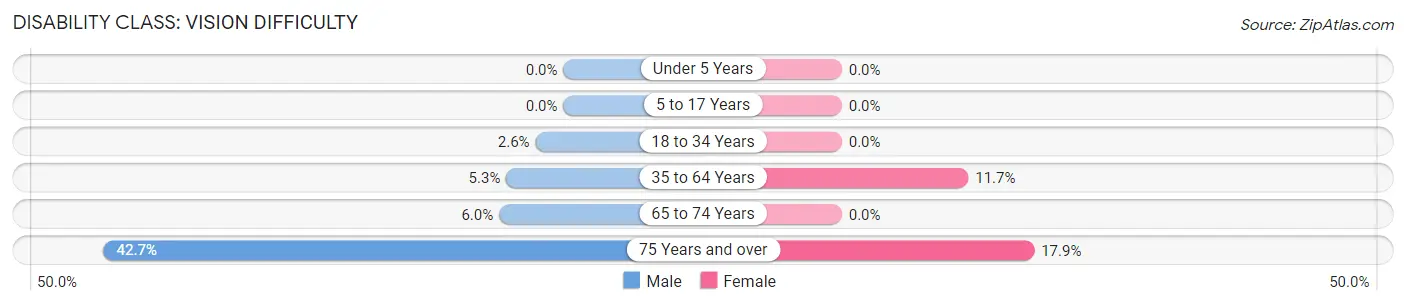
| Age Bracket | Male | Female |
| Under 5 Years | 0 (0.0%) | 0 (0.0%) |
| 5 to 17 Years | 0 (0.0%) | 0 (0.0%) |
| 18 to 34 Years | 5 (2.6%) | 0 (0.0%) |
| 35 to 64 Years | 21 (5.3%) | 62 (11.7%) |
| 65 to 74 Years | 16 (6.0%) | 0 (0.0%) |
| 75 Years and over | 61 (42.7%) | 20 (17.9%) |
Disability Class: Cognitive Difficulty
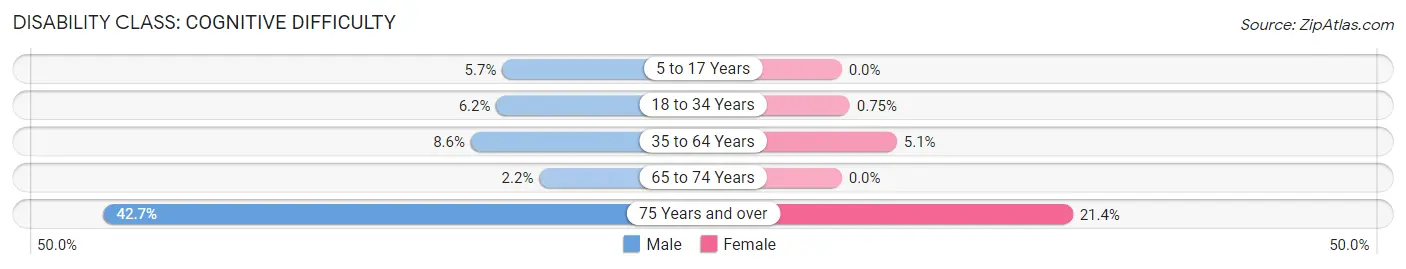
| Age Bracket | Male | Female |
| 5 to 17 Years | 16 (5.7%) | 0 (0.0%) |
| 18 to 34 Years | 12 (6.2%) | 2 (0.7%) |
| 35 to 64 Years | 34 (8.6%) | 27 (5.1%) |
| 65 to 74 Years | 6 (2.2%) | 0 (0.0%) |
| 75 Years and over | 61 (42.7%) | 24 (21.4%) |
Disability Class: Ambulatory Difficulty
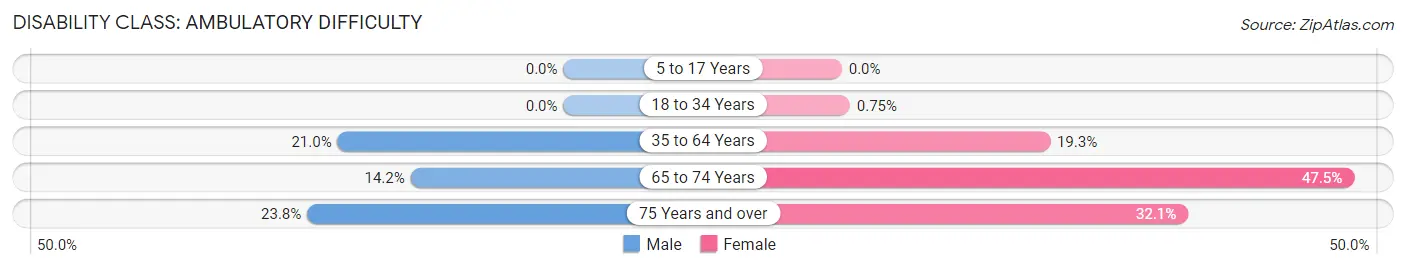
| Age Bracket | Male | Female |
| 5 to 17 Years | 0 (0.0%) | 0 (0.0%) |
| 18 to 34 Years | 0 (0.0%) | 2 (0.7%) |
| 35 to 64 Years | 83 (21.0%) | 102 (19.3%) |
| 65 to 74 Years | 38 (14.2%) | 116 (47.5%) |
| 75 Years and over | 34 (23.8%) | 36 (32.1%) |
Disability Class: Self-Care Difficulty
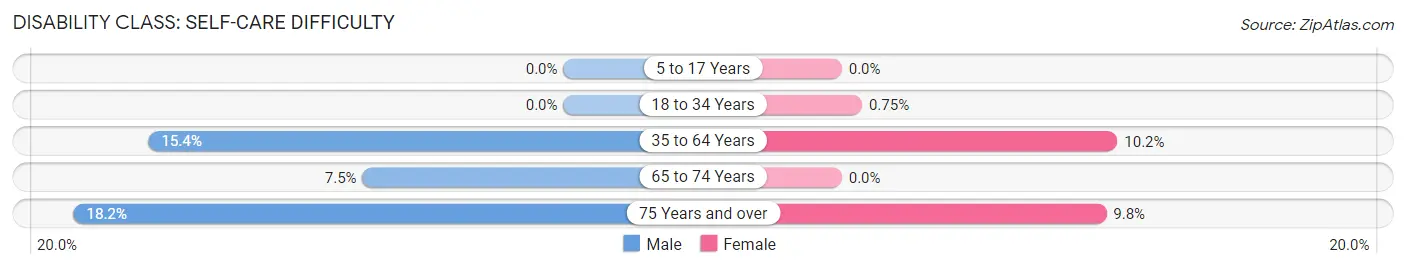
| Age Bracket | Male | Female |
| 5 to 17 Years | 0 (0.0%) | 0 (0.0%) |
| 18 to 34 Years | 0 (0.0%) | 2 (0.7%) |
| 35 to 64 Years | 61 (15.4%) | 54 (10.2%) |
| 65 to 74 Years | 20 (7.5%) | 0 (0.0%) |
| 75 Years and over | 26 (18.2%) | 11 (9.8%) |
Technology Access in Brownstown
Computing Device Access in Brownstown
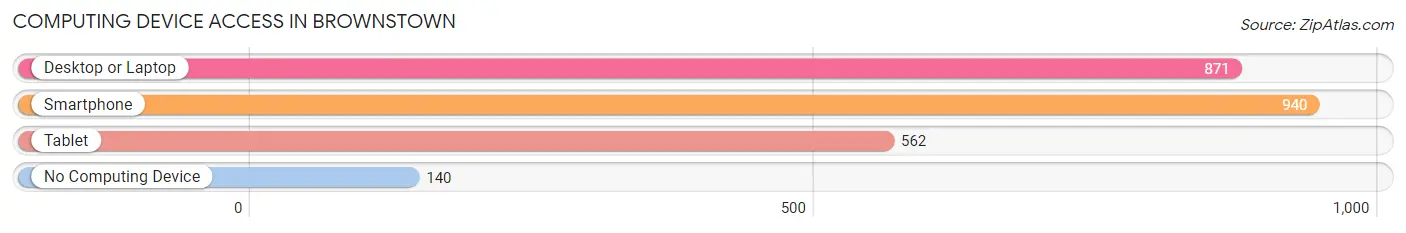
| Device Type | # Households | % Households |
| Desktop or Laptop | 871 | 73.6% |
| Smartphone | 940 | 79.4% |
| Tablet | 562 | 47.5% |
| No Computing Device | 140 | 11.8% |
| Total | 1,184 | 100.0% |
Internet Access in Brownstown
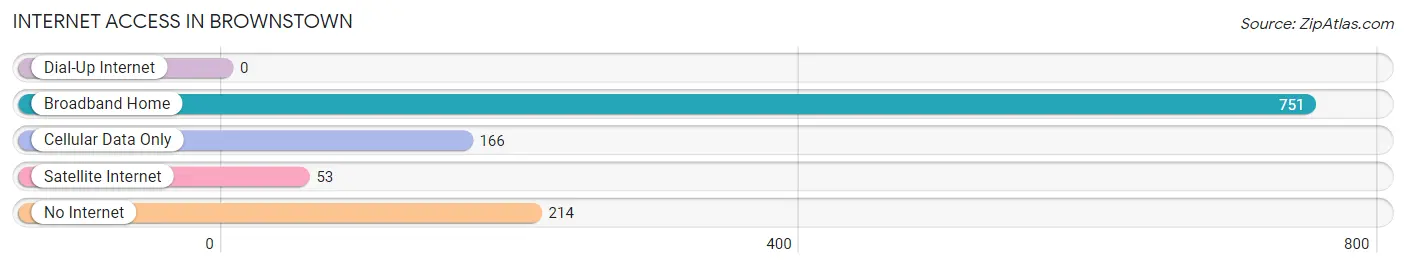
| Internet Type | # Households | % Households |
| Dial-Up Internet | 0 | 0.0% |
| Broadband Home | 751 | 63.4% |
| Cellular Data Only | 166 | 14.0% |
| Satellite Internet | 53 | 4.5% |
| No Internet | 214 | 18.1% |
| Total | 1,184 | 100.0% |
Brownstown Summary
Brownstown, Indiana is a small town located in Jackson County, Indiana. It is situated in the southeastern part of the state, about 40 miles south of Indianapolis. The town was founded in 1818 and has a population of about 2,500 people.
Geography
Brownstown is located in the rolling hills of southern Indiana. It is situated in the Muscatatuck River Valley, which is part of the larger Ohio River Valley. The town is surrounded by farmland and is located near the Muscatatuck National Wildlife Refuge. The town is also close to the Hoosier National Forest, which provides a variety of recreational activities.
The town is located at the intersection of State Road 250 and State Road 135. It is about 40 miles south of Indianapolis and about 60 miles north of Louisville, Kentucky. The nearest major airport is Indianapolis International Airport, which is about an hour away.
Economy
The economy of Brownstown is largely based on agriculture. The town is home to several farms, which produce a variety of crops, including corn, soybeans, and wheat. The town also has a few small businesses, including a grocery store, a hardware store, and a few restaurants.
The town is also home to a few manufacturing companies, including a plastics manufacturer and a furniture manufacturer. The town is also home to a few small technology companies, which provide software and web development services.
Demographics
As of the 2010 census, the population of Brownstown was 2,521. The racial makeup of the town was 97.3% White, 0.7% African American, 0.2% Native American, 0.3% Asian, 0.1% Pacific Islander, 0.4% from other races, and 1.0% from two or more races. Hispanic or Latino of any race were 1.2% of the population.
The median income for a household in the town was $37,917, and the median income for a family was $45,000. The per capita income for the town was $18,945. About 11.2% of families and 14.2% of the population were below the poverty line, including 18.2% of those under age 18 and 8.2% of those age 65 or over.
History
Brownstown was founded in 1818 by a group of settlers from North Carolina. The town was named after William Brown, who was one of the original settlers. The town was originally a farming community, but it soon became a center for manufacturing and industry.
In the late 19th century, the town was home to several factories, including a furniture factory, a brick factory, and a canning factory. The town also had a few small businesses, including a grocery store, a hardware store, and a few restaurants.
In the early 20th century, the town experienced a period of growth and prosperity. The town was home to several banks, a movie theater, and a few hotels. The town also had a few small manufacturing companies, including a plastics manufacturer and a furniture manufacturer.
In the late 20th century, the town experienced a period of decline. Many of the factories and businesses closed, and the population of the town began to decline. In recent years, the town has experienced a resurgence, with new businesses and industries moving into the area. The town is now home to several technology companies, which provide software and web development services.
Common Questions
What is Per Capita Income in Brownstown?
Per Capita income in Brownstown is $30,692.
What is the Median Family Income in Brownstown?
Median Family Income in Brownstown is $64,342.
What is the Median Household income in Brownstown?
Median Household Income in Brownstown is $60,393.
What is Income or Wage Gap in Brownstown?
Income or Wage Gap in Brownstown is 32.8%.
Women in Brownstown earn 67.2 cents for every dollar earned by a man.
What is Inequality or Gini Index in Brownstown?
Inequality or Gini Index in Brownstown is 0.43.
What is the Total Population of Brownstown?
Total Population of Brownstown is 3,015.
What is the Total Male Population of Brownstown?
Total Male Population of Brownstown is 1,414.
What is the Total Female Population of Brownstown?
Total Female Population of Brownstown is 1,601.
What is the Ratio of Males per 100 Females in Brownstown?
There are 88.32 Males per 100 Females in Brownstown.
What is the Ratio of Females per 100 Males in Brownstown?
There are 113.22 Females per 100 Males in Brownstown.
What is the Median Population Age in Brownstown?
Median Population Age in Brownstown is 45.3 Years.
What is the Average Family Size in Brownstown
Average Family Size in Brownstown is 2.9 People.
What is the Average Household Size in Brownstown
Average Household Size in Brownstown is 2.4 People.
How Large is the Labor Force in Brownstown?
There are 1,178 People in the Labor Forcein in Brownstown.
What is the Percentage of People in the Labor Force in Brownstown?
51.1% of People are in the Labor Force in Brownstown.
What is the Unemployment Rate in Brownstown?
Unemployment Rate in Brownstown is 1.9%.