Stinesville, IN Map & Demographics
Stinesville Map
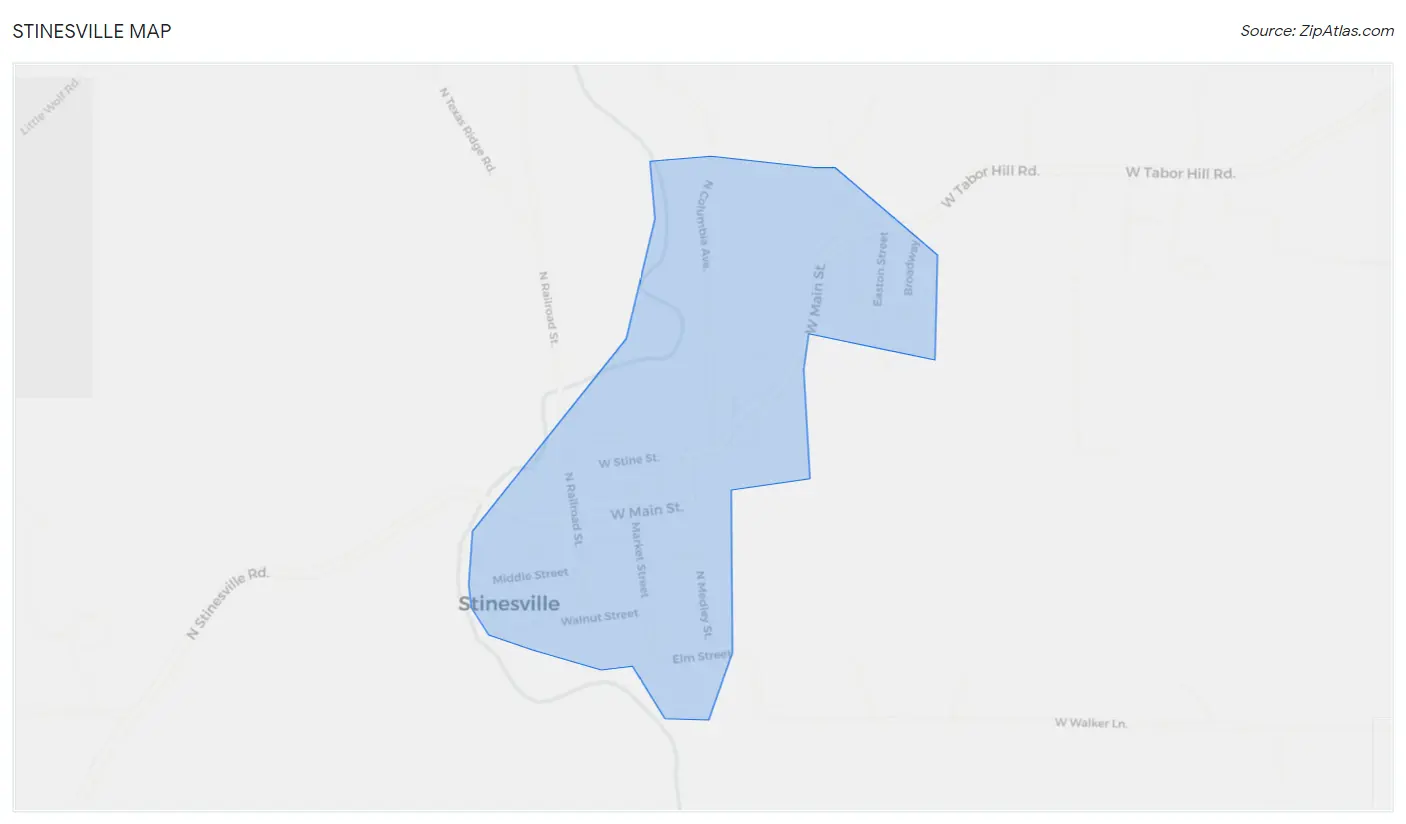
Stinesville Overview
$31,553
PER CAPITA INCOME
$74,688
AVG FAMILY INCOME
$58,889
AVG HOUSEHOLD INCOME
14.3%
WAGE / INCOME GAP [ % ]
85.7¢/ $1
WAGE / INCOME GAP [ $ ]
0.38
INEQUALITY / GINI INDEX
350
TOTAL POPULATION
196
MALE POPULATION
154
FEMALE POPULATION
127.27
MALES / 100 FEMALES
78.57
FEMALES / 100 MALES
41.3
MEDIAN AGE
2.5
AVG FAMILY SIZE
2.1
AVG HOUSEHOLD SIZE
194
LABOR FORCE [ PEOPLE ]
63.8%
PERCENT IN LABOR FORCE
9.8%
UNEMPLOYMENT RATE
Stinesville Zip Codes
Stinesville Area Codes
Income in Stinesville
Income Overview in Stinesville
Per Capita Income in Stinesville is $31,553, while median incomes of families and households are $74,688 and $58,889 respectively.
| Characteristic | Number | Measure |
| Per Capita Income | 350 | $31,553 |
| Median Family Income | 64 | $74,688 |
| Mean Family Income | 64 | $74,959 |
| Median Household Income | 170 | $58,889 |
| Mean Household Income | 170 | $65,732 |
| Income Deficit | 64 | $0 |
| Wage / Income Gap (%) | 350 | 14.28% |
| Wage / Income Gap ($) | 350 | 85.72¢ per $1 |
| Gini / Inequality Index | 350 | 0.38 |
Earnings by Sex in Stinesville
Average Earnings in Stinesville are $52,768, $54,554 for men and $46,765 for women, a difference of 14.3%.
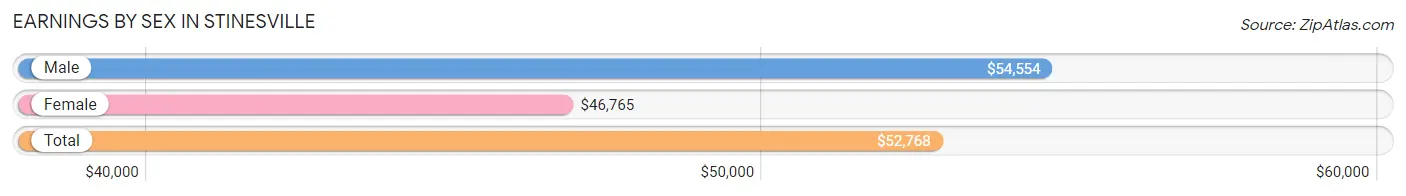
| Sex | Number | Average Earnings |
| Male | 115 (63.5%) | $54,554 |
| Female | 66 (36.5%) | $46,765 |
| Total | 181 (100.0%) | $52,768 |
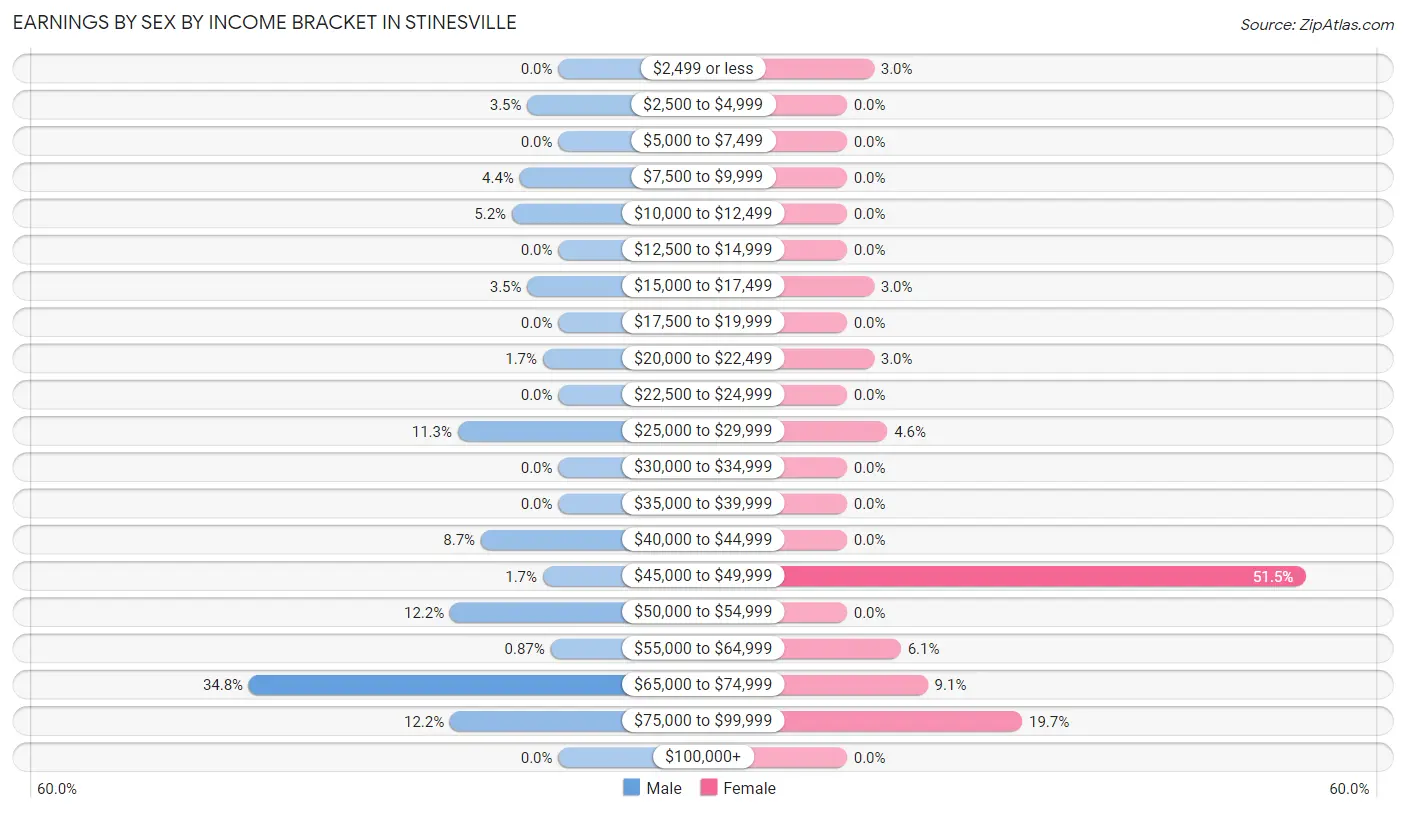
Earnings by Sex by Income Bracket in Stinesville
The most common earnings brackets in Stinesville are $65,000 to $74,999 for men (40 | 34.8%) and $45,000 to $49,999 for women (34 | 51.5%).
| Income | Male | Female |
| $2,499 or less | 0 (0.0%) | 2 (3.0%) |
| $2,500 to $4,999 | 4 (3.5%) | 0 (0.0%) |
| $5,000 to $7,499 | 0 (0.0%) | 0 (0.0%) |
| $7,500 to $9,999 | 5 (4.3%) | 0 (0.0%) |
| $10,000 to $12,499 | 6 (5.2%) | 0 (0.0%) |
| $12,500 to $14,999 | 0 (0.0%) | 0 (0.0%) |
| $15,000 to $17,499 | 4 (3.5%) | 2 (3.0%) |
| $17,500 to $19,999 | 0 (0.0%) | 0 (0.0%) |
| $20,000 to $22,499 | 2 (1.7%) | 2 (3.0%) |
| $22,500 to $24,999 | 0 (0.0%) | 0 (0.0%) |
| $25,000 to $29,999 | 13 (11.3%) | 3 (4.5%) |
| $30,000 to $34,999 | 0 (0.0%) | 0 (0.0%) |
| $35,000 to $39,999 | 0 (0.0%) | 0 (0.0%) |
| $40,000 to $44,999 | 10 (8.7%) | 0 (0.0%) |
| $45,000 to $49,999 | 2 (1.7%) | 34 (51.5%) |
| $50,000 to $54,999 | 14 (12.2%) | 0 (0.0%) |
| $55,000 to $64,999 | 1 (0.9%) | 4 (6.1%) |
| $65,000 to $74,999 | 40 (34.8%) | 6 (9.1%) |
| $75,000 to $99,999 | 14 (12.2%) | 13 (19.7%) |
| $100,000+ | 0 (0.0%) | 0 (0.0%) |
| Total | 115 (100.0%) | 66 (100.0%) |
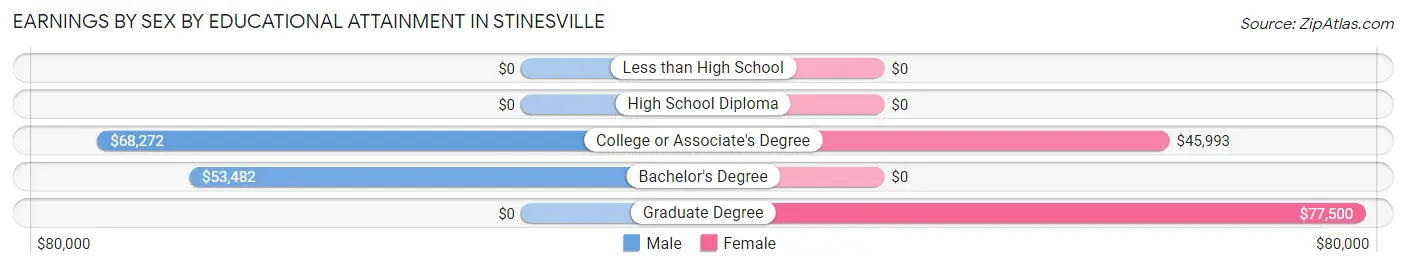
Earnings by Sex by Educational Attainment in Stinesville
Average earnings in Stinesville are $56,250 for men and $46,765 for women, a difference of 16.9%. Men with an educational attainment of college or associate's degree enjoy the highest average annual earnings of $68,272, while those with bachelor's degree education earn the least with $53,482. Women with an educational attainment of graduate degree earn the most with the average annual earnings of $77,500, while those with college or associate's degree education have the smallest earnings of $45,993.
| Educational Attainment | Male Income | Female Income |
| Less than High School | - | - |
| High School Diploma | - | - |
| College or Associate's Degree | $68,272 | $45,993 |
| Bachelor's Degree | $53,482 | $0 |
| Graduate Degree | - | - |
| Total | $56,250 | $46,765 |
Family Income in Stinesville
Family Income Brackets in Stinesville
According to the Stinesville family income data, there are 17 families falling into the $50,000 to $74,999 income range, which is the most common income bracket and makes up 26.6% of all families.
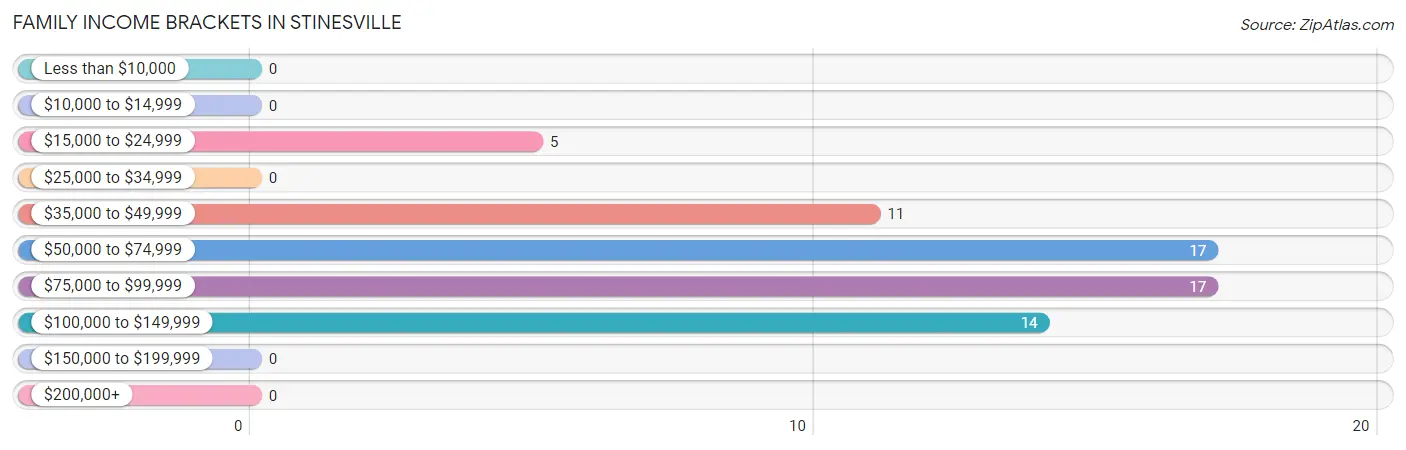
| Income Bracket | # Families | % Families |
| Less than $10,000 | 0 | 0.0% |
| $10,000 to $14,999 | 0 | 0.0% |
| $15,000 to $24,999 | 5 | 7.8% |
| $25,000 to $34,999 | 0 | 0.0% |
| $35,000 to $49,999 | 11 | 17.2% |
| $50,000 to $74,999 | 17 | 26.6% |
| $75,000 to $99,999 | 17 | 26.6% |
| $100,000 to $149,999 | 14 | 21.9% |
| $150,000 to $199,999 | 0 | 0.0% |
| $200,000+ | 0 | 0.0% |
Family Income by Famaliy Size in Stinesville
3-person families (12 | 18.8%) account for the highest median family income in Stinesville with $95,000 per family, while 2-person families (35 | 54.7%) have the highest median income of $45,170 per family member.
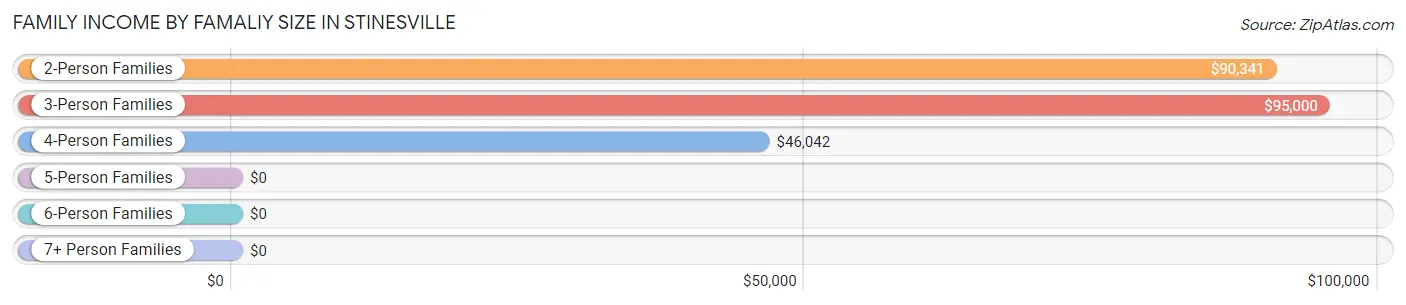
| Income Bracket | # Families | Median Income |
| 2-Person Families | 35 (54.7%) | $90,341 |
| 3-Person Families | 12 (18.8%) | $95,000 |
| 4-Person Families | 15 (23.4%) | $46,042 |
| 5-Person Families | 2 (3.1%) | $0 |
| 6-Person Families | 0 (0.0%) | $0 |
| 7+ Person Families | 0 (0.0%) | $0 |
| Total | 64 (100.0%) | $74,688 |
Family Income by Number of Earners in Stinesville
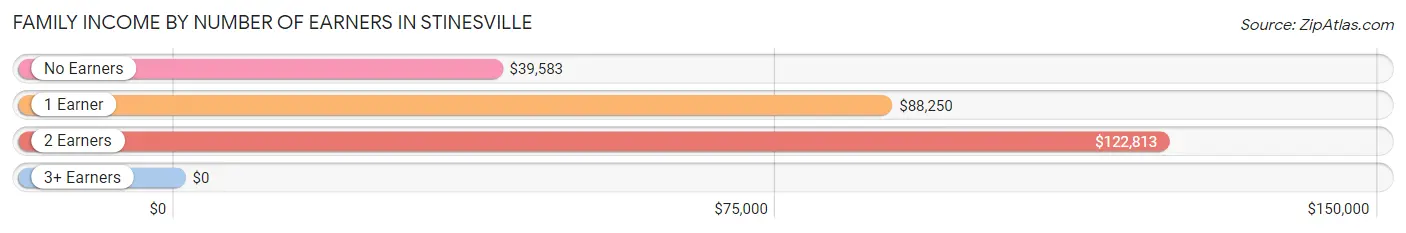
| Number of Earners | # Families | Median Income |
| No Earners | 15 (23.4%) | $39,583 |
| 1 Earner | 29 (45.3%) | $88,250 |
| 2 Earners | 14 (21.9%) | $122,813 |
| 3+ Earners | 6 (9.4%) | $0 |
| Total | 64 (100.0%) | $74,688 |
Household Income in Stinesville
Household Income Brackets in Stinesville
With 46 households falling in the category, the $100,000 to $149,999 income range is the most frequent in Stinesville, accounting for 27.1% of all households.
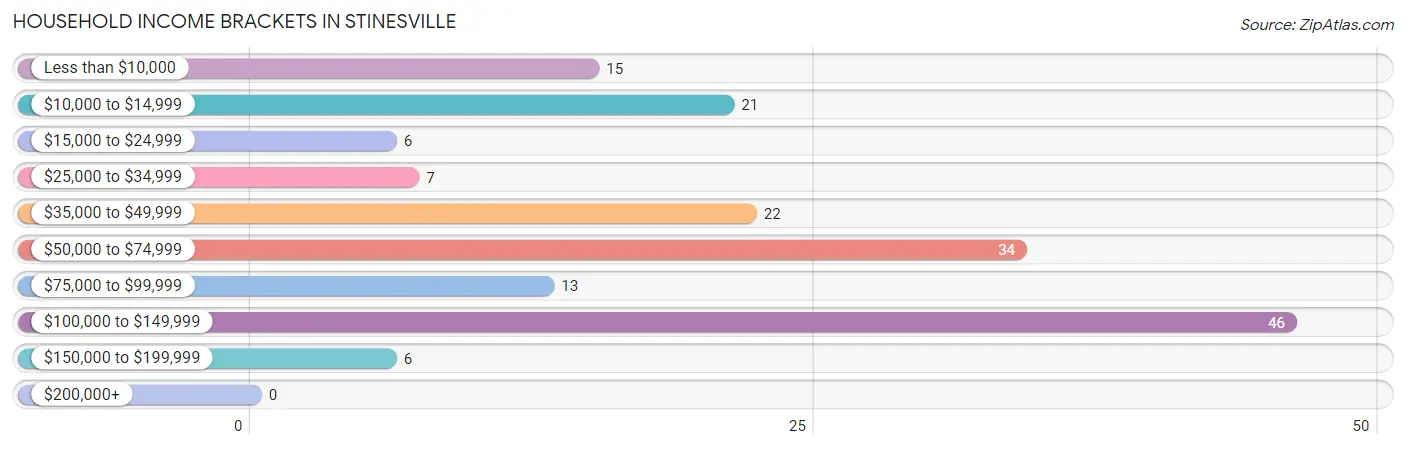
| Income Bracket | # Households | % Households |
| Less than $10,000 | 15 | 8.8% |
| $10,000 to $14,999 | 21 | 12.4% |
| $15,000 to $24,999 | 6 | 3.5% |
| $25,000 to $34,999 | 7 | 4.1% |
| $35,000 to $49,999 | 22 | 12.9% |
| $50,000 to $74,999 | 34 | 20.0% |
| $75,000 to $99,999 | 13 | 7.6% |
| $100,000 to $149,999 | 46 | 27.1% |
| $150,000 to $199,999 | 6 | 3.5% |
| $200,000+ | 0 | 0.0% |
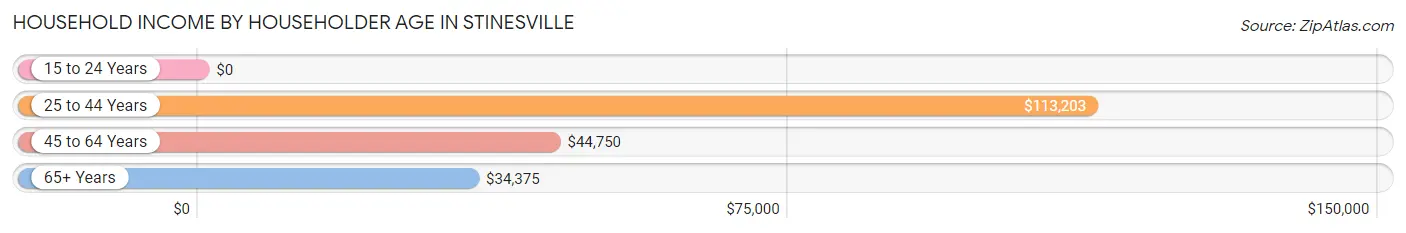
Household Income by Householder Age in Stinesville
The median household income in Stinesville is $58,889, with the highest median household income of $113,203 found in the 25 to 44 years age bracket for the primary householder. A total of 74 households (43.5%) fall into this category.
| Income Bracket | # Households | Median Income |
| 15 to 24 Years | 0 (0.0%) | $0 |
| 25 to 44 Years | 74 (43.5%) | $113,203 |
| 45 to 64 Years | 63 (37.1%) | $44,750 |
| 65+ Years | 33 (19.4%) | $34,375 |
| Total | 170 (100.0%) | $58,889 |
Poverty in Stinesville
Income Below Poverty by Sex and Age in Stinesville
With 17.6% poverty level for males and 22.5% for females among the residents of Stinesville, 6 to 11 year old males and 65 to 74 year old females are the most vulnerable to poverty, with 5 males (55.6%) and 7 females (50.0%) in their respective age groups living below the poverty level.
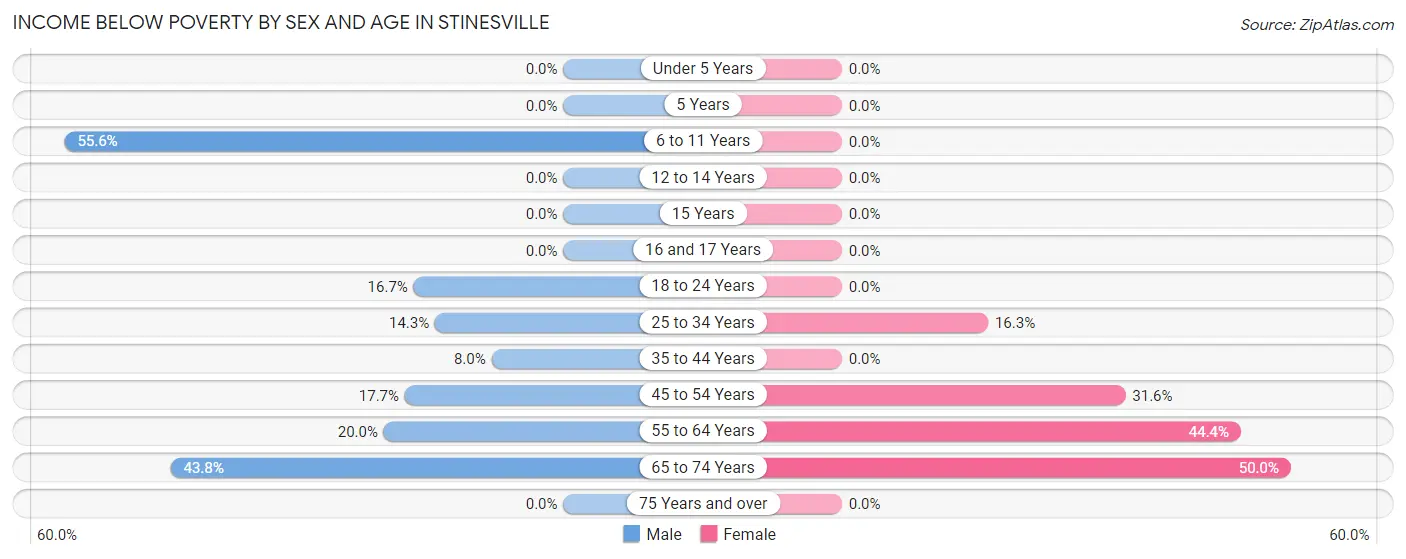
| Age Bracket | Male | Female |
| Under 5 Years | 0 (0.0%) | 0 (0.0%) |
| 5 Years | 0 (0.0%) | 0 (0.0%) |
| 6 to 11 Years | 5 (55.6%) | 0 (0.0%) |
| 12 to 14 Years | 0 (0.0%) | 0 (0.0%) |
| 15 Years | 0 (0.0%) | 0 (0.0%) |
| 16 and 17 Years | 0 (0.0%) | 0 (0.0%) |
| 18 to 24 Years | 1 (16.7%) | 0 (0.0%) |
| 25 to 34 Years | 3 (14.3%) | 7 (16.3%) |
| 35 to 44 Years | 4 (8.0%) | 0 (0.0%) |
| 45 to 54 Years | 6 (17.6%) | 6 (31.6%) |
| 55 to 64 Years | 6 (20.0%) | 12 (44.4%) |
| 65 to 74 Years | 7 (43.8%) | 7 (50.0%) |
| 75 Years and over | 0 (0.0%) | 0 (0.0%) |
| Total | 32 (17.6%) | 32 (22.5%) |
Income Above Poverty by Sex and Age in Stinesville
According to the poverty statistics in Stinesville, males aged under 5 years and females aged under 5 years are the age groups that are most secure financially, with 100.0% of males and 100.0% of females in these age groups living above the poverty line.
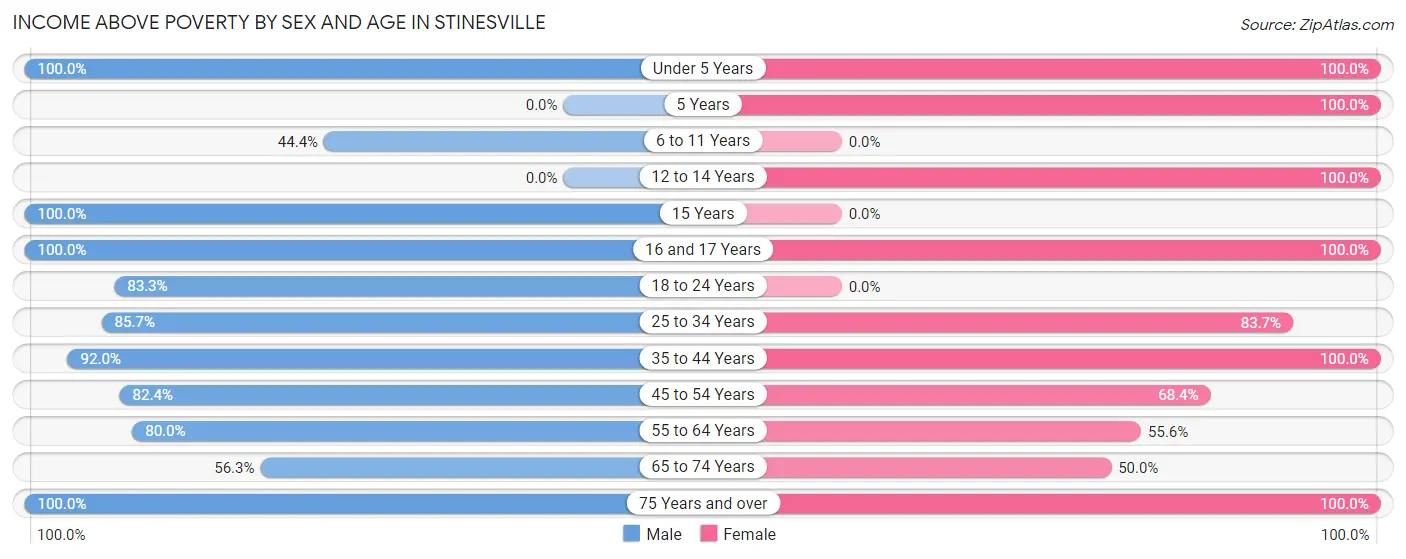
| Age Bracket | Male | Female |
| Under 5 Years | 2 (100.0%) | 5 (100.0%) |
| 5 Years | 0 (0.0%) | 1 (100.0%) |
| 6 to 11 Years | 4 (44.4%) | 0 (0.0%) |
| 12 to 14 Years | 0 (0.0%) | 1 (100.0%) |
| 15 Years | 2 (100.0%) | 0 (0.0%) |
| 16 and 17 Years | 9 (100.0%) | 1 (100.0%) |
| 18 to 24 Years | 5 (83.3%) | 0 (0.0%) |
| 25 to 34 Years | 18 (85.7%) | 36 (83.7%) |
| 35 to 44 Years | 46 (92.0%) | 26 (100.0%) |
| 45 to 54 Years | 28 (82.4%) | 13 (68.4%) |
| 55 to 64 Years | 24 (80.0%) | 15 (55.6%) |
| 65 to 74 Years | 9 (56.2%) | 7 (50.0%) |
| 75 Years and over | 3 (100.0%) | 5 (100.0%) |
| Total | 150 (82.4%) | 110 (77.5%) |
Income Below Poverty Among Married-Couple Families in Stinesville
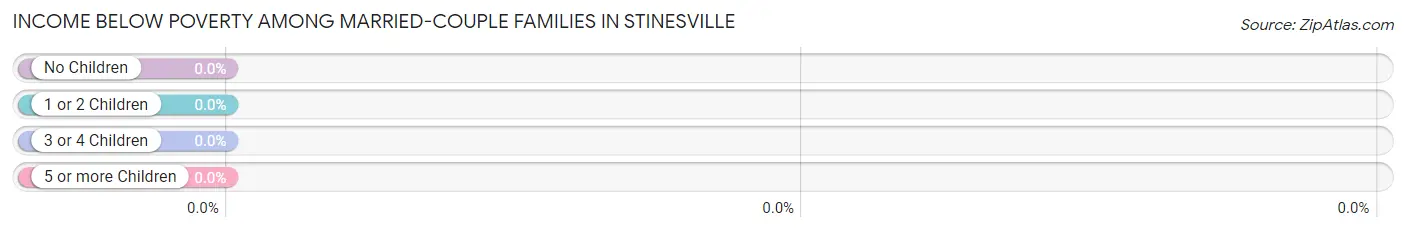
| Children | Above Poverty | Below Poverty |
| No Children | 41 (100.0%) | 0 (0.0%) |
| 1 or 2 Children | 11 (100.0%) | 0 (0.0%) |
| 3 or 4 Children | 0 (0.0%) | 0 (0.0%) |
| 5 or more Children | 0 (0.0%) | 0 (0.0%) |
| Total | 52 (100.0%) | 0 (0.0%) |
Income Below Poverty Among Single-Parent Households in Stinesville
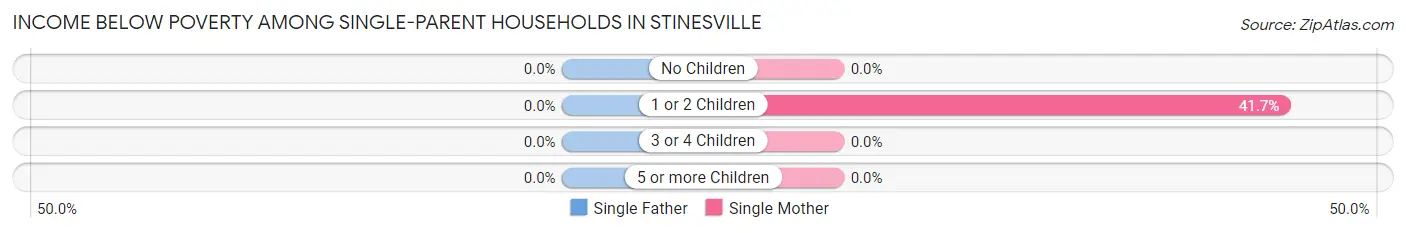
| Children | Single Father | Single Mother |
| No Children | 0 (0.0%) | 0 (0.0%) |
| 1 or 2 Children | 0 (0.0%) | 5 (41.7%) |
| 3 or 4 Children | 0 (0.0%) | 0 (0.0%) |
| 5 or more Children | 0 (0.0%) | 0 (0.0%) |
| Total | 0 (0.0%) | 5 (41.7%) |
Income Below Poverty Among Married-Couple vs Single-Parent Households in Stinesville
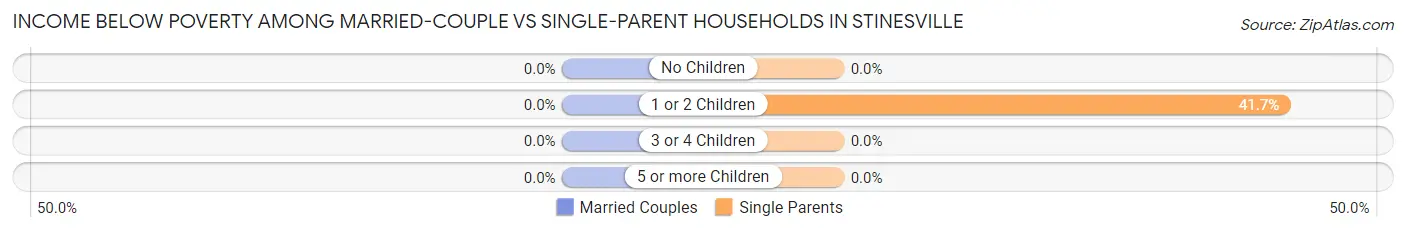
| Children | Married-Couple Families | Single-Parent Households |
| No Children | 0 (0.0%) | 0 (0.0%) |
| 1 or 2 Children | 0 (0.0%) | 5 (41.7%) |
| 3 or 4 Children | 0 (0.0%) | 0 (0.0%) |
| 5 or more Children | 0 (0.0%) | 0 (0.0%) |
| Total | 0 (0.0%) | 5 (41.7%) |
Race in Stinesville
The most populous races in Stinesville are White / Caucasian (317 | 90.6%), Two or more Races (33 | 9.4%), and Hispanic or Latino (26 | 7.4%).
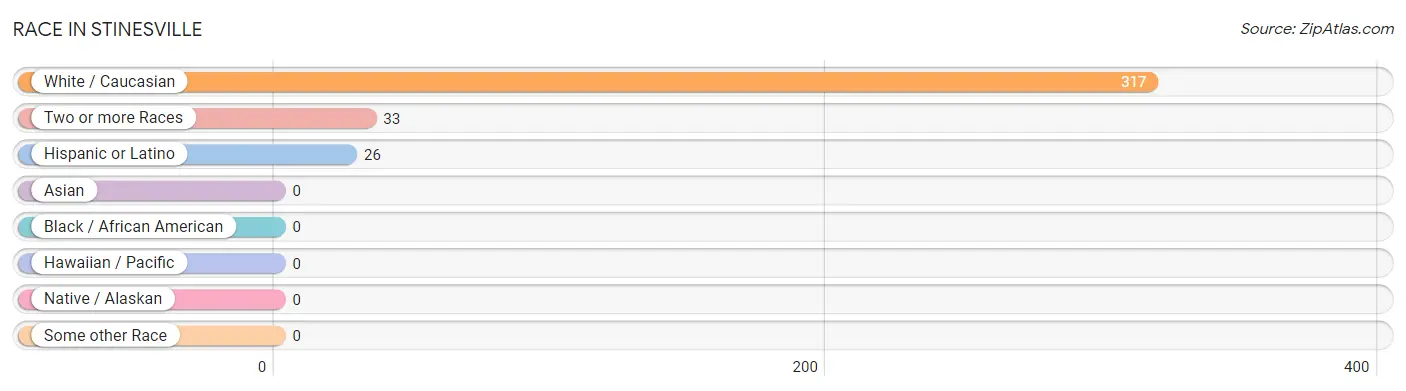
| Race | # Population | % Population |
| Asian | 0 | 0.0% |
| Black / African American | 0 | 0.0% |
| Hawaiian / Pacific | 0 | 0.0% |
| Hispanic or Latino | 26 | 7.4% |
| Native / Alaskan | 0 | 0.0% |
| White / Caucasian | 317 | 90.6% |
| Two or more Races | 33 | 9.4% |
| Some other Race | 0 | 0.0% |
| Total | 350 | 100.0% |
Ancestry in Stinesville
The most populous ancestries reported in Stinesville are Irish (124 | 35.4%), English (75 | 21.4%), German (71 | 20.3%), Italian (28 | 8.0%), and Spaniard (26 | 7.4%), together accounting for 92.6% of all Stinesville residents.
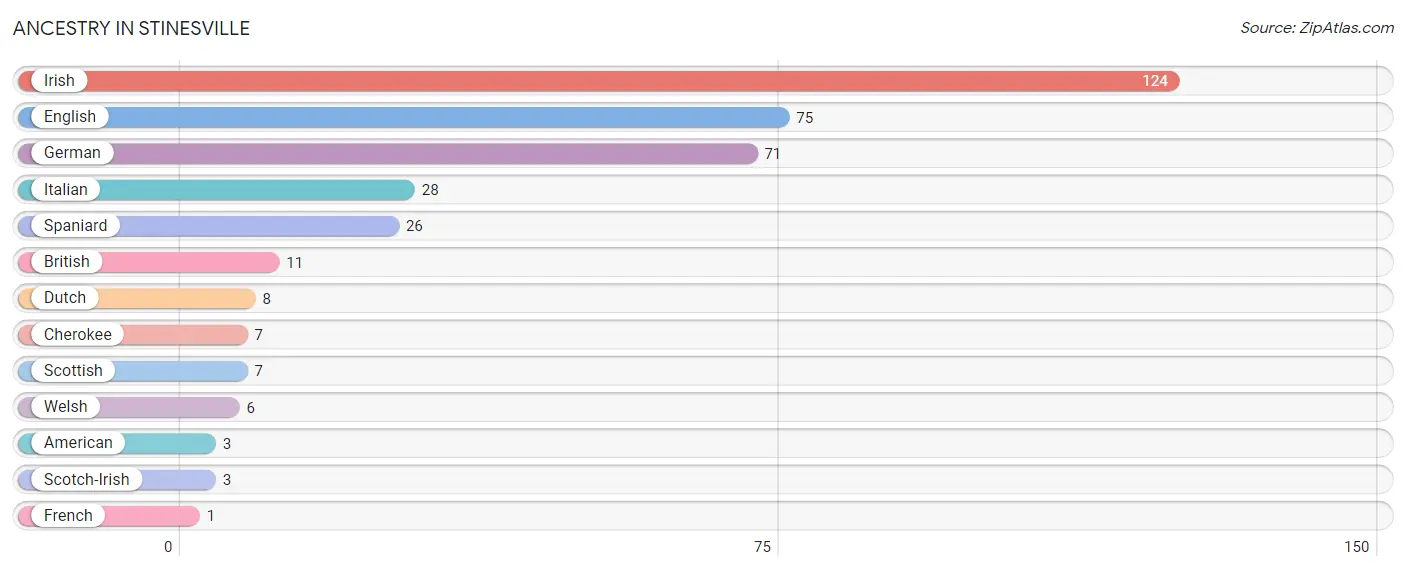
| Ancestry | # Population | % Population |
| American | 3 | 0.9% |
| British | 11 | 3.1% |
| Cherokee | 7 | 2.0% |
| Dutch | 8 | 2.3% |
| English | 75 | 21.4% |
| French | 1 | 0.3% |
| German | 71 | 20.3% |
| Irish | 124 | 35.4% |
| Italian | 28 | 8.0% |
| Scotch-Irish | 3 | 0.9% |
| Scottish | 7 | 2.0% |
| Spaniard | 26 | 7.4% |
| Welsh | 6 | 1.7% | View All 13 Rows |
Immigrants in Stinesville

| Immigration Origin | # Population | % Population | View All 0 Rows |
Sex and Age in Stinesville
Sex and Age in Stinesville
The most populous age groups in Stinesville are 35 to 39 Years (38 | 19.4%) for men and 30 to 34 Years (39 | 25.3%) for women.
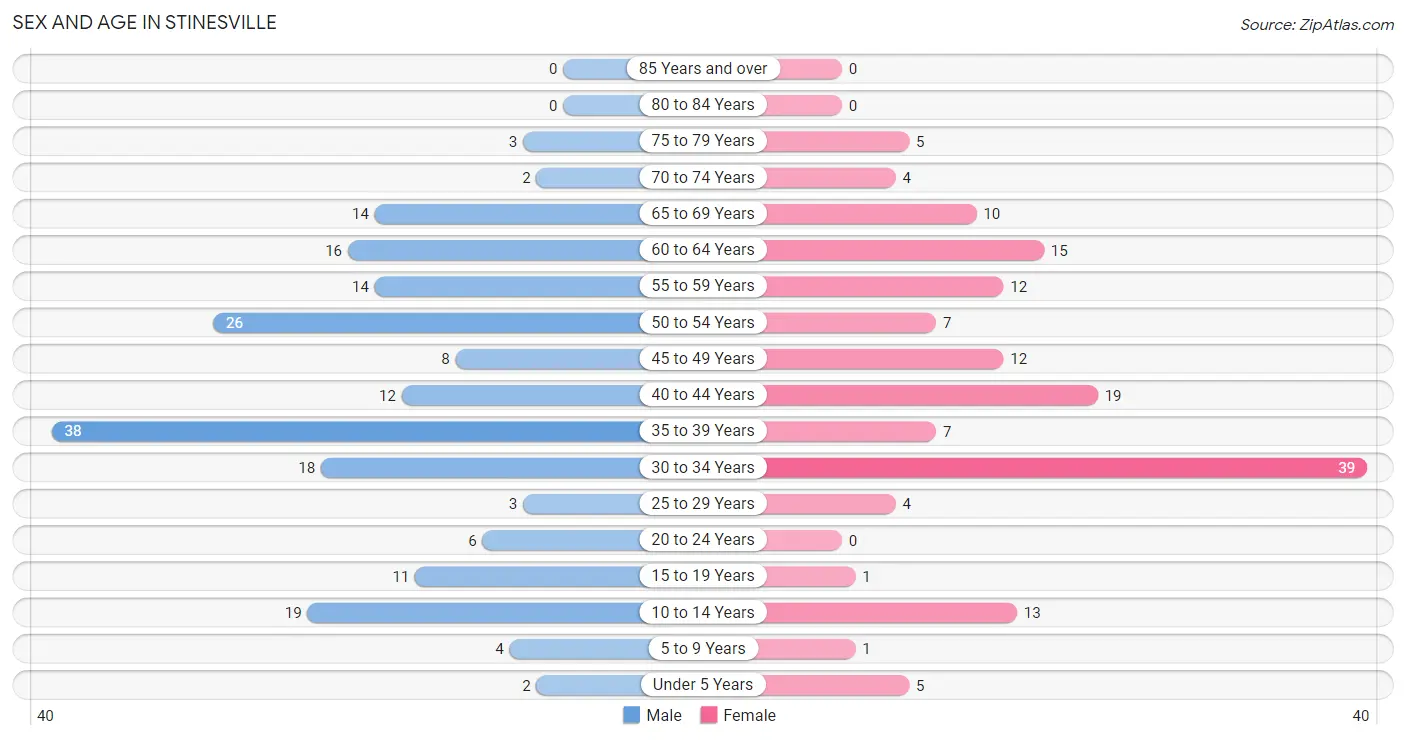
| Age Bracket | Male | Female |
| Under 5 Years | 2 (1.0%) | 5 (3.3%) |
| 5 to 9 Years | 4 (2.0%) | 1 (0.6%) |
| 10 to 14 Years | 19 (9.7%) | 13 (8.4%) |
| 15 to 19 Years | 11 (5.6%) | 1 (0.6%) |
| 20 to 24 Years | 6 (3.1%) | 0 (0.0%) |
| 25 to 29 Years | 3 (1.5%) | 4 (2.6%) |
| 30 to 34 Years | 18 (9.2%) | 39 (25.3%) |
| 35 to 39 Years | 38 (19.4%) | 7 (4.5%) |
| 40 to 44 Years | 12 (6.1%) | 19 (12.3%) |
| 45 to 49 Years | 8 (4.1%) | 12 (7.8%) |
| 50 to 54 Years | 26 (13.3%) | 7 (4.5%) |
| 55 to 59 Years | 14 (7.1%) | 12 (7.8%) |
| 60 to 64 Years | 16 (8.2%) | 15 (9.7%) |
| 65 to 69 Years | 14 (7.1%) | 10 (6.5%) |
| 70 to 74 Years | 2 (1.0%) | 4 (2.6%) |
| 75 to 79 Years | 3 (1.5%) | 5 (3.3%) |
| 80 to 84 Years | 0 (0.0%) | 0 (0.0%) |
| 85 Years and over | 0 (0.0%) | 0 (0.0%) |
| Total | 196 (100.0%) | 154 (100.0%) |
Families and Households in Stinesville
Median Family Size in Stinesville
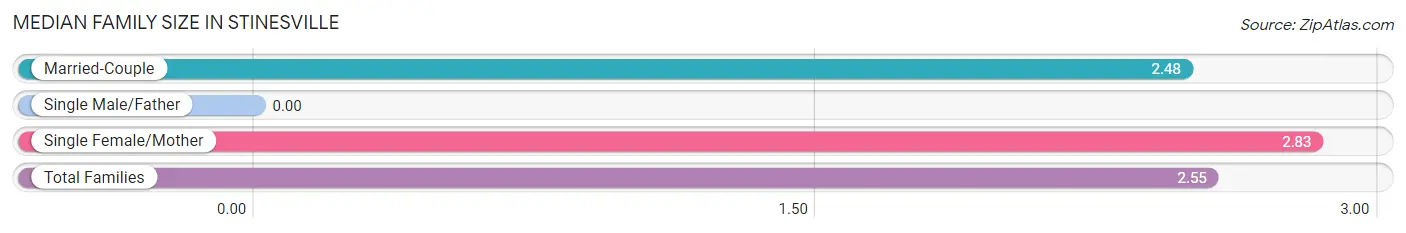
| Family Type | # Families | Family Size |
| Married-Couple | 52 (81.2%) | 2.48 |
| Single Male/Father | 0 (0.0%) | - |
| Single Female/Mother | 12 (18.8%) | 2.83 |
| Total Families | 64 (100.0%) | 2.55 |
Median Household Size in Stinesville
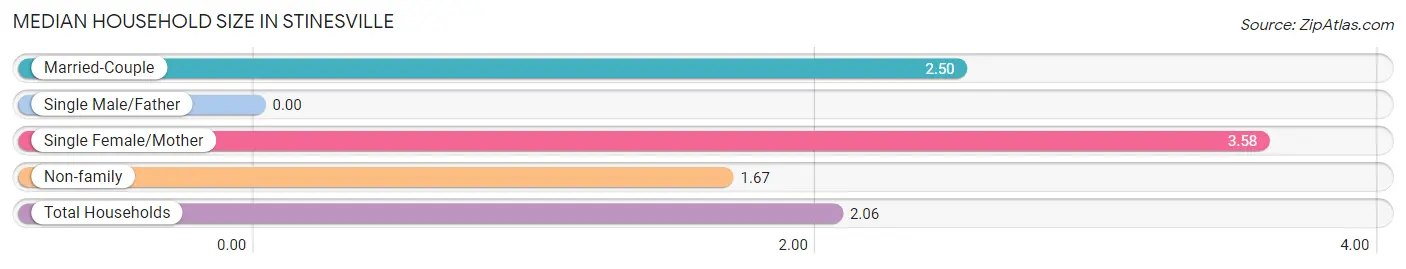
| Household Type | # Households | Household Size |
| Married-Couple | 52 (30.6%) | 2.50 |
| Single Male/Father | 0 (0.0%) | - |
| Single Female/Mother | 12 (7.1%) | 3.58 |
| Non-family | 106 (62.4%) | 1.67 |
| Total Households | 170 (100.0%) | 2.06 |
Household Size by Marriage Status in Stinesville
Out of a total of 170 households in Stinesville, 64 (37.7%) are family households, while 106 (62.4%) are nonfamily households. The most numerous type of family households are 2-person households, comprising 33, and the most common type of nonfamily households are 1-person households, comprising 67.
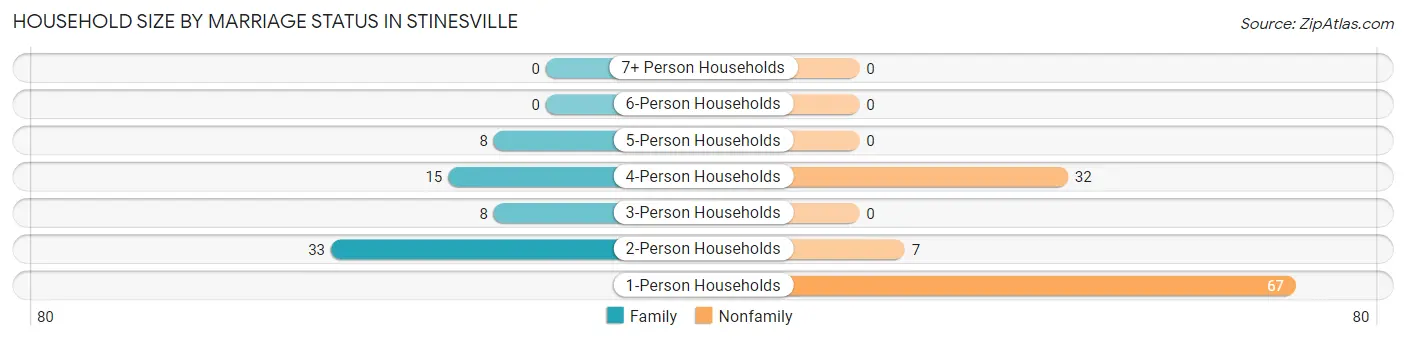
| Household Size | Family Households | Nonfamily Households |
| 1-Person Households | - | 67 (39.4%) |
| 2-Person Households | 33 (19.4%) | 7 (4.1%) |
| 3-Person Households | 8 (4.7%) | 0 (0.0%) |
| 4-Person Households | 15 (8.8%) | 32 (18.8%) |
| 5-Person Households | 8 (4.7%) | 0 (0.0%) |
| 6-Person Households | 0 (0.0%) | 0 (0.0%) |
| 7+ Person Households | 0 (0.0%) | 0 (0.0%) |
| Total | 64 (37.7%) | 106 (62.4%) |
Female Fertility in Stinesville
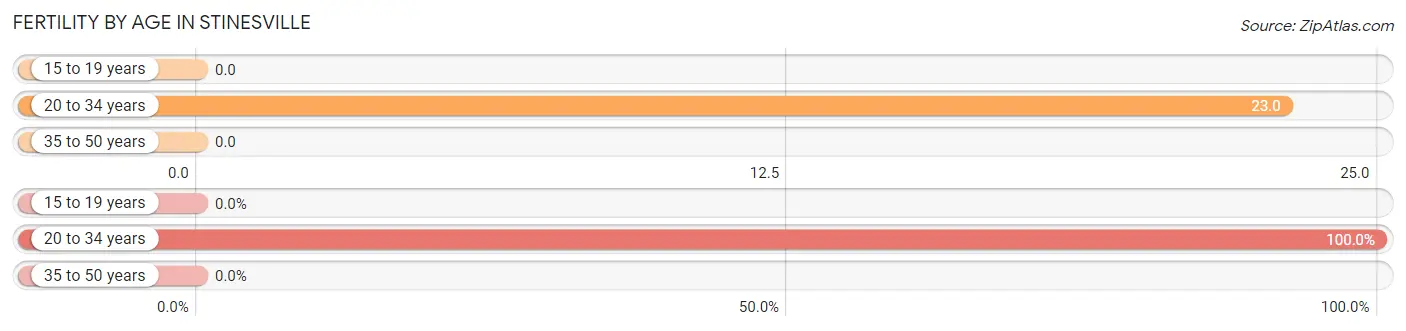
Fertility by Age in Stinesville
Average fertility rate in Stinesville is 12.0 births per 1,000 women. Women in the age bracket of 20 to 34 years have the highest fertility rate with 23.0 births per 1,000 women. Women in the age bracket of 20 to 34 years acount for 100.0% of all women with births.
| Age Bracket | Women with Births | Births / 1,000 Women |
| 15 to 19 years | 0 (0.0%) | 0.0 |
| 20 to 34 years | 1 (100.0%) | 23.0 |
| 35 to 50 years | 0 (0.0%) | 0.0 |
| Total | 1 (100.0%) | 12.0 |
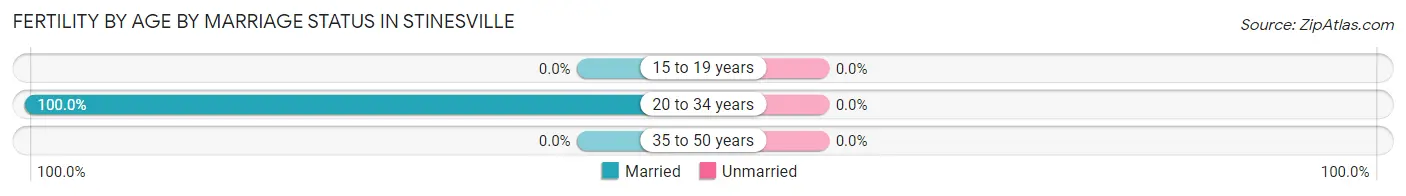
Fertility by Age by Marriage Status in Stinesville
| Age Bracket | Married | Unmarried |
| 15 to 19 years | 0 (0.0%) | 0 (0.0%) |
| 20 to 34 years | 1 (100.0%) | 0 (0.0%) |
| 35 to 50 years | 0 (0.0%) | 0 (0.0%) |
| Total | 1 (100.0%) | 0 (0.0%) |
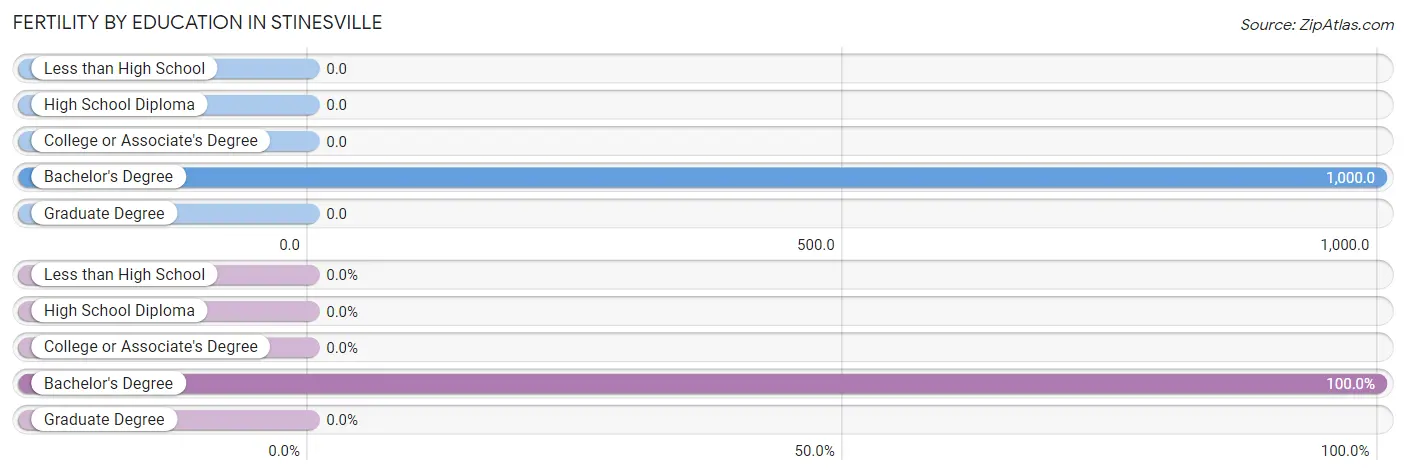
Fertility by Education in Stinesville
| Educational Attainment | Women with Births | Births / 1,000 Women |
| Less than High School | 0 (0.0%) | 0.0 |
| High School Diploma | 0 (0.0%) | 0.0 |
| College or Associate's Degree | 0 (0.0%) | 0.0 |
| Bachelor's Degree | 1 (100.0%) | 1,000.0 |
| Graduate Degree | 0 (0.0%) | 0.0 |
| Total | 1 (100.0%) | 12.0 |
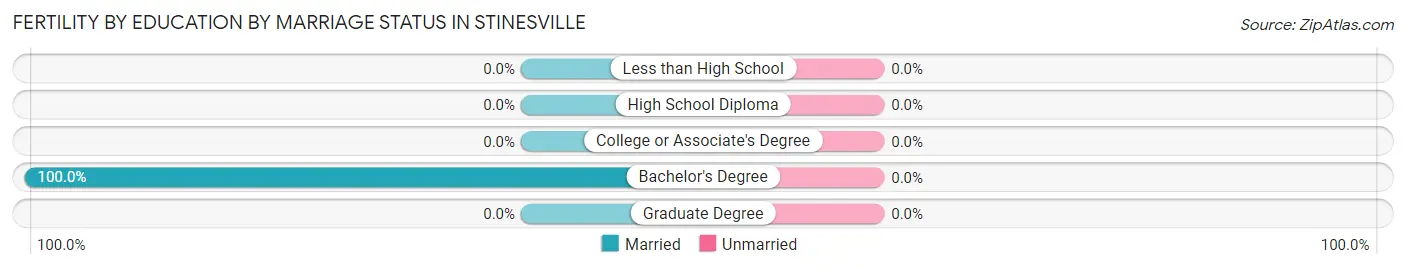
Fertility by Education by Marriage Status in Stinesville
| Educational Attainment | Married | Unmarried |
| Less than High School | 0 (0.0%) | 0 (0.0%) |
| High School Diploma | 0 (0.0%) | 0 (0.0%) |
| College or Associate's Degree | 0 (0.0%) | 0 (0.0%) |
| Bachelor's Degree | 1 (100.0%) | 0 (0.0%) |
| Graduate Degree | 0 (0.0%) | 0 (0.0%) |
| Total | 1 (100.0%) | 0 (0.0%) |
Employment Characteristics in Stinesville
Employment by Class of Employer in Stinesville
Among the 169 employed individuals in Stinesville, private company employees (119 | 70.4%), local government employees (22 | 13.0%), and state government employees (13 | 7.7%) make up the most common classes of employment.
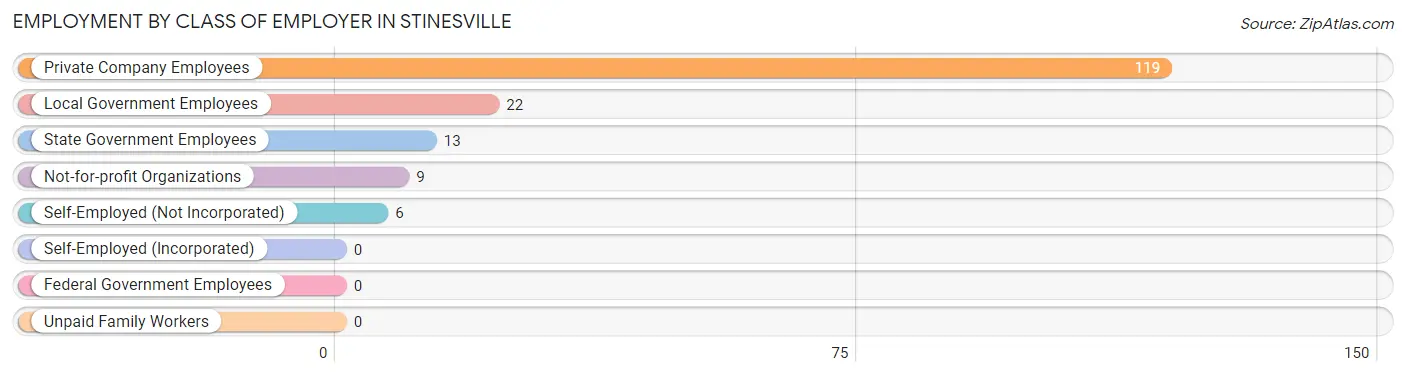
| Employer Class | # Employees | % Employees |
| Private Company Employees | 119 | 70.4% |
| Self-Employed (Incorporated) | 0 | 0.0% |
| Self-Employed (Not Incorporated) | 6 | 3.5% |
| Not-for-profit Organizations | 9 | 5.3% |
| Local Government Employees | 22 | 13.0% |
| State Government Employees | 13 | 7.7% |
| Federal Government Employees | 0 | 0.0% |
| Unpaid Family Workers | 0 | 0.0% |
| Total | 169 | 100.0% |
Employment Status by Age in Stinesville
According to the labor force statistics for Stinesville, out of the total population over 16 years of age (304), 63.8% or 194 individuals are in the labor force, with 9.8% or 19 of them unemployed. The age group with the highest labor force participation rate is 20 to 24 years, with 100.0% or 6 individuals in the labor force. Within the labor force, the 16 to 19 years age range has the highest percentage of unemployed individuals, with 100.0% or 9 of them being unemployed.
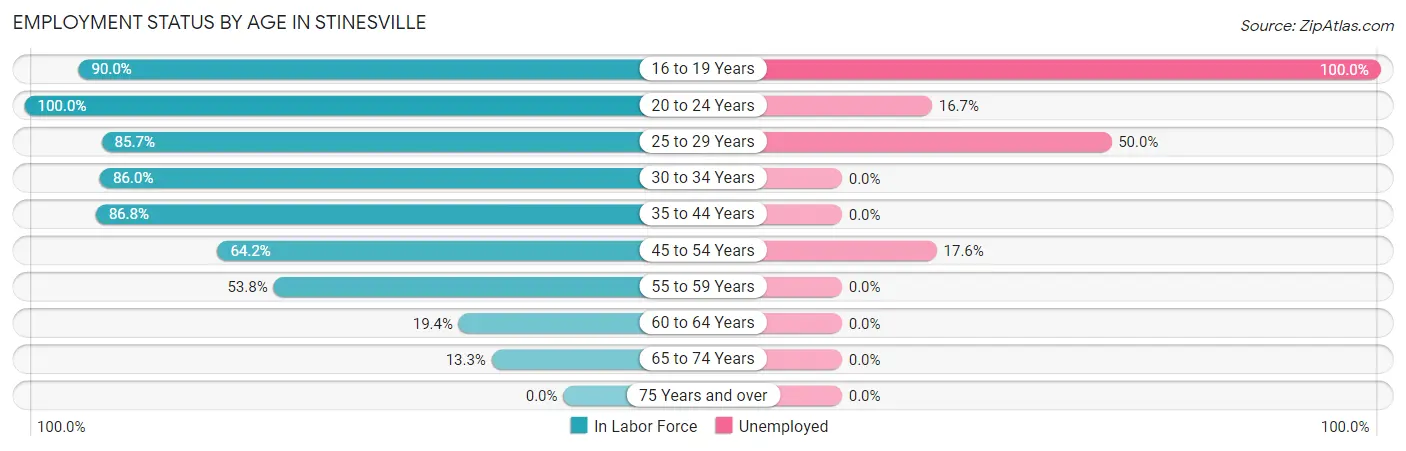
| Age Bracket | In Labor Force | Unemployed |
| 16 to 19 Years | 9 (90.0%) | 9 (100.0%) |
| 20 to 24 Years | 6 (100.0%) | 1 (16.7%) |
| 25 to 29 Years | 6 (85.7%) | 3 (50.0%) |
| 30 to 34 Years | 49 (86.0%) | 0 (0.0%) |
| 35 to 44 Years | 66 (86.8%) | 0 (0.0%) |
| 45 to 54 Years | 34 (64.2%) | 6 (17.6%) |
| 55 to 59 Years | 14 (53.8%) | 0 (0.0%) |
| 60 to 64 Years | 6 (19.4%) | 0 (0.0%) |
| 65 to 74 Years | 4 (13.3%) | 0 (0.0%) |
| 75 Years and over | 0 (0.0%) | 0 (0.0%) |
| Total | 194 (63.8%) | 19 (9.8%) |
Employment Status by Educational Attainment in Stinesville
According to labor force statistics for Stinesville, 70.0% of individuals (175) out of the total population between 25 and 64 years of age (250) are in the labor force, with 5.1% or 9 of them being unemployed. The group with the highest labor force participation rate are those with the educational attainment of bachelor's degree or higher, with 96.9% or 31 individuals in the labor force. Within the labor force, individuals with high school diploma education have the highest percentage of unemployment, with 15.0% or 9 of them being unemployed.
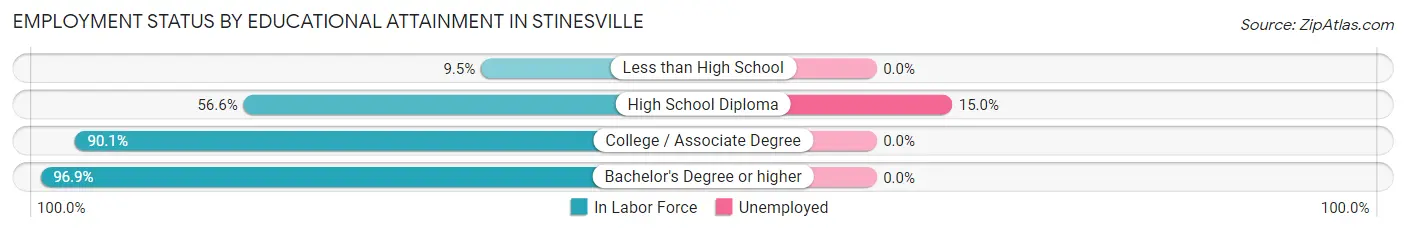
| Educational Attainment | In Labor Force | Unemployed |
| Less than High School | 2 (9.5%) | 0 (0.0%) |
| High School Diploma | 60 (56.6%) | 16 (15.0%) |
| College / Associate Degree | 82 (90.1%) | 0 (0.0%) |
| Bachelor's Degree or higher | 31 (96.9%) | 0 (0.0%) |
| Total | 175 (70.0%) | 13 (5.1%) |
Employment Occupations by Sex in Stinesville
Management, Business, Science and Arts Occupations
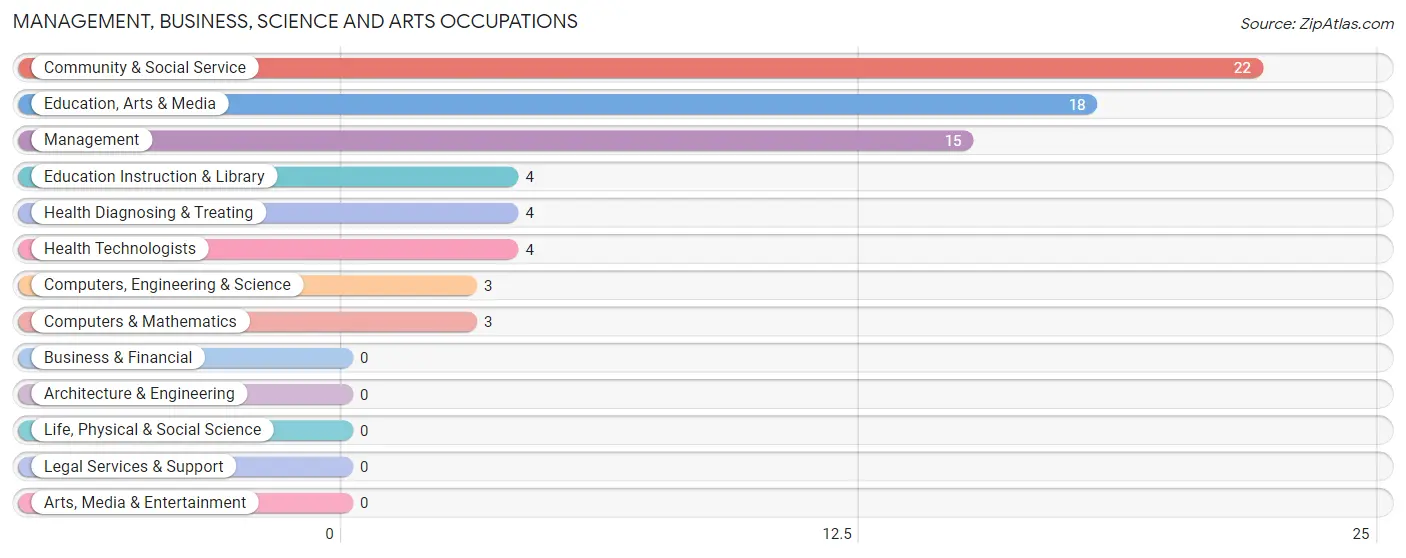
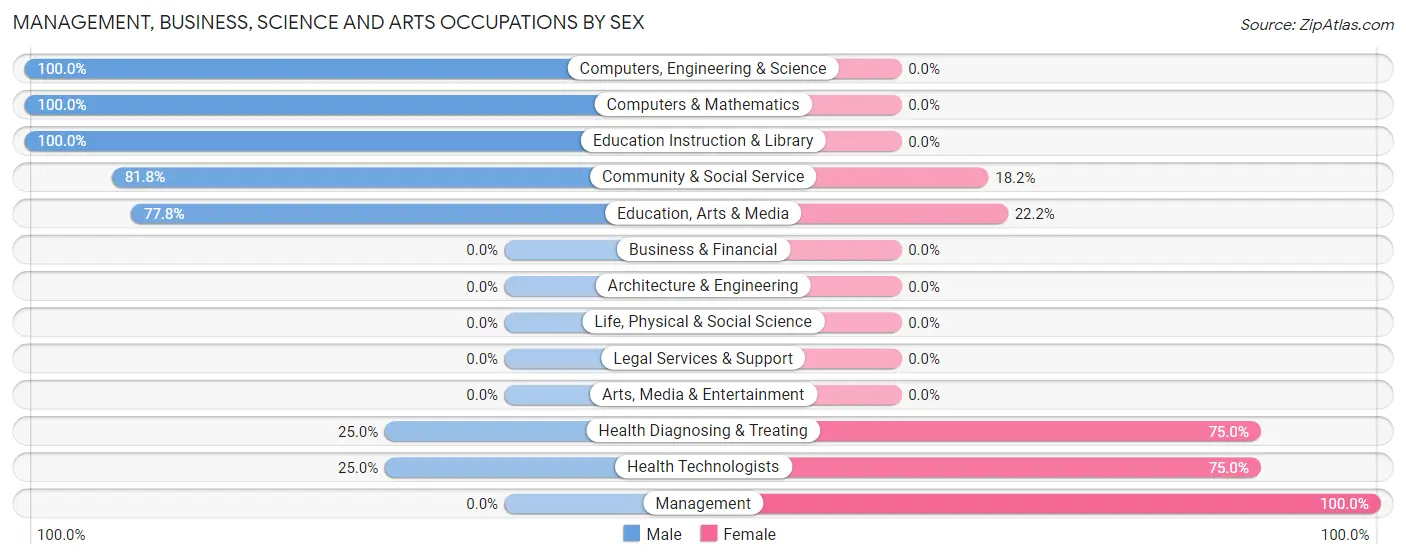
The most common Management, Business, Science and Arts occupations in Stinesville are Community & Social Service (22 | 12.6%), Education, Arts & Media (18 | 10.3%), Management (15 | 8.6%), Education Instruction & Library (4 | 2.3%), and Health Diagnosing & Treating (4 | 2.3%).
Management, Business, Science and Arts Occupations by Sex
Within the Management, Business, Science and Arts occupations in Stinesville, the most male-oriented occupations are Computers, Engineering & Science (100.0%), Computers & Mathematics (100.0%), and Education Instruction & Library (100.0%), while the most female-oriented occupations are Management (100.0%), Health Diagnosing & Treating (75.0%), and Health Technologists (75.0%).
| Occupation | Male | Female |
| Management | 0 (0.0%) | 15 (100.0%) |
| Business & Financial | 0 (0.0%) | 0 (0.0%) |
| Computers, Engineering & Science | 3 (100.0%) | 0 (0.0%) |
| Computers & Mathematics | 3 (100.0%) | 0 (0.0%) |
| Architecture & Engineering | 0 (0.0%) | 0 (0.0%) |
| Life, Physical & Social Science | 0 (0.0%) | 0 (0.0%) |
| Community & Social Service | 18 (81.8%) | 4 (18.2%) |
| Education, Arts & Media | 14 (77.8%) | 4 (22.2%) |
| Legal Services & Support | 0 (0.0%) | 0 (0.0%) |
| Education Instruction & Library | 4 (100.0%) | 0 (0.0%) |
| Arts, Media & Entertainment | 0 (0.0%) | 0 (0.0%) |
| Health Diagnosing & Treating | 1 (25.0%) | 3 (75.0%) |
| Health Technologists | 1 (25.0%) | 3 (75.0%) |
| Total (Category) | 22 (50.0%) | 22 (50.0%) |
| Total (Overall) | 109 (62.3%) | 66 (37.7%) |
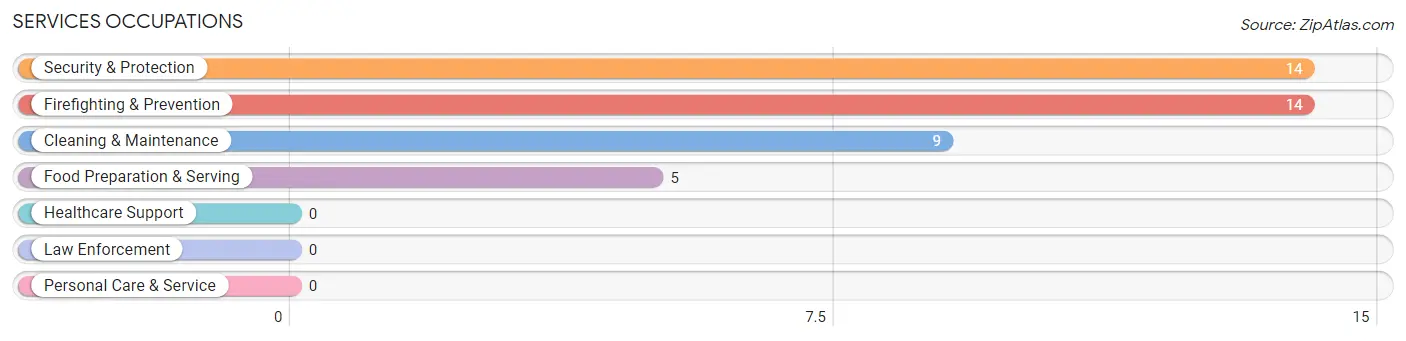
Services Occupations
The most common Services occupations in Stinesville are Security & Protection (14 | 8.0%), Firefighting & Prevention (14 | 8.0%), Cleaning & Maintenance (9 | 5.1%), and Food Preparation & Serving (5 | 2.9%).
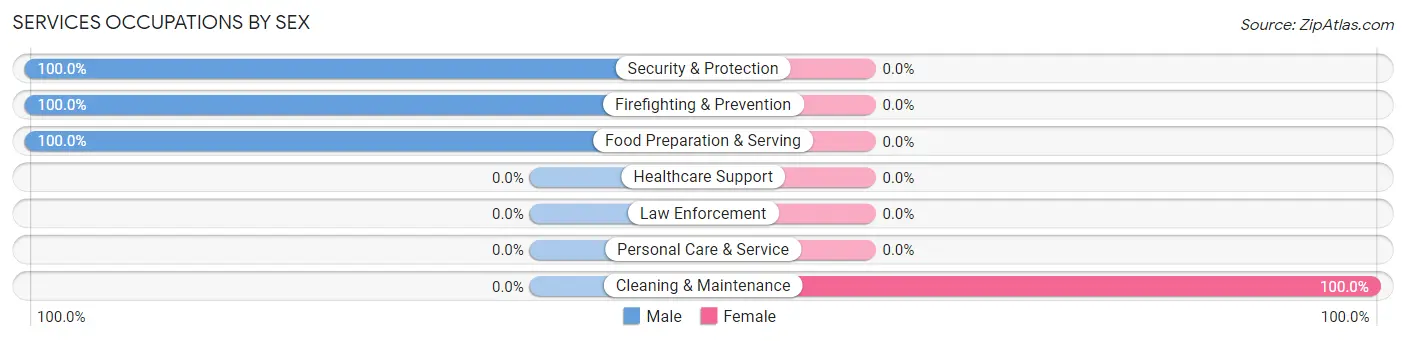
Services Occupations by Sex
| Occupation | Male | Female |
| Healthcare Support | 0 (0.0%) | 0 (0.0%) |
| Security & Protection | 14 (100.0%) | 0 (0.0%) |
| Firefighting & Prevention | 14 (100.0%) | 0 (0.0%) |
| Law Enforcement | 0 (0.0%) | 0 (0.0%) |
| Food Preparation & Serving | 5 (100.0%) | 0 (0.0%) |
| Cleaning & Maintenance | 0 (0.0%) | 9 (100.0%) |
| Personal Care & Service | 0 (0.0%) | 0 (0.0%) |
| Total (Category) | 19 (67.9%) | 9 (32.1%) |
| Total (Overall) | 109 (62.3%) | 66 (37.7%) |
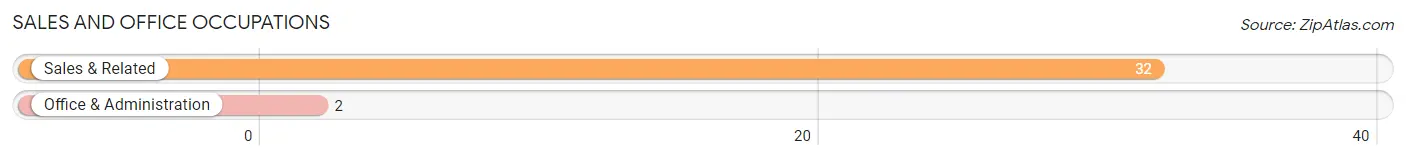
Sales and Office Occupations
The most common Sales and Office occupations in Stinesville are Sales & Related (32 | 18.3%), and Office & Administration (2 | 1.1%).
Sales and Office Occupations by Sex
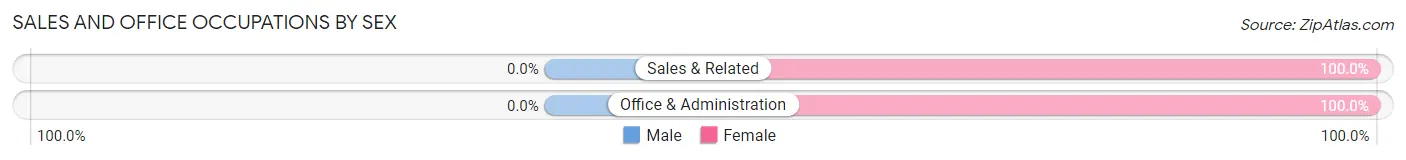
| Occupation | Male | Female |
| Sales & Related | 0 (0.0%) | 32 (100.0%) |
| Office & Administration | 0 (0.0%) | 2 (100.0%) |
| Total (Category) | 0 (0.0%) | 34 (100.0%) |
| Total (Overall) | 109 (62.3%) | 66 (37.7%) |
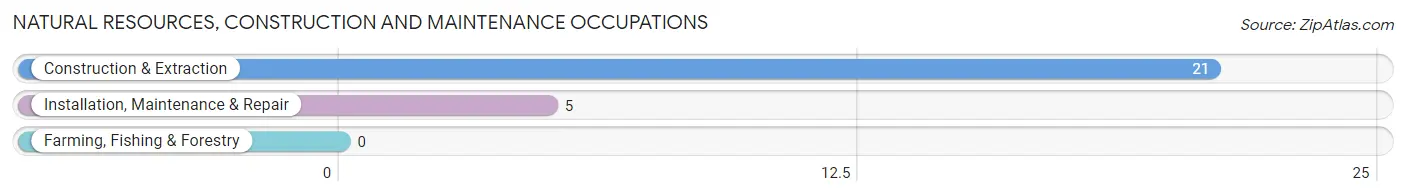
Natural Resources, Construction and Maintenance Occupations
The most common Natural Resources, Construction and Maintenance occupations in Stinesville are Construction & Extraction (21 | 12.0%), and Installation, Maintenance & Repair (5 | 2.9%).
Natural Resources, Construction and Maintenance Occupations by Sex
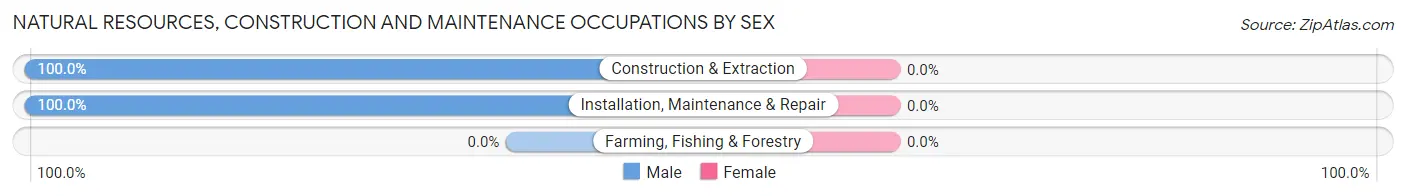
| Occupation | Male | Female |
| Farming, Fishing & Forestry | 0 (0.0%) | 0 (0.0%) |
| Construction & Extraction | 21 (100.0%) | 0 (0.0%) |
| Installation, Maintenance & Repair | 5 (100.0%) | 0 (0.0%) |
| Total (Category) | 26 (100.0%) | 0 (0.0%) |
| Total (Overall) | 109 (62.3%) | 66 (37.7%) |
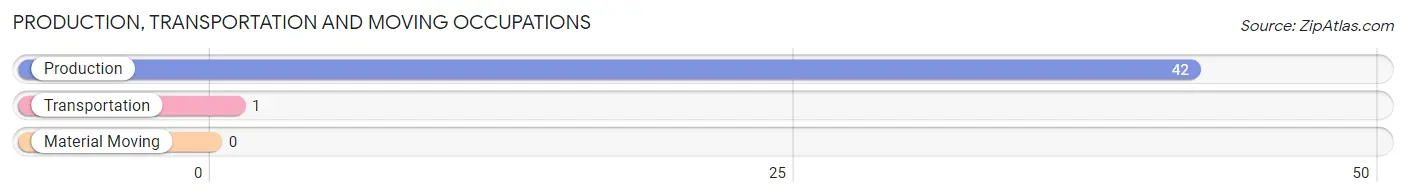
Production, Transportation and Moving Occupations
The most common Production, Transportation and Moving occupations in Stinesville are Production (42 | 24.0%), and Transportation (1 | 0.6%).
Production, Transportation and Moving Occupations by Sex
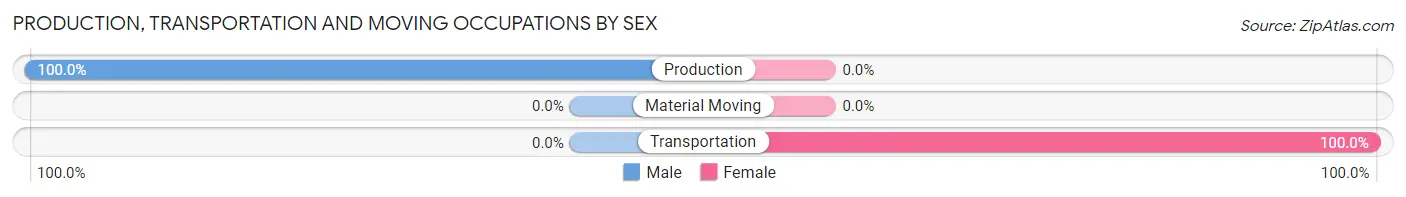
| Occupation | Male | Female |
| Production | 42 (100.0%) | 0 (0.0%) |
| Transportation | 0 (0.0%) | 1 (100.0%) |
| Material Moving | 0 (0.0%) | 0 (0.0%) |
| Total (Category) | 42 (97.7%) | 1 (2.3%) |
| Total (Overall) | 109 (62.3%) | 66 (37.7%) |
Employment Industries by Sex in Stinesville
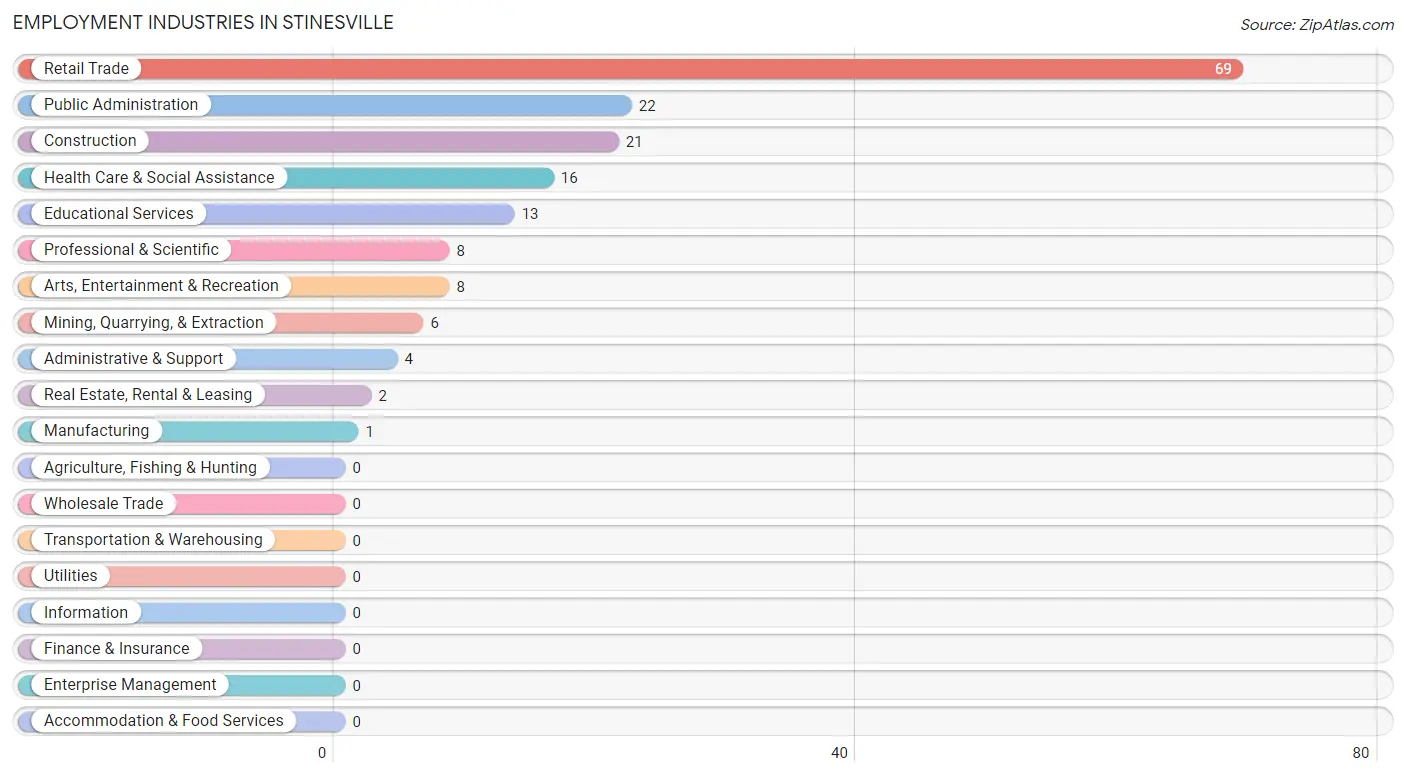
Employment Industries in Stinesville
The major employment industries in Stinesville include Retail Trade (69 | 39.4%), Public Administration (22 | 12.6%), Construction (21 | 12.0%), Health Care & Social Assistance (16 | 9.1%), and Educational Services (13 | 7.4%).
Employment Industries by Sex in Stinesville
The Stinesville industries that see more men than women are Mining, Quarrying, & Extraction (100.0%), Construction (100.0%), and Manufacturing (100.0%), whereas the industries that tend to have a higher number of women are Real Estate, Rental & Leasing (100.0%), Professional & Scientific (100.0%), and Administrative & Support (100.0%).
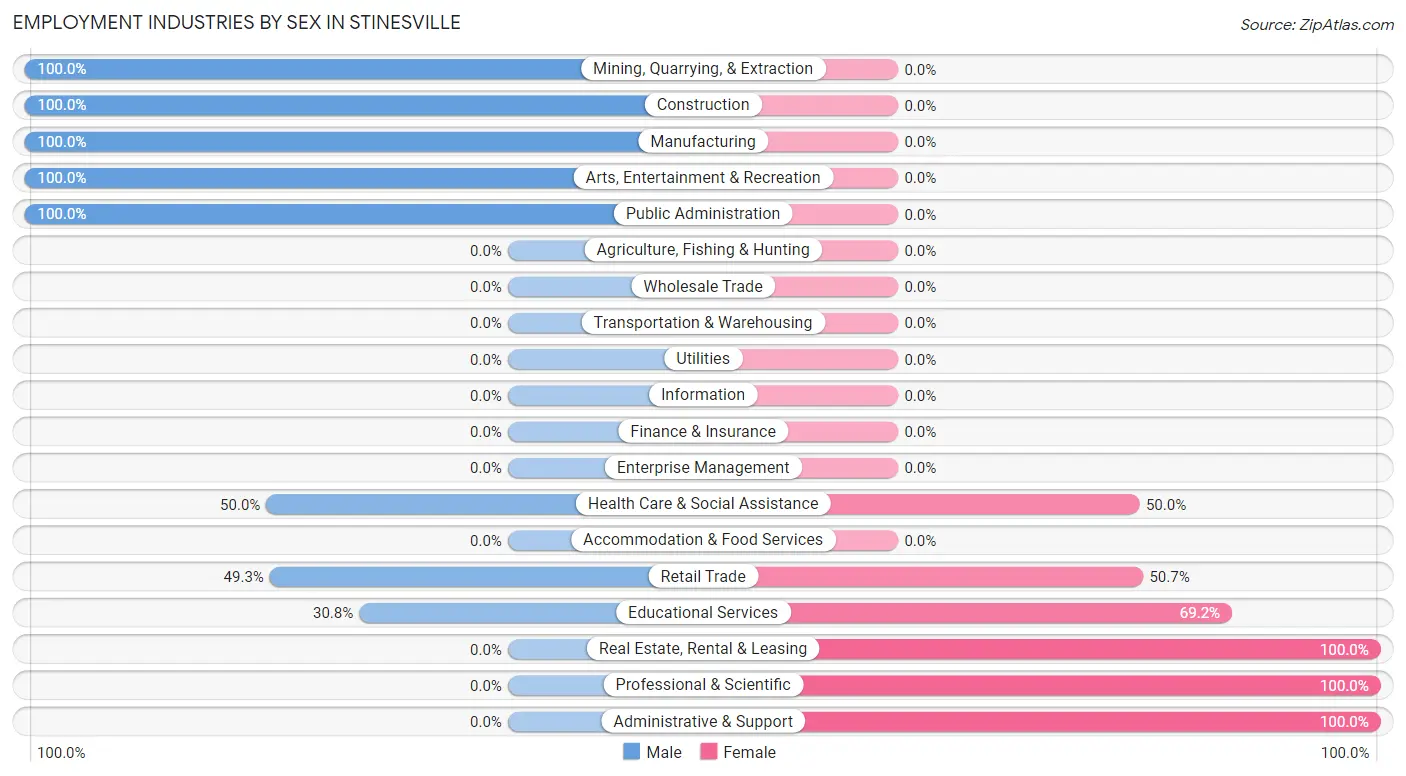
| Industry | Male | Female |
| Agriculture, Fishing & Hunting | 0 (0.0%) | 0 (0.0%) |
| Mining, Quarrying, & Extraction | 6 (100.0%) | 0 (0.0%) |
| Construction | 21 (100.0%) | 0 (0.0%) |
| Manufacturing | 1 (100.0%) | 0 (0.0%) |
| Wholesale Trade | 0 (0.0%) | 0 (0.0%) |
| Retail Trade | 34 (49.3%) | 35 (50.7%) |
| Transportation & Warehousing | 0 (0.0%) | 0 (0.0%) |
| Utilities | 0 (0.0%) | 0 (0.0%) |
| Information | 0 (0.0%) | 0 (0.0%) |
| Finance & Insurance | 0 (0.0%) | 0 (0.0%) |
| Real Estate, Rental & Leasing | 0 (0.0%) | 2 (100.0%) |
| Professional & Scientific | 0 (0.0%) | 8 (100.0%) |
| Enterprise Management | 0 (0.0%) | 0 (0.0%) |
| Administrative & Support | 0 (0.0%) | 4 (100.0%) |
| Educational Services | 4 (30.8%) | 9 (69.2%) |
| Health Care & Social Assistance | 8 (50.0%) | 8 (50.0%) |
| Arts, Entertainment & Recreation | 8 (100.0%) | 0 (0.0%) |
| Accommodation & Food Services | 0 (0.0%) | 0 (0.0%) |
| Public Administration | 22 (100.0%) | 0 (0.0%) |
| Total | 109 (62.3%) | 66 (37.7%) |
Education in Stinesville
School Enrollment in Stinesville
The most common levels of schooling among the 83 students in Stinesville are college / undergraduate (36 | 43.4%), middle school (27 | 32.5%), and elementary school (9 | 10.8%).
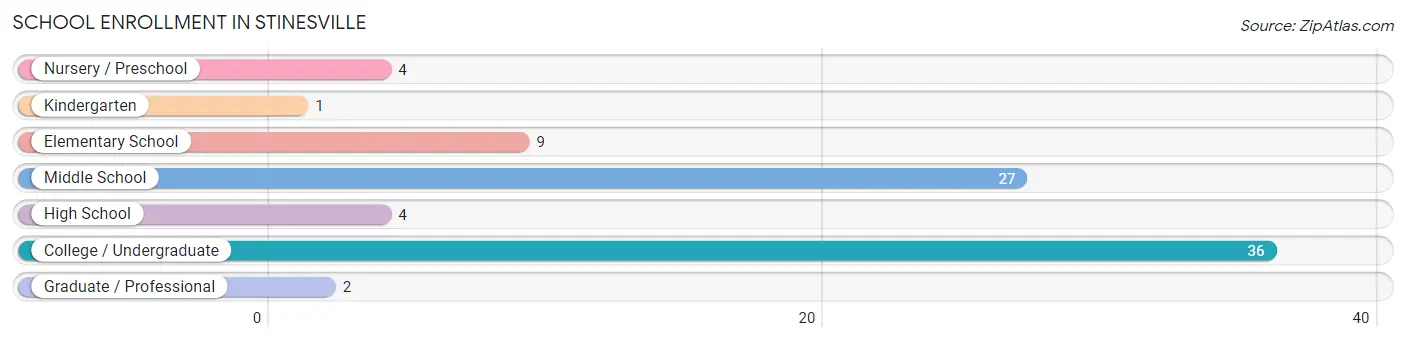
| School Level | # Students | % Students |
| Nursery / Preschool | 4 | 4.8% |
| Kindergarten | 1 | 1.2% |
| Elementary School | 9 | 10.8% |
| Middle School | 27 | 32.5% |
| High School | 4 | 4.8% |
| College / Undergraduate | 36 | 43.4% |
| Graduate / Professional | 2 | 2.4% |
| Total | 83 | 100.0% |
School Enrollment by Age by Funding Source in Stinesville
Out of a total of 83 students who are enrolled in schools in Stinesville, 4 (4.8%) attend a private institution, while the remaining 79 (95.2%) are enrolled in public schools. The age group of 3 to 4 year olds has the highest likelihood of being enrolled in private schools, with 4 (100.0% in the age bracket) enrolled. Conversely, the age group of 5 to 9 year old has the lowest likelihood of being enrolled in a private school, with 5 (100.0% in the age bracket) attending a public institution.
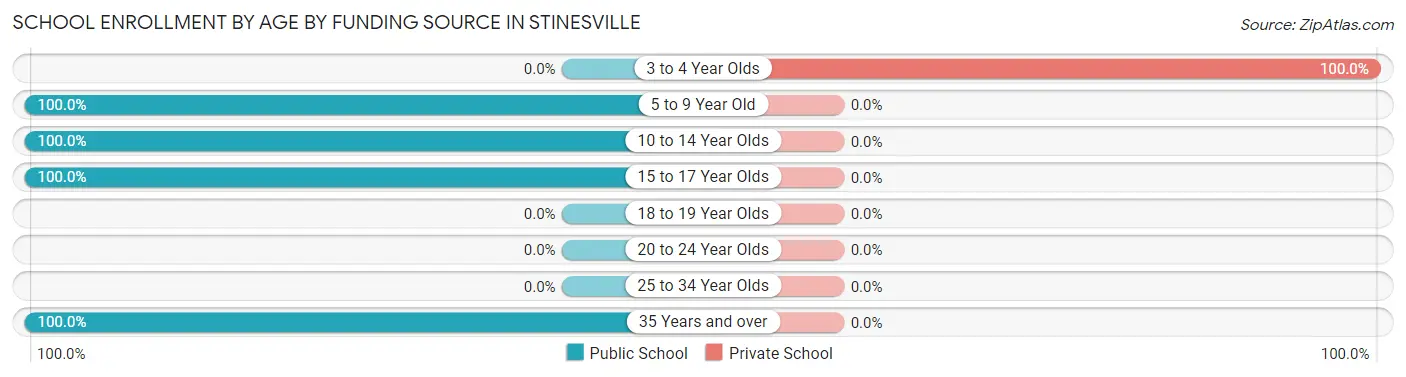
| Age Bracket | Public School | Private School |
| 3 to 4 Year Olds | 0 (0.0%) | 4 (100.0%) |
| 5 to 9 Year Old | 5 (100.0%) | 0 (0.0%) |
| 10 to 14 Year Olds | 32 (100.0%) | 0 (0.0%) |
| 15 to 17 Year Olds | 4 (100.0%) | 0 (0.0%) |
| 18 to 19 Year Olds | 0 (0.0%) | 0 (0.0%) |
| 20 to 24 Year Olds | 0 (0.0%) | 0 (0.0%) |
| 25 to 34 Year Olds | 0 (0.0%) | 0 (0.0%) |
| 35 Years and over | 38 (100.0%) | 0 (0.0%) |
| Total | 79 (95.2%) | 4 (4.8%) |
Educational Attainment by Field of Study in Stinesville
Social sciences (14 | 26.4%), arts & humanities (14 | 26.4%), science & technology (6 | 11.3%), visual & performing arts (6 | 11.3%), and bio, nature & agricultural (4 | 7.5%) are the most common fields of study among 53 individuals in Stinesville who have obtained a bachelor's degree or higher.
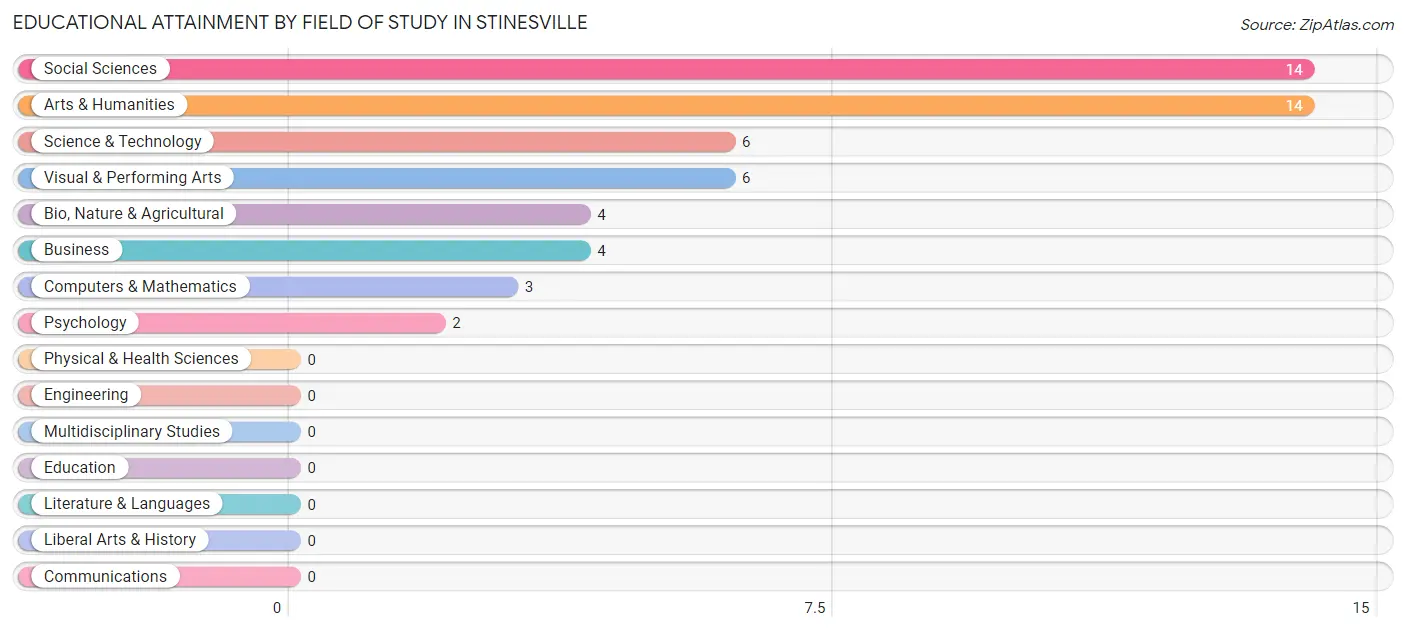
| Field of Study | # Graduates | % Graduates |
| Computers & Mathematics | 3 | 5.7% |
| Bio, Nature & Agricultural | 4 | 7.5% |
| Physical & Health Sciences | 0 | 0.0% |
| Psychology | 2 | 3.8% |
| Social Sciences | 14 | 26.4% |
| Engineering | 0 | 0.0% |
| Multidisciplinary Studies | 0 | 0.0% |
| Science & Technology | 6 | 11.3% |
| Business | 4 | 7.5% |
| Education | 0 | 0.0% |
| Literature & Languages | 0 | 0.0% |
| Liberal Arts & History | 0 | 0.0% |
| Visual & Performing Arts | 6 | 11.3% |
| Communications | 0 | 0.0% |
| Arts & Humanities | 14 | 26.4% |
| Total | 53 | 100.0% |
Transportation & Commute in Stinesville
Vehicle Availability by Sex in Stinesville
The most prevalent vehicle ownership categories in Stinesville are males with 2 vehicles (84, accounting for 81.6%) and females with 2 vehicles (45, making up 127.3%).
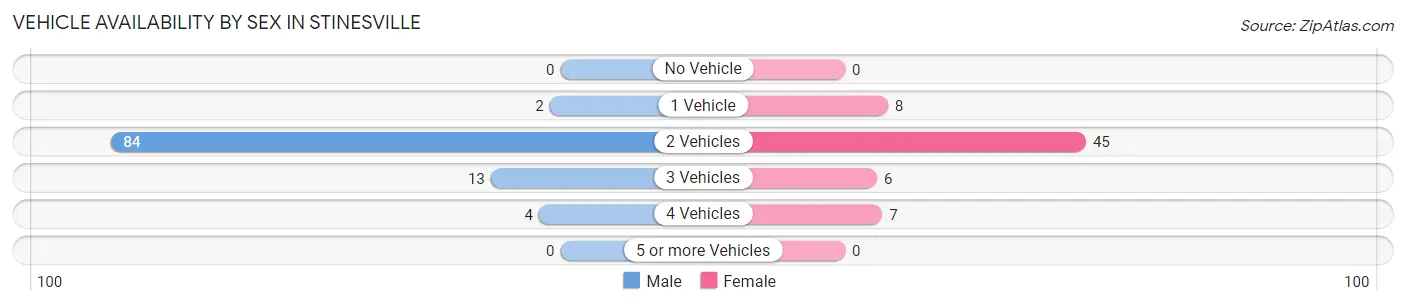
| Vehicles Available | Male | Female |
| No Vehicle | 0 (0.0%) | 0 (0.0%) |
| 1 Vehicle | 2 (1.9%) | 8 (12.1%) |
| 2 Vehicles | 84 (81.6%) | 45 (68.2%) |
| 3 Vehicles | 13 (12.6%) | 6 (9.1%) |
| 4 Vehicles | 4 (3.9%) | 7 (10.6%) |
| 5 or more Vehicles | 0 (0.0%) | 0 (0.0%) |
| Total | 103 (100.0%) | 66 (100.0%) |
Commute Time in Stinesville
The most frequently occuring commute durations in Stinesville are 30 to 34 minutes (81 commuters, 49.7%), 20 to 24 minutes (33 commuters, 20.3%), and 5 to 9 minutes (17 commuters, 10.4%).
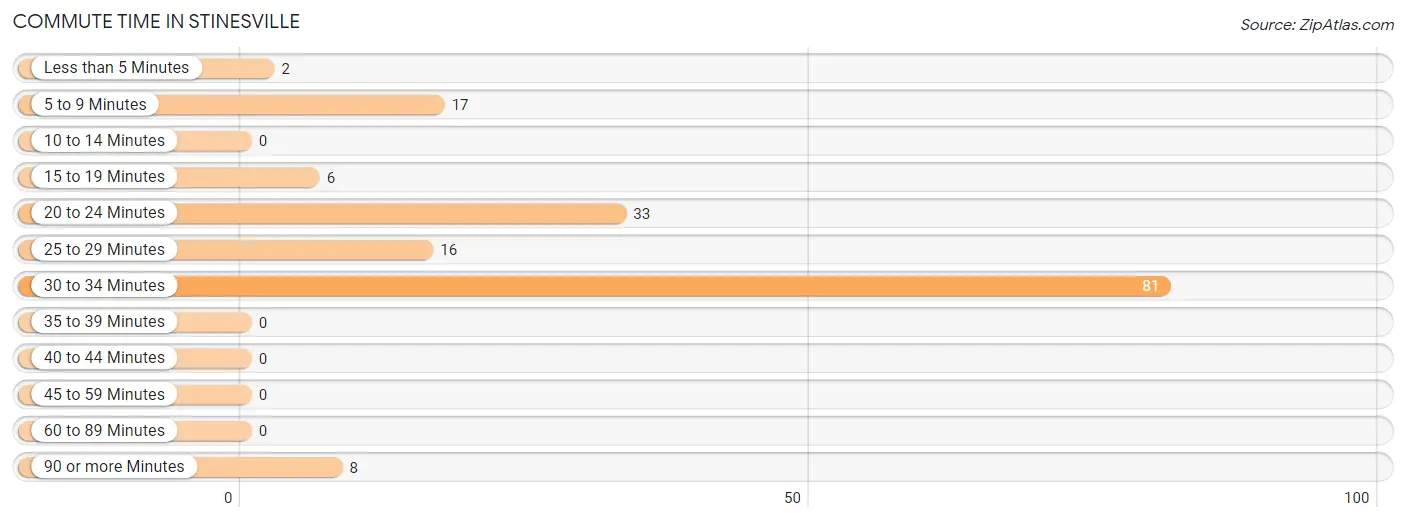
| Commute Time | # Commuters | % Commuters |
| Less than 5 Minutes | 2 | 1.2% |
| 5 to 9 Minutes | 17 | 10.4% |
| 10 to 14 Minutes | 0 | 0.0% |
| 15 to 19 Minutes | 6 | 3.7% |
| 20 to 24 Minutes | 33 | 20.3% |
| 25 to 29 Minutes | 16 | 9.8% |
| 30 to 34 Minutes | 81 | 49.7% |
| 35 to 39 Minutes | 0 | 0.0% |
| 40 to 44 Minutes | 0 | 0.0% |
| 45 to 59 Minutes | 0 | 0.0% |
| 60 to 89 Minutes | 0 | 0.0% |
| 90 or more Minutes | 8 | 4.9% |
Commute Time by Sex in Stinesville
The most common commute times in Stinesville are 30 to 34 minutes (63 commuters, 63.6%) for males and 20 to 24 minutes (32 commuters, 50.0%) for females.
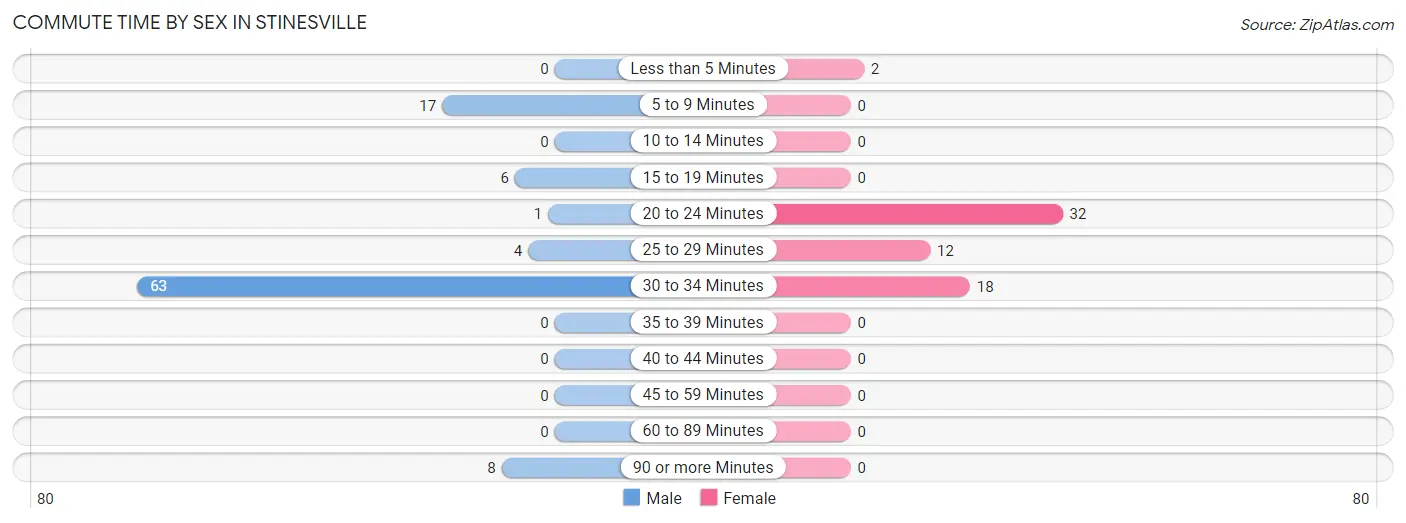
| Commute Time | Male | Female |
| Less than 5 Minutes | 0 (0.0%) | 2 (3.1%) |
| 5 to 9 Minutes | 17 (17.2%) | 0 (0.0%) |
| 10 to 14 Minutes | 0 (0.0%) | 0 (0.0%) |
| 15 to 19 Minutes | 6 (6.1%) | 0 (0.0%) |
| 20 to 24 Minutes | 1 (1.0%) | 32 (50.0%) |
| 25 to 29 Minutes | 4 (4.0%) | 12 (18.8%) |
| 30 to 34 Minutes | 63 (63.6%) | 18 (28.1%) |
| 35 to 39 Minutes | 0 (0.0%) | 0 (0.0%) |
| 40 to 44 Minutes | 0 (0.0%) | 0 (0.0%) |
| 45 to 59 Minutes | 0 (0.0%) | 0 (0.0%) |
| 60 to 89 Minutes | 0 (0.0%) | 0 (0.0%) |
| 90 or more Minutes | 8 (8.1%) | 0 (0.0%) |
Time of Departure to Work by Sex in Stinesville
The most frequent times of departure to work in Stinesville are 6:30 AM to 6:59 AM (61, 61.6%) for males and 9:00 AM to 9:59 AM (32, 50.0%) for females.
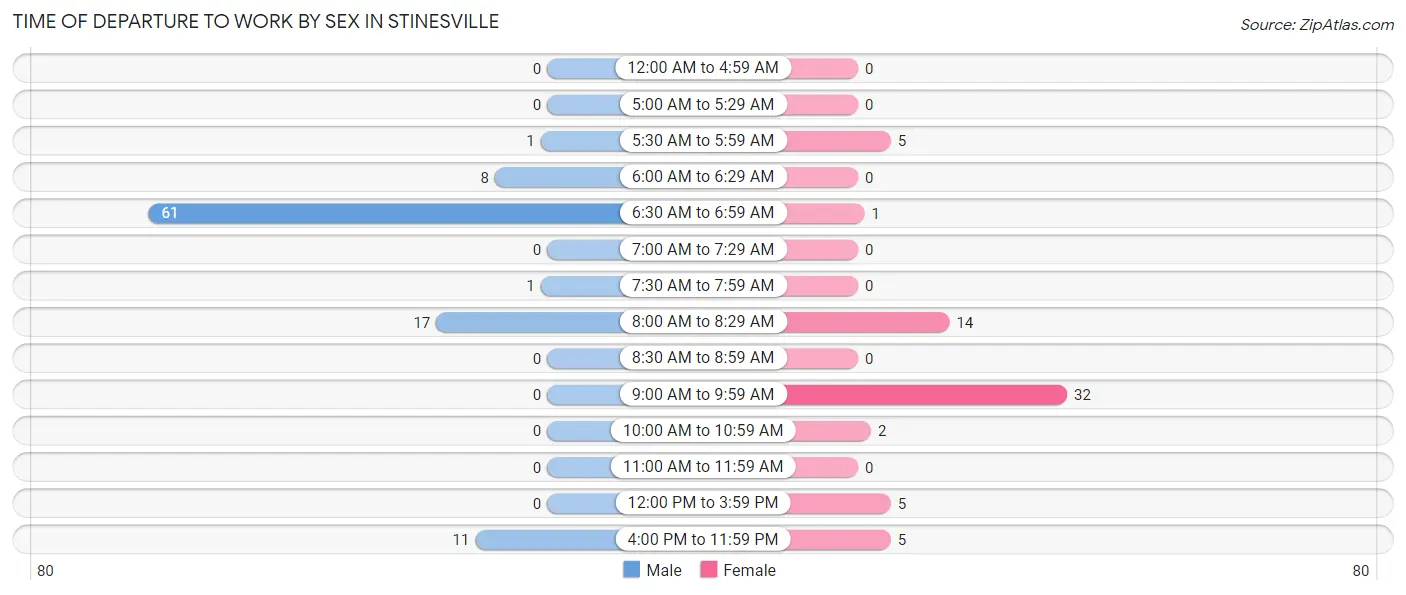
| Time of Departure | Male | Female |
| 12:00 AM to 4:59 AM | 0 (0.0%) | 0 (0.0%) |
| 5:00 AM to 5:29 AM | 0 (0.0%) | 0 (0.0%) |
| 5:30 AM to 5:59 AM | 1 (1.0%) | 5 (7.8%) |
| 6:00 AM to 6:29 AM | 8 (8.1%) | 0 (0.0%) |
| 6:30 AM to 6:59 AM | 61 (61.6%) | 1 (1.6%) |
| 7:00 AM to 7:29 AM | 0 (0.0%) | 0 (0.0%) |
| 7:30 AM to 7:59 AM | 1 (1.0%) | 0 (0.0%) |
| 8:00 AM to 8:29 AM | 17 (17.2%) | 14 (21.9%) |
| 8:30 AM to 8:59 AM | 0 (0.0%) | 0 (0.0%) |
| 9:00 AM to 9:59 AM | 0 (0.0%) | 32 (50.0%) |
| 10:00 AM to 10:59 AM | 0 (0.0%) | 2 (3.1%) |
| 11:00 AM to 11:59 AM | 0 (0.0%) | 0 (0.0%) |
| 12:00 PM to 3:59 PM | 0 (0.0%) | 5 (7.8%) |
| 4:00 PM to 11:59 PM | 11 (11.1%) | 5 (7.8%) |
| Total | 99 (100.0%) | 64 (100.0%) |
Housing Occupancy in Stinesville
Occupancy by Ownership in Stinesville
Of the total 170 dwellings in Stinesville, owner-occupied units account for 103 (60.6%), while renter-occupied units make up 67 (39.4%).
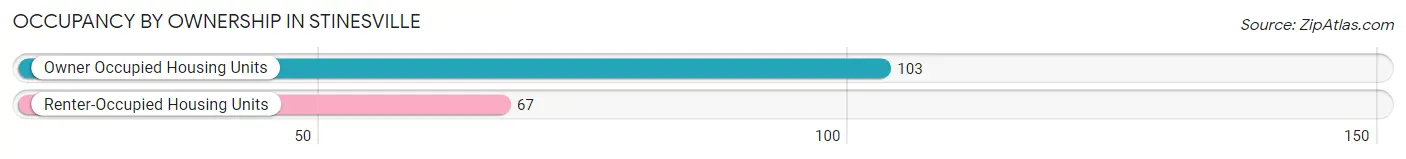
| Occupancy | # Housing Units | % Housing Units |
| Owner Occupied Housing Units | 103 | 60.6% |
| Renter-Occupied Housing Units | 67 | 39.4% |
| Total Occupied Housing Units | 170 | 100.0% |
Occupancy by Household Size in Stinesville
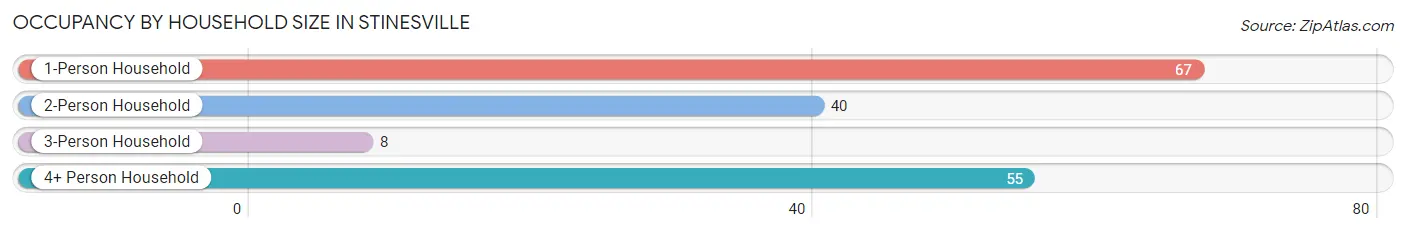
| Household Size | # Housing Units | % Housing Units |
| 1-Person Household | 67 | 39.4% |
| 2-Person Household | 40 | 23.5% |
| 3-Person Household | 8 | 4.7% |
| 4+ Person Household | 55 | 32.4% |
| Total Housing Units | 170 | 100.0% |
Occupancy by Ownership by Household Size in Stinesville
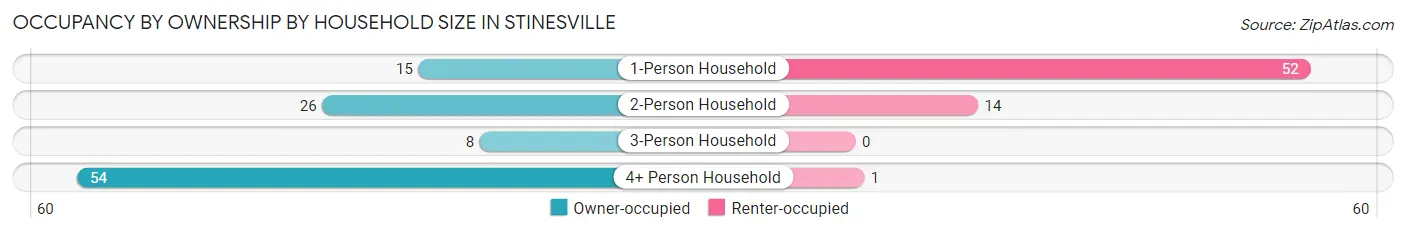
| Household Size | Owner-occupied | Renter-occupied |
| 1-Person Household | 15 (22.4%) | 52 (77.6%) |
| 2-Person Household | 26 (65.0%) | 14 (35.0%) |
| 3-Person Household | 8 (100.0%) | 0 (0.0%) |
| 4+ Person Household | 54 (98.2%) | 1 (1.8%) |
| Total Housing Units | 103 (60.6%) | 67 (39.4%) |
Occupancy by Educational Attainment in Stinesville
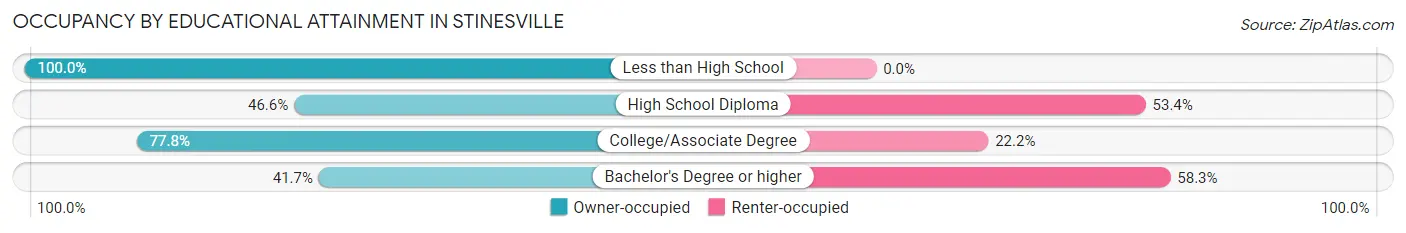
| Household Size | Owner-occupied | Renter-occupied |
| Less than High School | 10 (100.0%) | 0 (0.0%) |
| High School Diploma | 34 (46.6%) | 39 (53.4%) |
| College/Associate Degree | 49 (77.8%) | 14 (22.2%) |
| Bachelor's Degree or higher | 10 (41.7%) | 14 (58.3%) |
Occupancy by Age of Householder in Stinesville
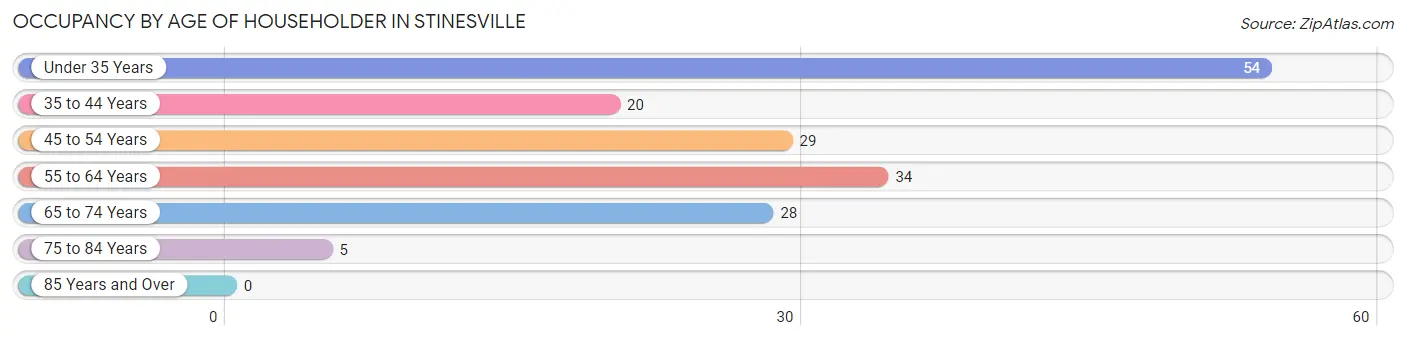
| Age Bracket | # Households | % Households |
| Under 35 Years | 54 | 31.8% |
| 35 to 44 Years | 20 | 11.8% |
| 45 to 54 Years | 29 | 17.1% |
| 55 to 64 Years | 34 | 20.0% |
| 65 to 74 Years | 28 | 16.5% |
| 75 to 84 Years | 5 | 2.9% |
| 85 Years and Over | 0 | 0.0% |
| Total | 170 | 100.0% |
Housing Finances in Stinesville
Median Income by Occupancy in Stinesville
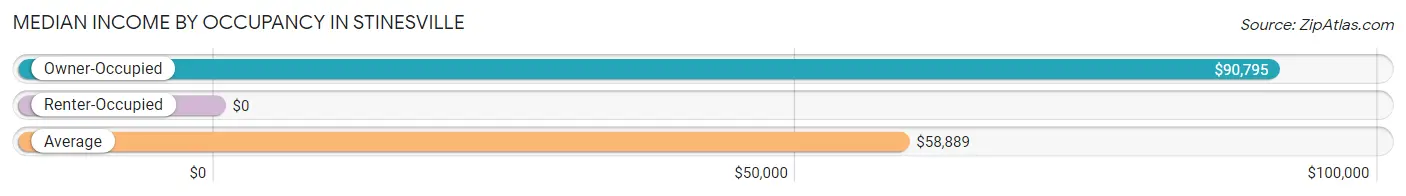
| Occupancy Type | # Households | Median Income |
| Owner-Occupied | 103 (60.6%) | $90,795 |
| Renter-Occupied | 67 (39.4%) | $0 |
| Average | 170 (100.0%) | $58,889 |
Occupancy by Householder Income Bracket in Stinesville
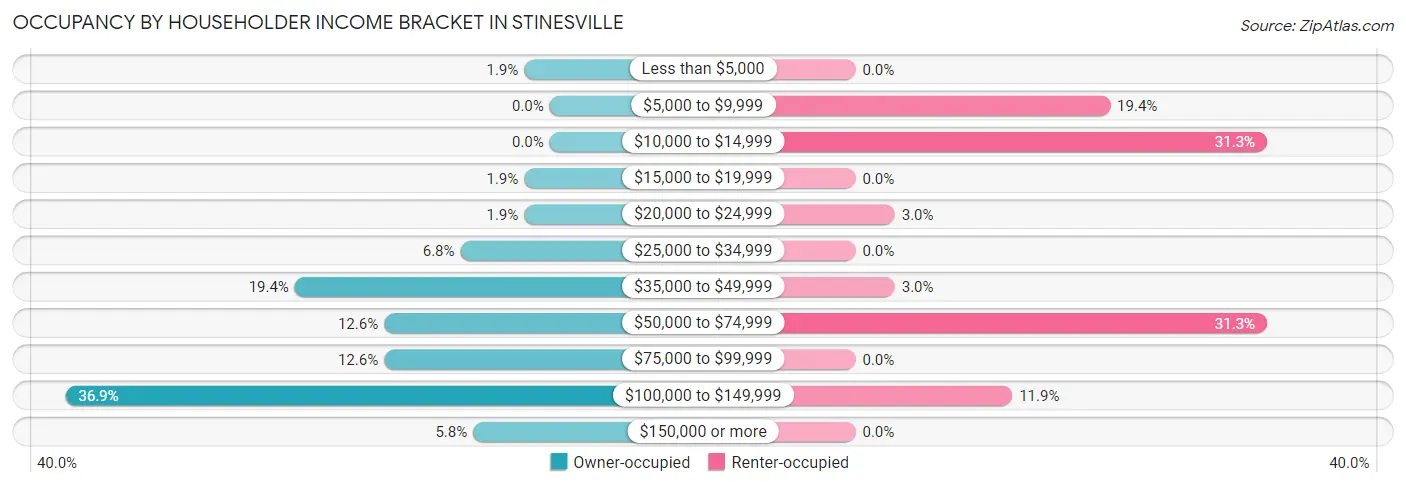
| Income Bracket | Owner-occupied | Renter-occupied |
| Less than $5,000 | 2 (1.9%) | 0 (0.0%) |
| $5,000 to $9,999 | 0 (0.0%) | 13 (19.4%) |
| $10,000 to $14,999 | 0 (0.0%) | 21 (31.3%) |
| $15,000 to $19,999 | 2 (1.9%) | 0 (0.0%) |
| $20,000 to $24,999 | 2 (1.9%) | 2 (3.0%) |
| $25,000 to $34,999 | 7 (6.8%) | 0 (0.0%) |
| $35,000 to $49,999 | 20 (19.4%) | 2 (3.0%) |
| $50,000 to $74,999 | 13 (12.6%) | 21 (31.3%) |
| $75,000 to $99,999 | 13 (12.6%) | 0 (0.0%) |
| $100,000 to $149,999 | 38 (36.9%) | 8 (11.9%) |
| $150,000 or more | 6 (5.8%) | 0 (0.0%) |
| Total | 103 (100.0%) | 67 (100.0%) |
Monthly Housing Cost Tiers in Stinesville
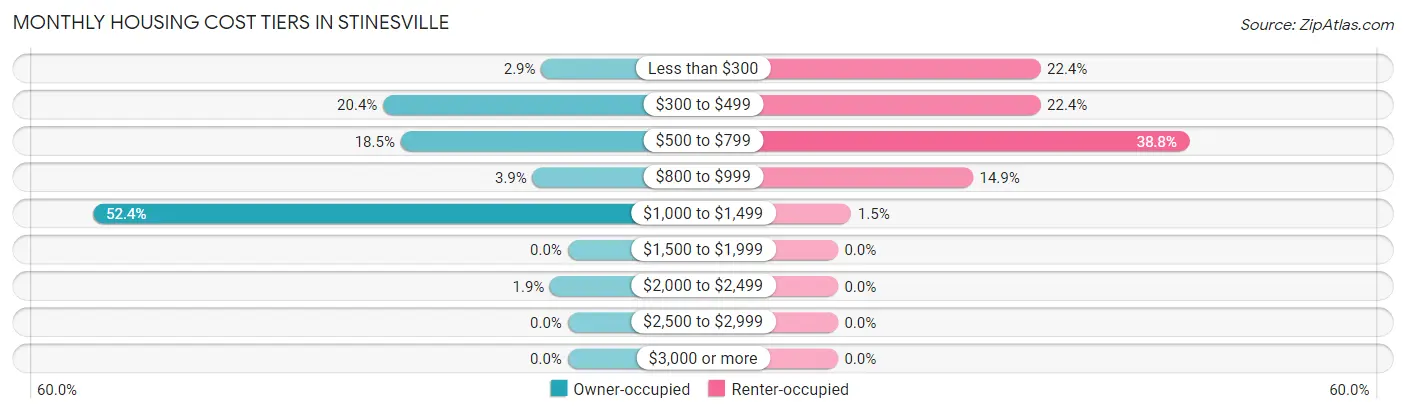
| Monthly Cost | Owner-occupied | Renter-occupied |
| Less than $300 | 3 (2.9%) | 15 (22.4%) |
| $300 to $499 | 21 (20.4%) | 15 (22.4%) |
| $500 to $799 | 19 (18.4%) | 26 (38.8%) |
| $800 to $999 | 4 (3.9%) | 10 (14.9%) |
| $1,000 to $1,499 | 54 (52.4%) | 1 (1.5%) |
| $1,500 to $1,999 | 0 (0.0%) | 0 (0.0%) |
| $2,000 to $2,499 | 2 (1.9%) | 0 (0.0%) |
| $2,500 to $2,999 | 0 (0.0%) | 0 (0.0%) |
| $3,000 or more | 0 (0.0%) | 0 (0.0%) |
| Total | 103 (100.0%) | 67 (100.0%) |
Physical Housing Characteristics in Stinesville
Housing Structures in Stinesville
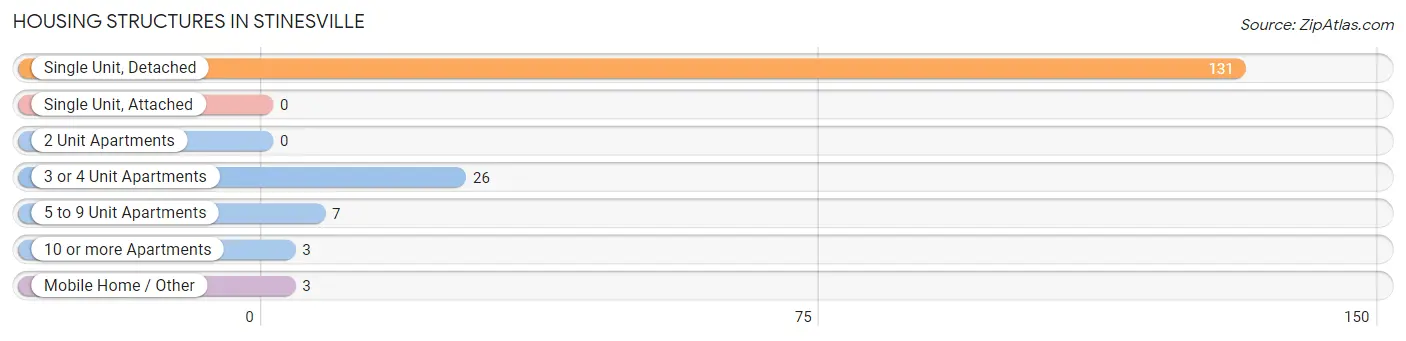
| Structure Type | # Housing Units | % Housing Units |
| Single Unit, Detached | 131 | 77.1% |
| Single Unit, Attached | 0 | 0.0% |
| 2 Unit Apartments | 0 | 0.0% |
| 3 or 4 Unit Apartments | 26 | 15.3% |
| 5 to 9 Unit Apartments | 7 | 4.1% |
| 10 or more Apartments | 3 | 1.8% |
| Mobile Home / Other | 3 | 1.8% |
| Total | 170 | 100.0% |
Housing Structures by Occupancy in Stinesville
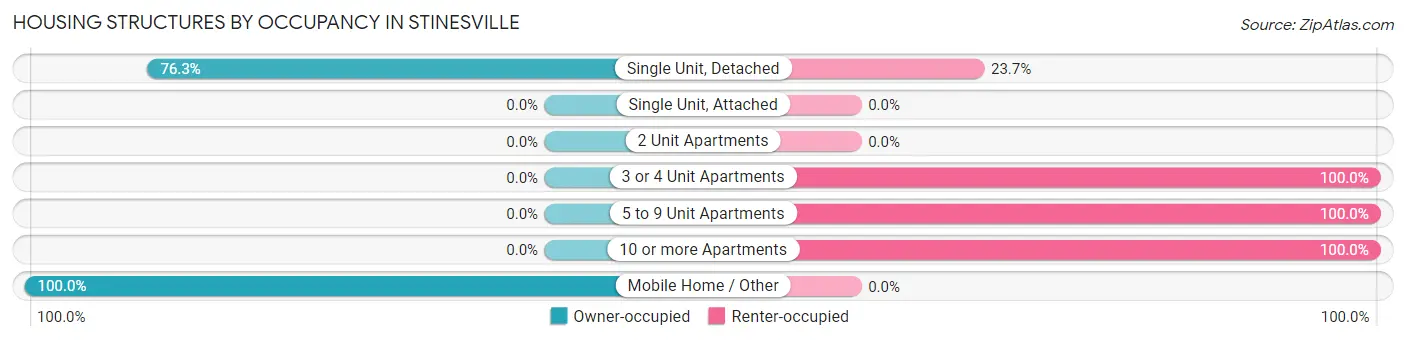
| Structure Type | Owner-occupied | Renter-occupied |
| Single Unit, Detached | 100 (76.3%) | 31 (23.7%) |
| Single Unit, Attached | 0 (0.0%) | 0 (0.0%) |
| 2 Unit Apartments | 0 (0.0%) | 0 (0.0%) |
| 3 or 4 Unit Apartments | 0 (0.0%) | 26 (100.0%) |
| 5 to 9 Unit Apartments | 0 (0.0%) | 7 (100.0%) |
| 10 or more Apartments | 0 (0.0%) | 3 (100.0%) |
| Mobile Home / Other | 3 (100.0%) | 0 (0.0%) |
| Total | 103 (60.6%) | 67 (39.4%) |
Housing Structures by Number of Rooms in Stinesville
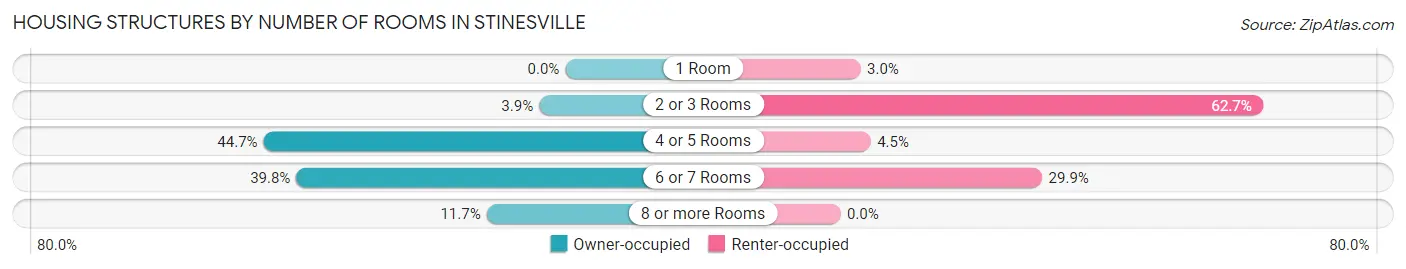
| Number of Rooms | Owner-occupied | Renter-occupied |
| 1 Room | 0 (0.0%) | 2 (3.0%) |
| 2 or 3 Rooms | 4 (3.9%) | 42 (62.7%) |
| 4 or 5 Rooms | 46 (44.7%) | 3 (4.5%) |
| 6 or 7 Rooms | 41 (39.8%) | 20 (29.8%) |
| 8 or more Rooms | 12 (11.7%) | 0 (0.0%) |
| Total | 103 (100.0%) | 67 (100.0%) |
Housing Structure by Heating Type in Stinesville
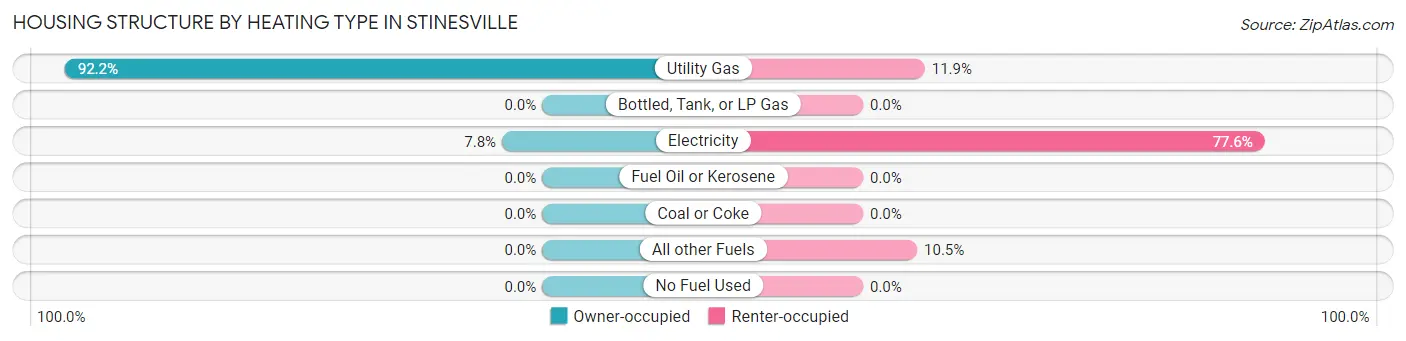
| Heating Type | Owner-occupied | Renter-occupied |
| Utility Gas | 95 (92.2%) | 8 (11.9%) |
| Bottled, Tank, or LP Gas | 0 (0.0%) | 0 (0.0%) |
| Electricity | 8 (7.8%) | 52 (77.6%) |
| Fuel Oil or Kerosene | 0 (0.0%) | 0 (0.0%) |
| Coal or Coke | 0 (0.0%) | 0 (0.0%) |
| All other Fuels | 0 (0.0%) | 7 (10.4%) |
| No Fuel Used | 0 (0.0%) | 0 (0.0%) |
| Total | 103 (100.0%) | 67 (100.0%) |
Household Vehicle Usage in Stinesville
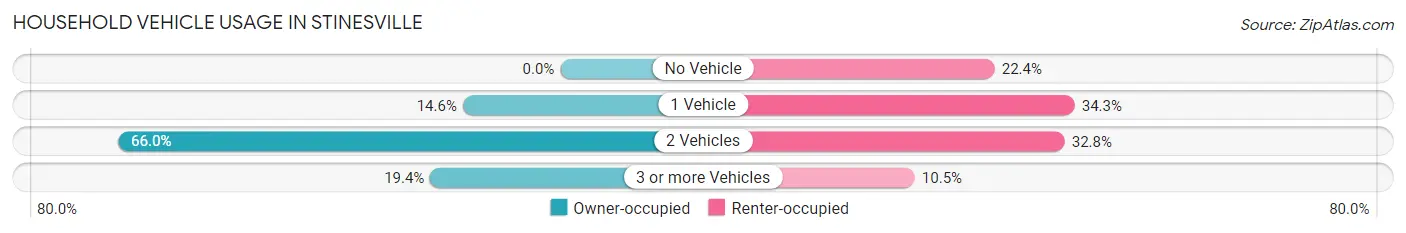
| Vehicles per Household | Owner-occupied | Renter-occupied |
| No Vehicle | 0 (0.0%) | 15 (22.4%) |
| 1 Vehicle | 15 (14.6%) | 23 (34.3%) |
| 2 Vehicles | 68 (66.0%) | 22 (32.8%) |
| 3 or more Vehicles | 20 (19.4%) | 7 (10.4%) |
| Total | 103 (100.0%) | 67 (100.0%) |
Real Estate & Mortgages in Stinesville
Real Estate and Mortgage Overview in Stinesville
| Characteristic | Without Mortgage | With Mortgage |
| Housing Units | 28 | 75 |
| Median Property Value | $92,900 | $129,100 |
| Median Household Income | $45,313 | $6 |
| Monthly Housing Costs | $433 | $0 |
| Real Estate Taxes | $600 | $0 |
Property Value by Mortgage Status in Stinesville
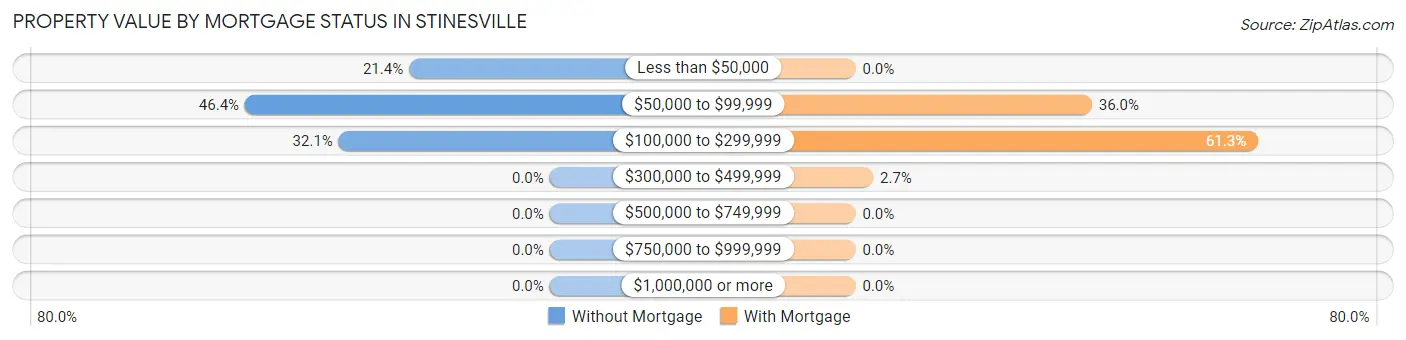
| Property Value | Without Mortgage | With Mortgage |
| Less than $50,000 | 6 (21.4%) | 0 (0.0%) |
| $50,000 to $99,999 | 13 (46.4%) | 27 (36.0%) |
| $100,000 to $299,999 | 9 (32.1%) | 46 (61.3%) |
| $300,000 to $499,999 | 0 (0.0%) | 2 (2.7%) |
| $500,000 to $749,999 | 0 (0.0%) | 0 (0.0%) |
| $750,000 to $999,999 | 0 (0.0%) | 0 (0.0%) |
| $1,000,000 or more | 0 (0.0%) | 0 (0.0%) |
| Total | 28 (100.0%) | 75 (100.0%) |
Household Income by Mortgage Status in Stinesville
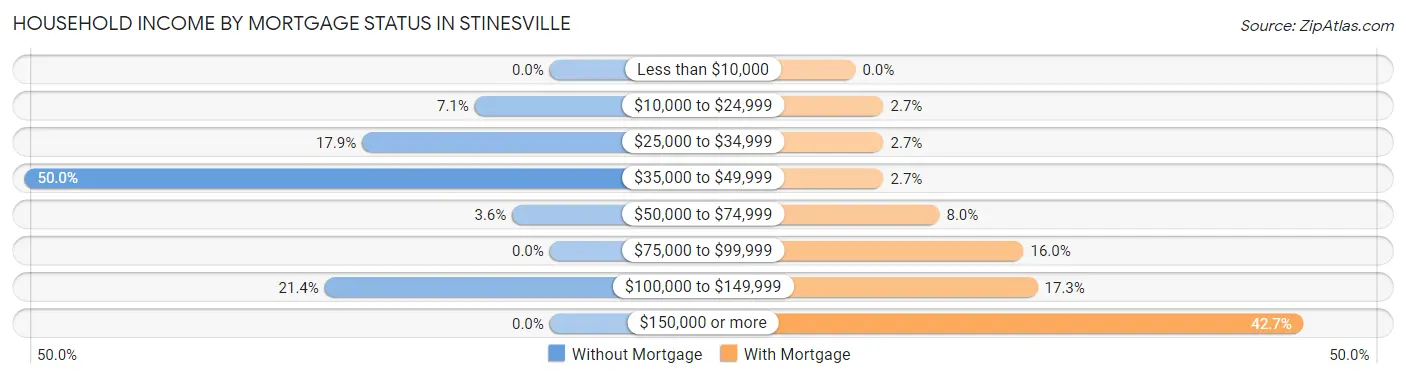
| Household Income | Without Mortgage | With Mortgage |
| Less than $10,000 | 0 (0.0%) | 0 (0.0%) |
| $10,000 to $24,999 | 2 (7.1%) | 2 (2.7%) |
| $25,000 to $34,999 | 5 (17.9%) | 2 (2.7%) |
| $35,000 to $49,999 | 14 (50.0%) | 2 (2.7%) |
| $50,000 to $74,999 | 1 (3.6%) | 6 (8.0%) |
| $75,000 to $99,999 | 0 (0.0%) | 12 (16.0%) |
| $100,000 to $149,999 | 6 (21.4%) | 13 (17.3%) |
| $150,000 or more | 0 (0.0%) | 32 (42.7%) |
| Total | 28 (100.0%) | 75 (100.0%) |
Property Value to Household Income Ratio in Stinesville
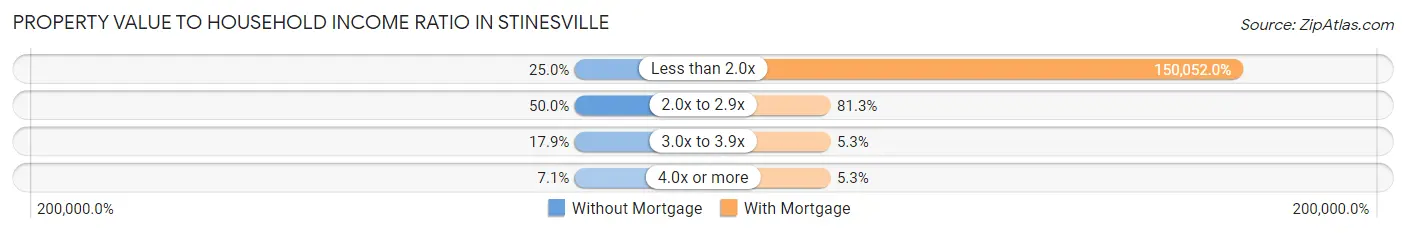
| Value-to-Income Ratio | Without Mortgage | With Mortgage |
| Less than 2.0x | 7 (25.0%) | 112,539 (150,052.0%) |
| 2.0x to 2.9x | 14 (50.0%) | 61 (81.3%) |
| 3.0x to 3.9x | 5 (17.9%) | 4 (5.3%) |
| 4.0x or more | 2 (7.1%) | 4 (5.3%) |
| Total | 28 (100.0%) | 75 (100.0%) |
Real Estate Taxes by Mortgage Status in Stinesville
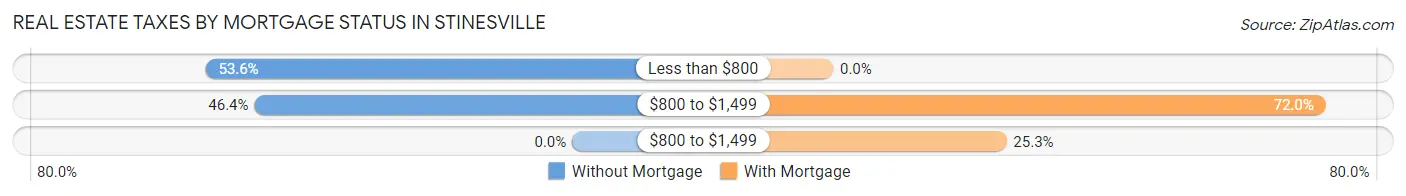
| Property Taxes | Without Mortgage | With Mortgage |
| Less than $800 | 15 (53.6%) | 0 (0.0%) |
| $800 to $1,499 | 13 (46.4%) | 54 (72.0%) |
| $800 to $1,499 | 0 (0.0%) | 19 (25.3%) |
| Total | 28 (100.0%) | 75 (100.0%) |
Health & Disability in Stinesville
Health Insurance Coverage by Age in Stinesville
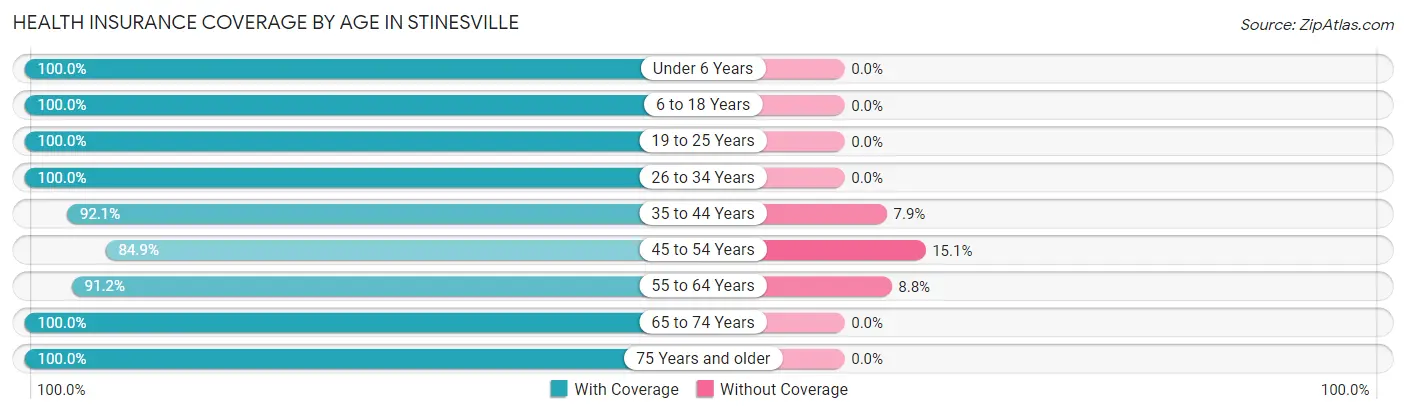
| Age Bracket | With Coverage | Without Coverage |
| Under 6 Years | 8 (100.0%) | 0 (0.0%) |
| 6 to 18 Years | 48 (100.0%) | 0 (0.0%) |
| 19 to 25 Years | 8 (100.0%) | 0 (0.0%) |
| 26 to 34 Years | 62 (100.0%) | 0 (0.0%) |
| 35 to 44 Years | 70 (92.1%) | 6 (7.9%) |
| 45 to 54 Years | 45 (84.9%) | 8 (15.1%) |
| 55 to 64 Years | 52 (91.2%) | 5 (8.8%) |
| 65 to 74 Years | 30 (100.0%) | 0 (0.0%) |
| 75 Years and older | 8 (100.0%) | 0 (0.0%) |
| Total | 331 (94.6%) | 19 (5.4%) |
Health Insurance Coverage by Citizenship Status in Stinesville
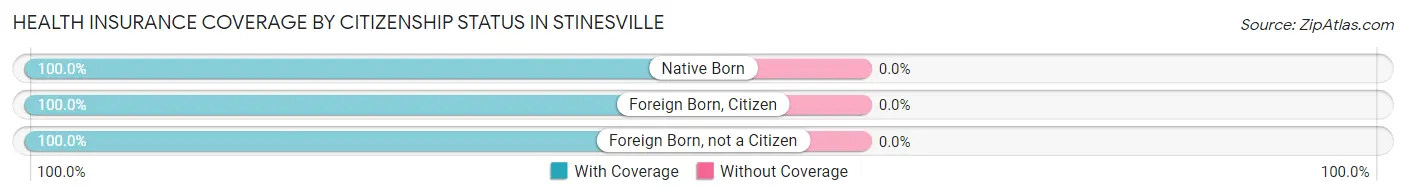
| Citizenship Status | With Coverage | Without Coverage |
| Native Born | 8 (100.0%) | 0 (0.0%) |
| Foreign Born, Citizen | 48 (100.0%) | 0 (0.0%) |
| Foreign Born, not a Citizen | 8 (100.0%) | 0 (0.0%) |
Health Insurance Coverage by Household Income in Stinesville
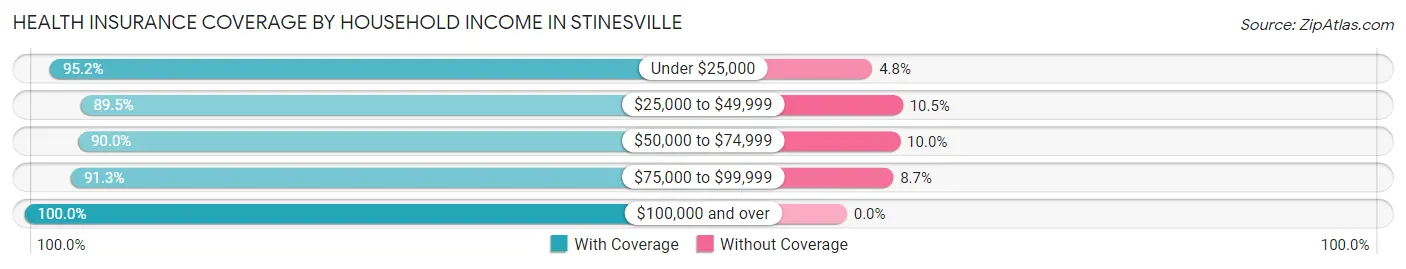
| Household Income | With Coverage | Without Coverage |
| Under $25,000 | 40 (95.2%) | 2 (4.8%) |
| $25,000 to $49,999 | 77 (89.5%) | 9 (10.5%) |
| $50,000 to $74,999 | 54 (90.0%) | 6 (10.0%) |
| $75,000 to $99,999 | 21 (91.3%) | 2 (8.7%) |
| $100,000 and over | 139 (100.0%) | 0 (0.0%) |
Public vs Private Health Insurance Coverage by Age in Stinesville
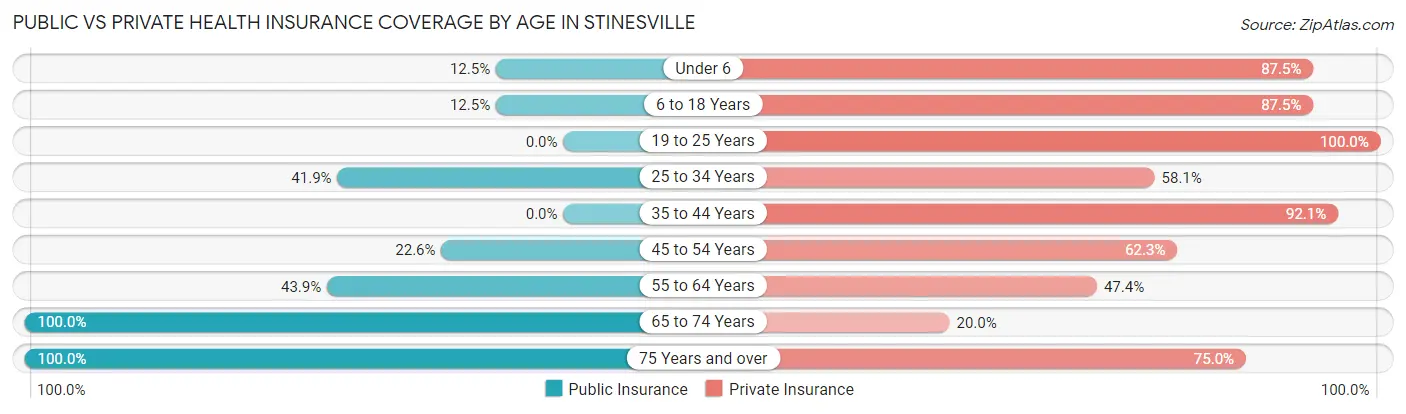
| Age Bracket | Public Insurance | Private Insurance |
| Under 6 | 1 (12.5%) | 7 (87.5%) |
| 6 to 18 Years | 6 (12.5%) | 42 (87.5%) |
| 19 to 25 Years | 0 (0.0%) | 8 (100.0%) |
| 25 to 34 Years | 26 (41.9%) | 36 (58.1%) |
| 35 to 44 Years | 0 (0.0%) | 70 (92.1%) |
| 45 to 54 Years | 12 (22.6%) | 33 (62.3%) |
| 55 to 64 Years | 25 (43.9%) | 27 (47.4%) |
| 65 to 74 Years | 30 (100.0%) | 6 (20.0%) |
| 75 Years and over | 8 (100.0%) | 6 (75.0%) |
| Total | 108 (30.9%) | 235 (67.1%) |
Disability Status by Sex by Age in Stinesville
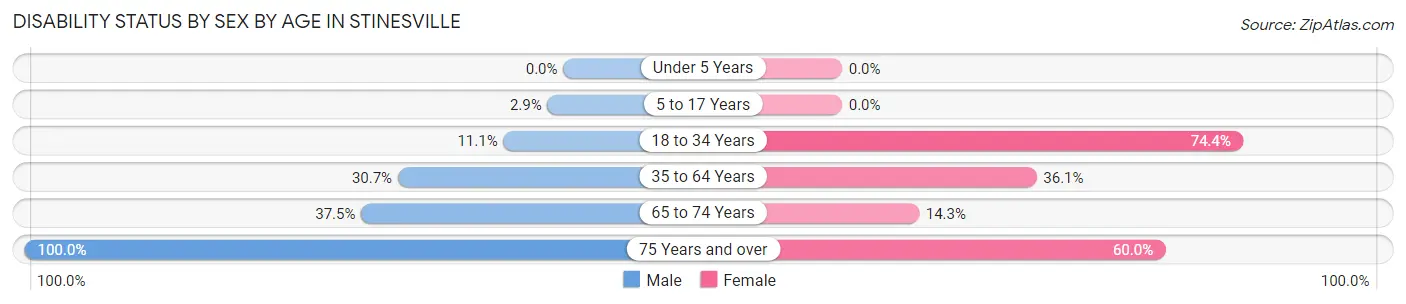
| Age Bracket | Male | Female |
| Under 5 Years | 0 (0.0%) | 0 (0.0%) |
| 5 to 17 Years | 1 (2.9%) | 0 (0.0%) |
| 18 to 34 Years | 3 (11.1%) | 32 (74.4%) |
| 35 to 64 Years | 35 (30.7%) | 26 (36.1%) |
| 65 to 74 Years | 6 (37.5%) | 2 (14.3%) |
| 75 Years and over | 3 (100.0%) | 3 (60.0%) |
Disability Class by Sex by Age in Stinesville
Disability Class: Hearing Difficulty
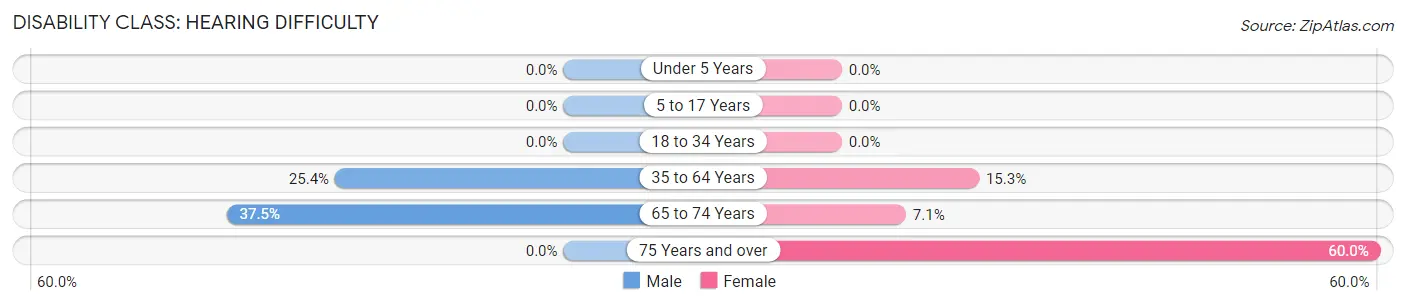
| Age Bracket | Male | Female |
| Under 5 Years | 0 (0.0%) | 0 (0.0%) |
| 5 to 17 Years | 0 (0.0%) | 0 (0.0%) |
| 18 to 34 Years | 0 (0.0%) | 0 (0.0%) |
| 35 to 64 Years | 29 (25.4%) | 11 (15.3%) |
| 65 to 74 Years | 6 (37.5%) | 1 (7.1%) |
| 75 Years and over | 0 (0.0%) | 3 (60.0%) |
Disability Class: Vision Difficulty
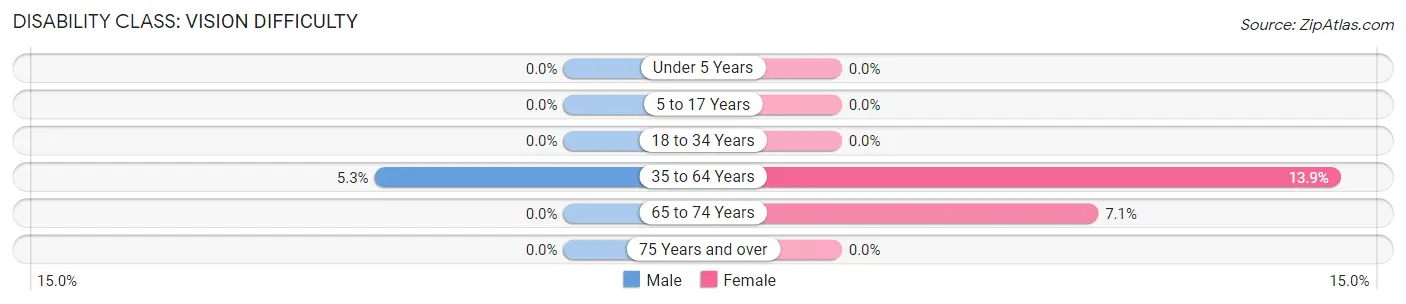
| Age Bracket | Male | Female |
| Under 5 Years | 0 (0.0%) | 0 (0.0%) |
| 5 to 17 Years | 0 (0.0%) | 0 (0.0%) |
| 18 to 34 Years | 0 (0.0%) | 0 (0.0%) |
| 35 to 64 Years | 6 (5.3%) | 10 (13.9%) |
| 65 to 74 Years | 0 (0.0%) | 1 (7.1%) |
| 75 Years and over | 0 (0.0%) | 0 (0.0%) |
Disability Class: Cognitive Difficulty
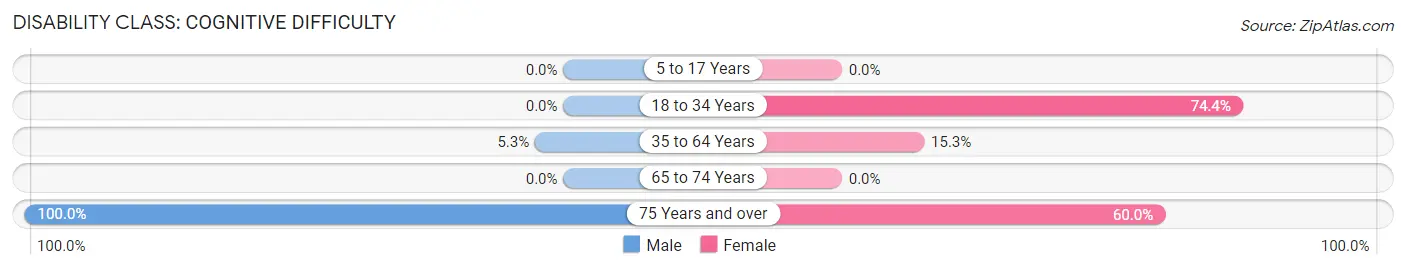
| Age Bracket | Male | Female |
| 5 to 17 Years | 0 (0.0%) | 0 (0.0%) |
| 18 to 34 Years | 0 (0.0%) | 32 (74.4%) |
| 35 to 64 Years | 6 (5.3%) | 11 (15.3%) |
| 65 to 74 Years | 0 (0.0%) | 0 (0.0%) |
| 75 Years and over | 3 (100.0%) | 3 (60.0%) |
Disability Class: Ambulatory Difficulty
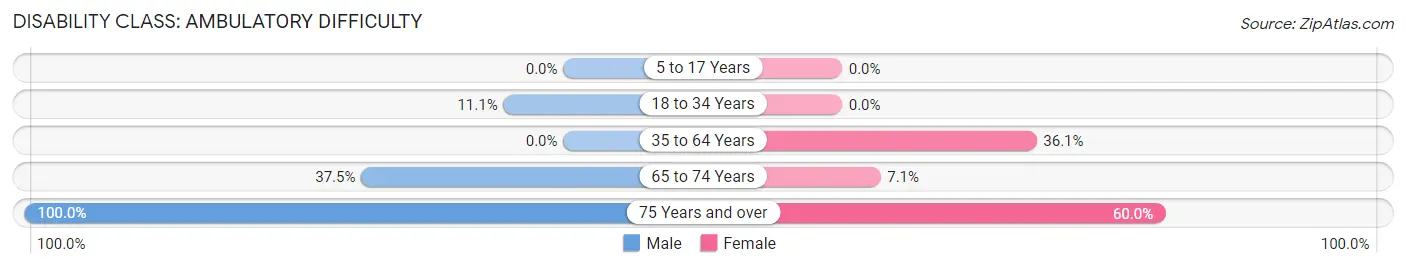
| Age Bracket | Male | Female |
| 5 to 17 Years | 0 (0.0%) | 0 (0.0%) |
| 18 to 34 Years | 3 (11.1%) | 0 (0.0%) |
| 35 to 64 Years | 0 (0.0%) | 26 (36.1%) |
| 65 to 74 Years | 6 (37.5%) | 1 (7.1%) |
| 75 Years and over | 3 (100.0%) | 3 (60.0%) |
Disability Class: Self-Care Difficulty
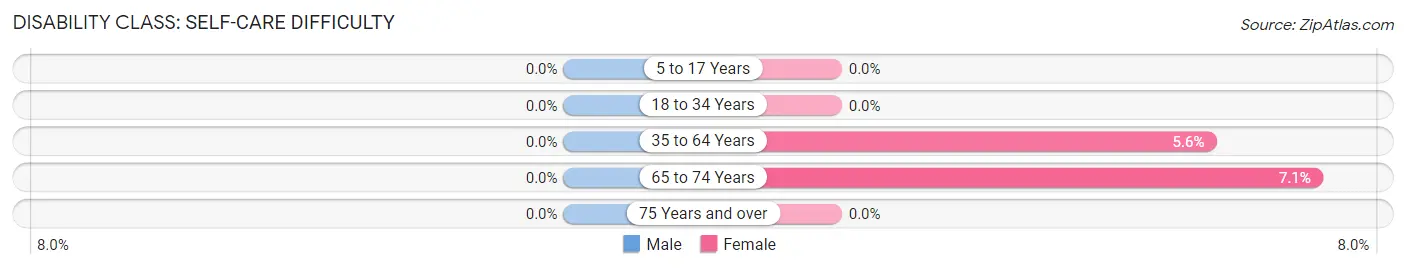
| Age Bracket | Male | Female |
| 5 to 17 Years | 0 (0.0%) | 0 (0.0%) |
| 18 to 34 Years | 0 (0.0%) | 0 (0.0%) |
| 35 to 64 Years | 0 (0.0%) | 4 (5.6%) |
| 65 to 74 Years | 0 (0.0%) | 1 (7.1%) |
| 75 Years and over | 0 (0.0%) | 0 (0.0%) |
Technology Access in Stinesville
Computing Device Access in Stinesville
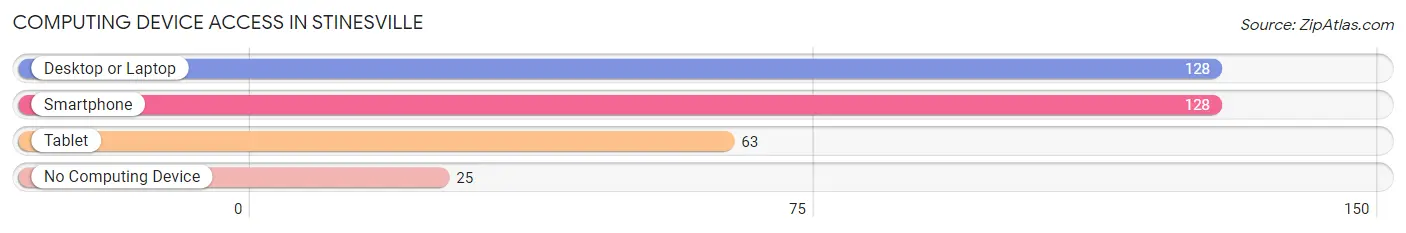
| Device Type | # Households | % Households |
| Desktop or Laptop | 128 | 75.3% |
| Smartphone | 128 | 75.3% |
| Tablet | 63 | 37.1% |
| No Computing Device | 25 | 14.7% |
| Total | 170 | 100.0% |
Internet Access in Stinesville
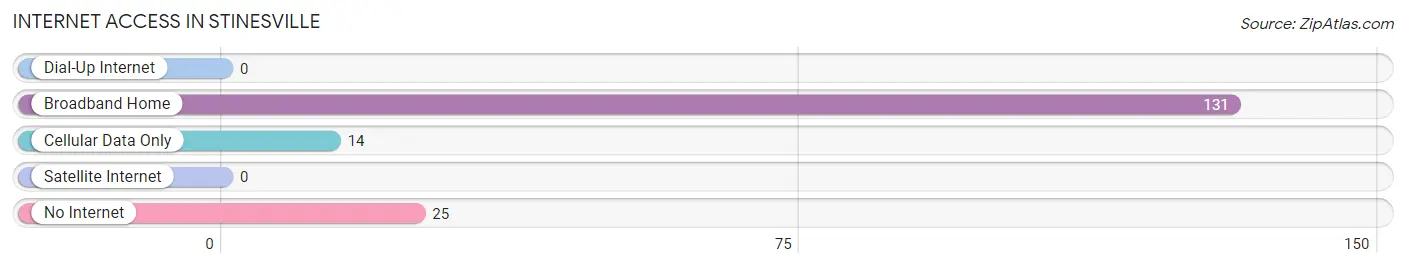
| Internet Type | # Households | % Households |
| Dial-Up Internet | 0 | 0.0% |
| Broadband Home | 131 | 77.1% |
| Cellular Data Only | 14 | 8.2% |
| Satellite Internet | 0 | 0.0% |
| No Internet | 25 | 14.7% |
| Total | 170 | 100.0% |
Stinesville Summary
Stinesville is a small town located in Monroe County, Indiana, United States. It is situated in the foothills of the Hoosier National Forest, approximately 10 miles south of Bloomington. The population was estimated to be 545 in the 2010 census.
History
Stinesville was founded in 1837 by William Stine, a German immigrant who had settled in the area in 1820. The town was originally known as Stine's Mill, and was later renamed Stinesville in 1851. The town was incorporated in 1871.
Stinesville was a thriving community in the late 19th and early 20th centuries, with a variety of businesses, including a flour mill, a sawmill, a blacksmith shop, a general store, a hotel, and a post office. The town also had a school, a church, and a cemetery.
Geography
Stinesville is located at 39°9'25"N 86°37'17"W (39.156944, -86.621389). The town is situated in the foothills of the Hoosier National Forest, approximately 10 miles south of Bloomington. The town is surrounded by rolling hills and wooded areas, and is located near the White River.
Economy
Stinesville's economy is largely based on agriculture and tourism. The town is home to several small businesses, including a general store, a restaurant, and a gas station. The town also has a few small manufacturing companies.
The town is also home to a number of tourist attractions, including the Stinesville Historical Museum, the Stinesville Covered Bridge, and the Stinesville Nature Preserve.
Demographics
As of the 2010 census, the population of Stinesville was 545. The racial makeup of the town was 97.3% White, 0.7% African American, 0.2% Native American, 0.2% Asian, 0.2% from other races, and 1.6% from two or more races. Hispanic or Latino of any race were 0.7% of the population.
The median income for a household in Stinesville was $37,500, and the median income for a family was $45,000. The per capita income for the town was $18,845. About 11.2% of families and 14.2% of the population were below the poverty line, including 18.2% of those under age 18 and 8.3% of those age 65 or over.
Stinesville is served by the Monroe County Community School Corporation. The town has one elementary school, Stinesville Elementary School, and one high school, Edgewood High School.
Common Questions
What is Per Capita Income in Stinesville?
Per Capita income in Stinesville is $31,553.
What is the Median Family Income in Stinesville?
Median Family Income in Stinesville is $74,688.
What is the Median Household income in Stinesville?
Median Household Income in Stinesville is $58,889.
What is Income or Wage Gap in Stinesville?
Income or Wage Gap in Stinesville is 14.3%.
Women in Stinesville earn 85.7 cents for every dollar earned by a man.
What is Inequality or Gini Index in Stinesville?
Inequality or Gini Index in Stinesville is 0.38.
What is the Total Population of Stinesville?
Total Population of Stinesville is 350.
What is the Total Male Population of Stinesville?
Total Male Population of Stinesville is 196.
What is the Total Female Population of Stinesville?
Total Female Population of Stinesville is 154.
What is the Ratio of Males per 100 Females in Stinesville?
There are 127.27 Males per 100 Females in Stinesville.
What is the Ratio of Females per 100 Males in Stinesville?
There are 78.57 Females per 100 Males in Stinesville.
What is the Median Population Age in Stinesville?
Median Population Age in Stinesville is 41.3 Years.
What is the Average Family Size in Stinesville
Average Family Size in Stinesville is 2.5 People.
What is the Average Household Size in Stinesville
Average Household Size in Stinesville is 2.1 People.
How Large is the Labor Force in Stinesville?
There are 194 People in the Labor Forcein in Stinesville.
What is the Percentage of People in the Labor Force in Stinesville?
63.8% of People are in the Labor Force in Stinesville.
What is the Unemployment Rate in Stinesville?
Unemployment Rate in Stinesville is 9.8%.