Cities with the Most Immigrants from Western Asia in Indiana
RELATED REPORTS & OPTIONS
Western Asia
Indiana
Compare Cities
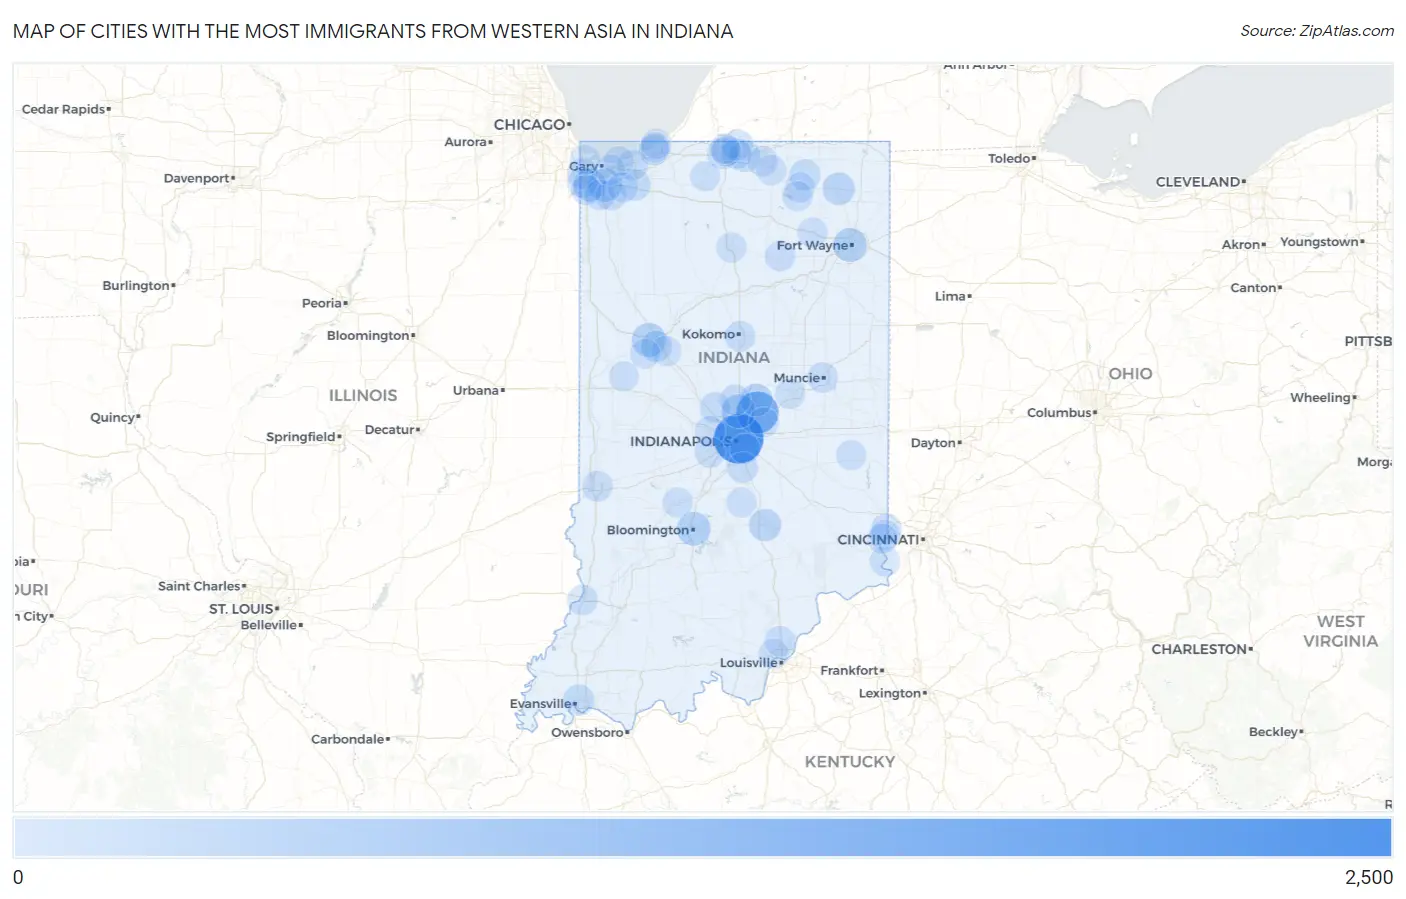
Map of Cities with the Most Immigrants from Western Asia in Indiana
0
2,500
Cities with the Most Immigrants from Western Asia in Indiana
| City | Western Asia | vs State | vs National | |
| 1. | Indianapolis | 2,013 | 8,663(23.24%)#1 | 1,204,112(0.17%)#60 |
| 2. | Fishers | 1,220 | 8,663(14.08%)#2 | 1,204,112(0.10%)#109 |
| 3. | West Lafayette | 372 | 8,663(4.29%)#3 | 1,204,112(0.03%)#467 |
| 4. | Carmel | 369 | 8,663(4.26%)#4 | 1,204,112(0.03%)#472 |
| 5. | Bloomington | 359 | 8,663(4.14%)#5 | 1,204,112(0.03%)#487 |
| 6. | Fort Wayne | 354 | 8,663(4.09%)#6 | 1,204,112(0.03%)#493 |
| 7. | Merrillville | 321 | 8,663(3.71%)#7 | 1,204,112(0.03%)#542 |
| 8. | Schererville | 267 | 8,663(3.08%)#8 | 1,204,112(0.02%)#651 |
| 9. | Noblesville | 246 | 8,663(2.84%)#9 | 1,204,112(0.02%)#707 |
| 10. | Kendallville | 222 | 8,663(2.56%)#10 | 1,204,112(0.02%)#770 |
| 11. | Columbus | 207 | 8,663(2.39%)#11 | 1,204,112(0.02%)#816 |
| 12. | Topeka | 115 | 8,663(1.33%)#12 | 1,204,112(0.01%)#1,264 |
| 13. | Osceola | 112 | 8,663(1.29%)#13 | 1,204,112(0.01%)#1,289 |
| 14. | Valparaiso | 110 | 8,663(1.27%)#14 | 1,204,112(0.01%)#1,304 |
| 15. | Lafayette | 107 | 8,663(1.24%)#15 | 1,204,112(0.01%)#1,331 |
| 16. | Evansville | 99 | 8,663(1.14%)#16 | 1,204,112(0.01%)#1,381 |
| 17. | South Bend | 76 | 8,663(0.88%)#17 | 1,204,112(0.01%)#1,630 |
| 18. | Winfield | 70 | 8,663(0.81%)#18 | 1,204,112(0.01%)#1,716 |
| 19. | Granger | 68 | 8,663(0.78%)#19 | 1,204,112(0.01%)#1,735 |
| 20. | Greenwood | 64 | 8,663(0.74%)#20 | 1,204,112(0.01%)#1,802 |
| 21. | Zionsville | 63 | 8,663(0.73%)#21 | 1,204,112(0.01%)#1,826 |
| 22. | Westfield | 62 | 8,663(0.72%)#22 | 1,204,112(0.01%)#1,842 |
| 23. | Kokomo | 56 | 8,663(0.65%)#23 | 1,204,112(0.00%)#1,941 |
| 24. | Chesterton | 54 | 8,663(0.62%)#24 | 1,204,112(0.00%)#1,983 |
| 25. | Munster | 53 | 8,663(0.61%)#25 | 1,204,112(0.00%)#1,998 |
| 26. | Michigan City | 51 | 8,663(0.59%)#26 | 1,204,112(0.00%)#2,035 |
| 27. | Terre Haute | 49 | 8,663(0.57%)#27 | 1,204,112(0.00%)#2,072 |
| 28. | Muncie | 46 | 8,663(0.53%)#28 | 1,204,112(0.00%)#2,142 |
| 29. | Dyer | 45 | 8,663(0.52%)#29 | 1,204,112(0.00%)#2,173 |
| 30. | Mishawaka | 38 | 8,663(0.44%)#30 | 1,204,112(0.00%)#2,330 |
| 31. | Brownsburg | 38 | 8,663(0.44%)#31 | 1,204,112(0.00%)#2,334 |
| 32. | Crown Point | 37 | 8,663(0.43%)#32 | 1,204,112(0.00%)#2,359 |
| 33. | Sellersburg | 35 | 8,663(0.40%)#33 | 1,204,112(0.00%)#2,426 |
| 34. | Plainfield | 30 | 8,663(0.35%)#34 | 1,204,112(0.00%)#2,584 |
| 35. | Hidden Valley | 30 | 8,663(0.35%)#35 | 1,204,112(0.00%)#2,603 |
| 36. | Vincennes | 22 | 8,663(0.25%)#36 | 1,204,112(0.00%)#2,971 |
| 37. | Lake Station | 18 | 8,663(0.21%)#37 | 1,204,112(0.00%)#3,191 |
| 38. | North Manchester | 18 | 8,663(0.21%)#38 | 1,204,112(0.00%)#3,224 |
| 39. | Notre Dame | 17 | 8,663(0.20%)#39 | 1,204,112(0.00%)#3,279 |
| 40. | Greendale | 17 | 8,663(0.20%)#40 | 1,204,112(0.00%)#3,291 |
| 41. | Dunlap | 16 | 8,663(0.18%)#41 | 1,204,112(0.00%)#3,362 |
| 42. | Shorewood Forest | 16 | 8,663(0.18%)#42 | 1,204,112(0.00%)#3,378 |
| 43. | Anderson | 15 | 8,663(0.17%)#43 | 1,204,112(0.00%)#3,397 |
| 44. | Columbia City | 15 | 8,663(0.17%)#44 | 1,204,112(0.00%)#3,428 |
| 45. | Hammond | 14 | 8,663(0.16%)#45 | 1,204,112(0.00%)#3,467 |
| 46. | Goshen | 13 | 8,663(0.15%)#46 | 1,204,112(0.00%)#3,538 |
| 47. | St John | 13 | 8,663(0.15%)#47 | 1,204,112(0.00%)#3,545 |
| 48. | Rochester | 13 | 8,663(0.15%)#48 | 1,204,112(0.00%)#3,565 |
| 49. | Ligonier | 12 | 8,663(0.14%)#49 | 1,204,112(0.00%)#3,658 |
| 50. | Roseland | 11 | 8,663(0.13%)#50 | 1,204,112(0.00%)#3,775 |
| 51. | Connersville | 10 | 8,663(0.12%)#51 | 1,204,112(0.00%)#3,800 |
| 52. | Gosport | 10 | 8,663(0.12%)#52 | 1,204,112(0.00%)#3,875 |
| 53. | New Albany | 8 | 8,663(0.09%)#53 | 1,204,112(0.00%)#3,984 |
| 54. | Mccordsville | 8 | 8,663(0.09%)#54 | 1,204,112(0.00%)#4,013 |
| 55. | Rising Sun | 8 | 8,663(0.09%)#55 | 1,204,112(0.00%)#4,052 |
| 56. | Long Beach | 4 | 8,663(0.05%)#56 | 1,204,112(0.00%)#4,395 |
| 57. | Dayton | 4 | 8,663(0.05%)#57 | 1,204,112(0.00%)#4,397 |
| 58. | Cromwell | 4 | 8,663(0.05%)#58 | 1,204,112(0.00%)#4,410 |
| 59. | Beech Grove | 3 | 8,663(0.03%)#59 | 1,204,112(0.00%)#4,432 |
| 60. | Shadeland | 3 | 8,663(0.03%)#60 | 1,204,112(0.00%)#4,454 |
| 61. | Prince S Lakes | 3 | 8,663(0.03%)#61 | 1,204,112(0.00%)#4,474 |
| 62. | Ogden Dunes | 3 | 8,663(0.03%)#62 | 1,204,112(0.00%)#4,477 |
| 63. | Lawrenceburg | 2 | 8,663(0.02%)#63 | 1,204,112(0.00%)#4,524 |
| 64. | North Liberty | 1 | 8,663(0.01%)#64 | 1,204,112(0.00%)#4,621 |
| 65. | Pottawattamie Park | 1 | 8,663(0.01%)#65 | 1,204,112(0.00%)#4,640 |
| 66. | Newtown | 1 | 8,663(0.01%)#66 | 1,204,112(0.00%)#4,645 |
Common Questions
What are the Top 10 Cities with the Most Immigrants from Western Asia in Indiana?
Top 10 Cities with the Most Immigrants from Western Asia in Indiana are:
#1
2,013
#2
1,220
#3
372
#4
369
#5
359
#6
354
#7
321
#8
267
#9
246
#10
222
What city has the Most Immigrants from Western Asia in Indiana?
Indianapolis has the Most Immigrants from Western Asia in Indiana with 2,013.
What is the Total Immigrants from Western Asia in the State of Indiana?
Total Immigrants from Western Asia in Indiana is 8,663.
What is the Total Immigrants from Western Asia in the United States?
Total Immigrants from Western Asia in the United States is 1,204,112.