Thorntown, IN Map & Demographics
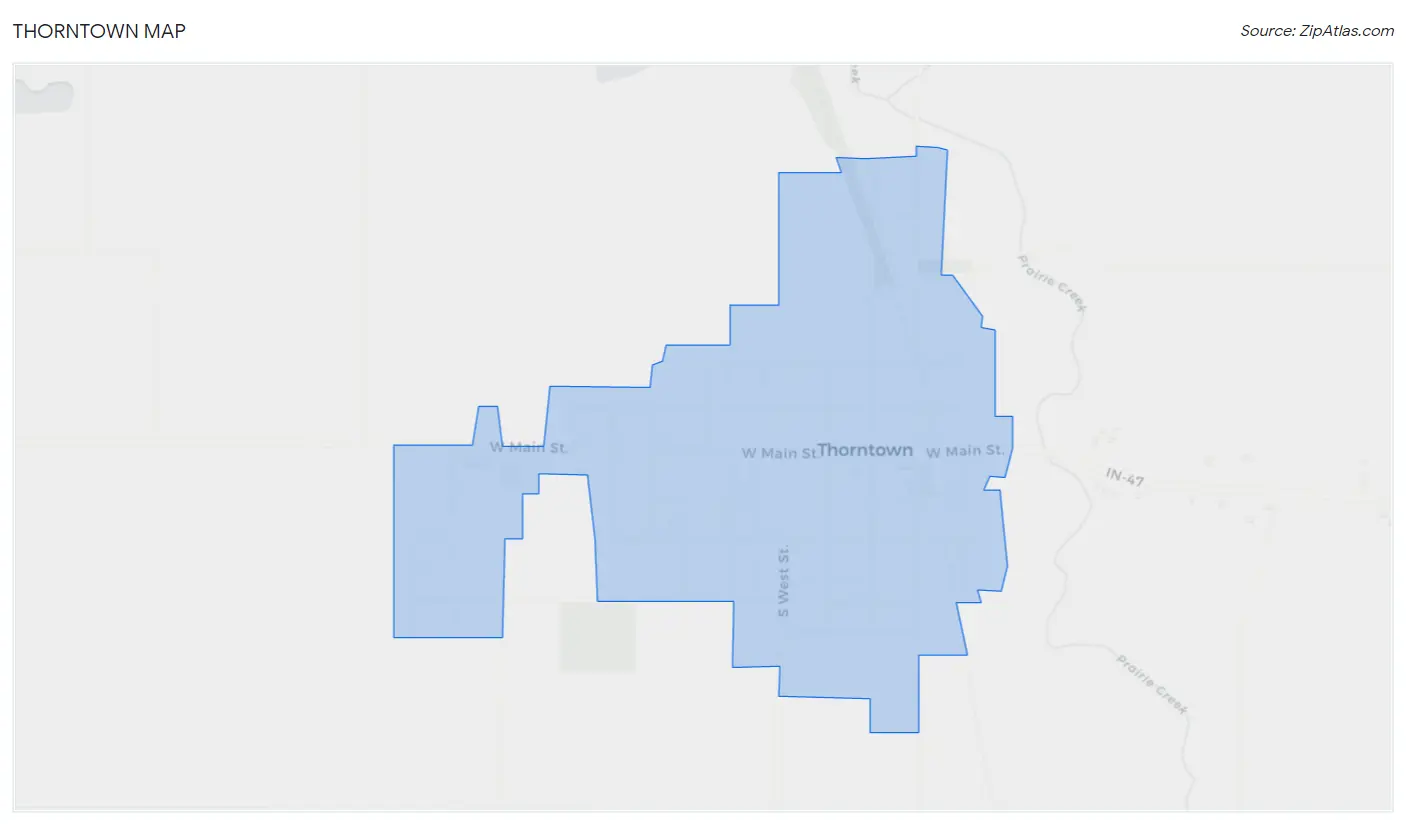
Thorntown Map
Thorntown Overview
$31,658
PER CAPITA INCOME
$70,833
AVG FAMILY INCOME
$65,114
AVG HOUSEHOLD INCOME
19.8%
WAGE / INCOME GAP [ % ]
80.2¢/ $1
WAGE / INCOME GAP [ $ ]
$7,287
FAMILY INCOME DEFICIT
0.37
INEQUALITY / GINI INDEX
1,119
TOTAL POPULATION
516
MALE POPULATION
603
FEMALE POPULATION
85.57
MALES / 100 FEMALES
116.86
FEMALES / 100 MALES
46.1
MEDIAN AGE
2.9
AVG FAMILY SIZE
2.4
AVG HOUSEHOLD SIZE
589
LABOR FORCE [ PEOPLE ]
65.2%
PERCENT IN LABOR FORCE
1.2%
UNEMPLOYMENT RATE
Thorntown Zip Codes
Thorntown Area Codes
Income in Thorntown
Income Overview in Thorntown
Per Capita Income in Thorntown is $31,658, while median incomes of families and households are $70,833 and $65,114 respectively.
| Characteristic | Number | Measure |
| Per Capita Income | 1,119 | $31,658 |
| Median Family Income | 308 | $70,833 |
| Mean Family Income | 308 | $80,281 |
| Median Household Income | 473 | $65,114 |
| Mean Household Income | 473 | $72,883 |
| Income Deficit | 308 | $7,287 |
| Wage / Income Gap (%) | 1,119 | 19.80% |
| Wage / Income Gap ($) | 1,119 | 80.20¢ per $1 |
| Gini / Inequality Index | 1,119 | 0.37 |
Earnings by Sex in Thorntown
Average Earnings in Thorntown are $43,363, $48,603 for men and $38,981 for women, a difference of 19.8%.
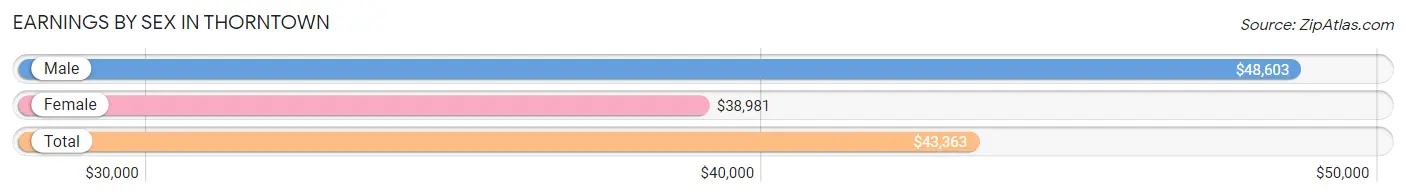
| Sex | Number | Average Earnings |
| Male | 273 (44.8%) | $48,603 |
| Female | 336 (55.2%) | $38,981 |
| Total | 609 (100.0%) | $43,363 |
Earnings by Sex by Income Bracket in Thorntown
The most common earnings brackets in Thorntown are $55,000 to $64,999 for men (53 | 19.4%) and $45,000 to $49,999 for women (39 | 11.6%).
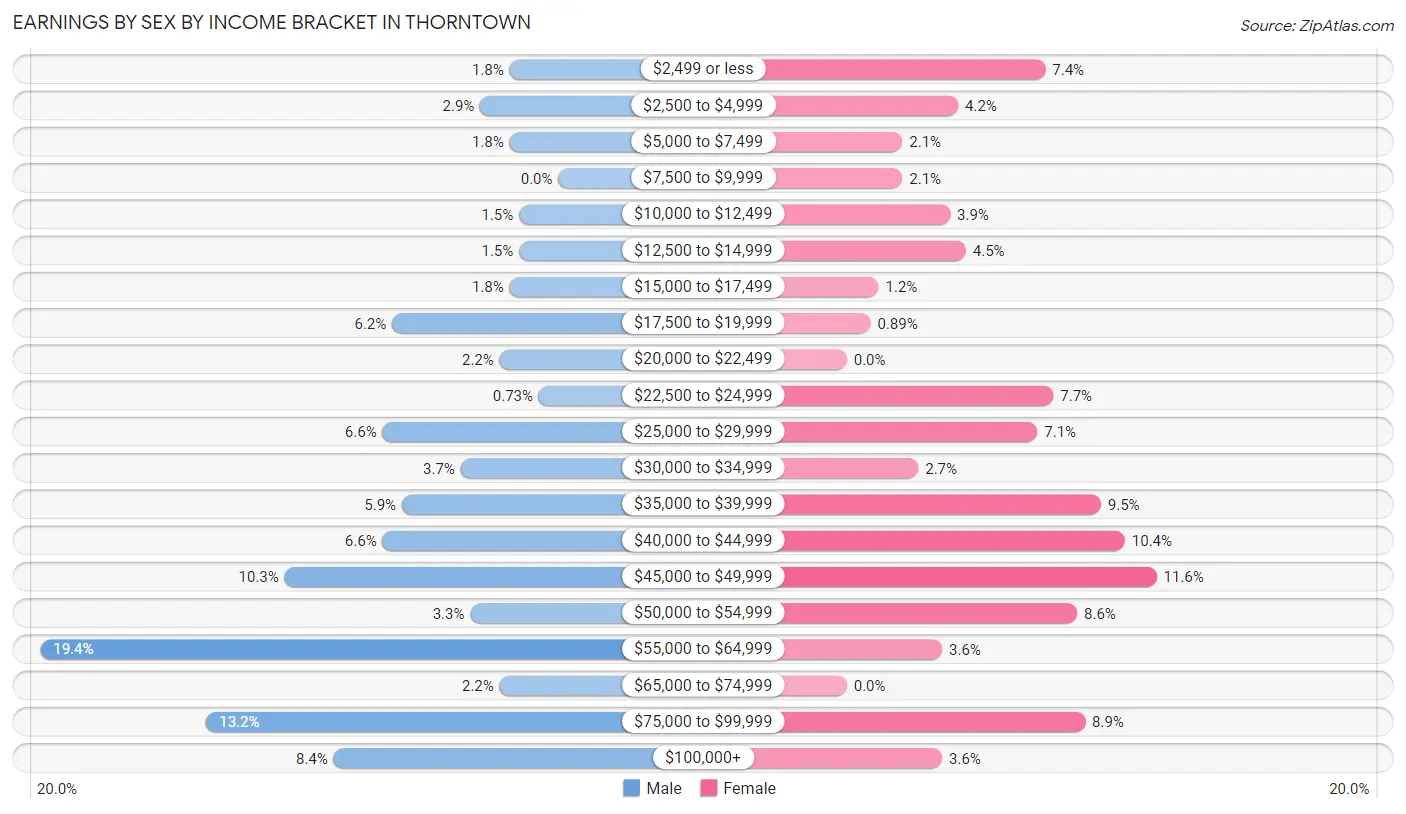
| Income | Male | Female |
| $2,499 or less | 5 (1.8%) | 25 (7.4%) |
| $2,500 to $4,999 | 8 (2.9%) | 14 (4.2%) |
| $5,000 to $7,499 | 5 (1.8%) | 7 (2.1%) |
| $7,500 to $9,999 | 0 (0.0%) | 7 (2.1%) |
| $10,000 to $12,499 | 4 (1.5%) | 13 (3.9%) |
| $12,500 to $14,999 | 4 (1.5%) | 15 (4.5%) |
| $15,000 to $17,499 | 5 (1.8%) | 4 (1.2%) |
| $17,500 to $19,999 | 17 (6.2%) | 3 (0.9%) |
| $20,000 to $22,499 | 6 (2.2%) | 0 (0.0%) |
| $22,500 to $24,999 | 2 (0.7%) | 26 (7.7%) |
| $25,000 to $29,999 | 18 (6.6%) | 24 (7.1%) |
| $30,000 to $34,999 | 10 (3.7%) | 9 (2.7%) |
| $35,000 to $39,999 | 16 (5.9%) | 32 (9.5%) |
| $40,000 to $44,999 | 18 (6.6%) | 35 (10.4%) |
| $45,000 to $49,999 | 28 (10.3%) | 39 (11.6%) |
| $50,000 to $54,999 | 9 (3.3%) | 29 (8.6%) |
| $55,000 to $64,999 | 53 (19.4%) | 12 (3.6%) |
| $65,000 to $74,999 | 6 (2.2%) | 0 (0.0%) |
| $75,000 to $99,999 | 36 (13.2%) | 30 (8.9%) |
| $100,000+ | 23 (8.4%) | 12 (3.6%) |
| Total | 273 (100.0%) | 336 (100.0%) |
Earnings by Sex by Educational Attainment in Thorntown
Average earnings in Thorntown are $55,500 for men and $43,068 for women, a difference of 22.4%. Men with an educational attainment of college or associate's degree enjoy the highest average annual earnings of $61,607, while those with high school diploma education earn the least with $48,594. Women with an educational attainment of bachelor's degree earn the most with the average annual earnings of $50,625, while those with high school diploma education have the smallest earnings of $32,222.
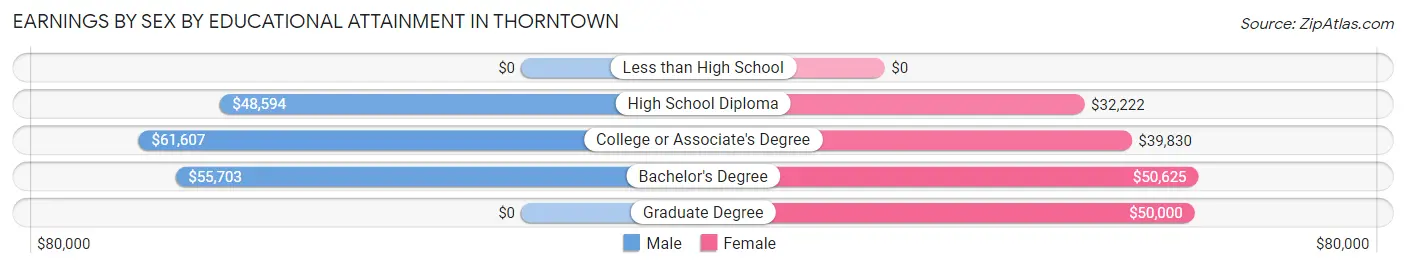
| Educational Attainment | Male Income | Female Income |
| Less than High School | - | - |
| High School Diploma | $48,594 | $32,222 |
| College or Associate's Degree | $61,607 | $39,830 |
| Bachelor's Degree | $55,703 | $50,625 |
| Graduate Degree | - | - |
| Total | $55,500 | $43,068 |
Family Income in Thorntown
Family Income Brackets in Thorntown
According to the Thorntown family income data, there are 84 families falling into the $50,000 to $74,999 income range, which is the most common income bracket and makes up 27.3% of all families. Conversely, the $10,000 to $14,999 income bracket is the least frequent group with only 5 families (1.6%) belonging to this category.
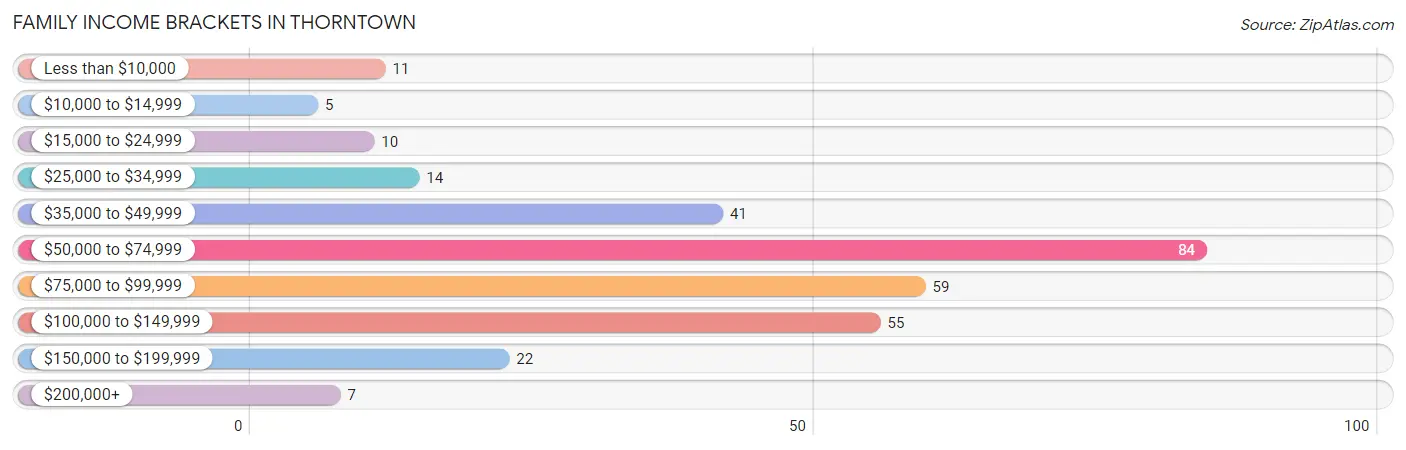
| Income Bracket | # Families | % Families |
| Less than $10,000 | 11 | 3.6% |
| $10,000 to $14,999 | 5 | 1.6% |
| $15,000 to $24,999 | 10 | 3.2% |
| $25,000 to $34,999 | 14 | 4.5% |
| $35,000 to $49,999 | 41 | 13.3% |
| $50,000 to $74,999 | 84 | 27.3% |
| $75,000 to $99,999 | 59 | 19.2% |
| $100,000 to $149,999 | 55 | 17.9% |
| $150,000 to $199,999 | 22 | 7.1% |
| $200,000+ | 7 | 2.3% |
Family Income by Famaliy Size in Thorntown
4-person families (30 | 9.7%) account for the highest median family income in Thorntown with $89,583 per family, while 2-person families (191 | 62.0%) have the highest median income of $32,590 per family member.
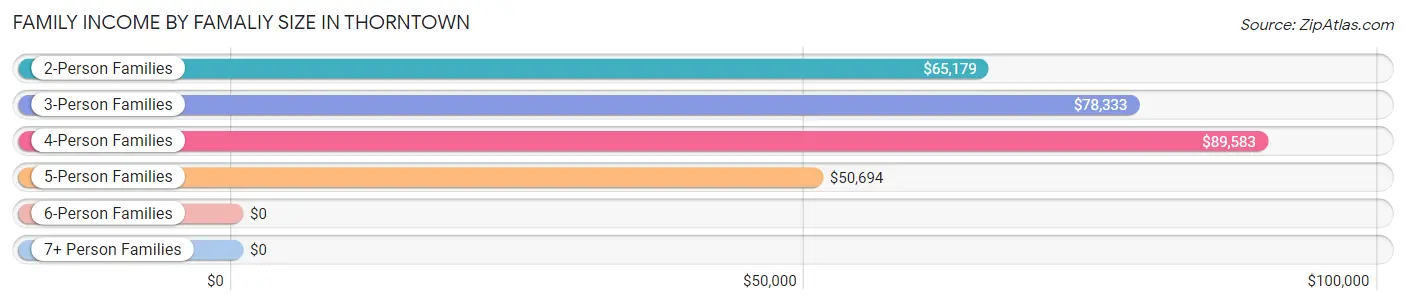
| Income Bracket | # Families | Median Income |
| 2-Person Families | 191 (62.0%) | $65,179 |
| 3-Person Families | 58 (18.8%) | $78,333 |
| 4-Person Families | 30 (9.7%) | $89,583 |
| 5-Person Families | 21 (6.8%) | $50,694 |
| 6-Person Families | 3 (1.0%) | $0 |
| 7+ Person Families | 5 (1.6%) | $0 |
| Total | 308 (100.0%) | $70,833 |
Family Income by Number of Earners in Thorntown
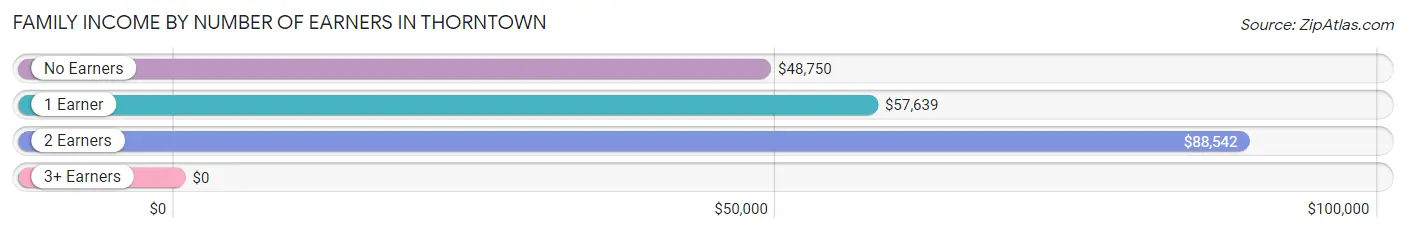
| Number of Earners | # Families | Median Income |
| No Earners | 52 (16.9%) | $48,750 |
| 1 Earner | 101 (32.8%) | $57,639 |
| 2 Earners | 147 (47.7%) | $88,542 |
| 3+ Earners | 8 (2.6%) | $0 |
| Total | 308 (100.0%) | $70,833 |
Household Income in Thorntown
Household Income Brackets in Thorntown
With 111 households falling in the category, the $50,000 to $74,999 income range is the most frequent in Thorntown, accounting for 23.5% of all households. In contrast, only 10 households (2.1%) fall into the $200,000+ income bracket, making it the least populous group.
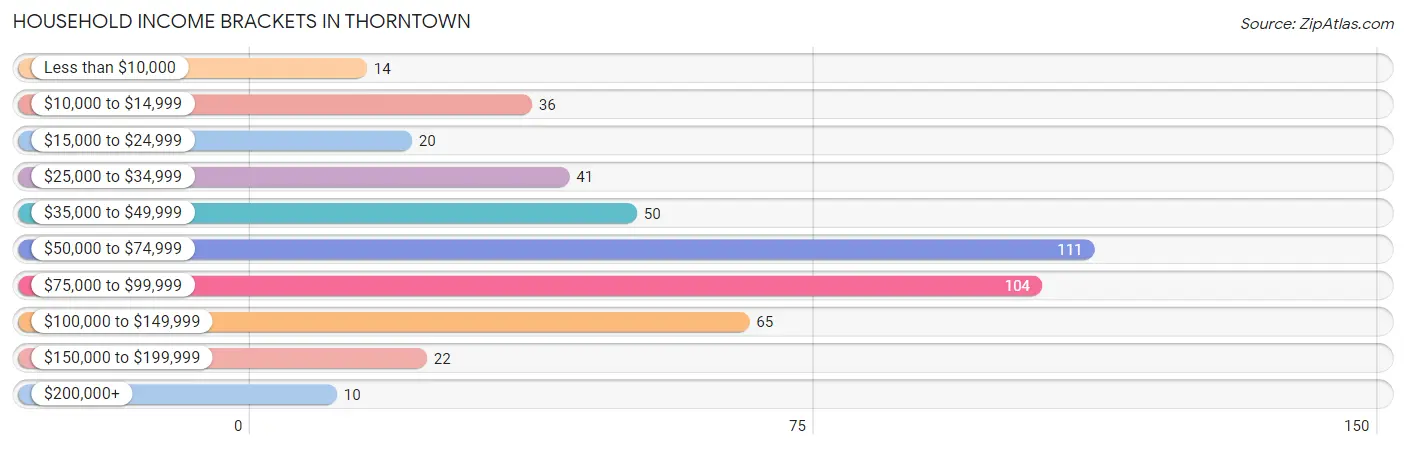
| Income Bracket | # Households | % Households |
| Less than $10,000 | 14 | 3.0% |
| $10,000 to $14,999 | 36 | 7.6% |
| $15,000 to $24,999 | 20 | 4.2% |
| $25,000 to $34,999 | 41 | 8.7% |
| $35,000 to $49,999 | 50 | 10.6% |
| $50,000 to $74,999 | 111 | 23.5% |
| $75,000 to $99,999 | 104 | 22.0% |
| $100,000 to $149,999 | 65 | 13.7% |
| $150,000 to $199,999 | 22 | 4.7% |
| $200,000+ | 10 | 2.1% |
Household Income by Householder Age in Thorntown
The median household income in Thorntown is $65,114, with the highest median household income of $75,268 found in the 45 to 64 years age bracket for the primary householder. A total of 219 households (46.3%) fall into this category. Meanwhile, the 15 to 24 years age bracket for the primary householder has the lowest median household income of $0, with 34 households (7.2%) in this group.
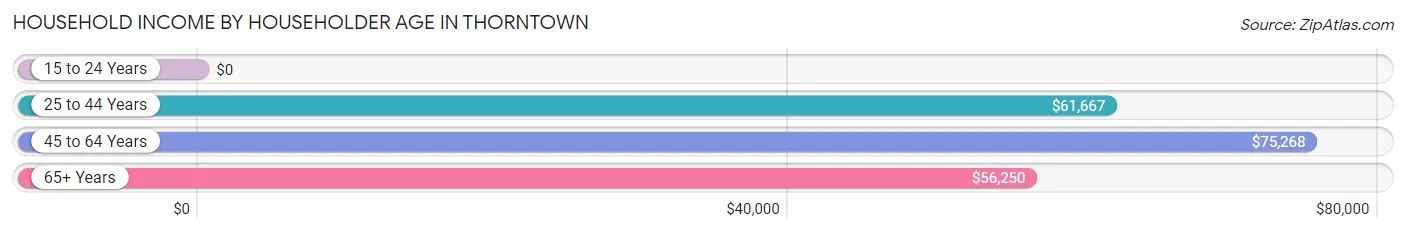
| Income Bracket | # Households | Median Income |
| 15 to 24 Years | 34 (7.2%) | $0 |
| 25 to 44 Years | 96 (20.3%) | $61,667 |
| 45 to 64 Years | 219 (46.3%) | $75,268 |
| 65+ Years | 124 (26.2%) | $56,250 |
| Total | 473 (100.0%) | $65,114 |
Poverty in Thorntown
Income Below Poverty by Sex and Age in Thorntown
With 14.3% poverty level for males and 13.6% for females among the residents of Thorntown, 16 and 17 year old males and 18 to 24 year old females are the most vulnerable to poverty, with 4 males (40.0%) and 14 females (35.9%) in their respective age groups living below the poverty level.
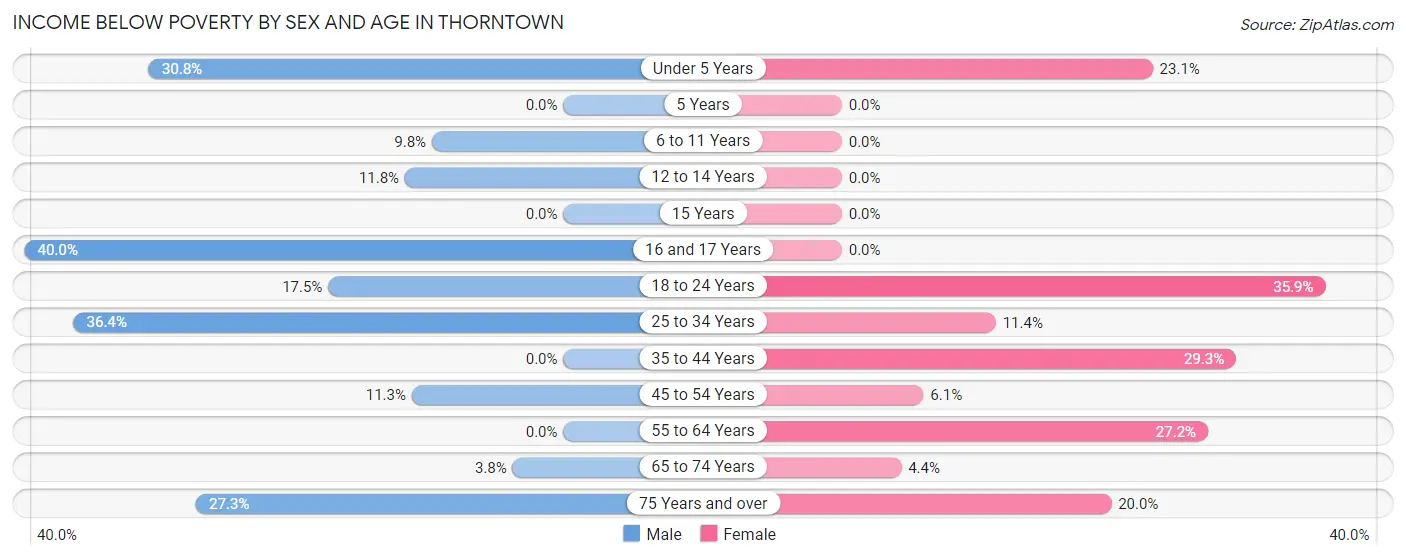
| Age Bracket | Male | Female |
| Under 5 Years | 8 (30.8%) | 3 (23.1%) |
| 5 Years | 0 (0.0%) | 0 (0.0%) |
| 6 to 11 Years | 4 (9.8%) | 0 (0.0%) |
| 12 to 14 Years | 4 (11.8%) | 0 (0.0%) |
| 15 Years | 0 (0.0%) | 0 (0.0%) |
| 16 and 17 Years | 4 (40.0%) | 0 (0.0%) |
| 18 to 24 Years | 11 (17.5%) | 14 (35.9%) |
| 25 to 34 Years | 20 (36.4%) | 8 (11.4%) |
| 35 to 44 Years | 0 (0.0%) | 12 (29.3%) |
| 45 to 54 Years | 9 (11.3%) | 6 (6.1%) |
| 55 to 64 Years | 0 (0.0%) | 28 (27.2%) |
| 65 to 74 Years | 2 (3.8%) | 3 (4.4%) |
| 75 Years and over | 12 (27.3%) | 8 (20.0%) |
| Total | 74 (14.3%) | 82 (13.6%) |
Income Above Poverty by Sex and Age in Thorntown
According to the poverty statistics in Thorntown, males aged 5 years and females aged 5 years are the age groups that are most secure financially, with 100.0% of males and 100.0% of females in these age groups living above the poverty line.
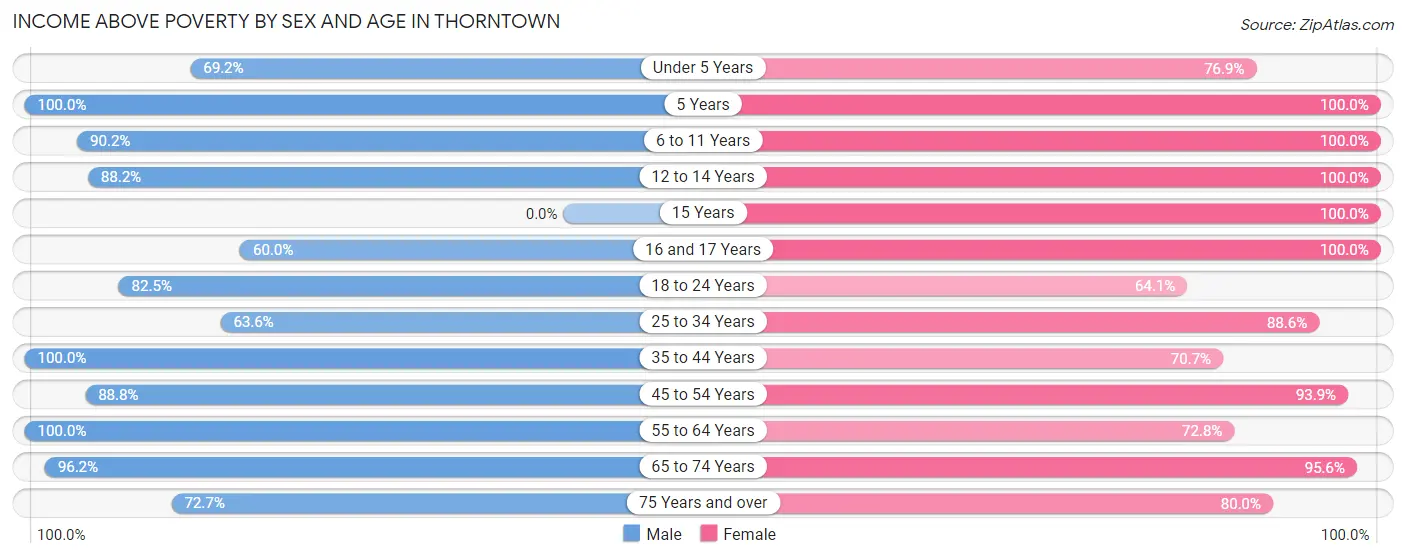
| Age Bracket | Male | Female |
| Under 5 Years | 18 (69.2%) | 10 (76.9%) |
| 5 Years | 3 (100.0%) | 8 (100.0%) |
| 6 to 11 Years | 37 (90.2%) | 33 (100.0%) |
| 12 to 14 Years | 30 (88.2%) | 51 (100.0%) |
| 15 Years | 0 (0.0%) | 7 (100.0%) |
| 16 and 17 Years | 6 (60.0%) | 31 (100.0%) |
| 18 to 24 Years | 52 (82.5%) | 25 (64.1%) |
| 25 to 34 Years | 35 (63.6%) | 62 (88.6%) |
| 35 to 44 Years | 26 (100.0%) | 29 (70.7%) |
| 45 to 54 Years | 71 (88.7%) | 93 (93.9%) |
| 55 to 64 Years | 81 (100.0%) | 75 (72.8%) |
| 65 to 74 Years | 51 (96.2%) | 65 (95.6%) |
| 75 Years and over | 32 (72.7%) | 32 (80.0%) |
| Total | 442 (85.7%) | 521 (86.4%) |
Income Below Poverty Among Married-Couple Families in Thorntown
The poverty statistics for married-couple families in Thorntown show that 3.3% or 7 of the total 213 families live below the poverty line. Families with 1 or 2 children have the highest poverty rate of 5.0%, comprising of 2 families. On the other hand, families with 3 or 4 children have the lowest poverty rate of 0.0%, which includes 0 families.
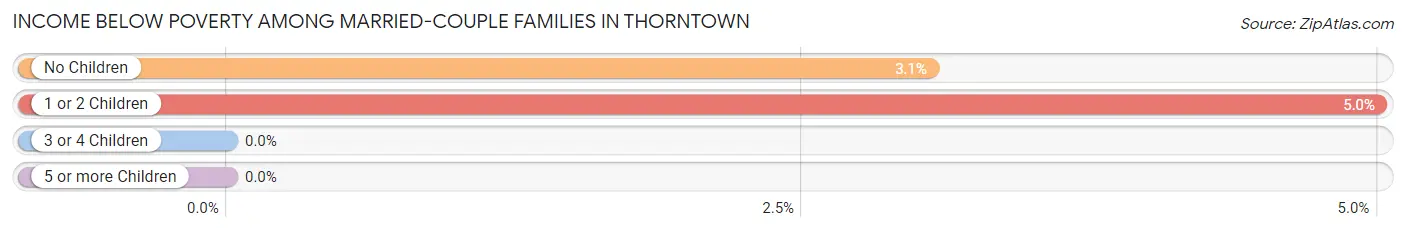
| Children | Above Poverty | Below Poverty |
| No Children | 159 (97.0%) | 5 (3.0%) |
| 1 or 2 Children | 38 (95.0%) | 2 (5.0%) |
| 3 or 4 Children | 4 (100.0%) | 0 (0.0%) |
| 5 or more Children | 5 (100.0%) | 0 (0.0%) |
| Total | 206 (96.7%) | 7 (3.3%) |
Income Below Poverty Among Single-Parent Households in Thorntown
| Children | Single Father | Single Mother |
| No Children | 0 (0.0%) | 11 (78.6%) |
| 1 or 2 Children | 0 (0.0%) | 8 (17.0%) |
| 3 or 4 Children | 0 (0.0%) | 4 (30.8%) |
| 5 or more Children | 0 (0.0%) | 0 (0.0%) |
| Total | 0 (0.0%) | 23 (31.1%) |
Income Below Poverty Among Married-Couple vs Single-Parent Households in Thorntown
The poverty data for Thorntown shows that 7 of the married-couple family households (3.3%) and 23 of the single-parent households (24.2%) are living below the poverty level. Within the married-couple family households, those with 1 or 2 children have the highest poverty rate, with 2 households (5.0%) falling below the poverty line. Among the single-parent households, those with no children have the highest poverty rate, with 11 household (57.9%) living below poverty.
| Children | Married-Couple Families | Single-Parent Households |
| No Children | 5 (3.0%) | 11 (57.9%) |
| 1 or 2 Children | 2 (5.0%) | 8 (12.7%) |
| 3 or 4 Children | 0 (0.0%) | 4 (30.8%) |
| 5 or more Children | 0 (0.0%) | 0 (0.0%) |
| Total | 7 (3.3%) | 23 (24.2%) |
Race in Thorntown
The most populous races in Thorntown are White / Caucasian (1,072 | 95.8%), Two or more Races (28 | 2.5%), and Hispanic or Latino (18 | 1.6%).
| Race | # Population | % Population |
| Asian | 15 | 1.3% |
| Black / African American | 0 | 0.0% |
| Hawaiian / Pacific | 0 | 0.0% |
| Hispanic or Latino | 18 | 1.6% |
| Native / Alaskan | 0 | 0.0% |
| White / Caucasian | 1,072 | 95.8% |
| Two or more Races | 28 | 2.5% |
| Some other Race | 4 | 0.4% |
| Total | 1,119 | 100.0% |
Ancestry in Thorntown
The most populous ancestries reported in Thorntown are American (187 | 16.7%), German (148 | 13.2%), English (110 | 9.8%), Irish (103 | 9.2%), and European (46 | 4.1%), together accounting for 53.1% of all Thorntown residents.
| Ancestry | # Population | % Population |
| American | 187 | 16.7% |
| British | 3 | 0.3% |
| Central American | 4 | 0.4% |
| Cherokee | 2 | 0.2% |
| Czech | 5 | 0.4% |
| Danish | 4 | 0.4% |
| Dutch | 12 | 1.1% |
| Eastern European | 3 | 0.3% |
| English | 110 | 9.8% |
| European | 46 | 4.1% |
| French | 7 | 0.6% |
| German | 148 | 13.2% |
| Guatemalan | 4 | 0.4% |
| Indian (Asian) | 15 | 1.3% |
| Irish | 103 | 9.2% |
| Italian | 5 | 0.4% |
| Lithuanian | 9 | 0.8% |
| Mexican | 7 | 0.6% |
| Polish | 13 | 1.2% |
| Puerto Rican | 5 | 0.4% |
| Scotch-Irish | 3 | 0.3% |
| Scottish | 8 | 0.7% |
| Swedish | 3 | 0.3% |
| Swiss | 20 | 1.8% | View All 24 Rows |
Immigrants in Thorntown
The most numerous immigrant groups reported in Thorntown came from Asia (8 | 0.7%), China (8 | 0.7%), Eastern Asia (8 | 0.7%), Central America (4 | 0.4%), and Guatemala (4 | 0.4%), together accounting for 2.8% of all Thorntown residents.
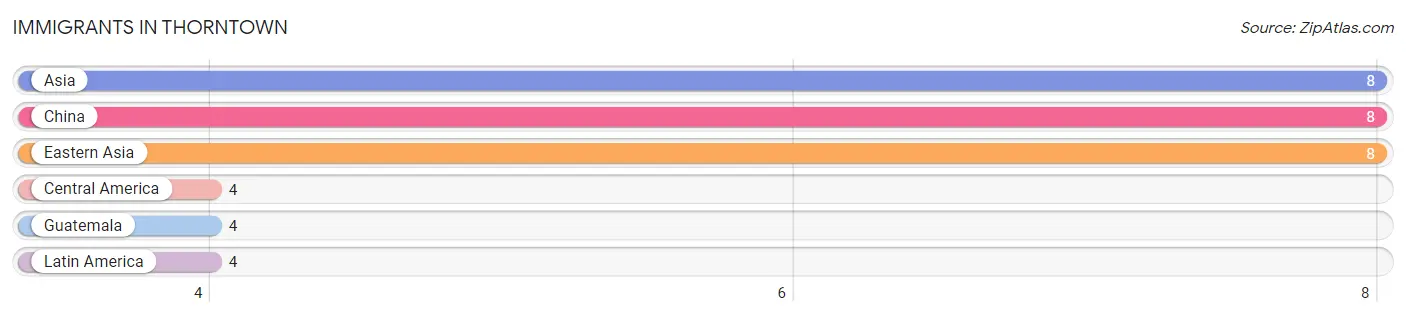
| Immigration Origin | # Population | % Population |
| Asia | 8 | 0.7% |
| Central America | 4 | 0.4% |
| China | 8 | 0.7% |
| Eastern Asia | 8 | 0.7% |
| Guatemala | 4 | 0.4% |
| Latin America | 4 | 0.4% | View All 6 Rows |
Sex and Age in Thorntown
Sex and Age in Thorntown
The most populous age groups in Thorntown are 20 to 24 Years (57 | 11.1%) for men and 10 to 14 Years (65 | 10.8%) for women.
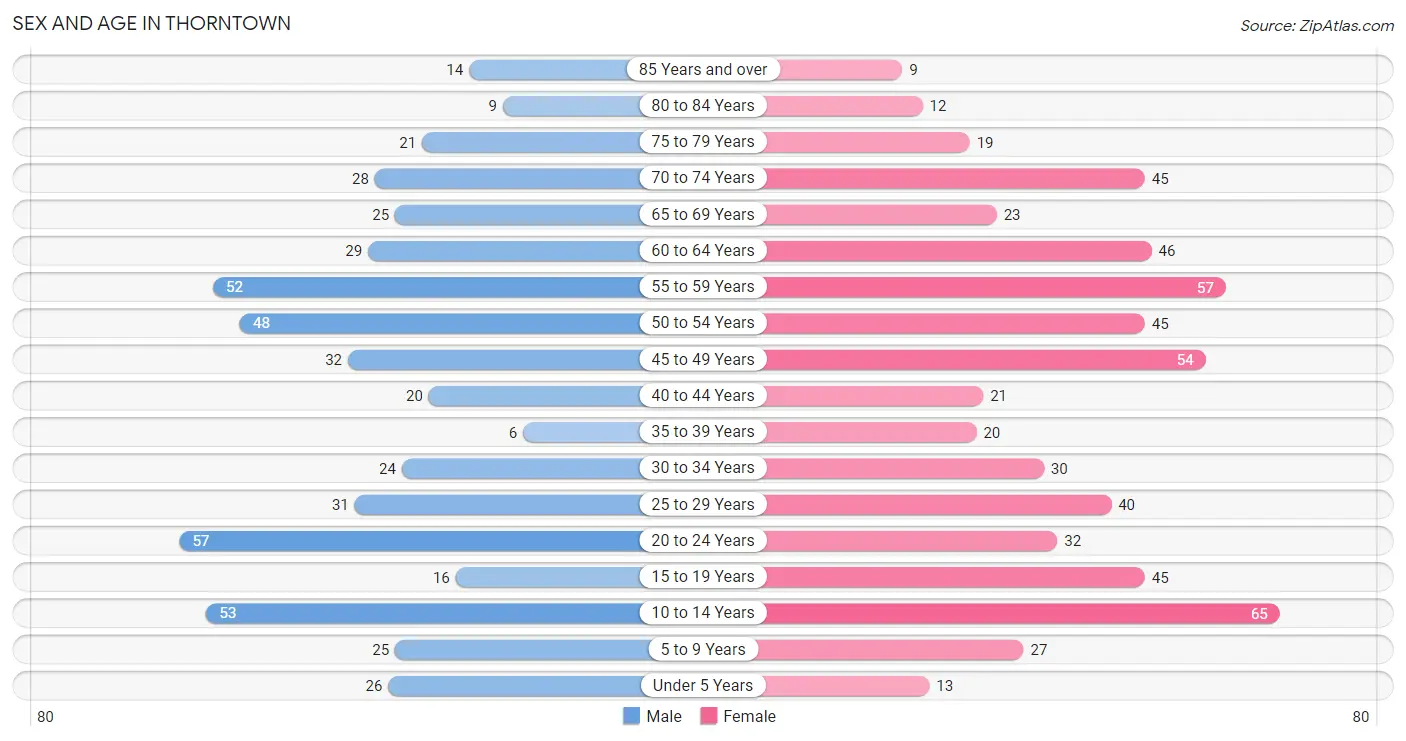
| Age Bracket | Male | Female |
| Under 5 Years | 26 (5.0%) | 13 (2.2%) |
| 5 to 9 Years | 25 (4.8%) | 27 (4.5%) |
| 10 to 14 Years | 53 (10.3%) | 65 (10.8%) |
| 15 to 19 Years | 16 (3.1%) | 45 (7.5%) |
| 20 to 24 Years | 57 (11.1%) | 32 (5.3%) |
| 25 to 29 Years | 31 (6.0%) | 40 (6.6%) |
| 30 to 34 Years | 24 (4.6%) | 30 (5.0%) |
| 35 to 39 Years | 6 (1.2%) | 20 (3.3%) |
| 40 to 44 Years | 20 (3.9%) | 21 (3.5%) |
| 45 to 49 Years | 32 (6.2%) | 54 (9.0%) |
| 50 to 54 Years | 48 (9.3%) | 45 (7.5%) |
| 55 to 59 Years | 52 (10.1%) | 57 (9.5%) |
| 60 to 64 Years | 29 (5.6%) | 46 (7.6%) |
| 65 to 69 Years | 25 (4.8%) | 23 (3.8%) |
| 70 to 74 Years | 28 (5.4%) | 45 (7.5%) |
| 75 to 79 Years | 21 (4.1%) | 19 (3.2%) |
| 80 to 84 Years | 9 (1.7%) | 12 (2.0%) |
| 85 Years and over | 14 (2.7%) | 9 (1.5%) |
| Total | 516 (100.0%) | 603 (100.0%) |
Families and Households in Thorntown
Median Family Size in Thorntown
The median family size in Thorntown is 2.87 persons per family, with single female/mother families (74 | 24.0%) accounting for the largest median family size of 3.35 persons per family. On the other hand, married-couple families (213 | 69.2%) represent the smallest median family size with 2.68 persons per family.
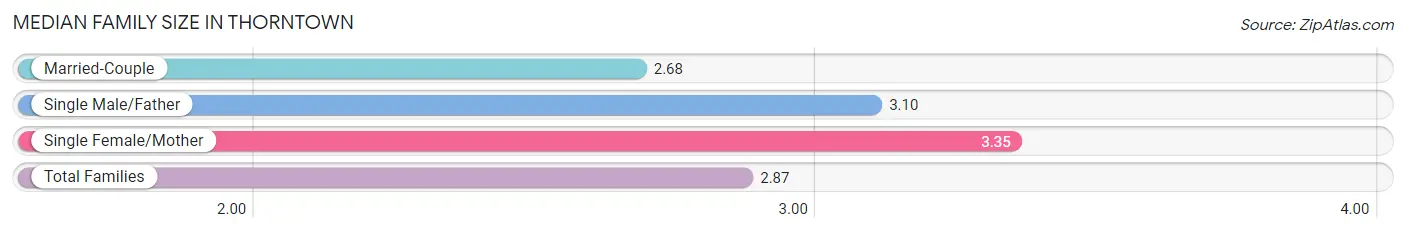
| Family Type | # Families | Family Size |
| Married-Couple | 213 (69.2%) | 2.68 |
| Single Male/Father | 21 (6.8%) | 3.10 |
| Single Female/Mother | 74 (24.0%) | 3.35 |
| Total Families | 308 (100.0%) | 2.87 |
Median Household Size in Thorntown
The median household size in Thorntown is 2.37 persons per household, with single female/mother households (74 | 15.6%) accounting for the largest median household size of 3.81 persons per household. non-family households (165 | 34.9%) represent the smallest median household size with 1.22 persons per household.
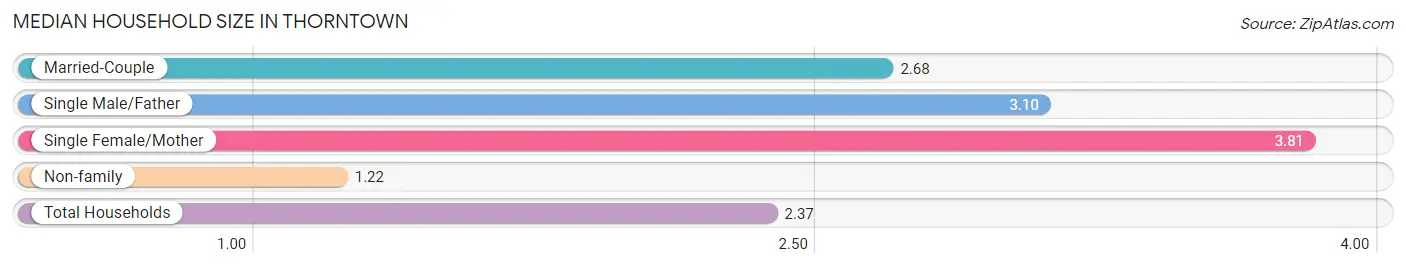
| Household Type | # Households | Household Size |
| Married-Couple | 213 (45.0%) | 2.68 |
| Single Male/Father | 21 (4.4%) | 3.10 |
| Single Female/Mother | 74 (15.6%) | 3.81 |
| Non-family | 165 (34.9%) | 1.22 |
| Total Households | 473 (100.0%) | 2.37 |
Household Size by Marriage Status in Thorntown
Out of a total of 473 households in Thorntown, 308 (65.1%) are family households, while 165 (34.9%) are nonfamily households. The most numerous type of family households are 2-person households, comprising 170, and the most common type of nonfamily households are 1-person households, comprising 120.
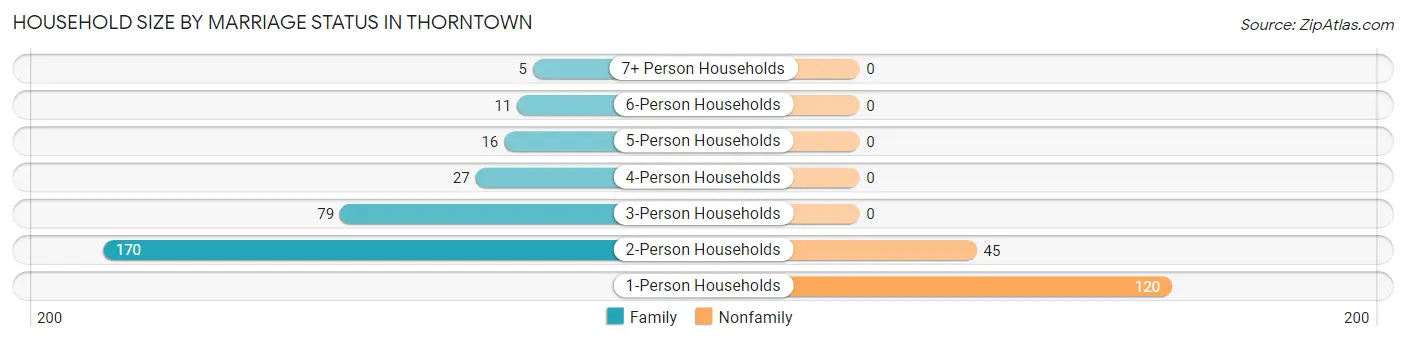
| Household Size | Family Households | Nonfamily Households |
| 1-Person Households | - | 120 (25.4%) |
| 2-Person Households | 170 (35.9%) | 45 (9.5%) |
| 3-Person Households | 79 (16.7%) | 0 (0.0%) |
| 4-Person Households | 27 (5.7%) | 0 (0.0%) |
| 5-Person Households | 16 (3.4%) | 0 (0.0%) |
| 6-Person Households | 11 (2.3%) | 0 (0.0%) |
| 7+ Person Households | 5 (1.1%) | 0 (0.0%) |
| Total | 308 (65.1%) | 165 (34.9%) |
Female Fertility in Thorntown
Fertility by Age in Thorntown
Average fertility rate in Thorntown is 20.0 births per 1,000 women. Women in the age bracket of 35 to 50 years have the highest fertility rate with 47.0 births per 1,000 women. Women in the age bracket of 35 to 50 years acount for 100.0% of all women with births.
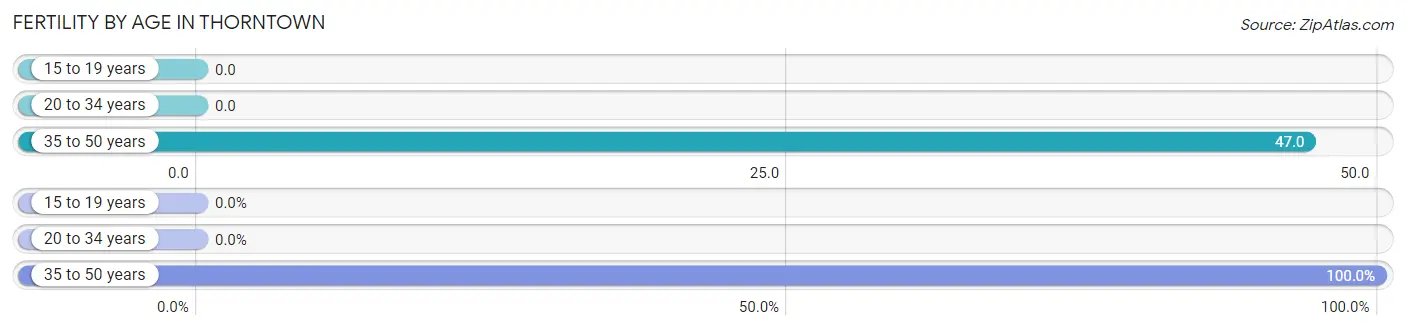
| Age Bracket | Women with Births | Births / 1,000 Women |
| 15 to 19 years | 0 (0.0%) | 0.0 |
| 20 to 34 years | 0 (0.0%) | 0.0 |
| 35 to 50 years | 5 (100.0%) | 47.0 |
| Total | 5 (100.0%) | 20.0 |
Fertility by Age by Marriage Status in Thorntown
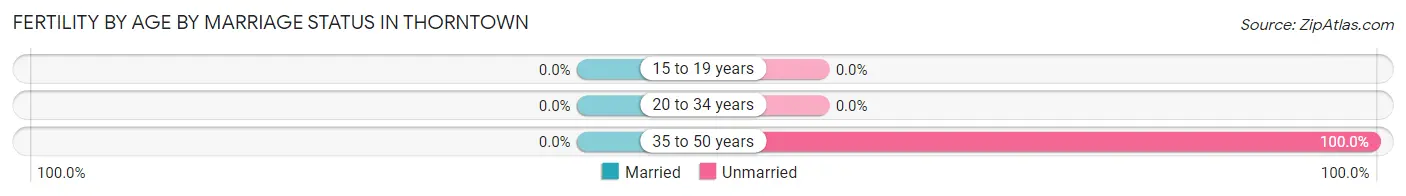
| Age Bracket | Married | Unmarried |
| 15 to 19 years | 0 (0.0%) | 0 (0.0%) |
| 20 to 34 years | 0 (0.0%) | 0 (0.0%) |
| 35 to 50 years | 0 (0.0%) | 5 (100.0%) |
| Total | 0 (0.0%) | 5 (100.0%) |
Fertility by Education in Thorntown
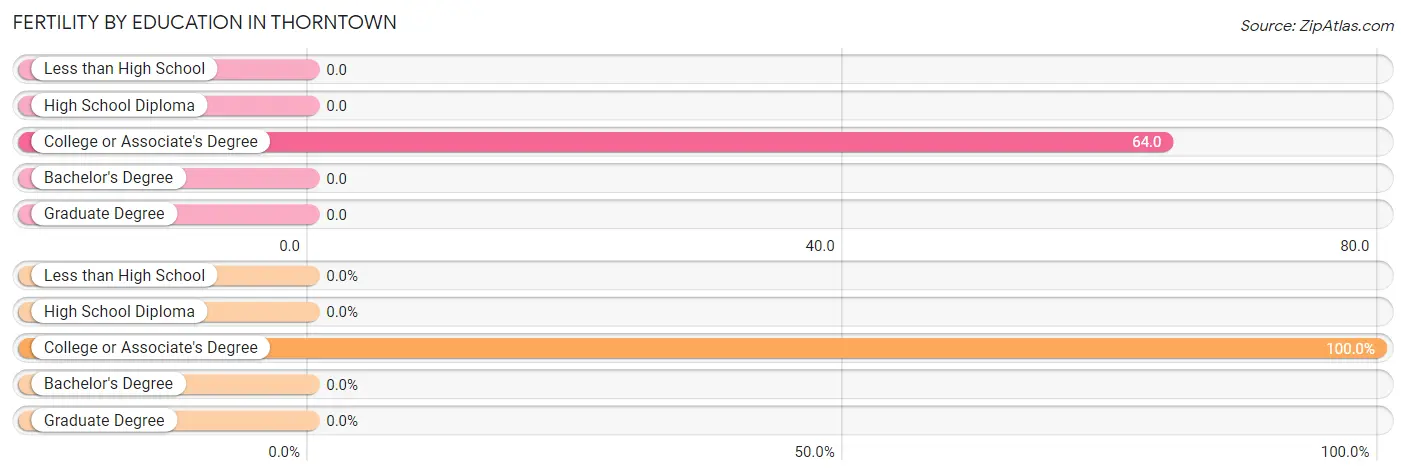
| Educational Attainment | Women with Births | Births / 1,000 Women |
| Less than High School | 0 (0.0%) | 0.0 |
| High School Diploma | 0 (0.0%) | 0.0 |
| College or Associate's Degree | 5 (100.0%) | 64.0 |
| Bachelor's Degree | 0 (0.0%) | 0.0 |
| Graduate Degree | 0 (0.0%) | 0.0 |
| Total | 5 (100.0%) | 20.0 |
Fertility by Education by Marriage Status in Thorntown
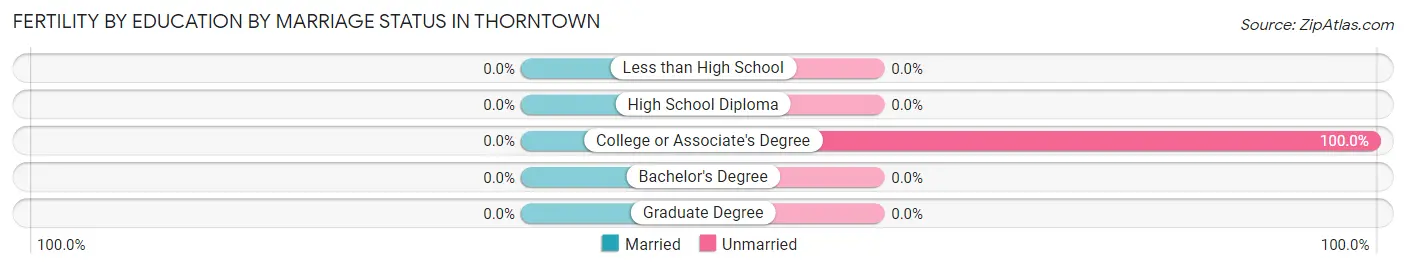
| Educational Attainment | Married | Unmarried |
| Less than High School | 0 (0.0%) | 0 (0.0%) |
| High School Diploma | 0 (0.0%) | 0 (0.0%) |
| College or Associate's Degree | 0 (0.0%) | 5 (100.0%) |
| Bachelor's Degree | 0 (0.0%) | 0 (0.0%) |
| Graduate Degree | 0 (0.0%) | 0 (0.0%) |
| Total | 0 (0.0%) | 5 (100.0%) |
Employment Characteristics in Thorntown
Employment by Class of Employer in Thorntown
Among the 578 employed individuals in Thorntown, private company employees (434 | 75.1%), local government employees (44 | 7.6%), and not-for-profit organizations (41 | 7.1%) make up the most common classes of employment.
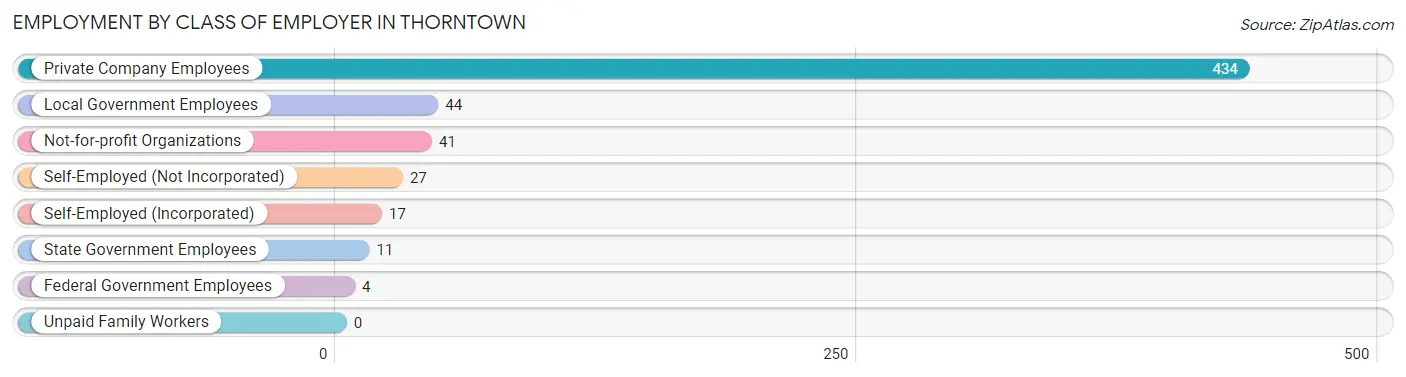
| Employer Class | # Employees | % Employees |
| Private Company Employees | 434 | 75.1% |
| Self-Employed (Incorporated) | 17 | 2.9% |
| Self-Employed (Not Incorporated) | 27 | 4.7% |
| Not-for-profit Organizations | 41 | 7.1% |
| Local Government Employees | 44 | 7.6% |
| State Government Employees | 11 | 1.9% |
| Federal Government Employees | 4 | 0.7% |
| Unpaid Family Workers | 0 | 0.0% |
| Total | 578 | 100.0% |
Employment Status by Age in Thorntown
According to the labor force statistics for Thorntown, out of the total population over 16 years of age (903), 65.2% or 589 individuals are in the labor force, with 1.2% or 7 of them unemployed. The age group with the highest labor force participation rate is 35 to 44 years, with 100.0% or 67 individuals in the labor force. Within the labor force, the 35 to 44 years age range has the highest percentage of unemployed individuals, with 6.0% or 4 of them being unemployed.
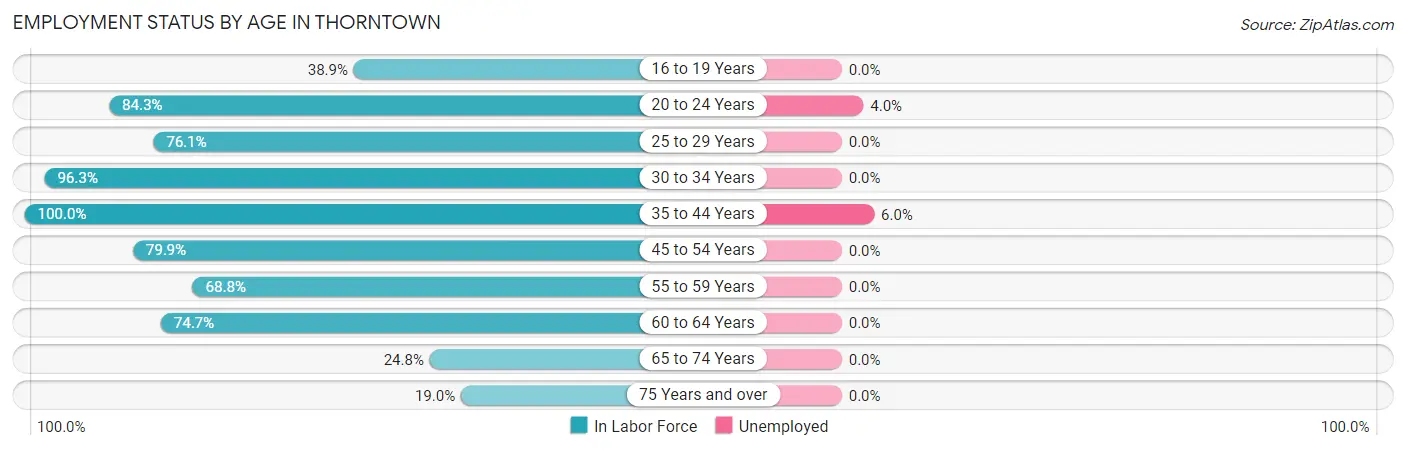
| Age Bracket | In Labor Force | Unemployed |
| 16 to 19 Years | 21 (38.9%) | 0 (0.0%) |
| 20 to 24 Years | 75 (84.3%) | 3 (4.0%) |
| 25 to 29 Years | 54 (76.1%) | 0 (0.0%) |
| 30 to 34 Years | 52 (96.3%) | 0 (0.0%) |
| 35 to 44 Years | 67 (100.0%) | 4 (6.0%) |
| 45 to 54 Years | 143 (79.9%) | 0 (0.0%) |
| 55 to 59 Years | 75 (68.8%) | 0 (0.0%) |
| 60 to 64 Years | 56 (74.7%) | 0 (0.0%) |
| 65 to 74 Years | 30 (24.8%) | 0 (0.0%) |
| 75 Years and over | 16 (19.0%) | 0 (0.0%) |
| Total | 589 (65.2%) | 7 (1.2%) |
Employment Status by Educational Attainment in Thorntown
According to labor force statistics for Thorntown, 80.5% of individuals (447) out of the total population between 25 and 64 years of age (555) are in the labor force, with 0.9% or 4 of them being unemployed. The group with the highest labor force participation rate are those with the educational attainment of bachelor's degree or higher, with 93.1% or 135 individuals in the labor force. Within the labor force, individuals with bachelor's degree or higher education have the highest percentage of unemployment, with 3.0% or 4 of them being unemployed.
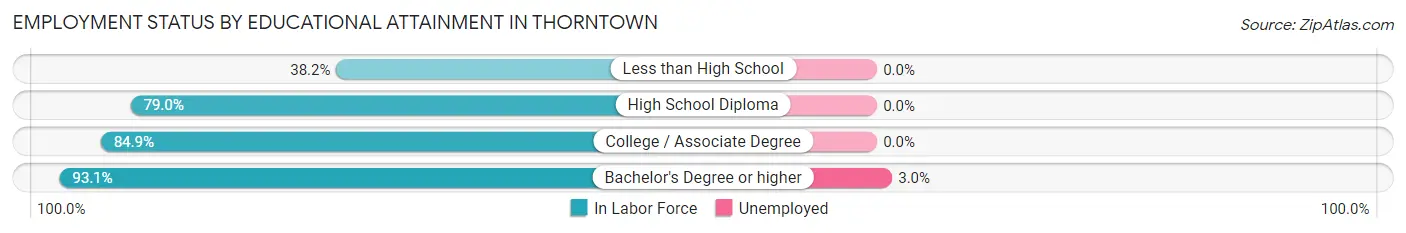
| Educational Attainment | In Labor Force | Unemployed |
| Less than High School | 21 (38.2%) | 0 (0.0%) |
| High School Diploma | 139 (79.0%) | 0 (0.0%) |
| College / Associate Degree | 152 (84.9%) | 0 (0.0%) |
| Bachelor's Degree or higher | 135 (93.1%) | 4 (3.0%) |
| Total | 447 (80.5%) | 5 (0.9%) |
Employment Occupations by Sex in Thorntown
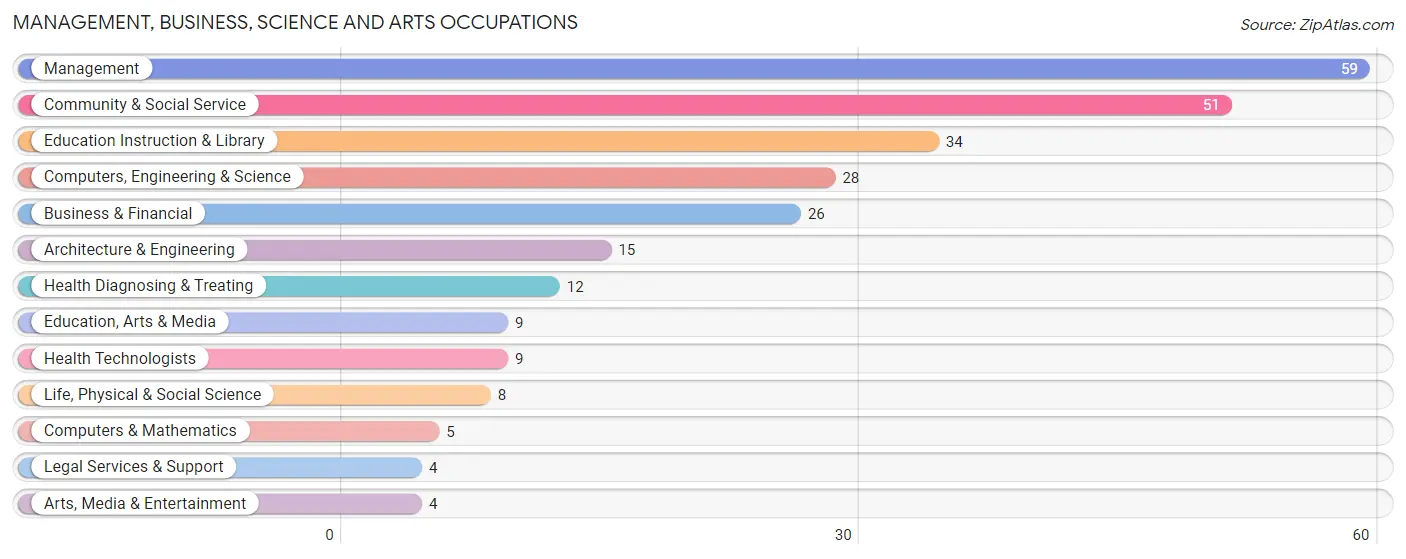
Management, Business, Science and Arts Occupations
The most common Management, Business, Science and Arts occupations in Thorntown are Management (59 | 10.1%), Community & Social Service (51 | 8.8%), Education Instruction & Library (34 | 5.8%), Computers, Engineering & Science (28 | 4.8%), and Business & Financial (26 | 4.5%).
Management, Business, Science and Arts Occupations by Sex
Within the Management, Business, Science and Arts occupations in Thorntown, the most male-oriented occupations are Arts, Media & Entertainment (100.0%), Management (66.1%), and Architecture & Engineering (46.7%), while the most female-oriented occupations are Computers & Mathematics (100.0%), Education, Arts & Media (100.0%), and Legal Services & Support (100.0%).
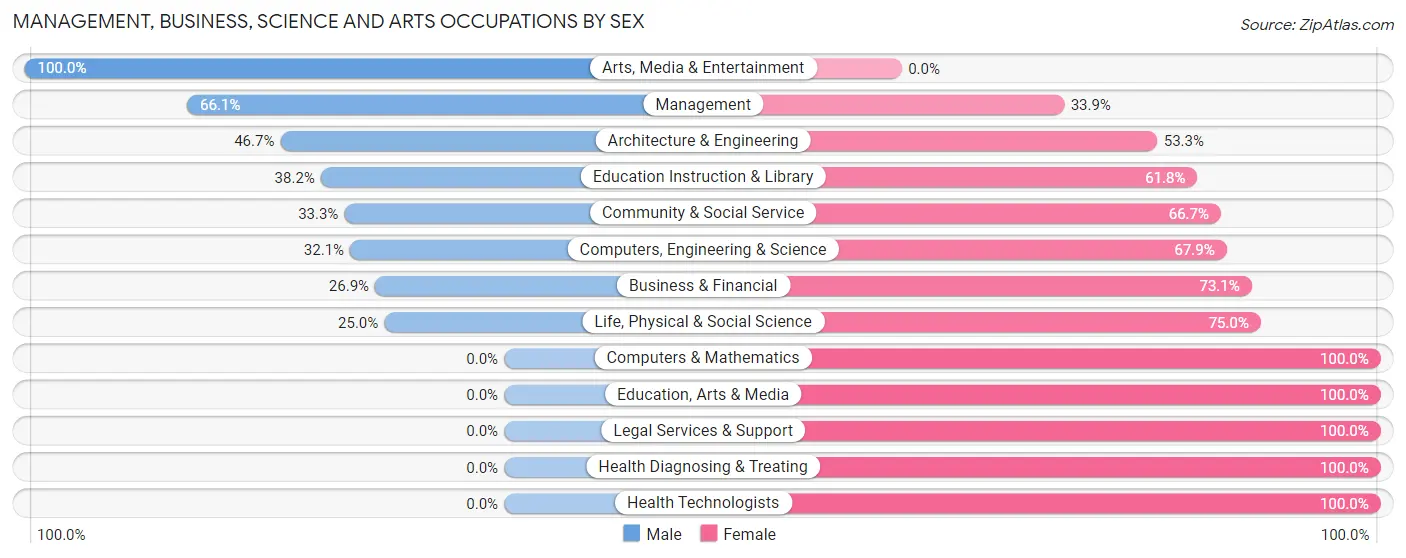
| Occupation | Male | Female |
| Management | 39 (66.1%) | 20 (33.9%) |
| Business & Financial | 7 (26.9%) | 19 (73.1%) |
| Computers, Engineering & Science | 9 (32.1%) | 19 (67.9%) |
| Computers & Mathematics | 0 (0.0%) | 5 (100.0%) |
| Architecture & Engineering | 7 (46.7%) | 8 (53.3%) |
| Life, Physical & Social Science | 2 (25.0%) | 6 (75.0%) |
| Community & Social Service | 17 (33.3%) | 34 (66.7%) |
| Education, Arts & Media | 0 (0.0%) | 9 (100.0%) |
| Legal Services & Support | 0 (0.0%) | 4 (100.0%) |
| Education Instruction & Library | 13 (38.2%) | 21 (61.8%) |
| Arts, Media & Entertainment | 4 (100.0%) | 0 (0.0%) |
| Health Diagnosing & Treating | 0 (0.0%) | 12 (100.0%) |
| Health Technologists | 0 (0.0%) | 9 (100.0%) |
| Total (Category) | 72 (40.9%) | 104 (59.1%) |
| Total (Overall) | 266 (45.7%) | 316 (54.3%) |
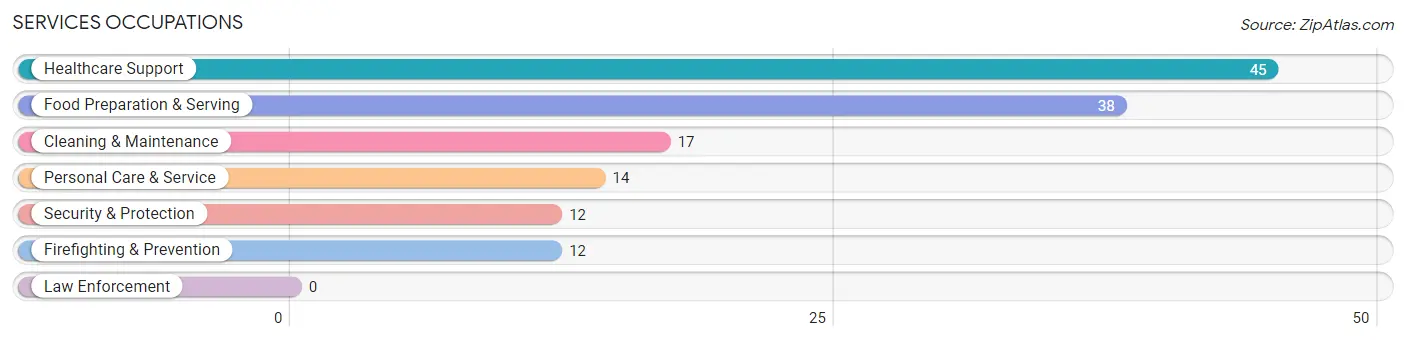
Services Occupations
The most common Services occupations in Thorntown are Healthcare Support (45 | 7.7%), Food Preparation & Serving (38 | 6.5%), Cleaning & Maintenance (17 | 2.9%), Personal Care & Service (14 | 2.4%), and Security & Protection (12 | 2.1%).
Services Occupations by Sex
Within the Services occupations in Thorntown, the most male-oriented occupations are Cleaning & Maintenance (64.7%), Security & Protection (33.3%), and Firefighting & Prevention (33.3%), while the most female-oriented occupations are Healthcare Support (100.0%), Food Preparation & Serving (100.0%), and Personal Care & Service (100.0%).
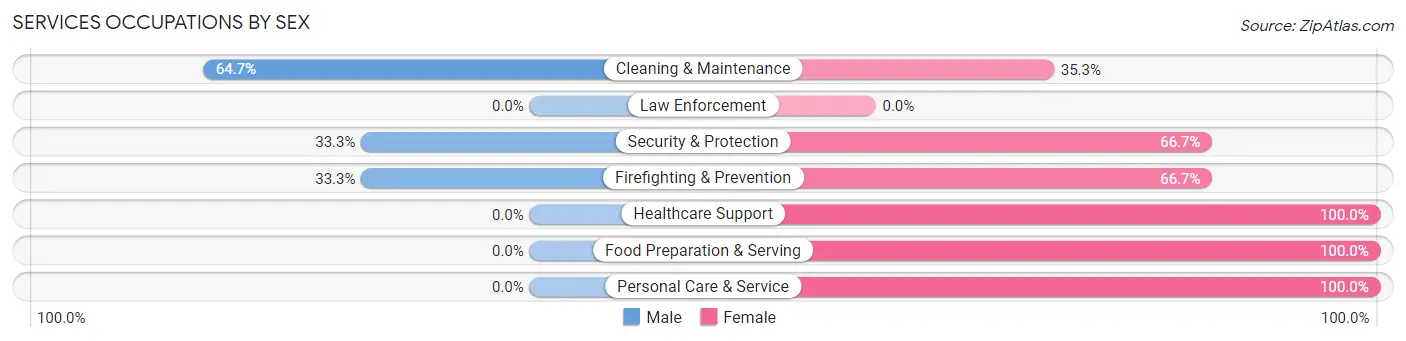
| Occupation | Male | Female |
| Healthcare Support | 0 (0.0%) | 45 (100.0%) |
| Security & Protection | 4 (33.3%) | 8 (66.7%) |
| Firefighting & Prevention | 4 (33.3%) | 8 (66.7%) |
| Law Enforcement | 0 (0.0%) | 0 (0.0%) |
| Food Preparation & Serving | 0 (0.0%) | 38 (100.0%) |
| Cleaning & Maintenance | 11 (64.7%) | 6 (35.3%) |
| Personal Care & Service | 0 (0.0%) | 14 (100.0%) |
| Total (Category) | 15 (11.9%) | 111 (88.1%) |
| Total (Overall) | 266 (45.7%) | 316 (54.3%) |
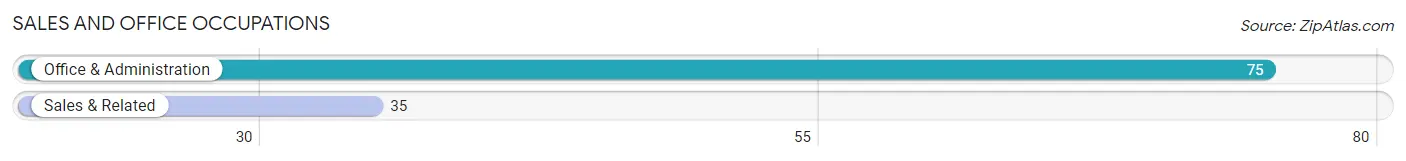
Sales and Office Occupations
The most common Sales and Office occupations in Thorntown are Office & Administration (75 | 12.9%), and Sales & Related (35 | 6.0%).
Sales and Office Occupations by Sex
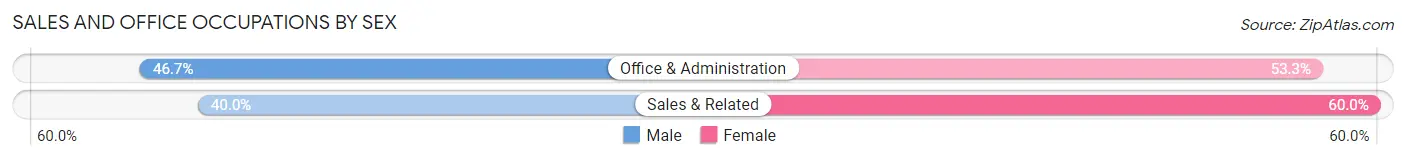
| Occupation | Male | Female |
| Sales & Related | 14 (40.0%) | 21 (60.0%) |
| Office & Administration | 35 (46.7%) | 40 (53.3%) |
| Total (Category) | 49 (44.6%) | 61 (55.4%) |
| Total (Overall) | 266 (45.7%) | 316 (54.3%) |
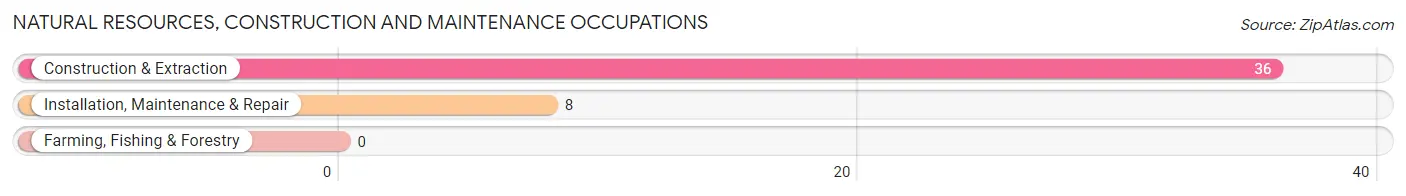
Natural Resources, Construction and Maintenance Occupations
The most common Natural Resources, Construction and Maintenance occupations in Thorntown are Construction & Extraction (36 | 6.2%), and Installation, Maintenance & Repair (8 | 1.4%).
Natural Resources, Construction and Maintenance Occupations by Sex
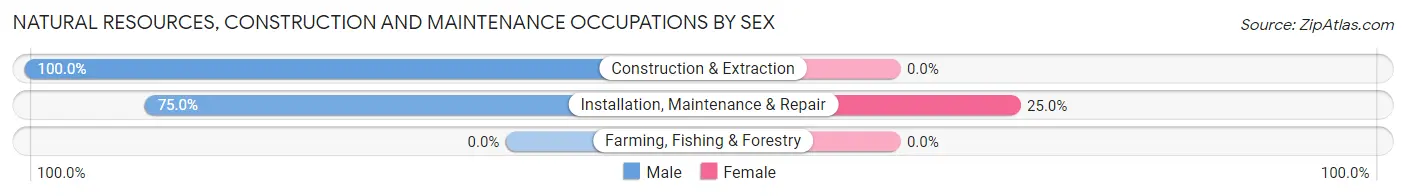
| Occupation | Male | Female |
| Farming, Fishing & Forestry | 0 (0.0%) | 0 (0.0%) |
| Construction & Extraction | 36 (100.0%) | 0 (0.0%) |
| Installation, Maintenance & Repair | 6 (75.0%) | 2 (25.0%) |
| Total (Category) | 42 (95.5%) | 2 (4.5%) |
| Total (Overall) | 266 (45.7%) | 316 (54.3%) |
Production, Transportation and Moving Occupations
The most common Production, Transportation and Moving occupations in Thorntown are Production (51 | 8.8%), Material Moving (42 | 7.2%), and Transportation (33 | 5.7%).
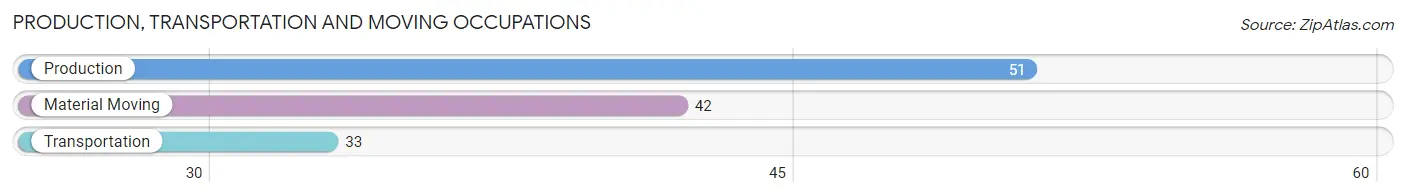
Production, Transportation and Moving Occupations by Sex
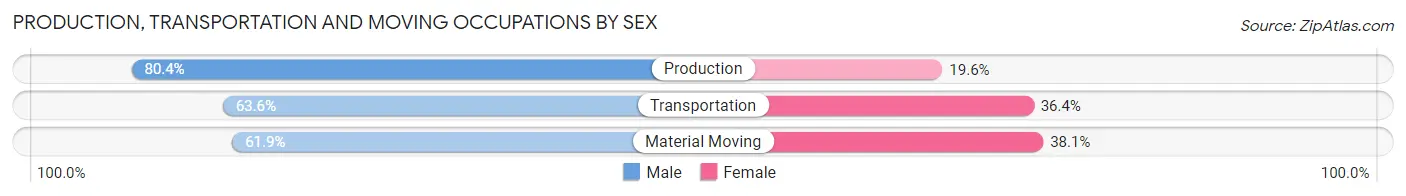
| Occupation | Male | Female |
| Production | 41 (80.4%) | 10 (19.6%) |
| Transportation | 21 (63.6%) | 12 (36.4%) |
| Material Moving | 26 (61.9%) | 16 (38.1%) |
| Total (Category) | 88 (69.8%) | 38 (30.2%) |
| Total (Overall) | 266 (45.7%) | 316 (54.3%) |
Employment Industries by Sex in Thorntown
Employment Industries in Thorntown
The major employment industries in Thorntown include Manufacturing (110 | 18.9%), Health Care & Social Assistance (73 | 12.5%), Accommodation & Food Services (64 | 11.0%), Retail Trade (57 | 9.8%), and Educational Services (55 | 9.5%).
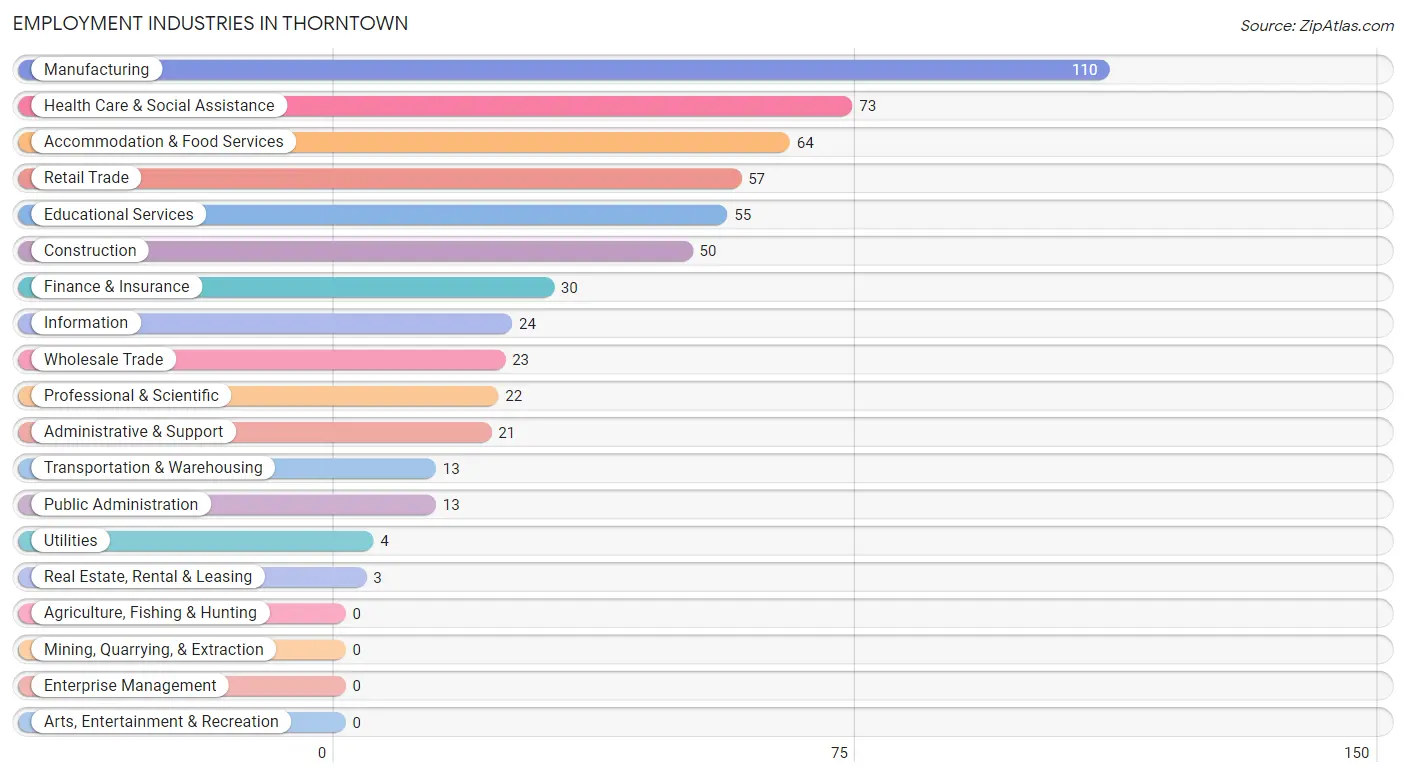
Employment Industries by Sex in Thorntown
The Thorntown industries that see more men than women are Construction (100.0%), Utilities (100.0%), and Wholesale Trade (82.6%), whereas the industries that tend to have a higher number of women are Finance & Insurance (100.0%), Real Estate, Rental & Leasing (100.0%), and Professional & Scientific (100.0%).
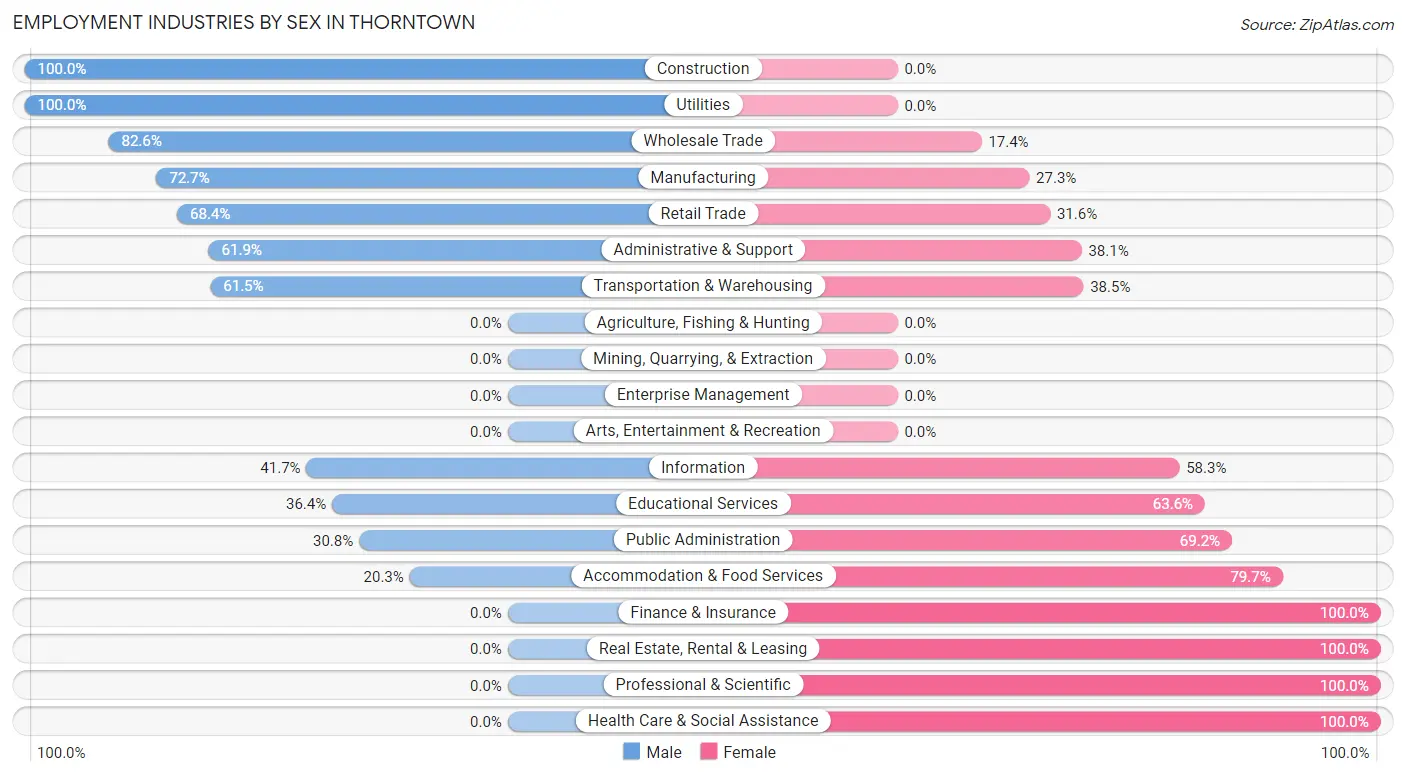
| Industry | Male | Female |
| Agriculture, Fishing & Hunting | 0 (0.0%) | 0 (0.0%) |
| Mining, Quarrying, & Extraction | 0 (0.0%) | 0 (0.0%) |
| Construction | 50 (100.0%) | 0 (0.0%) |
| Manufacturing | 80 (72.7%) | 30 (27.3%) |
| Wholesale Trade | 19 (82.6%) | 4 (17.4%) |
| Retail Trade | 39 (68.4%) | 18 (31.6%) |
| Transportation & Warehousing | 8 (61.5%) | 5 (38.5%) |
| Utilities | 4 (100.0%) | 0 (0.0%) |
| Information | 10 (41.7%) | 14 (58.3%) |
| Finance & Insurance | 0 (0.0%) | 30 (100.0%) |
| Real Estate, Rental & Leasing | 0 (0.0%) | 3 (100.0%) |
| Professional & Scientific | 0 (0.0%) | 22 (100.0%) |
| Enterprise Management | 0 (0.0%) | 0 (0.0%) |
| Administrative & Support | 13 (61.9%) | 8 (38.1%) |
| Educational Services | 20 (36.4%) | 35 (63.6%) |
| Health Care & Social Assistance | 0 (0.0%) | 73 (100.0%) |
| Arts, Entertainment & Recreation | 0 (0.0%) | 0 (0.0%) |
| Accommodation & Food Services | 13 (20.3%) | 51 (79.7%) |
| Public Administration | 4 (30.8%) | 9 (69.2%) |
| Total | 266 (45.7%) | 316 (54.3%) |
Education in Thorntown
School Enrollment in Thorntown
The most common levels of schooling among the 268 students in Thorntown are middle school (103 | 38.4%), high school (54 | 20.2%), and college / undergraduate (46 | 17.2%).
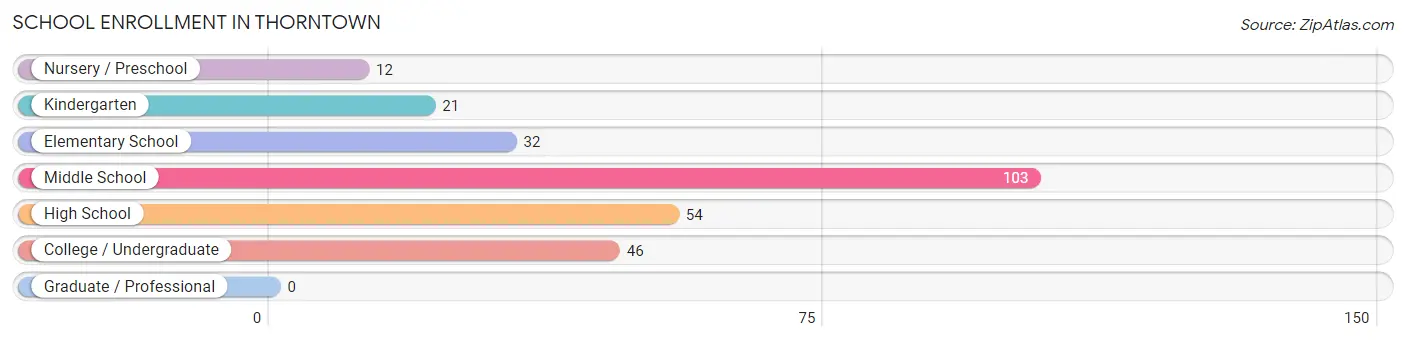
| School Level | # Students | % Students |
| Nursery / Preschool | 12 | 4.5% |
| Kindergarten | 21 | 7.8% |
| Elementary School | 32 | 11.9% |
| Middle School | 103 | 38.4% |
| High School | 54 | 20.2% |
| College / Undergraduate | 46 | 17.2% |
| Graduate / Professional | 0 | 0.0% |
| Total | 268 | 100.0% |
School Enrollment by Age by Funding Source in Thorntown
Out of a total of 268 students who are enrolled in schools in Thorntown, 38 (14.2%) attend a private institution, while the remaining 230 (85.8%) are enrolled in public schools. The age group of 10 to 14 year olds has the highest likelihood of being enrolled in private schools, with 31 (26.3% in the age bracket) enrolled. Conversely, the age group of 3 to 4 year olds has the lowest likelihood of being enrolled in a private school, with 4 (100.0% in the age bracket) attending a public institution.
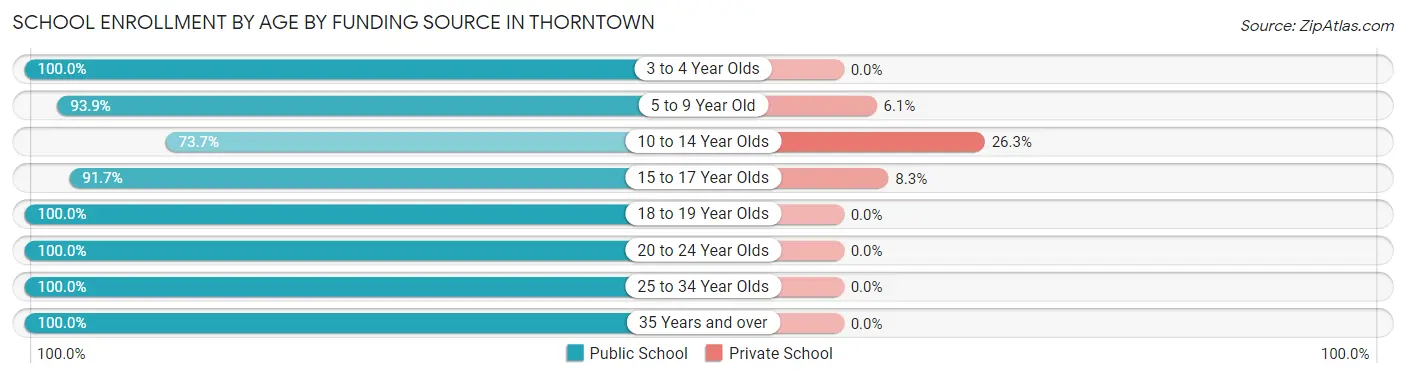
| Age Bracket | Public School | Private School |
| 3 to 4 Year Olds | 4 (100.0%) | 0 (0.0%) |
| 5 to 9 Year Old | 46 (93.9%) | 3 (6.1%) |
| 10 to 14 Year Olds | 87 (73.7%) | 31 (26.3%) |
| 15 to 17 Year Olds | 44 (91.7%) | 4 (8.3%) |
| 18 to 19 Year Olds | 7 (100.0%) | 0 (0.0%) |
| 20 to 24 Year Olds | 17 (100.0%) | 0 (0.0%) |
| 25 to 34 Year Olds | 18 (100.0%) | 0 (0.0%) |
| 35 Years and over | 7 (100.0%) | 0 (0.0%) |
| Total | 230 (85.8%) | 38 (14.2%) |
Educational Attainment by Field of Study in Thorntown
Liberal arts & history (33 | 19.2%), science & technology (29 | 16.9%), education (27 | 15.7%), business (26 | 15.1%), and arts & humanities (13 | 7.6%) are the most common fields of study among 172 individuals in Thorntown who have obtained a bachelor's degree or higher.
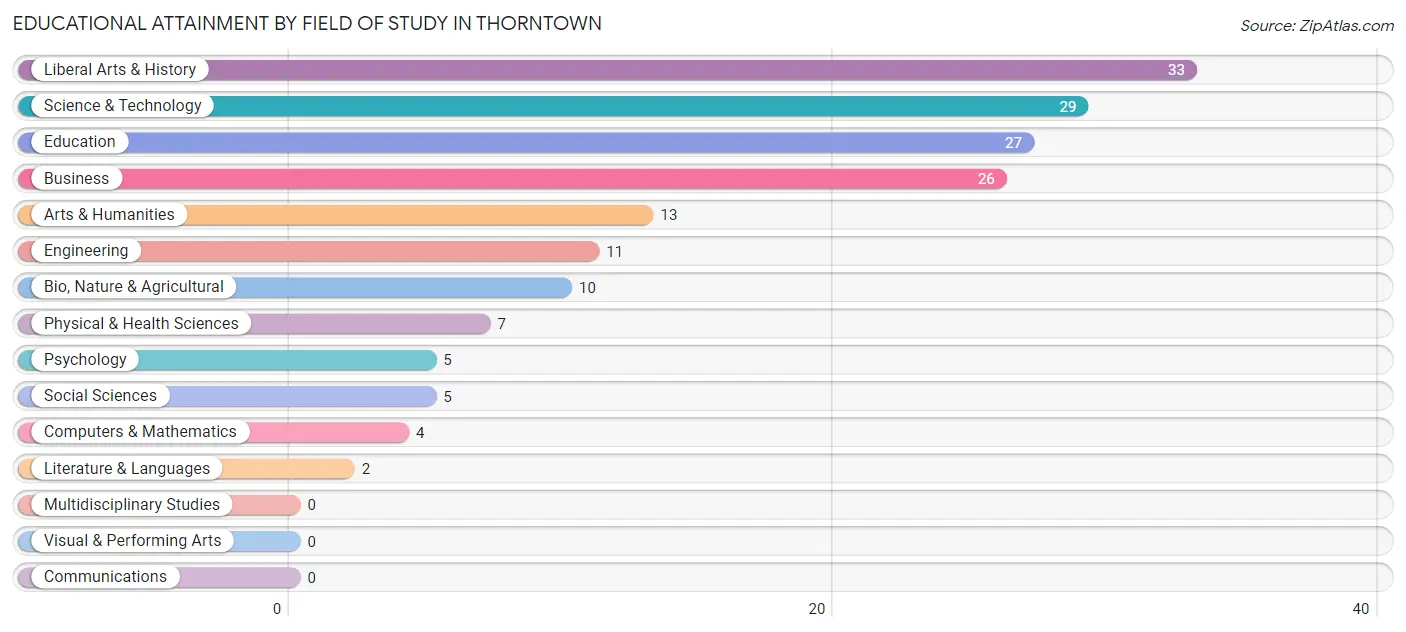
| Field of Study | # Graduates | % Graduates |
| Computers & Mathematics | 4 | 2.3% |
| Bio, Nature & Agricultural | 10 | 5.8% |
| Physical & Health Sciences | 7 | 4.1% |
| Psychology | 5 | 2.9% |
| Social Sciences | 5 | 2.9% |
| Engineering | 11 | 6.4% |
| Multidisciplinary Studies | 0 | 0.0% |
| Science & Technology | 29 | 16.9% |
| Business | 26 | 15.1% |
| Education | 27 | 15.7% |
| Literature & Languages | 2 | 1.2% |
| Liberal Arts & History | 33 | 19.2% |
| Visual & Performing Arts | 0 | 0.0% |
| Communications | 0 | 0.0% |
| Arts & Humanities | 13 | 7.6% |
| Total | 172 | 100.0% |
Transportation & Commute in Thorntown
Vehicle Availability by Sex in Thorntown
The most prevalent vehicle ownership categories in Thorntown are males with 2 vehicles (96, accounting for 36.1%) and females with 2 vehicles (125, making up 30.8%).
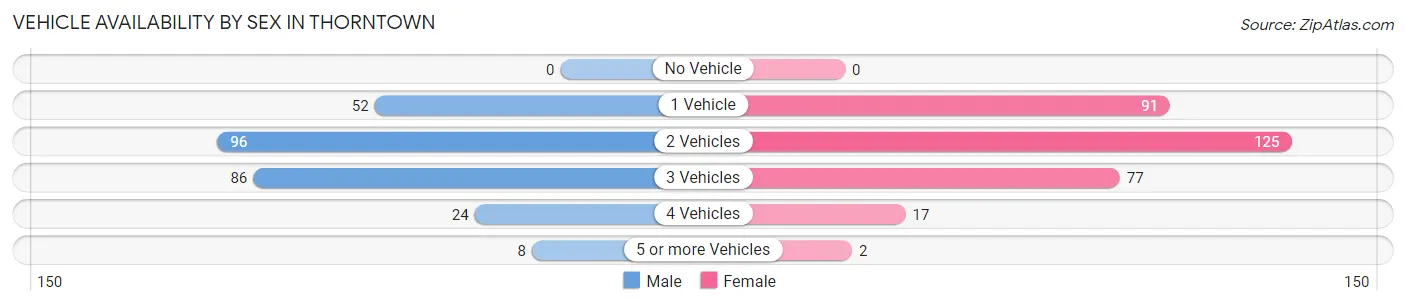
| Vehicles Available | Male | Female |
| No Vehicle | 0 (0.0%) | 0 (0.0%) |
| 1 Vehicle | 52 (19.6%) | 91 (29.2%) |
| 2 Vehicles | 96 (36.1%) | 125 (40.1%) |
| 3 Vehicles | 86 (32.3%) | 77 (24.7%) |
| 4 Vehicles | 24 (9.0%) | 17 (5.4%) |
| 5 or more Vehicles | 8 (3.0%) | 2 (0.6%) |
| Total | 266 (100.0%) | 312 (100.0%) |
Commute Time in Thorntown
The most frequently occuring commute durations in Thorntown are 20 to 24 minutes (92 commuters, 17.3%), 30 to 34 minutes (74 commuters, 13.9%), and 10 to 14 minutes (68 commuters, 12.8%).
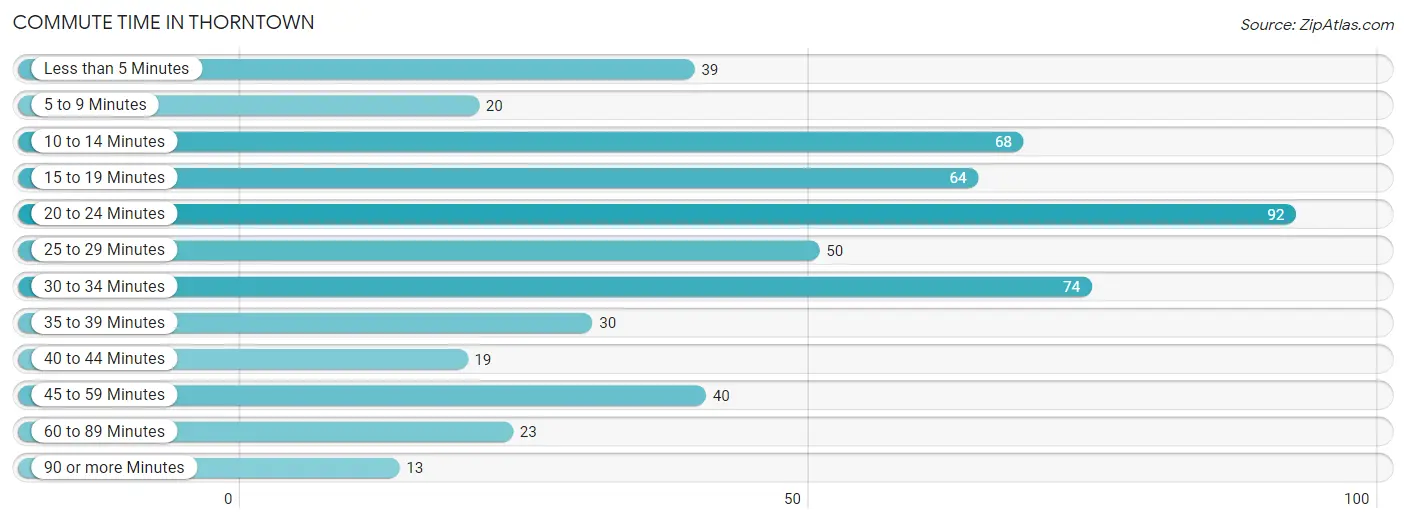
| Commute Time | # Commuters | % Commuters |
| Less than 5 Minutes | 39 | 7.3% |
| 5 to 9 Minutes | 20 | 3.8% |
| 10 to 14 Minutes | 68 | 12.8% |
| 15 to 19 Minutes | 64 | 12.0% |
| 20 to 24 Minutes | 92 | 17.3% |
| 25 to 29 Minutes | 50 | 9.4% |
| 30 to 34 Minutes | 74 | 13.9% |
| 35 to 39 Minutes | 30 | 5.6% |
| 40 to 44 Minutes | 19 | 3.6% |
| 45 to 59 Minutes | 40 | 7.5% |
| 60 to 89 Minutes | 23 | 4.3% |
| 90 or more Minutes | 13 | 2.4% |
Commute Time by Sex in Thorntown
The most common commute times in Thorntown are 20 to 24 minutes (52 commuters, 20.6%) for males and 15 to 19 minutes (47 commuters, 16.8%) for females.
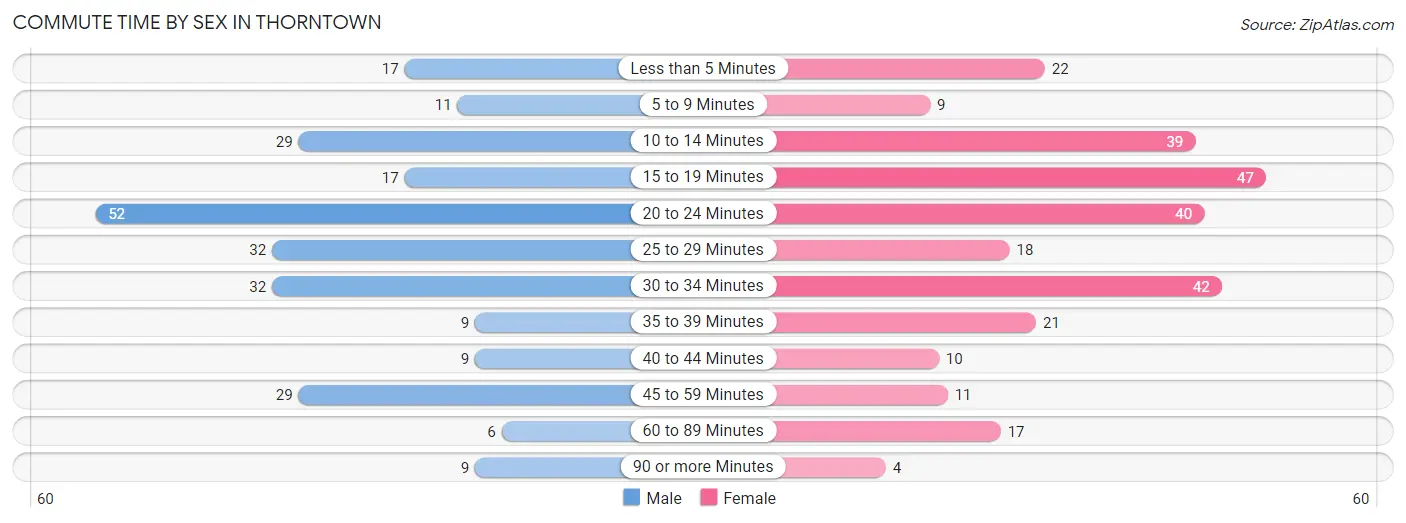
| Commute Time | Male | Female |
| Less than 5 Minutes | 17 (6.8%) | 22 (7.9%) |
| 5 to 9 Minutes | 11 (4.4%) | 9 (3.2%) |
| 10 to 14 Minutes | 29 (11.5%) | 39 (13.9%) |
| 15 to 19 Minutes | 17 (6.8%) | 47 (16.8%) |
| 20 to 24 Minutes | 52 (20.6%) | 40 (14.3%) |
| 25 to 29 Minutes | 32 (12.7%) | 18 (6.4%) |
| 30 to 34 Minutes | 32 (12.7%) | 42 (15.0%) |
| 35 to 39 Minutes | 9 (3.6%) | 21 (7.5%) |
| 40 to 44 Minutes | 9 (3.6%) | 10 (3.6%) |
| 45 to 59 Minutes | 29 (11.5%) | 11 (3.9%) |
| 60 to 89 Minutes | 6 (2.4%) | 17 (6.1%) |
| 90 or more Minutes | 9 (3.6%) | 4 (1.4%) |
Time of Departure to Work by Sex in Thorntown
The most frequent times of departure to work in Thorntown are 12:00 AM to 4:59 AM (52, 20.6%) for males and 6:30 AM to 6:59 AM (49, 17.5%) for females.
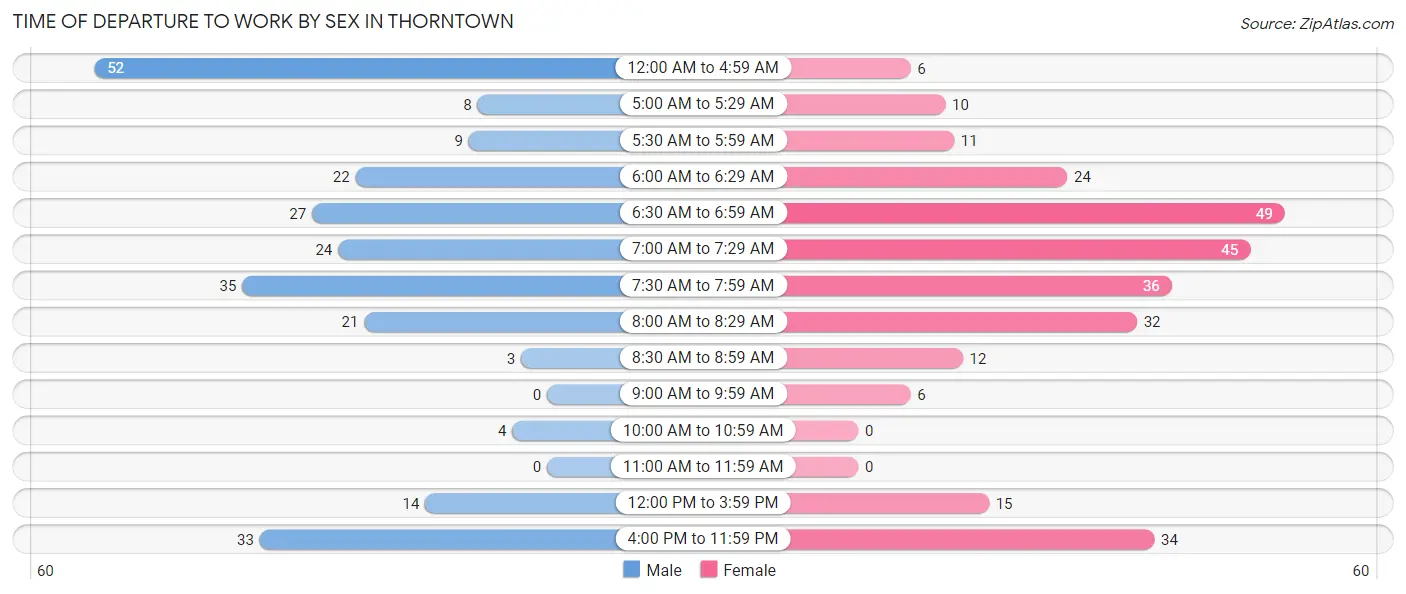
| Time of Departure | Male | Female |
| 12:00 AM to 4:59 AM | 52 (20.6%) | 6 (2.1%) |
| 5:00 AM to 5:29 AM | 8 (3.2%) | 10 (3.6%) |
| 5:30 AM to 5:59 AM | 9 (3.6%) | 11 (3.9%) |
| 6:00 AM to 6:29 AM | 22 (8.7%) | 24 (8.6%) |
| 6:30 AM to 6:59 AM | 27 (10.7%) | 49 (17.5%) |
| 7:00 AM to 7:29 AM | 24 (9.5%) | 45 (16.1%) |
| 7:30 AM to 7:59 AM | 35 (13.9%) | 36 (12.9%) |
| 8:00 AM to 8:29 AM | 21 (8.3%) | 32 (11.4%) |
| 8:30 AM to 8:59 AM | 3 (1.2%) | 12 (4.3%) |
| 9:00 AM to 9:59 AM | 0 (0.0%) | 6 (2.1%) |
| 10:00 AM to 10:59 AM | 4 (1.6%) | 0 (0.0%) |
| 11:00 AM to 11:59 AM | 0 (0.0%) | 0 (0.0%) |
| 12:00 PM to 3:59 PM | 14 (5.6%) | 15 (5.4%) |
| 4:00 PM to 11:59 PM | 33 (13.1%) | 34 (12.1%) |
| Total | 252 (100.0%) | 280 (100.0%) |
Housing Occupancy in Thorntown
Occupancy by Ownership in Thorntown
Of the total 473 dwellings in Thorntown, owner-occupied units account for 332 (70.2%), while renter-occupied units make up 141 (29.8%).
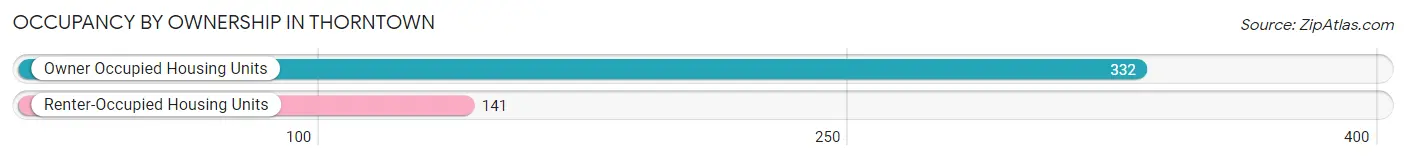
| Occupancy | # Housing Units | % Housing Units |
| Owner Occupied Housing Units | 332 | 70.2% |
| Renter-Occupied Housing Units | 141 | 29.8% |
| Total Occupied Housing Units | 473 | 100.0% |
Occupancy by Household Size in Thorntown
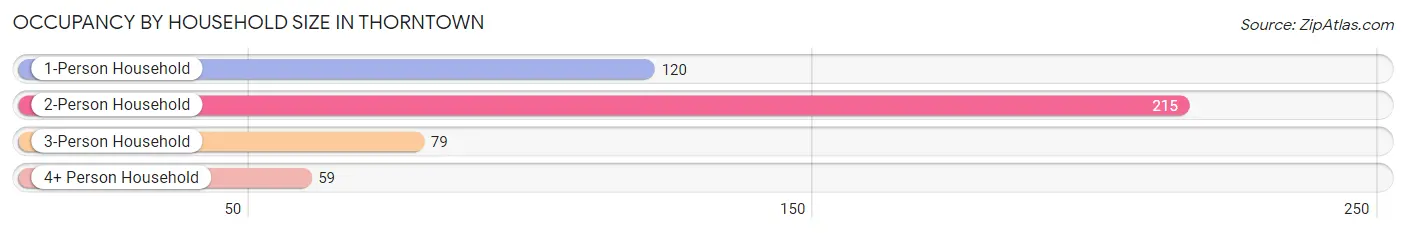
| Household Size | # Housing Units | % Housing Units |
| 1-Person Household | 120 | 25.4% |
| 2-Person Household | 215 | 45.5% |
| 3-Person Household | 79 | 16.7% |
| 4+ Person Household | 59 | 12.5% |
| Total Housing Units | 473 | 100.0% |
Occupancy by Ownership by Household Size in Thorntown
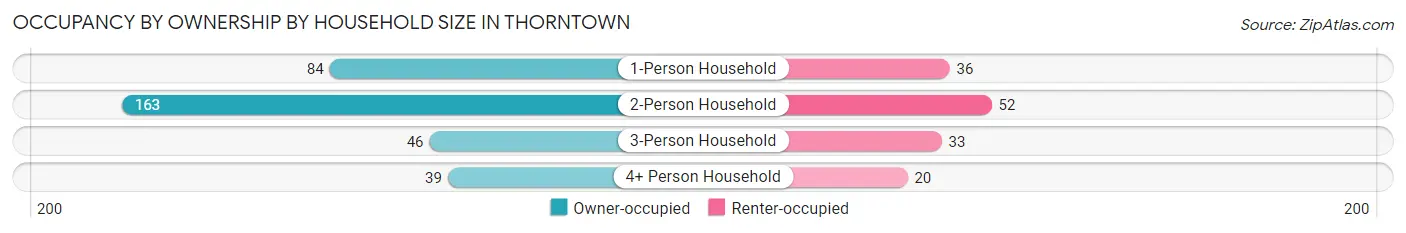
| Household Size | Owner-occupied | Renter-occupied |
| 1-Person Household | 84 (70.0%) | 36 (30.0%) |
| 2-Person Household | 163 (75.8%) | 52 (24.2%) |
| 3-Person Household | 46 (58.2%) | 33 (41.8%) |
| 4+ Person Household | 39 (66.1%) | 20 (33.9%) |
| Total Housing Units | 332 (70.2%) | 141 (29.8%) |
Occupancy by Educational Attainment in Thorntown
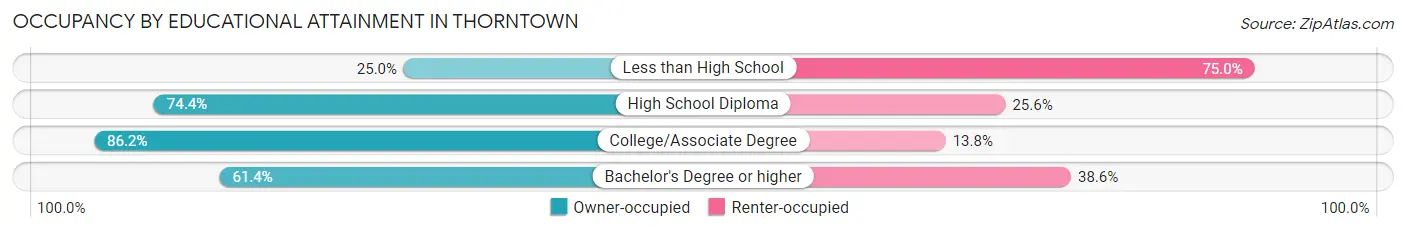
| Household Size | Owner-occupied | Renter-occupied |
| Less than High School | 10 (25.0%) | 30 (75.0%) |
| High School Diploma | 116 (74.4%) | 40 (25.6%) |
| College/Associate Degree | 125 (86.2%) | 20 (13.8%) |
| Bachelor's Degree or higher | 81 (61.4%) | 51 (38.6%) |
Occupancy by Age of Householder in Thorntown
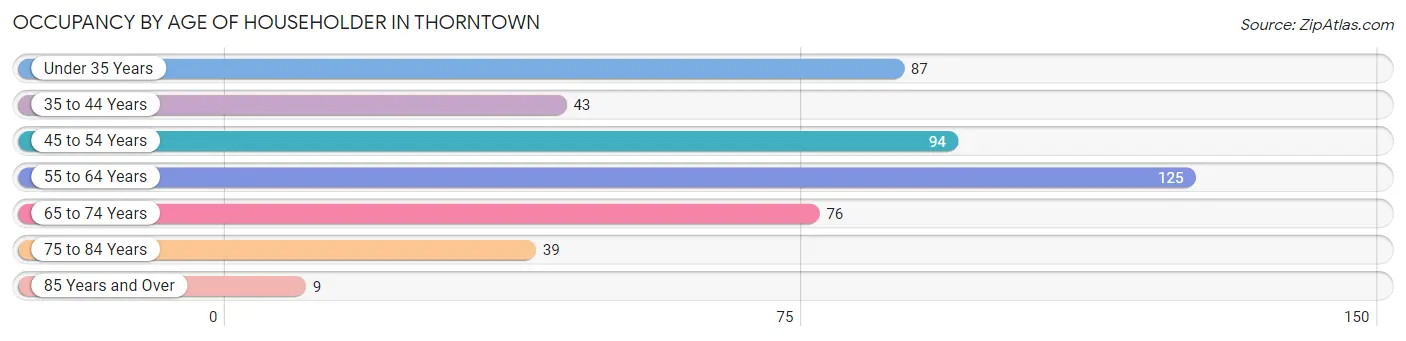
| Age Bracket | # Households | % Households |
| Under 35 Years | 87 | 18.4% |
| 35 to 44 Years | 43 | 9.1% |
| 45 to 54 Years | 94 | 19.9% |
| 55 to 64 Years | 125 | 26.4% |
| 65 to 74 Years | 76 | 16.1% |
| 75 to 84 Years | 39 | 8.3% |
| 85 Years and Over | 9 | 1.9% |
| Total | 473 | 100.0% |
Housing Finances in Thorntown
Median Income by Occupancy in Thorntown
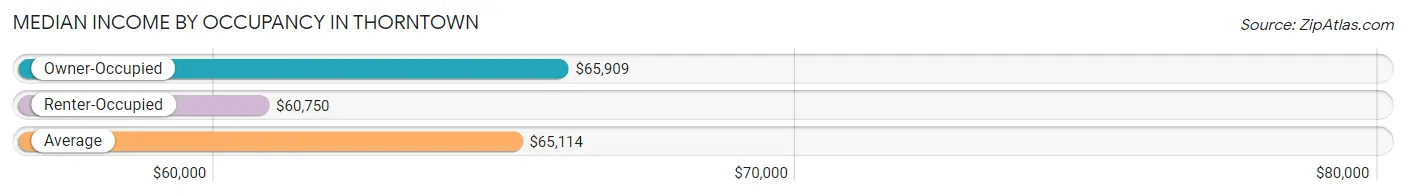
| Occupancy Type | # Households | Median Income |
| Owner-Occupied | 332 (70.2%) | $65,909 |
| Renter-Occupied | 141 (29.8%) | $60,750 |
| Average | 473 (100.0%) | $65,114 |
Occupancy by Householder Income Bracket in Thorntown
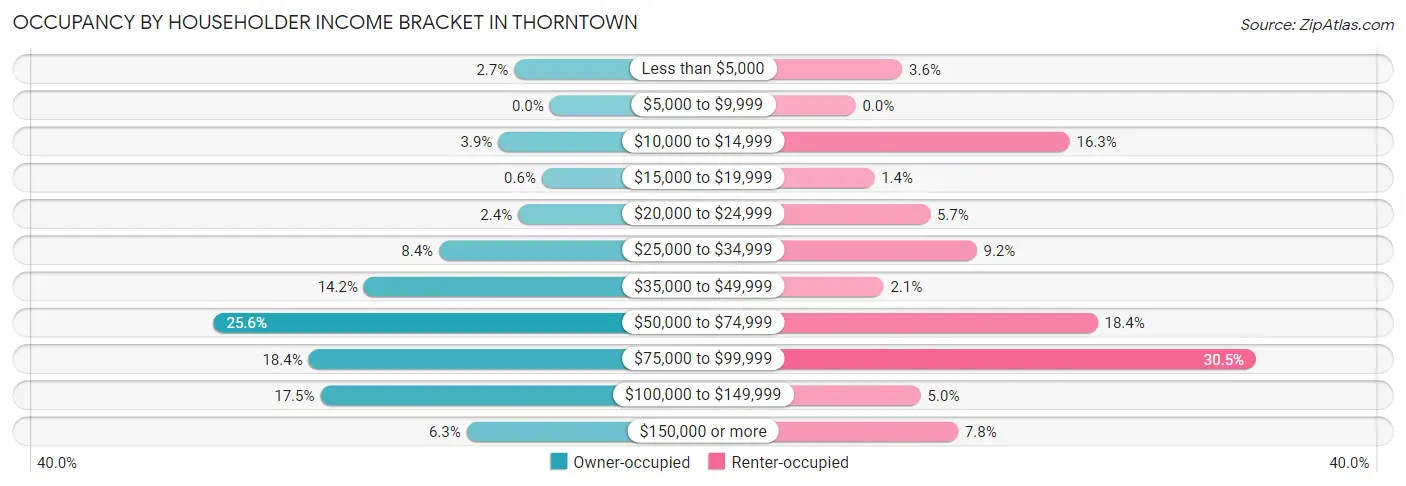
| Income Bracket | Owner-occupied | Renter-occupied |
| Less than $5,000 | 9 (2.7%) | 5 (3.5%) |
| $5,000 to $9,999 | 0 (0.0%) | 0 (0.0%) |
| $10,000 to $14,999 | 13 (3.9%) | 23 (16.3%) |
| $15,000 to $19,999 | 2 (0.6%) | 2 (1.4%) |
| $20,000 to $24,999 | 8 (2.4%) | 8 (5.7%) |
| $25,000 to $34,999 | 28 (8.4%) | 13 (9.2%) |
| $35,000 to $49,999 | 47 (14.2%) | 3 (2.1%) |
| $50,000 to $74,999 | 85 (25.6%) | 26 (18.4%) |
| $75,000 to $99,999 | 61 (18.4%) | 43 (30.5%) |
| $100,000 to $149,999 | 58 (17.5%) | 7 (5.0%) |
| $150,000 or more | 21 (6.3%) | 11 (7.8%) |
| Total | 332 (100.0%) | 141 (100.0%) |
Monthly Housing Cost Tiers in Thorntown
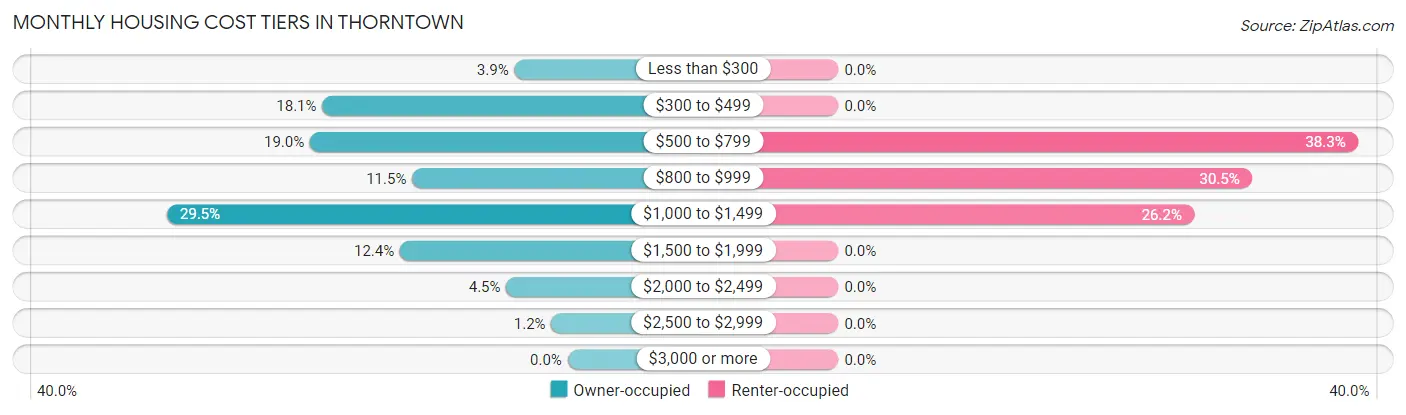
| Monthly Cost | Owner-occupied | Renter-occupied |
| Less than $300 | 13 (3.9%) | 0 (0.0%) |
| $300 to $499 | 60 (18.1%) | 0 (0.0%) |
| $500 to $799 | 63 (19.0%) | 54 (38.3%) |
| $800 to $999 | 38 (11.5%) | 43 (30.5%) |
| $1,000 to $1,499 | 98 (29.5%) | 37 (26.2%) |
| $1,500 to $1,999 | 41 (12.3%) | 0 (0.0%) |
| $2,000 to $2,499 | 15 (4.5%) | 0 (0.0%) |
| $2,500 to $2,999 | 4 (1.2%) | 0 (0.0%) |
| $3,000 or more | 0 (0.0%) | 0 (0.0%) |
| Total | 332 (100.0%) | 141 (100.0%) |
Physical Housing Characteristics in Thorntown
Housing Structures in Thorntown
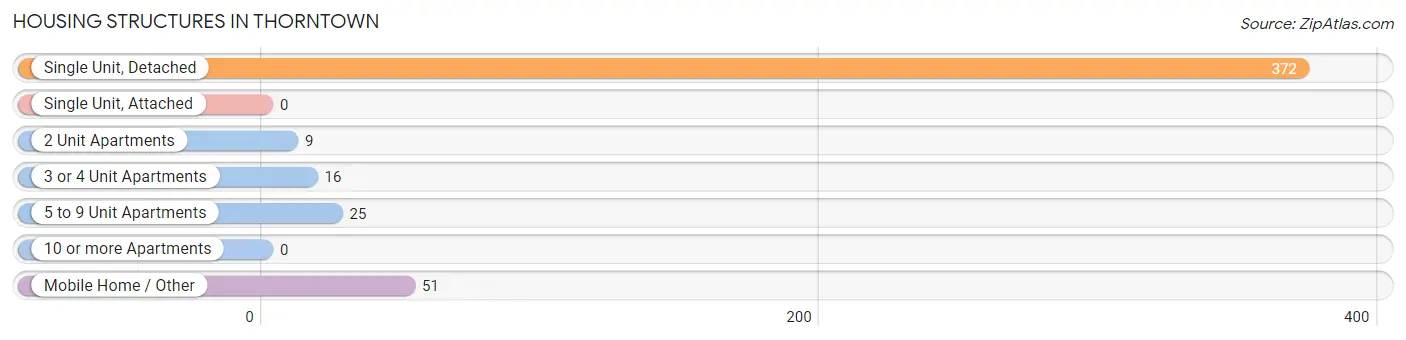
| Structure Type | # Housing Units | % Housing Units |
| Single Unit, Detached | 372 | 78.6% |
| Single Unit, Attached | 0 | 0.0% |
| 2 Unit Apartments | 9 | 1.9% |
| 3 or 4 Unit Apartments | 16 | 3.4% |
| 5 to 9 Unit Apartments | 25 | 5.3% |
| 10 or more Apartments | 0 | 0.0% |
| Mobile Home / Other | 51 | 10.8% |
| Total | 473 | 100.0% |
Housing Structures by Occupancy in Thorntown
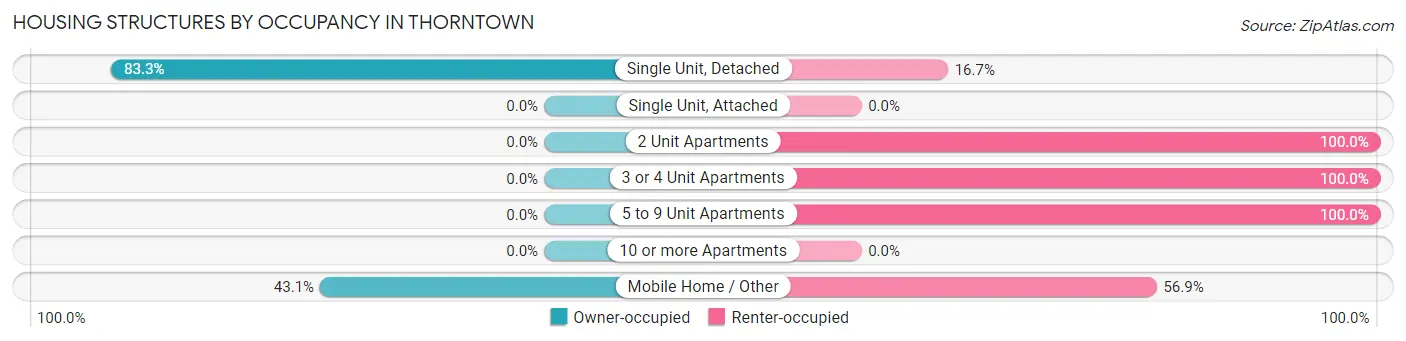
| Structure Type | Owner-occupied | Renter-occupied |
| Single Unit, Detached | 310 (83.3%) | 62 (16.7%) |
| Single Unit, Attached | 0 (0.0%) | 0 (0.0%) |
| 2 Unit Apartments | 0 (0.0%) | 9 (100.0%) |
| 3 or 4 Unit Apartments | 0 (0.0%) | 16 (100.0%) |
| 5 to 9 Unit Apartments | 0 (0.0%) | 25 (100.0%) |
| 10 or more Apartments | 0 (0.0%) | 0 (0.0%) |
| Mobile Home / Other | 22 (43.1%) | 29 (56.9%) |
| Total | 332 (70.2%) | 141 (29.8%) |
Housing Structures by Number of Rooms in Thorntown
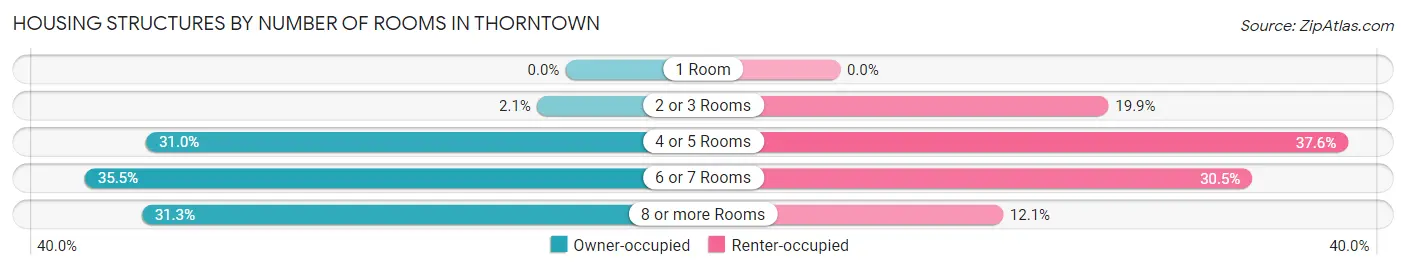
| Number of Rooms | Owner-occupied | Renter-occupied |
| 1 Room | 0 (0.0%) | 0 (0.0%) |
| 2 or 3 Rooms | 7 (2.1%) | 28 (19.9%) |
| 4 or 5 Rooms | 103 (31.0%) | 53 (37.6%) |
| 6 or 7 Rooms | 118 (35.5%) | 43 (30.5%) |
| 8 or more Rooms | 104 (31.3%) | 17 (12.1%) |
| Total | 332 (100.0%) | 141 (100.0%) |
Housing Structure by Heating Type in Thorntown
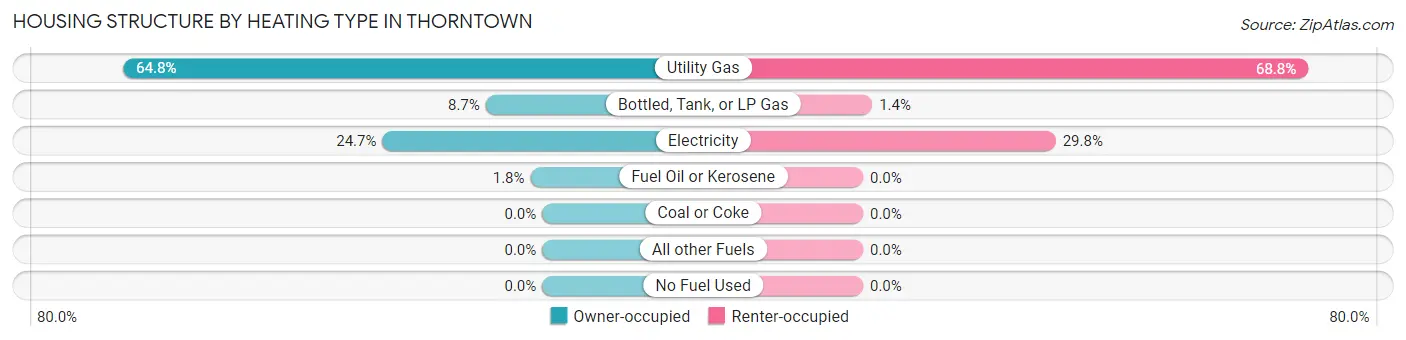
| Heating Type | Owner-occupied | Renter-occupied |
| Utility Gas | 215 (64.8%) | 97 (68.8%) |
| Bottled, Tank, or LP Gas | 29 (8.7%) | 2 (1.4%) |
| Electricity | 82 (24.7%) | 42 (29.8%) |
| Fuel Oil or Kerosene | 6 (1.8%) | 0 (0.0%) |
| Coal or Coke | 0 (0.0%) | 0 (0.0%) |
| All other Fuels | 0 (0.0%) | 0 (0.0%) |
| No Fuel Used | 0 (0.0%) | 0 (0.0%) |
| Total | 332 (100.0%) | 141 (100.0%) |
Household Vehicle Usage in Thorntown
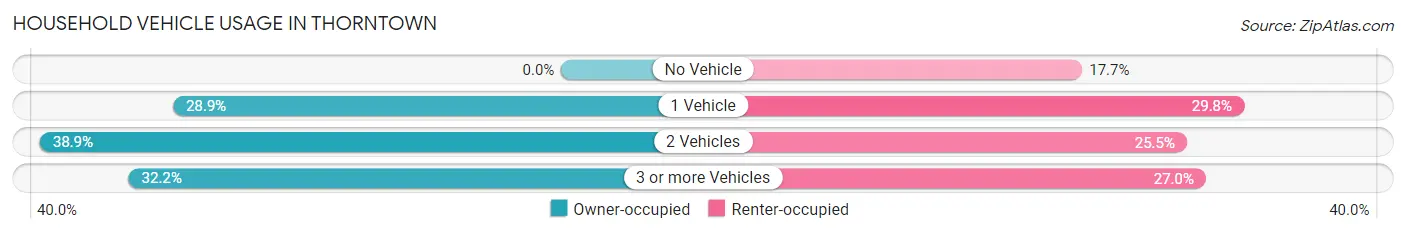
| Vehicles per Household | Owner-occupied | Renter-occupied |
| No Vehicle | 0 (0.0%) | 25 (17.7%) |
| 1 Vehicle | 96 (28.9%) | 42 (29.8%) |
| 2 Vehicles | 129 (38.9%) | 36 (25.5%) |
| 3 or more Vehicles | 107 (32.2%) | 38 (27.0%) |
| Total | 332 (100.0%) | 141 (100.0%) |
Real Estate & Mortgages in Thorntown
Real Estate and Mortgage Overview in Thorntown
| Characteristic | Without Mortgage | With Mortgage |
| Housing Units | 100 | 232 |
| Median Property Value | $116,700 | $176,900 |
| Median Household Income | $69,167 | $18 |
| Monthly Housing Costs | $405 | $0 |
| Real Estate Taxes | $882 | $3 |
Property Value by Mortgage Status in Thorntown
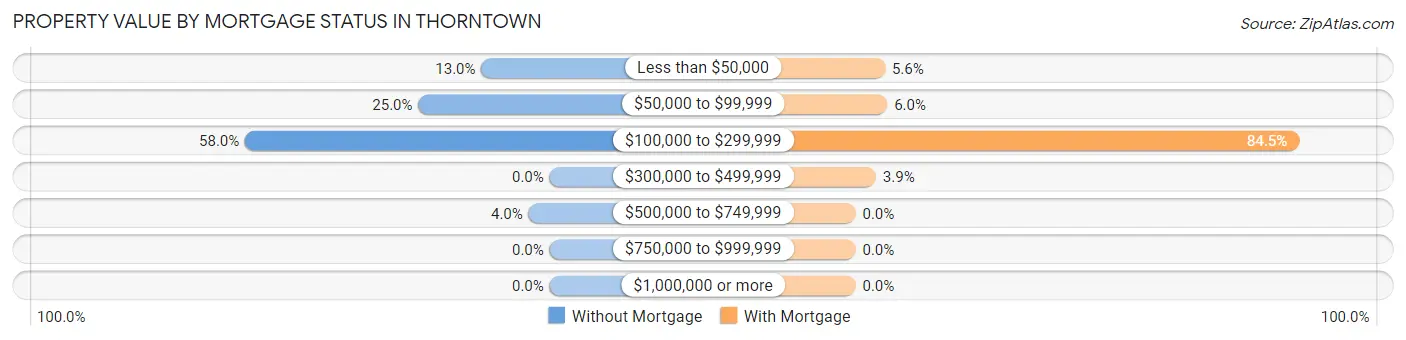
| Property Value | Without Mortgage | With Mortgage |
| Less than $50,000 | 13 (13.0%) | 13 (5.6%) |
| $50,000 to $99,999 | 25 (25.0%) | 14 (6.0%) |
| $100,000 to $299,999 | 58 (58.0%) | 196 (84.5%) |
| $300,000 to $499,999 | 0 (0.0%) | 9 (3.9%) |
| $500,000 to $749,999 | 4 (4.0%) | 0 (0.0%) |
| $750,000 to $999,999 | 0 (0.0%) | 0 (0.0%) |
| $1,000,000 or more | 0 (0.0%) | 0 (0.0%) |
| Total | 100 (100.0%) | 232 (100.0%) |
Household Income by Mortgage Status in Thorntown
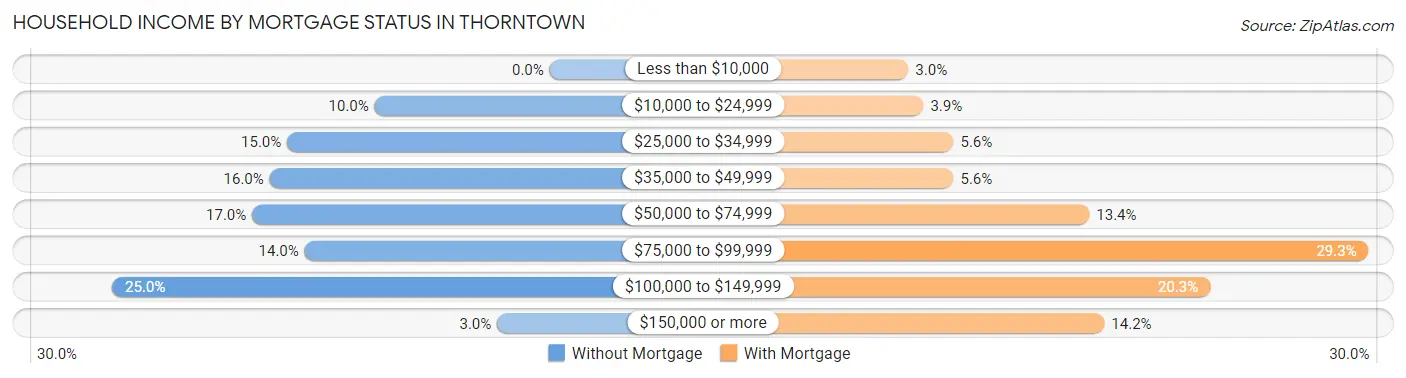
| Household Income | Without Mortgage | With Mortgage |
| Less than $10,000 | 0 (0.0%) | 7 (3.0%) |
| $10,000 to $24,999 | 10 (10.0%) | 9 (3.9%) |
| $25,000 to $34,999 | 15 (15.0%) | 13 (5.6%) |
| $35,000 to $49,999 | 16 (16.0%) | 13 (5.6%) |
| $50,000 to $74,999 | 17 (17.0%) | 31 (13.4%) |
| $75,000 to $99,999 | 14 (14.0%) | 68 (29.3%) |
| $100,000 to $149,999 | 25 (25.0%) | 47 (20.3%) |
| $150,000 or more | 3 (3.0%) | 33 (14.2%) |
| Total | 100 (100.0%) | 232 (100.0%) |
Property Value to Household Income Ratio in Thorntown
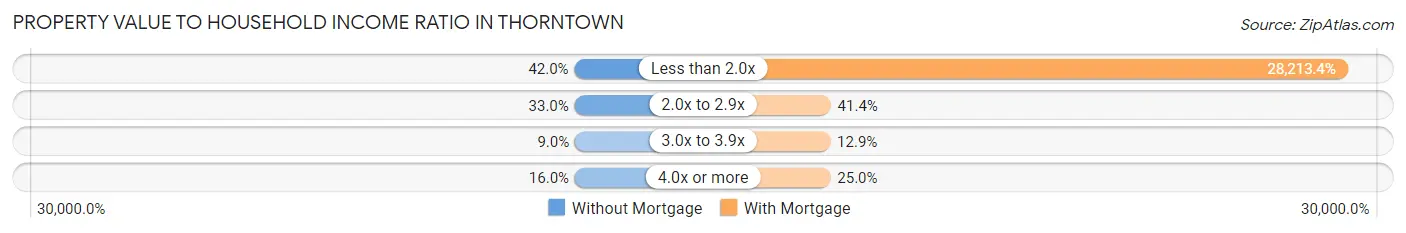
| Value-to-Income Ratio | Without Mortgage | With Mortgage |
| Less than 2.0x | 42 (42.0%) | 65,455 (28,213.4%) |
| 2.0x to 2.9x | 33 (33.0%) | 96 (41.4%) |
| 3.0x to 3.9x | 9 (9.0%) | 30 (12.9%) |
| 4.0x or more | 16 (16.0%) | 58 (25.0%) |
| Total | 100 (100.0%) | 232 (100.0%) |
Real Estate Taxes by Mortgage Status in Thorntown
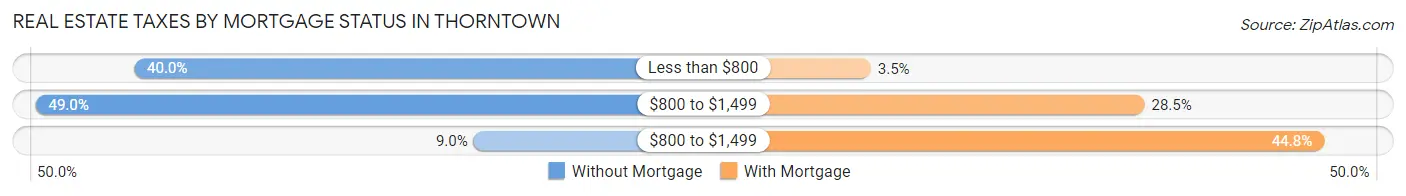
| Property Taxes | Without Mortgage | With Mortgage |
| Less than $800 | 40 (40.0%) | 8 (3.5%) |
| $800 to $1,499 | 49 (49.0%) | 66 (28.4%) |
| $800 to $1,499 | 9 (9.0%) | 104 (44.8%) |
| Total | 100 (100.0%) | 232 (100.0%) |
Health & Disability in Thorntown
Health Insurance Coverage by Age in Thorntown
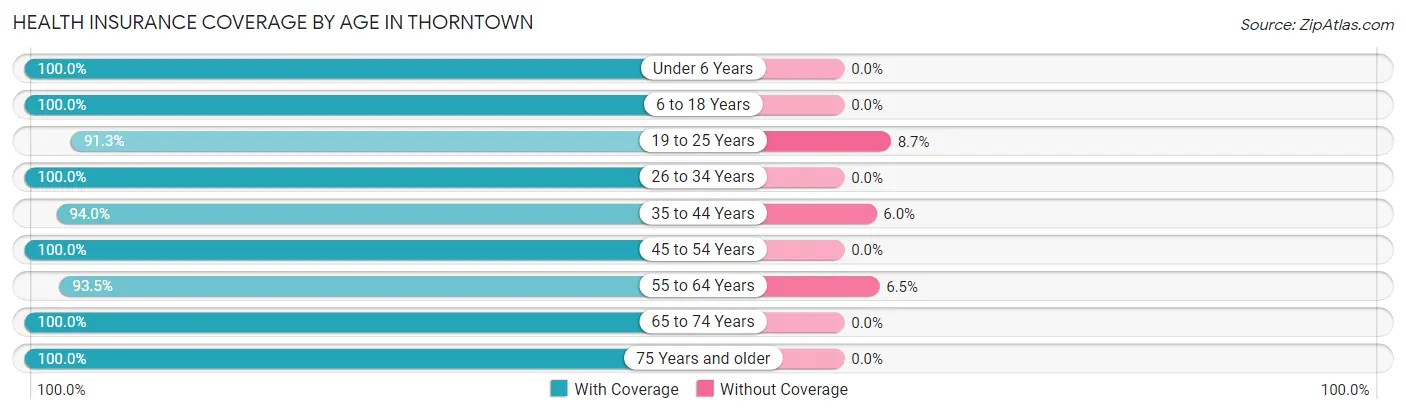
| Age Bracket | With Coverage | Without Coverage |
| Under 6 Years | 50 (100.0%) | 0 (0.0%) |
| 6 to 18 Years | 210 (100.0%) | 0 (0.0%) |
| 19 to 25 Years | 116 (91.3%) | 11 (8.7%) |
| 26 to 34 Years | 97 (100.0%) | 0 (0.0%) |
| 35 to 44 Years | 63 (94.0%) | 4 (6.0%) |
| 45 to 54 Years | 179 (100.0%) | 0 (0.0%) |
| 55 to 64 Years | 172 (93.5%) | 12 (6.5%) |
| 65 to 74 Years | 121 (100.0%) | 0 (0.0%) |
| 75 Years and older | 84 (100.0%) | 0 (0.0%) |
| Total | 1,092 (97.6%) | 27 (2.4%) |
Health Insurance Coverage by Citizenship Status in Thorntown
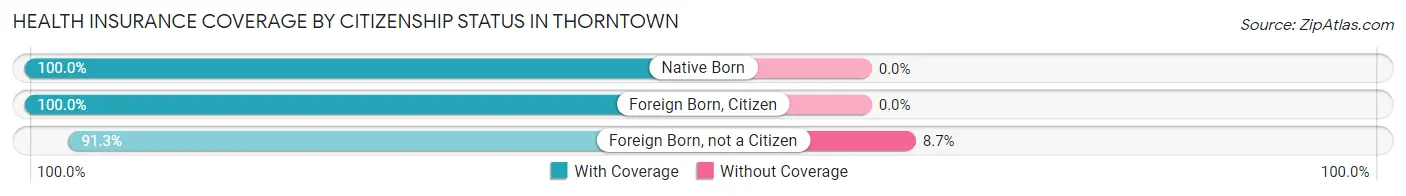
| Citizenship Status | With Coverage | Without Coverage |
| Native Born | 50 (100.0%) | 0 (0.0%) |
| Foreign Born, Citizen | 210 (100.0%) | 0 (0.0%) |
| Foreign Born, not a Citizen | 116 (91.3%) | 11 (8.7%) |
Health Insurance Coverage by Household Income in Thorntown
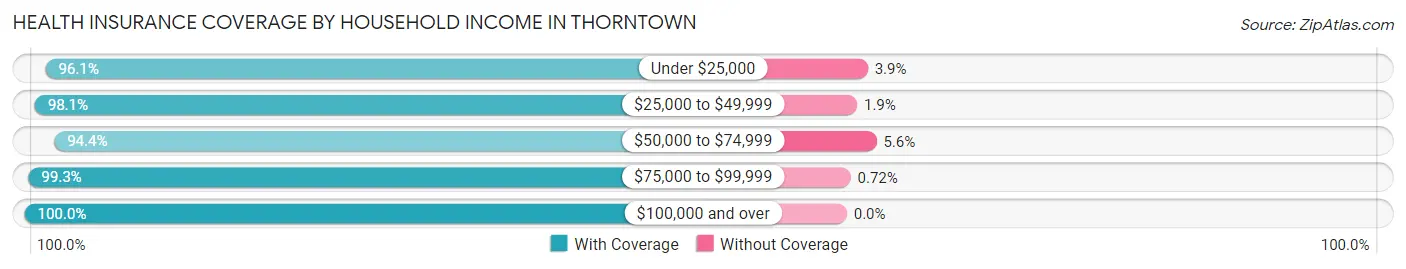
| Household Income | With Coverage | Without Coverage |
| Under $25,000 | 98 (96.1%) | 4 (3.9%) |
| $25,000 to $49,999 | 153 (98.1%) | 3 (1.9%) |
| $50,000 to $74,999 | 306 (94.4%) | 18 (5.6%) |
| $75,000 to $99,999 | 277 (99.3%) | 2 (0.7%) |
| $100,000 and over | 258 (100.0%) | 0 (0.0%) |
Public vs Private Health Insurance Coverage by Age in Thorntown
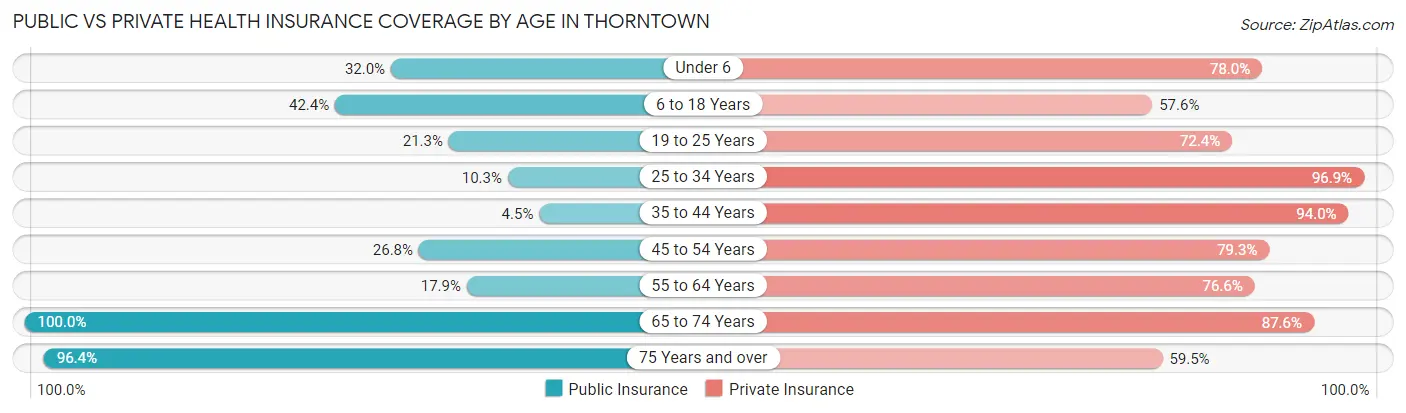
| Age Bracket | Public Insurance | Private Insurance |
| Under 6 | 16 (32.0%) | 39 (78.0%) |
| 6 to 18 Years | 89 (42.4%) | 121 (57.6%) |
| 19 to 25 Years | 27 (21.3%) | 92 (72.4%) |
| 25 to 34 Years | 10 (10.3%) | 94 (96.9%) |
| 35 to 44 Years | 3 (4.5%) | 63 (94.0%) |
| 45 to 54 Years | 48 (26.8%) | 142 (79.3%) |
| 55 to 64 Years | 33 (17.9%) | 141 (76.6%) |
| 65 to 74 Years | 121 (100.0%) | 106 (87.6%) |
| 75 Years and over | 81 (96.4%) | 50 (59.5%) |
| Total | 428 (38.3%) | 848 (75.8%) |
Disability Status by Sex by Age in Thorntown
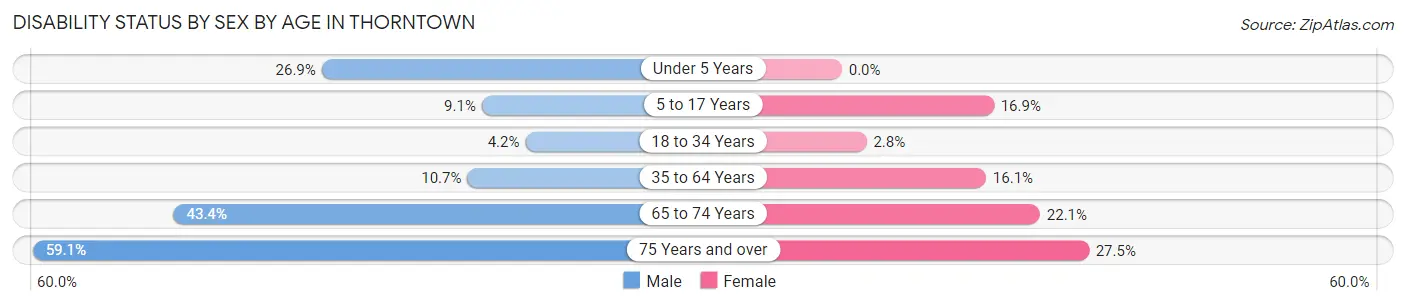
| Age Bracket | Male | Female |
| Under 5 Years | 7 (26.9%) | 0 (0.0%) |
| 5 to 17 Years | 8 (9.1%) | 22 (16.9%) |
| 18 to 34 Years | 5 (4.2%) | 3 (2.8%) |
| 35 to 64 Years | 20 (10.7%) | 39 (16.1%) |
| 65 to 74 Years | 23 (43.4%) | 15 (22.1%) |
| 75 Years and over | 26 (59.1%) | 11 (27.5%) |
Disability Class by Sex by Age in Thorntown
Disability Class: Hearing Difficulty
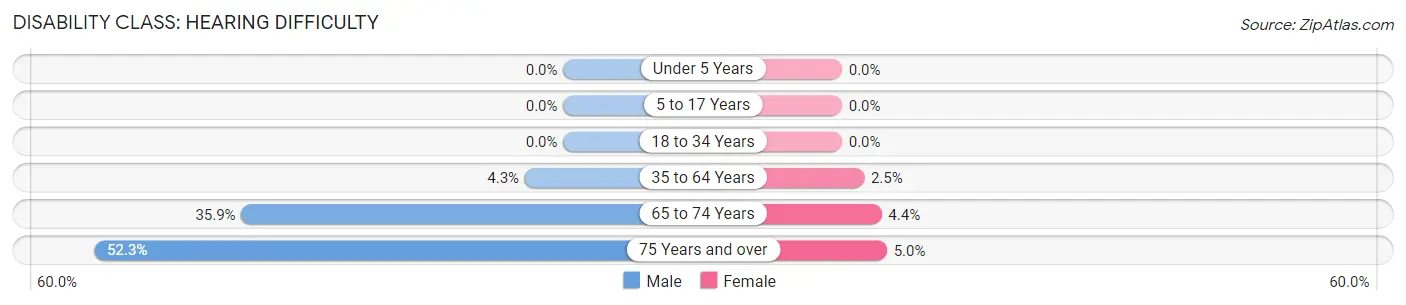
| Age Bracket | Male | Female |
| Under 5 Years | 0 (0.0%) | 0 (0.0%) |
| 5 to 17 Years | 0 (0.0%) | 0 (0.0%) |
| 18 to 34 Years | 0 (0.0%) | 0 (0.0%) |
| 35 to 64 Years | 8 (4.3%) | 6 (2.5%) |
| 65 to 74 Years | 19 (35.8%) | 3 (4.4%) |
| 75 Years and over | 23 (52.3%) | 2 (5.0%) |
Disability Class: Vision Difficulty
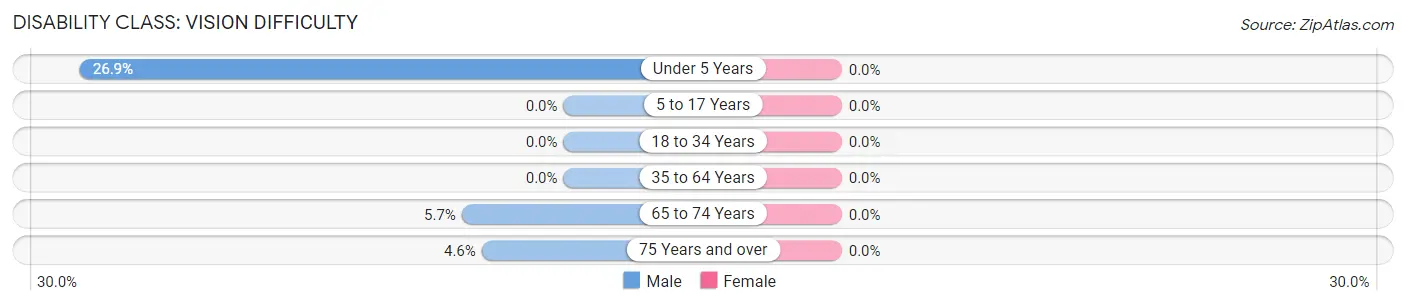
| Age Bracket | Male | Female |
| Under 5 Years | 7 (26.9%) | 0 (0.0%) |
| 5 to 17 Years | 0 (0.0%) | 0 (0.0%) |
| 18 to 34 Years | 0 (0.0%) | 0 (0.0%) |
| 35 to 64 Years | 0 (0.0%) | 0 (0.0%) |
| 65 to 74 Years | 3 (5.7%) | 0 (0.0%) |
| 75 Years and over | 2 (4.5%) | 0 (0.0%) |
Disability Class: Cognitive Difficulty
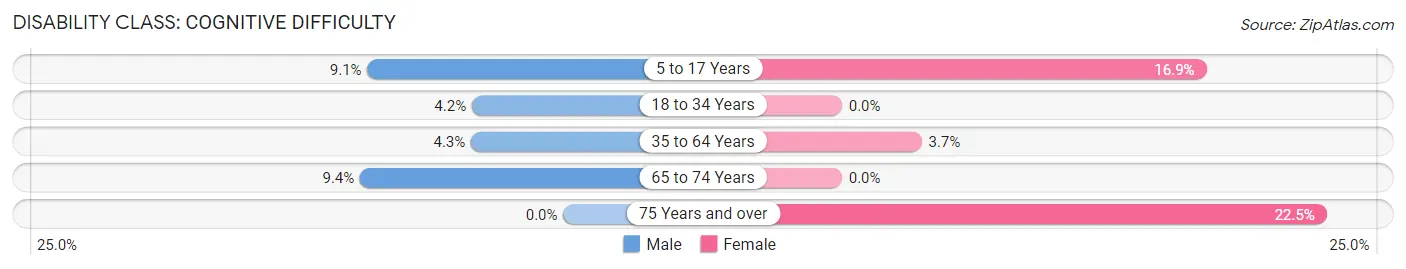
| Age Bracket | Male | Female |
| 5 to 17 Years | 8 (9.1%) | 22 (16.9%) |
| 18 to 34 Years | 5 (4.2%) | 0 (0.0%) |
| 35 to 64 Years | 8 (4.3%) | 9 (3.7%) |
| 65 to 74 Years | 5 (9.4%) | 0 (0.0%) |
| 75 Years and over | 0 (0.0%) | 9 (22.5%) |
Disability Class: Ambulatory Difficulty
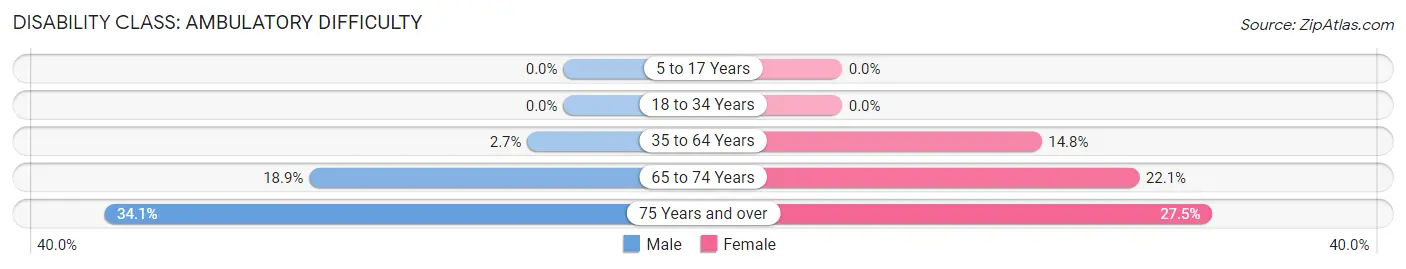
| Age Bracket | Male | Female |
| 5 to 17 Years | 0 (0.0%) | 0 (0.0%) |
| 18 to 34 Years | 0 (0.0%) | 0 (0.0%) |
| 35 to 64 Years | 5 (2.7%) | 36 (14.8%) |
| 65 to 74 Years | 10 (18.9%) | 15 (22.1%) |
| 75 Years and over | 15 (34.1%) | 11 (27.5%) |
Disability Class: Self-Care Difficulty
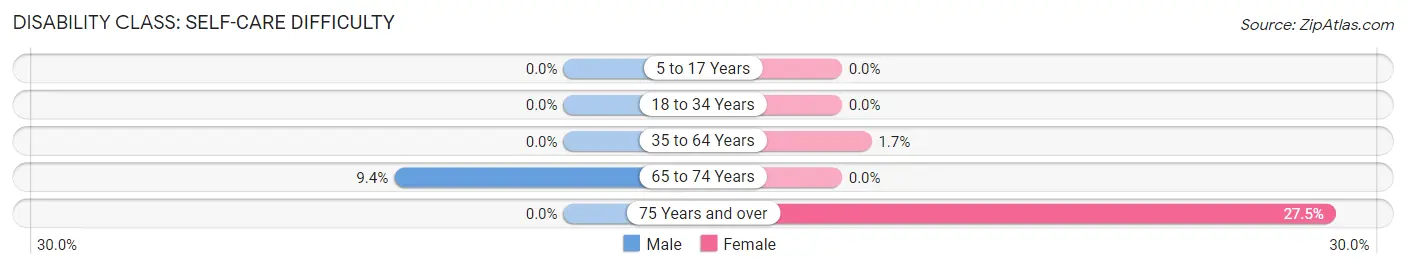
| Age Bracket | Male | Female |
| 5 to 17 Years | 0 (0.0%) | 0 (0.0%) |
| 18 to 34 Years | 0 (0.0%) | 0 (0.0%) |
| 35 to 64 Years | 0 (0.0%) | 4 (1.7%) |
| 65 to 74 Years | 5 (9.4%) | 0 (0.0%) |
| 75 Years and over | 0 (0.0%) | 11 (27.5%) |
Technology Access in Thorntown
Computing Device Access in Thorntown
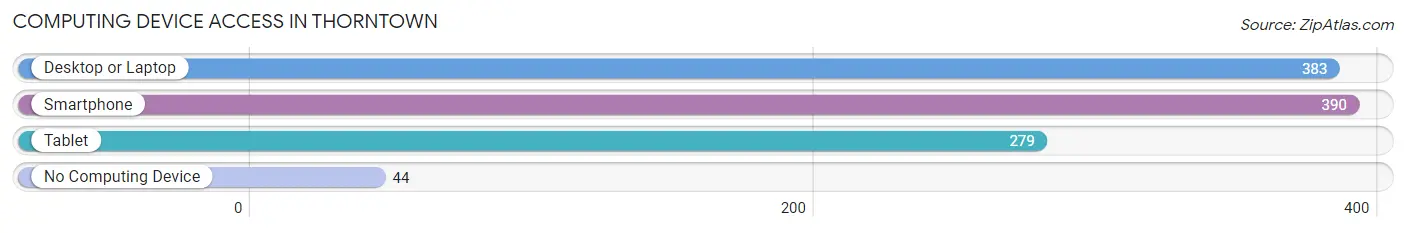
| Device Type | # Households | % Households |
| Desktop or Laptop | 383 | 81.0% |
| Smartphone | 390 | 82.5% |
| Tablet | 279 | 59.0% |
| No Computing Device | 44 | 9.3% |
| Total | 473 | 100.0% |
Internet Access in Thorntown
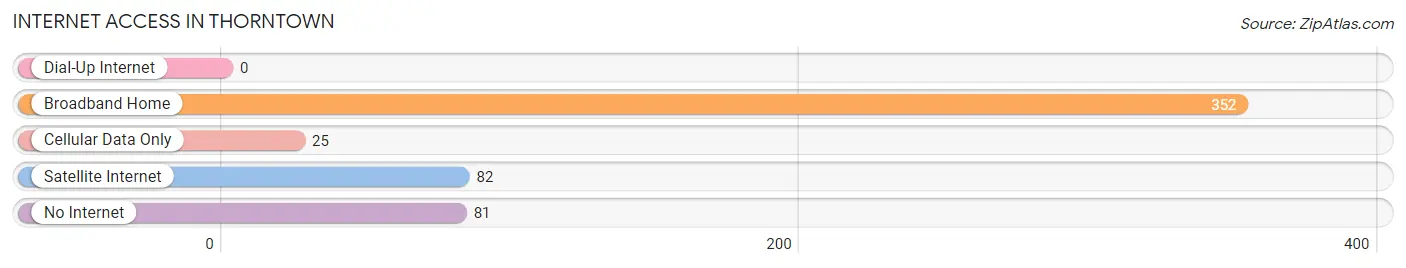
| Internet Type | # Households | % Households |
| Dial-Up Internet | 0 | 0.0% |
| Broadband Home | 352 | 74.4% |
| Cellular Data Only | 25 | 5.3% |
| Satellite Internet | 82 | 17.3% |
| No Internet | 81 | 17.1% |
| Total | 473 | 100.0% |
Thorntown Summary
Thortown, Indiana is a small town located in Boone County, Indiana. It is situated about 25 miles northwest of Indianapolis and is part of the Lebanon Metropolitan Statistical Area. The town was founded in 1832 and has a population of approximately 1,400 people.
History
Thortown was founded in 1832 by William Thorn, a Quaker from North Carolina. He purchased the land from the government and named it after himself. The town was originally a farming community, but it soon became a center for manufacturing and industry. The first factory in Thortown was a woolen mill, which was built in 1845. The town also had a sawmill, a gristmill, and a blacksmith shop.
In the late 19th century, Thortown became a popular tourist destination. The town was known for its mineral springs, which were believed to have healing properties. The springs attracted visitors from all over the country, and the town became known as the “Spa of the Midwest.”
In the early 20th century, Thortown began to decline. The mineral springs dried up, and the factories closed. The town was hit hard by the Great Depression, and many of its residents moved away.
Geography
Thortown is located in Boone County, Indiana. It is situated about 25 miles northwest of Indianapolis. The town is located on the banks of the Big Blue River, which flows through the town. The town is surrounded by rolling hills and farmland.
Economy
Thortown’s economy is largely based on agriculture. The town is home to several farms, which produce corn, soybeans, and wheat. The town also has a few small businesses, including a grocery store, a hardware store, and a few restaurants.
Demographics
As of the 2010 census, Thortown had a population of 1,400 people. The town is predominantly white, with about 95% of the population being Caucasian. The median household income is $45,000, and the median home value is $125,000.
Thortown is a small town with a rich history and a strong sense of community. The town is home to many friendly people who are proud of their town and its history. The town is a great place to live, work, and raise a family.
Common Questions
What is Per Capita Income in Thorntown?
Per Capita income in Thorntown is $31,658.
What is the Median Family Income in Thorntown?
Median Family Income in Thorntown is $70,833.
What is the Median Household income in Thorntown?
Median Household Income in Thorntown is $65,114.
What is Income or Wage Gap in Thorntown?
Income or Wage Gap in Thorntown is 19.8%.
Women in Thorntown earn 80.2 cents for every dollar earned by a man.
What is Family Income Deficit in Thorntown?
Family Income Deficit in Thorntown is $7,287.
Families that are below poverty line in Thorntown earn $7,287 less on average than the poverty threshold level.
What is Inequality or Gini Index in Thorntown?
Inequality or Gini Index in Thorntown is 0.37.
What is the Total Population of Thorntown?
Total Population of Thorntown is 1,119.
What is the Total Male Population of Thorntown?
Total Male Population of Thorntown is 516.
What is the Total Female Population of Thorntown?
Total Female Population of Thorntown is 603.
What is the Ratio of Males per 100 Females in Thorntown?
There are 85.57 Males per 100 Females in Thorntown.
What is the Ratio of Females per 100 Males in Thorntown?
There are 116.86 Females per 100 Males in Thorntown.
What is the Median Population Age in Thorntown?
Median Population Age in Thorntown is 46.1 Years.
What is the Average Family Size in Thorntown
Average Family Size in Thorntown is 2.9 People.
What is the Average Household Size in Thorntown
Average Household Size in Thorntown is 2.4 People.
How Large is the Labor Force in Thorntown?
There are 589 People in the Labor Forcein in Thorntown.
What is the Percentage of People in the Labor Force in Thorntown?
65.2% of People are in the Labor Force in Thorntown.
What is the Unemployment Rate in Thorntown?
Unemployment Rate in Thorntown is 1.2%.