Crothersville, IN Map & Demographics
Crothersville Map
Crothersville Overview
$22,887
PER CAPITA INCOME
$67,361
AVG FAMILY INCOME
$50,875
AVG HOUSEHOLD INCOME
20.2%
WAGE / INCOME GAP [ % ]
79.8¢/ $1
WAGE / INCOME GAP [ $ ]
0.43
INEQUALITY / GINI INDEX
1,796
TOTAL POPULATION
885
MALE POPULATION
911
FEMALE POPULATION
97.15
MALES / 100 FEMALES
102.94
FEMALES / 100 MALES
32.8
MEDIAN AGE
3.6
AVG FAMILY SIZE
3.0
AVG HOUSEHOLD SIZE
656
LABOR FORCE [ PEOPLE ]
48.0%
PERCENT IN LABOR FORCE
1.8%
UNEMPLOYMENT RATE
Crothersville Zip Codes
Crothersville Area Codes
Income in Crothersville
Income Overview in Crothersville
Per Capita Income in Crothersville is $22,887, while median incomes of families and households are $67,361 and $50,875 respectively.
| Characteristic | Number | Measure |
| Per Capita Income | 1,796 | $22,887 |
| Median Family Income | 434 | $67,361 |
| Mean Family Income | 434 | $81,201 |
| Median Household Income | 609 | $50,875 |
| Mean Household Income | 609 | $67,387 |
| Income Deficit | 434 | $0 |
| Wage / Income Gap (%) | 1,796 | 20.17% |
| Wage / Income Gap ($) | 1,796 | 79.83¢ per $1 |
| Gini / Inequality Index | 1,796 | 0.43 |
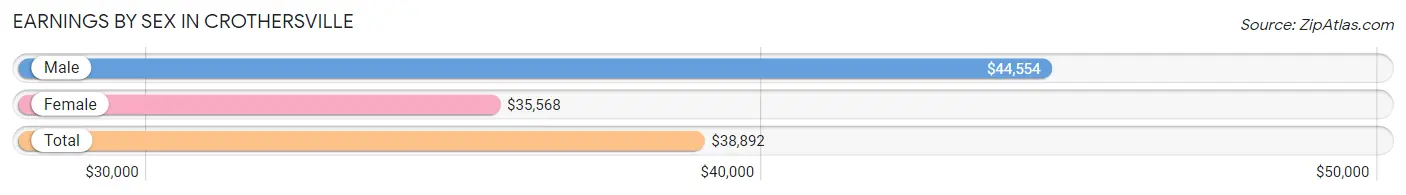
Earnings by Sex in Crothersville
Average Earnings in Crothersville are $38,892, $44,554 for men and $35,568 for women, a difference of 20.2%.
| Sex | Number | Average Earnings |
| Male | 357 (52.3%) | $44,554 |
| Female | 326 (47.7%) | $35,568 |
| Total | 683 (100.0%) | $38,892 |
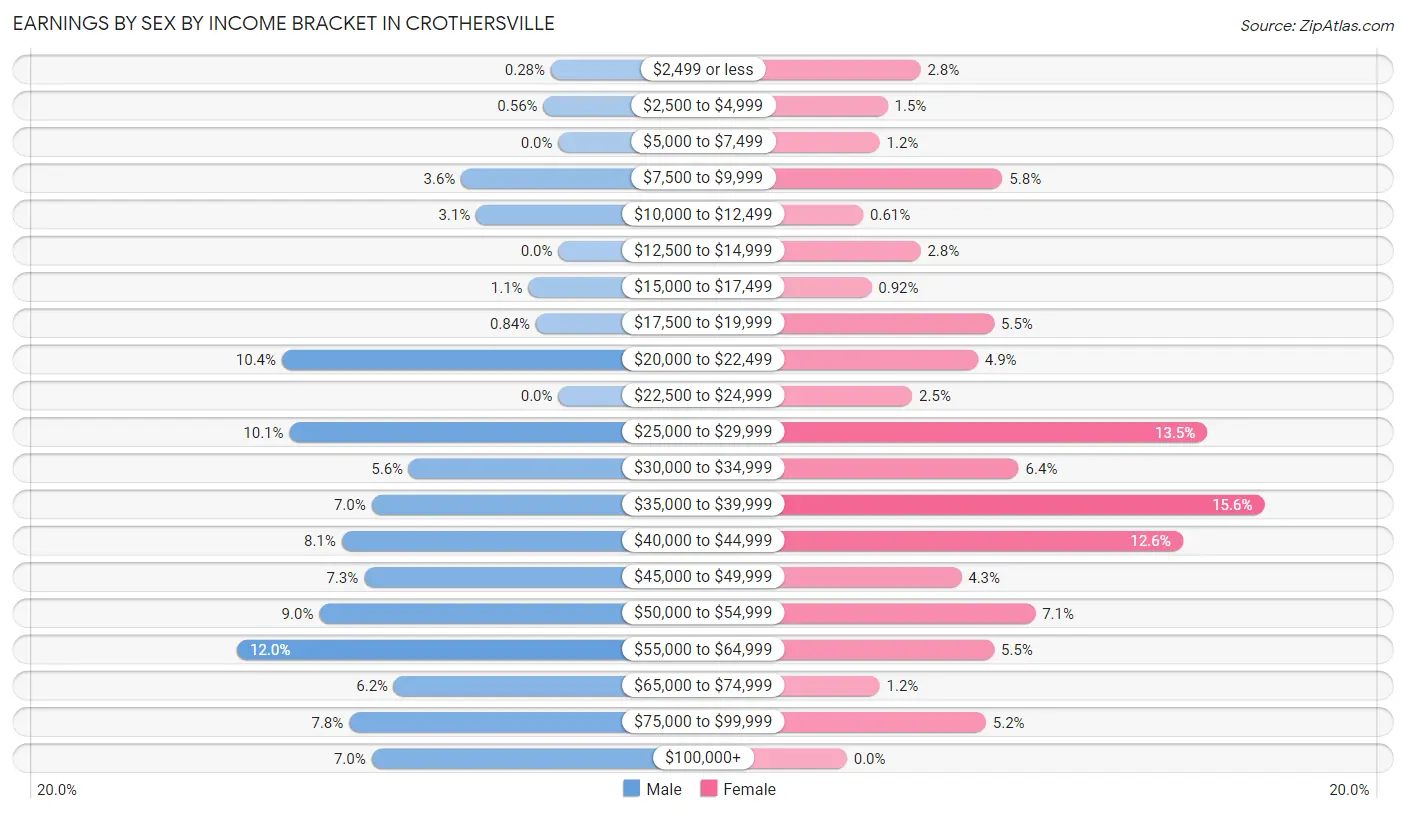
Earnings by Sex by Income Bracket in Crothersville
The most common earnings brackets in Crothersville are $55,000 to $64,999 for men (43 | 12.0%) and $35,000 to $39,999 for women (51 | 15.6%).
| Income | Male | Female |
| $2,499 or less | 1 (0.3%) | 9 (2.8%) |
| $2,500 to $4,999 | 2 (0.6%) | 5 (1.5%) |
| $5,000 to $7,499 | 0 (0.0%) | 4 (1.2%) |
| $7,500 to $9,999 | 13 (3.6%) | 19 (5.8%) |
| $10,000 to $12,499 | 11 (3.1%) | 2 (0.6%) |
| $12,500 to $14,999 | 0 (0.0%) | 9 (2.8%) |
| $15,000 to $17,499 | 4 (1.1%) | 3 (0.9%) |
| $17,500 to $19,999 | 3 (0.8%) | 18 (5.5%) |
| $20,000 to $22,499 | 37 (10.4%) | 16 (4.9%) |
| $22,500 to $24,999 | 0 (0.0%) | 8 (2.5%) |
| $25,000 to $29,999 | 36 (10.1%) | 44 (13.5%) |
| $30,000 to $34,999 | 20 (5.6%) | 21 (6.4%) |
| $35,000 to $39,999 | 25 (7.0%) | 51 (15.6%) |
| $40,000 to $44,999 | 29 (8.1%) | 41 (12.6%) |
| $45,000 to $49,999 | 26 (7.3%) | 14 (4.3%) |
| $50,000 to $54,999 | 32 (9.0%) | 23 (7.1%) |
| $55,000 to $64,999 | 43 (12.0%) | 18 (5.5%) |
| $65,000 to $74,999 | 22 (6.2%) | 4 (1.2%) |
| $75,000 to $99,999 | 28 (7.8%) | 17 (5.2%) |
| $100,000+ | 25 (7.0%) | 0 (0.0%) |
| Total | 357 (100.0%) | 326 (100.0%) |
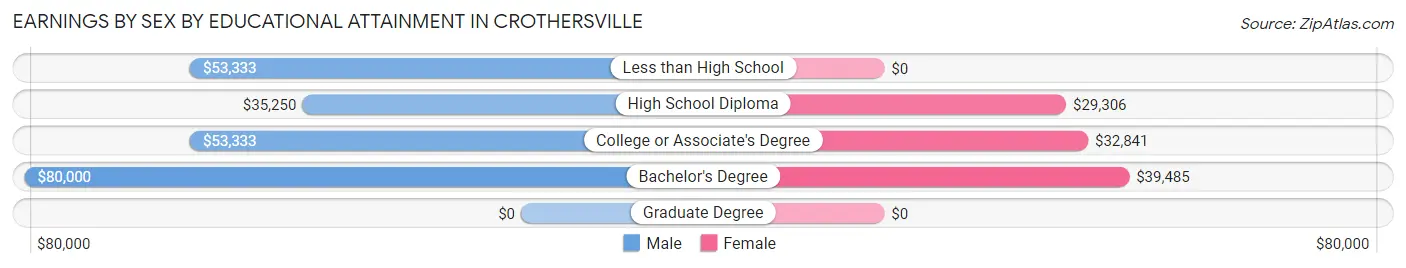
Earnings by Sex by Educational Attainment in Crothersville
Average earnings in Crothersville are $46,161 for men and $36,125 for women, a difference of 21.7%. Men with an educational attainment of bachelor's degree enjoy the highest average annual earnings of $80,000, while those with high school diploma education earn the least with $35,250. Women with an educational attainment of bachelor's degree earn the most with the average annual earnings of $39,485, while those with high school diploma education have the smallest earnings of $29,306.
| Educational Attainment | Male Income | Female Income |
| Less than High School | $53,333 | $0 |
| High School Diploma | $35,250 | $29,306 |
| College or Associate's Degree | $53,333 | $32,841 |
| Bachelor's Degree | $80,000 | $39,485 |
| Graduate Degree | - | - |
| Total | $46,161 | $36,125 |
Family Income in Crothersville
Family Income Brackets in Crothersville
According to the Crothersville family income data, there are 103 families falling into the $50,000 to $74,999 income range, which is the most common income bracket and makes up 23.7% of all families.
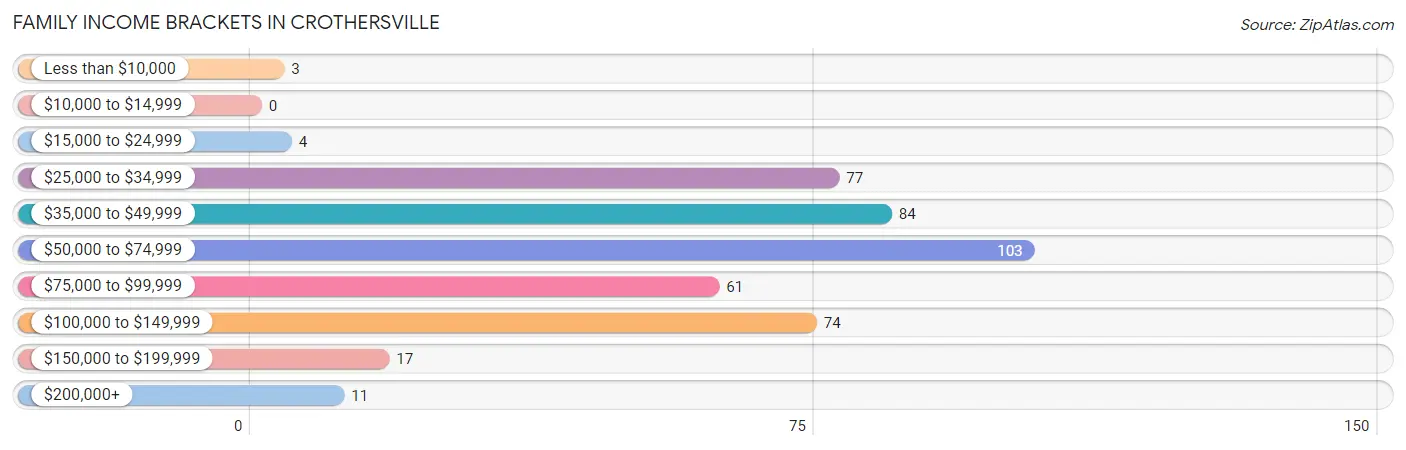
| Income Bracket | # Families | % Families |
| Less than $10,000 | 3 | 0.7% |
| $10,000 to $14,999 | 0 | 0.0% |
| $15,000 to $24,999 | 4 | 0.9% |
| $25,000 to $34,999 | 77 | 17.7% |
| $35,000 to $49,999 | 84 | 19.4% |
| $50,000 to $74,999 | 103 | 23.7% |
| $75,000 to $99,999 | 61 | 14.1% |
| $100,000 to $149,999 | 74 | 17.1% |
| $150,000 to $199,999 | 17 | 3.9% |
| $200,000+ | 11 | 2.5% |
Family Income by Famaliy Size in Crothersville
3-person families (114 | 26.3%) account for the highest median family income in Crothersville with $68,846 per family, while 2-person families (138 | 31.8%) have the highest median income of $25,750 per family member.
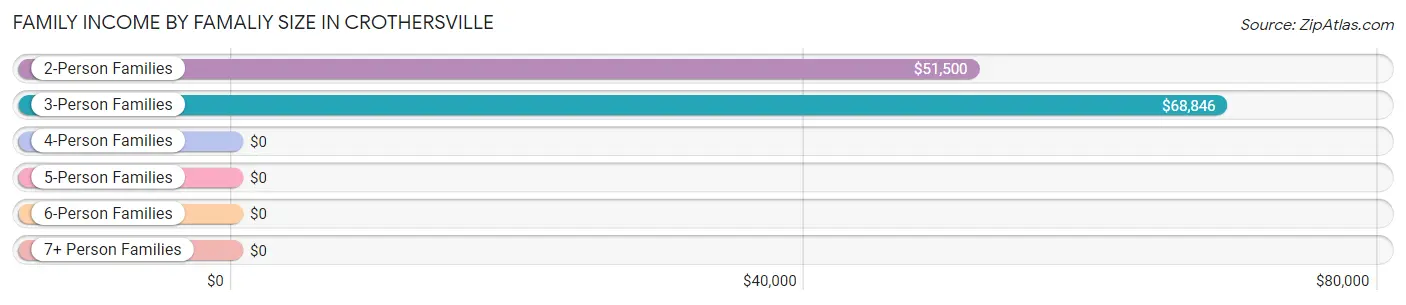
| Income Bracket | # Families | Median Income |
| 2-Person Families | 138 (31.8%) | $51,500 |
| 3-Person Families | 114 (26.3%) | $68,846 |
| 4-Person Families | 105 (24.2%) | $0 |
| 5-Person Families | 28 (6.5%) | $0 |
| 6-Person Families | 16 (3.7%) | $0 |
| 7+ Person Families | 33 (7.6%) | $0 |
| Total | 434 (100.0%) | $67,361 |
Family Income by Number of Earners in Crothersville
The median family income in Crothersville is $67,361, with families comprising 3+ earners (19) having the highest median family income of $191,563, while families with no earners (59) have the lowest median family income of $36,875, accounting for 4.4% and 13.6% of families, respectively.
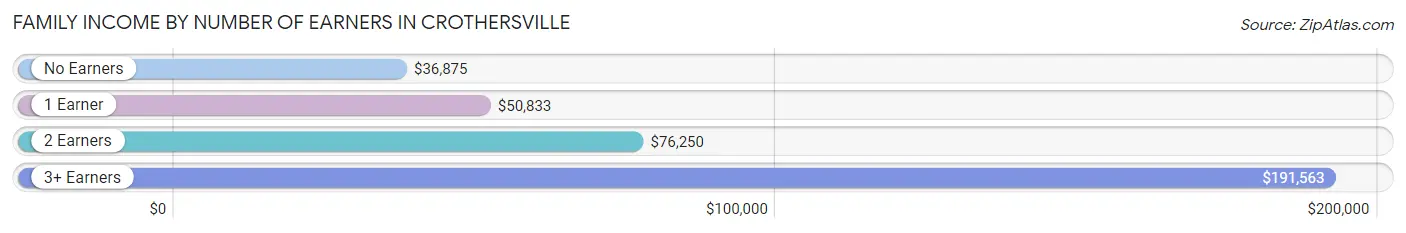
| Number of Earners | # Families | Median Income |
| No Earners | 59 (13.6%) | $36,875 |
| 1 Earner | 174 (40.1%) | $50,833 |
| 2 Earners | 182 (41.9%) | $76,250 |
| 3+ Earners | 19 (4.4%) | $191,563 |
| Total | 434 (100.0%) | $67,361 |
Household Income in Crothersville
Household Income Brackets in Crothersville
With 137 households falling in the category, the $35,000 to $49,999 income range is the most frequent in Crothersville, accounting for 22.5% of all households. In contrast, only 11 households (1.8%) fall into the $200,000+ income bracket, making it the least populous group.
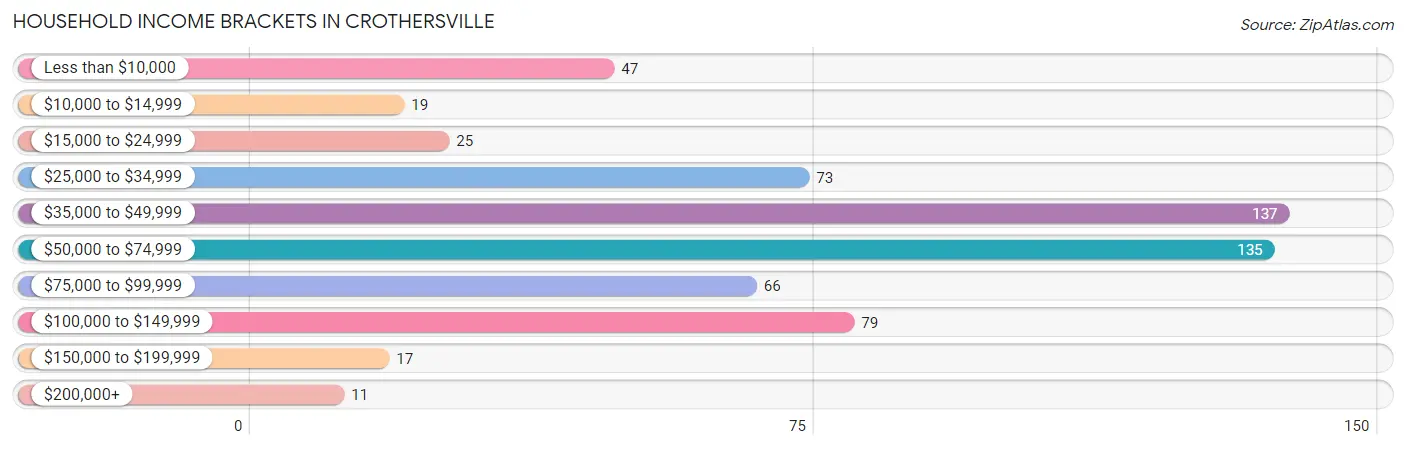
| Income Bracket | # Households | % Households |
| Less than $10,000 | 47 | 7.7% |
| $10,000 to $14,999 | 19 | 3.1% |
| $15,000 to $24,999 | 25 | 4.1% |
| $25,000 to $34,999 | 73 | 12.0% |
| $35,000 to $49,999 | 137 | 22.5% |
| $50,000 to $74,999 | 135 | 22.2% |
| $75,000 to $99,999 | 66 | 10.8% |
| $100,000 to $149,999 | 79 | 13.0% |
| $150,000 to $199,999 | 17 | 2.8% |
| $200,000+ | 11 | 1.8% |
Household Income by Householder Age in Crothersville
The median household income in Crothersville is $50,875, with the highest median household income of $70,833 found in the 45 to 64 years age bracket for the primary householder. A total of 224 households (36.8%) fall into this category. Meanwhile, the 15 to 24 years age bracket for the primary householder has the lowest median household income of $0, with 20 households (3.3%) in this group.
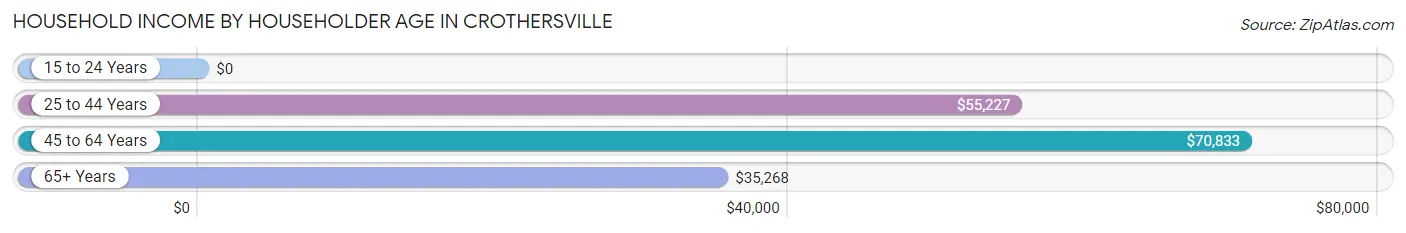
| Income Bracket | # Households | Median Income |
| 15 to 24 Years | 20 (3.3%) | $0 |
| 25 to 44 Years | 208 (34.2%) | $55,227 |
| 45 to 64 Years | 224 (36.8%) | $70,833 |
| 65+ Years | 157 (25.8%) | $35,268 |
| Total | 609 (100.0%) | $50,875 |
Poverty in Crothersville
Income Below Poverty by Sex and Age in Crothersville
With 24.4% poverty level for males and 22.3% for females among the residents of Crothersville, 16 and 17 year old males and 18 to 24 year old females are the most vulnerable to poverty, with 70 males (62.5%) and 54 females (46.6%) in their respective age groups living below the poverty level.
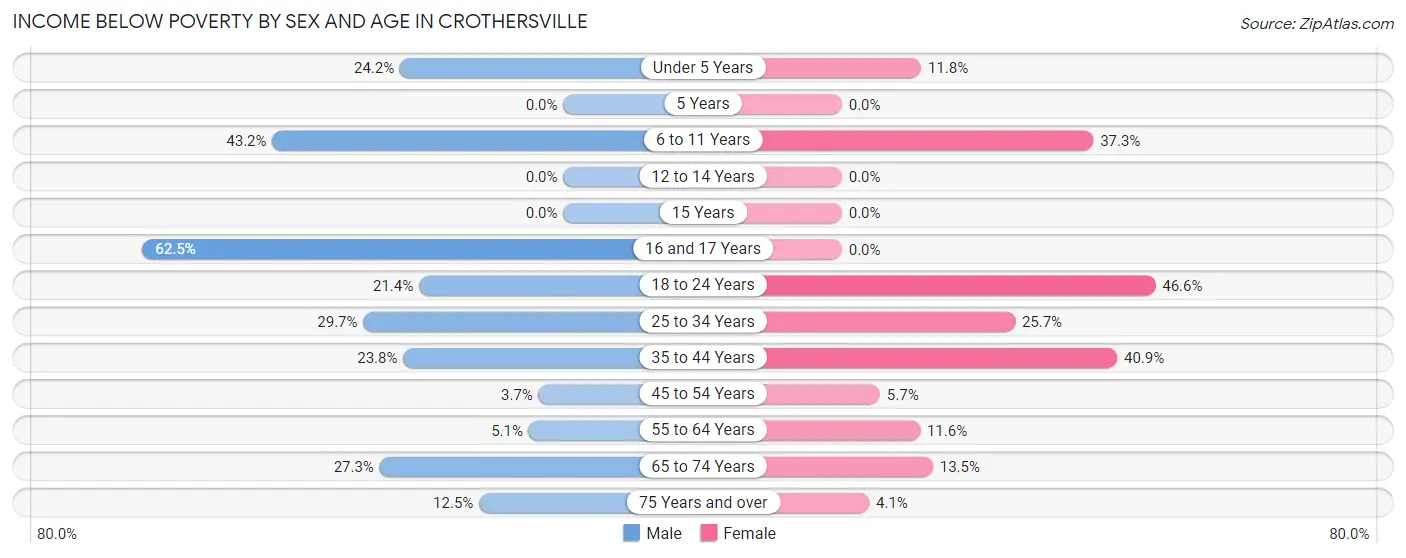
| Age Bracket | Male | Female |
| Under 5 Years | 16 (24.2%) | 8 (11.8%) |
| 5 Years | 0 (0.0%) | 0 (0.0%) |
| 6 to 11 Years | 35 (43.2%) | 28 (37.3%) |
| 12 to 14 Years | 0 (0.0%) | 0 (0.0%) |
| 15 Years | 0 (0.0%) | 0 (0.0%) |
| 16 and 17 Years | 70 (62.5%) | 0 (0.0%) |
| 18 to 24 Years | 9 (21.4%) | 54 (46.6%) |
| 25 to 34 Years | 30 (29.7%) | 27 (25.7%) |
| 35 to 44 Years | 29 (23.8%) | 47 (40.9%) |
| 45 to 54 Years | 3 (3.7%) | 3 (5.7%) |
| 55 to 64 Years | 4 (5.1%) | 18 (11.6%) |
| 65 to 74 Years | 9 (27.3%) | 10 (13.5%) |
| 75 Years and over | 9 (12.5%) | 3 (4.1%) |
| Total | 214 (24.4%) | 198 (22.3%) |
Income Above Poverty by Sex and Age in Crothersville
According to the poverty statistics in Crothersville, males aged 5 years and females aged 12 to 14 years are the age groups that are most secure financially, with 100.0% of males and 100.0% of females in these age groups living above the poverty line.
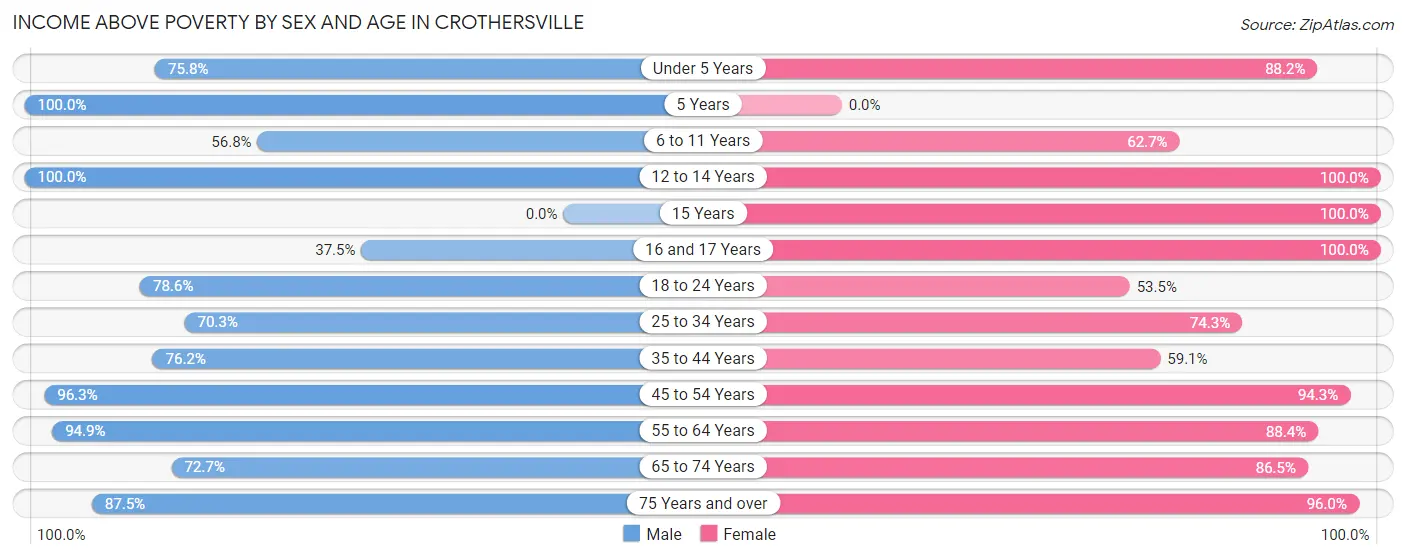
| Age Bracket | Male | Female |
| Under 5 Years | 50 (75.8%) | 60 (88.2%) |
| 5 Years | 27 (100.0%) | 0 (0.0%) |
| 6 to 11 Years | 46 (56.8%) | 47 (62.7%) |
| 12 to 14 Years | 62 (100.0%) | 18 (100.0%) |
| 15 Years | 0 (0.0%) | 4 (100.0%) |
| 16 and 17 Years | 42 (37.5%) | 32 (100.0%) |
| 18 to 24 Years | 33 (78.6%) | 62 (53.4%) |
| 25 to 34 Years | 71 (70.3%) | 78 (74.3%) |
| 35 to 44 Years | 93 (76.2%) | 68 (59.1%) |
| 45 to 54 Years | 79 (96.3%) | 50 (94.3%) |
| 55 to 64 Years | 74 (94.9%) | 137 (88.4%) |
| 65 to 74 Years | 24 (72.7%) | 64 (86.5%) |
| 75 Years and over | 63 (87.5%) | 71 (96.0%) |
| Total | 664 (75.6%) | 691 (77.7%) |
Income Below Poverty Among Married-Couple Families in Crothersville
The poverty statistics for married-couple families in Crothersville show that 13.9% or 48 of the total 346 families live below the poverty line. Families with 3 or 4 children have the highest poverty rate of 48.5%, comprising of 16 families. On the other hand, families with 5 or more children have the lowest poverty rate of 0.0%, which includes 0 families.
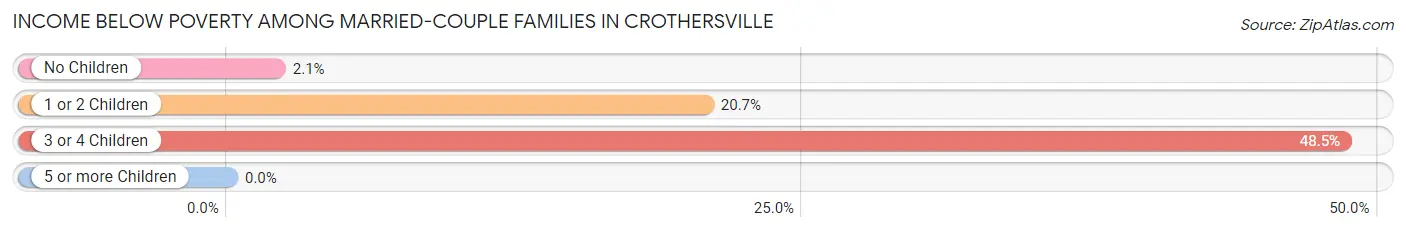
| Children | Above Poverty | Below Poverty |
| No Children | 141 (97.9%) | 3 (2.1%) |
| 1 or 2 Children | 111 (79.3%) | 29 (20.7%) |
| 3 or 4 Children | 17 (51.5%) | 16 (48.5%) |
| 5 or more Children | 29 (100.0%) | 0 (0.0%) |
| Total | 298 (86.1%) | 48 (13.9%) |
Income Below Poverty Among Single-Parent Households in Crothersville
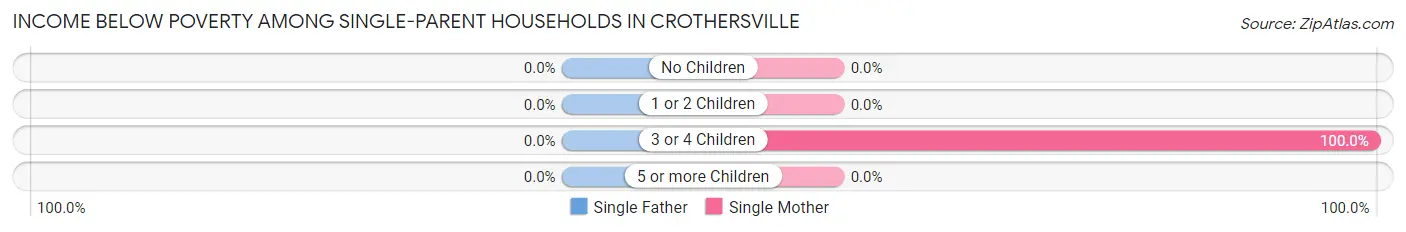
| Children | Single Father | Single Mother |
| No Children | 0 (0.0%) | 0 (0.0%) |
| 1 or 2 Children | 0 (0.0%) | 0 (0.0%) |
| 3 or 4 Children | 0 (0.0%) | 9 (100.0%) |
| 5 or more Children | 0 (0.0%) | 0 (0.0%) |
| Total | 0 (0.0%) | 9 (11.1%) |
Income Below Poverty Among Married-Couple vs Single-Parent Households in Crothersville
The poverty data for Crothersville shows that 48 of the married-couple family households (13.9%) and 9 of the single-parent households (10.2%) are living below the poverty level. Within the married-couple family households, those with 3 or 4 children have the highest poverty rate, with 16 households (48.5%) falling below the poverty line. Among the single-parent households, those with 3 or 4 children have the highest poverty rate, with 9 household (100.0%) living below poverty.
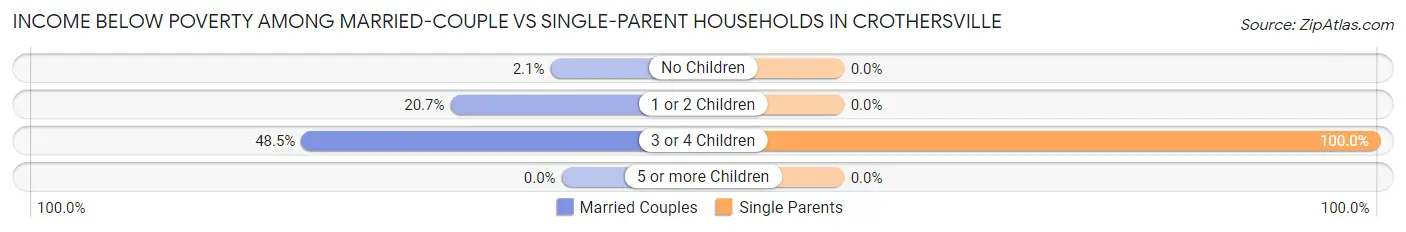
| Children | Married-Couple Families | Single-Parent Households |
| No Children | 3 (2.1%) | 0 (0.0%) |
| 1 or 2 Children | 29 (20.7%) | 0 (0.0%) |
| 3 or 4 Children | 16 (48.5%) | 9 (100.0%) |
| 5 or more Children | 0 (0.0%) | 0 (0.0%) |
| Total | 48 (13.9%) | 9 (10.2%) |
Race in Crothersville
The most populous races in Crothersville are White / Caucasian (1,782 | 99.2%), Two or more Races (12 | 0.7%), and Hispanic or Latino (7 | 0.4%).
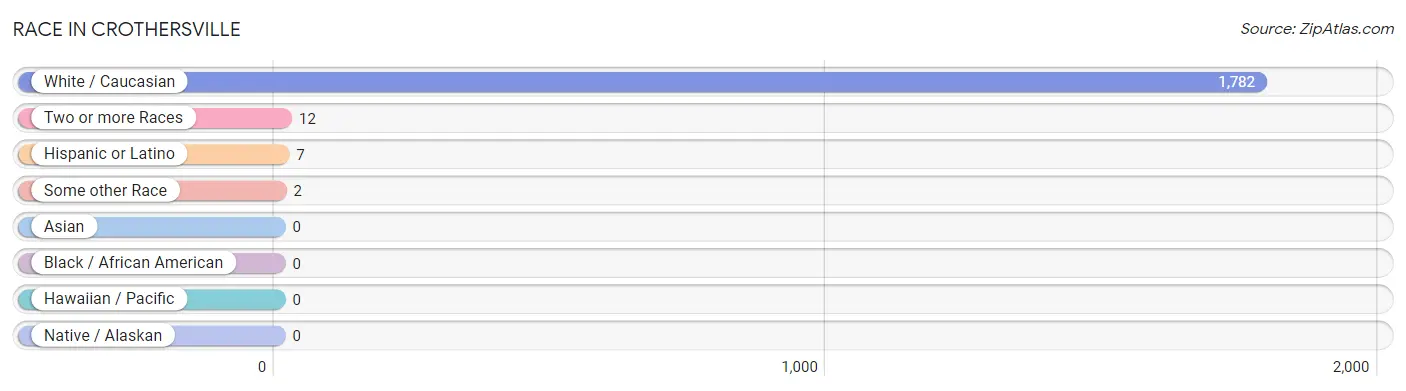
| Race | # Population | % Population |
| Asian | 0 | 0.0% |
| Black / African American | 0 | 0.0% |
| Hawaiian / Pacific | 0 | 0.0% |
| Hispanic or Latino | 7 | 0.4% |
| Native / Alaskan | 0 | 0.0% |
| White / Caucasian | 1,782 | 99.2% |
| Two or more Races | 12 | 0.7% |
| Some other Race | 2 | 0.1% |
| Total | 1,796 | 100.0% |
Ancestry in Crothersville
The most populous ancestries reported in Crothersville are German (282 | 15.7%), American (277 | 15.4%), English (262 | 14.6%), Irish (146 | 8.1%), and Eastern European (13 | 0.7%), together accounting for 54.6% of all Crothersville residents.
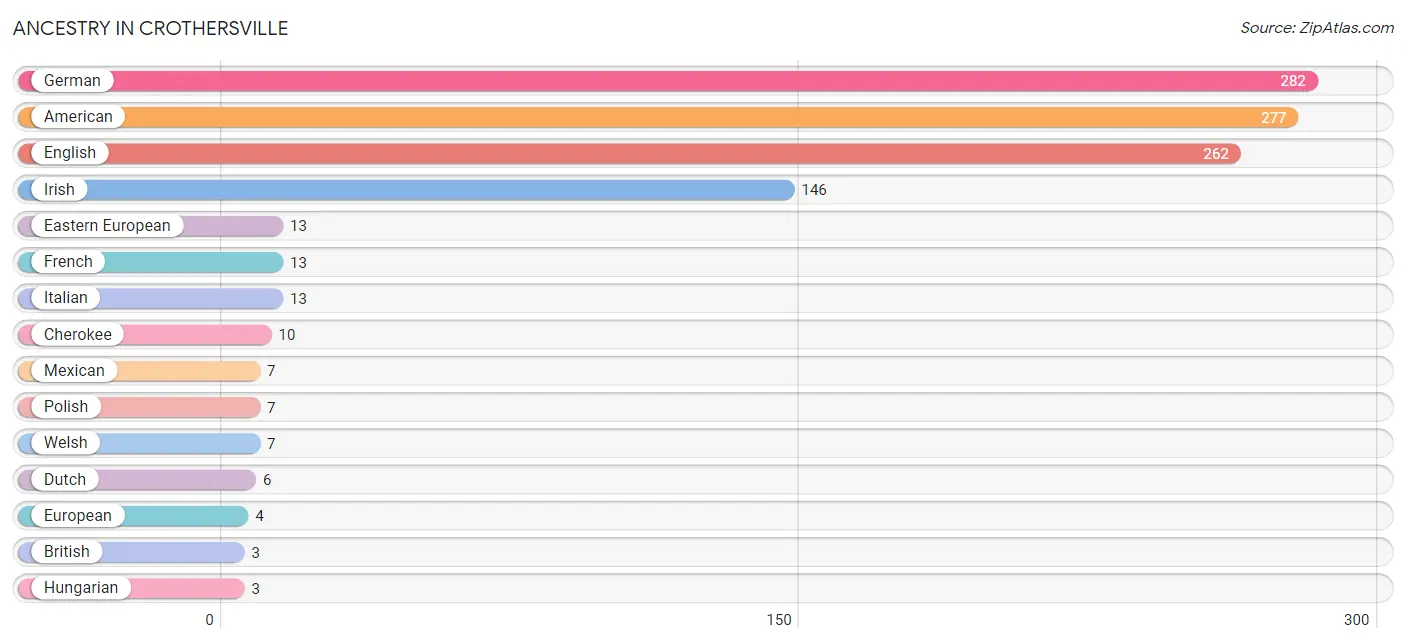
| Ancestry | # Population | % Population |
| American | 277 | 15.4% |
| British | 3 | 0.2% |
| Cherokee | 10 | 0.6% |
| Dutch | 6 | 0.3% |
| Eastern European | 13 | 0.7% |
| English | 262 | 14.6% |
| European | 4 | 0.2% |
| French | 13 | 0.7% |
| German | 282 | 15.7% |
| Hungarian | 3 | 0.2% |
| Irish | 146 | 8.1% |
| Italian | 13 | 0.7% |
| Mexican | 7 | 0.4% |
| Polish | 7 | 0.4% |
| Scotch-Irish | 2 | 0.1% |
| Scottish | 1 | 0.1% |
| Welsh | 7 | 0.4% | View All 17 Rows |
Immigrants in Crothersville
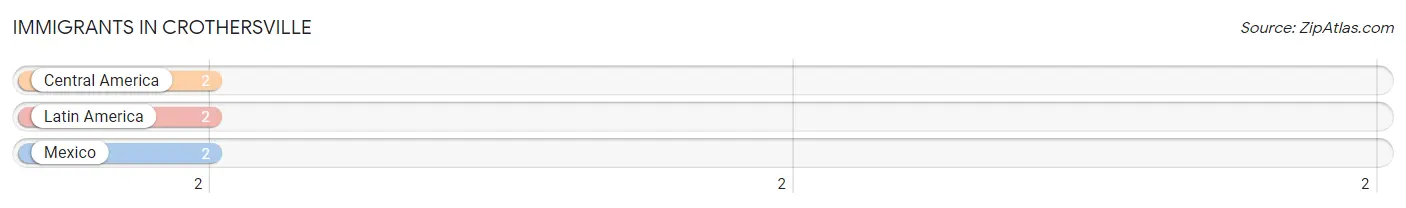
The most numerous immigrant groups reported in Crothersville came from Central America (2 | 0.1%), Latin America (2 | 0.1%), and Mexico (2 | 0.1%), together accounting for 0.3% of all Crothersville residents.
| Immigration Origin | # Population | % Population |
| Central America | 2 | 0.1% |
| Latin America | 2 | 0.1% |
| Mexico | 2 | 0.1% | View All 3 Rows |
Sex and Age in Crothersville
Sex and Age in Crothersville
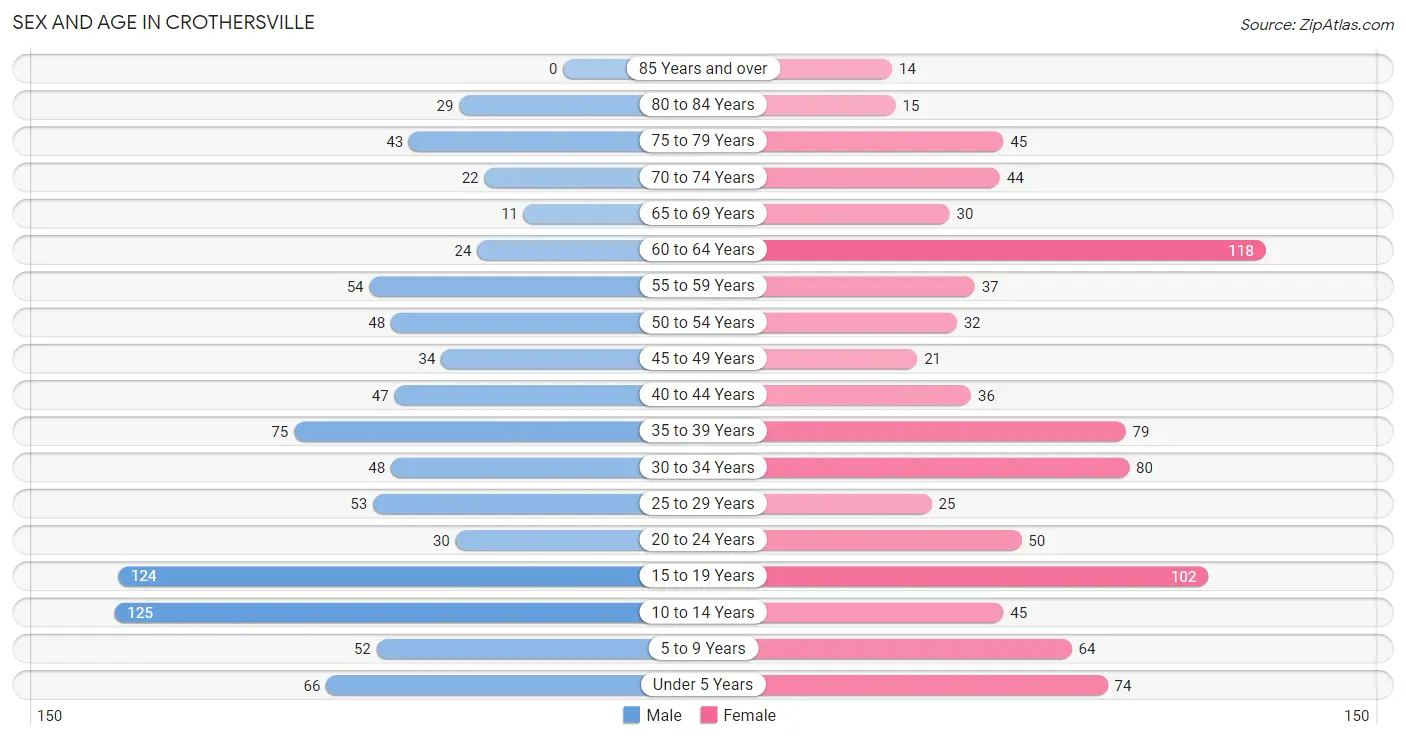
The most populous age groups in Crothersville are 10 to 14 Years (125 | 14.1%) for men and 60 to 64 Years (118 | 13.0%) for women.
| Age Bracket | Male | Female |
| Under 5 Years | 66 (7.5%) | 74 (8.1%) |
| 5 to 9 Years | 52 (5.9%) | 64 (7.0%) |
| 10 to 14 Years | 125 (14.1%) | 45 (4.9%) |
| 15 to 19 Years | 124 (14.0%) | 102 (11.2%) |
| 20 to 24 Years | 30 (3.4%) | 50 (5.5%) |
| 25 to 29 Years | 53 (6.0%) | 25 (2.7%) |
| 30 to 34 Years | 48 (5.4%) | 80 (8.8%) |
| 35 to 39 Years | 75 (8.5%) | 79 (8.7%) |
| 40 to 44 Years | 47 (5.3%) | 36 (4.0%) |
| 45 to 49 Years | 34 (3.8%) | 21 (2.3%) |
| 50 to 54 Years | 48 (5.4%) | 32 (3.5%) |
| 55 to 59 Years | 54 (6.1%) | 37 (4.1%) |
| 60 to 64 Years | 24 (2.7%) | 118 (13.0%) |
| 65 to 69 Years | 11 (1.2%) | 30 (3.3%) |
| 70 to 74 Years | 22 (2.5%) | 44 (4.8%) |
| 75 to 79 Years | 43 (4.9%) | 45 (4.9%) |
| 80 to 84 Years | 29 (3.3%) | 15 (1.7%) |
| 85 Years and over | 0 (0.0%) | 14 (1.5%) |
| Total | 885 (100.0%) | 911 (100.0%) |
Families and Households in Crothersville
Median Family Size in Crothersville
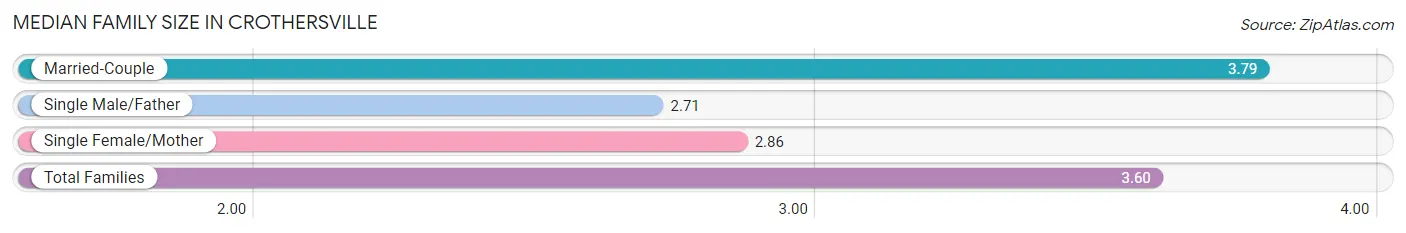
The median family size in Crothersville is 3.60 persons per family, with married-couple families (346 | 79.7%) accounting for the largest median family size of 3.79 persons per family. On the other hand, single male/father families (7 | 1.6%) represent the smallest median family size with 2.71 persons per family.
| Family Type | # Families | Family Size |
| Married-Couple | 346 (79.7%) | 3.79 |
| Single Male/Father | 7 (1.6%) | 2.71 |
| Single Female/Mother | 81 (18.7%) | 2.86 |
| Total Families | 434 (100.0%) | 3.60 |
Median Household Size in Crothersville
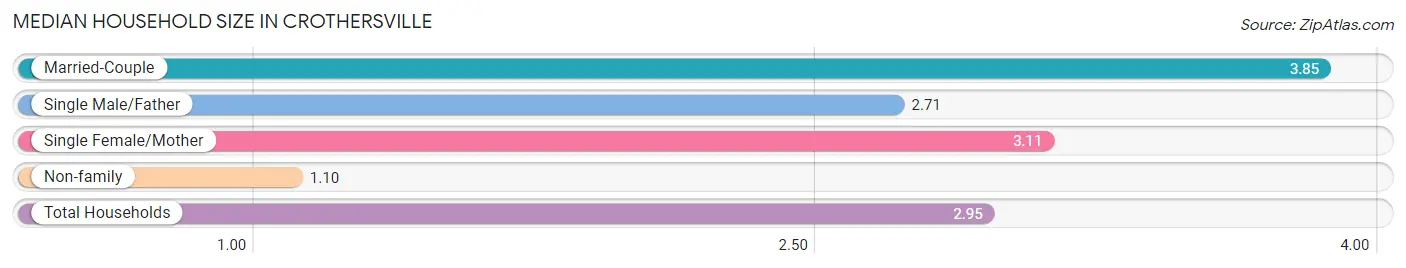
The median household size in Crothersville is 2.95 persons per household, with married-couple households (346 | 56.8%) accounting for the largest median household size of 3.85 persons per household. non-family households (175 | 28.7%) represent the smallest median household size with 1.10 persons per household.
| Household Type | # Households | Household Size |
| Married-Couple | 346 (56.8%) | 3.85 |
| Single Male/Father | 7 (1.1%) | 2.71 |
| Single Female/Mother | 81 (13.3%) | 3.11 |
| Non-family | 175 (28.7%) | 1.10 |
| Total Households | 609 (100.0%) | 2.95 |
Household Size by Marriage Status in Crothersville
Out of a total of 609 households in Crothersville, 434 (71.3%) are family households, while 175 (28.7%) are nonfamily households. The most numerous type of family households are 2-person households, comprising 138, and the most common type of nonfamily households are 1-person households, comprising 158.
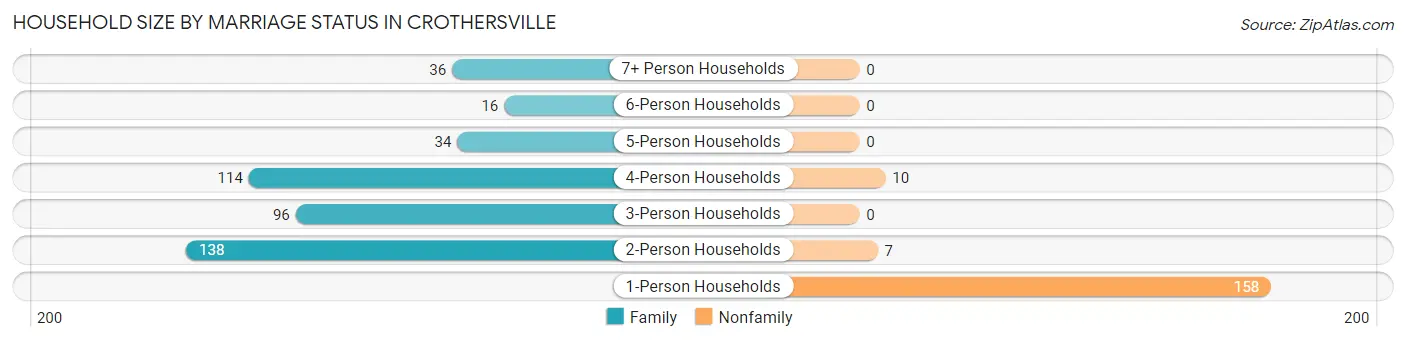
| Household Size | Family Households | Nonfamily Households |
| 1-Person Households | - | 158 (25.9%) |
| 2-Person Households | 138 (22.7%) | 7 (1.1%) |
| 3-Person Households | 96 (15.8%) | 0 (0.0%) |
| 4-Person Households | 114 (18.7%) | 10 (1.6%) |
| 5-Person Households | 34 (5.6%) | 0 (0.0%) |
| 6-Person Households | 16 (2.6%) | 0 (0.0%) |
| 7+ Person Households | 36 (5.9%) | 0 (0.0%) |
| Total | 434 (71.3%) | 175 (28.7%) |
Female Fertility in Crothersville
Fertility by Age in Crothersville
Average fertility rate in Crothersville is 46.0 births per 1,000 women. Women in the age bracket of 20 to 34 years have the highest fertility rate with 116.0 births per 1,000 women. Women in the age bracket of 20 to 34 years acount for 100.0% of all women with births.
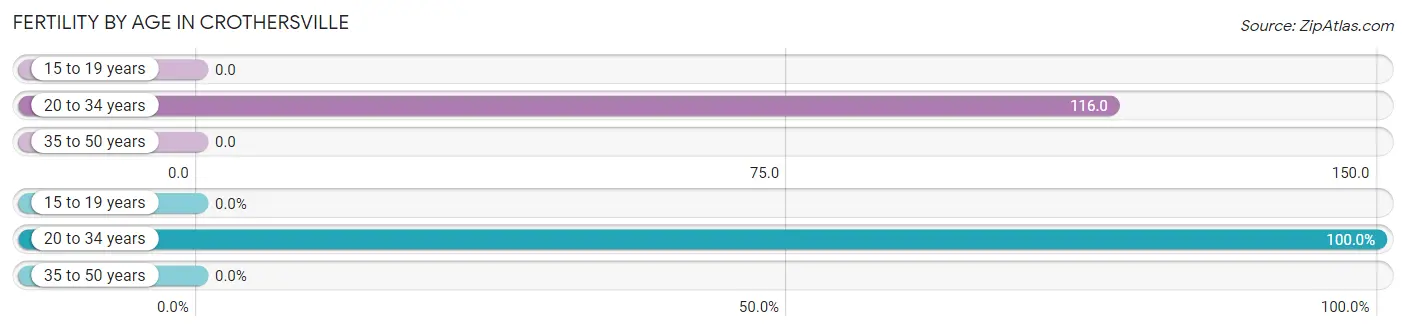
| Age Bracket | Women with Births | Births / 1,000 Women |
| 15 to 19 years | 0 (0.0%) | 0.0 |
| 20 to 34 years | 18 (100.0%) | 116.0 |
| 35 to 50 years | 0 (0.0%) | 0.0 |
| Total | 18 (100.0%) | 46.0 |
Fertility by Age by Marriage Status in Crothersville
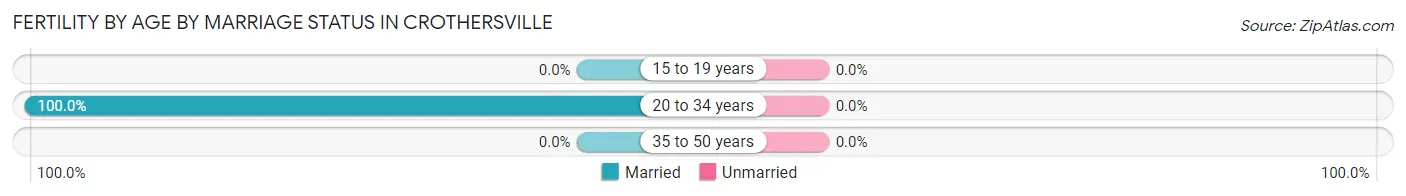
| Age Bracket | Married | Unmarried |
| 15 to 19 years | 0 (0.0%) | 0 (0.0%) |
| 20 to 34 years | 18 (100.0%) | 0 (0.0%) |
| 35 to 50 years | 0 (0.0%) | 0 (0.0%) |
| Total | 18 (100.0%) | 0 (0.0%) |
Fertility by Education in Crothersville
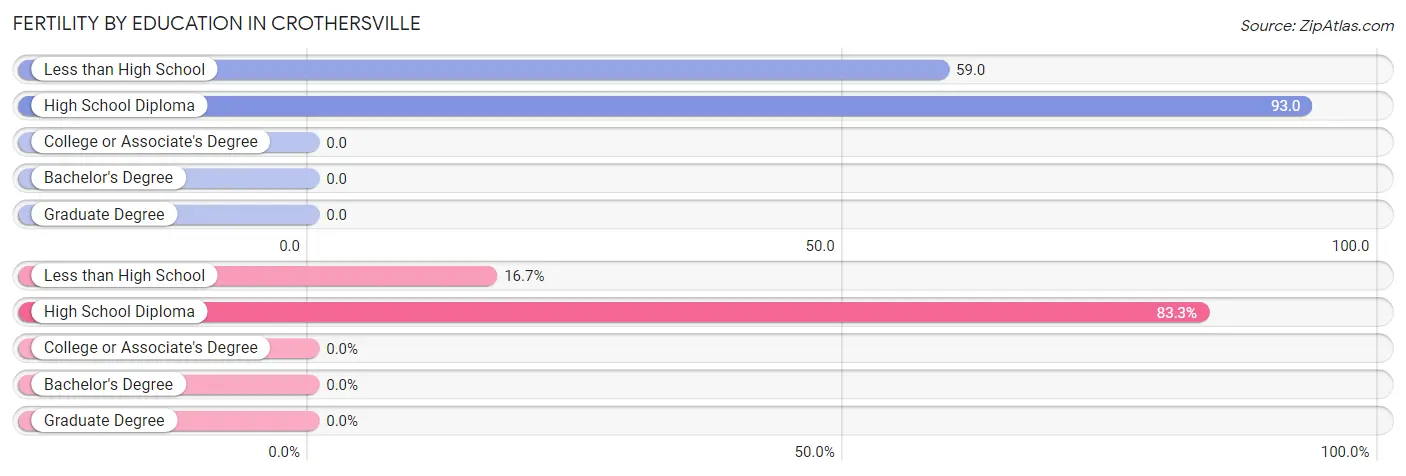
| Educational Attainment | Women with Births | Births / 1,000 Women |
| Less than High School | 3 (16.7%) | 59.0 |
| High School Diploma | 15 (83.3%) | 93.0 |
| College or Associate's Degree | 0 (0.0%) | 0.0 |
| Bachelor's Degree | 0 (0.0%) | 0.0 |
| Graduate Degree | 0 (0.0%) | 0.0 |
| Total | 18 (100.0%) | 46.0 |
Fertility by Education by Marriage Status in Crothersville
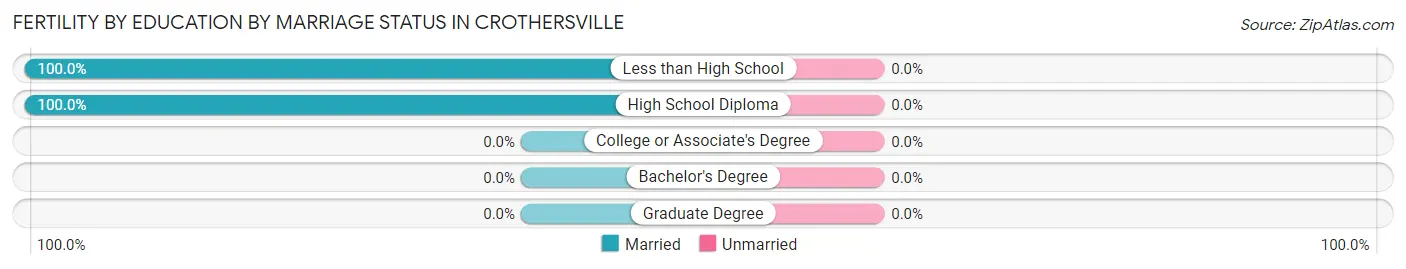
| Educational Attainment | Married | Unmarried |
| Less than High School | 3 (100.0%) | 0 (0.0%) |
| High School Diploma | 15 (100.0%) | 0 (0.0%) |
| College or Associate's Degree | 0 (0.0%) | 0 (0.0%) |
| Bachelor's Degree | 0 (0.0%) | 0 (0.0%) |
| Graduate Degree | 0 (0.0%) | 0 (0.0%) |
| Total | 18 (100.0%) | 0 (0.0%) |
Employment Characteristics in Crothersville
Employment by Class of Employer in Crothersville
Among the 631 employed individuals in Crothersville, private company employees (538 | 85.3%), not-for-profit organizations (29 | 4.6%), and self-employed (not incorporated) (20 | 3.2%) make up the most common classes of employment.
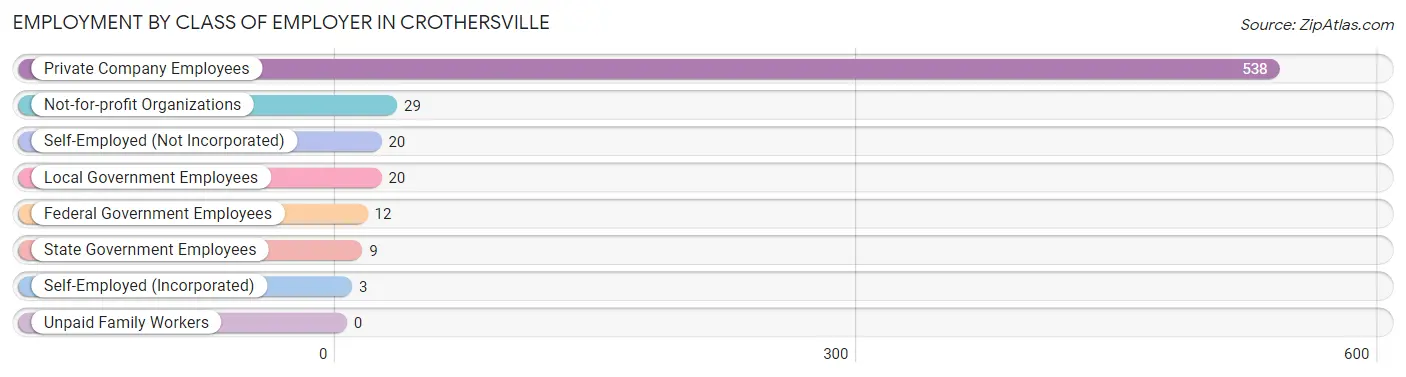
| Employer Class | # Employees | % Employees |
| Private Company Employees | 538 | 85.3% |
| Self-Employed (Incorporated) | 3 | 0.5% |
| Self-Employed (Not Incorporated) | 20 | 3.2% |
| Not-for-profit Organizations | 29 | 4.6% |
| Local Government Employees | 20 | 3.2% |
| State Government Employees | 9 | 1.4% |
| Federal Government Employees | 12 | 1.9% |
| Unpaid Family Workers | 0 | 0.0% |
| Total | 631 | 100.0% |
Employment Status by Age in Crothersville
According to the labor force statistics for Crothersville, out of the total population over 16 years of age (1,366), 48.0% or 656 individuals are in the labor force, with 1.8% or 12 of them unemployed. The age group with the highest labor force participation rate is 20 to 24 years, with 91.3% or 73 individuals in the labor force. Within the labor force, the 20 to 24 years age range has the highest percentage of unemployed individuals, with 6.8% or 5 of them being unemployed.
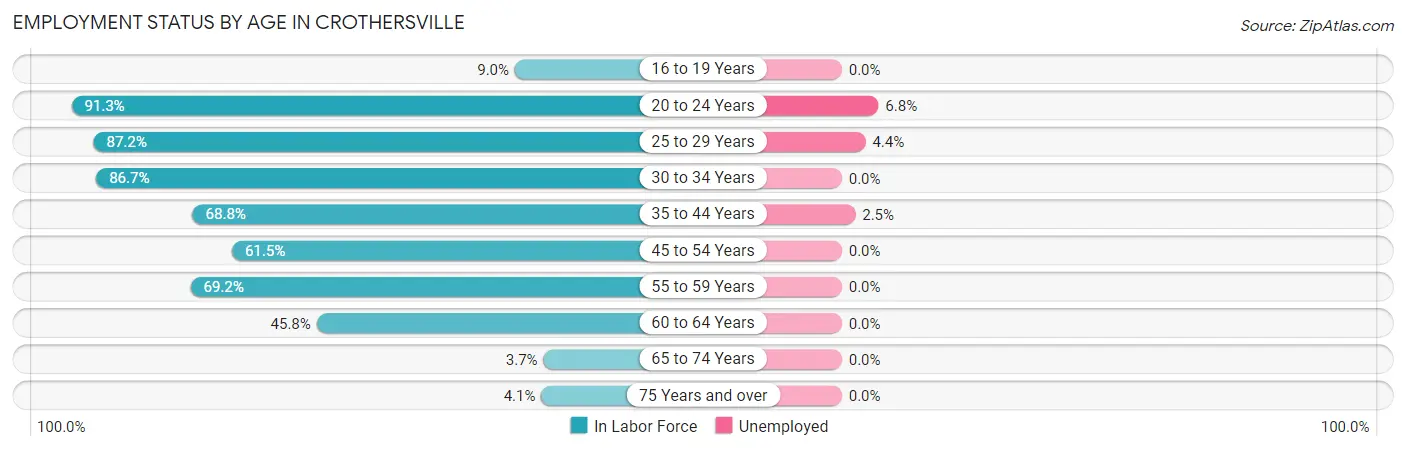
| Age Bracket | In Labor Force | Unemployed |
| 16 to 19 Years | 20 (9.0%) | 0 (0.0%) |
| 20 to 24 Years | 73 (91.3%) | 5 (6.8%) |
| 25 to 29 Years | 68 (87.2%) | 3 (4.4%) |
| 30 to 34 Years | 111 (86.7%) | 0 (0.0%) |
| 35 to 44 Years | 163 (68.8%) | 4 (2.5%) |
| 45 to 54 Years | 83 (61.5%) | 0 (0.0%) |
| 55 to 59 Years | 63 (69.2%) | 0 (0.0%) |
| 60 to 64 Years | 65 (45.8%) | 0 (0.0%) |
| 65 to 74 Years | 4 (3.7%) | 0 (0.0%) |
| 75 Years and over | 6 (4.1%) | 0 (0.0%) |
| Total | 656 (48.0%) | 12 (1.8%) |
Employment Status by Educational Attainment in Crothersville
According to labor force statistics for Crothersville, 68.2% of individuals (553) out of the total population between 25 and 64 years of age (811) are in the labor force, with 1.3% or 7 of them being unemployed. The group with the highest labor force participation rate are those with the educational attainment of bachelor's degree or higher, with 93.8% or 45 individuals in the labor force. Within the labor force, individuals with college / associate degree education have the highest percentage of unemployment, with 2.2% or 4 of them being unemployed.
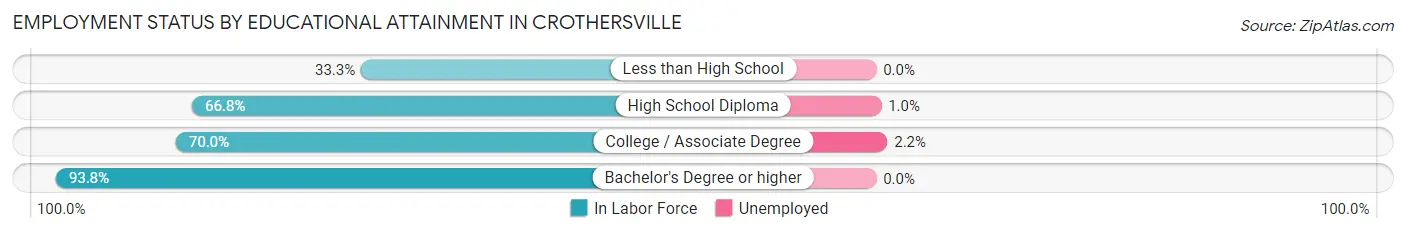
| Educational Attainment | In Labor Force | Unemployed |
| Less than High School | 10 (33.3%) | 0 (0.0%) |
| High School Diploma | 314 (66.8%) | 5 (1.0%) |
| College / Associate Degree | 184 (70.0%) | 6 (2.2%) |
| Bachelor's Degree or higher | 45 (93.8%) | 0 (0.0%) |
| Total | 553 (68.2%) | 11 (1.3%) |
Employment Occupations by Sex in Crothersville
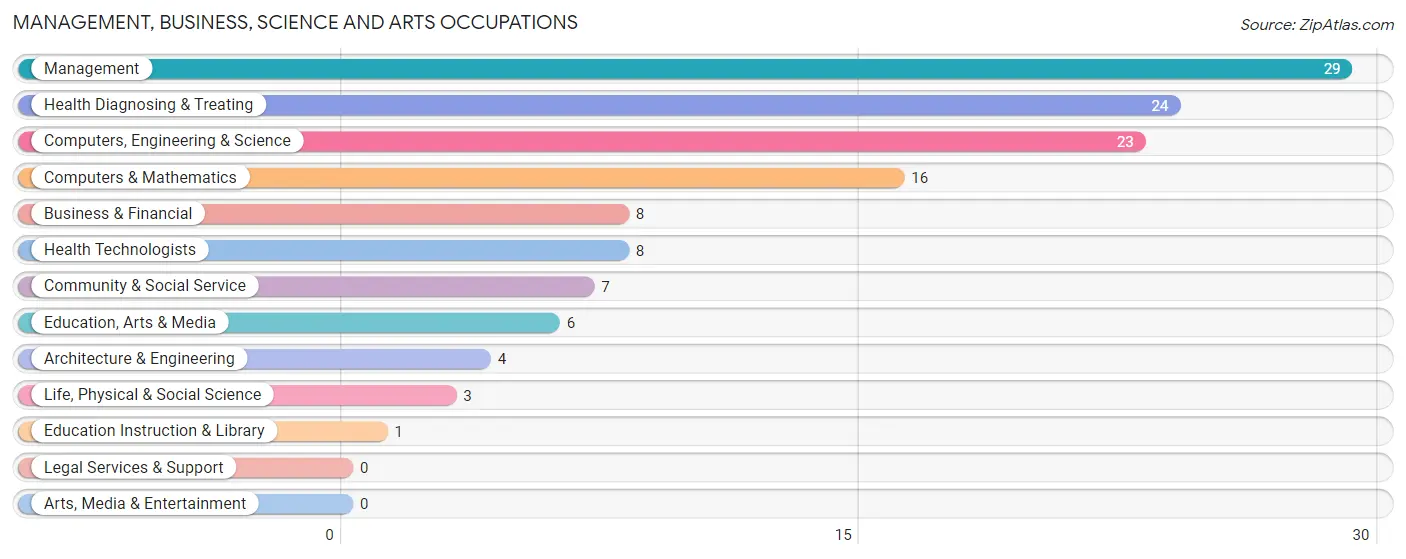
Management, Business, Science and Arts Occupations
The most common Management, Business, Science and Arts occupations in Crothersville are Management (29 | 4.5%), Health Diagnosing & Treating (24 | 3.7%), Computers, Engineering & Science (23 | 3.6%), Computers & Mathematics (16 | 2.5%), and Business & Financial (8 | 1.2%).
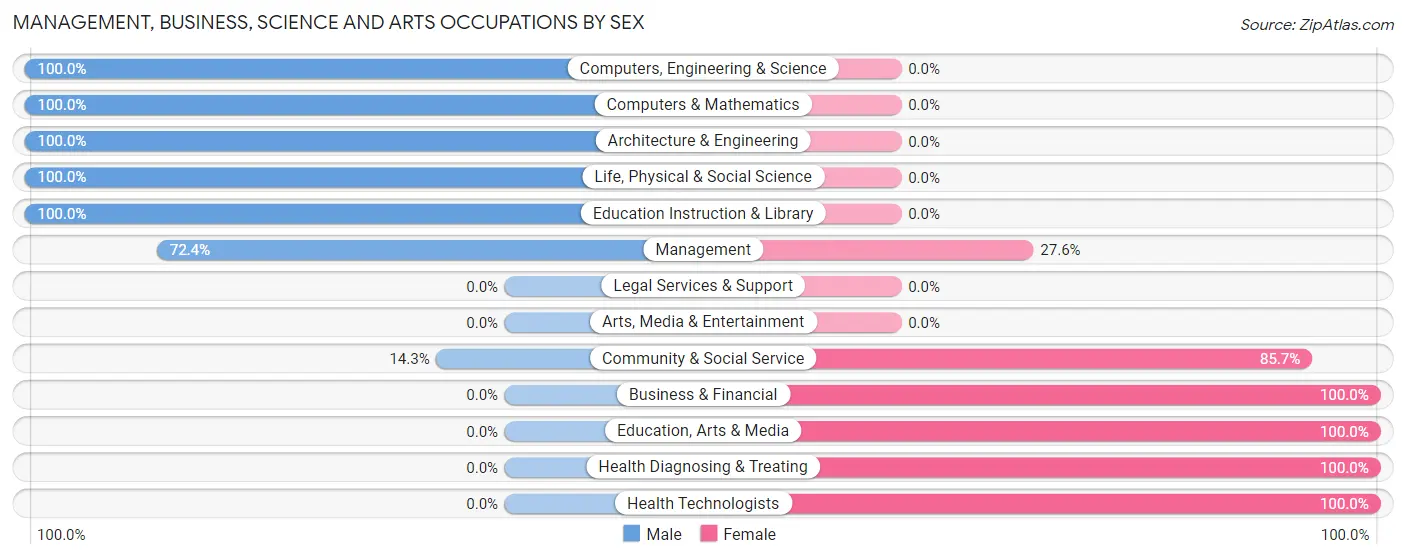
Management, Business, Science and Arts Occupations by Sex
Within the Management, Business, Science and Arts occupations in Crothersville, the most male-oriented occupations are Computers, Engineering & Science (100.0%), Computers & Mathematics (100.0%), and Architecture & Engineering (100.0%), while the most female-oriented occupations are Business & Financial (100.0%), Education, Arts & Media (100.0%), and Health Diagnosing & Treating (100.0%).
| Occupation | Male | Female |
| Management | 21 (72.4%) | 8 (27.6%) |
| Business & Financial | 0 (0.0%) | 8 (100.0%) |
| Computers, Engineering & Science | 23 (100.0%) | 0 (0.0%) |
| Computers & Mathematics | 16 (100.0%) | 0 (0.0%) |
| Architecture & Engineering | 4 (100.0%) | 0 (0.0%) |
| Life, Physical & Social Science | 3 (100.0%) | 0 (0.0%) |
| Community & Social Service | 1 (14.3%) | 6 (85.7%) |
| Education, Arts & Media | 0 (0.0%) | 6 (100.0%) |
| Legal Services & Support | 0 (0.0%) | 0 (0.0%) |
| Education Instruction & Library | 1 (100.0%) | 0 (0.0%) |
| Arts, Media & Entertainment | 0 (0.0%) | 0 (0.0%) |
| Health Diagnosing & Treating | 0 (0.0%) | 24 (100.0%) |
| Health Technologists | 0 (0.0%) | 8 (100.0%) |
| Total (Category) | 45 (49.4%) | 46 (50.5%) |
| Total (Overall) | 349 (54.2%) | 295 (45.8%) |
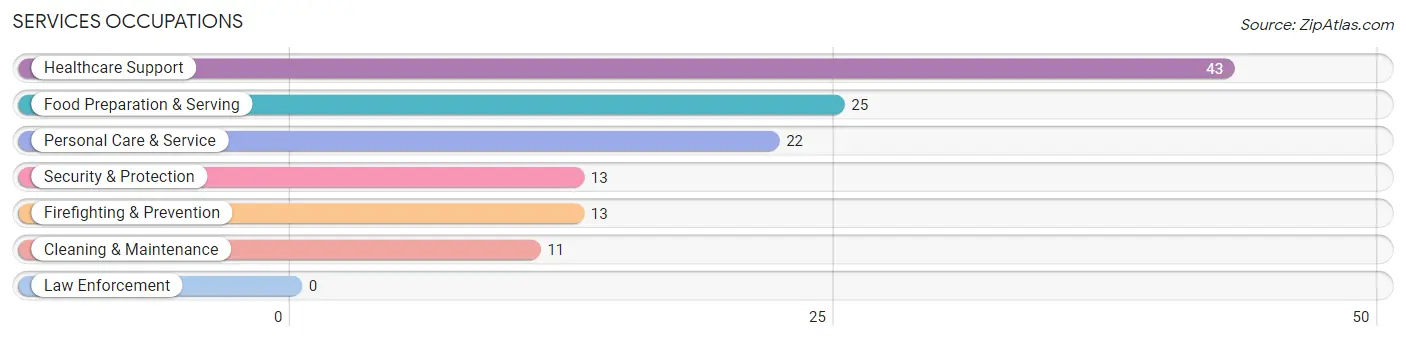
Services Occupations
The most common Services occupations in Crothersville are Healthcare Support (43 | 6.7%), Food Preparation & Serving (25 | 3.9%), Personal Care & Service (22 | 3.4%), Security & Protection (13 | 2.0%), and Firefighting & Prevention (13 | 2.0%).
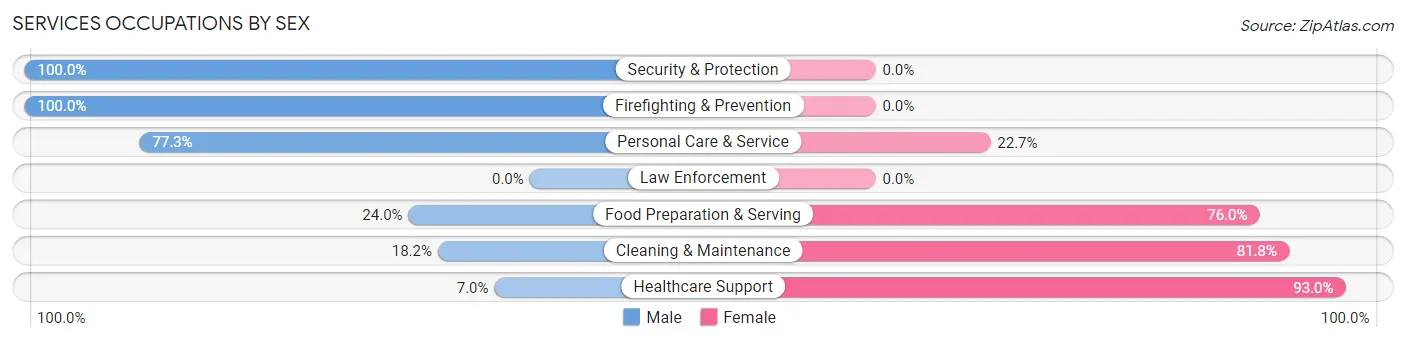
Services Occupations by Sex
Within the Services occupations in Crothersville, the most male-oriented occupations are Security & Protection (100.0%), Firefighting & Prevention (100.0%), and Personal Care & Service (77.3%), while the most female-oriented occupations are Healthcare Support (93.0%), Cleaning & Maintenance (81.8%), and Food Preparation & Serving (76.0%).
| Occupation | Male | Female |
| Healthcare Support | 3 (7.0%) | 40 (93.0%) |
| Security & Protection | 13 (100.0%) | 0 (0.0%) |
| Firefighting & Prevention | 13 (100.0%) | 0 (0.0%) |
| Law Enforcement | 0 (0.0%) | 0 (0.0%) |
| Food Preparation & Serving | 6 (24.0%) | 19 (76.0%) |
| Cleaning & Maintenance | 2 (18.2%) | 9 (81.8%) |
| Personal Care & Service | 17 (77.3%) | 5 (22.7%) |
| Total (Category) | 41 (36.0%) | 73 (64.0%) |
| Total (Overall) | 349 (54.2%) | 295 (45.8%) |
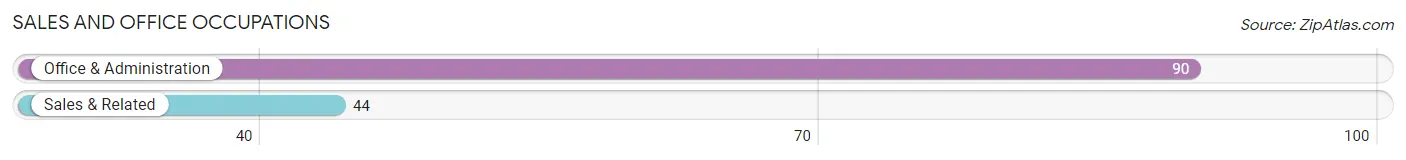
Sales and Office Occupations
The most common Sales and Office occupations in Crothersville are Office & Administration (90 | 14.0%), and Sales & Related (44 | 6.8%).
Sales and Office Occupations by Sex
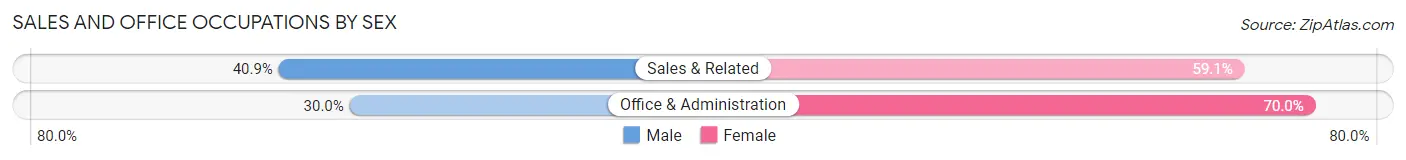
| Occupation | Male | Female |
| Sales & Related | 18 (40.9%) | 26 (59.1%) |
| Office & Administration | 27 (30.0%) | 63 (70.0%) |
| Total (Category) | 45 (33.6%) | 89 (66.4%) |
| Total (Overall) | 349 (54.2%) | 295 (45.8%) |
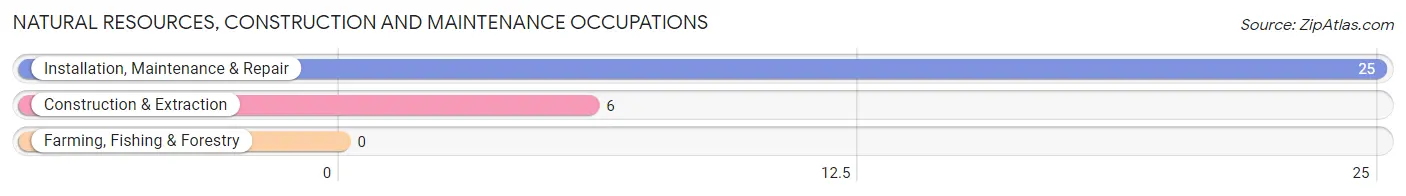
Natural Resources, Construction and Maintenance Occupations
The most common Natural Resources, Construction and Maintenance occupations in Crothersville are Installation, Maintenance & Repair (25 | 3.9%), and Construction & Extraction (6 | 0.9%).
Natural Resources, Construction and Maintenance Occupations by Sex
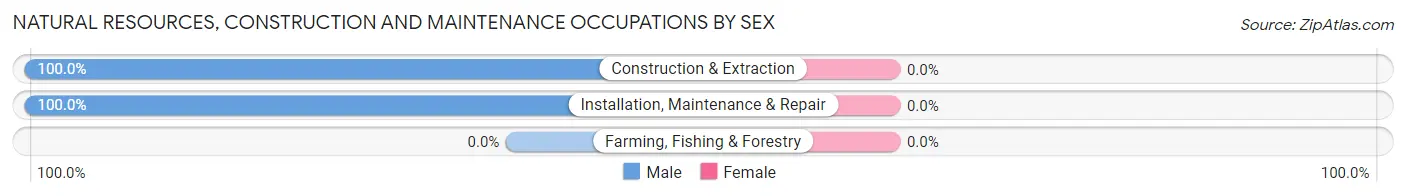
| Occupation | Male | Female |
| Farming, Fishing & Forestry | 0 (0.0%) | 0 (0.0%) |
| Construction & Extraction | 6 (100.0%) | 0 (0.0%) |
| Installation, Maintenance & Repair | 25 (100.0%) | 0 (0.0%) |
| Total (Category) | 31 (100.0%) | 0 (0.0%) |
| Total (Overall) | 349 (54.2%) | 295 (45.8%) |
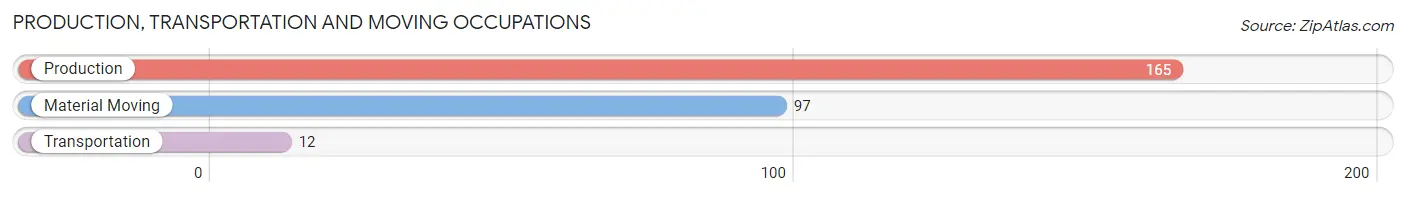
Production, Transportation and Moving Occupations
The most common Production, Transportation and Moving occupations in Crothersville are Production (165 | 25.6%), Material Moving (97 | 15.1%), and Transportation (12 | 1.9%).
Production, Transportation and Moving Occupations by Sex
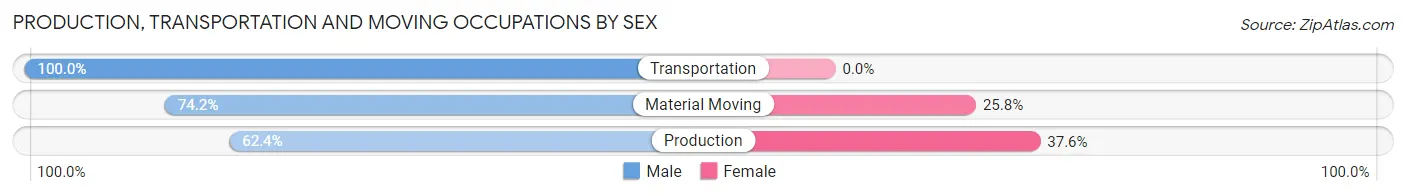
| Occupation | Male | Female |
| Production | 103 (62.4%) | 62 (37.6%) |
| Transportation | 12 (100.0%) | 0 (0.0%) |
| Material Moving | 72 (74.2%) | 25 (25.8%) |
| Total (Category) | 187 (68.2%) | 87 (31.8%) |
| Total (Overall) | 349 (54.2%) | 295 (45.8%) |
Employment Industries by Sex in Crothersville
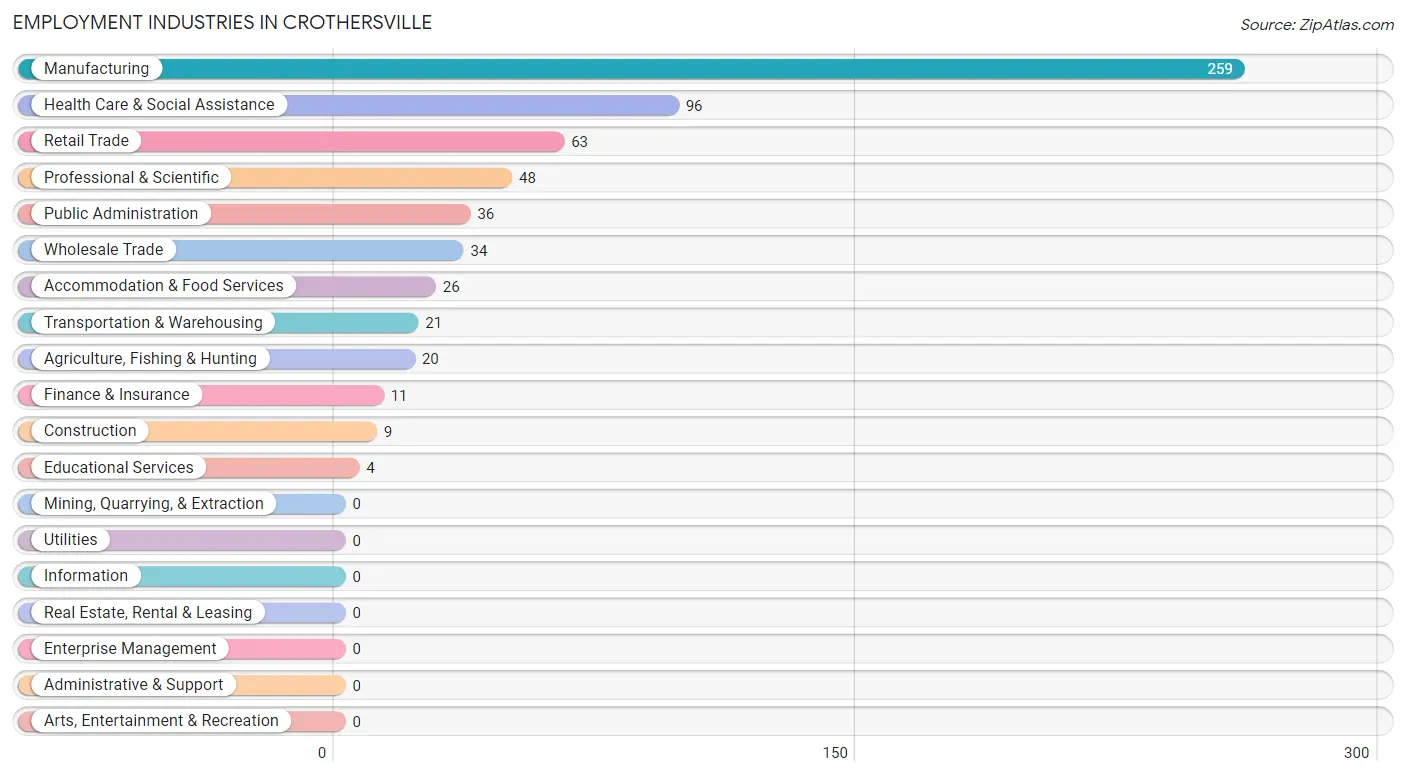
Employment Industries in Crothersville
The major employment industries in Crothersville include Manufacturing (259 | 40.2%), Health Care & Social Assistance (96 | 14.9%), Retail Trade (63 | 9.8%), Professional & Scientific (48 | 7.4%), and Public Administration (36 | 5.6%).
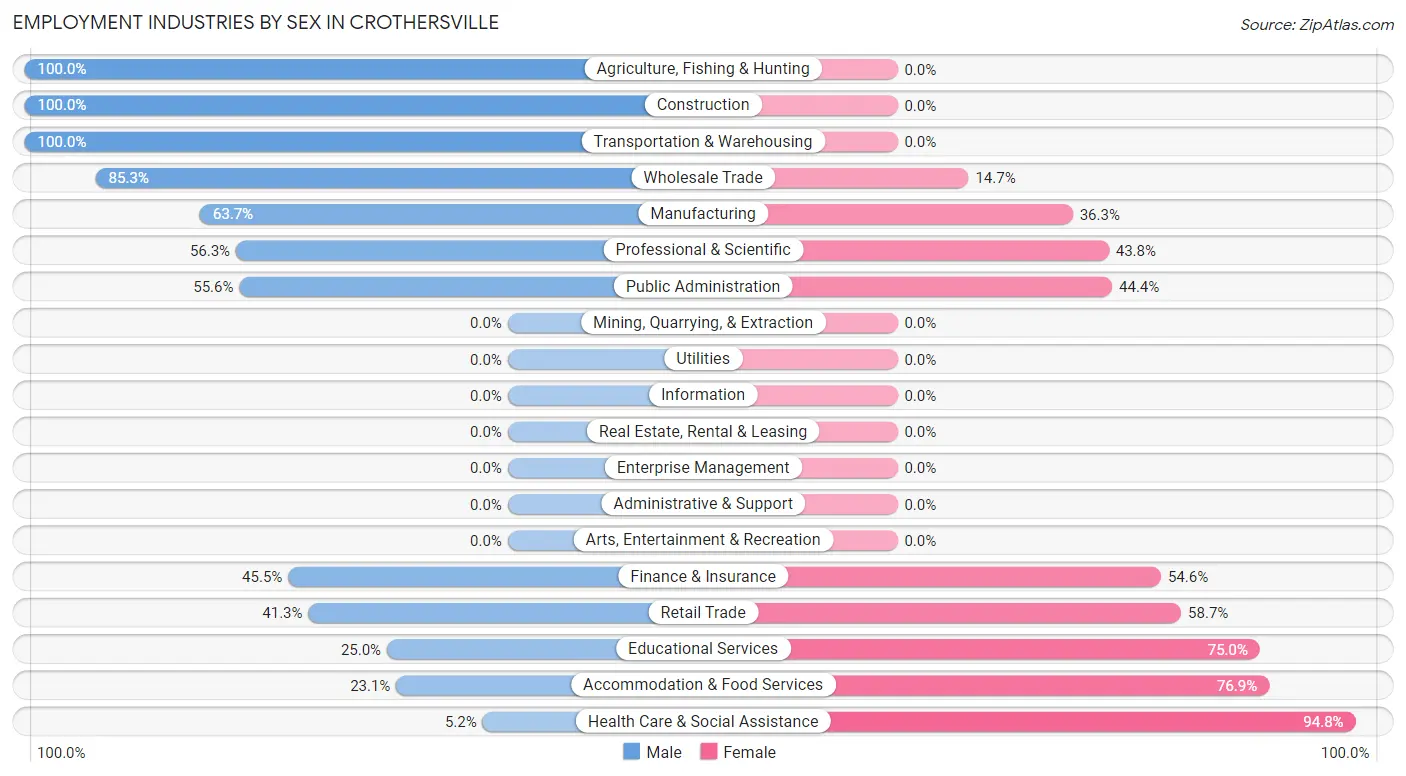
Employment Industries by Sex in Crothersville
The Crothersville industries that see more men than women are Agriculture, Fishing & Hunting (100.0%), Construction (100.0%), and Transportation & Warehousing (100.0%), whereas the industries that tend to have a higher number of women are Health Care & Social Assistance (94.8%), Accommodation & Food Services (76.9%), and Educational Services (75.0%).
| Industry | Male | Female |
| Agriculture, Fishing & Hunting | 20 (100.0%) | 0 (0.0%) |
| Mining, Quarrying, & Extraction | 0 (0.0%) | 0 (0.0%) |
| Construction | 9 (100.0%) | 0 (0.0%) |
| Manufacturing | 165 (63.7%) | 94 (36.3%) |
| Wholesale Trade | 29 (85.3%) | 5 (14.7%) |
| Retail Trade | 26 (41.3%) | 37 (58.7%) |
| Transportation & Warehousing | 21 (100.0%) | 0 (0.0%) |
| Utilities | 0 (0.0%) | 0 (0.0%) |
| Information | 0 (0.0%) | 0 (0.0%) |
| Finance & Insurance | 5 (45.5%) | 6 (54.5%) |
| Real Estate, Rental & Leasing | 0 (0.0%) | 0 (0.0%) |
| Professional & Scientific | 27 (56.2%) | 21 (43.8%) |
| Enterprise Management | 0 (0.0%) | 0 (0.0%) |
| Administrative & Support | 0 (0.0%) | 0 (0.0%) |
| Educational Services | 1 (25.0%) | 3 (75.0%) |
| Health Care & Social Assistance | 5 (5.2%) | 91 (94.8%) |
| Arts, Entertainment & Recreation | 0 (0.0%) | 0 (0.0%) |
| Accommodation & Food Services | 6 (23.1%) | 20 (76.9%) |
| Public Administration | 20 (55.6%) | 16 (44.4%) |
| Total | 349 (54.2%) | 295 (45.8%) |
Education in Crothersville
School Enrollment in Crothersville
The most common levels of schooling among the 570 students in Crothersville are high school (208 | 36.5%), middle school (127 | 22.3%), and college / undergraduate (89 | 15.6%).
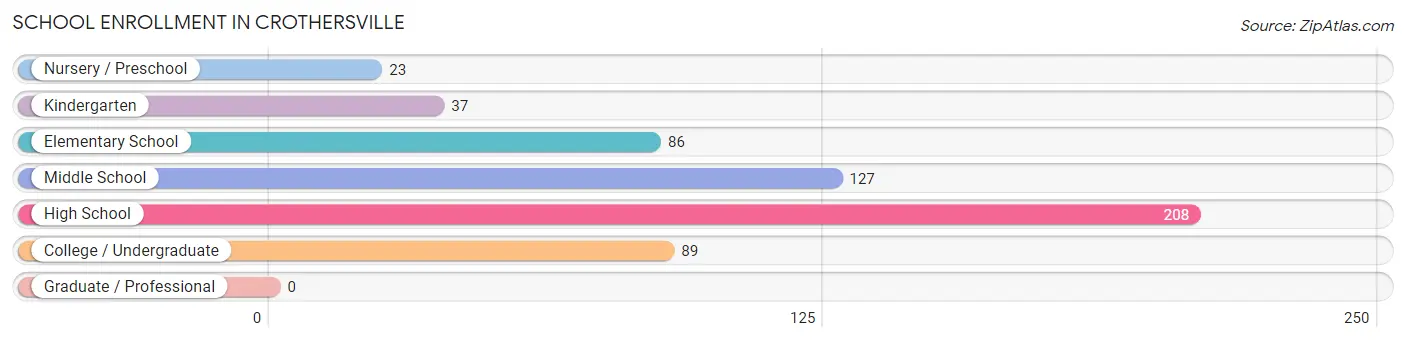
| School Level | # Students | % Students |
| Nursery / Preschool | 23 | 4.0% |
| Kindergarten | 37 | 6.5% |
| Elementary School | 86 | 15.1% |
| Middle School | 127 | 22.3% |
| High School | 208 | 36.5% |
| College / Undergraduate | 89 | 15.6% |
| Graduate / Professional | 0 | 0.0% |
| Total | 570 | 100.0% |
School Enrollment by Age by Funding Source in Crothersville
Out of a total of 570 students who are enrolled in schools in Crothersville, 29 (5.1%) attend a private institution, while the remaining 541 (94.9%) are enrolled in public schools. The age group of 35 years and over has the highest likelihood of being enrolled in private schools, with 4 (22.2% in the age bracket) enrolled. Conversely, the age group of 3 to 4 year olds has the lowest likelihood of being enrolled in a private school, with 23 (100.0% in the age bracket) attending a public institution.
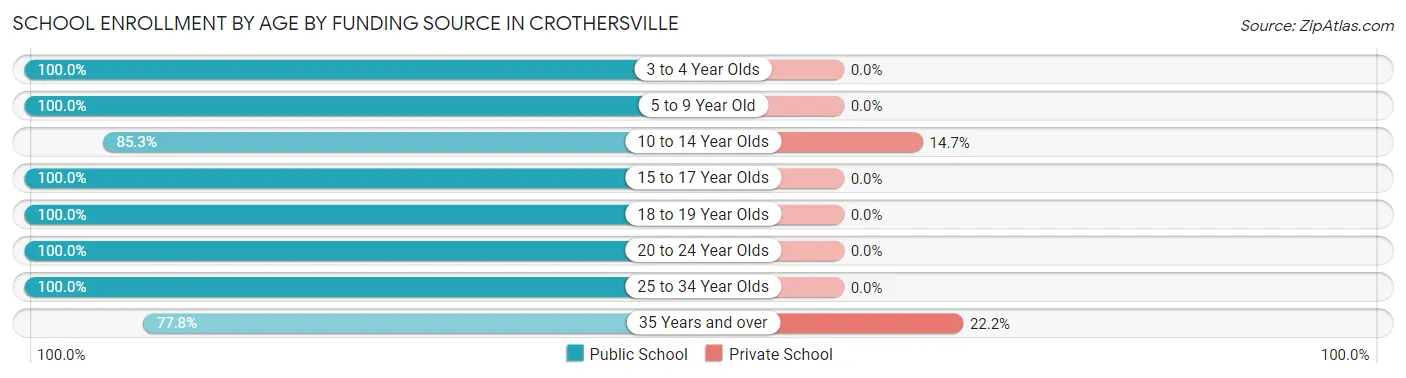
| Age Bracket | Public School | Private School |
| 3 to 4 Year Olds | 23 (100.0%) | 0 (0.0%) |
| 5 to 9 Year Old | 116 (100.0%) | 0 (0.0%) |
| 10 to 14 Year Olds | 145 (85.3%) | 25 (14.7%) |
| 15 to 17 Year Olds | 148 (100.0%) | 0 (0.0%) |
| 18 to 19 Year Olds | 78 (100.0%) | 0 (0.0%) |
| 20 to 24 Year Olds | 9 (100.0%) | 0 (0.0%) |
| 25 to 34 Year Olds | 8 (100.0%) | 0 (0.0%) |
| 35 Years and over | 14 (77.8%) | 4 (22.2%) |
| Total | 541 (94.9%) | 29 (5.1%) |
Educational Attainment by Field of Study in Crothersville
Business (25 | 46.3%), arts & humanities (10 | 18.5%), education (7 | 13.0%), science & technology (4 | 7.4%), and visual & performing arts (3 | 5.6%) are the most common fields of study among 54 individuals in Crothersville who have obtained a bachelor's degree or higher.
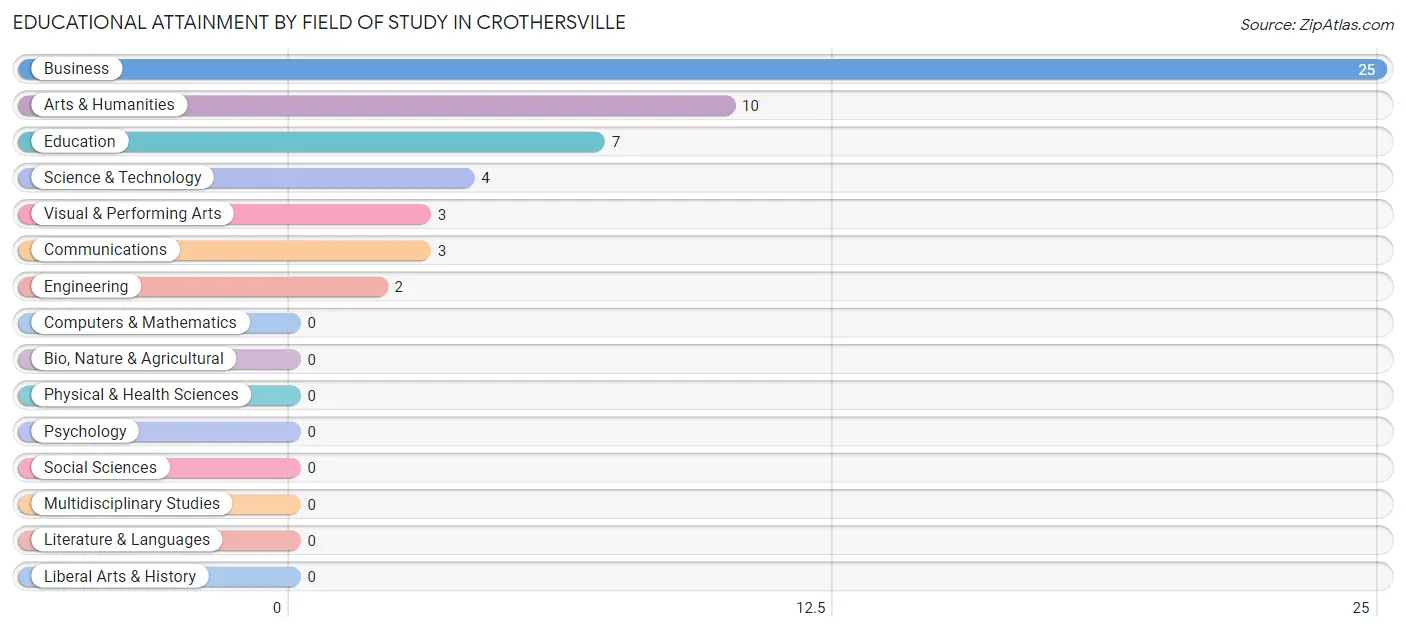
| Field of Study | # Graduates | % Graduates |
| Computers & Mathematics | 0 | 0.0% |
| Bio, Nature & Agricultural | 0 | 0.0% |
| Physical & Health Sciences | 0 | 0.0% |
| Psychology | 0 | 0.0% |
| Social Sciences | 0 | 0.0% |
| Engineering | 2 | 3.7% |
| Multidisciplinary Studies | 0 | 0.0% |
| Science & Technology | 4 | 7.4% |
| Business | 25 | 46.3% |
| Education | 7 | 13.0% |
| Literature & Languages | 0 | 0.0% |
| Liberal Arts & History | 0 | 0.0% |
| Visual & Performing Arts | 3 | 5.6% |
| Communications | 3 | 5.6% |
| Arts & Humanities | 10 | 18.5% |
| Total | 54 | 100.0% |
Transportation & Commute in Crothersville
Vehicle Availability by Sex in Crothersville
The most prevalent vehicle ownership categories in Crothersville are males with 2 vehicles (191, accounting for 54.7%) and females with 2 vehicles (114, making up 67.7%).
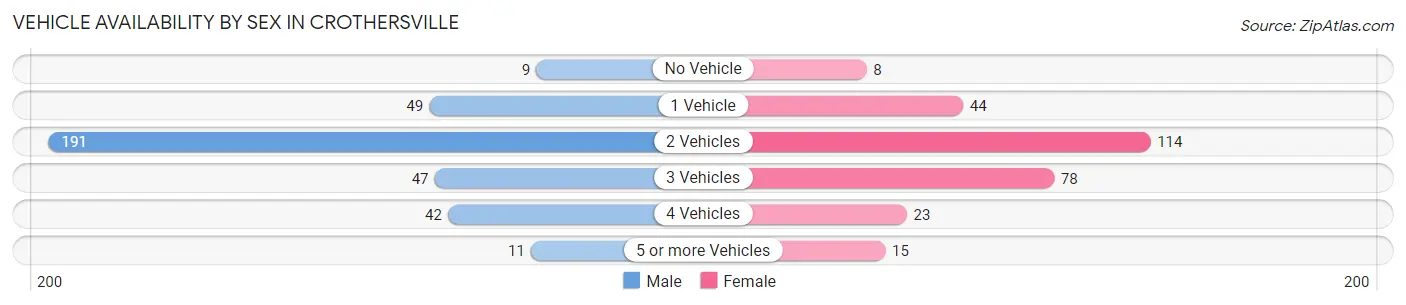
| Vehicles Available | Male | Female |
| No Vehicle | 9 (2.6%) | 8 (2.8%) |
| 1 Vehicle | 49 (14.0%) | 44 (15.6%) |
| 2 Vehicles | 191 (54.7%) | 114 (40.4%) |
| 3 Vehicles | 47 (13.5%) | 78 (27.7%) |
| 4 Vehicles | 42 (12.0%) | 23 (8.2%) |
| 5 or more Vehicles | 11 (3.2%) | 15 (5.3%) |
| Total | 349 (100.0%) | 282 (100.0%) |
Commute Time in Crothersville
The most frequently occuring commute durations in Crothersville are 30 to 34 minutes (109 commuters, 17.7%), 20 to 24 minutes (85 commuters, 13.8%), and 25 to 29 minutes (70 commuters, 11.4%).
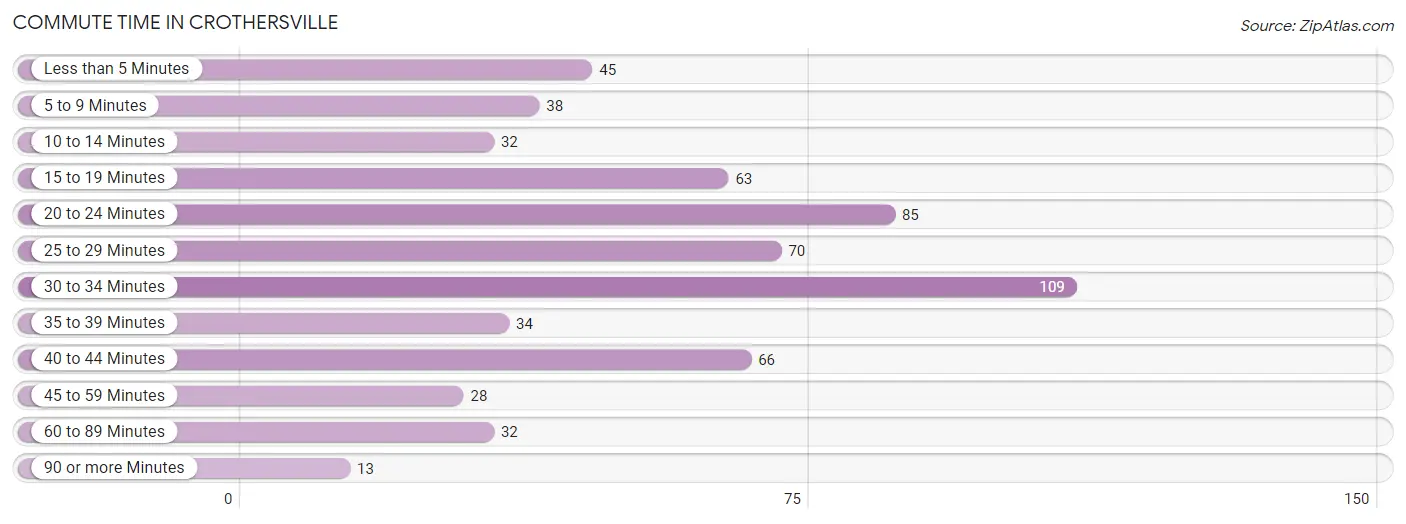
| Commute Time | # Commuters | % Commuters |
| Less than 5 Minutes | 45 | 7.3% |
| 5 to 9 Minutes | 38 | 6.2% |
| 10 to 14 Minutes | 32 | 5.2% |
| 15 to 19 Minutes | 63 | 10.2% |
| 20 to 24 Minutes | 85 | 13.8% |
| 25 to 29 Minutes | 70 | 11.4% |
| 30 to 34 Minutes | 109 | 17.7% |
| 35 to 39 Minutes | 34 | 5.5% |
| 40 to 44 Minutes | 66 | 10.7% |
| 45 to 59 Minutes | 28 | 4.5% |
| 60 to 89 Minutes | 32 | 5.2% |
| 90 or more Minutes | 13 | 2.1% |
Commute Time by Sex in Crothersville
The most common commute times in Crothersville are 30 to 34 minutes (56 commuters, 16.2%) for males and 20 to 24 minutes (61 commuters, 22.7%) for females.
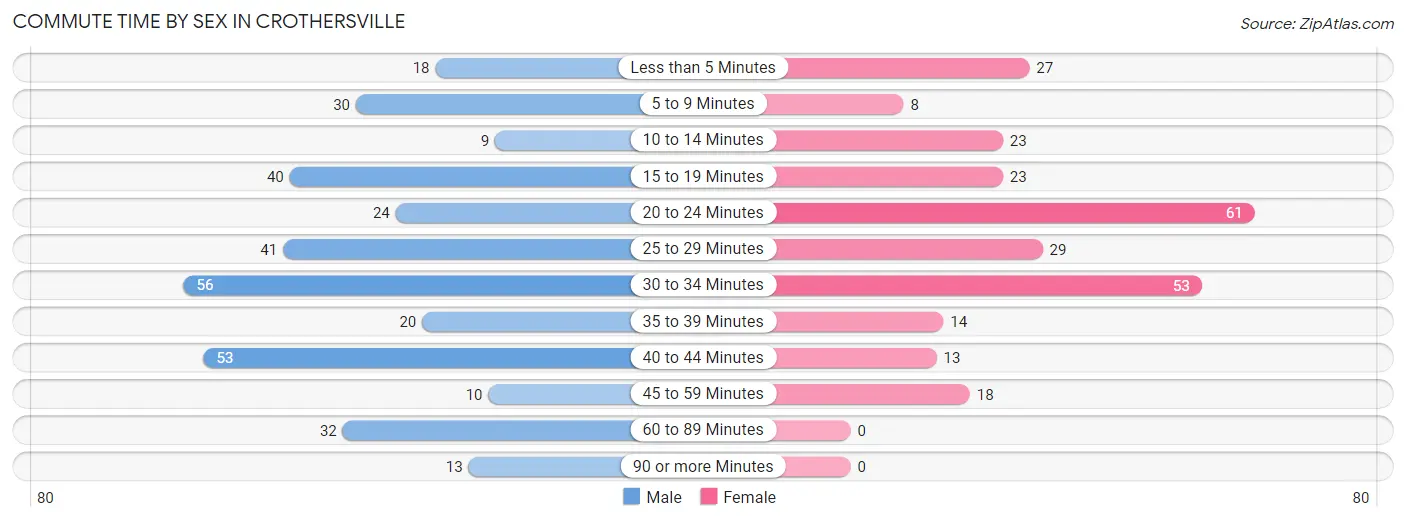
| Commute Time | Male | Female |
| Less than 5 Minutes | 18 (5.2%) | 27 (10.0%) |
| 5 to 9 Minutes | 30 (8.7%) | 8 (3.0%) |
| 10 to 14 Minutes | 9 (2.6%) | 23 (8.6%) |
| 15 to 19 Minutes | 40 (11.6%) | 23 (8.6%) |
| 20 to 24 Minutes | 24 (6.9%) | 61 (22.7%) |
| 25 to 29 Minutes | 41 (11.8%) | 29 (10.8%) |
| 30 to 34 Minutes | 56 (16.2%) | 53 (19.7%) |
| 35 to 39 Minutes | 20 (5.8%) | 14 (5.2%) |
| 40 to 44 Minutes | 53 (15.3%) | 13 (4.8%) |
| 45 to 59 Minutes | 10 (2.9%) | 18 (6.7%) |
| 60 to 89 Minutes | 32 (9.2%) | 0 (0.0%) |
| 90 or more Minutes | 13 (3.8%) | 0 (0.0%) |
Time of Departure to Work by Sex in Crothersville
The most frequent times of departure to work in Crothersville are 6:00 AM to 6:29 AM (65, 18.8%) for males and 12:00 AM to 4:59 AM (37, 13.8%) for females.
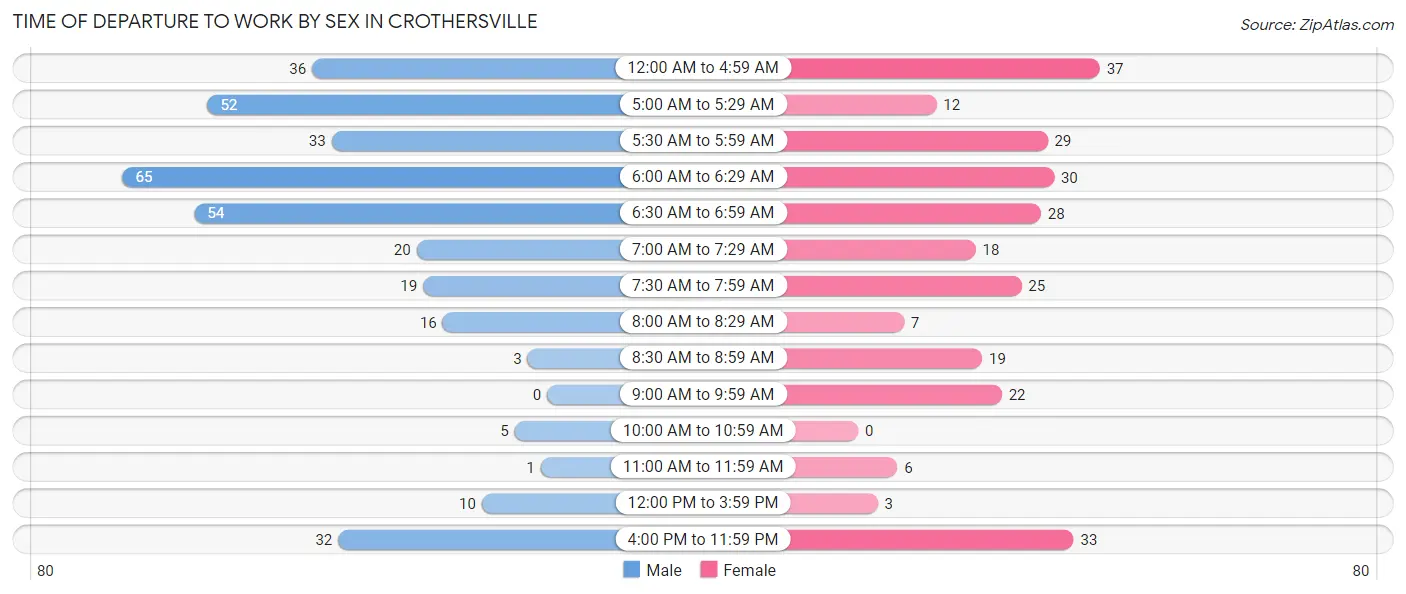
| Time of Departure | Male | Female |
| 12:00 AM to 4:59 AM | 36 (10.4%) | 37 (13.8%) |
| 5:00 AM to 5:29 AM | 52 (15.0%) | 12 (4.5%) |
| 5:30 AM to 5:59 AM | 33 (9.5%) | 29 (10.8%) |
| 6:00 AM to 6:29 AM | 65 (18.8%) | 30 (11.2%) |
| 6:30 AM to 6:59 AM | 54 (15.6%) | 28 (10.4%) |
| 7:00 AM to 7:29 AM | 20 (5.8%) | 18 (6.7%) |
| 7:30 AM to 7:59 AM | 19 (5.5%) | 25 (9.3%) |
| 8:00 AM to 8:29 AM | 16 (4.6%) | 7 (2.6%) |
| 8:30 AM to 8:59 AM | 3 (0.9%) | 19 (7.1%) |
| 9:00 AM to 9:59 AM | 0 (0.0%) | 22 (8.2%) |
| 10:00 AM to 10:59 AM | 5 (1.5%) | 0 (0.0%) |
| 11:00 AM to 11:59 AM | 1 (0.3%) | 6 (2.2%) |
| 12:00 PM to 3:59 PM | 10 (2.9%) | 3 (1.1%) |
| 4:00 PM to 11:59 PM | 32 (9.2%) | 33 (12.3%) |
| Total | 346 (100.0%) | 269 (100.0%) |
Housing Occupancy in Crothersville
Occupancy by Ownership in Crothersville
Of the total 609 dwellings in Crothersville, owner-occupied units account for 462 (75.9%), while renter-occupied units make up 147 (24.1%).
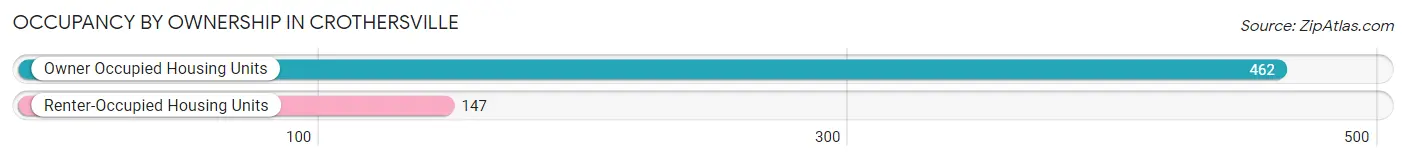
| Occupancy | # Housing Units | % Housing Units |
| Owner Occupied Housing Units | 462 | 75.9% |
| Renter-Occupied Housing Units | 147 | 24.1% |
| Total Occupied Housing Units | 609 | 100.0% |
Occupancy by Household Size in Crothersville
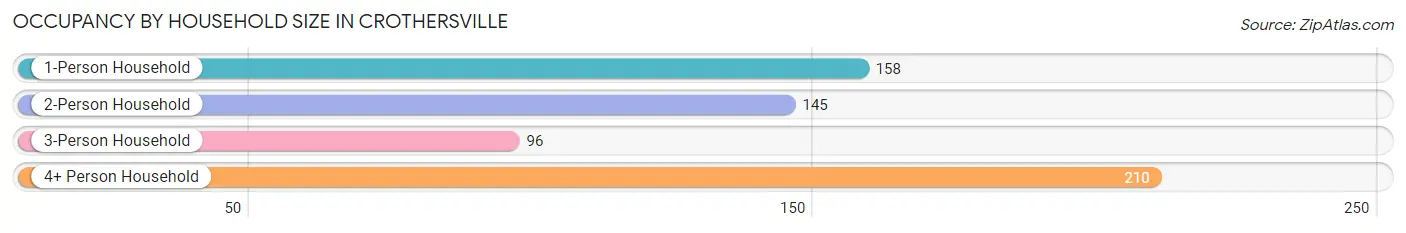
| Household Size | # Housing Units | % Housing Units |
| 1-Person Household | 158 | 25.9% |
| 2-Person Household | 145 | 23.8% |
| 3-Person Household | 96 | 15.8% |
| 4+ Person Household | 210 | 34.5% |
| Total Housing Units | 609 | 100.0% |
Occupancy by Ownership by Household Size in Crothersville
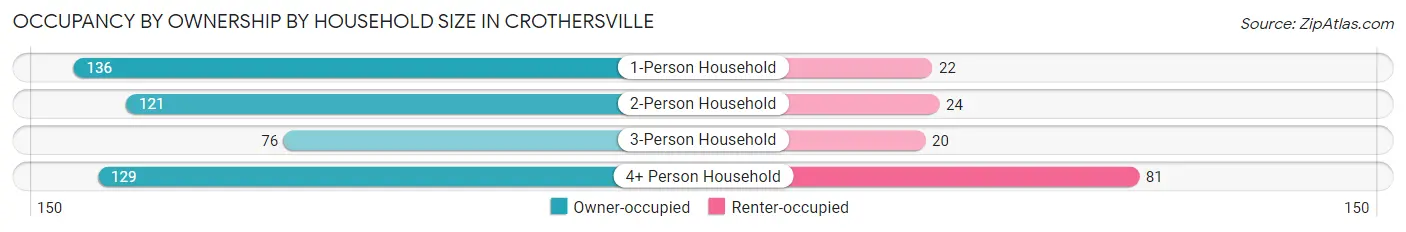
| Household Size | Owner-occupied | Renter-occupied |
| 1-Person Household | 136 (86.1%) | 22 (13.9%) |
| 2-Person Household | 121 (83.5%) | 24 (16.6%) |
| 3-Person Household | 76 (79.2%) | 20 (20.8%) |
| 4+ Person Household | 129 (61.4%) | 81 (38.6%) |
| Total Housing Units | 462 (75.9%) | 147 (24.1%) |
Occupancy by Educational Attainment in Crothersville
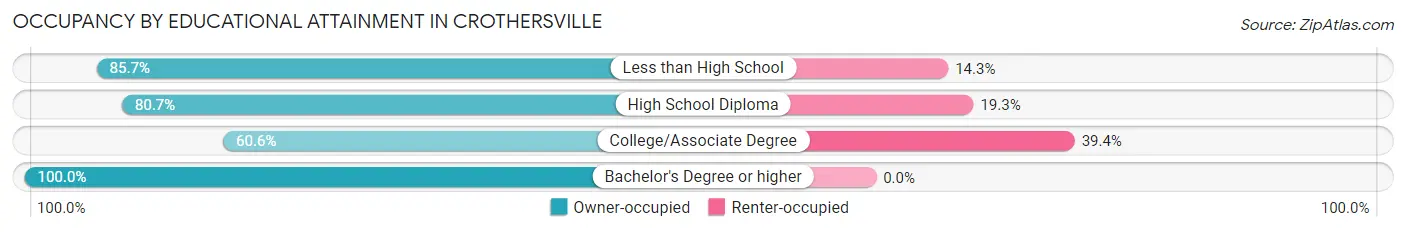
| Household Size | Owner-occupied | Renter-occupied |
| Less than High School | 48 (85.7%) | 8 (14.3%) |
| High School Diploma | 272 (80.7%) | 65 (19.3%) |
| College/Associate Degree | 114 (60.6%) | 74 (39.4%) |
| Bachelor's Degree or higher | 28 (100.0%) | 0 (0.0%) |
Occupancy by Age of Householder in Crothersville
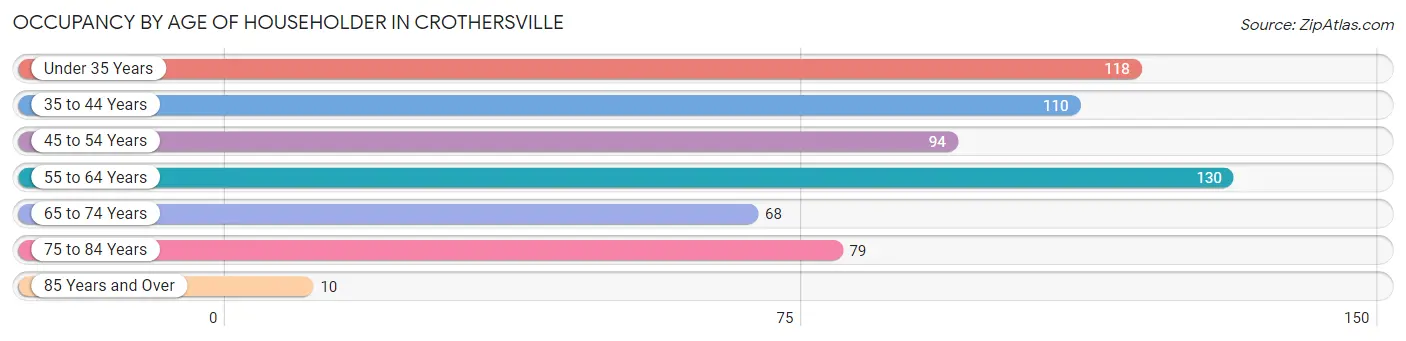
| Age Bracket | # Households | % Households |
| Under 35 Years | 118 | 19.4% |
| 35 to 44 Years | 110 | 18.1% |
| 45 to 54 Years | 94 | 15.4% |
| 55 to 64 Years | 130 | 21.3% |
| 65 to 74 Years | 68 | 11.2% |
| 75 to 84 Years | 79 | 13.0% |
| 85 Years and Over | 10 | 1.6% |
| Total | 609 | 100.0% |
Housing Finances in Crothersville
Median Income by Occupancy in Crothersville
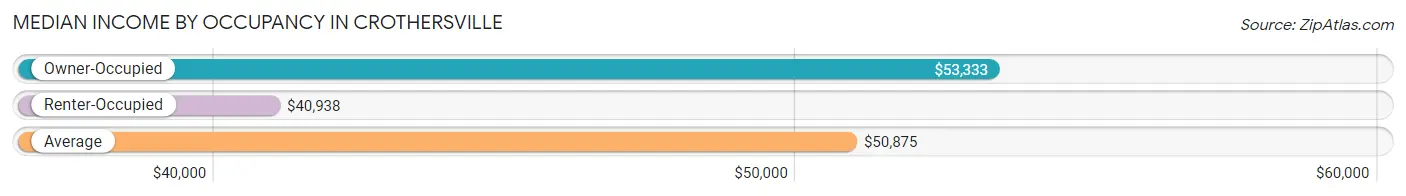
| Occupancy Type | # Households | Median Income |
| Owner-Occupied | 462 (75.9%) | $53,333 |
| Renter-Occupied | 147 (24.1%) | $40,938 |
| Average | 609 (100.0%) | $50,875 |
Occupancy by Householder Income Bracket in Crothersville
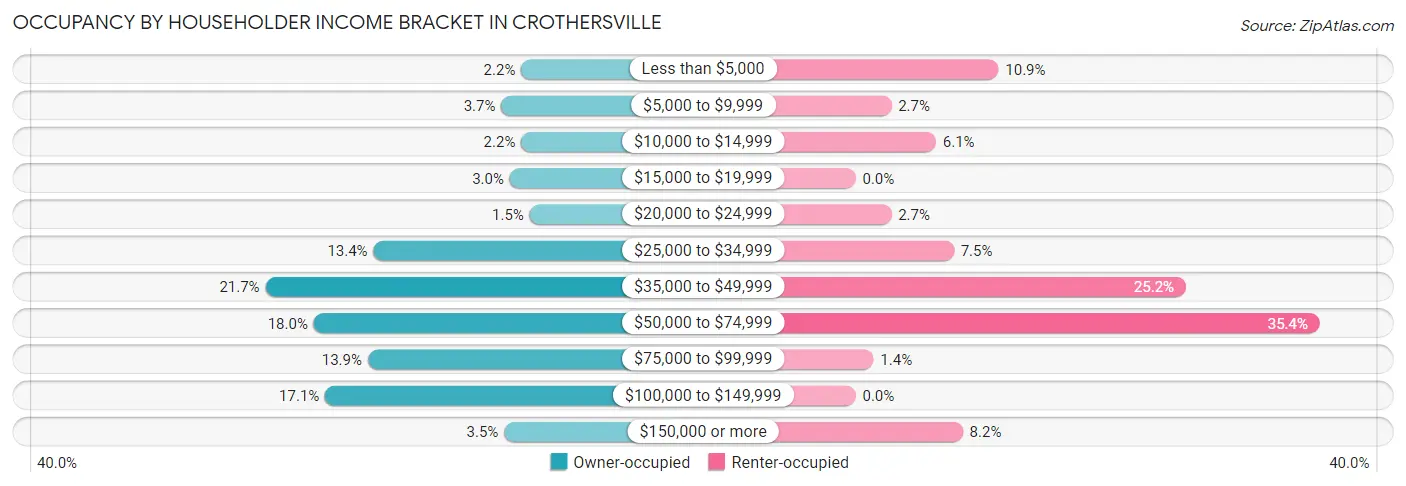
| Income Bracket | Owner-occupied | Renter-occupied |
| Less than $5,000 | 10 (2.2%) | 16 (10.9%) |
| $5,000 to $9,999 | 17 (3.7%) | 4 (2.7%) |
| $10,000 to $14,999 | 10 (2.2%) | 9 (6.1%) |
| $15,000 to $19,999 | 14 (3.0%) | 0 (0.0%) |
| $20,000 to $24,999 | 7 (1.5%) | 4 (2.7%) |
| $25,000 to $34,999 | 62 (13.4%) | 11 (7.5%) |
| $35,000 to $49,999 | 100 (21.6%) | 37 (25.2%) |
| $50,000 to $74,999 | 83 (18.0%) | 52 (35.4%) |
| $75,000 to $99,999 | 64 (13.9%) | 2 (1.4%) |
| $100,000 to $149,999 | 79 (17.1%) | 0 (0.0%) |
| $150,000 or more | 16 (3.5%) | 12 (8.2%) |
| Total | 462 (100.0%) | 147 (100.0%) |
Monthly Housing Cost Tiers in Crothersville
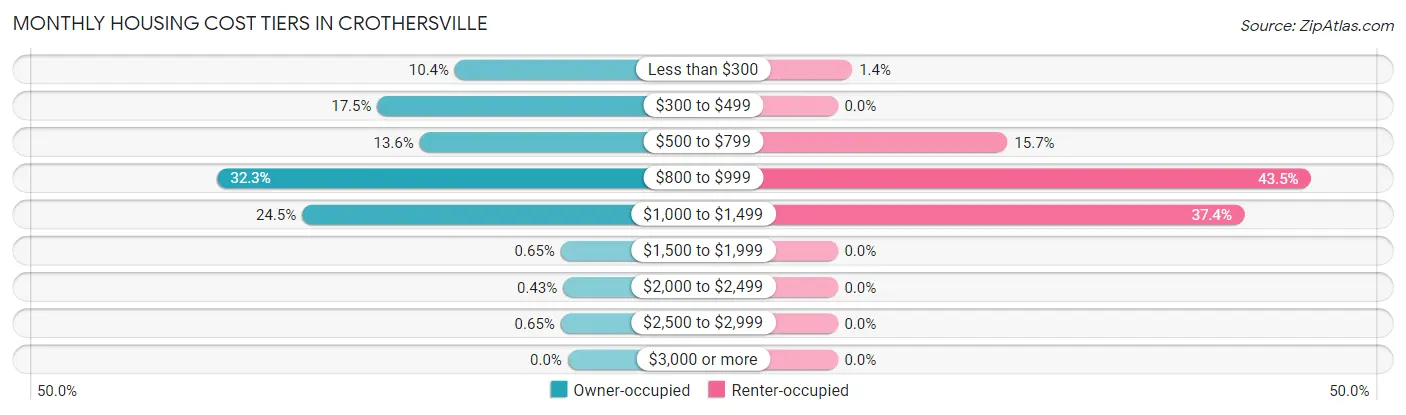
| Monthly Cost | Owner-occupied | Renter-occupied |
| Less than $300 | 48 (10.4%) | 2 (1.4%) |
| $300 to $499 | 81 (17.5%) | 0 (0.0%) |
| $500 to $799 | 63 (13.6%) | 23 (15.7%) |
| $800 to $999 | 149 (32.3%) | 64 (43.5%) |
| $1,000 to $1,499 | 113 (24.5%) | 55 (37.4%) |
| $1,500 to $1,999 | 3 (0.6%) | 0 (0.0%) |
| $2,000 to $2,499 | 2 (0.4%) | 0 (0.0%) |
| $2,500 to $2,999 | 3 (0.6%) | 0 (0.0%) |
| $3,000 or more | 0 (0.0%) | 0 (0.0%) |
| Total | 462 (100.0%) | 147 (100.0%) |
Physical Housing Characteristics in Crothersville
Housing Structures in Crothersville
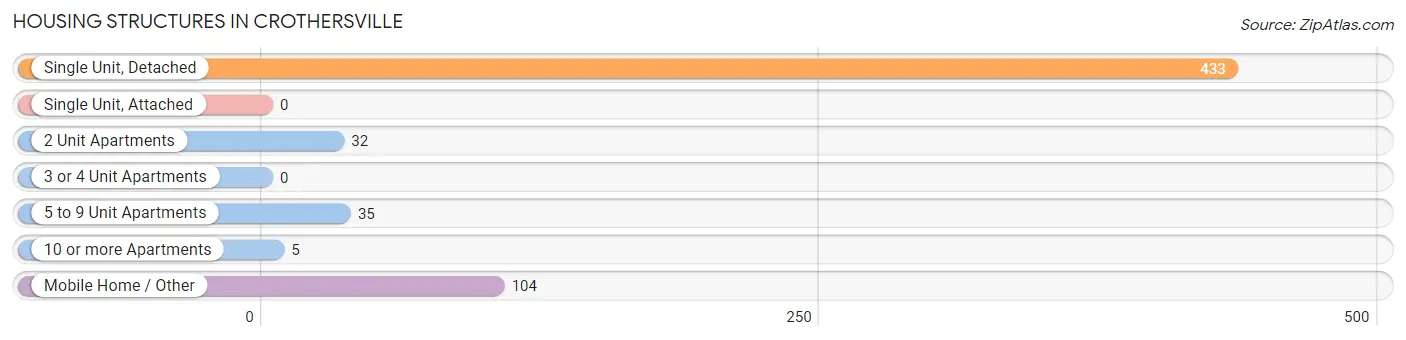
| Structure Type | # Housing Units | % Housing Units |
| Single Unit, Detached | 433 | 71.1% |
| Single Unit, Attached | 0 | 0.0% |
| 2 Unit Apartments | 32 | 5.2% |
| 3 or 4 Unit Apartments | 0 | 0.0% |
| 5 to 9 Unit Apartments | 35 | 5.8% |
| 10 or more Apartments | 5 | 0.8% |
| Mobile Home / Other | 104 | 17.1% |
| Total | 609 | 100.0% |
Housing Structures by Occupancy in Crothersville
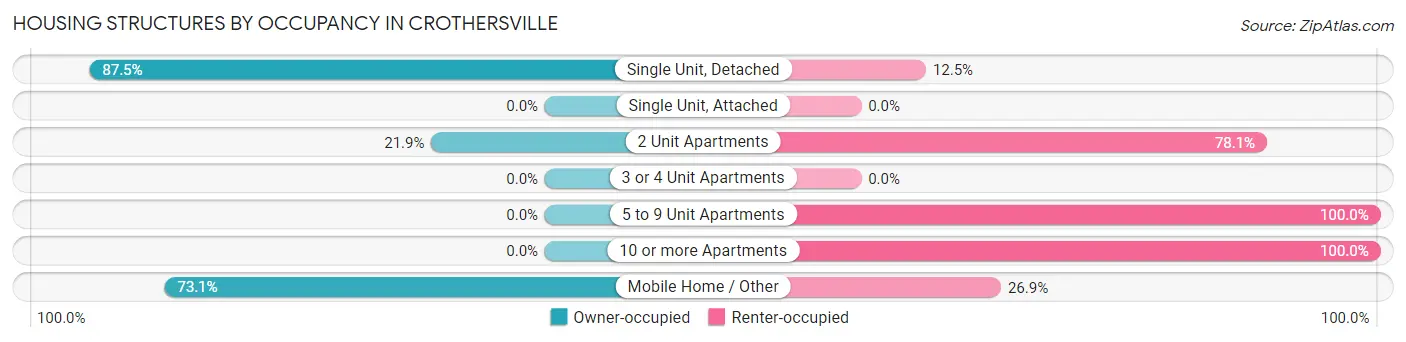
| Structure Type | Owner-occupied | Renter-occupied |
| Single Unit, Detached | 379 (87.5%) | 54 (12.5%) |
| Single Unit, Attached | 0 (0.0%) | 0 (0.0%) |
| 2 Unit Apartments | 7 (21.9%) | 25 (78.1%) |
| 3 or 4 Unit Apartments | 0 (0.0%) | 0 (0.0%) |
| 5 to 9 Unit Apartments | 0 (0.0%) | 35 (100.0%) |
| 10 or more Apartments | 0 (0.0%) | 5 (100.0%) |
| Mobile Home / Other | 76 (73.1%) | 28 (26.9%) |
| Total | 462 (75.9%) | 147 (24.1%) |
Housing Structures by Number of Rooms in Crothersville
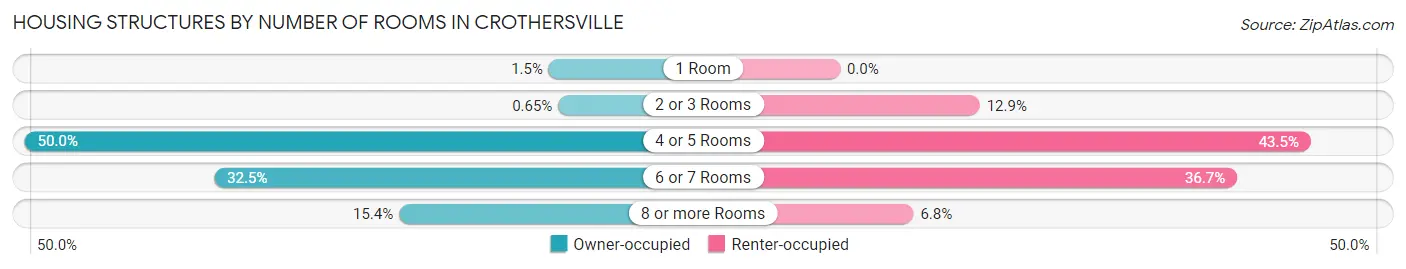
| Number of Rooms | Owner-occupied | Renter-occupied |
| 1 Room | 7 (1.5%) | 0 (0.0%) |
| 2 or 3 Rooms | 3 (0.6%) | 19 (12.9%) |
| 4 or 5 Rooms | 231 (50.0%) | 64 (43.5%) |
| 6 or 7 Rooms | 150 (32.5%) | 54 (36.7%) |
| 8 or more Rooms | 71 (15.4%) | 10 (6.8%) |
| Total | 462 (100.0%) | 147 (100.0%) |
Housing Structure by Heating Type in Crothersville
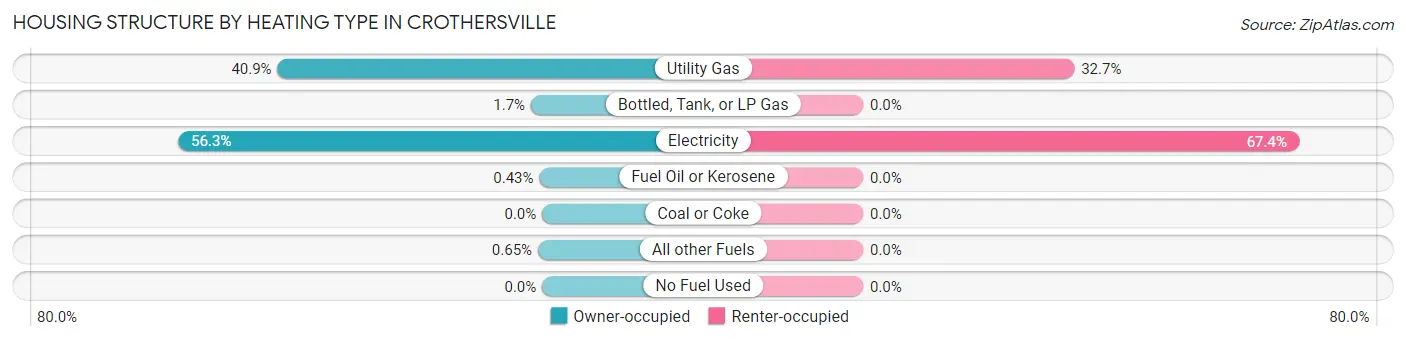
| Heating Type | Owner-occupied | Renter-occupied |
| Utility Gas | 189 (40.9%) | 48 (32.7%) |
| Bottled, Tank, or LP Gas | 8 (1.7%) | 0 (0.0%) |
| Electricity | 260 (56.3%) | 99 (67.3%) |
| Fuel Oil or Kerosene | 2 (0.4%) | 0 (0.0%) |
| Coal or Coke | 0 (0.0%) | 0 (0.0%) |
| All other Fuels | 3 (0.6%) | 0 (0.0%) |
| No Fuel Used | 0 (0.0%) | 0 (0.0%) |
| Total | 462 (100.0%) | 147 (100.0%) |
Household Vehicle Usage in Crothersville
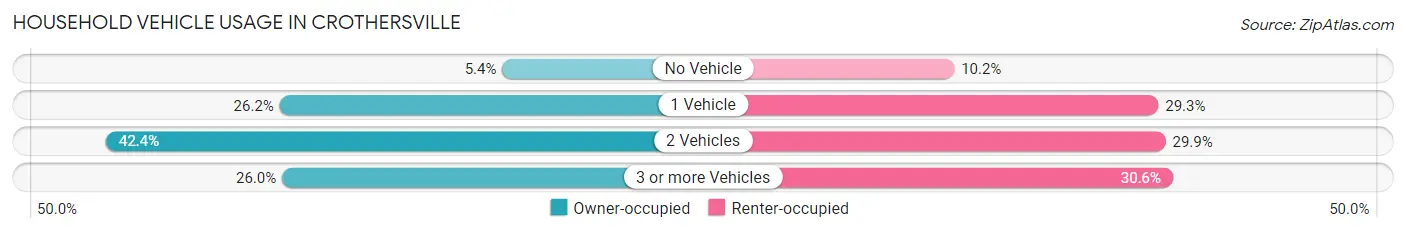
| Vehicles per Household | Owner-occupied | Renter-occupied |
| No Vehicle | 25 (5.4%) | 15 (10.2%) |
| 1 Vehicle | 121 (26.2%) | 43 (29.2%) |
| 2 Vehicles | 196 (42.4%) | 44 (29.9%) |
| 3 or more Vehicles | 120 (26.0%) | 45 (30.6%) |
| Total | 462 (100.0%) | 147 (100.0%) |
Real Estate & Mortgages in Crothersville
Real Estate and Mortgage Overview in Crothersville
| Characteristic | Without Mortgage | With Mortgage |
| Housing Units | 172 | 290 |
| Median Property Value | $101,600 | $101,800 |
| Median Household Income | $39,891 | $13 |
| Monthly Housing Costs | $400 | $0 |
| Real Estate Taxes | $523 | $6 |
Property Value by Mortgage Status in Crothersville
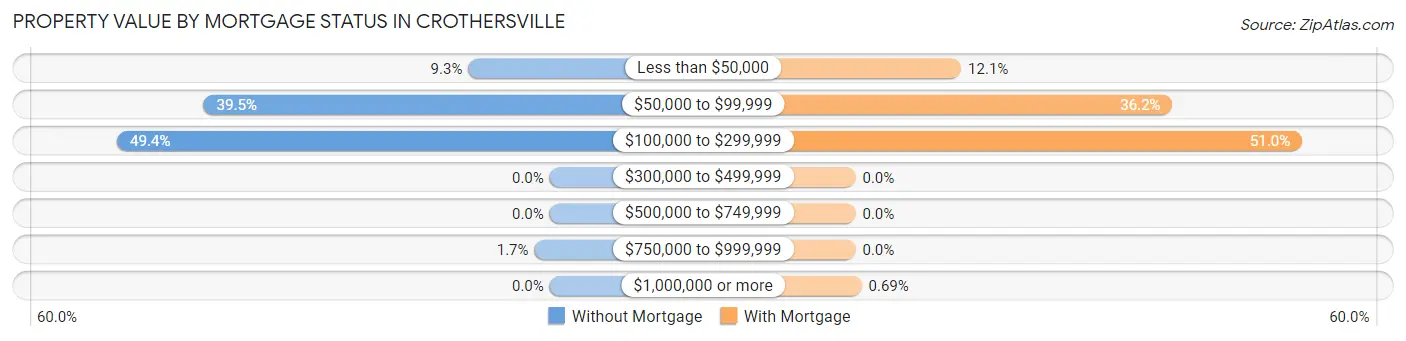
| Property Value | Without Mortgage | With Mortgage |
| Less than $50,000 | 16 (9.3%) | 35 (12.1%) |
| $50,000 to $99,999 | 68 (39.5%) | 105 (36.2%) |
| $100,000 to $299,999 | 85 (49.4%) | 148 (51.0%) |
| $300,000 to $499,999 | 0 (0.0%) | 0 (0.0%) |
| $500,000 to $749,999 | 0 (0.0%) | 0 (0.0%) |
| $750,000 to $999,999 | 3 (1.7%) | 0 (0.0%) |
| $1,000,000 or more | 0 (0.0%) | 2 (0.7%) |
| Total | 172 (100.0%) | 290 (100.0%) |
Household Income by Mortgage Status in Crothersville
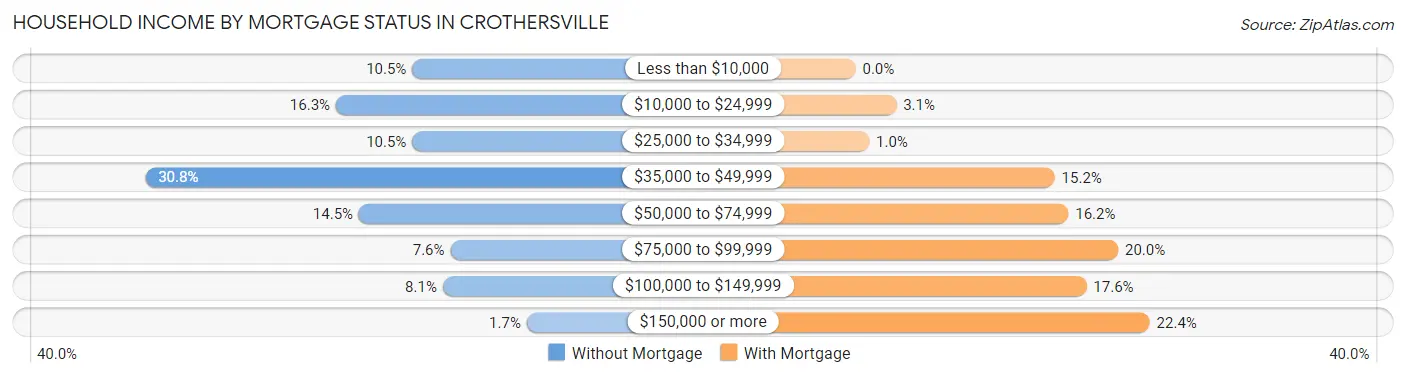
| Household Income | Without Mortgage | With Mortgage |
| Less than $10,000 | 18 (10.5%) | 0 (0.0%) |
| $10,000 to $24,999 | 28 (16.3%) | 9 (3.1%) |
| $25,000 to $34,999 | 18 (10.5%) | 3 (1.0%) |
| $35,000 to $49,999 | 53 (30.8%) | 44 (15.2%) |
| $50,000 to $74,999 | 25 (14.5%) | 47 (16.2%) |
| $75,000 to $99,999 | 13 (7.6%) | 58 (20.0%) |
| $100,000 to $149,999 | 14 (8.1%) | 51 (17.6%) |
| $150,000 or more | 3 (1.7%) | 65 (22.4%) |
| Total | 172 (100.0%) | 290 (100.0%) |
Property Value to Household Income Ratio in Crothersville
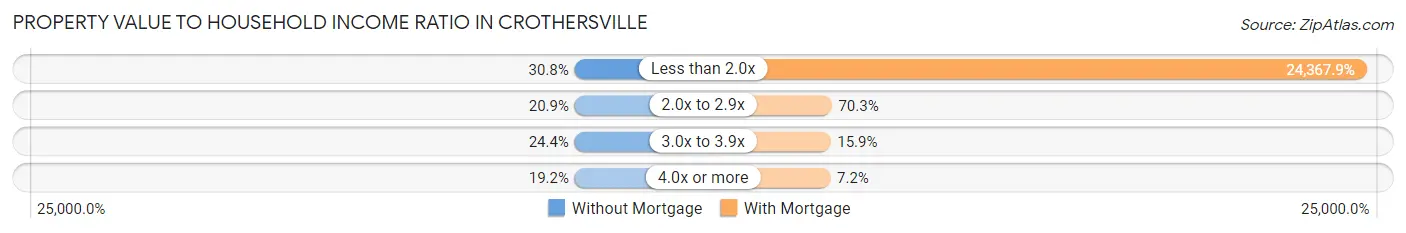
| Value-to-Income Ratio | Without Mortgage | With Mortgage |
| Less than 2.0x | 53 (30.8%) | 70,667 (24,367.9%) |
| 2.0x to 2.9x | 36 (20.9%) | 204 (70.3%) |
| 3.0x to 3.9x | 42 (24.4%) | 46 (15.9%) |
| 4.0x or more | 33 (19.2%) | 21 (7.2%) |
| Total | 172 (100.0%) | 290 (100.0%) |
Real Estate Taxes by Mortgage Status in Crothersville
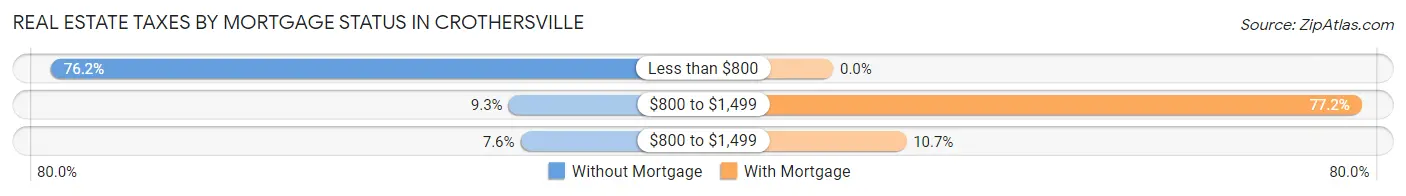
| Property Taxes | Without Mortgage | With Mortgage |
| Less than $800 | 131 (76.2%) | 0 (0.0%) |
| $800 to $1,499 | 16 (9.3%) | 224 (77.2%) |
| $800 to $1,499 | 13 (7.6%) | 31 (10.7%) |
| Total | 172 (100.0%) | 290 (100.0%) |
Health & Disability in Crothersville
Health Insurance Coverage by Age in Crothersville
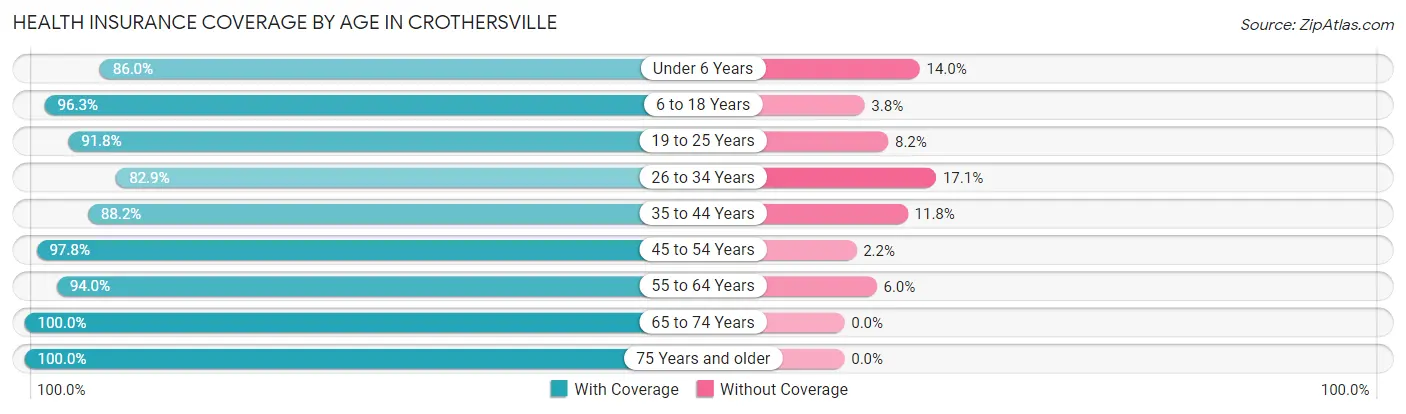
| Age Bracket | With Coverage | Without Coverage |
| Under 6 Years | 147 (86.0%) | 24 (14.0%) |
| 6 to 18 Years | 411 (96.3%) | 16 (3.7%) |
| 19 to 25 Years | 135 (91.8%) | 12 (8.2%) |
| 26 to 34 Years | 160 (82.9%) | 33 (17.1%) |
| 35 to 44 Years | 209 (88.2%) | 28 (11.8%) |
| 45 to 54 Years | 132 (97.8%) | 3 (2.2%) |
| 55 to 64 Years | 219 (94.0%) | 14 (6.0%) |
| 65 to 74 Years | 107 (100.0%) | 0 (0.0%) |
| 75 Years and older | 146 (100.0%) | 0 (0.0%) |
| Total | 1,666 (92.8%) | 130 (7.2%) |
Health Insurance Coverage by Citizenship Status in Crothersville
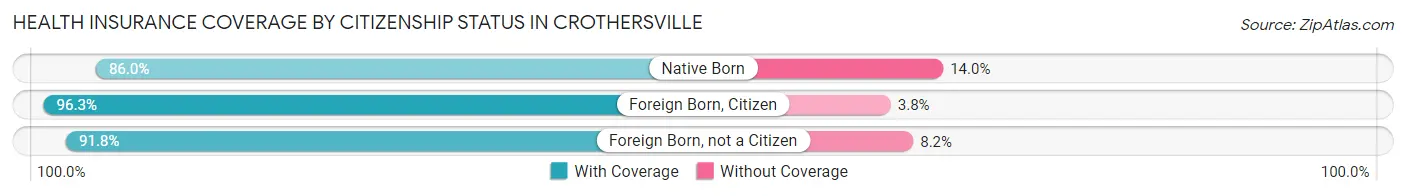
| Citizenship Status | With Coverage | Without Coverage |
| Native Born | 147 (86.0%) | 24 (14.0%) |
| Foreign Born, Citizen | 411 (96.3%) | 16 (3.7%) |
| Foreign Born, not a Citizen | 135 (91.8%) | 12 (8.2%) |
Health Insurance Coverage by Household Income in Crothersville
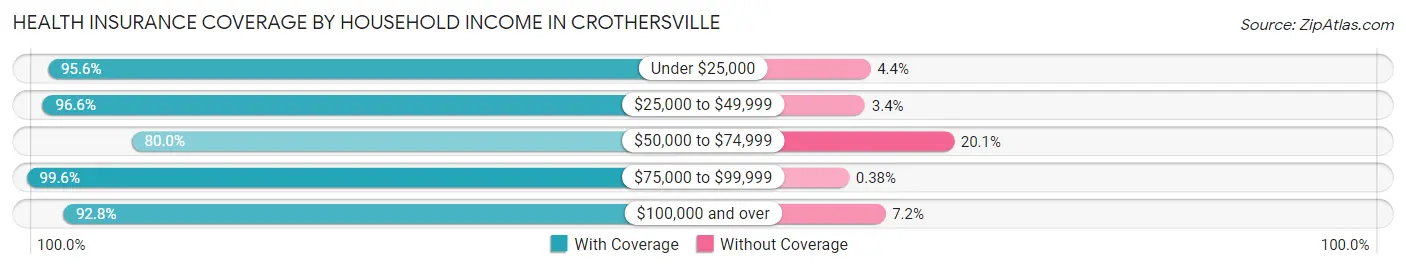
| Household Income | With Coverage | Without Coverage |
| Under $25,000 | 109 (95.6%) | 5 (4.4%) |
| $25,000 to $49,999 | 629 (96.6%) | 22 (3.4%) |
| $50,000 to $74,999 | 291 (79.9%) | 73 (20.1%) |
| $75,000 to $99,999 | 263 (99.6%) | 1 (0.4%) |
| $100,000 and over | 374 (92.8%) | 29 (7.2%) |
Public vs Private Health Insurance Coverage by Age in Crothersville
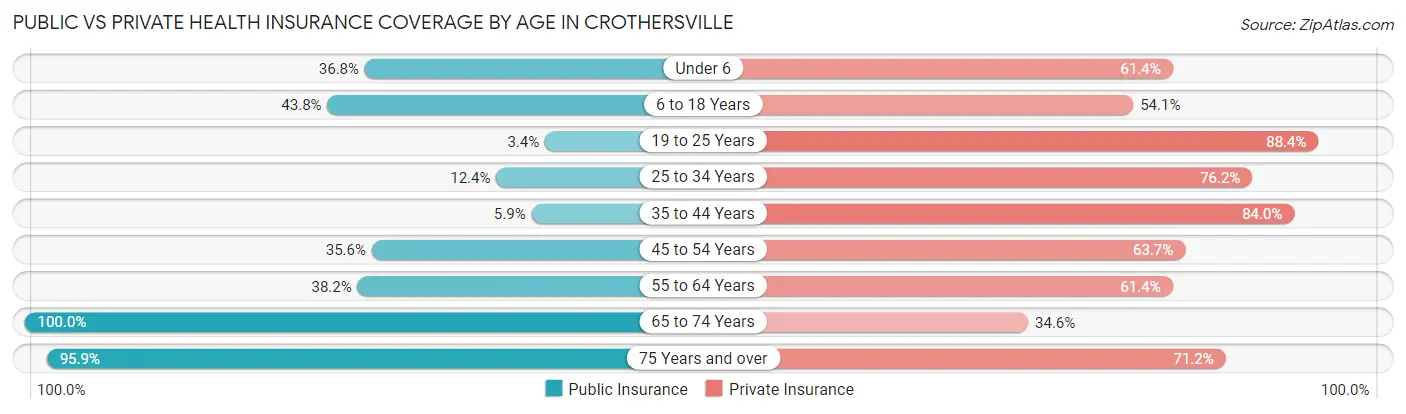
| Age Bracket | Public Insurance | Private Insurance |
| Under 6 | 63 (36.8%) | 105 (61.4%) |
| 6 to 18 Years | 187 (43.8%) | 231 (54.1%) |
| 19 to 25 Years | 5 (3.4%) | 130 (88.4%) |
| 25 to 34 Years | 24 (12.4%) | 147 (76.2%) |
| 35 to 44 Years | 14 (5.9%) | 199 (84.0%) |
| 45 to 54 Years | 48 (35.6%) | 86 (63.7%) |
| 55 to 64 Years | 89 (38.2%) | 143 (61.4%) |
| 65 to 74 Years | 107 (100.0%) | 37 (34.6%) |
| 75 Years and over | 140 (95.9%) | 104 (71.2%) |
| Total | 677 (37.7%) | 1,182 (65.8%) |
Disability Status by Sex by Age in Crothersville
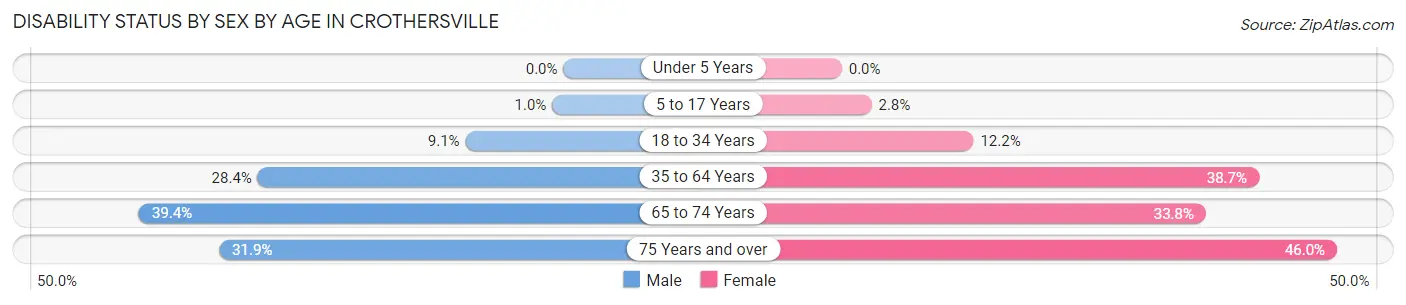
| Age Bracket | Male | Female |
| Under 5 Years | 0 (0.0%) | 0 (0.0%) |
| 5 to 17 Years | 3 (1.0%) | 4 (2.8%) |
| 18 to 34 Years | 13 (9.1%) | 27 (12.2%) |
| 35 to 64 Years | 80 (28.4%) | 125 (38.7%) |
| 65 to 74 Years | 13 (39.4%) | 25 (33.8%) |
| 75 Years and over | 23 (31.9%) | 34 (46.0%) |
Disability Class by Sex by Age in Crothersville
Disability Class: Hearing Difficulty
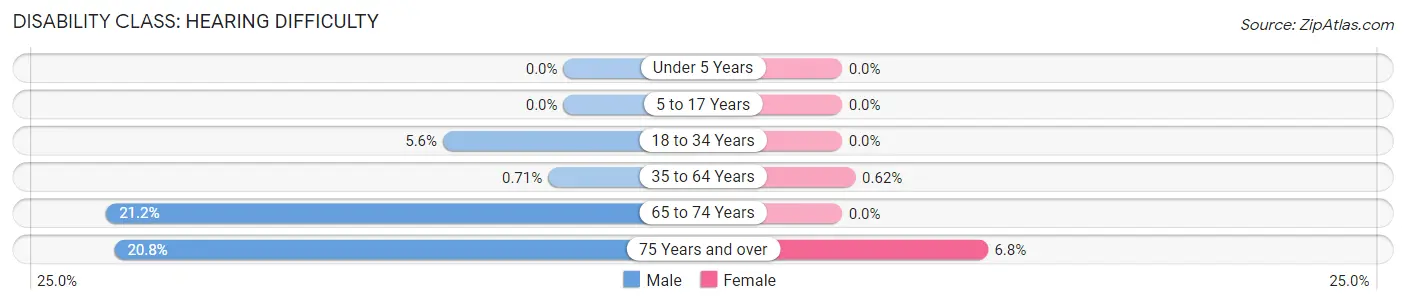
| Age Bracket | Male | Female |
| Under 5 Years | 0 (0.0%) | 0 (0.0%) |
| 5 to 17 Years | 0 (0.0%) | 0 (0.0%) |
| 18 to 34 Years | 8 (5.6%) | 0 (0.0%) |
| 35 to 64 Years | 2 (0.7%) | 2 (0.6%) |
| 65 to 74 Years | 7 (21.2%) | 0 (0.0%) |
| 75 Years and over | 15 (20.8%) | 5 (6.8%) |
Disability Class: Vision Difficulty
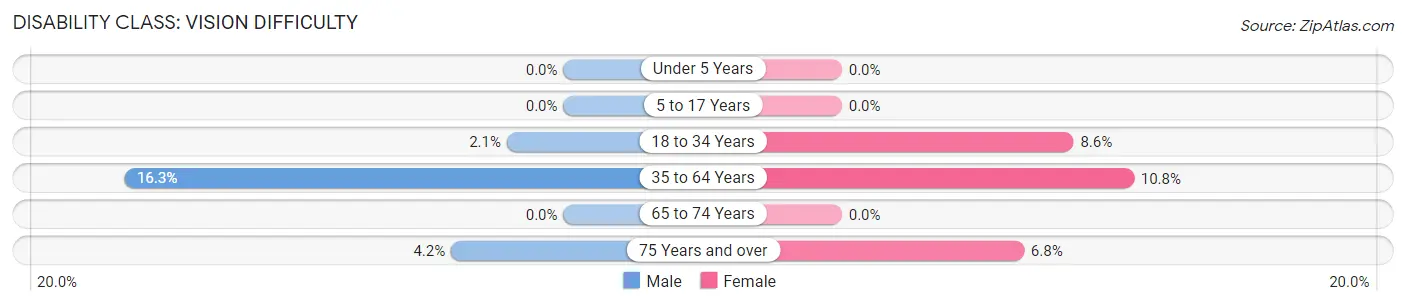
| Age Bracket | Male | Female |
| Under 5 Years | 0 (0.0%) | 0 (0.0%) |
| 5 to 17 Years | 0 (0.0%) | 0 (0.0%) |
| 18 to 34 Years | 3 (2.1%) | 19 (8.6%) |
| 35 to 64 Years | 46 (16.3%) | 35 (10.8%) |
| 65 to 74 Years | 0 (0.0%) | 0 (0.0%) |
| 75 Years and over | 3 (4.2%) | 5 (6.8%) |
Disability Class: Cognitive Difficulty
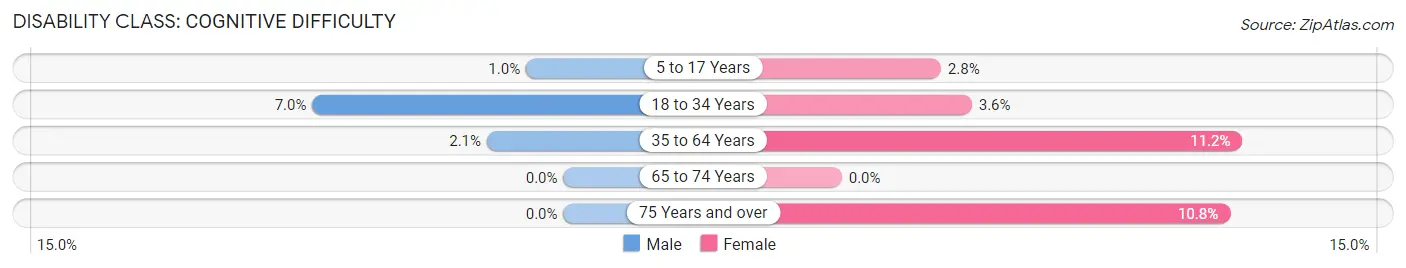
| Age Bracket | Male | Female |
| 5 to 17 Years | 3 (1.0%) | 4 (2.8%) |
| 18 to 34 Years | 10 (7.0%) | 8 (3.6%) |
| 35 to 64 Years | 6 (2.1%) | 36 (11.2%) |
| 65 to 74 Years | 0 (0.0%) | 0 (0.0%) |
| 75 Years and over | 0 (0.0%) | 8 (10.8%) |
Disability Class: Ambulatory Difficulty
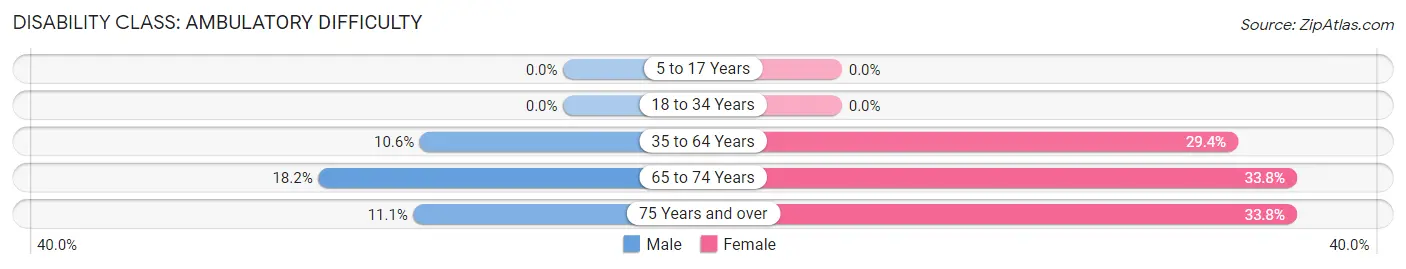
| Age Bracket | Male | Female |
| 5 to 17 Years | 0 (0.0%) | 0 (0.0%) |
| 18 to 34 Years | 0 (0.0%) | 0 (0.0%) |
| 35 to 64 Years | 30 (10.6%) | 95 (29.4%) |
| 65 to 74 Years | 6 (18.2%) | 25 (33.8%) |
| 75 Years and over | 8 (11.1%) | 25 (33.8%) |
Disability Class: Self-Care Difficulty
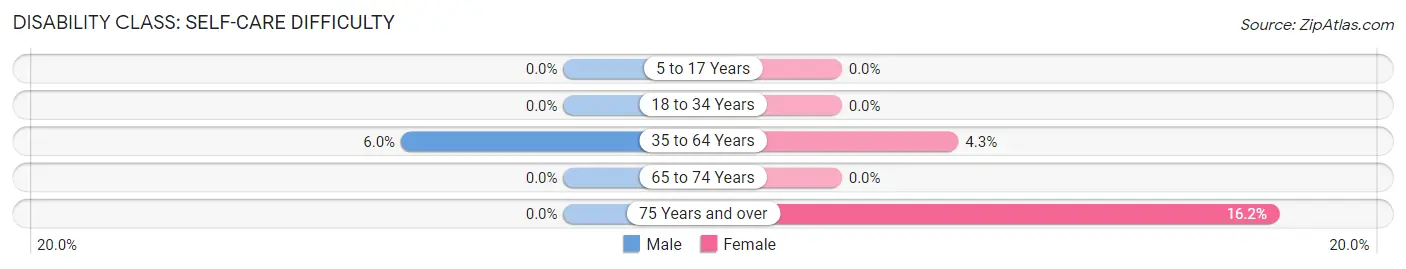
| Age Bracket | Male | Female |
| 5 to 17 Years | 0 (0.0%) | 0 (0.0%) |
| 18 to 34 Years | 0 (0.0%) | 0 (0.0%) |
| 35 to 64 Years | 17 (6.0%) | 14 (4.3%) |
| 65 to 74 Years | 0 (0.0%) | 0 (0.0%) |
| 75 Years and over | 0 (0.0%) | 12 (16.2%) |
Technology Access in Crothersville
Computing Device Access in Crothersville
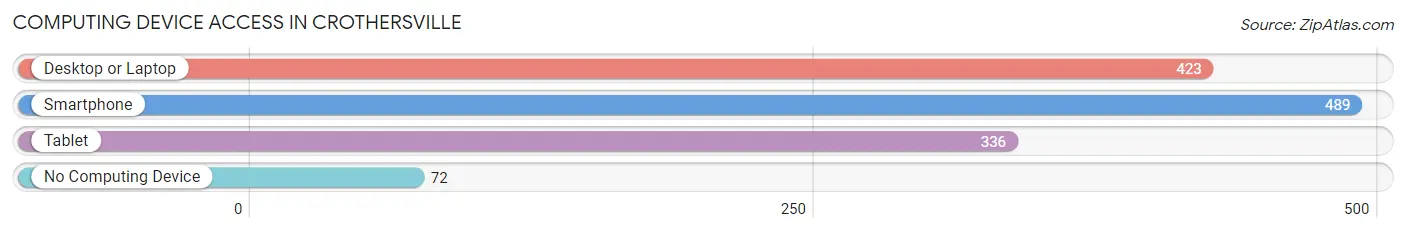
| Device Type | # Households | % Households |
| Desktop or Laptop | 423 | 69.5% |
| Smartphone | 489 | 80.3% |
| Tablet | 336 | 55.2% |
| No Computing Device | 72 | 11.8% |
| Total | 609 | 100.0% |
Internet Access in Crothersville
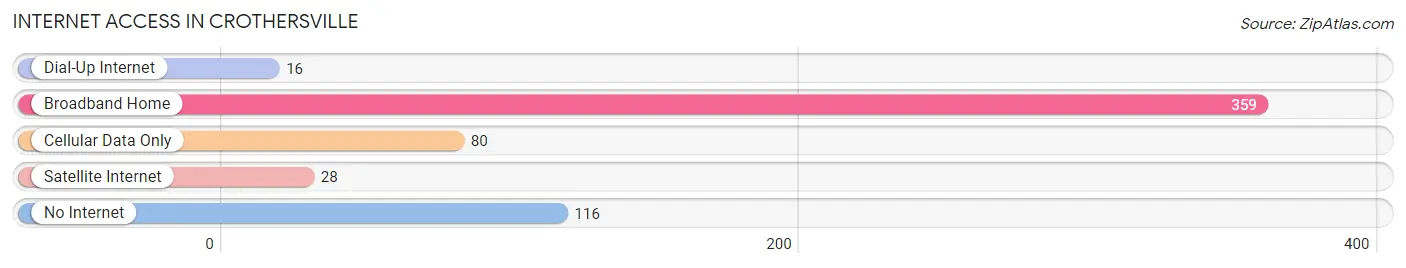
| Internet Type | # Households | % Households |
| Dial-Up Internet | 16 | 2.6% |
| Broadband Home | 359 | 59.0% |
| Cellular Data Only | 80 | 13.1% |
| Satellite Internet | 28 | 4.6% |
| No Internet | 116 | 19.1% |
| Total | 609 | 100.0% |
Crothersville Summary
History
The town of Crothersville, Indiana is located in Jackson County, Indiana, and is part of the Seymour, Indiana Metropolitan Statistical Area. The town was founded in 1837 by William Crothers, a Revolutionary War veteran, and was originally known as Crothersville. The town was officially incorporated in 1872.
Crothersville has a rich history that dates back to the early 1800s. The town was a major stop on the Underground Railroad, and was home to many abolitionists who helped slaves escape to freedom. The town was also home to a large number of German immigrants who settled in the area in the mid-1800s.
Geography
Crothersville is located in the southeastern part of Jackson County, Indiana, and is situated along the Muscatatuck River. The town is located approximately 30 miles south of Indianapolis and is part of the Seymour, Indiana Metropolitan Statistical Area. The town has a total area of 1.2 square miles, all of which is land.
The town is located in a rural area and is surrounded by farmland. The town is also located near the Hoosier National Forest, which is a popular destination for outdoor recreation.
Economy
Crothersville has a small but diverse economy. The town is home to a variety of businesses, including a grocery store, a hardware store, a pharmacy, a bank, and a variety of restaurants. The town is also home to a number of manufacturing companies, including a furniture manufacturer, a plastics manufacturer, and a metal fabrication company.
The town is also home to a number of small businesses, including a variety of antique stores, a winery, and a number of art galleries. The town is also home to a number of service-based businesses, including a number of auto repair shops, a veterinary clinic, and a number of beauty salons.
Demographics
As of the 2010 census, the town of Crothersville had a population of 1,717. The population is predominantly white, with a small percentage of African Americans, Hispanics, and Asians. The median household income in the town is $37,917, and the median age is 41.
The town is home to a number of churches, including the First Baptist Church, the First United Methodist Church, and the Church of the Nazarene. The town is also home to a number of schools, including Crothersville Elementary School, Crothersville Middle School, and Crothersville High School.
Conclusion
Crothersville, Indiana is a small town with a rich history and a diverse economy. The town is home to a variety of businesses, churches, and schools, and is a popular destination for outdoor recreation. The town has a population of 1,717, and the median household income is $37,917. The town is predominantly white, with a small percentage of African Americans, Hispanics, and Asians.
Common Questions
What is Per Capita Income in Crothersville?
Per Capita income in Crothersville is $22,887.
What is the Median Family Income in Crothersville?
Median Family Income in Crothersville is $67,361.
What is the Median Household income in Crothersville?
Median Household Income in Crothersville is $50,875.
What is Income or Wage Gap in Crothersville?
Income or Wage Gap in Crothersville is 20.2%.
Women in Crothersville earn 79.8 cents for every dollar earned by a man.
What is Inequality or Gini Index in Crothersville?
Inequality or Gini Index in Crothersville is 0.43.
What is the Total Population of Crothersville?
Total Population of Crothersville is 1,796.
What is the Total Male Population of Crothersville?
Total Male Population of Crothersville is 885.
What is the Total Female Population of Crothersville?
Total Female Population of Crothersville is 911.
What is the Ratio of Males per 100 Females in Crothersville?
There are 97.15 Males per 100 Females in Crothersville.
What is the Ratio of Females per 100 Males in Crothersville?
There are 102.94 Females per 100 Males in Crothersville.
What is the Median Population Age in Crothersville?
Median Population Age in Crothersville is 32.8 Years.
What is the Average Family Size in Crothersville
Average Family Size in Crothersville is 3.6 People.
What is the Average Household Size in Crothersville
Average Household Size in Crothersville is 3.0 People.
How Large is the Labor Force in Crothersville?
There are 656 People in the Labor Forcein in Crothersville.
What is the Percentage of People in the Labor Force in Crothersville?
48.0% of People are in the Labor Force in Crothersville.
What is the Unemployment Rate in Crothersville?
Unemployment Rate in Crothersville is 1.8%.