New Goshen, IN Map & Demographics
New Goshen Map
New Goshen Overview
$26,440
PER CAPITA INCOME
$90,667
AVG FAMILY INCOME
$71,655
AVG HOUSEHOLD INCOME
46.4%
WAGE / INCOME GAP [ % ]
53.6¢/ $1
WAGE / INCOME GAP [ $ ]
0.25
INEQUALITY / GINI INDEX
583
TOTAL POPULATION
228
MALE POPULATION
355
FEMALE POPULATION
64.23
MALES / 100 FEMALES
155.70
FEMALES / 100 MALES
39.2
MEDIAN AGE
3.5
AVG FAMILY SIZE
2.9
AVG HOUSEHOLD SIZE
376
LABOR FORCE [ PEOPLE ]
70.4%
PERCENT IN LABOR FORCE
10.4%
UNEMPLOYMENT RATE
New Goshen Zip Codes
Income in New Goshen
Income Overview in New Goshen
Per Capita Income in New Goshen is $26,440, while median incomes of families and households are $90,667 and $71,655 respectively.
| Characteristic | Number | Measure |
| Per Capita Income | 583 | $26,440 |
| Median Family Income | 142 | $90,667 |
| Mean Family Income | 142 | $87,062 |
| Median Household Income | 201 | $71,655 |
| Mean Household Income | 201 | $69,986 |
| Income Deficit | 142 | $0 |
| Wage / Income Gap (%) | 583 | 46.39% |
| Wage / Income Gap ($) | 583 | 53.61¢ per $1 |
| Gini / Inequality Index | 583 | 0.25 |
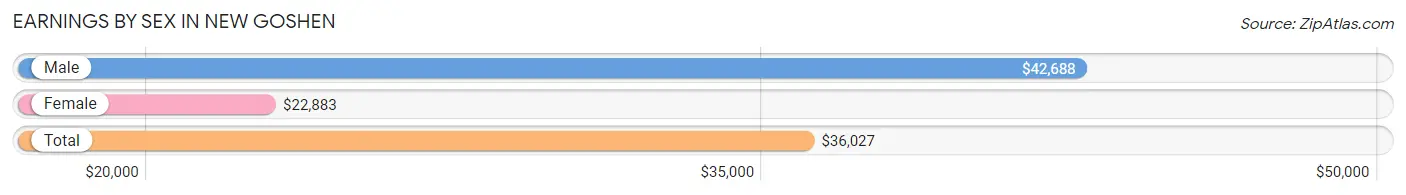
Earnings by Sex in New Goshen
Average Earnings in New Goshen are $36,027, $42,688 for men and $22,883 for women, a difference of 46.4%.
| Sex | Number | Average Earnings |
| Male | 145 (37.8%) | $42,688 |
| Female | 239 (62.2%) | $22,883 |
| Total | 384 (100.0%) | $36,027 |
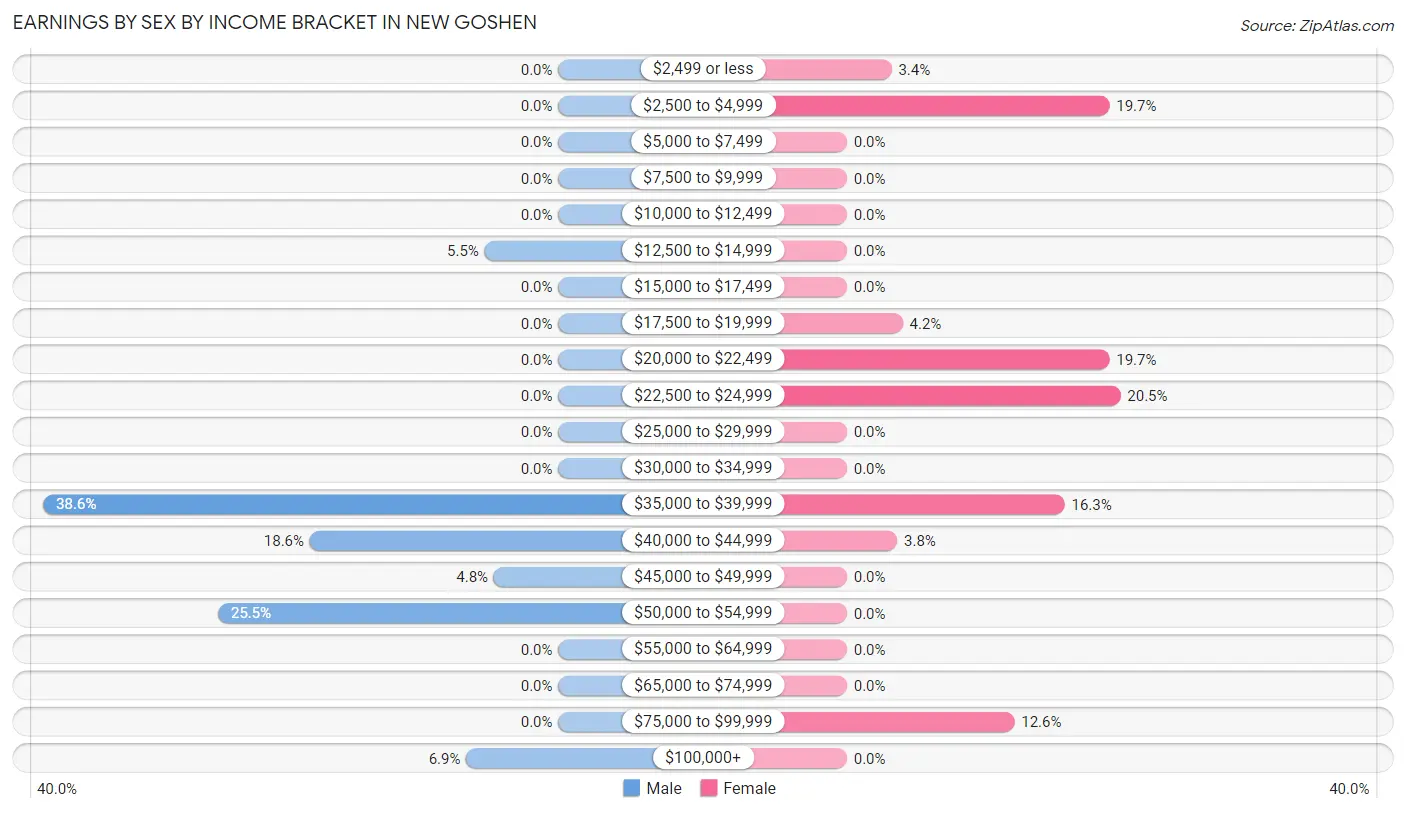
Earnings by Sex by Income Bracket in New Goshen
The most common earnings brackets in New Goshen are $35,000 to $39,999 for men (56 | 38.6%) and $22,500 to $24,999 for women (49 | 20.5%).
| Income | Male | Female |
| $2,499 or less | 0 (0.0%) | 8 (3.4%) |
| $2,500 to $4,999 | 0 (0.0%) | 47 (19.7%) |
| $5,000 to $7,499 | 0 (0.0%) | 0 (0.0%) |
| $7,500 to $9,999 | 0 (0.0%) | 0 (0.0%) |
| $10,000 to $12,499 | 0 (0.0%) | 0 (0.0%) |
| $12,500 to $14,999 | 8 (5.5%) | 0 (0.0%) |
| $15,000 to $17,499 | 0 (0.0%) | 0 (0.0%) |
| $17,500 to $19,999 | 0 (0.0%) | 10 (4.2%) |
| $20,000 to $22,499 | 0 (0.0%) | 47 (19.7%) |
| $22,500 to $24,999 | 0 (0.0%) | 49 (20.5%) |
| $25,000 to $29,999 | 0 (0.0%) | 0 (0.0%) |
| $30,000 to $34,999 | 0 (0.0%) | 0 (0.0%) |
| $35,000 to $39,999 | 56 (38.6%) | 39 (16.3%) |
| $40,000 to $44,999 | 27 (18.6%) | 9 (3.8%) |
| $45,000 to $49,999 | 7 (4.8%) | 0 (0.0%) |
| $50,000 to $54,999 | 37 (25.5%) | 0 (0.0%) |
| $55,000 to $64,999 | 0 (0.0%) | 0 (0.0%) |
| $65,000 to $74,999 | 0 (0.0%) | 0 (0.0%) |
| $75,000 to $99,999 | 0 (0.0%) | 30 (12.6%) |
| $100,000+ | 10 (6.9%) | 0 (0.0%) |
| Total | 145 (100.0%) | 239 (100.0%) |
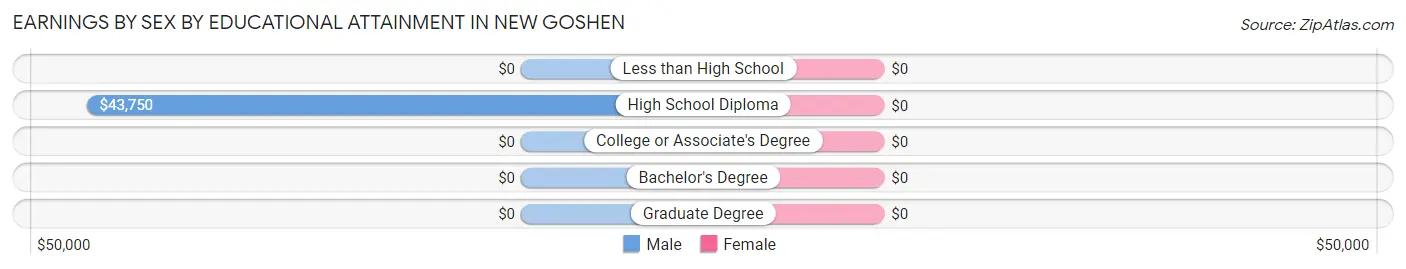
Earnings by Sex by Educational Attainment in New Goshen
| Educational Attainment | Male Income | Female Income |
| Less than High School | - | - |
| High School Diploma | $43,750 | $0 |
| College or Associate's Degree | - | - |
| Bachelor's Degree | - | - |
| Graduate Degree | - | - |
| Total | $52,669 | $39,006 |
Family Income in New Goshen
Family Income Brackets in New Goshen
According to the New Goshen family income data, there are 54 families falling into the $50,000 to $74,999 income range, which is the most common income bracket and makes up 38.0% of all families.
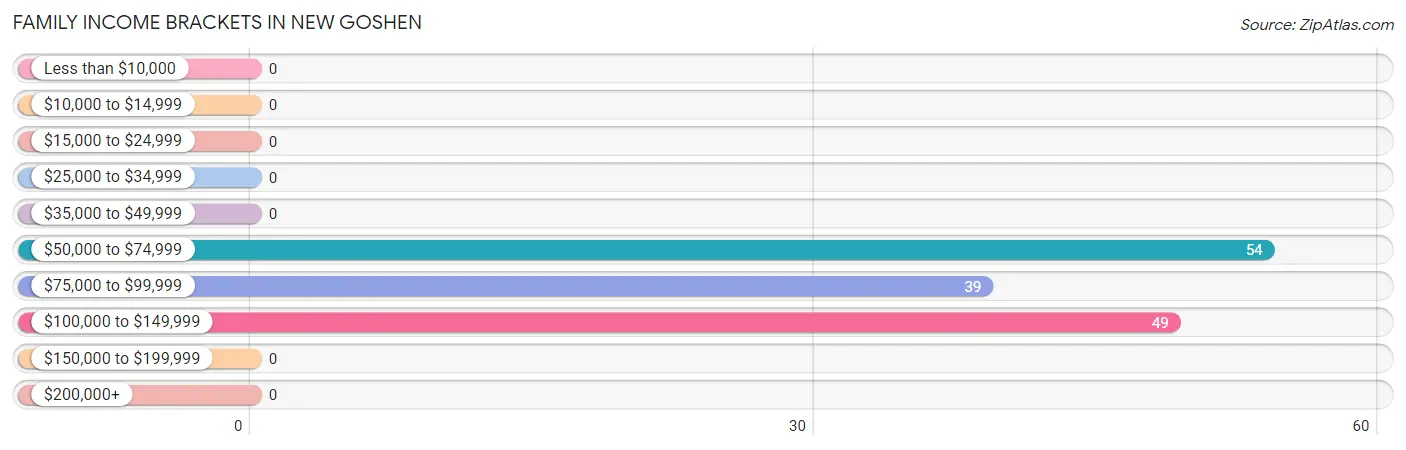
| Income Bracket | # Families | % Families |
| Less than $10,000 | 0 | 0.0% |
| $10,000 to $14,999 | 0 | 0.0% |
| $15,000 to $24,999 | 0 | 0.0% |
| $25,000 to $34,999 | 0 | 0.0% |
| $35,000 to $49,999 | 0 | 0.0% |
| $50,000 to $74,999 | 54 | 38.0% |
| $75,000 to $99,999 | 39 | 27.5% |
| $100,000 to $149,999 | 49 | 34.5% |
| $150,000 to $199,999 | 0 | 0.0% |
| $200,000+ | 0 | 0.0% |
Family Income by Famaliy Size in New Goshen
2-person families (64 | 45.1%) account for the highest median family income in New Goshen with $71,014 per family, while 2-person families (64 | 45.1%) have the highest median income of $35,507 per family member.
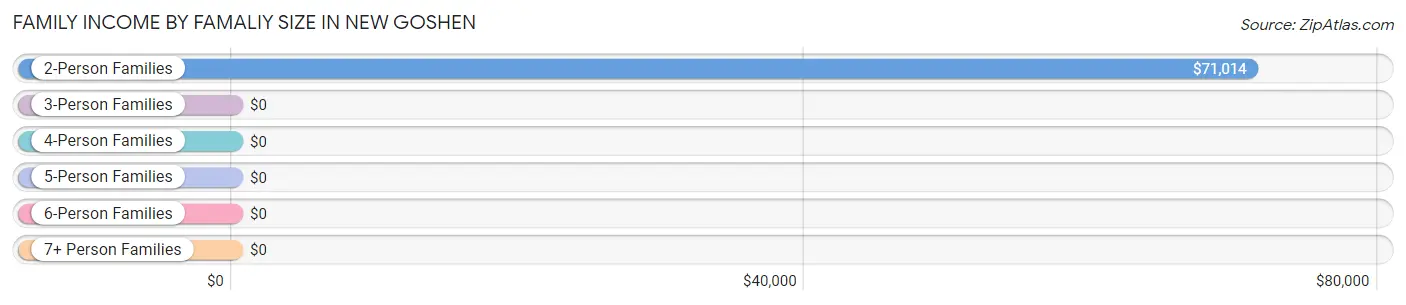
| Income Bracket | # Families | Median Income |
| 2-Person Families | 64 (45.1%) | $71,014 |
| 3-Person Families | 0 (0.0%) | $0 |
| 4-Person Families | 9 (6.3%) | $0 |
| 5-Person Families | 69 (48.6%) | $0 |
| 6-Person Families | 0 (0.0%) | $0 |
| 7+ Person Families | 0 (0.0%) | $0 |
| Total | 142 (100.0%) | $90,667 |
Family Income by Number of Earners in New Goshen
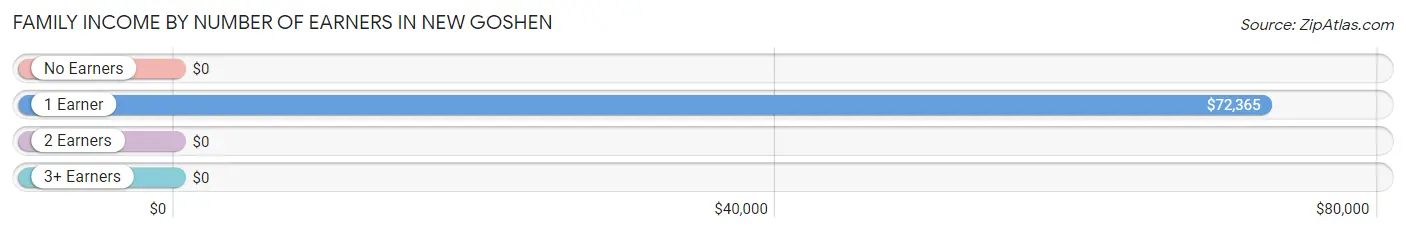
| Number of Earners | # Families | Median Income |
| No Earners | 0 (0.0%) | $0 |
| 1 Earner | 84 (59.2%) | $72,365 |
| 2 Earners | 10 (7.0%) | $0 |
| 3+ Earners | 48 (33.8%) | $0 |
| Total | 142 (100.0%) | $90,667 |
Household Income in New Goshen
Household Income Brackets in New Goshen
With 54 households falling in the category, the $50,000 to $74,999 income range is the most frequent in New Goshen, accounting for 26.9% of all households.
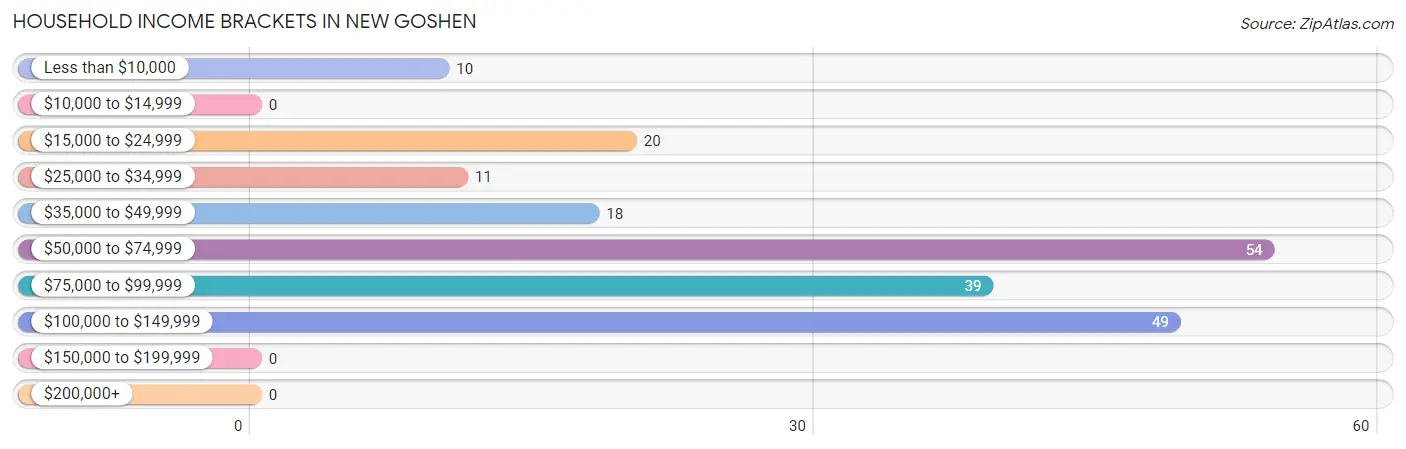
| Income Bracket | # Households | % Households |
| Less than $10,000 | 10 | 5.0% |
| $10,000 to $14,999 | 0 | 0.0% |
| $15,000 to $24,999 | 20 | 10.0% |
| $25,000 to $34,999 | 11 | 5.5% |
| $35,000 to $49,999 | 18 | 9.0% |
| $50,000 to $74,999 | 54 | 26.9% |
| $75,000 to $99,999 | 39 | 19.4% |
| $100,000 to $149,999 | 49 | 24.4% |
| $150,000 to $199,999 | 0 | 0.0% |
| $200,000+ | 0 | 0.0% |
Household Income by Householder Age in New Goshen
The median household income in New Goshen is $71,655, with the highest median household income of $92,458 found in the 25 to 44 years age bracket for the primary householder. A total of 79 households (39.3%) fall into this category.
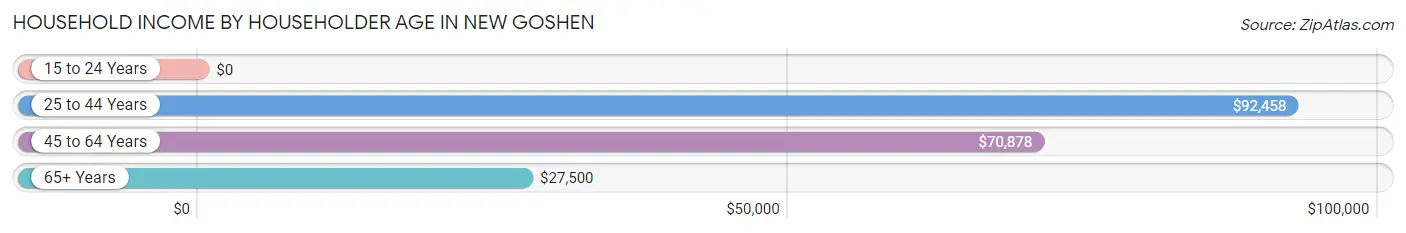
| Income Bracket | # Households | Median Income |
| 15 to 24 Years | 0 (0.0%) | $0 |
| 25 to 44 Years | 79 (39.3%) | $92,458 |
| 45 to 64 Years | 86 (42.8%) | $70,878 |
| 65+ Years | 36 (17.9%) | $27,500 |
| Total | 201 (100.0%) | $71,655 |
Poverty in New Goshen
Income Below Poverty by Sex and Age in New Goshen
With 9.7% poverty level for males and 2.2% for females among the residents of New Goshen, 75 year old and over males and 45 to 54 year old females are the most vulnerable to poverty, with 10 males (34.5%) and 8 females (18.6%) in their respective age groups living below the poverty level.
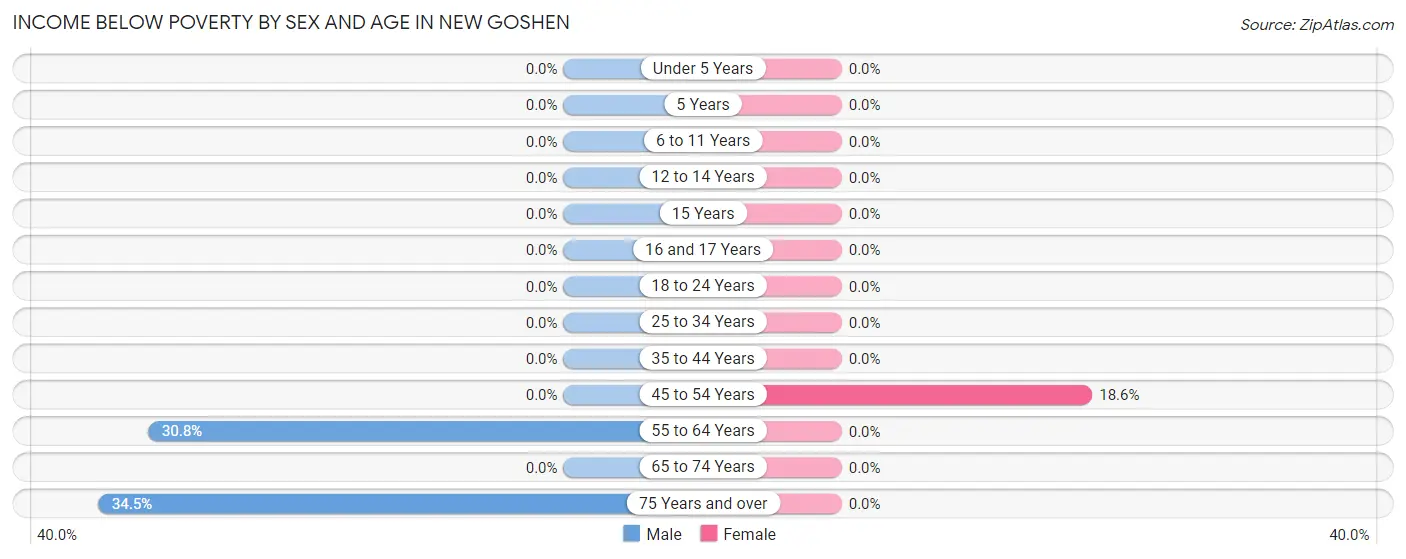
| Age Bracket | Male | Female |
| Under 5 Years | 0 (0.0%) | 0 (0.0%) |
| 5 Years | 0 (0.0%) | 0 (0.0%) |
| 6 to 11 Years | 0 (0.0%) | 0 (0.0%) |
| 12 to 14 Years | 0 (0.0%) | 0 (0.0%) |
| 15 Years | 0 (0.0%) | 0 (0.0%) |
| 16 and 17 Years | 0 (0.0%) | 0 (0.0%) |
| 18 to 24 Years | 0 (0.0%) | 0 (0.0%) |
| 25 to 34 Years | 0 (0.0%) | 0 (0.0%) |
| 35 to 44 Years | 0 (0.0%) | 0 (0.0%) |
| 45 to 54 Years | 0 (0.0%) | 8 (18.6%) |
| 55 to 64 Years | 12 (30.8%) | 0 (0.0%) |
| 65 to 74 Years | 0 (0.0%) | 0 (0.0%) |
| 75 Years and over | 10 (34.5%) | 0 (0.0%) |
| Total | 22 (9.7%) | 8 (2.2%) |
Income Above Poverty by Sex and Age in New Goshen
According to the poverty statistics in New Goshen, males aged 16 and 17 years and females aged under 5 years are the age groups that are most secure financially, with 100.0% of males and 100.0% of females in these age groups living above the poverty line.
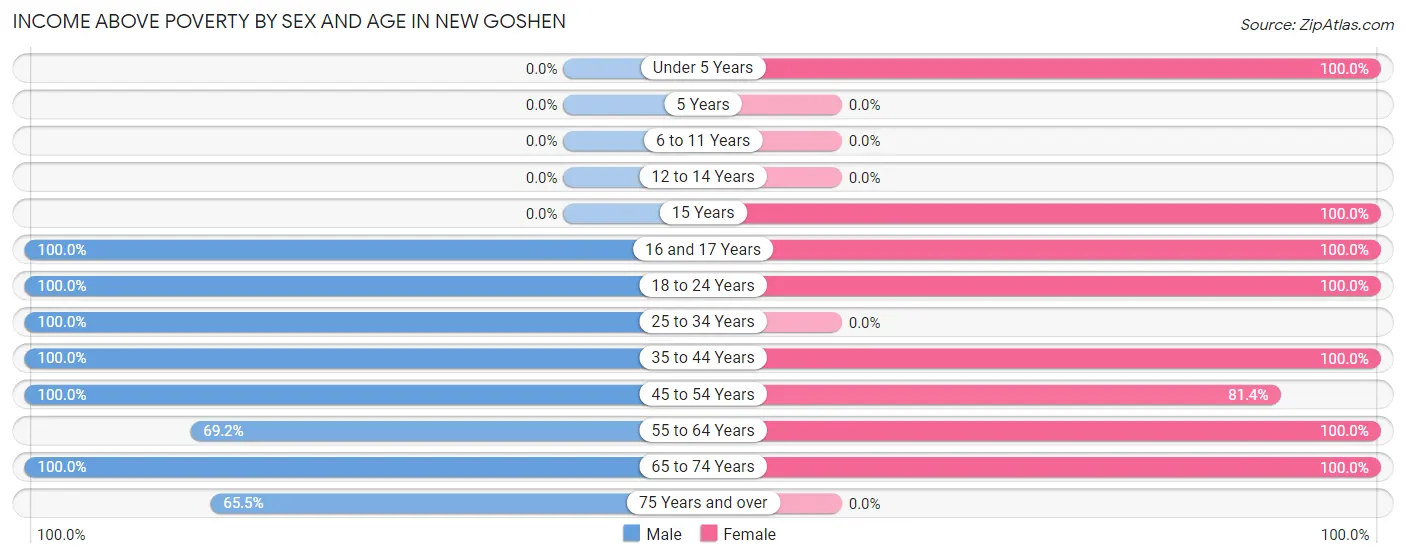
| Age Bracket | Male | Female |
| Under 5 Years | 0 (0.0%) | 13 (100.0%) |
| 5 Years | 0 (0.0%) | 0 (0.0%) |
| 6 to 11 Years | 0 (0.0%) | 0 (0.0%) |
| 12 to 14 Years | 0 (0.0%) | 0 (0.0%) |
| 15 Years | 0 (0.0%) | 36 (100.0%) |
| 16 and 17 Years | 18 (100.0%) | 16 (100.0%) |
| 18 to 24 Years | 56 (100.0%) | 130 (100.0%) |
| 25 to 34 Years | 18 (100.0%) | 0 (0.0%) |
| 35 to 44 Years | 24 (100.0%) | 103 (100.0%) |
| 45 to 54 Years | 37 (100.0%) | 35 (81.4%) |
| 55 to 64 Years | 27 (69.2%) | 10 (100.0%) |
| 65 to 74 Years | 7 (100.0%) | 4 (100.0%) |
| 75 Years and over | 19 (65.5%) | 0 (0.0%) |
| Total | 206 (90.3%) | 347 (97.8%) |
Income Below Poverty Among Married-Couple Families in New Goshen
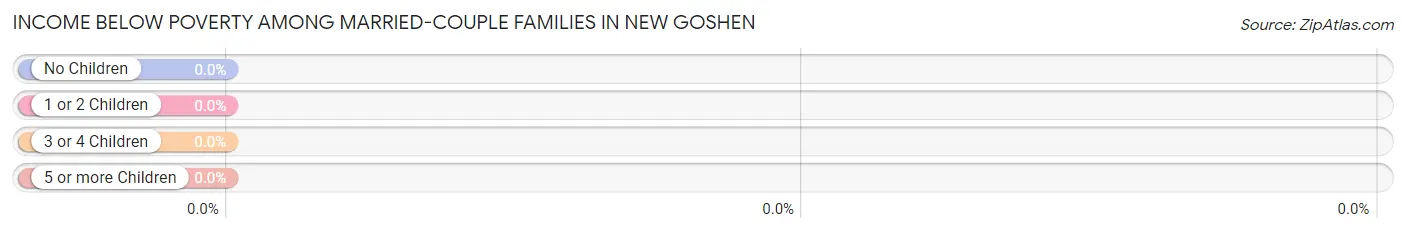
| Children | Above Poverty | Below Poverty |
| No Children | 64 (100.0%) | 0 (0.0%) |
| 1 or 2 Children | 0 (0.0%) | 0 (0.0%) |
| 3 or 4 Children | 30 (100.0%) | 0 (0.0%) |
| 5 or more Children | 0 (0.0%) | 0 (0.0%) |
| Total | 94 (100.0%) | 0 (0.0%) |
Income Below Poverty Among Single-Parent Households in New Goshen
| Children | Single Father | Single Mother |
| No Children | 0 (0.0%) | 0 (0.0%) |
| 1 or 2 Children | 0 (0.0%) | 0 (0.0%) |
| 3 or 4 Children | 0 (0.0%) | 0 (0.0%) |
| 5 or more Children | 0 (0.0%) | 0 (0.0%) |
| Total | 0 (0.0%) | 0 (0.0%) |
Income Below Poverty Among Married-Couple vs Single-Parent Households in New Goshen
| Children | Married-Couple Families | Single-Parent Households |
| No Children | 0 (0.0%) | 0 (0.0%) |
| 1 or 2 Children | 0 (0.0%) | 0 (0.0%) |
| 3 or 4 Children | 0 (0.0%) | 0 (0.0%) |
| 5 or more Children | 0 (0.0%) | 0 (0.0%) |
| Total | 0 (0.0%) | 0 (0.0%) |
Race in New Goshen
The most populous races in New Goshen are White / Caucasian (480 | 82.3%), Black / African American (55 | 9.4%), and Two or more Races (48 | 8.2%).
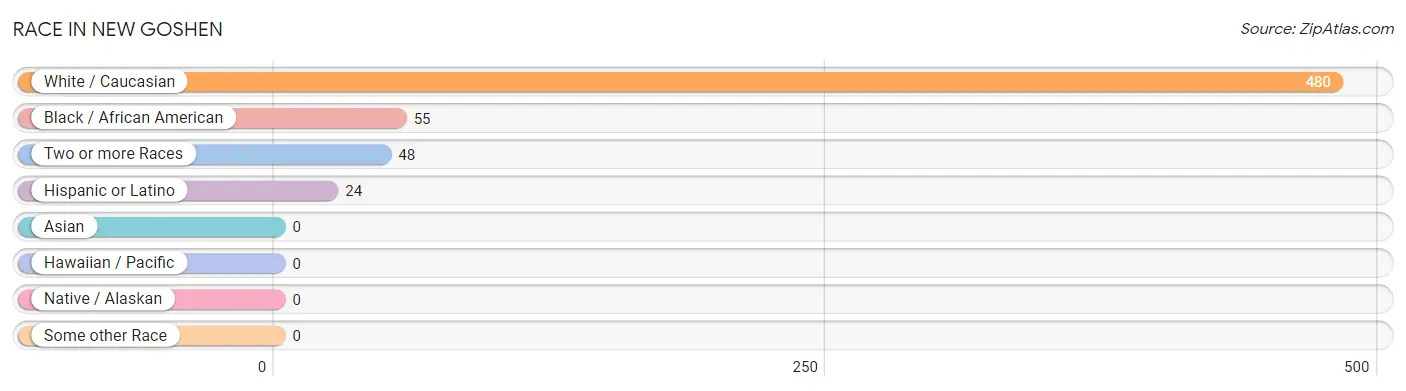
| Race | # Population | % Population |
| Asian | 0 | 0.0% |
| Black / African American | 55 | 9.4% |
| Hawaiian / Pacific | 0 | 0.0% |
| Hispanic or Latino | 24 | 4.1% |
| Native / Alaskan | 0 | 0.0% |
| White / Caucasian | 480 | 82.3% |
| Two or more Races | 48 | 8.2% |
| Some other Race | 0 | 0.0% |
| Total | 583 | 100.0% |
Ancestry in New Goshen
The most populous ancestries reported in New Goshen are German (100 | 17.2%), Irish (80 | 13.7%), English (67 | 11.5%), Puerto Rican (16 | 2.7%), and Scottish (10 | 1.7%), together accounting for 46.8% of all New Goshen residents.
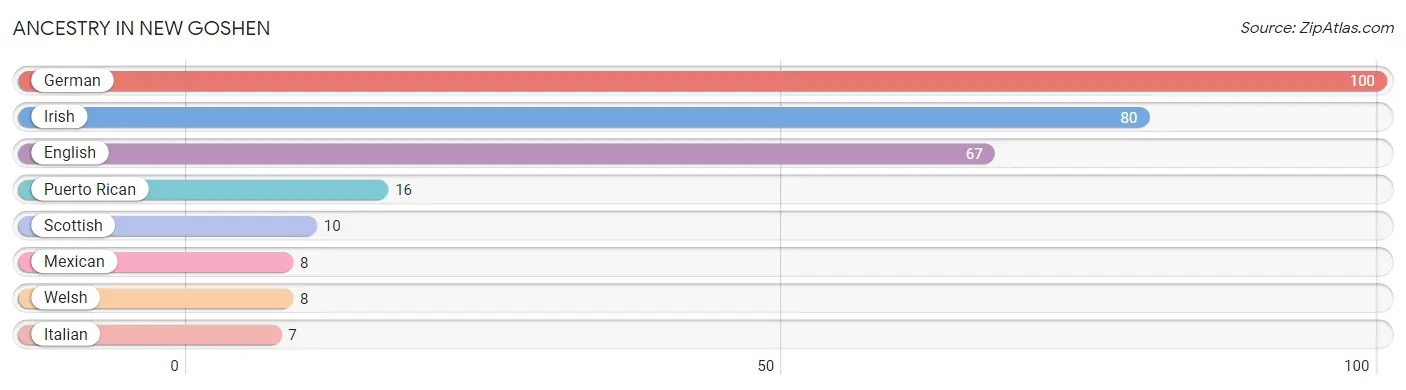
| Ancestry | # Population | % Population |
| English | 67 | 11.5% |
| German | 100 | 17.2% |
| Irish | 80 | 13.7% |
| Italian | 7 | 1.2% |
| Mexican | 8 | 1.4% |
| Puerto Rican | 16 | 2.7% |
| Scottish | 10 | 1.7% |
| Welsh | 8 | 1.4% | View All 8 Rows |
Immigrants in New Goshen

| Immigration Origin | # Population | % Population | View All 0 Rows |
Sex and Age in New Goshen
Sex and Age in New Goshen
The most populous age groups in New Goshen are 20 to 24 Years (56 | 24.6%) for men and 20 to 24 Years (130 | 36.6%) for women.
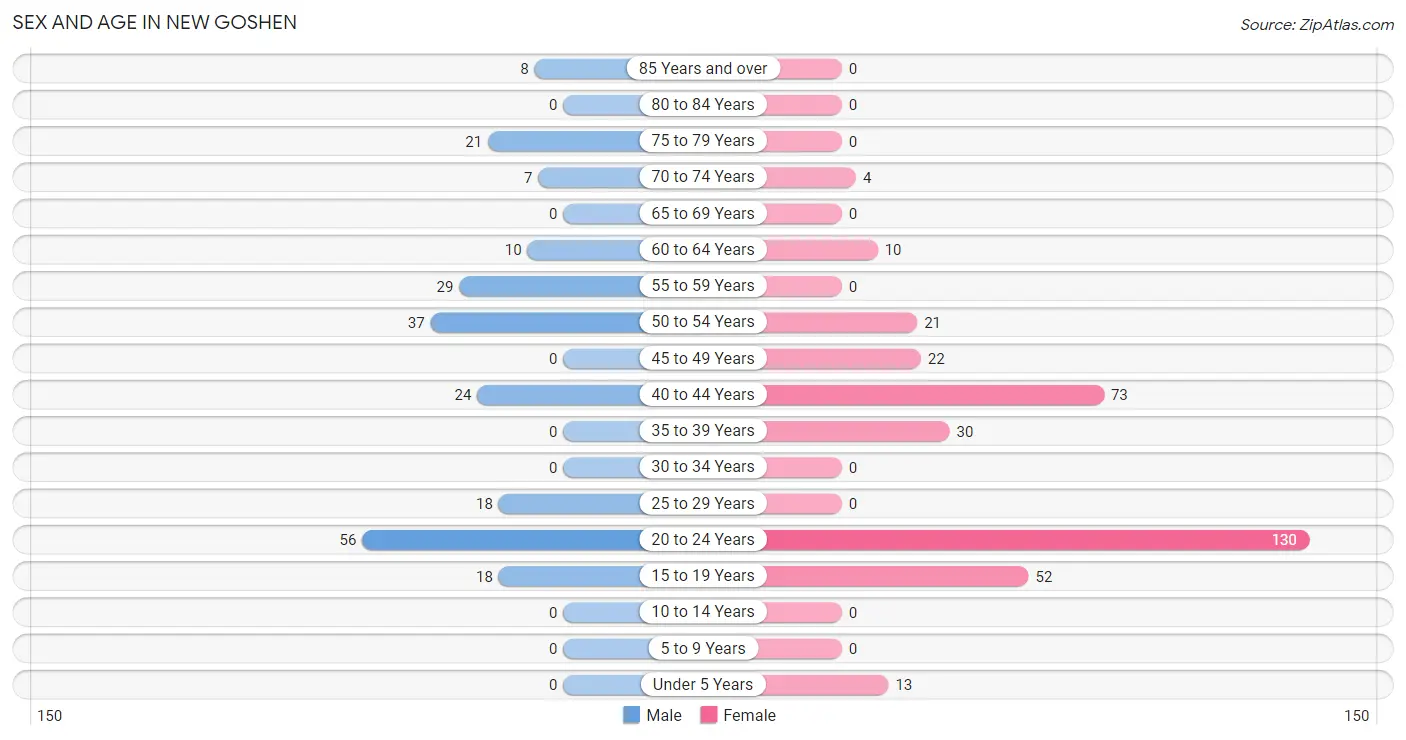
| Age Bracket | Male | Female |
| Under 5 Years | 0 (0.0%) | 13 (3.7%) |
| 5 to 9 Years | 0 (0.0%) | 0 (0.0%) |
| 10 to 14 Years | 0 (0.0%) | 0 (0.0%) |
| 15 to 19 Years | 18 (7.9%) | 52 (14.6%) |
| 20 to 24 Years | 56 (24.6%) | 130 (36.6%) |
| 25 to 29 Years | 18 (7.9%) | 0 (0.0%) |
| 30 to 34 Years | 0 (0.0%) | 0 (0.0%) |
| 35 to 39 Years | 0 (0.0%) | 30 (8.5%) |
| 40 to 44 Years | 24 (10.5%) | 73 (20.6%) |
| 45 to 49 Years | 0 (0.0%) | 22 (6.2%) |
| 50 to 54 Years | 37 (16.2%) | 21 (5.9%) |
| 55 to 59 Years | 29 (12.7%) | 0 (0.0%) |
| 60 to 64 Years | 10 (4.4%) | 10 (2.8%) |
| 65 to 69 Years | 0 (0.0%) | 0 (0.0%) |
| 70 to 74 Years | 7 (3.1%) | 4 (1.1%) |
| 75 to 79 Years | 21 (9.2%) | 0 (0.0%) |
| 80 to 84 Years | 0 (0.0%) | 0 (0.0%) |
| 85 Years and over | 8 (3.5%) | 0 (0.0%) |
| Total | 228 (100.0%) | 355 (100.0%) |
Families and Households in New Goshen
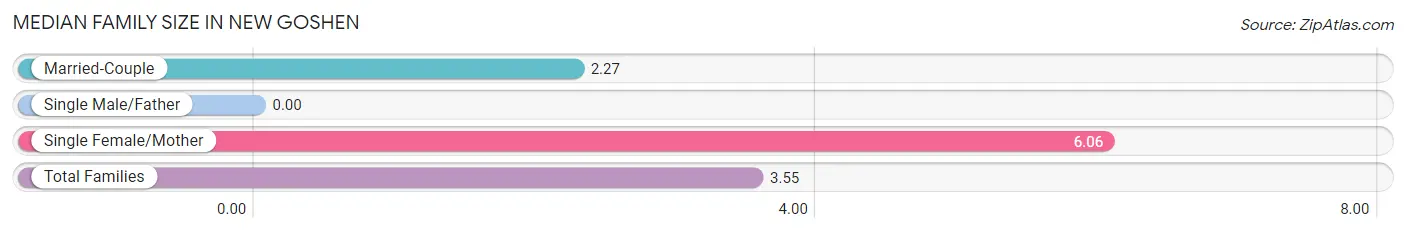
Median Family Size in New Goshen
| Family Type | # Families | Family Size |
| Married-Couple | 94 (66.2%) | 2.27 |
| Single Male/Father | 0 (0.0%) | - |
| Single Female/Mother | 48 (33.8%) | 6.06 |
| Total Families | 142 (100.0%) | 3.55 |
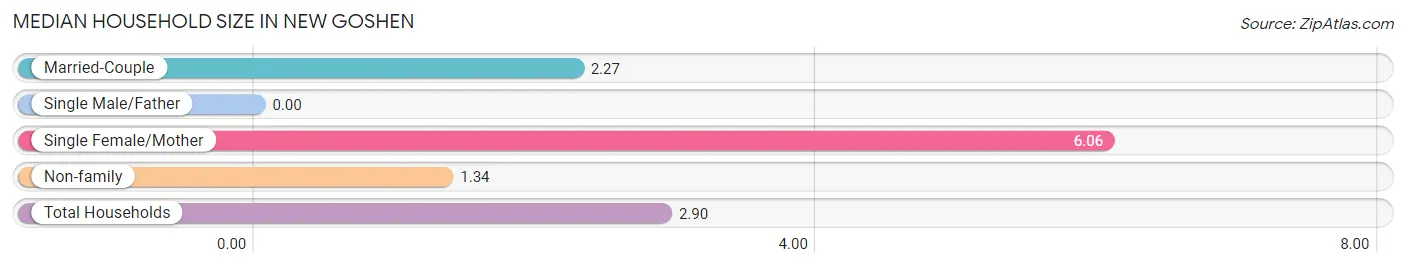
Median Household Size in New Goshen
| Household Type | # Households | Household Size |
| Married-Couple | 94 (46.8%) | 2.27 |
| Single Male/Father | 0 (0.0%) | - |
| Single Female/Mother | 48 (23.9%) | 6.06 |
| Non-family | 59 (29.3%) | 1.34 |
| Total Households | 201 (100.0%) | 2.90 |
Household Size by Marriage Status in New Goshen
Out of a total of 201 households in New Goshen, 142 (70.7%) are family households, while 59 (29.3%) are nonfamily households. The most numerous type of family households are 5-person households, comprising 69, and the most common type of nonfamily households are 1-person households, comprising 39.
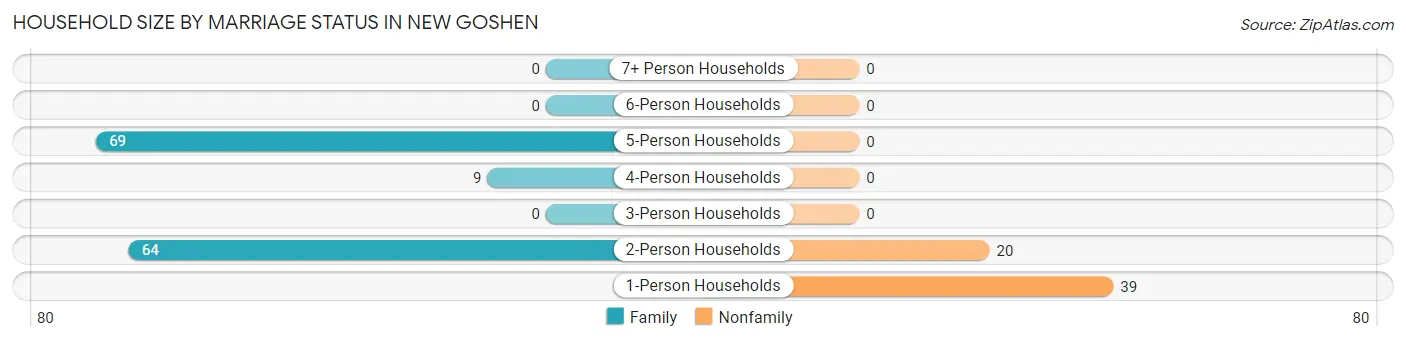
| Household Size | Family Households | Nonfamily Households |
| 1-Person Households | - | 39 (19.4%) |
| 2-Person Households | 64 (31.8%) | 20 (10.0%) |
| 3-Person Households | 0 (0.0%) | 0 (0.0%) |
| 4-Person Households | 9 (4.5%) | 0 (0.0%) |
| 5-Person Households | 69 (34.3%) | 0 (0.0%) |
| 6-Person Households | 0 (0.0%) | 0 (0.0%) |
| 7+ Person Households | 0 (0.0%) | 0 (0.0%) |
| Total | 142 (70.7%) | 59 (29.3%) |
Female Fertility in New Goshen
Fertility by Age in New Goshen
Average fertility rate in New Goshen is 117.0 births per 1,000 women. Women in the age bracket of 20 to 34 years have the highest fertility rate with 277.0 births per 1,000 women. Women in the age bracket of 20 to 34 years acount for 100.0% of all women with births.
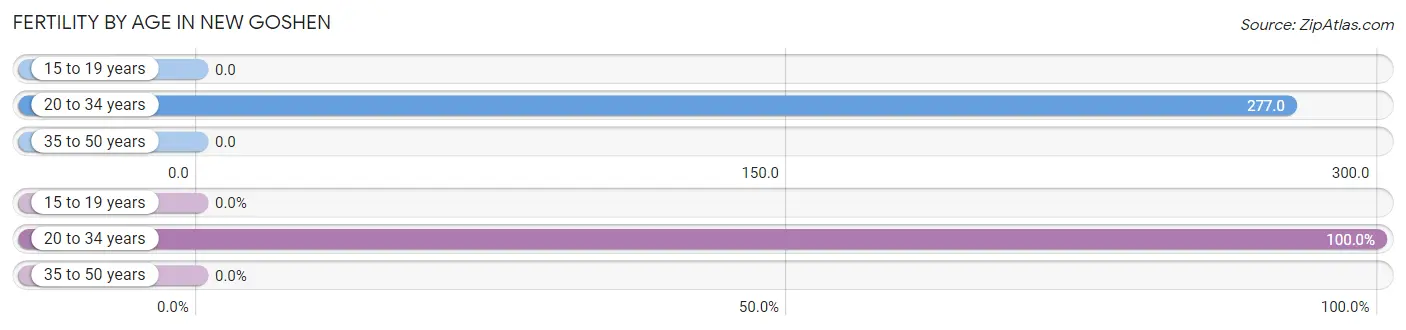
| Age Bracket | Women with Births | Births / 1,000 Women |
| 15 to 19 years | 0 (0.0%) | 0.0 |
| 20 to 34 years | 36 (100.0%) | 277.0 |
| 35 to 50 years | 0 (0.0%) | 0.0 |
| Total | 36 (100.0%) | 117.0 |
Fertility by Age by Marriage Status in New Goshen
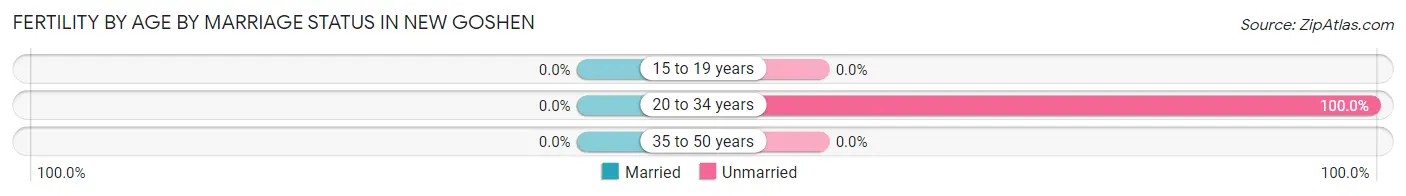
| Age Bracket | Married | Unmarried |
| 15 to 19 years | 0 (0.0%) | 0 (0.0%) |
| 20 to 34 years | 0 (0.0%) | 36 (100.0%) |
| 35 to 50 years | 0 (0.0%) | 0 (0.0%) |
| Total | 0 (0.0%) | 36 (100.0%) |
Fertility by Education in New Goshen
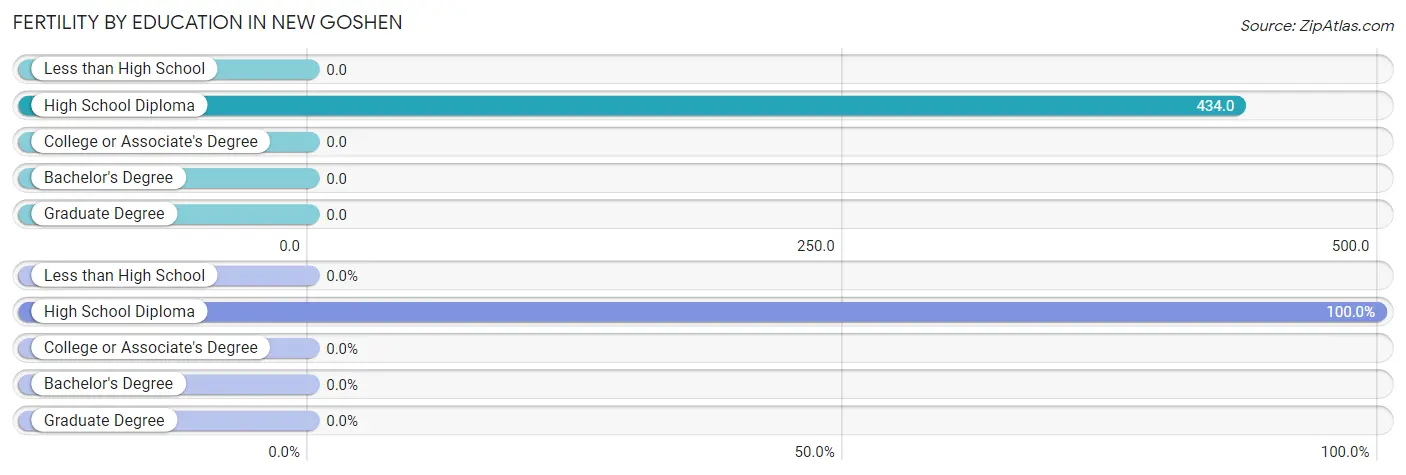
| Educational Attainment | Women with Births | Births / 1,000 Women |
| Less than High School | 0 (0.0%) | 0.0 |
| High School Diploma | 36 (100.0%) | 434.0 |
| College or Associate's Degree | 0 (0.0%) | 0.0 |
| Bachelor's Degree | 0 (0.0%) | 0.0 |
| Graduate Degree | 0 (0.0%) | 0.0 |
| Total | 36 (100.0%) | 117.0 |
Fertility by Education by Marriage Status in New Goshen
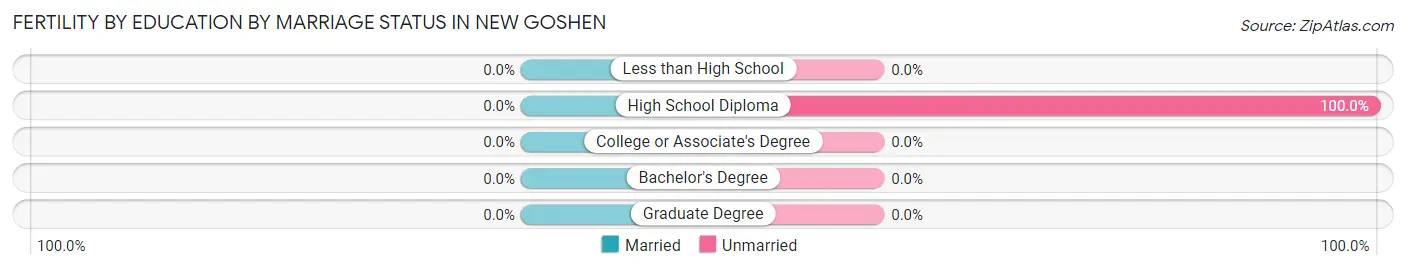
| Educational Attainment | Married | Unmarried |
| Less than High School | 0 (0.0%) | 0 (0.0%) |
| High School Diploma | 0 (0.0%) | 36 (100.0%) |
| College or Associate's Degree | 0 (0.0%) | 0 (0.0%) |
| Bachelor's Degree | 0 (0.0%) | 0 (0.0%) |
| Graduate Degree | 0 (0.0%) | 0 (0.0%) |
| Total | 0 (0.0%) | 36 (100.0%) |
Employment Characteristics in New Goshen
Employment by Class of Employer in New Goshen
Among the 337 employed individuals in New Goshen, private company employees (243 | 72.1%), state government employees (37 | 11.0%), and federal government employees (30 | 8.9%) make up the most common classes of employment.
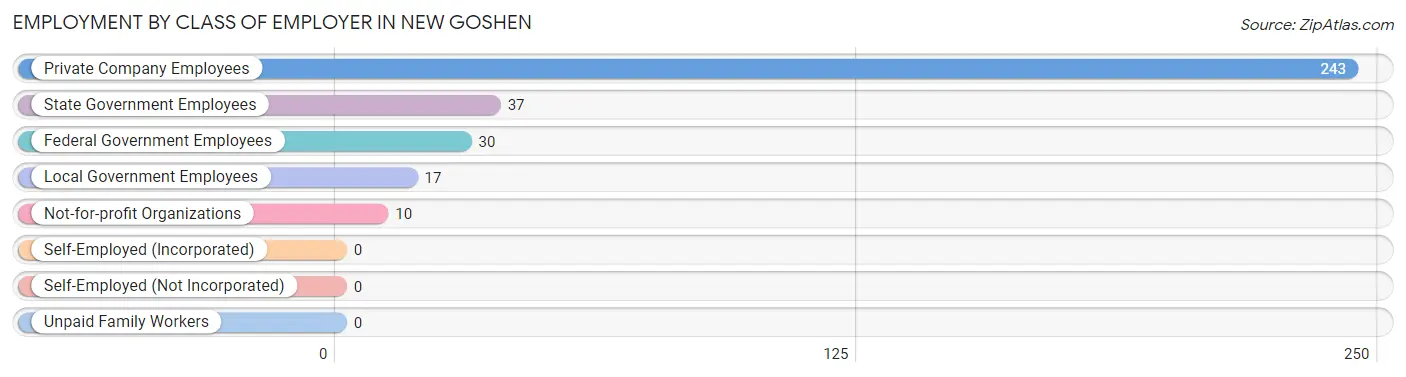
| Employer Class | # Employees | % Employees |
| Private Company Employees | 243 | 72.1% |
| Self-Employed (Incorporated) | 0 | 0.0% |
| Self-Employed (Not Incorporated) | 0 | 0.0% |
| Not-for-profit Organizations | 10 | 3.0% |
| Local Government Employees | 17 | 5.0% |
| State Government Employees | 37 | 11.0% |
| Federal Government Employees | 30 | 8.9% |
| Unpaid Family Workers | 0 | 0.0% |
| Total | 337 | 100.0% |
Employment Status by Age in New Goshen
According to the labor force statistics for New Goshen, out of the total population over 16 years of age (534), 70.4% or 376 individuals are in the labor force, with 10.4% or 39 of them unemployed. The age group with the highest labor force participation rate is 20 to 24 years, with 100.0% or 186 individuals in the labor force. Within the labor force, the 35 to 44 years age range has the highest percentage of unemployed individuals, with 56.5% or 39 of them being unemployed.
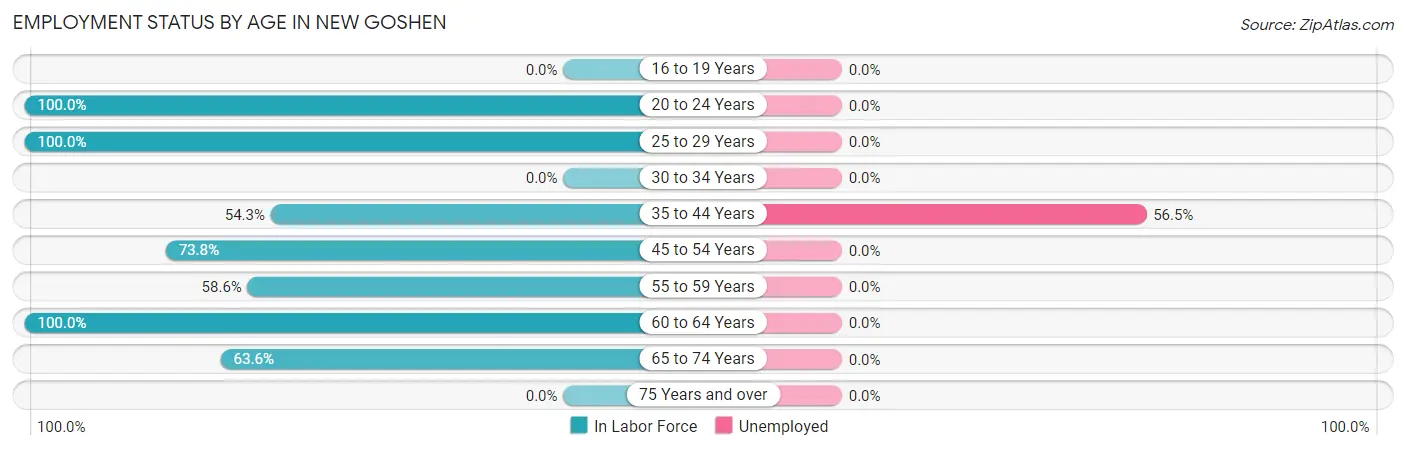
| Age Bracket | In Labor Force | Unemployed |
| 16 to 19 Years | 0 (0.0%) | 0 (0.0%) |
| 20 to 24 Years | 186 (100.0%) | 0 (0.0%) |
| 25 to 29 Years | 18 (100.0%) | 0 (0.0%) |
| 30 to 34 Years | 0 (0.0%) | 0 (0.0%) |
| 35 to 44 Years | 69 (54.3%) | 39 (56.5%) |
| 45 to 54 Years | 59 (73.8%) | 0 (0.0%) |
| 55 to 59 Years | 17 (58.6%) | 0 (0.0%) |
| 60 to 64 Years | 20 (100.0%) | 0 (0.0%) |
| 65 to 74 Years | 7 (63.6%) | 0 (0.0%) |
| 75 Years and over | 0 (0.0%) | 0 (0.0%) |
| Total | 376 (70.4%) | 39 (10.4%) |
Employment Status by Educational Attainment in New Goshen
According to labor force statistics for New Goshen, 66.8% of individuals (183) out of the total population between 25 and 64 years of age (274) are in the labor force, with 21.3% or 39 of them being unemployed. The group with the highest labor force participation rate are those with the educational attainment of less than high school, with 100.0% or 8 individuals in the labor force. Within the labor force, individuals with college / associate degree education have the highest percentage of unemployment, with 41.1% or 39 of them being unemployed.
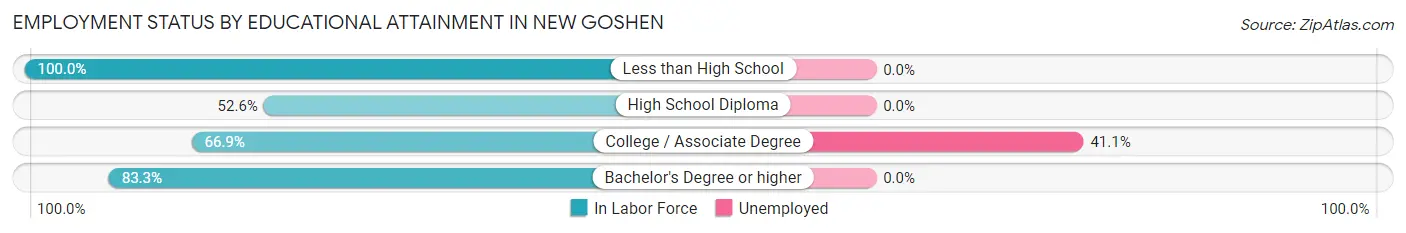
| Educational Attainment | In Labor Force | Unemployed |
| Less than High School | 8 (100.0%) | 0 (0.0%) |
| High School Diploma | 40 (52.6%) | 0 (0.0%) |
| College / Associate Degree | 95 (66.9%) | 58 (41.1%) |
| Bachelor's Degree or higher | 40 (83.3%) | 0 (0.0%) |
| Total | 183 (66.8%) | 58 (21.3%) |
Employment Occupations by Sex in New Goshen
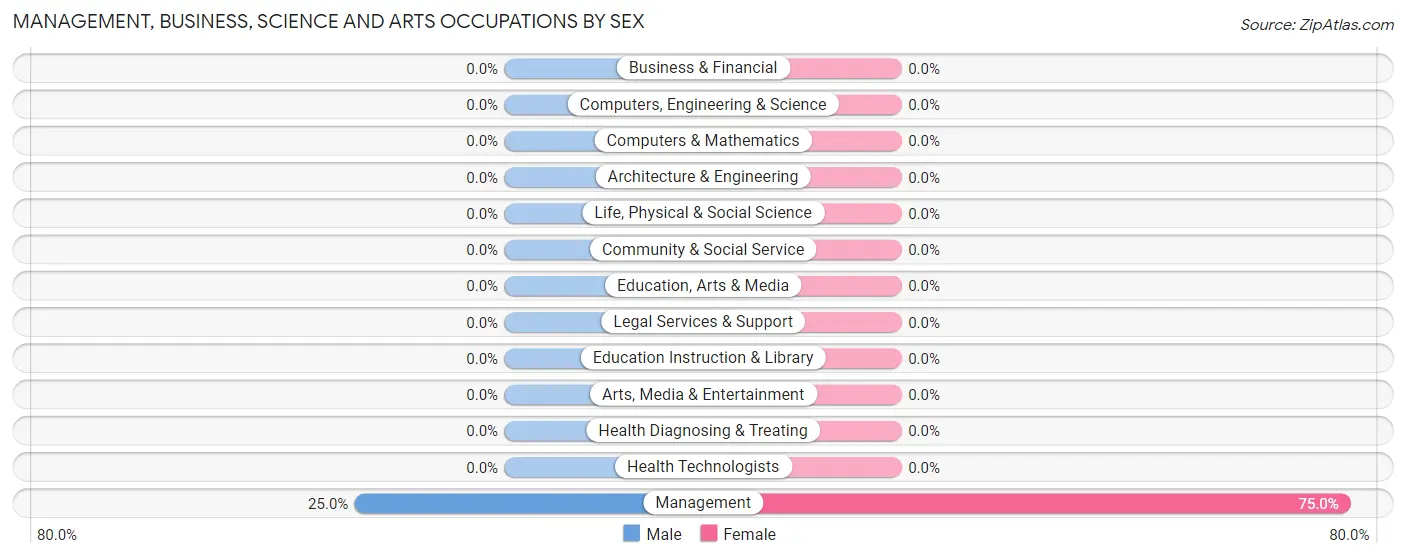
Management, Business, Science and Arts Occupations
The most common Management, Business, Science and Arts occupations in New Goshen are , and Management (40 | 11.9%).
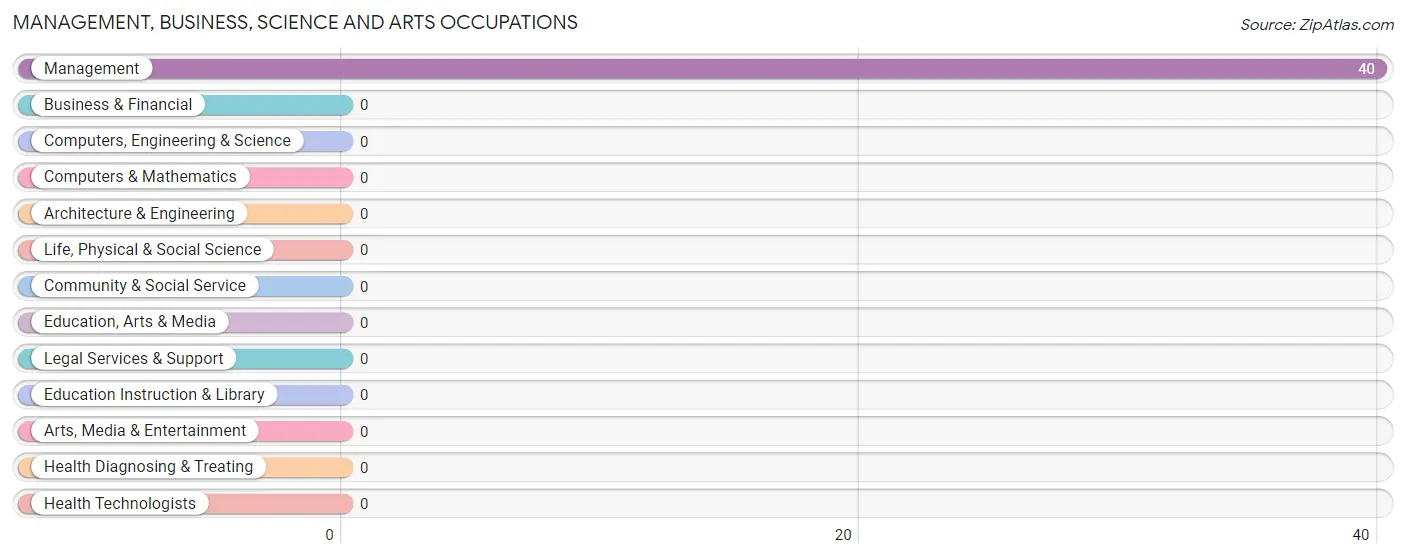
Management, Business, Science and Arts Occupations by Sex
| Occupation | Male | Female |
| Management | 10 (25.0%) | 30 (75.0%) |
| Business & Financial | 0 (0.0%) | 0 (0.0%) |
| Computers, Engineering & Science | 0 (0.0%) | 0 (0.0%) |
| Computers & Mathematics | 0 (0.0%) | 0 (0.0%) |
| Architecture & Engineering | 0 (0.0%) | 0 (0.0%) |
| Life, Physical & Social Science | 0 (0.0%) | 0 (0.0%) |
| Community & Social Service | 0 (0.0%) | 0 (0.0%) |
| Education, Arts & Media | 0 (0.0%) | 0 (0.0%) |
| Legal Services & Support | 0 (0.0%) | 0 (0.0%) |
| Education Instruction & Library | 0 (0.0%) | 0 (0.0%) |
| Arts, Media & Entertainment | 0 (0.0%) | 0 (0.0%) |
| Health Diagnosing & Treating | 0 (0.0%) | 0 (0.0%) |
| Health Technologists | 0 (0.0%) | 0 (0.0%) |
| Total (Category) | 10 (25.0%) | 30 (75.0%) |
| Total (Overall) | 145 (43.0%) | 192 (57.0%) |
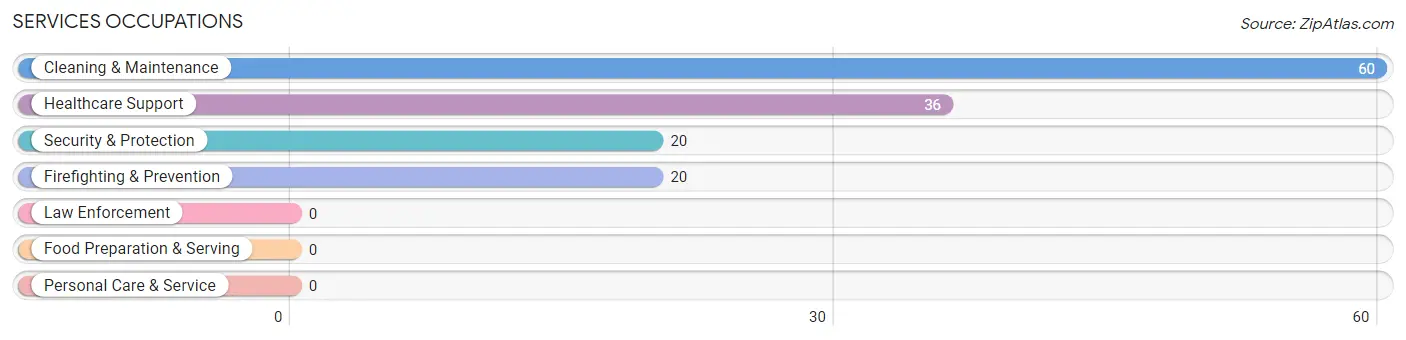
Services Occupations
The most common Services occupations in New Goshen are Cleaning & Maintenance (60 | 17.8%), Healthcare Support (36 | 10.7%), Security & Protection (20 | 5.9%), and Firefighting & Prevention (20 | 5.9%).
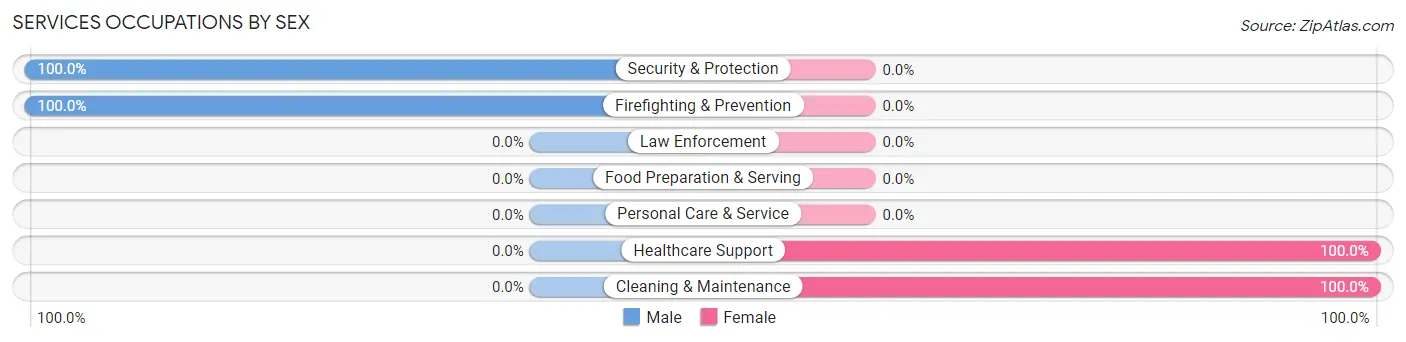
Services Occupations by Sex
Within the Services occupations in New Goshen, the most male-oriented occupations are Security & Protection (100.0%), and Firefighting & Prevention (100.0%), while the most female-oriented occupations are Healthcare Support (100.0%), and Cleaning & Maintenance (100.0%).
| Occupation | Male | Female |
| Healthcare Support | 0 (0.0%) | 36 (100.0%) |
| Security & Protection | 20 (100.0%) | 0 (0.0%) |
| Firefighting & Prevention | 20 (100.0%) | 0 (0.0%) |
| Law Enforcement | 0 (0.0%) | 0 (0.0%) |
| Food Preparation & Serving | 0 (0.0%) | 0 (0.0%) |
| Cleaning & Maintenance | 0 (0.0%) | 60 (100.0%) |
| Personal Care & Service | 0 (0.0%) | 0 (0.0%) |
| Total (Category) | 20 (17.2%) | 96 (82.8%) |
| Total (Overall) | 145 (43.0%) | 192 (57.0%) |
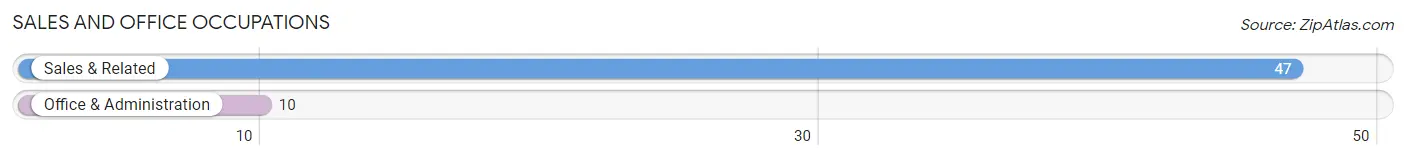
Sales and Office Occupations
The most common Sales and Office occupations in New Goshen are Sales & Related (47 | 14.0%), and Office & Administration (10 | 3.0%).
Sales and Office Occupations by Sex
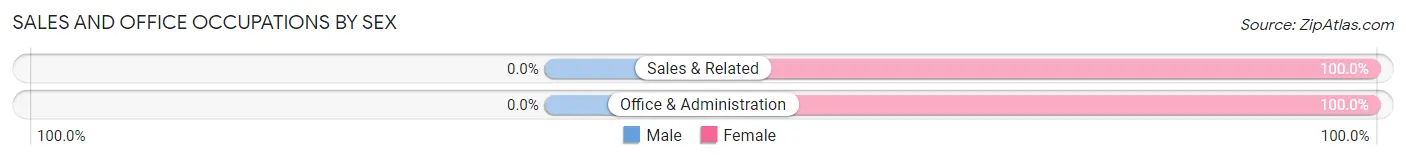
| Occupation | Male | Female |
| Sales & Related | 0 (0.0%) | 47 (100.0%) |
| Office & Administration | 0 (0.0%) | 10 (100.0%) |
| Total (Category) | 0 (0.0%) | 57 (100.0%) |
| Total (Overall) | 145 (43.0%) | 192 (57.0%) |
Natural Resources, Construction and Maintenance Occupations
The most common Natural Resources, Construction and Maintenance occupations in New Goshen are , and Construction & Extraction (37 | 11.0%).
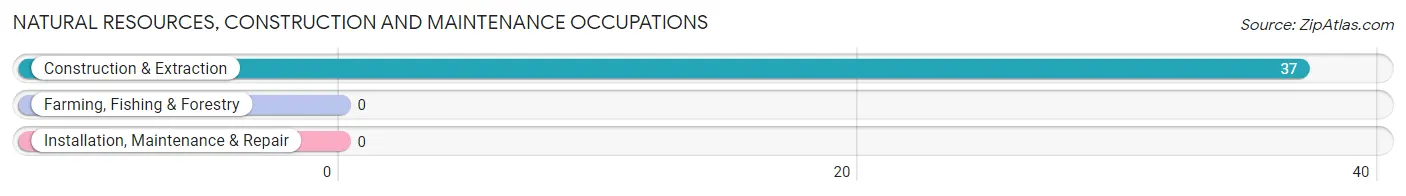
Natural Resources, Construction and Maintenance Occupations by Sex
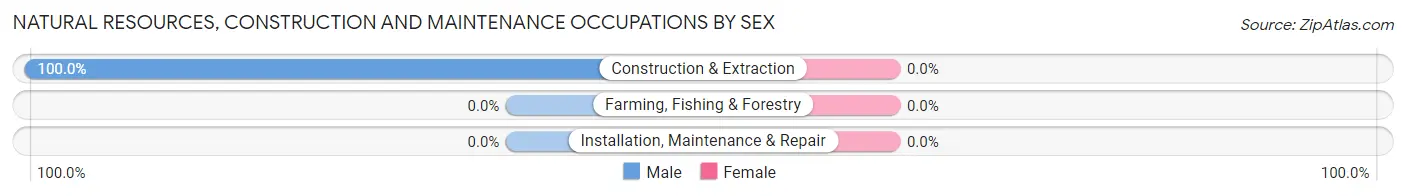
| Occupation | Male | Female |
| Farming, Fishing & Forestry | 0 (0.0%) | 0 (0.0%) |
| Construction & Extraction | 37 (100.0%) | 0 (0.0%) |
| Installation, Maintenance & Repair | 0 (0.0%) | 0 (0.0%) |
| Total (Category) | 37 (100.0%) | 0 (0.0%) |
| Total (Overall) | 145 (43.0%) | 192 (57.0%) |
Production, Transportation and Moving Occupations
The most common Production, Transportation and Moving occupations in New Goshen are Material Moving (56 | 16.6%), Production (24 | 7.1%), and Transportation (7 | 2.1%).
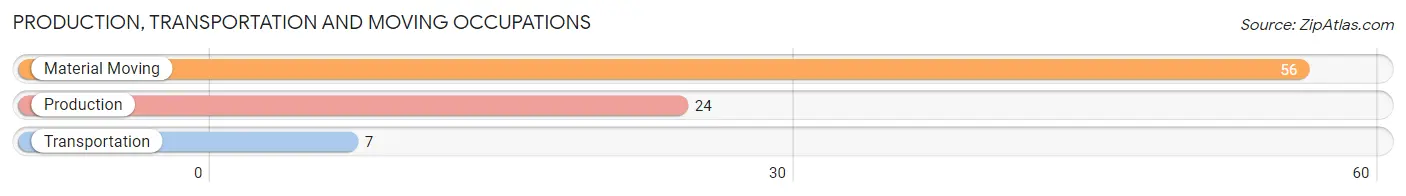
Production, Transportation and Moving Occupations by Sex
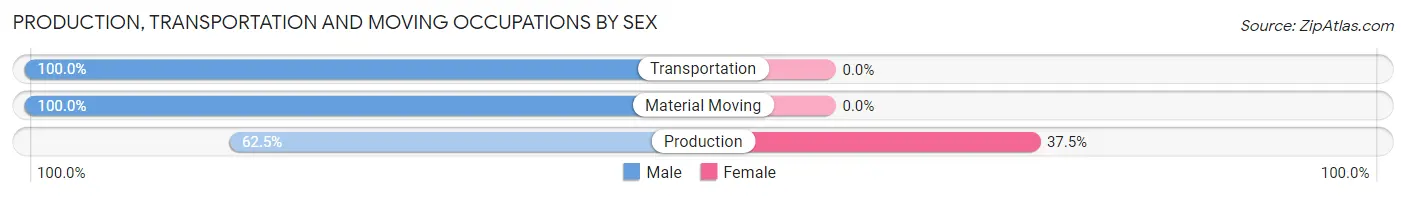
| Occupation | Male | Female |
| Production | 15 (62.5%) | 9 (37.5%) |
| Transportation | 7 (100.0%) | 0 (0.0%) |
| Material Moving | 56 (100.0%) | 0 (0.0%) |
| Total (Category) | 78 (89.7%) | 9 (10.3%) |
| Total (Overall) | 145 (43.0%) | 192 (57.0%) |
Employment Industries by Sex in New Goshen
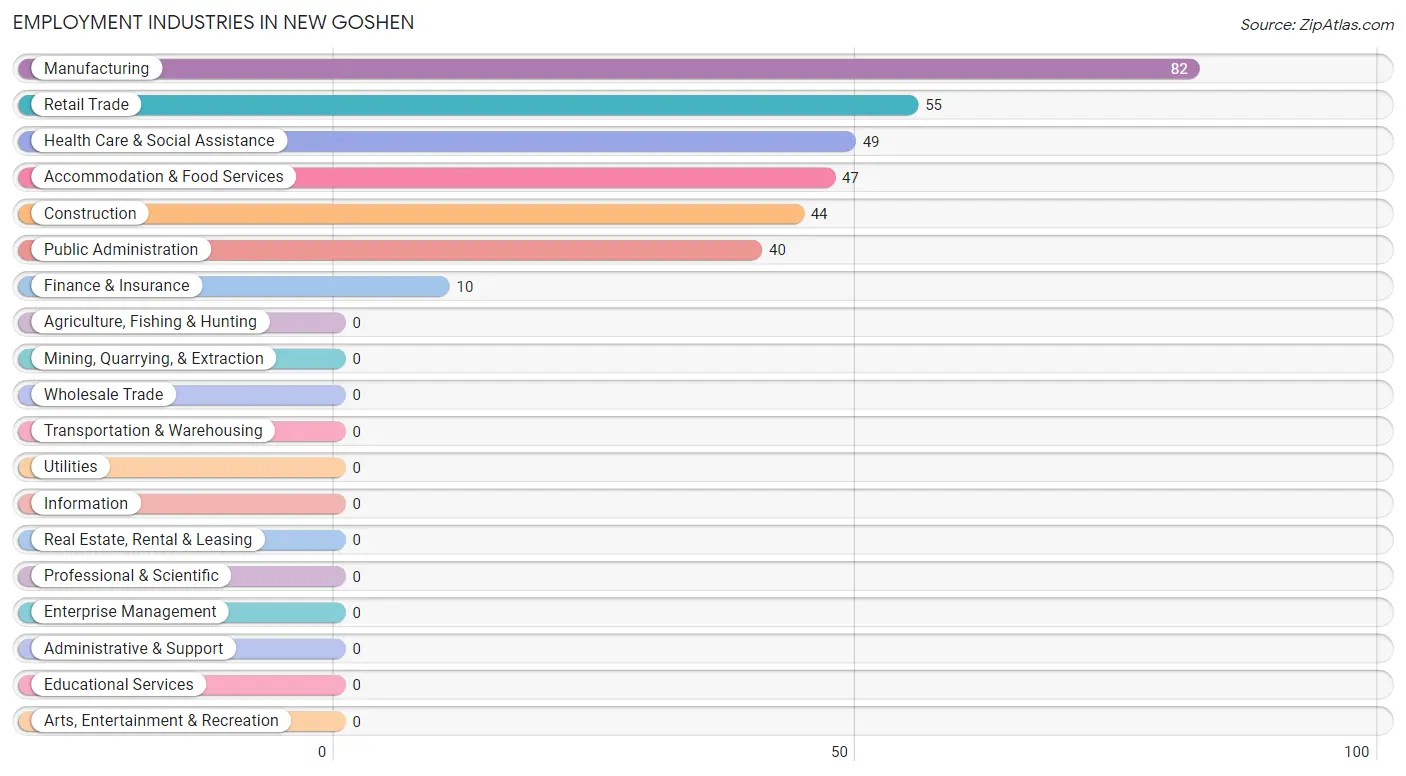
Employment Industries in New Goshen
The major employment industries in New Goshen include Manufacturing (82 | 24.3%), Retail Trade (55 | 16.3%), Health Care & Social Assistance (49 | 14.5%), Accommodation & Food Services (47 | 14.0%), and Construction (44 | 13.1%).
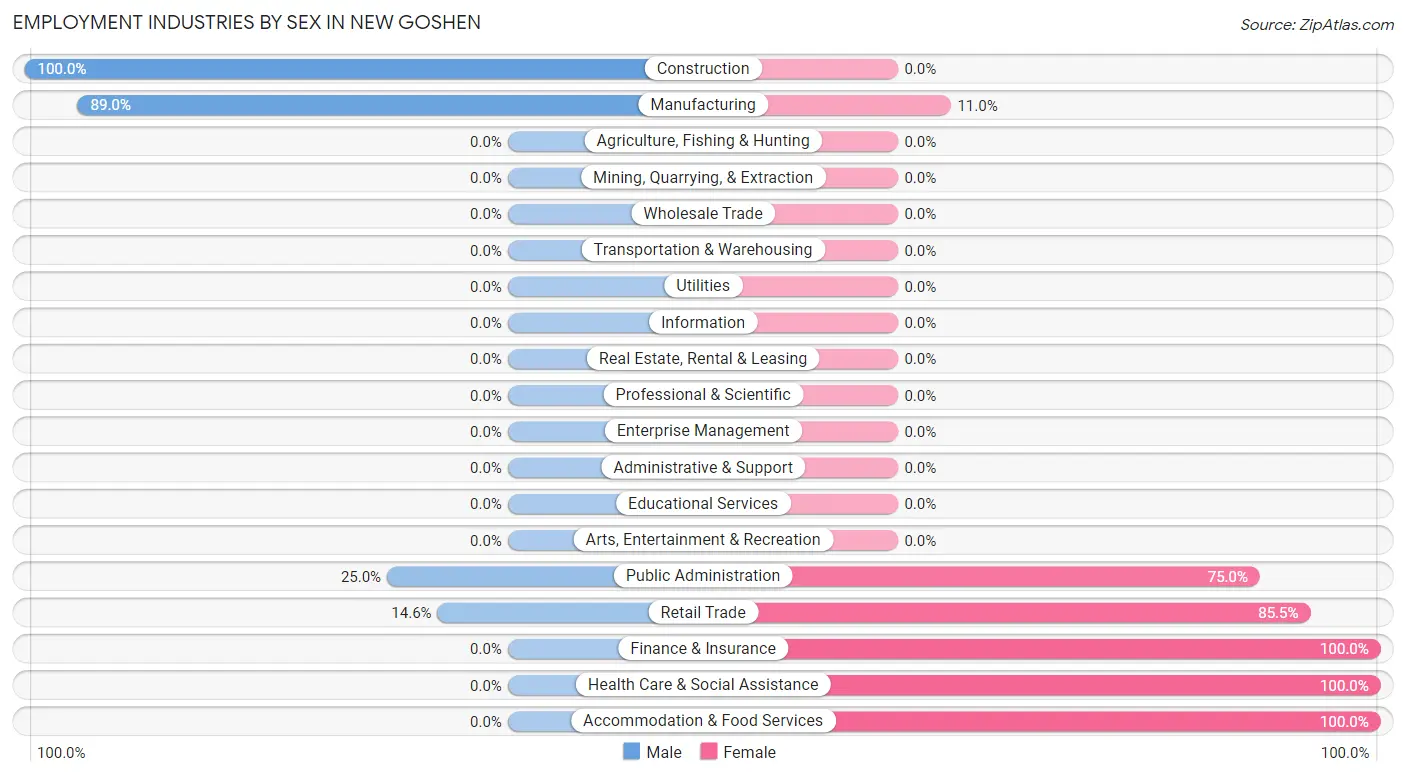
Employment Industries by Sex in New Goshen
The New Goshen industries that see more men than women are Construction (100.0%), Manufacturing (89.0%), and Public Administration (25.0%), whereas the industries that tend to have a higher number of women are Finance & Insurance (100.0%), Health Care & Social Assistance (100.0%), and Accommodation & Food Services (100.0%).
| Industry | Male | Female |
| Agriculture, Fishing & Hunting | 0 (0.0%) | 0 (0.0%) |
| Mining, Quarrying, & Extraction | 0 (0.0%) | 0 (0.0%) |
| Construction | 44 (100.0%) | 0 (0.0%) |
| Manufacturing | 73 (89.0%) | 9 (11.0%) |
| Wholesale Trade | 0 (0.0%) | 0 (0.0%) |
| Retail Trade | 8 (14.5%) | 47 (85.5%) |
| Transportation & Warehousing | 0 (0.0%) | 0 (0.0%) |
| Utilities | 0 (0.0%) | 0 (0.0%) |
| Information | 0 (0.0%) | 0 (0.0%) |
| Finance & Insurance | 0 (0.0%) | 10 (100.0%) |
| Real Estate, Rental & Leasing | 0 (0.0%) | 0 (0.0%) |
| Professional & Scientific | 0 (0.0%) | 0 (0.0%) |
| Enterprise Management | 0 (0.0%) | 0 (0.0%) |
| Administrative & Support | 0 (0.0%) | 0 (0.0%) |
| Educational Services | 0 (0.0%) | 0 (0.0%) |
| Health Care & Social Assistance | 0 (0.0%) | 49 (100.0%) |
| Arts, Entertainment & Recreation | 0 (0.0%) | 0 (0.0%) |
| Accommodation & Food Services | 0 (0.0%) | 47 (100.0%) |
| Public Administration | 10 (25.0%) | 30 (75.0%) |
| Total | 145 (43.0%) | 192 (57.0%) |
Education in New Goshen
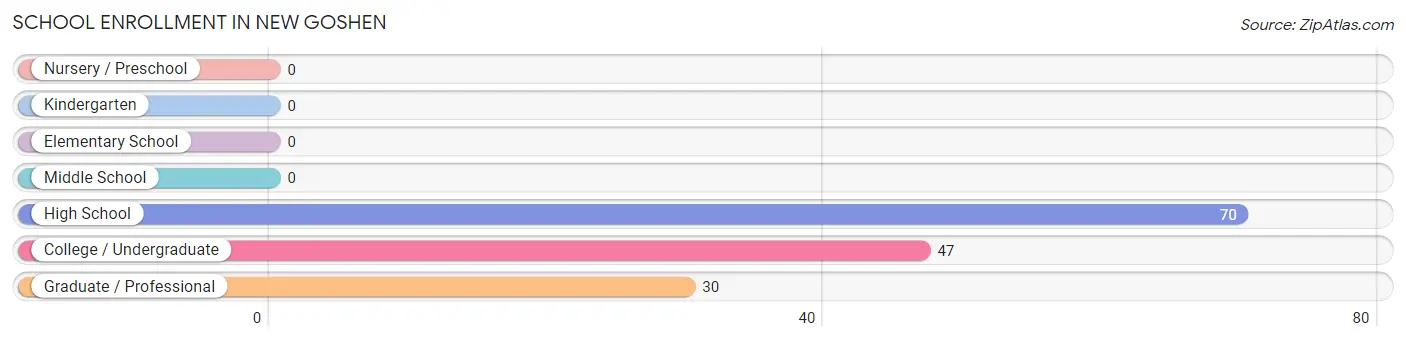
School Enrollment in New Goshen
The most common levels of schooling among the 147 students in New Goshen are high school (70 | 47.6%), college / undergraduate (47 | 32.0%), and graduate / professional (30 | 20.4%).
| School Level | # Students | % Students |
| Nursery / Preschool | 0 | 0.0% |
| Kindergarten | 0 | 0.0% |
| Elementary School | 0 | 0.0% |
| Middle School | 0 | 0.0% |
| High School | 70 | 47.6% |
| College / Undergraduate | 47 | 32.0% |
| Graduate / Professional | 30 | 20.4% |
| Total | 147 | 100.0% |
School Enrollment by Age by Funding Source in New Goshen
Out of a total of 147 students who are enrolled in schools in New Goshen, 30 (20.4%) attend a private institution, while the remaining 117 (79.6%) are enrolled in public schools. The age group of 35 years and over has the highest likelihood of being enrolled in private schools, with 30 (100.0% in the age bracket) enrolled. Conversely, the age group of 15 to 17 year olds has the lowest likelihood of being enrolled in a private school, with 70 (100.0% in the age bracket) attending a public institution.
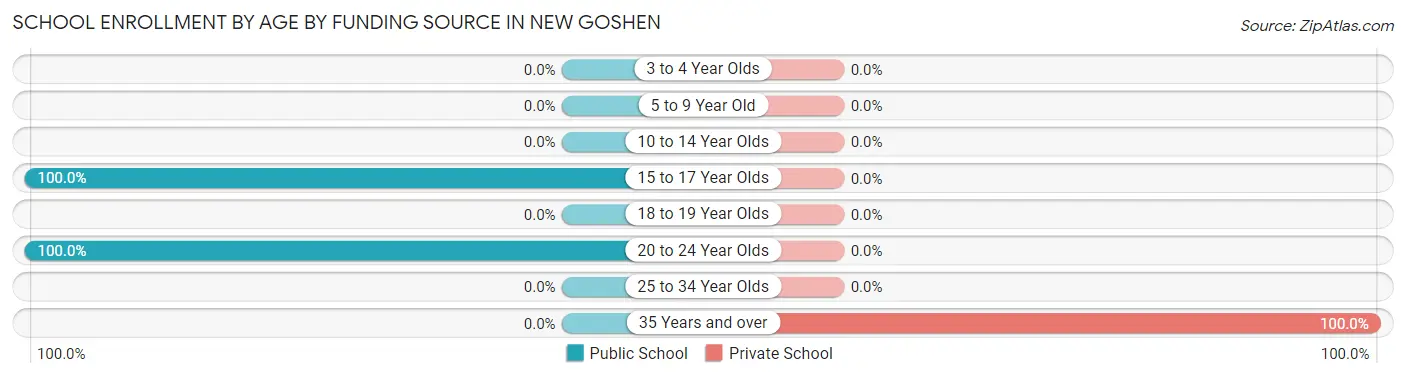
| Age Bracket | Public School | Private School |
| 3 to 4 Year Olds | 0 (0.0%) | 0 (0.0%) |
| 5 to 9 Year Old | 0 (0.0%) | 0 (0.0%) |
| 10 to 14 Year Olds | 0 (0.0%) | 0 (0.0%) |
| 15 to 17 Year Olds | 70 (100.0%) | 0 (0.0%) |
| 18 to 19 Year Olds | 0 (0.0%) | 0 (0.0%) |
| 20 to 24 Year Olds | 47 (100.0%) | 0 (0.0%) |
| 25 to 34 Year Olds | 0 (0.0%) | 0 (0.0%) |
| 35 Years and over | 0 (0.0%) | 30 (100.0%) |
| Total | 117 (79.6%) | 30 (20.4%) |
Educational Attainment by Field of Study in New Goshen
Business (38 | 79.2%), and liberal arts & history (10 | 20.8%) are the most common fields of study among 48 individuals in New Goshen who have obtained a bachelor's degree or higher.
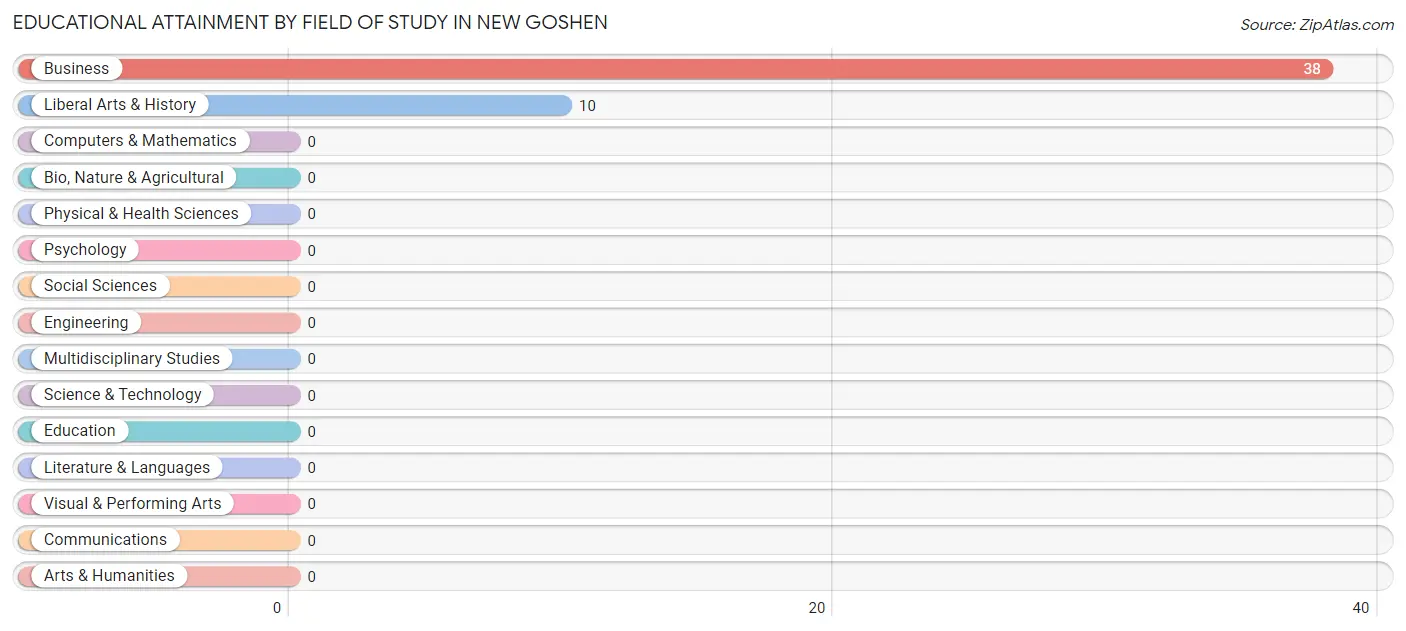
| Field of Study | # Graduates | % Graduates |
| Computers & Mathematics | 0 | 0.0% |
| Bio, Nature & Agricultural | 0 | 0.0% |
| Physical & Health Sciences | 0 | 0.0% |
| Psychology | 0 | 0.0% |
| Social Sciences | 0 | 0.0% |
| Engineering | 0 | 0.0% |
| Multidisciplinary Studies | 0 | 0.0% |
| Science & Technology | 0 | 0.0% |
| Business | 38 | 79.2% |
| Education | 0 | 0.0% |
| Literature & Languages | 0 | 0.0% |
| Liberal Arts & History | 10 | 20.8% |
| Visual & Performing Arts | 0 | 0.0% |
| Communications | 0 | 0.0% |
| Arts & Humanities | 0 | 0.0% |
| Total | 48 | 100.0% |
Transportation & Commute in New Goshen
Vehicle Availability by Sex in New Goshen
The most prevalent vehicle ownership categories in New Goshen are males with 1 vehicle (66, accounting for 45.5%) and females with 1 vehicle (94, making up 34.4%).
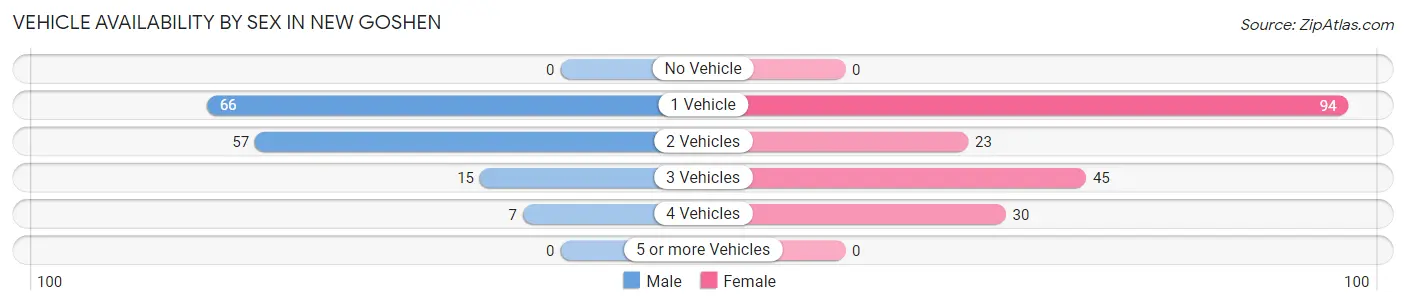
| Vehicles Available | Male | Female |
| No Vehicle | 0 (0.0%) | 0 (0.0%) |
| 1 Vehicle | 66 (45.5%) | 94 (49.0%) |
| 2 Vehicles | 57 (39.3%) | 23 (12.0%) |
| 3 Vehicles | 15 (10.3%) | 45 (23.4%) |
| 4 Vehicles | 7 (4.8%) | 30 (15.6%) |
| 5 or more Vehicles | 0 (0.0%) | 0 (0.0%) |
| Total | 145 (100.0%) | 192 (100.0%) |
Commute Time in New Goshen
The most frequently occuring commute durations in New Goshen are 15 to 19 minutes (151 commuters, 44.8%), 30 to 34 minutes (76 commuters, 22.6%), and 25 to 29 minutes (45 commuters, 13.4%).
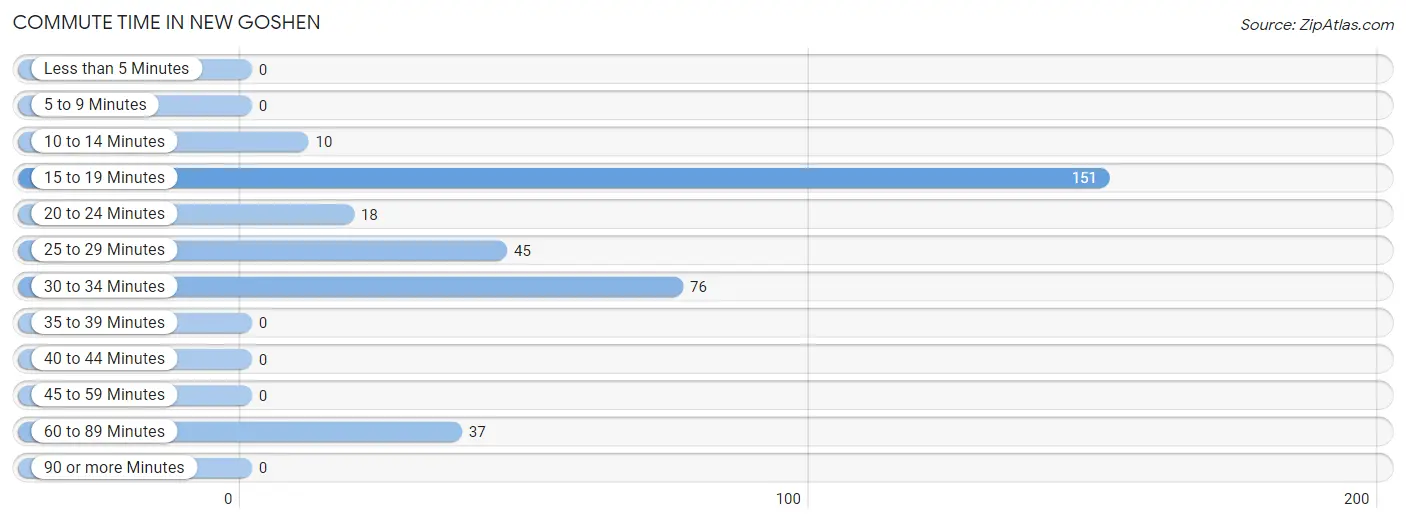
| Commute Time | # Commuters | % Commuters |
| Less than 5 Minutes | 0 | 0.0% |
| 5 to 9 Minutes | 0 | 0.0% |
| 10 to 14 Minutes | 10 | 3.0% |
| 15 to 19 Minutes | 151 | 44.8% |
| 20 to 24 Minutes | 18 | 5.3% |
| 25 to 29 Minutes | 45 | 13.4% |
| 30 to 34 Minutes | 76 | 22.6% |
| 35 to 39 Minutes | 0 | 0.0% |
| 40 to 44 Minutes | 0 | 0.0% |
| 45 to 59 Minutes | 0 | 0.0% |
| 60 to 89 Minutes | 37 | 11.0% |
| 90 or more Minutes | 0 | 0.0% |
Commute Time by Sex in New Goshen
The most common commute times in New Goshen are 30 to 34 minutes (76 commuters, 52.4%) for males and 15 to 19 minutes (107 commuters, 55.7%) for females.
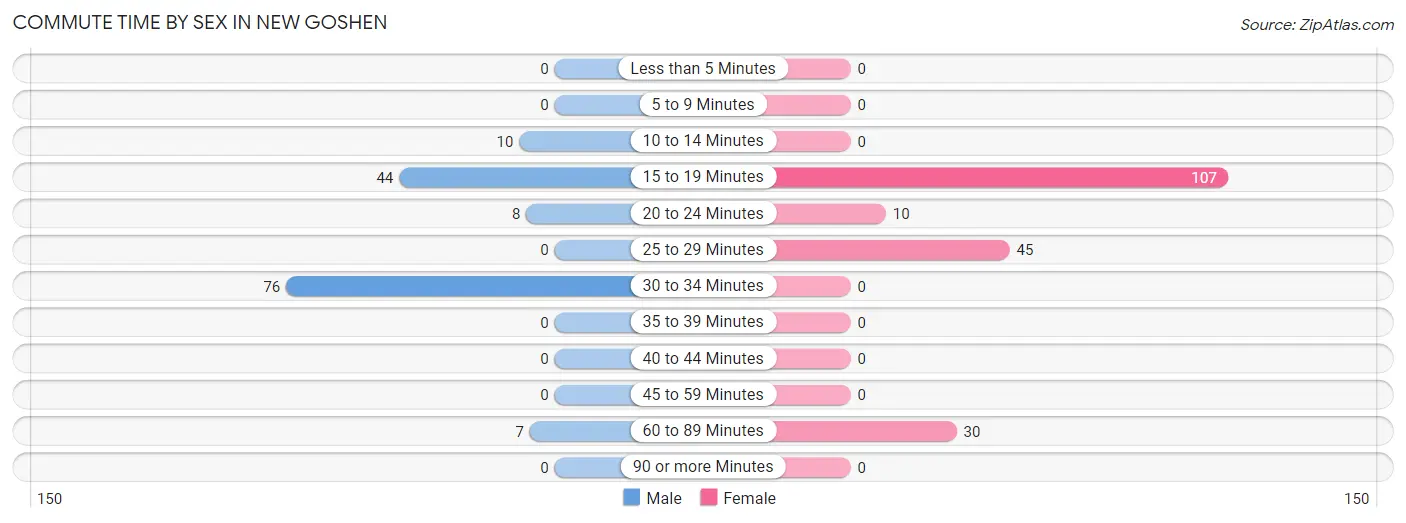
| Commute Time | Male | Female |
| Less than 5 Minutes | 0 (0.0%) | 0 (0.0%) |
| 5 to 9 Minutes | 0 (0.0%) | 0 (0.0%) |
| 10 to 14 Minutes | 10 (6.9%) | 0 (0.0%) |
| 15 to 19 Minutes | 44 (30.3%) | 107 (55.7%) |
| 20 to 24 Minutes | 8 (5.5%) | 10 (5.2%) |
| 25 to 29 Minutes | 0 (0.0%) | 45 (23.4%) |
| 30 to 34 Minutes | 76 (52.4%) | 0 (0.0%) |
| 35 to 39 Minutes | 0 (0.0%) | 0 (0.0%) |
| 40 to 44 Minutes | 0 (0.0%) | 0 (0.0%) |
| 45 to 59 Minutes | 0 (0.0%) | 0 (0.0%) |
| 60 to 89 Minutes | 7 (4.8%) | 30 (15.6%) |
| 90 or more Minutes | 0 (0.0%) | 0 (0.0%) |
Time of Departure to Work by Sex in New Goshen
The most frequent times of departure to work in New Goshen are 6:00 AM to 6:29 AM (56, 38.6%) for males and 8:00 AM to 8:29 AM (47, 24.5%) for females.
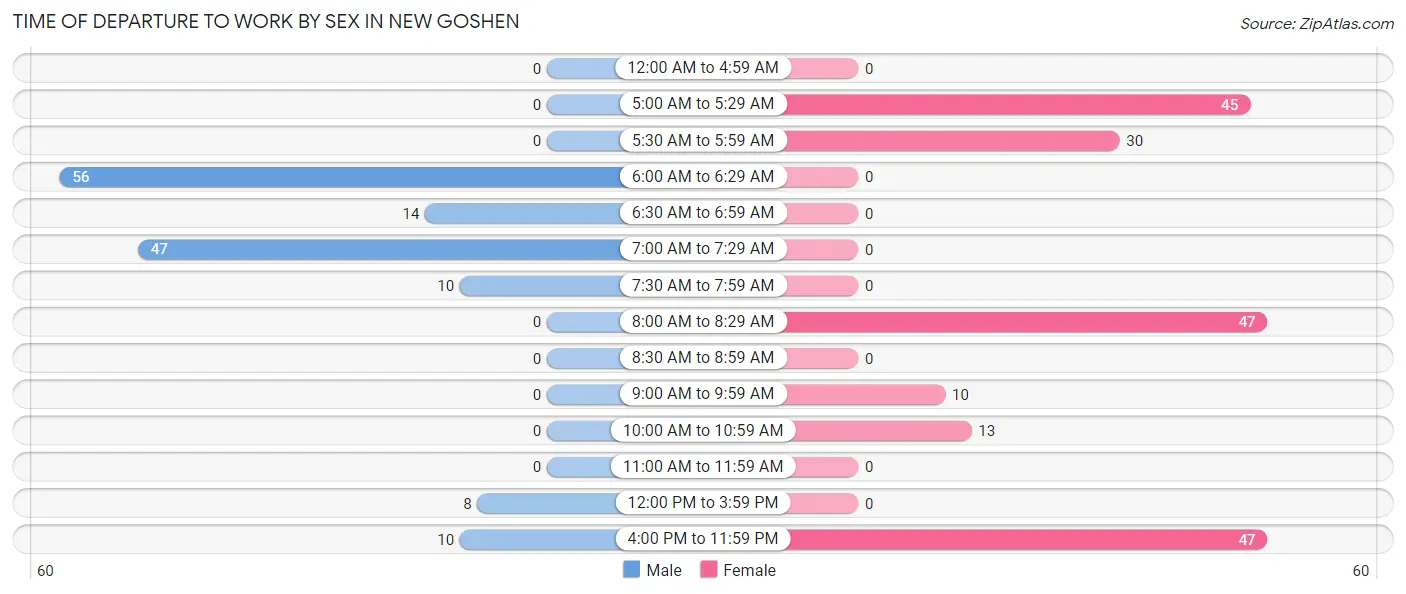
| Time of Departure | Male | Female |
| 12:00 AM to 4:59 AM | 0 (0.0%) | 0 (0.0%) |
| 5:00 AM to 5:29 AM | 0 (0.0%) | 45 (23.4%) |
| 5:30 AM to 5:59 AM | 0 (0.0%) | 30 (15.6%) |
| 6:00 AM to 6:29 AM | 56 (38.6%) | 0 (0.0%) |
| 6:30 AM to 6:59 AM | 14 (9.7%) | 0 (0.0%) |
| 7:00 AM to 7:29 AM | 47 (32.4%) | 0 (0.0%) |
| 7:30 AM to 7:59 AM | 10 (6.9%) | 0 (0.0%) |
| 8:00 AM to 8:29 AM | 0 (0.0%) | 47 (24.5%) |
| 8:30 AM to 8:59 AM | 0 (0.0%) | 0 (0.0%) |
| 9:00 AM to 9:59 AM | 0 (0.0%) | 10 (5.2%) |
| 10:00 AM to 10:59 AM | 0 (0.0%) | 13 (6.8%) |
| 11:00 AM to 11:59 AM | 0 (0.0%) | 0 (0.0%) |
| 12:00 PM to 3:59 PM | 8 (5.5%) | 0 (0.0%) |
| 4:00 PM to 11:59 PM | 10 (6.9%) | 47 (24.5%) |
| Total | 145 (100.0%) | 192 (100.0%) |
Housing Occupancy in New Goshen
Occupancy by Ownership in New Goshen
Of the total 201 dwellings in New Goshen, owner-occupied units account for 162 (80.6%), while renter-occupied units make up 39 (19.4%).
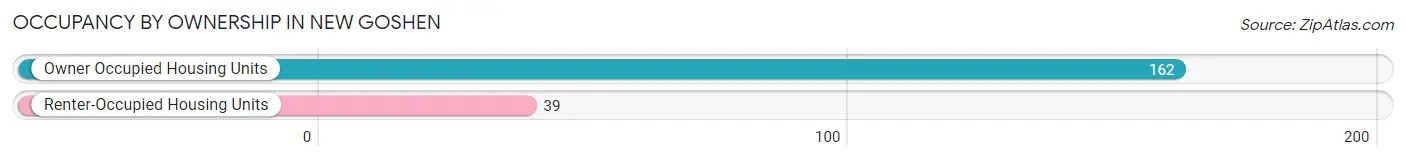
| Occupancy | # Housing Units | % Housing Units |
| Owner Occupied Housing Units | 162 | 80.6% |
| Renter-Occupied Housing Units | 39 | 19.4% |
| Total Occupied Housing Units | 201 | 100.0% |
Occupancy by Household Size in New Goshen
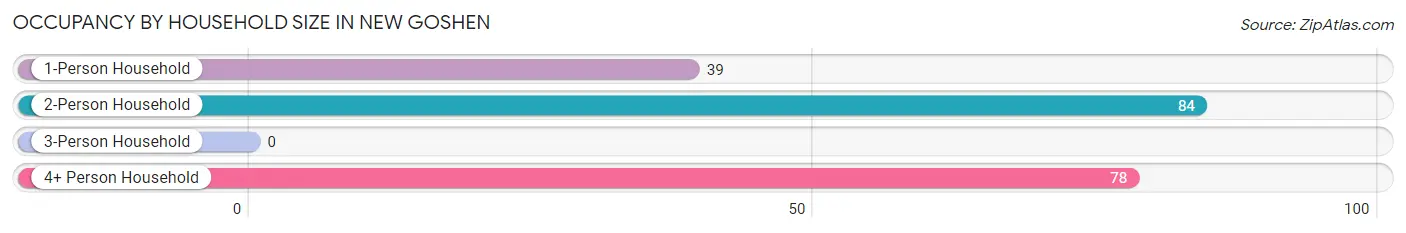
| Household Size | # Housing Units | % Housing Units |
| 1-Person Household | 39 | 19.4% |
| 2-Person Household | 84 | 41.8% |
| 3-Person Household | 0 | 0.0% |
| 4+ Person Household | 78 | 38.8% |
| Total Housing Units | 201 | 100.0% |
Occupancy by Ownership by Household Size in New Goshen
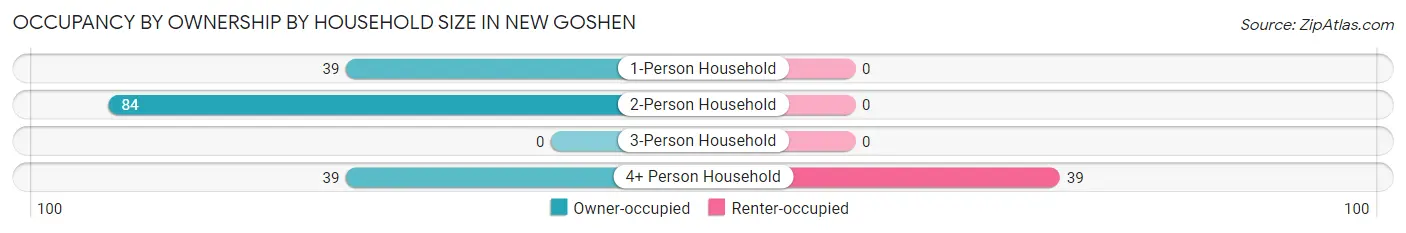
| Household Size | Owner-occupied | Renter-occupied |
| 1-Person Household | 39 (100.0%) | 0 (0.0%) |
| 2-Person Household | 84 (100.0%) | 0 (0.0%) |
| 3-Person Household | 0 (0.0%) | 0 (0.0%) |
| 4+ Person Household | 39 (50.0%) | 39 (50.0%) |
| Total Housing Units | 162 (80.6%) | 39 (19.4%) |
Occupancy by Educational Attainment in New Goshen
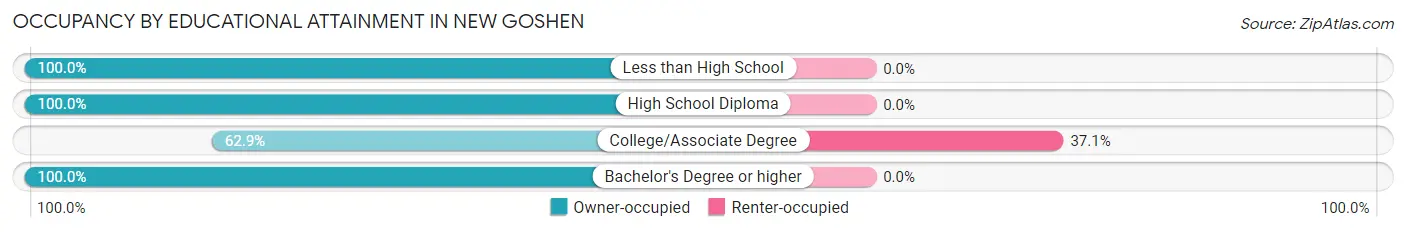
| Household Size | Owner-occupied | Renter-occupied |
| Less than High School | 8 (100.0%) | 0 (0.0%) |
| High School Diploma | 40 (100.0%) | 0 (0.0%) |
| College/Associate Degree | 66 (62.9%) | 39 (37.1%) |
| Bachelor's Degree or higher | 48 (100.0%) | 0 (0.0%) |
Occupancy by Age of Householder in New Goshen
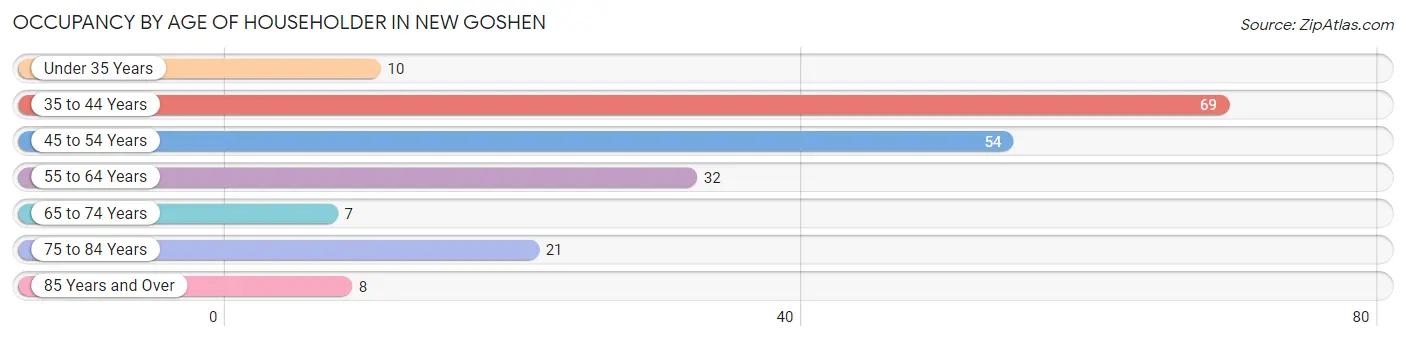
| Age Bracket | # Households | % Households |
| Under 35 Years | 10 | 5.0% |
| 35 to 44 Years | 69 | 34.3% |
| 45 to 54 Years | 54 | 26.9% |
| 55 to 64 Years | 32 | 15.9% |
| 65 to 74 Years | 7 | 3.5% |
| 75 to 84 Years | 21 | 10.4% |
| 85 Years and Over | 8 | 4.0% |
| Total | 201 | 100.0% |
Housing Finances in New Goshen
Median Income by Occupancy in New Goshen
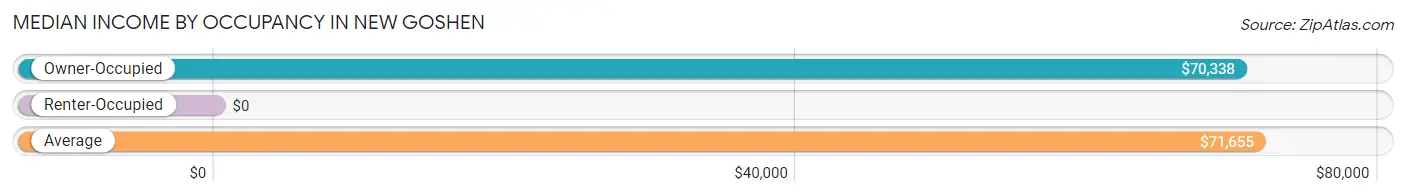
| Occupancy Type | # Households | Median Income |
| Owner-Occupied | 162 (80.6%) | $70,338 |
| Renter-Occupied | 39 (19.4%) | $0 |
| Average | 201 (100.0%) | $71,655 |
Occupancy by Householder Income Bracket in New Goshen
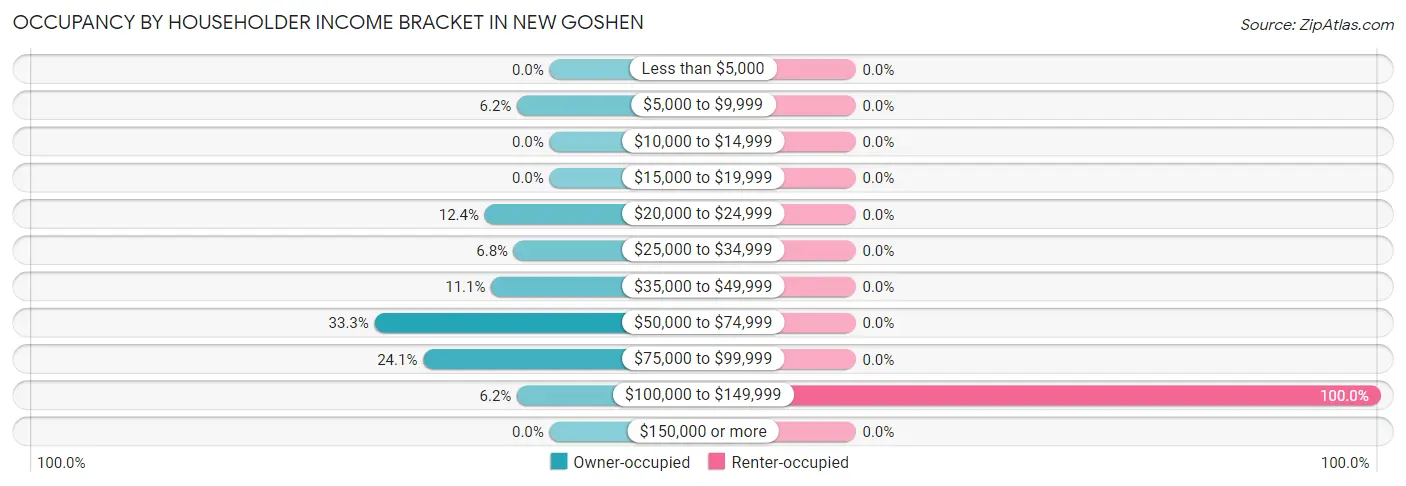
| Income Bracket | Owner-occupied | Renter-occupied |
| Less than $5,000 | 0 (0.0%) | 0 (0.0%) |
| $5,000 to $9,999 | 10 (6.2%) | 0 (0.0%) |
| $10,000 to $14,999 | 0 (0.0%) | 0 (0.0%) |
| $15,000 to $19,999 | 0 (0.0%) | 0 (0.0%) |
| $20,000 to $24,999 | 20 (12.3%) | 0 (0.0%) |
| $25,000 to $34,999 | 11 (6.8%) | 0 (0.0%) |
| $35,000 to $49,999 | 18 (11.1%) | 0 (0.0%) |
| $50,000 to $74,999 | 54 (33.3%) | 0 (0.0%) |
| $75,000 to $99,999 | 39 (24.1%) | 0 (0.0%) |
| $100,000 to $149,999 | 10 (6.2%) | 39 (100.0%) |
| $150,000 or more | 0 (0.0%) | 0 (0.0%) |
| Total | 162 (100.0%) | 39 (100.0%) |
Monthly Housing Cost Tiers in New Goshen
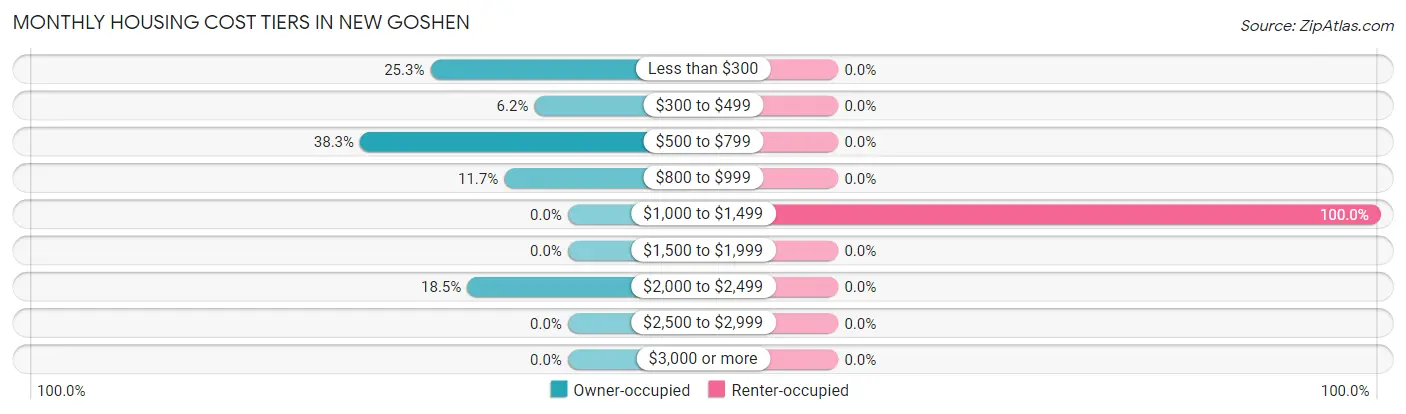
| Monthly Cost | Owner-occupied | Renter-occupied |
| Less than $300 | 41 (25.3%) | 0 (0.0%) |
| $300 to $499 | 10 (6.2%) | 0 (0.0%) |
| $500 to $799 | 62 (38.3%) | 0 (0.0%) |
| $800 to $999 | 19 (11.7%) | 0 (0.0%) |
| $1,000 to $1,499 | 0 (0.0%) | 39 (100.0%) |
| $1,500 to $1,999 | 0 (0.0%) | 0 (0.0%) |
| $2,000 to $2,499 | 30 (18.5%) | 0 (0.0%) |
| $2,500 to $2,999 | 0 (0.0%) | 0 (0.0%) |
| $3,000 or more | 0 (0.0%) | 0 (0.0%) |
| Total | 162 (100.0%) | 39 (100.0%) |
Physical Housing Characteristics in New Goshen
Housing Structures in New Goshen
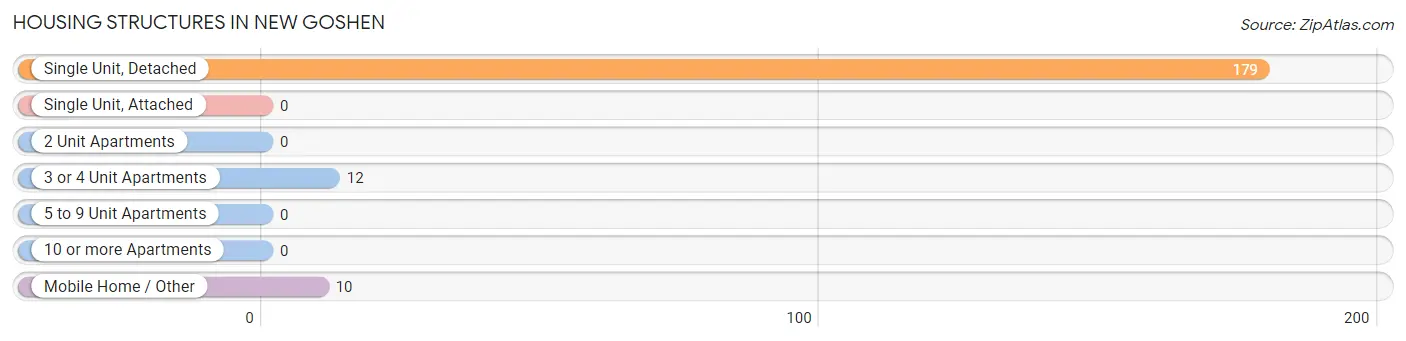
| Structure Type | # Housing Units | % Housing Units |
| Single Unit, Detached | 179 | 89.0% |
| Single Unit, Attached | 0 | 0.0% |
| 2 Unit Apartments | 0 | 0.0% |
| 3 or 4 Unit Apartments | 12 | 6.0% |
| 5 to 9 Unit Apartments | 0 | 0.0% |
| 10 or more Apartments | 0 | 0.0% |
| Mobile Home / Other | 10 | 5.0% |
| Total | 201 | 100.0% |
Housing Structures by Occupancy in New Goshen
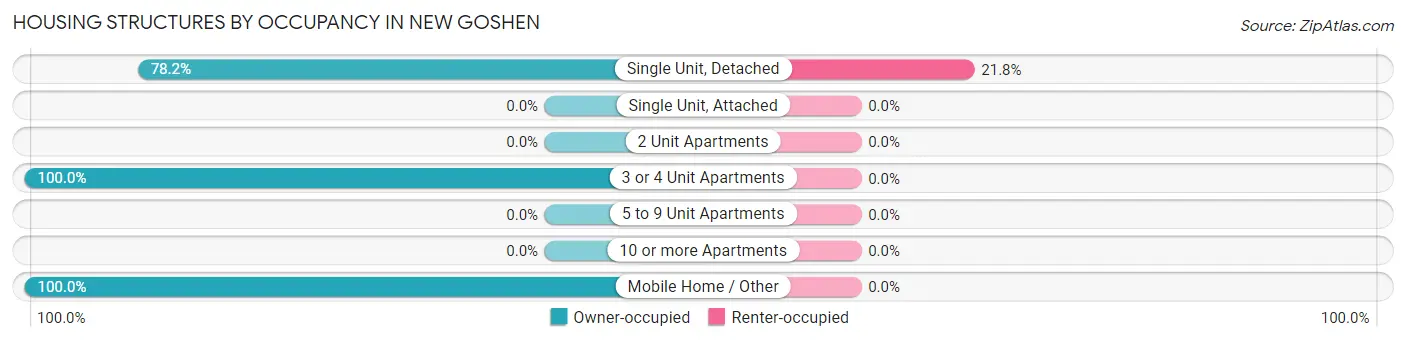
| Structure Type | Owner-occupied | Renter-occupied |
| Single Unit, Detached | 140 (78.2%) | 39 (21.8%) |
| Single Unit, Attached | 0 (0.0%) | 0 (0.0%) |
| 2 Unit Apartments | 0 (0.0%) | 0 (0.0%) |
| 3 or 4 Unit Apartments | 12 (100.0%) | 0 (0.0%) |
| 5 to 9 Unit Apartments | 0 (0.0%) | 0 (0.0%) |
| 10 or more Apartments | 0 (0.0%) | 0 (0.0%) |
| Mobile Home / Other | 10 (100.0%) | 0 (0.0%) |
| Total | 162 (80.6%) | 39 (19.4%) |
Housing Structures by Number of Rooms in New Goshen
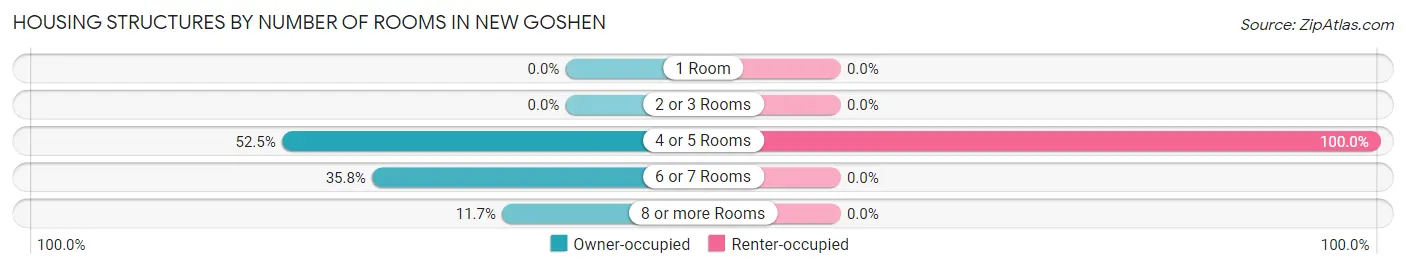
| Number of Rooms | Owner-occupied | Renter-occupied |
| 1 Room | 0 (0.0%) | 0 (0.0%) |
| 2 or 3 Rooms | 0 (0.0%) | 0 (0.0%) |
| 4 or 5 Rooms | 85 (52.5%) | 39 (100.0%) |
| 6 or 7 Rooms | 58 (35.8%) | 0 (0.0%) |
| 8 or more Rooms | 19 (11.7%) | 0 (0.0%) |
| Total | 162 (100.0%) | 39 (100.0%) |
Housing Structure by Heating Type in New Goshen
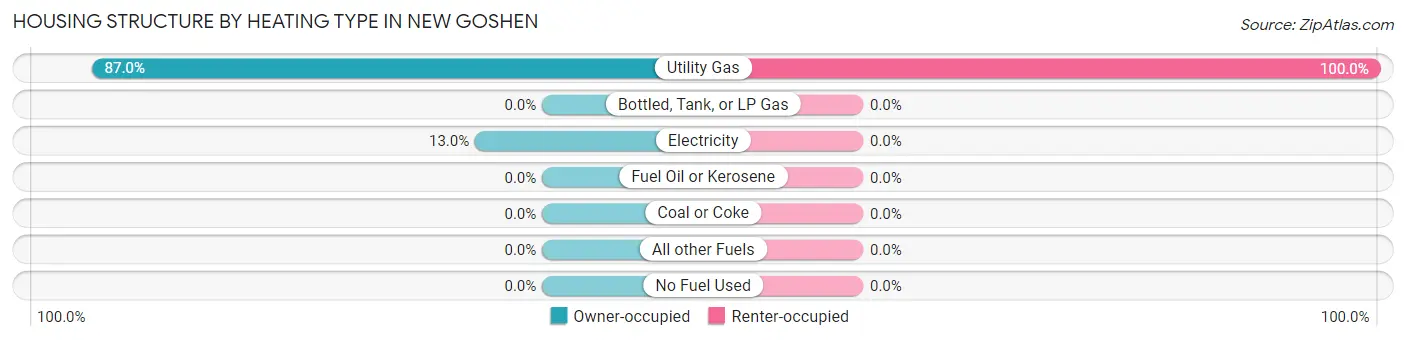
| Heating Type | Owner-occupied | Renter-occupied |
| Utility Gas | 141 (87.0%) | 39 (100.0%) |
| Bottled, Tank, or LP Gas | 0 (0.0%) | 0 (0.0%) |
| Electricity | 21 (13.0%) | 0 (0.0%) |
| Fuel Oil or Kerosene | 0 (0.0%) | 0 (0.0%) |
| Coal or Coke | 0 (0.0%) | 0 (0.0%) |
| All other Fuels | 0 (0.0%) | 0 (0.0%) |
| No Fuel Used | 0 (0.0%) | 0 (0.0%) |
| Total | 162 (100.0%) | 39 (100.0%) |
Household Vehicle Usage in New Goshen
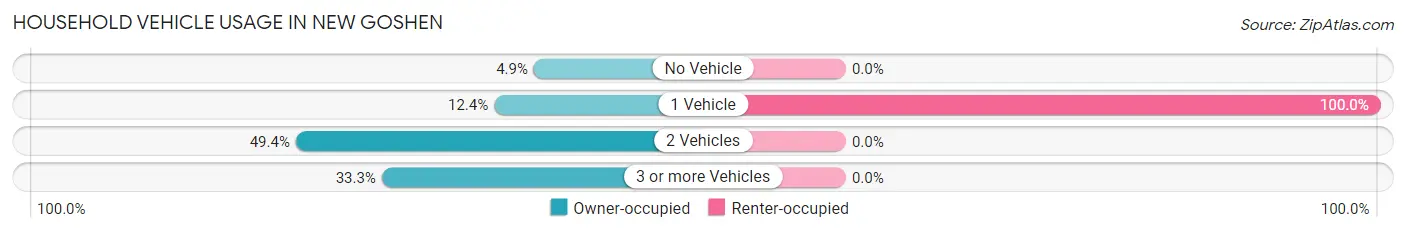
| Vehicles per Household | Owner-occupied | Renter-occupied |
| No Vehicle | 8 (4.9%) | 0 (0.0%) |
| 1 Vehicle | 20 (12.3%) | 39 (100.0%) |
| 2 Vehicles | 80 (49.4%) | 0 (0.0%) |
| 3 or more Vehicles | 54 (33.3%) | 0 (0.0%) |
| Total | 162 (100.0%) | 39 (100.0%) |
Real Estate & Mortgages in New Goshen
Real Estate and Mortgage Overview in New Goshen
| Characteristic | Without Mortgage | With Mortgage |
| Housing Units | 51 | 111 |
| Median Property Value | $53,500 | $0 |
| Median Household Income | $24,438 | $0 |
| Monthly Housing Costs | $259 | $0 |
| Real Estate Taxes | $332 | $37 |
Property Value by Mortgage Status in New Goshen
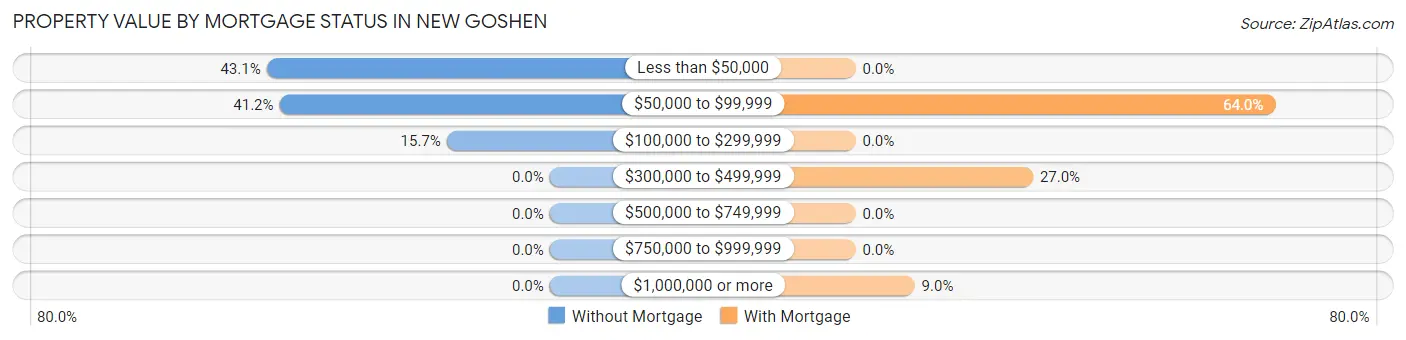
| Property Value | Without Mortgage | With Mortgage |
| Less than $50,000 | 22 (43.1%) | 0 (0.0%) |
| $50,000 to $99,999 | 21 (41.2%) | 71 (64.0%) |
| $100,000 to $299,999 | 8 (15.7%) | 0 (0.0%) |
| $300,000 to $499,999 | 0 (0.0%) | 30 (27.0%) |
| $500,000 to $749,999 | 0 (0.0%) | 0 (0.0%) |
| $750,000 to $999,999 | 0 (0.0%) | 0 (0.0%) |
| $1,000,000 or more | 0 (0.0%) | 10 (9.0%) |
| Total | 51 (100.0%) | 111 (100.0%) |
Household Income by Mortgage Status in New Goshen
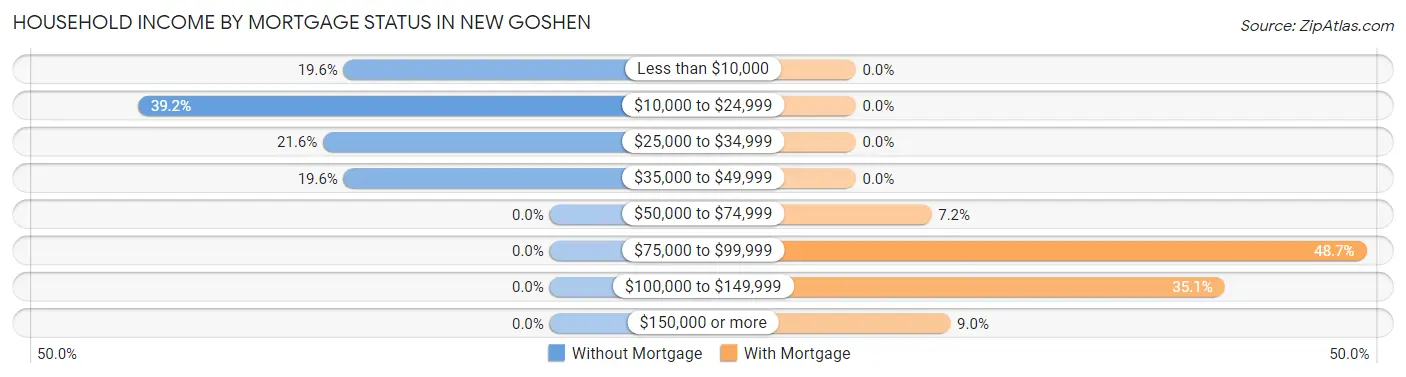
| Household Income | Without Mortgage | With Mortgage |
| Less than $10,000 | 10 (19.6%) | 0 (0.0%) |
| $10,000 to $24,999 | 20 (39.2%) | 0 (0.0%) |
| $25,000 to $34,999 | 11 (21.6%) | 0 (0.0%) |
| $35,000 to $49,999 | 10 (19.6%) | 0 (0.0%) |
| $50,000 to $74,999 | 0 (0.0%) | 8 (7.2%) |
| $75,000 to $99,999 | 0 (0.0%) | 54 (48.6%) |
| $100,000 to $149,999 | 0 (0.0%) | 39 (35.1%) |
| $150,000 or more | 0 (0.0%) | 10 (9.0%) |
| Total | 51 (100.0%) | 111 (100.0%) |
Property Value to Household Income Ratio in New Goshen
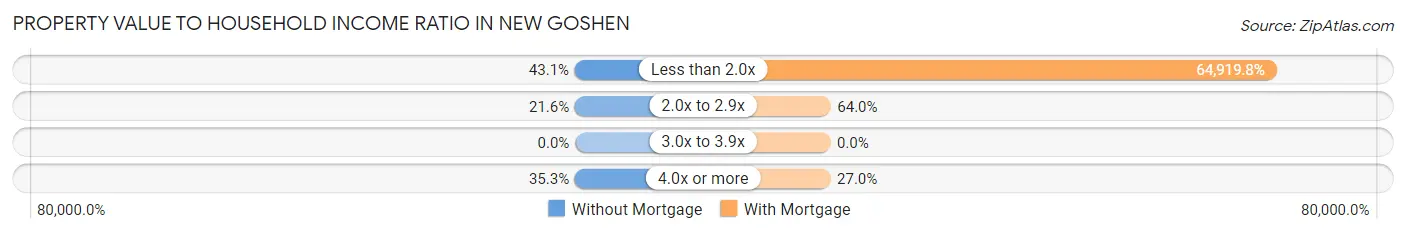
| Value-to-Income Ratio | Without Mortgage | With Mortgage |
| Less than 2.0x | 22 (43.1%) | 72,061 (64,919.8%) |
| 2.0x to 2.9x | 11 (21.6%) | 71 (64.0%) |
| 3.0x to 3.9x | 0 (0.0%) | 0 (0.0%) |
| 4.0x or more | 18 (35.3%) | 30 (27.0%) |
| Total | 51 (100.0%) | 111 (100.0%) |
Real Estate Taxes by Mortgage Status in New Goshen
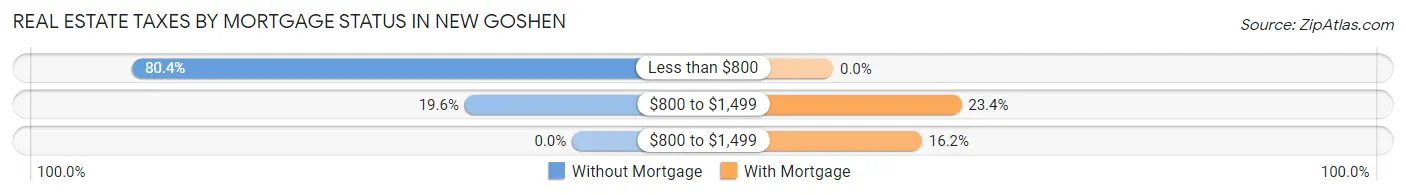
| Property Taxes | Without Mortgage | With Mortgage |
| Less than $800 | 41 (80.4%) | 0 (0.0%) |
| $800 to $1,499 | 10 (19.6%) | 26 (23.4%) |
| $800 to $1,499 | 0 (0.0%) | 18 (16.2%) |
| Total | 51 (100.0%) | 111 (100.0%) |
Health & Disability in New Goshen
Health Insurance Coverage by Age in New Goshen
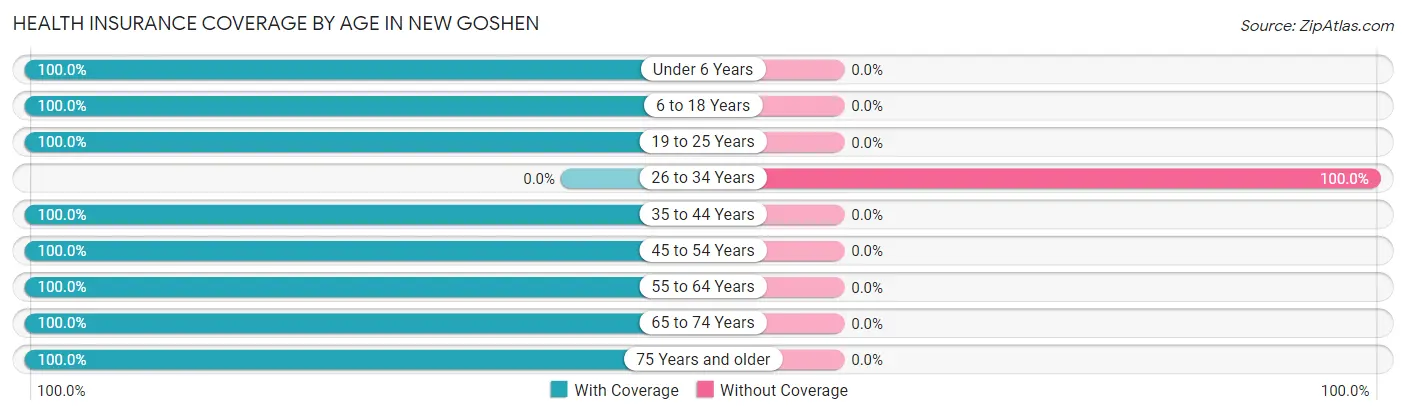
| Age Bracket | With Coverage | Without Coverage |
| Under 6 Years | 13 (100.0%) | 0 (0.0%) |
| 6 to 18 Years | 70 (100.0%) | 0 (0.0%) |
| 19 to 25 Years | 196 (100.0%) | 0 (0.0%) |
| 26 to 34 Years | 0 (0.0%) | 8 (100.0%) |
| 35 to 44 Years | 127 (100.0%) | 0 (0.0%) |
| 45 to 54 Years | 80 (100.0%) | 0 (0.0%) |
| 55 to 64 Years | 49 (100.0%) | 0 (0.0%) |
| 65 to 74 Years | 11 (100.0%) | 0 (0.0%) |
| 75 Years and older | 29 (100.0%) | 0 (0.0%) |
| Total | 575 (98.6%) | 8 (1.4%) |
Health Insurance Coverage by Citizenship Status in New Goshen
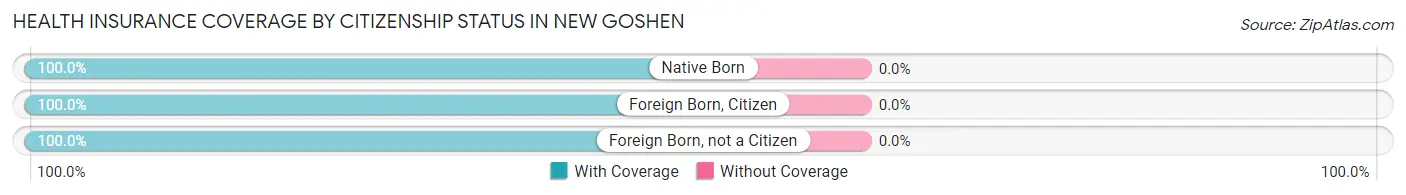
| Citizenship Status | With Coverage | Without Coverage |
| Native Born | 13 (100.0%) | 0 (0.0%) |
| Foreign Born, Citizen | 70 (100.0%) | 0 (0.0%) |
| Foreign Born, not a Citizen | 196 (100.0%) | 0 (0.0%) |
Health Insurance Coverage by Household Income in New Goshen
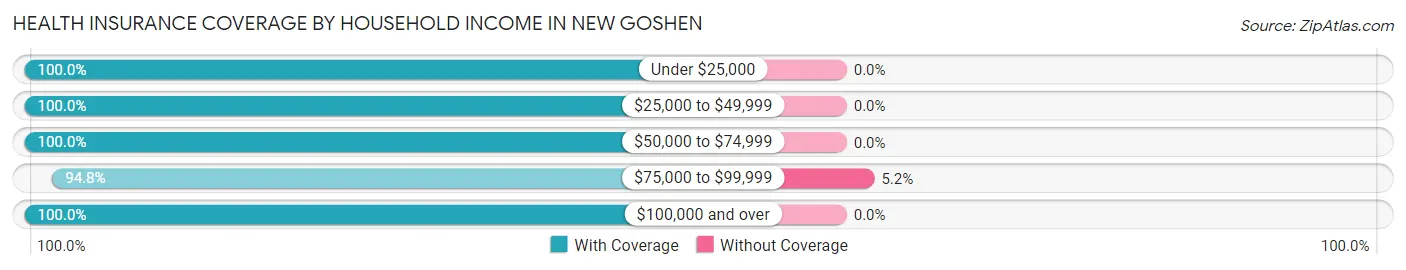
| Household Income | With Coverage | Without Coverage |
| Under $25,000 | 43 (100.0%) | 0 (0.0%) |
| $25,000 to $49,999 | 36 (100.0%) | 0 (0.0%) |
| $50,000 to $74,999 | 102 (100.0%) | 0 (0.0%) |
| $75,000 to $99,999 | 146 (94.8%) | 8 (5.2%) |
| $100,000 and over | 248 (100.0%) | 0 (0.0%) |
Public vs Private Health Insurance Coverage by Age in New Goshen
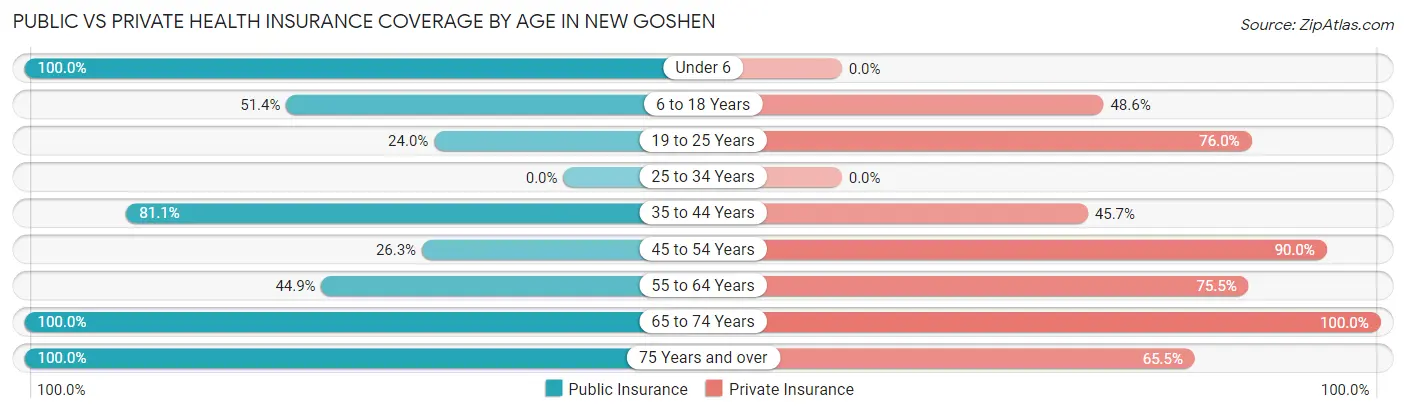
| Age Bracket | Public Insurance | Private Insurance |
| Under 6 | 13 (100.0%) | 0 (0.0%) |
| 6 to 18 Years | 36 (51.4%) | 34 (48.6%) |
| 19 to 25 Years | 47 (24.0%) | 149 (76.0%) |
| 25 to 34 Years | 0 (0.0%) | 0 (0.0%) |
| 35 to 44 Years | 103 (81.1%) | 58 (45.7%) |
| 45 to 54 Years | 21 (26.3%) | 72 (90.0%) |
| 55 to 64 Years | 22 (44.9%) | 37 (75.5%) |
| 65 to 74 Years | 11 (100.0%) | 11 (100.0%) |
| 75 Years and over | 29 (100.0%) | 19 (65.5%) |
| Total | 282 (48.4%) | 380 (65.2%) |
Disability Status by Sex by Age in New Goshen
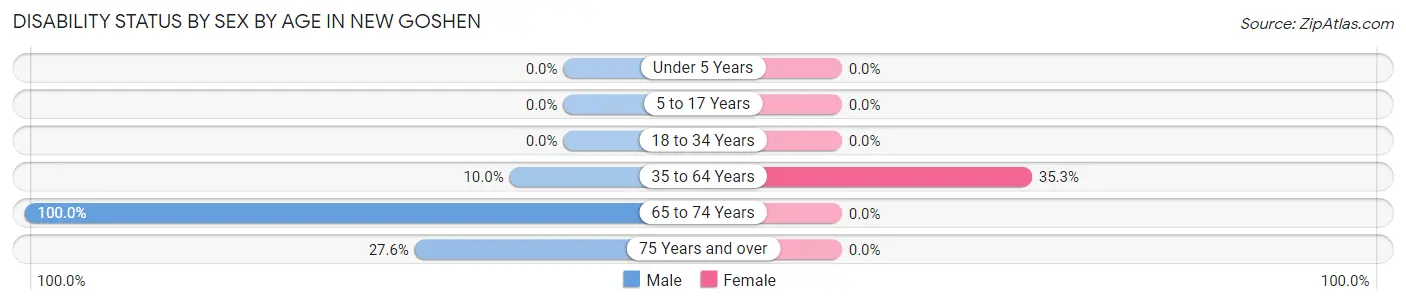
| Age Bracket | Male | Female |
| Under 5 Years | 0 (0.0%) | 0 (0.0%) |
| 5 to 17 Years | 0 (0.0%) | 0 (0.0%) |
| 18 to 34 Years | 0 (0.0%) | 0 (0.0%) |
| 35 to 64 Years | 10 (10.0%) | 55 (35.3%) |
| 65 to 74 Years | 7 (100.0%) | 0 (0.0%) |
| 75 Years and over | 8 (27.6%) | 0 (0.0%) |
Disability Class by Sex by Age in New Goshen
Disability Class: Hearing Difficulty
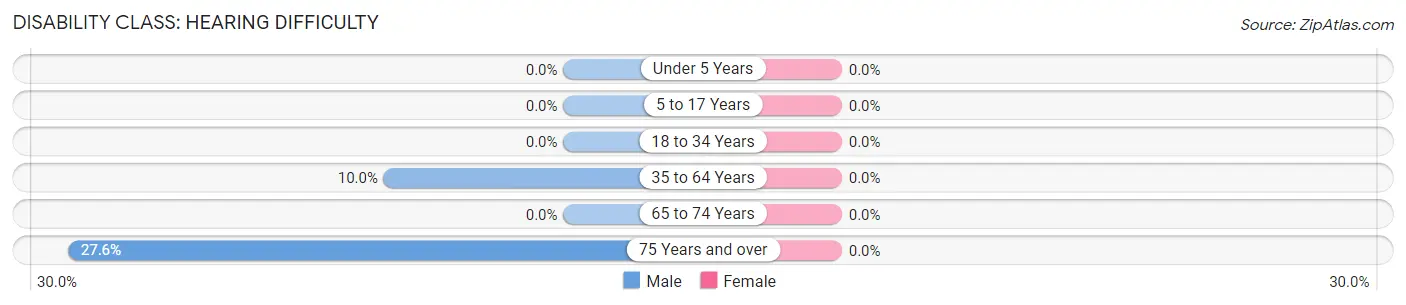
| Age Bracket | Male | Female |
| Under 5 Years | 0 (0.0%) | 0 (0.0%) |
| 5 to 17 Years | 0 (0.0%) | 0 (0.0%) |
| 18 to 34 Years | 0 (0.0%) | 0 (0.0%) |
| 35 to 64 Years | 10 (10.0%) | 0 (0.0%) |
| 65 to 74 Years | 0 (0.0%) | 0 (0.0%) |
| 75 Years and over | 8 (27.6%) | 0 (0.0%) |
Disability Class: Vision Difficulty
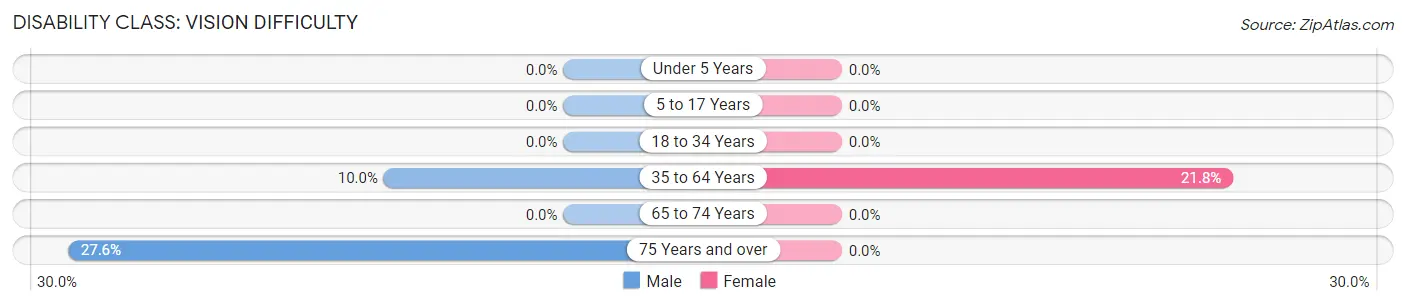
| Age Bracket | Male | Female |
| Under 5 Years | 0 (0.0%) | 0 (0.0%) |
| 5 to 17 Years | 0 (0.0%) | 0 (0.0%) |
| 18 to 34 Years | 0 (0.0%) | 0 (0.0%) |
| 35 to 64 Years | 10 (10.0%) | 34 (21.8%) |
| 65 to 74 Years | 0 (0.0%) | 0 (0.0%) |
| 75 Years and over | 8 (27.6%) | 0 (0.0%) |
Disability Class: Cognitive Difficulty
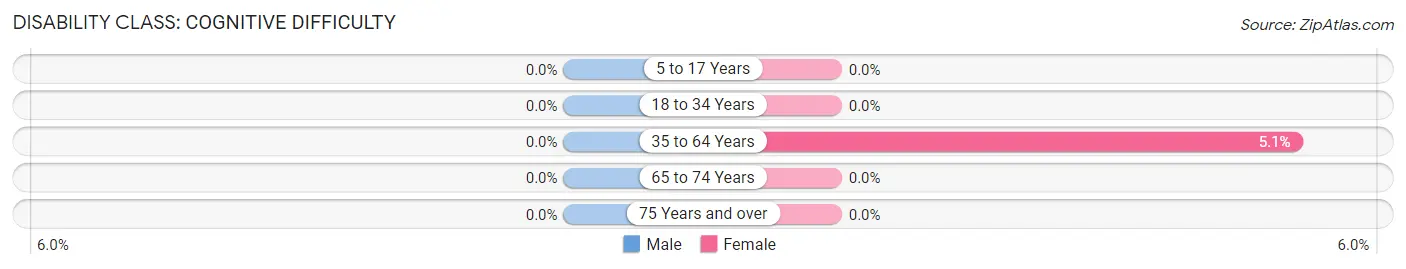
| Age Bracket | Male | Female |
| 5 to 17 Years | 0 (0.0%) | 0 (0.0%) |
| 18 to 34 Years | 0 (0.0%) | 0 (0.0%) |
| 35 to 64 Years | 0 (0.0%) | 8 (5.1%) |
| 65 to 74 Years | 0 (0.0%) | 0 (0.0%) |
| 75 Years and over | 0 (0.0%) | 0 (0.0%) |
Disability Class: Ambulatory Difficulty
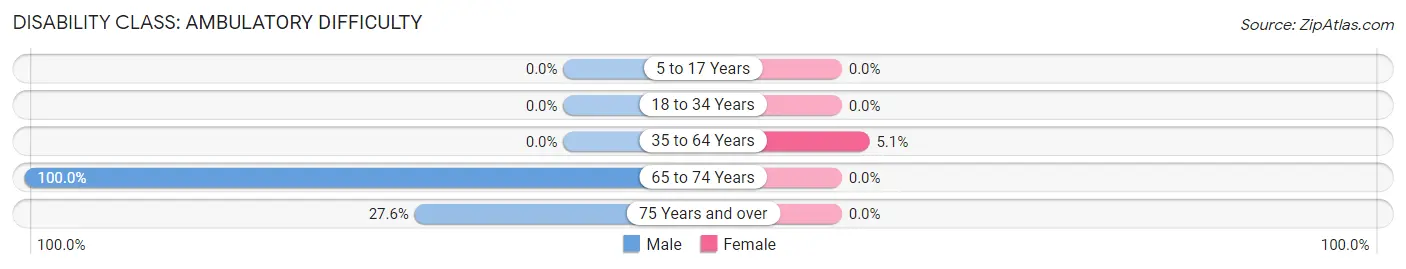
| Age Bracket | Male | Female |
| 5 to 17 Years | 0 (0.0%) | 0 (0.0%) |
| 18 to 34 Years | 0 (0.0%) | 0 (0.0%) |
| 35 to 64 Years | 0 (0.0%) | 8 (5.1%) |
| 65 to 74 Years | 7 (100.0%) | 0 (0.0%) |
| 75 Years and over | 8 (27.6%) | 0 (0.0%) |
Disability Class: Self-Care Difficulty
| Age Bracket | Male | Female |
| 5 to 17 Years | 0 (0.0%) | 0 (0.0%) |
| 18 to 34 Years | 0 (0.0%) | 0 (0.0%) |
| 35 to 64 Years | 0 (0.0%) | 0 (0.0%) |
| 65 to 74 Years | 0 (0.0%) | 0 (0.0%) |
| 75 Years and over | 0 (0.0%) | 0 (0.0%) |
Technology Access in New Goshen
Computing Device Access in New Goshen
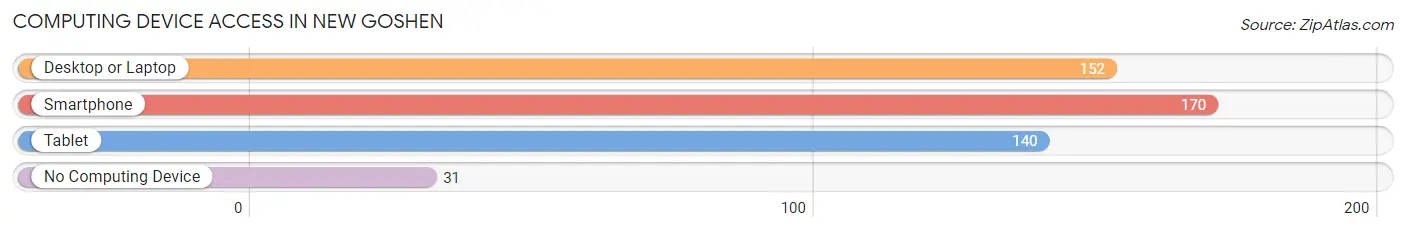
| Device Type | # Households | % Households |
| Desktop or Laptop | 152 | 75.6% |
| Smartphone | 170 | 84.6% |
| Tablet | 140 | 69.7% |
| No Computing Device | 31 | 15.4% |
| Total | 201 | 100.0% |
Internet Access in New Goshen
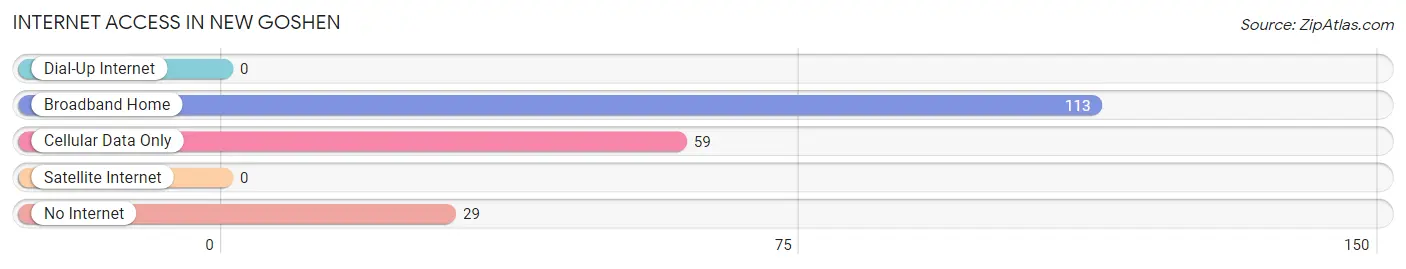
| Internet Type | # Households | % Households |
| Dial-Up Internet | 0 | 0.0% |
| Broadband Home | 113 | 56.2% |
| Cellular Data Only | 59 | 29.3% |
| Satellite Internet | 0 | 0.0% |
| No Internet | 29 | 14.4% |
| Total | 201 | 100.0% |
New Goshen Summary
Goshen is a city located in Elkhart County, Indiana, United States. It is the county seat of Elkhart County and is located in the northern part of the state, about 15 miles east of South Bend. The population was 31,719 at the 2010 census, which makes it the 13th largest city in Indiana.
History
Goshen was founded in 1831 by William G. Ewing, a Quaker from Pennsylvania. He named the city after the biblical city of Goshen, which was located in the land of Goshen in the Bible. The city was incorporated in 1835 and was the first city in Elkhart County.
Goshen was an important stop on the Underground Railroad, and was home to many abolitionists. In 1838, the first anti-slavery society in Indiana was formed in Goshen. The city was also home to the first public library in Elkhart County, which was established in 1845.
Goshen was an important center of industry in the late 19th and early 20th centuries. The city was home to several factories, including the Goshen Stove Company, the Goshen Wagon Works, and the Goshen Foundry. The city was also home to the first electric streetcar line in Indiana, which was established in 1891.
Geography
Goshen is located at 41°33'N 85°50'W (41.55, -85.83). According to the 2010 census, the city has a total area of 8.9 square miles (23.1 km2), of which 8.8 square miles (22.8 km2) is land and 0.1 square miles (0.3 km2) is water.
Goshen is located in the northern part of Indiana, about 15 miles east of South Bend. The city is situated in the Elkhart-Goshen metropolitan area, which is part of the larger South Bend-Elkhart-Mishawaka Combined Statistical Area.
Economy
Goshen is a major economic center in northern Indiana. The city is home to several large employers, including the Elkhart County government, the Elkhart General Hospital, and the Goshen Health System. The city is also home to several manufacturing companies, including the Goshen Stove Company, the Goshen Wagon Works, and the Goshen Foundry.
Goshen is also home to several educational institutions, including Goshen College, Ivy Tech Community College, and the Elkhart County Career and Technical Education Center.
Demographics
As of the 2010 census, there were 31,719 people, 12,845 households, and 7,845 families residing in the city. The population density was 3,569.3 people per square mile (1,380.2/km2). There were 13,845 housing units at an average density of 1,567.3 per square mile (605.7/km2). The racial makeup of the city was 79.2% White, 0.7% African American, 0.5% Native American, 0.7% Asian, 0.1% Pacific Islander, 16.2% from other races, and 2.7% from two or more races. Hispanic or Latino of any race were 33.2% of the population.
There were 12,845 households, out of which 30.2% had children under the age of 18 living with them, 43.2% were married couples living together, 14.3% had a female householder with no husband present, and 36.7% were non-families. 30.7% of all households were made up of individuals, and 12.3% had someone living alone who was 65 years of age or older. The average household size was 2.45 and the average family size was 3.04.
In the city, the population was spread out, with 25.7% under the age of 18, 10.2% from 18 to 24, 28.7% from 25 to 44, 20.2% from 45 to 64, and 15.2% who were 65 years of age or older. The median age was 34 years. For every 100 females, there were 93.2 males. For every 100 females age 18 and over, there were 89.7 males.
The median income for a household in the city was $37,845, and the median income for a family was $45,945. Males had a median income of $32,917 versus $25,945 for females. The per capita income for the city was $19,845. About 10.2% of families and 13.3% of the population were below the poverty line, including 18.2% of those under age 18 and 8.2% of those age 65 or over.
Common Questions
What is Per Capita Income in New Goshen?
Per Capita income in New Goshen is $26,440.
What is the Median Family Income in New Goshen?
Median Family Income in New Goshen is $90,667.
What is the Median Household income in New Goshen?
Median Household Income in New Goshen is $71,655.
What is Income or Wage Gap in New Goshen?
Income or Wage Gap in New Goshen is 46.4%.
Women in New Goshen earn 53.6 cents for every dollar earned by a man.
What is Inequality or Gini Index in New Goshen?
Inequality or Gini Index in New Goshen is 0.25.
What is the Total Population of New Goshen?
Total Population of New Goshen is 583.
What is the Total Male Population of New Goshen?
Total Male Population of New Goshen is 228.
What is the Total Female Population of New Goshen?
Total Female Population of New Goshen is 355.
What is the Ratio of Males per 100 Females in New Goshen?
There are 64.23 Males per 100 Females in New Goshen.
What is the Ratio of Females per 100 Males in New Goshen?
There are 155.70 Females per 100 Males in New Goshen.
What is the Median Population Age in New Goshen?
Median Population Age in New Goshen is 39.2 Years.
What is the Average Family Size in New Goshen
Average Family Size in New Goshen is 3.5 People.
What is the Average Household Size in New Goshen
Average Household Size in New Goshen is 2.9 People.
How Large is the Labor Force in New Goshen?
There are 376 People in the Labor Forcein in New Goshen.
What is the Percentage of People in the Labor Force in New Goshen?
70.4% of People are in the Labor Force in New Goshen.
What is the Unemployment Rate in New Goshen?
Unemployment Rate in New Goshen is 10.4%.