New Washington, IN Map & Demographics
New Washington Map
New Washington Overview
$31,305
PER CAPITA INCOME
$78,333
AVG FAMILY INCOME
$70,298
AVG HOUSEHOLD INCOME
0.38
INEQUALITY / GINI INDEX
463
TOTAL POPULATION
217
MALE POPULATION
246
FEMALE POPULATION
88.21
MALES / 100 FEMALES
113.36
FEMALES / 100 MALES
47.5
MEDIAN AGE
3.2
AVG FAMILY SIZE
2.5
AVG HOUSEHOLD SIZE
250
LABOR FORCE [ PEOPLE ]
62.2%
PERCENT IN LABOR FORCE
New Washington Zip Codes
New Washington Area Codes
Income in New Washington
Income Overview in New Washington
Per Capita Income in New Washington is $31,305, while median incomes of families and households are $78,333 and $70,298 respectively.
| Characteristic | Number | Measure |
| Per Capita Income | 463 | $31,305 |
| Median Family Income | 112 | $78,333 |
| Mean Family Income | 112 | $97,563 |
| Median Household Income | 189 | $70,298 |
| Mean Household Income | 189 | $70,987 |
| Income Deficit | 112 | $0 |
| Wage / Income Gap (%) | 463 | 0.00% |
| Wage / Income Gap ($) | 463 | 100.00¢ per $1 |
| Gini / Inequality Index | 463 | 0.38 |
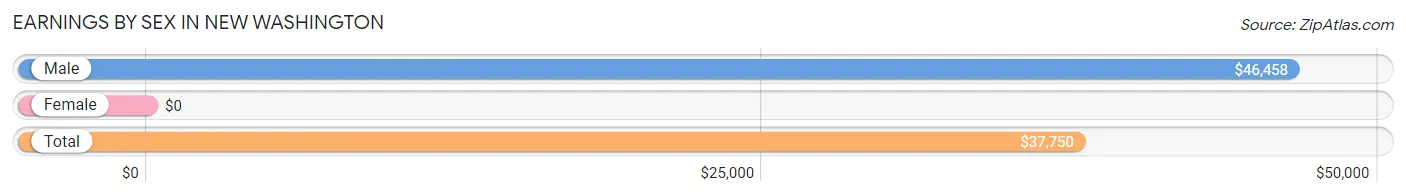
Earnings by Sex in New Washington
| Sex | Number | Average Earnings |
| Male | 130 (49.2%) | $46,458 |
| Female | 134 (50.8%) | $0 |
| Total | 264 (100.0%) | $37,750 |
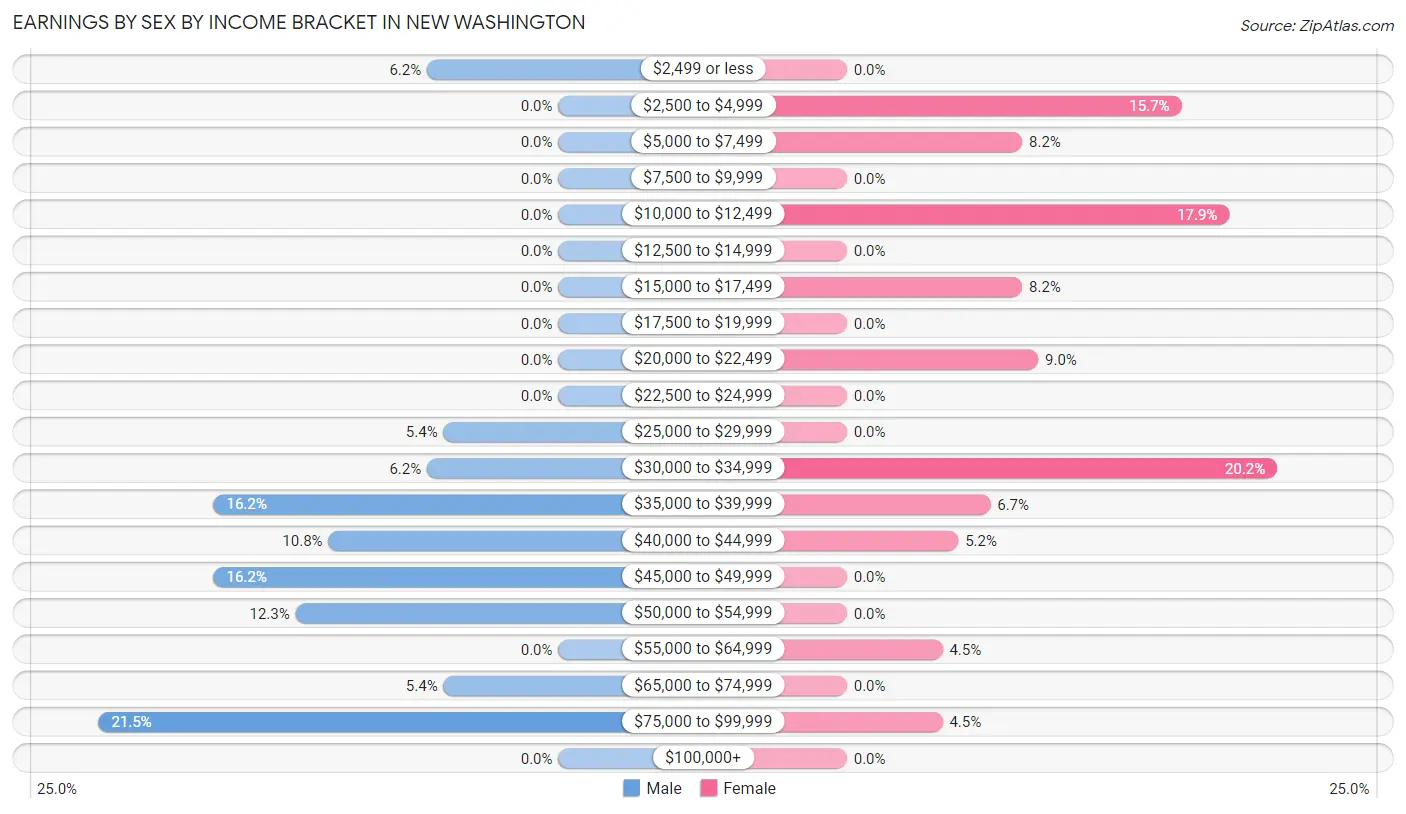
Earnings by Sex by Income Bracket in New Washington
The most common earnings brackets in New Washington are $75,000 to $99,999 for men (28 | 21.5%) and $30,000 to $34,999 for women (27 | 20.2%).
| Income | Male | Female |
| $2,499 or less | 8 (6.1%) | 0 (0.0%) |
| $2,500 to $4,999 | 0 (0.0%) | 21 (15.7%) |
| $5,000 to $7,499 | 0 (0.0%) | 11 (8.2%) |
| $7,500 to $9,999 | 0 (0.0%) | 0 (0.0%) |
| $10,000 to $12,499 | 0 (0.0%) | 24 (17.9%) |
| $12,500 to $14,999 | 0 (0.0%) | 0 (0.0%) |
| $15,000 to $17,499 | 0 (0.0%) | 11 (8.2%) |
| $17,500 to $19,999 | 0 (0.0%) | 0 (0.0%) |
| $20,000 to $22,499 | 0 (0.0%) | 12 (9.0%) |
| $22,500 to $24,999 | 0 (0.0%) | 0 (0.0%) |
| $25,000 to $29,999 | 7 (5.4%) | 0 (0.0%) |
| $30,000 to $34,999 | 8 (6.1%) | 27 (20.2%) |
| $35,000 to $39,999 | 21 (16.2%) | 9 (6.7%) |
| $40,000 to $44,999 | 14 (10.8%) | 7 (5.2%) |
| $45,000 to $49,999 | 21 (16.2%) | 0 (0.0%) |
| $50,000 to $54,999 | 16 (12.3%) | 0 (0.0%) |
| $55,000 to $64,999 | 0 (0.0%) | 6 (4.5%) |
| $65,000 to $74,999 | 7 (5.4%) | 0 (0.0%) |
| $75,000 to $99,999 | 28 (21.5%) | 6 (4.5%) |
| $100,000+ | 0 (0.0%) | 0 (0.0%) |
| Total | 130 (100.0%) | 134 (100.0%) |
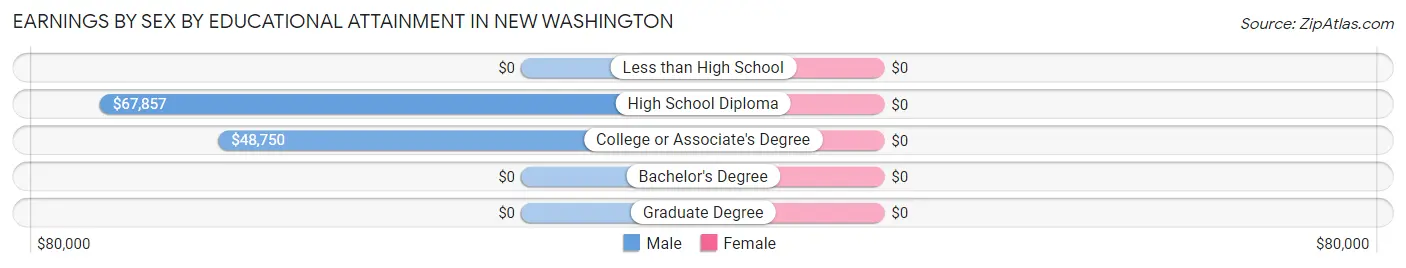
Earnings by Sex by Educational Attainment in New Washington
| Educational Attainment | Male Income | Female Income |
| Less than High School | - | - |
| High School Diploma | $67,857 | $0 |
| College or Associate's Degree | $48,750 | $0 |
| Bachelor's Degree | - | - |
| Graduate Degree | - | - |
| Total | $49,444 | $0 |
Family Income in New Washington
Family Income Brackets in New Washington
According to the New Washington family income data, there are 30 families falling into the $50,000 to $74,999 income range, which is the most common income bracket and makes up 26.8% of all families.
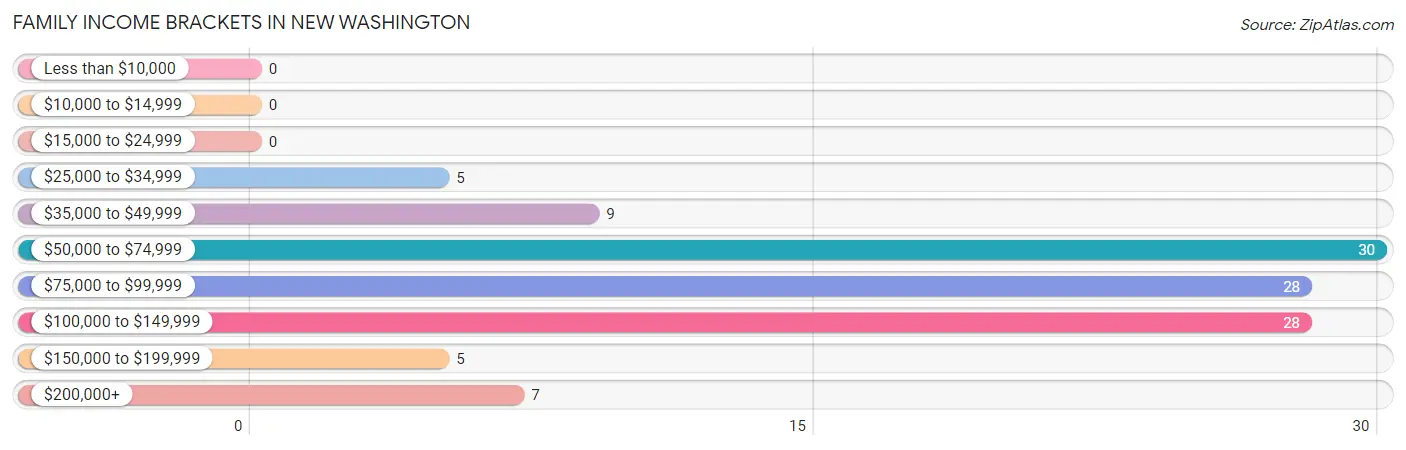
| Income Bracket | # Families | % Families |
| Less than $10,000 | 0 | 0.0% |
| $10,000 to $14,999 | 0 | 0.0% |
| $15,000 to $24,999 | 0 | 0.0% |
| $25,000 to $34,999 | 5 | 4.5% |
| $35,000 to $49,999 | 9 | 8.0% |
| $50,000 to $74,999 | 30 | 26.8% |
| $75,000 to $99,999 | 28 | 25.0% |
| $100,000 to $149,999 | 28 | 25.0% |
| $150,000 to $199,999 | 5 | 4.5% |
| $200,000+ | 7 | 6.3% |
Family Income by Famaliy Size in New Washington
2-person families (58 | 51.8%) account for the highest median family income in New Washington with $71,786 per family, while 2-person families (58 | 51.8%) have the highest median income of $35,893 per family member.
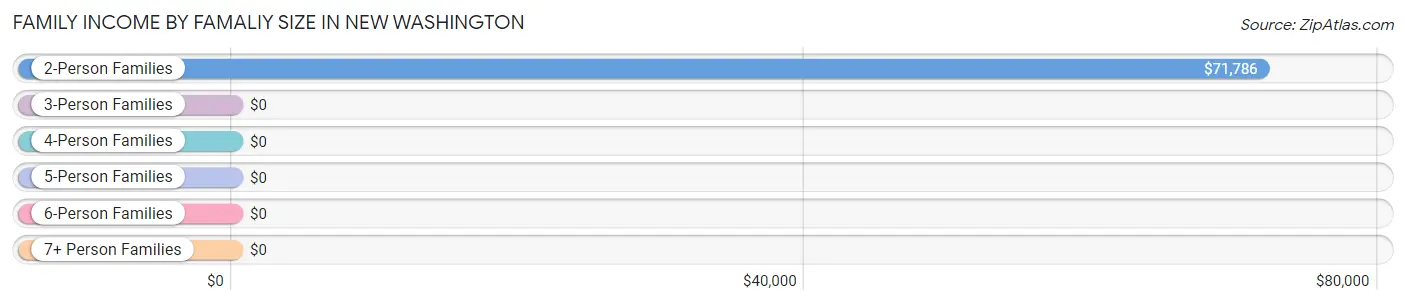
| Income Bracket | # Families | Median Income |
| 2-Person Families | 58 (51.8%) | $71,786 |
| 3-Person Families | 22 (19.6%) | $0 |
| 4-Person Families | 18 (16.1%) | $0 |
| 5-Person Families | 14 (12.5%) | $0 |
| 6-Person Families | 0 (0.0%) | $0 |
| 7+ Person Families | 0 (0.0%) | $0 |
| Total | 112 (100.0%) | $78,333 |
Family Income by Number of Earners in New Washington
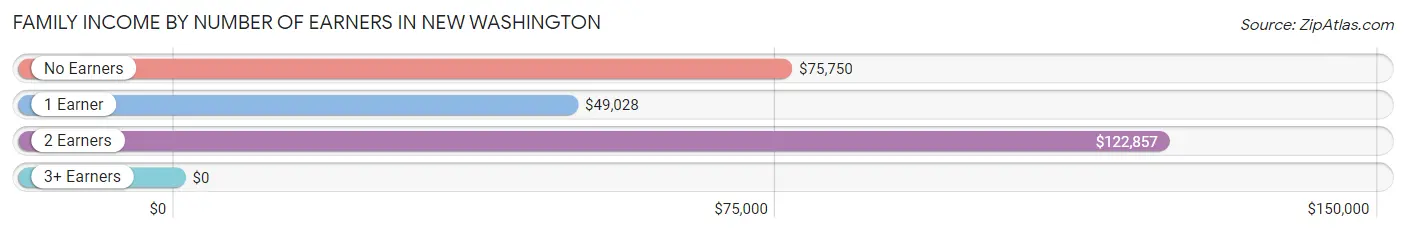
| Number of Earners | # Families | Median Income |
| No Earners | 24 (21.4%) | $75,750 |
| 1 Earner | 21 (18.8%) | $49,028 |
| 2 Earners | 56 (50.0%) | $122,857 |
| 3+ Earners | 11 (9.8%) | $0 |
| Total | 112 (100.0%) | $78,333 |
Household Income in New Washington
Household Income Brackets in New Washington
With 45 households falling in the category, the $35,000 to $49,999 income range is the most frequent in New Washington, accounting for 23.8% of all households. In contrast, only 5 households (2.6%) fall into the $25,000 to $34,999 income bracket, making it the least populous group.
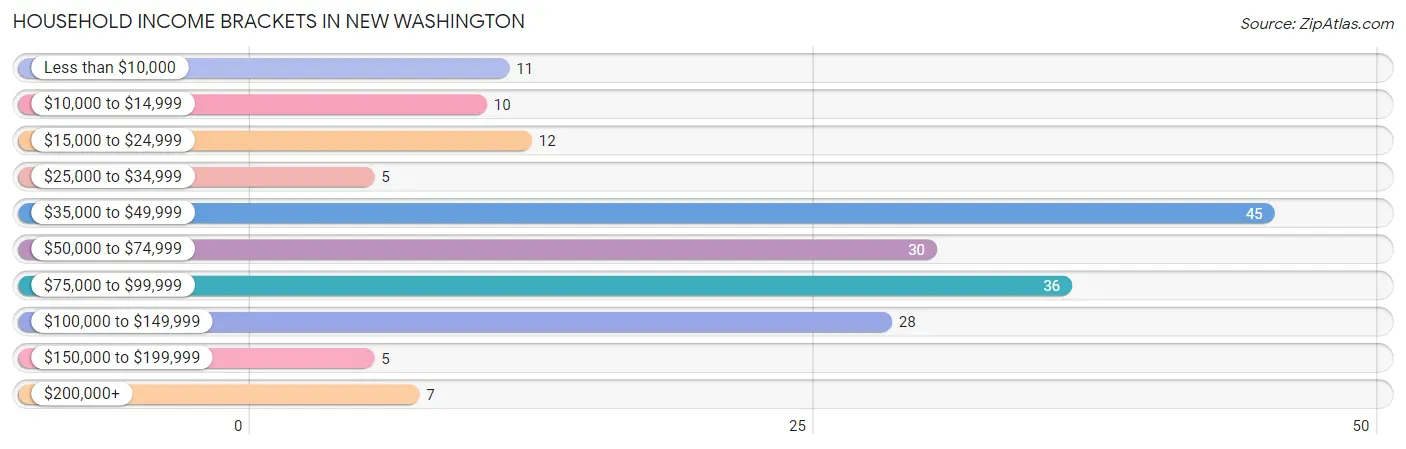
| Income Bracket | # Households | % Households |
| Less than $10,000 | 11 | 5.8% |
| $10,000 to $14,999 | 10 | 5.3% |
| $15,000 to $24,999 | 12 | 6.3% |
| $25,000 to $34,999 | 5 | 2.6% |
| $35,000 to $49,999 | 45 | 23.8% |
| $50,000 to $74,999 | 30 | 15.9% |
| $75,000 to $99,999 | 36 | 19.0% |
| $100,000 to $149,999 | 28 | 14.8% |
| $150,000 to $199,999 | 5 | 2.6% |
| $200,000+ | 7 | 3.7% |
Household Income by Householder Age in New Washington
The median household income in New Washington is $70,298, with the highest median household income of $71,131 found in the 45 to 64 years age bracket for the primary householder. A total of 71 households (37.6%) fall into this category. Meanwhile, the 15 to 24 years age bracket for the primary householder has the lowest median household income of $0, with 8 households (4.2%) in this group.
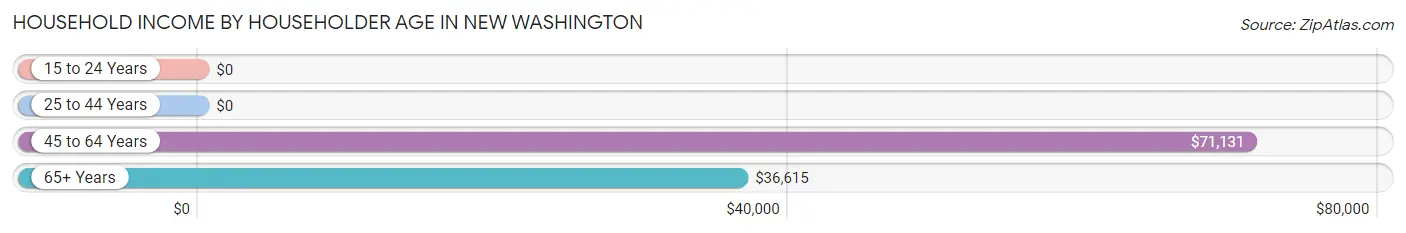
| Income Bracket | # Households | Median Income |
| 15 to 24 Years | 8 (4.2%) | $0 |
| 25 to 44 Years | 37 (19.6%) | $0 |
| 45 to 64 Years | 71 (37.6%) | $71,131 |
| 65+ Years | 73 (38.6%) | $36,615 |
| Total | 189 (100.0%) | $70,298 |
Poverty in New Washington
Income Below Poverty by Sex and Age in New Washington
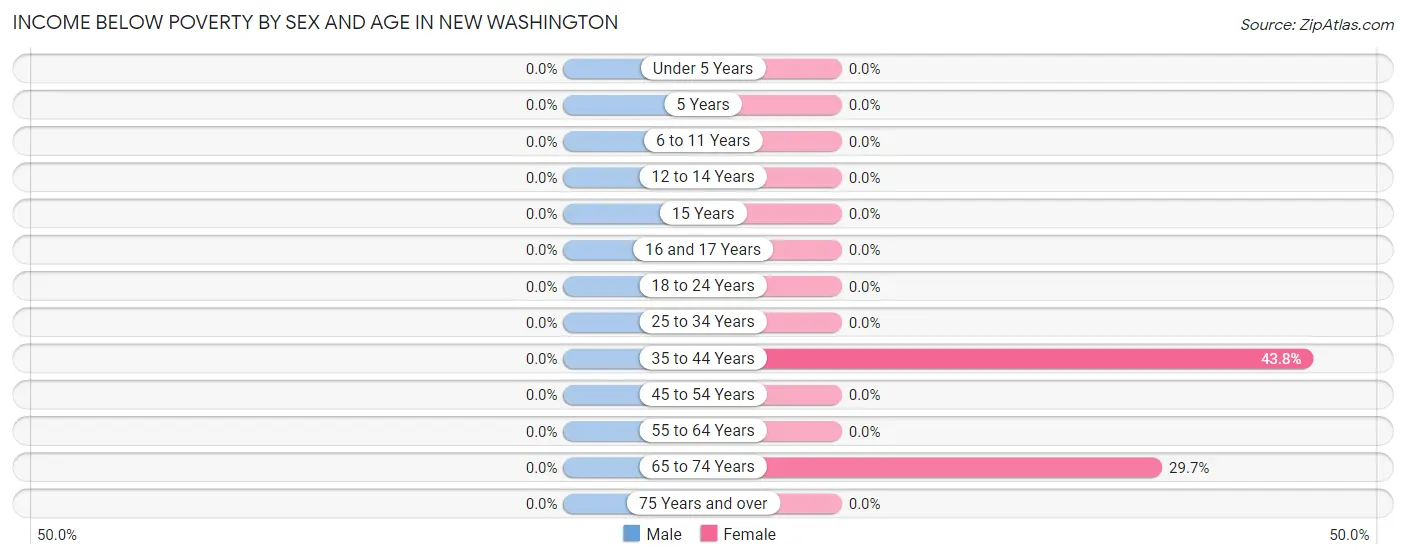
| Age Bracket | Male | Female |
| Under 5 Years | 0 (0.0%) | 0 (0.0%) |
| 5 Years | 0 (0.0%) | 0 (0.0%) |
| 6 to 11 Years | 0 (0.0%) | 0 (0.0%) |
| 12 to 14 Years | 0 (0.0%) | 0 (0.0%) |
| 15 Years | 0 (0.0%) | 0 (0.0%) |
| 16 and 17 Years | 0 (0.0%) | 0 (0.0%) |
| 18 to 24 Years | 0 (0.0%) | 0 (0.0%) |
| 25 to 34 Years | 0 (0.0%) | 0 (0.0%) |
| 35 to 44 Years | 0 (0.0%) | 14 (43.8%) |
| 45 to 54 Years | 0 (0.0%) | 0 (0.0%) |
| 55 to 64 Years | 0 (0.0%) | 0 (0.0%) |
| 65 to 74 Years | 0 (0.0%) | 11 (29.7%) |
| 75 Years and over | 0 (0.0%) | 0 (0.0%) |
| Total | 0 (0.0%) | 25 (10.2%) |
Income Above Poverty by Sex and Age in New Washington
According to the poverty statistics in New Washington, males aged 6 to 11 years and females aged under 5 years are the age groups that are most secure financially, with 100.0% of males and 100.0% of females in these age groups living above the poverty line.
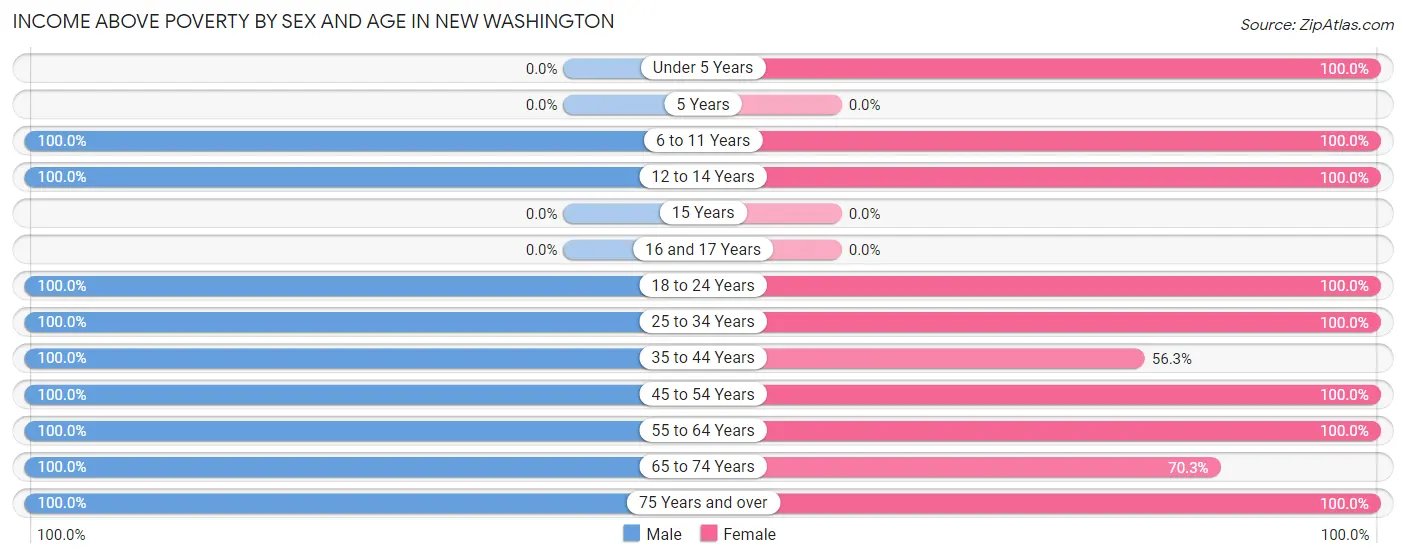
| Age Bracket | Male | Female |
| Under 5 Years | 0 (0.0%) | 19 (100.0%) |
| 5 Years | 0 (0.0%) | 0 (0.0%) |
| 6 to 11 Years | 20 (100.0%) | 6 (100.0%) |
| 12 to 14 Years | 6 (100.0%) | 10 (100.0%) |
| 15 Years | 0 (0.0%) | 0 (0.0%) |
| 16 and 17 Years | 0 (0.0%) | 0 (0.0%) |
| 18 to 24 Years | 39 (100.0%) | 20 (100.0%) |
| 25 to 34 Years | 40 (100.0%) | 19 (100.0%) |
| 35 to 44 Years | 12 (100.0%) | 18 (56.2%) |
| 45 to 54 Years | 47 (100.0%) | 21 (100.0%) |
| 55 to 64 Years | 29 (100.0%) | 37 (100.0%) |
| 65 to 74 Years | 19 (100.0%) | 26 (70.3%) |
| 75 Years and over | 5 (100.0%) | 45 (100.0%) |
| Total | 217 (100.0%) | 221 (89.8%) |
Income Below Poverty Among Married-Couple Families in New Washington
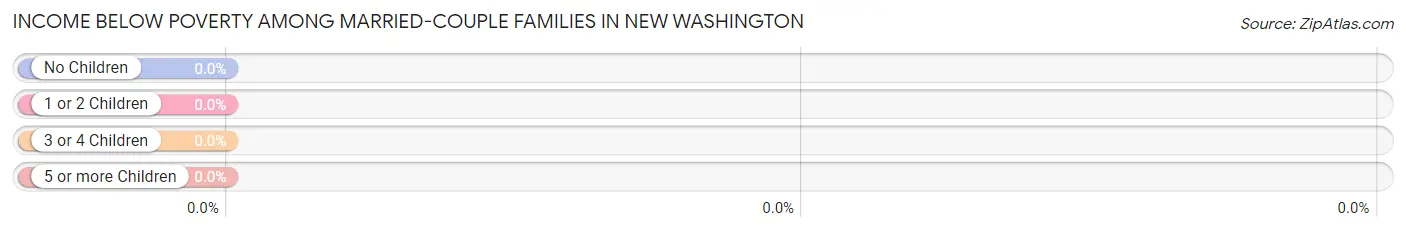
| Children | Above Poverty | Below Poverty |
| No Children | 65 (100.0%) | 0 (0.0%) |
| 1 or 2 Children | 31 (100.0%) | 0 (0.0%) |
| 3 or 4 Children | 7 (100.0%) | 0 (0.0%) |
| 5 or more Children | 0 (0.0%) | 0 (0.0%) |
| Total | 103 (100.0%) | 0 (0.0%) |
Income Below Poverty Among Single-Parent Households in New Washington
| Children | Single Father | Single Mother |
| No Children | 0 (0.0%) | 0 (0.0%) |
| 1 or 2 Children | 0 (0.0%) | 0 (0.0%) |
| 3 or 4 Children | 0 (0.0%) | 0 (0.0%) |
| 5 or more Children | 0 (0.0%) | 0 (0.0%) |
| Total | 0 (0.0%) | 0 (0.0%) |
Income Below Poverty Among Married-Couple vs Single-Parent Households in New Washington
| Children | Married-Couple Families | Single-Parent Households |
| No Children | 0 (0.0%) | 0 (0.0%) |
| 1 or 2 Children | 0 (0.0%) | 0 (0.0%) |
| 3 or 4 Children | 0 (0.0%) | 0 (0.0%) |
| 5 or more Children | 0 (0.0%) | 0 (0.0%) |
| Total | 0 (0.0%) | 0 (0.0%) |
Race in New Washington
The most populous races in New Washington are White / Caucasian (463 | 100.0%), and Hispanic or Latino (16 | 3.5%).
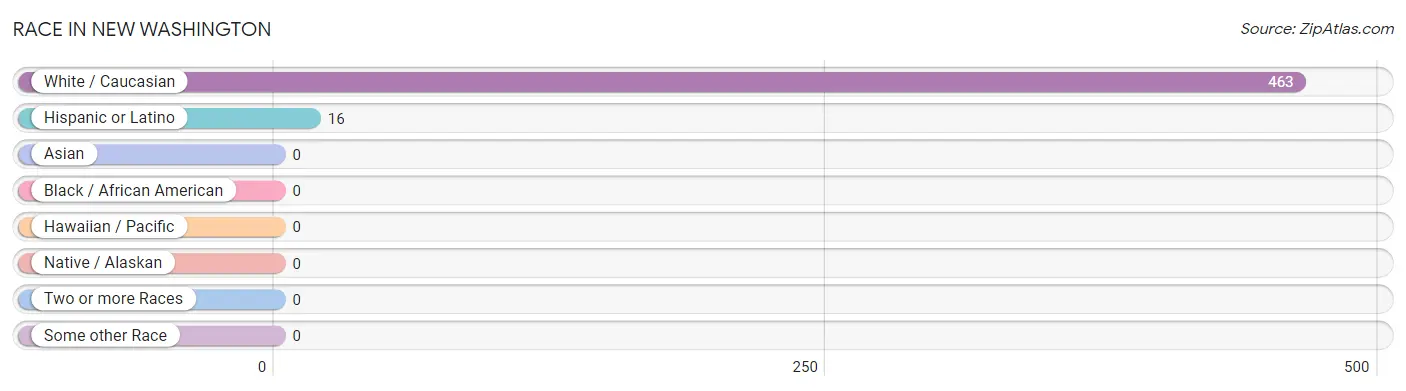
| Race | # Population | % Population |
| Asian | 0 | 0.0% |
| Black / African American | 0 | 0.0% |
| Hawaiian / Pacific | 0 | 0.0% |
| Hispanic or Latino | 16 | 3.5% |
| Native / Alaskan | 0 | 0.0% |
| White / Caucasian | 463 | 100.0% |
| Two or more Races | 0 | 0.0% |
| Some other Race | 0 | 0.0% |
| Total | 463 | 100.0% |
Ancestry in New Washington
The most populous ancestries reported in New Washington are American (52 | 11.2%), Italian (52 | 11.2%), English (44 | 9.5%), German (42 | 9.1%), and European (27 | 5.8%), together accounting for 46.9% of all New Washington residents.
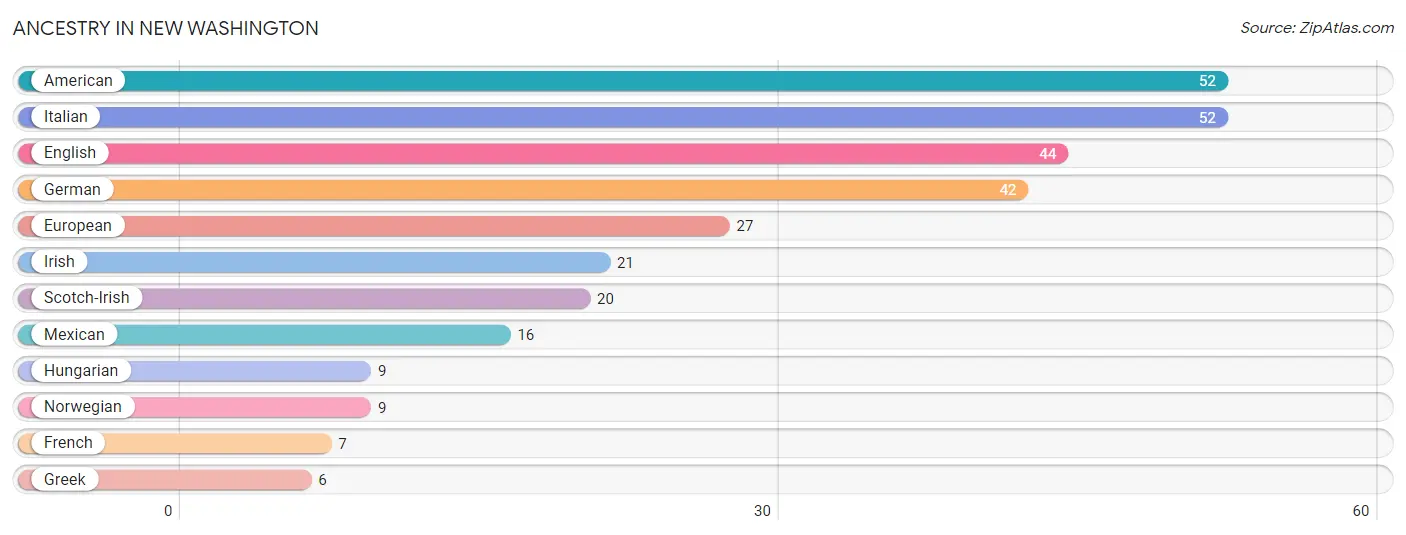
| Ancestry | # Population | % Population |
| American | 52 | 11.2% |
| English | 44 | 9.5% |
| European | 27 | 5.8% |
| French | 7 | 1.5% |
| German | 42 | 9.1% |
| Greek | 6 | 1.3% |
| Hungarian | 9 | 1.9% |
| Irish | 21 | 4.5% |
| Italian | 52 | 11.2% |
| Mexican | 16 | 3.5% |
| Norwegian | 9 | 1.9% |
| Scotch-Irish | 20 | 4.3% | View All 12 Rows |
Immigrants in New Washington

| Immigration Origin | # Population | % Population | View All 0 Rows |
Sex and Age in New Washington
Sex and Age in New Washington
The most populous age groups in New Washington are 20 to 24 Years (31 | 14.3%) for men and 75 to 79 Years (45 | 18.3%) for women.
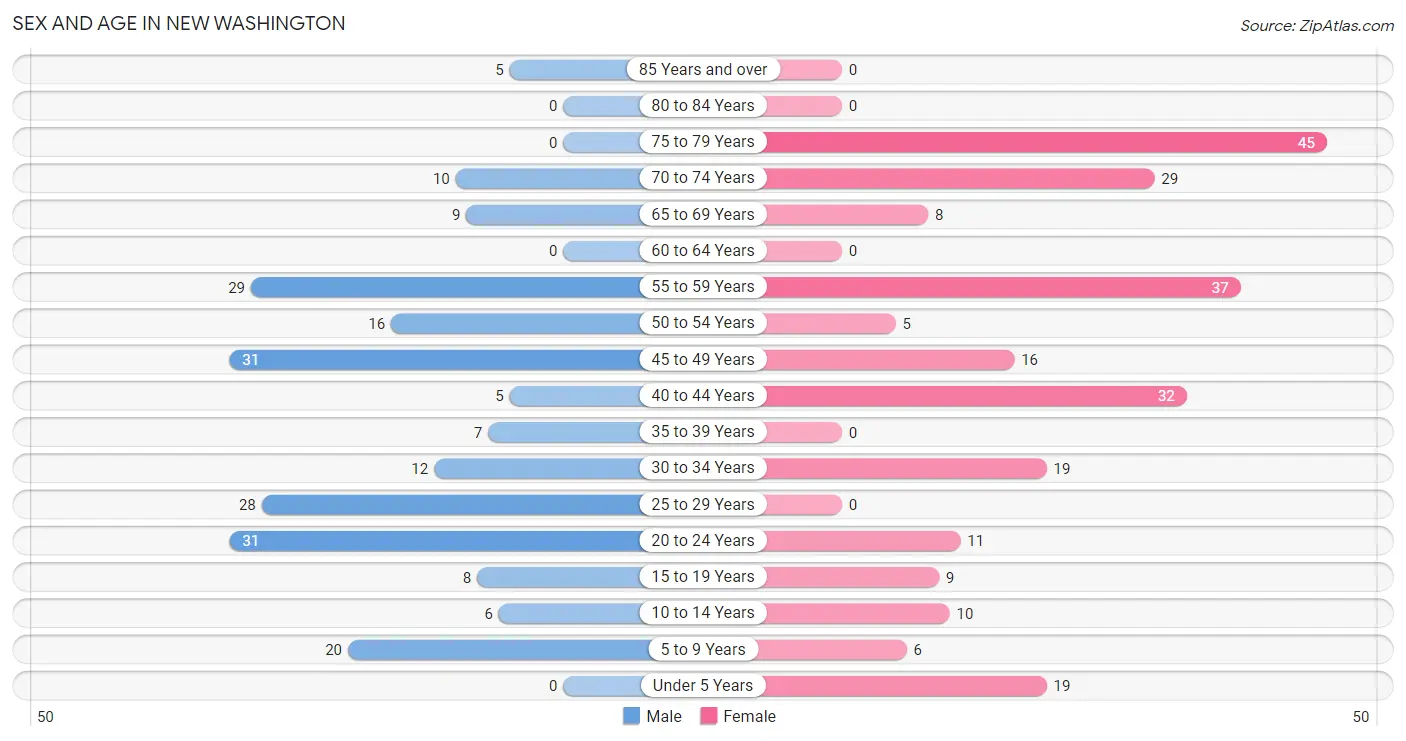
| Age Bracket | Male | Female |
| Under 5 Years | 0 (0.0%) | 19 (7.7%) |
| 5 to 9 Years | 20 (9.2%) | 6 (2.4%) |
| 10 to 14 Years | 6 (2.8%) | 10 (4.1%) |
| 15 to 19 Years | 8 (3.7%) | 9 (3.7%) |
| 20 to 24 Years | 31 (14.3%) | 11 (4.5%) |
| 25 to 29 Years | 28 (12.9%) | 0 (0.0%) |
| 30 to 34 Years | 12 (5.5%) | 19 (7.7%) |
| 35 to 39 Years | 7 (3.2%) | 0 (0.0%) |
| 40 to 44 Years | 5 (2.3%) | 32 (13.0%) |
| 45 to 49 Years | 31 (14.3%) | 16 (6.5%) |
| 50 to 54 Years | 16 (7.4%) | 5 (2.0%) |
| 55 to 59 Years | 29 (13.4%) | 37 (15.0%) |
| 60 to 64 Years | 0 (0.0%) | 0 (0.0%) |
| 65 to 69 Years | 9 (4.2%) | 8 (3.3%) |
| 70 to 74 Years | 10 (4.6%) | 29 (11.8%) |
| 75 to 79 Years | 0 (0.0%) | 45 (18.3%) |
| 80 to 84 Years | 0 (0.0%) | 0 (0.0%) |
| 85 Years and over | 5 (2.3%) | 0 (0.0%) |
| Total | 217 (100.0%) | 246 (100.0%) |
Families and Households in New Washington
Median Family Size in New Washington
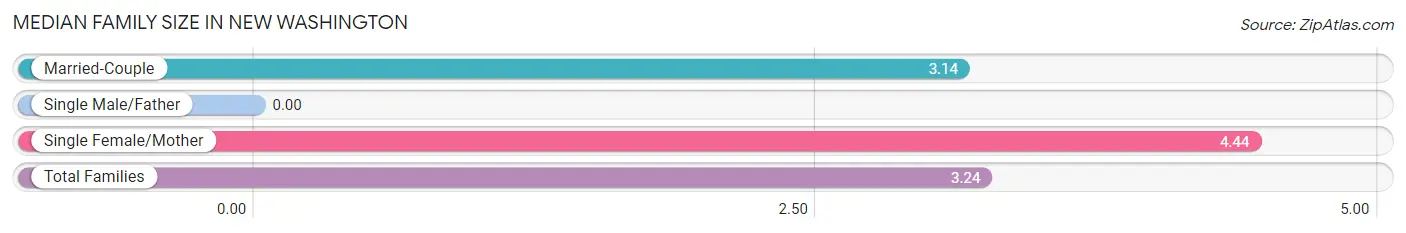
| Family Type | # Families | Family Size |
| Married-Couple | 103 (92.0%) | 3.14 |
| Single Male/Father | 0 (0.0%) | - |
| Single Female/Mother | 9 (8.0%) | 4.44 |
| Total Families | 112 (100.0%) | 3.24 |
Median Household Size in New Washington
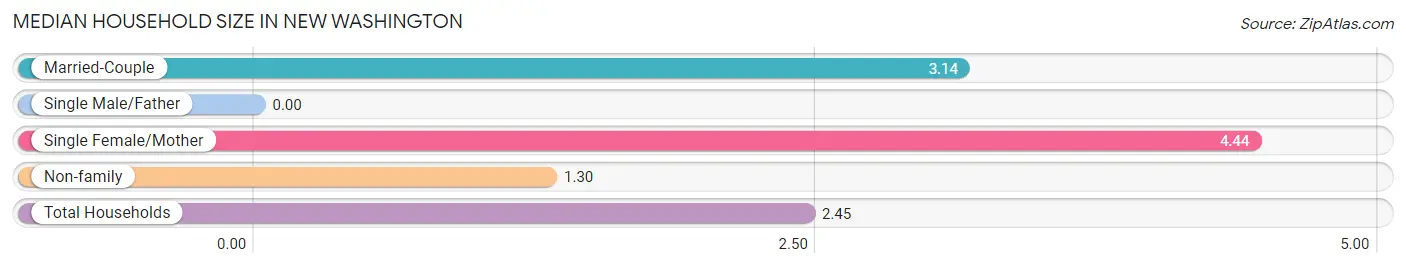
| Household Type | # Households | Household Size |
| Married-Couple | 103 (54.5%) | 3.14 |
| Single Male/Father | 0 (0.0%) | - |
| Single Female/Mother | 9 (4.8%) | 4.44 |
| Non-family | 77 (40.7%) | 1.30 |
| Total Households | 189 (100.0%) | 2.45 |
Household Size by Marriage Status in New Washington
Out of a total of 189 households in New Washington, 112 (59.3%) are family households, while 77 (40.7%) are nonfamily households. The most numerous type of family households are 2-person households, comprising 58, and the most common type of nonfamily households are 1-person households, comprising 57.
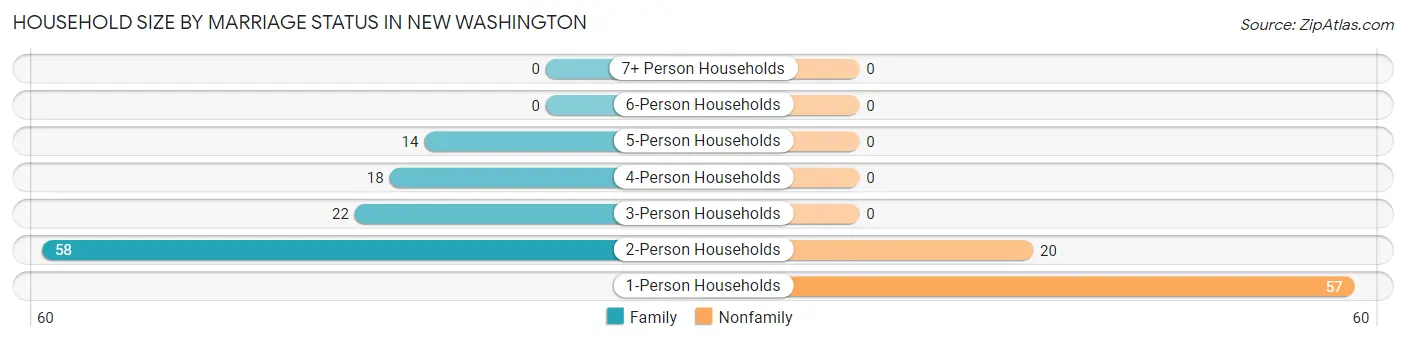
| Household Size | Family Households | Nonfamily Households |
| 1-Person Households | - | 57 (30.2%) |
| 2-Person Households | 58 (30.7%) | 20 (10.6%) |
| 3-Person Households | 22 (11.6%) | 0 (0.0%) |
| 4-Person Households | 18 (9.5%) | 0 (0.0%) |
| 5-Person Households | 14 (7.4%) | 0 (0.0%) |
| 6-Person Households | 0 (0.0%) | 0 (0.0%) |
| 7+ Person Households | 0 (0.0%) | 0 (0.0%) |
| Total | 112 (59.3%) | 77 (40.7%) |
Female Fertility in New Washington
Fertility by Age in New Washington
| Age Bracket | Women with Births | Births / 1,000 Women |
| 15 to 19 years | 0 (0.0%) | 0.0 |
| 20 to 34 years | 0 (0.0%) | 0.0 |
| 35 to 50 years | 0 (0.0%) | 0.0 |
| Total | 0 (0.0%) | 0.0 |
Fertility by Age by Marriage Status in New Washington
| Age Bracket | Married | Unmarried |
| 15 to 19 years | 0 (0.0%) | 0 (0.0%) |
| 20 to 34 years | 0 (0.0%) | 0 (0.0%) |
| 35 to 50 years | 0 (0.0%) | 0 (0.0%) |
| Total | 0 (0.0%) | 0 (0.0%) |
Fertility by Education in New Washington
| Educational Attainment | Women with Births | Births / 1,000 Women |
| Less than High School | 0 (0.0%) | 0.0 |
| High School Diploma | 0 (0.0%) | 0.0 |
| College or Associate's Degree | 0 (0.0%) | 0.0 |
| Bachelor's Degree | 0 (0.0%) | 0.0 |
| Graduate Degree | 0 (0.0%) | 0.0 |
| Total | 0 (0.0%) | 0.0 |
Fertility by Education by Marriage Status in New Washington
| Educational Attainment | Married | Unmarried |
| Less than High School | 0 (0.0%) | 0 (0.0%) |
| High School Diploma | 0 (0.0%) | 0 (0.0%) |
| College or Associate's Degree | 0 (0.0%) | 0 (0.0%) |
| Bachelor's Degree | 0 (0.0%) | 0 (0.0%) |
| Graduate Degree | 0 (0.0%) | 0 (0.0%) |
| Total | 0 (0.0%) | 0 (0.0%) |
Employment Characteristics in New Washington
Employment by Class of Employer in New Washington
Among the 250 employed individuals in New Washington, private company employees (148 | 59.2%), not-for-profit organizations (58 | 23.2%), and federal government employees (24 | 9.6%) make up the most common classes of employment.
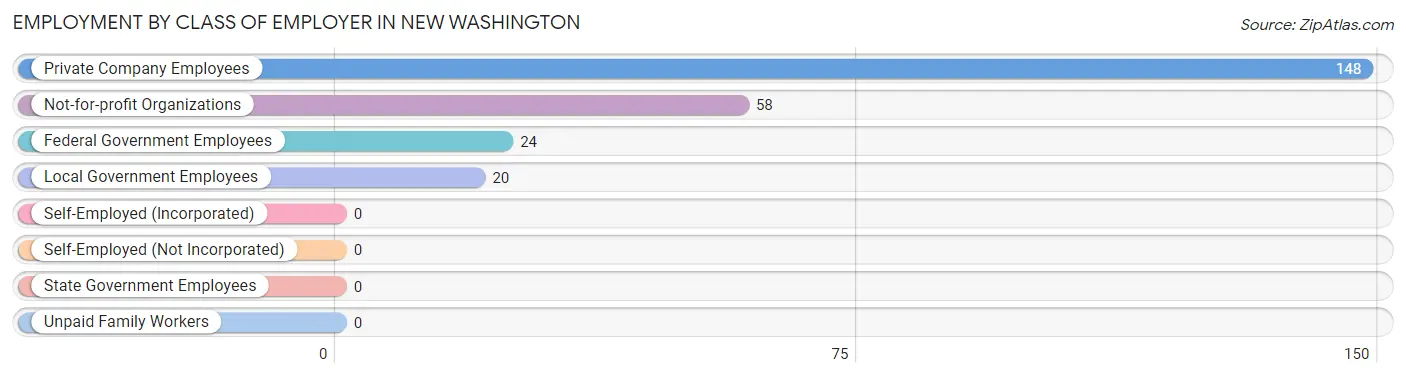
| Employer Class | # Employees | % Employees |
| Private Company Employees | 148 | 59.2% |
| Self-Employed (Incorporated) | 0 | 0.0% |
| Self-Employed (Not Incorporated) | 0 | 0.0% |
| Not-for-profit Organizations | 58 | 23.2% |
| Local Government Employees | 20 | 8.0% |
| State Government Employees | 0 | 0.0% |
| Federal Government Employees | 24 | 9.6% |
| Unpaid Family Workers | 0 | 0.0% |
| Total | 250 | 100.0% |
Employment Status by Age in New Washington
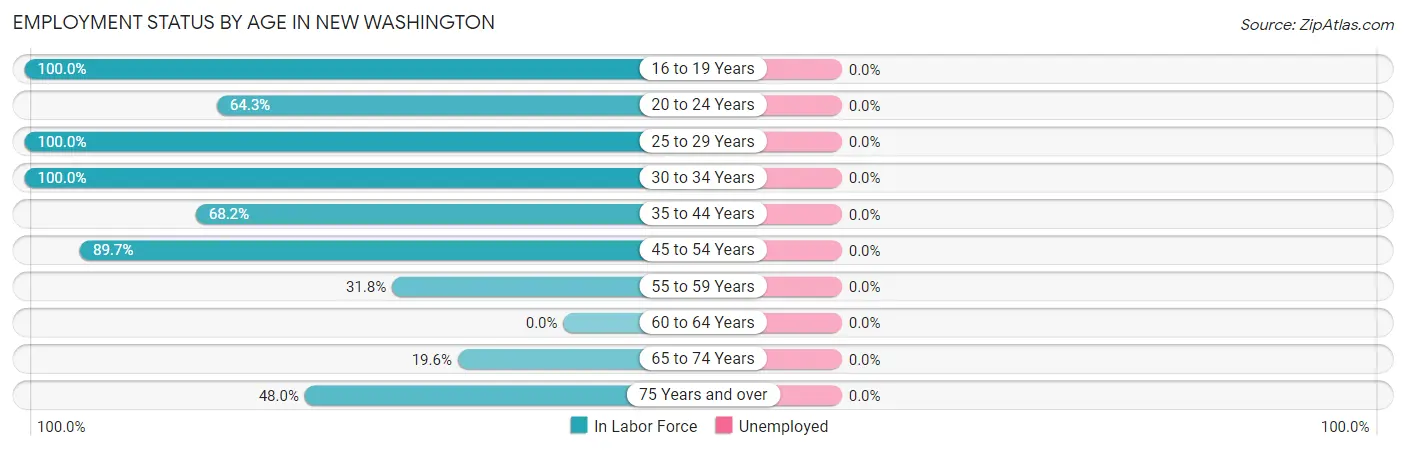
| Age Bracket | In Labor Force | Unemployed |
| 16 to 19 Years | 17 (100.0%) | 0 (0.0%) |
| 20 to 24 Years | 27 (64.3%) | 0 (0.0%) |
| 25 to 29 Years | 28 (100.0%) | 0 (0.0%) |
| 30 to 34 Years | 31 (100.0%) | 0 (0.0%) |
| 35 to 44 Years | 30 (68.2%) | 0 (0.0%) |
| 45 to 54 Years | 61 (89.7%) | 0 (0.0%) |
| 55 to 59 Years | 21 (31.8%) | 0 (0.0%) |
| 60 to 64 Years | 0 (0.0%) | 0 (0.0%) |
| 65 to 74 Years | 11 (19.6%) | 0 (0.0%) |
| 75 Years and over | 24 (48.0%) | 0 (0.0%) |
| Total | 250 (62.2%) | 0 (0.0%) |
Employment Status by Educational Attainment in New Washington
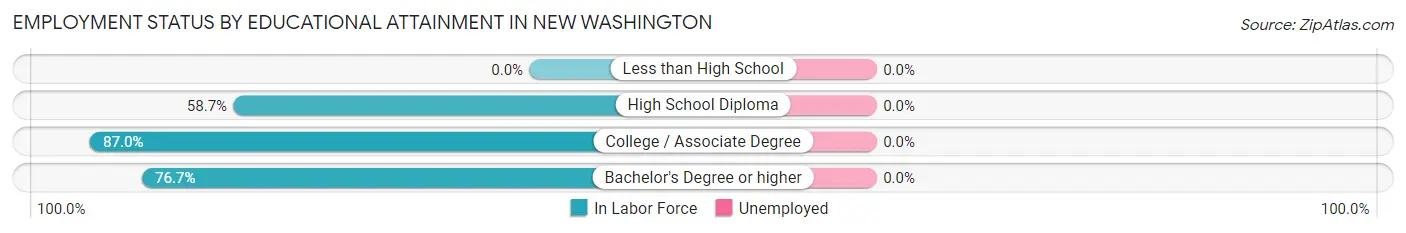
| Educational Attainment | In Labor Force | Unemployed |
| Less than High School | 0 (0.0%) | 0 (0.0%) |
| High School Diploma | 54 (58.7%) | 0 (0.0%) |
| College / Associate Degree | 94 (87.0%) | 0 (0.0%) |
| Bachelor's Degree or higher | 23 (76.7%) | 0 (0.0%) |
| Total | 171 (72.2%) | 0 (0.0%) |
Employment Occupations by Sex in New Washington
Management, Business, Science and Arts Occupations
The most common Management, Business, Science and Arts occupations in New Washington are Management (28 | 11.2%), Community & Social Service (7 | 2.8%), Education Instruction & Library (7 | 2.8%), Computers, Engineering & Science (6 | 2.4%), and Architecture & Engineering (6 | 2.4%).
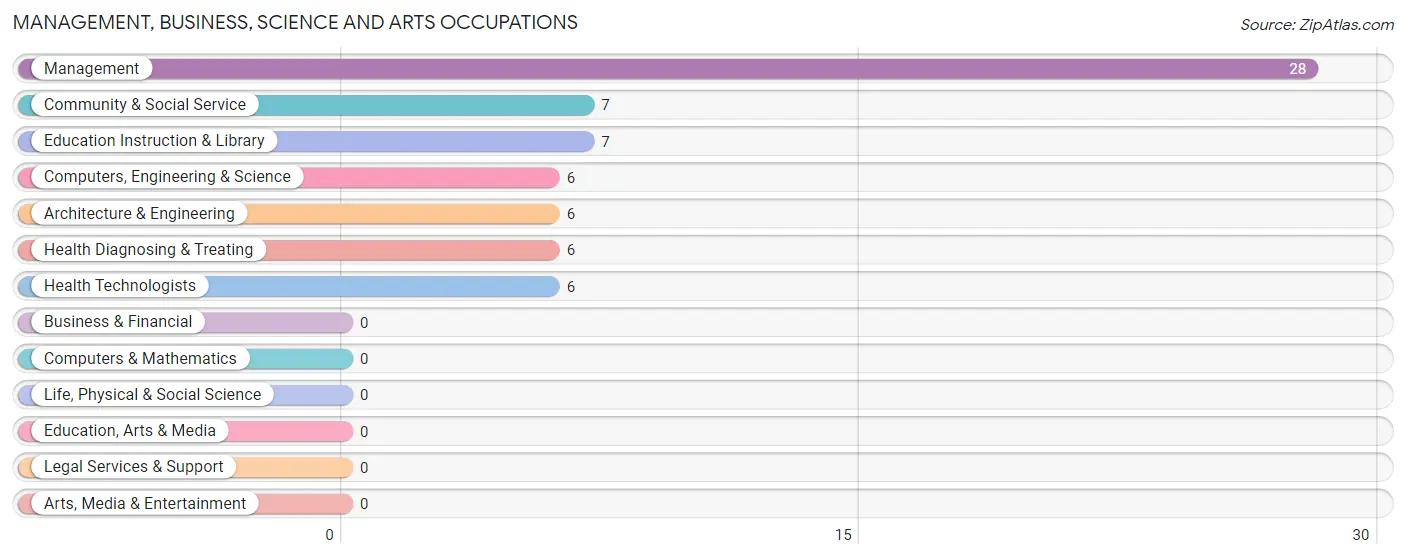
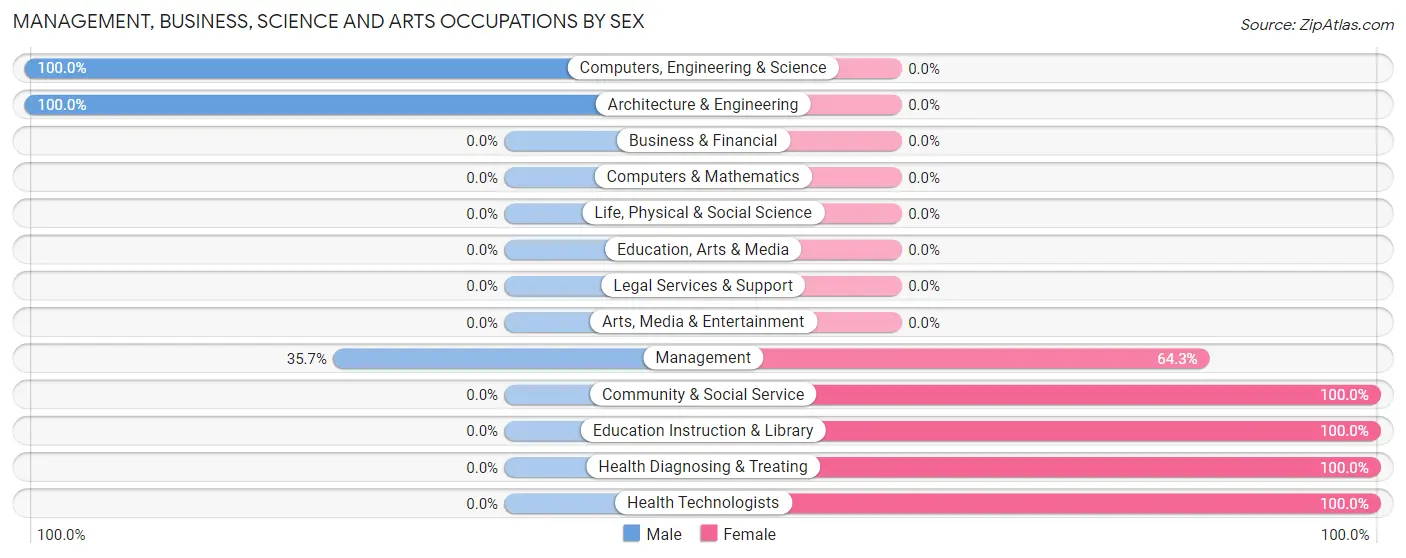
Management, Business, Science and Arts Occupations by Sex
Within the Management, Business, Science and Arts occupations in New Washington, the most male-oriented occupations are Computers, Engineering & Science (100.0%), Architecture & Engineering (100.0%), and Management (35.7%), while the most female-oriented occupations are Community & Social Service (100.0%), Education Instruction & Library (100.0%), and Health Diagnosing & Treating (100.0%).
| Occupation | Male | Female |
| Management | 10 (35.7%) | 18 (64.3%) |
| Business & Financial | 0 (0.0%) | 0 (0.0%) |
| Computers, Engineering & Science | 6 (100.0%) | 0 (0.0%) |
| Computers & Mathematics | 0 (0.0%) | 0 (0.0%) |
| Architecture & Engineering | 6 (100.0%) | 0 (0.0%) |
| Life, Physical & Social Science | 0 (0.0%) | 0 (0.0%) |
| Community & Social Service | 0 (0.0%) | 7 (100.0%) |
| Education, Arts & Media | 0 (0.0%) | 0 (0.0%) |
| Legal Services & Support | 0 (0.0%) | 0 (0.0%) |
| Education Instruction & Library | 0 (0.0%) | 7 (100.0%) |
| Arts, Media & Entertainment | 0 (0.0%) | 0 (0.0%) |
| Health Diagnosing & Treating | 0 (0.0%) | 6 (100.0%) |
| Health Technologists | 0 (0.0%) | 6 (100.0%) |
| Total (Category) | 16 (34.0%) | 31 (66.0%) |
| Total (Overall) | 116 (46.4%) | 134 (53.6%) |
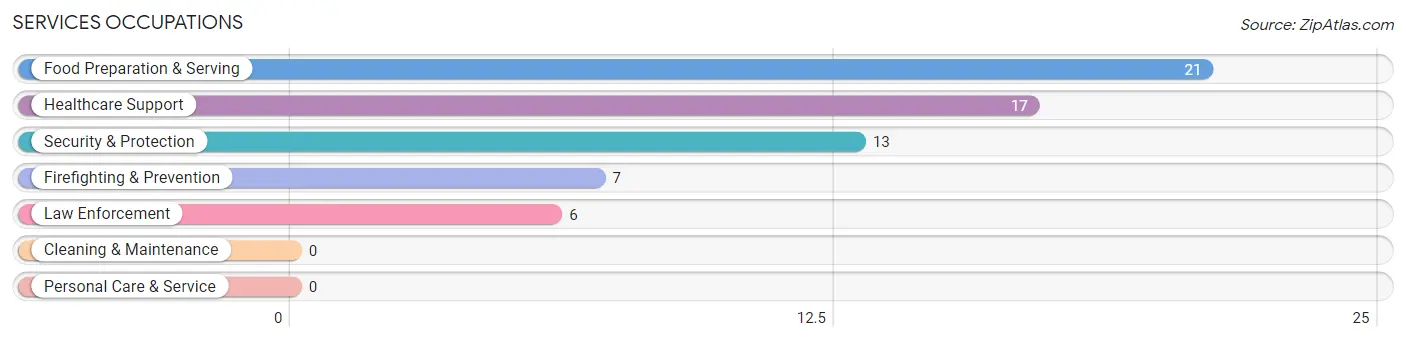
Services Occupations
The most common Services occupations in New Washington are Food Preparation & Serving (21 | 8.4%), Healthcare Support (17 | 6.8%), Security & Protection (13 | 5.2%), Firefighting & Prevention (7 | 2.8%), and Law Enforcement (6 | 2.4%).
Services Occupations by Sex
Within the Services occupations in New Washington, the most male-oriented occupations are Firefighting & Prevention (100.0%), and Security & Protection (53.8%), while the most female-oriented occupations are Healthcare Support (100.0%), Law Enforcement (100.0%), and Food Preparation & Serving (100.0%).

| Occupation | Male | Female |
| Healthcare Support | 0 (0.0%) | 17 (100.0%) |
| Security & Protection | 7 (53.8%) | 6 (46.2%) |
| Firefighting & Prevention | 7 (100.0%) | 0 (0.0%) |
| Law Enforcement | 0 (0.0%) | 6 (100.0%) |
| Food Preparation & Serving | 0 (0.0%) | 21 (100.0%) |
| Cleaning & Maintenance | 0 (0.0%) | 0 (0.0%) |
| Personal Care & Service | 0 (0.0%) | 0 (0.0%) |
| Total (Category) | 7 (13.7%) | 44 (86.3%) |
| Total (Overall) | 116 (46.4%) | 134 (53.6%) |
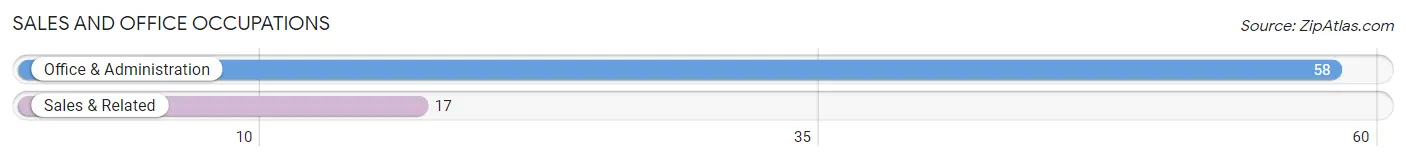
Sales and Office Occupations
The most common Sales and Office occupations in New Washington are Office & Administration (58 | 23.2%), and Sales & Related (17 | 6.8%).
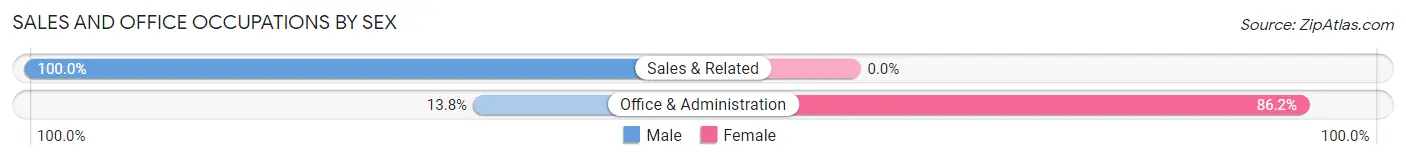
Sales and Office Occupations by Sex
| Occupation | Male | Female |
| Sales & Related | 17 (100.0%) | 0 (0.0%) |
| Office & Administration | 8 (13.8%) | 50 (86.2%) |
| Total (Category) | 25 (33.3%) | 50 (66.7%) |
| Total (Overall) | 116 (46.4%) | 134 (53.6%) |
Natural Resources, Construction and Maintenance Occupations
The most common Natural Resources, Construction and Maintenance occupations in New Washington are , and Installation, Maintenance & Repair (34 | 13.6%).
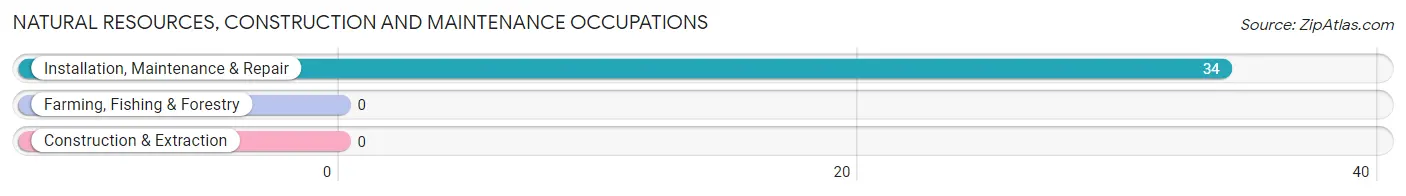
Natural Resources, Construction and Maintenance Occupations by Sex
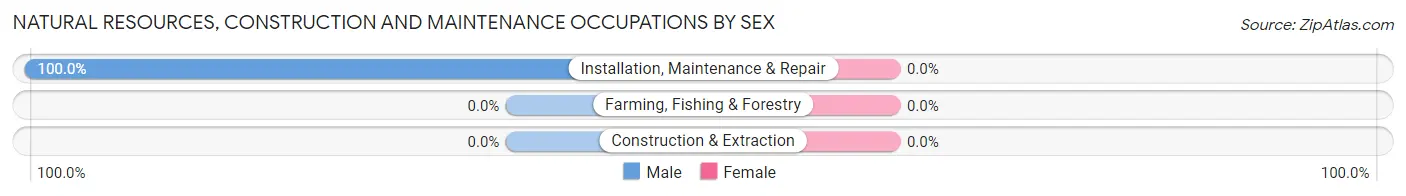
| Occupation | Male | Female |
| Farming, Fishing & Forestry | 0 (0.0%) | 0 (0.0%) |
| Construction & Extraction | 0 (0.0%) | 0 (0.0%) |
| Installation, Maintenance & Repair | 34 (100.0%) | 0 (0.0%) |
| Total (Category) | 34 (100.0%) | 0 (0.0%) |
| Total (Overall) | 116 (46.4%) | 134 (53.6%) |
Production, Transportation and Moving Occupations
The most common Production, Transportation and Moving occupations in New Washington are Material Moving (38 | 15.2%), and Production (5 | 2.0%).
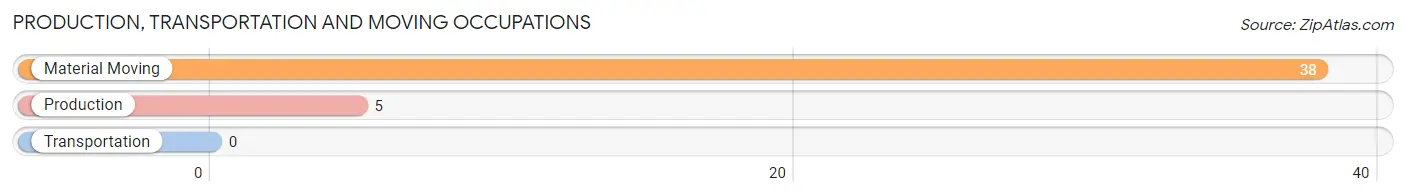
Production, Transportation and Moving Occupations by Sex
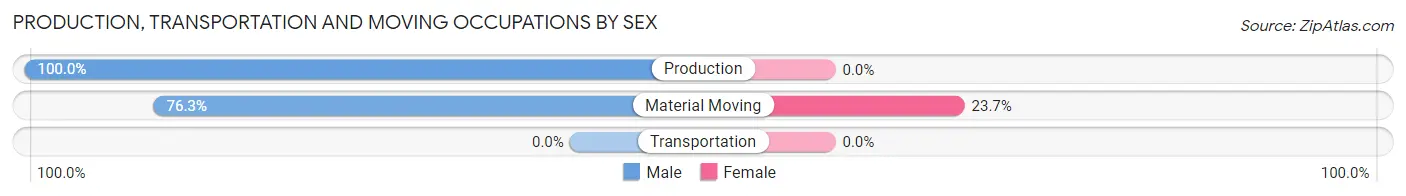
| Occupation | Male | Female |
| Production | 5 (100.0%) | 0 (0.0%) |
| Transportation | 0 (0.0%) | 0 (0.0%) |
| Material Moving | 29 (76.3%) | 9 (23.7%) |
| Total (Category) | 34 (79.1%) | 9 (20.9%) |
| Total (Overall) | 116 (46.4%) | 134 (53.6%) |
Employment Industries by Sex in New Washington
Employment Industries in New Washington
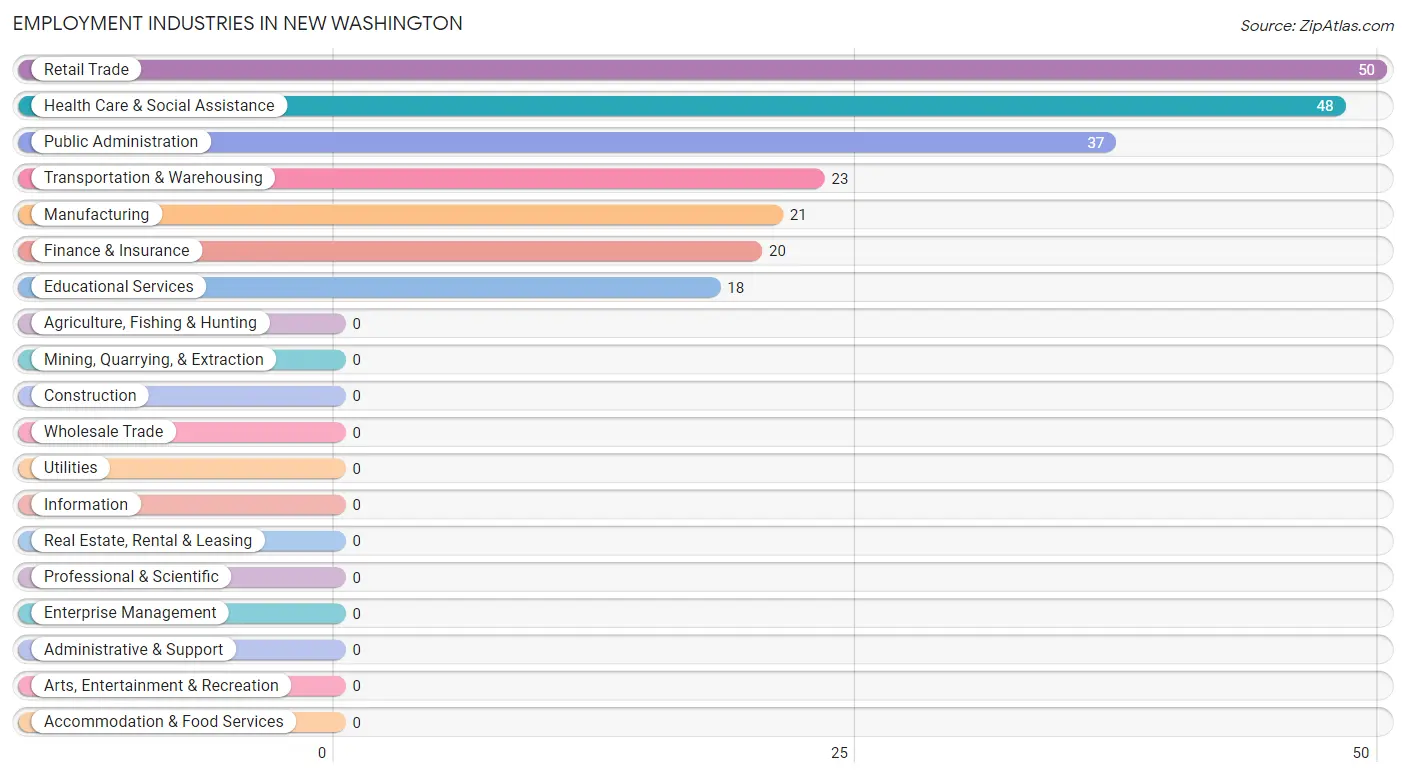
The major employment industries in New Washington include Retail Trade (50 | 20.0%), Health Care & Social Assistance (48 | 19.2%), Public Administration (37 | 14.8%), Transportation & Warehousing (23 | 9.2%), and Manufacturing (21 | 8.4%).
Employment Industries by Sex in New Washington
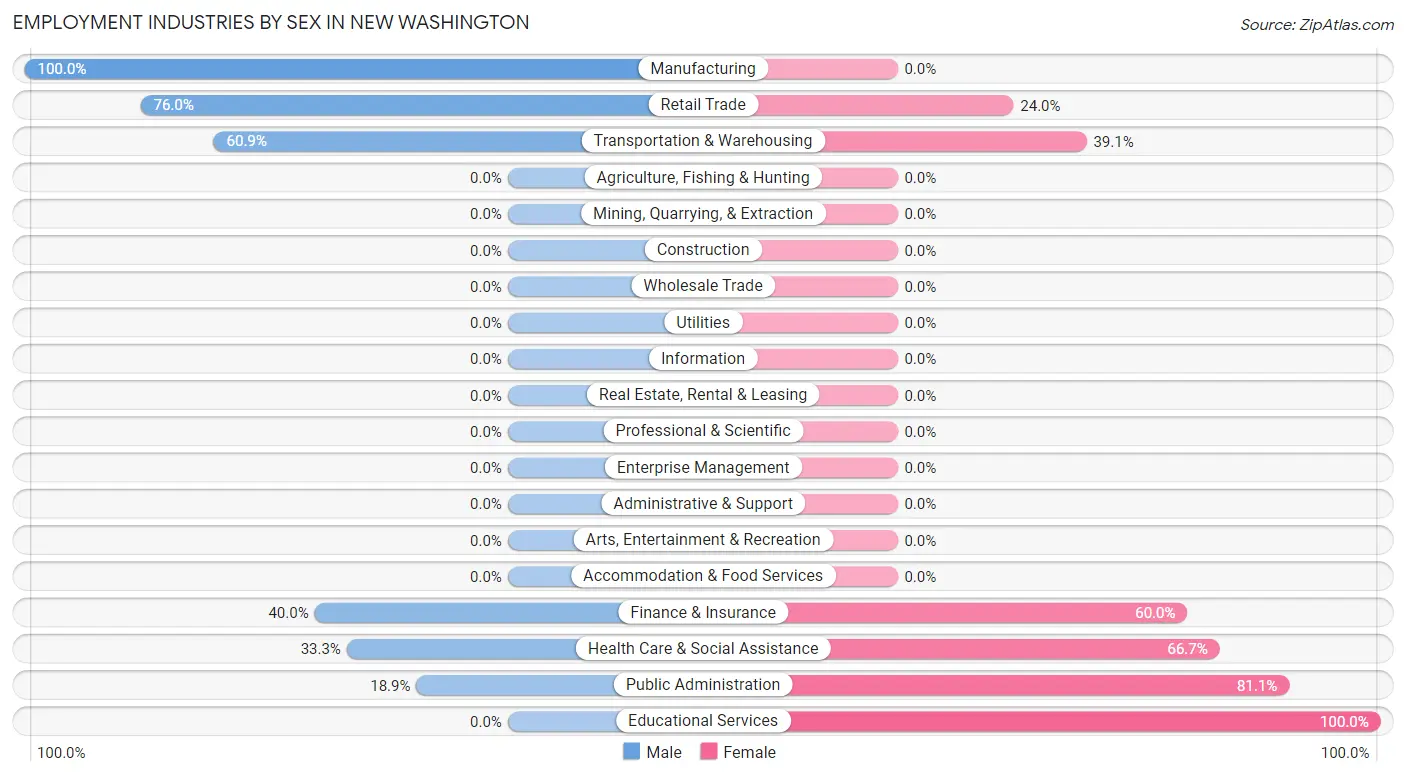
The New Washington industries that see more men than women are Manufacturing (100.0%), Retail Trade (76.0%), and Transportation & Warehousing (60.9%), whereas the industries that tend to have a higher number of women are Educational Services (100.0%), Public Administration (81.1%), and Health Care & Social Assistance (66.7%).
| Industry | Male | Female |
| Agriculture, Fishing & Hunting | 0 (0.0%) | 0 (0.0%) |
| Mining, Quarrying, & Extraction | 0 (0.0%) | 0 (0.0%) |
| Construction | 0 (0.0%) | 0 (0.0%) |
| Manufacturing | 21 (100.0%) | 0 (0.0%) |
| Wholesale Trade | 0 (0.0%) | 0 (0.0%) |
| Retail Trade | 38 (76.0%) | 12 (24.0%) |
| Transportation & Warehousing | 14 (60.9%) | 9 (39.1%) |
| Utilities | 0 (0.0%) | 0 (0.0%) |
| Information | 0 (0.0%) | 0 (0.0%) |
| Finance & Insurance | 8 (40.0%) | 12 (60.0%) |
| Real Estate, Rental & Leasing | 0 (0.0%) | 0 (0.0%) |
| Professional & Scientific | 0 (0.0%) | 0 (0.0%) |
| Enterprise Management | 0 (0.0%) | 0 (0.0%) |
| Administrative & Support | 0 (0.0%) | 0 (0.0%) |
| Educational Services | 0 (0.0%) | 18 (100.0%) |
| Health Care & Social Assistance | 16 (33.3%) | 32 (66.7%) |
| Arts, Entertainment & Recreation | 0 (0.0%) | 0 (0.0%) |
| Accommodation & Food Services | 0 (0.0%) | 0 (0.0%) |
| Public Administration | 7 (18.9%) | 30 (81.1%) |
| Total | 116 (46.4%) | 134 (53.6%) |
Education in New Washington
School Enrollment in New Washington
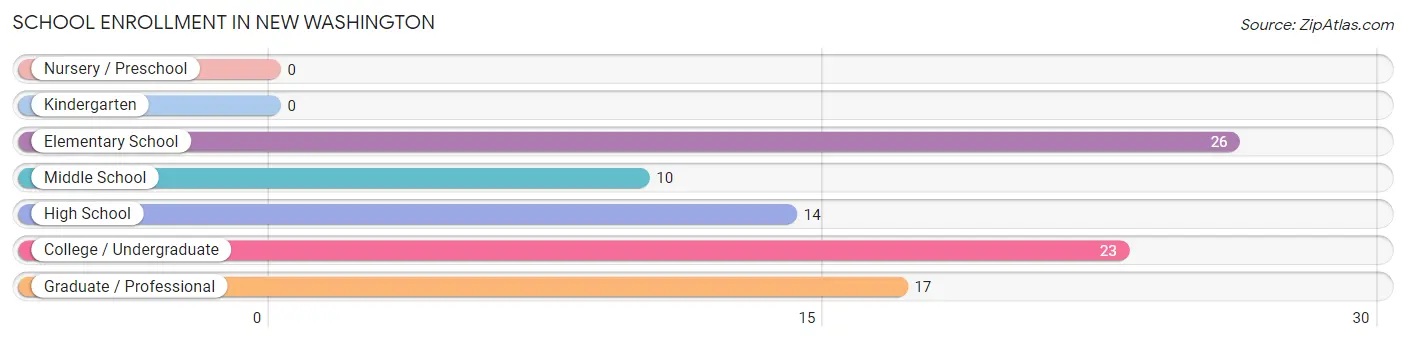
The most common levels of schooling among the 90 students in New Washington are elementary school (26 | 28.9%), college / undergraduate (23 | 25.6%), and graduate / professional (17 | 18.9%).
| School Level | # Students | % Students |
| Nursery / Preschool | 0 | 0.0% |
| Kindergarten | 0 | 0.0% |
| Elementary School | 26 | 28.9% |
| Middle School | 10 | 11.1% |
| High School | 14 | 15.6% |
| College / Undergraduate | 23 | 25.6% |
| Graduate / Professional | 17 | 18.9% |
| Total | 90 | 100.0% |
School Enrollment by Age by Funding Source in New Washington
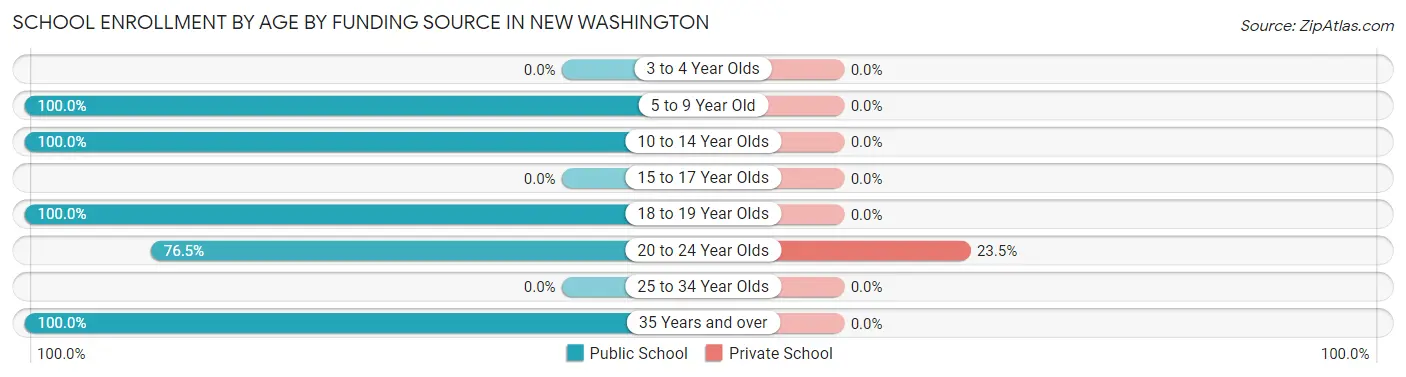
Out of a total of 90 students who are enrolled in schools in New Washington, 8 (8.9%) attend a private institution, while the remaining 82 (91.1%) are enrolled in public schools. The age group of 20 to 24 year olds has the highest likelihood of being enrolled in private schools, with 8 (23.5% in the age bracket) enrolled. Conversely, the age group of 5 to 9 year old has the lowest likelihood of being enrolled in a private school, with 26 (100.0% in the age bracket) attending a public institution.
| Age Bracket | Public School | Private School |
| 3 to 4 Year Olds | 0 (0.0%) | 0 (0.0%) |
| 5 to 9 Year Old | 26 (100.0%) | 0 (0.0%) |
| 10 to 14 Year Olds | 16 (100.0%) | 0 (0.0%) |
| 15 to 17 Year Olds | 0 (0.0%) | 0 (0.0%) |
| 18 to 19 Year Olds | 8 (100.0%) | 0 (0.0%) |
| 20 to 24 Year Olds | 26 (76.5%) | 8 (23.5%) |
| 25 to 34 Year Olds | 0 (0.0%) | 0 (0.0%) |
| 35 Years and over | 6 (100.0%) | 0 (0.0%) |
| Total | 82 (91.1%) | 8 (8.9%) |
Educational Attainment by Field of Study in New Washington
Business (10 | 21.3%), arts & humanities (10 | 21.3%), education (7 | 14.9%), liberal arts & history (7 | 14.9%), and communications (7 | 14.9%) are the most common fields of study among 47 individuals in New Washington who have obtained a bachelor's degree or higher.
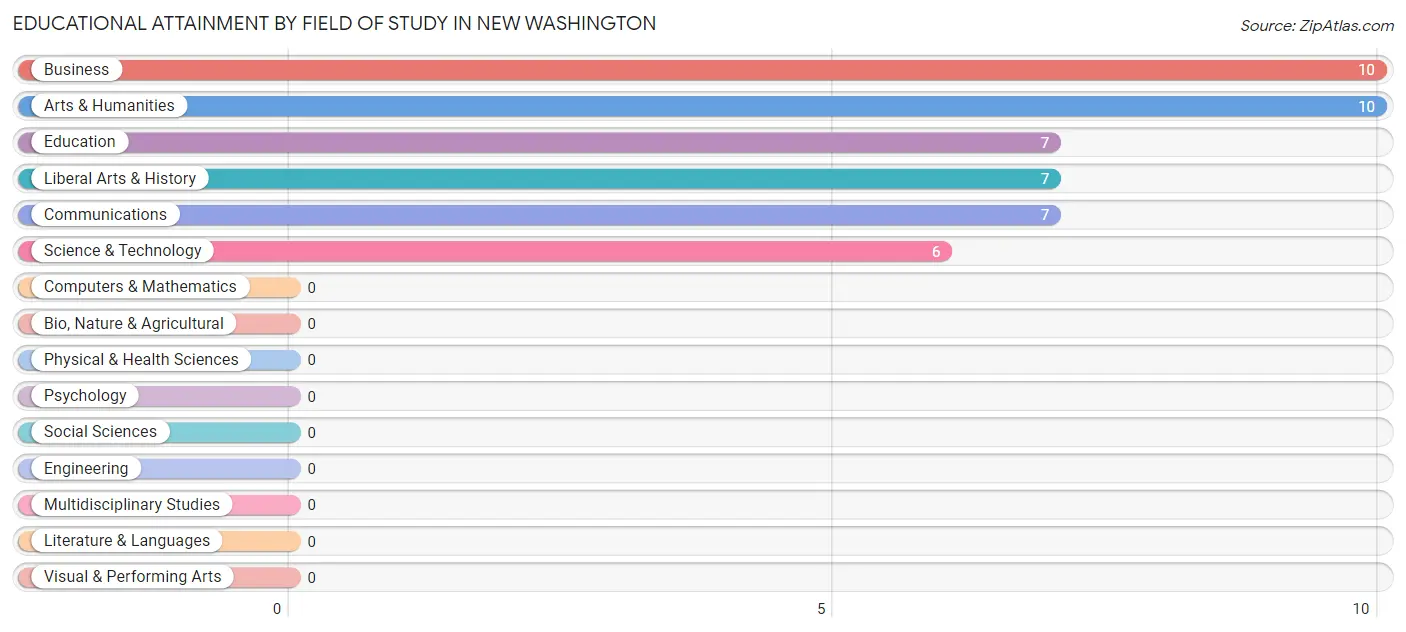
| Field of Study | # Graduates | % Graduates |
| Computers & Mathematics | 0 | 0.0% |
| Bio, Nature & Agricultural | 0 | 0.0% |
| Physical & Health Sciences | 0 | 0.0% |
| Psychology | 0 | 0.0% |
| Social Sciences | 0 | 0.0% |
| Engineering | 0 | 0.0% |
| Multidisciplinary Studies | 0 | 0.0% |
| Science & Technology | 6 | 12.8% |
| Business | 10 | 21.3% |
| Education | 7 | 14.9% |
| Literature & Languages | 0 | 0.0% |
| Liberal Arts & History | 7 | 14.9% |
| Visual & Performing Arts | 0 | 0.0% |
| Communications | 7 | 14.9% |
| Arts & Humanities | 10 | 21.3% |
| Total | 47 | 100.0% |
Transportation & Commute in New Washington
Vehicle Availability by Sex in New Washington
The most prevalent vehicle ownership categories in New Washington are males with 5 or more vehicles (37, accounting for 31.9%) and females with 5 or more vehicles (31, making up 27.6%).
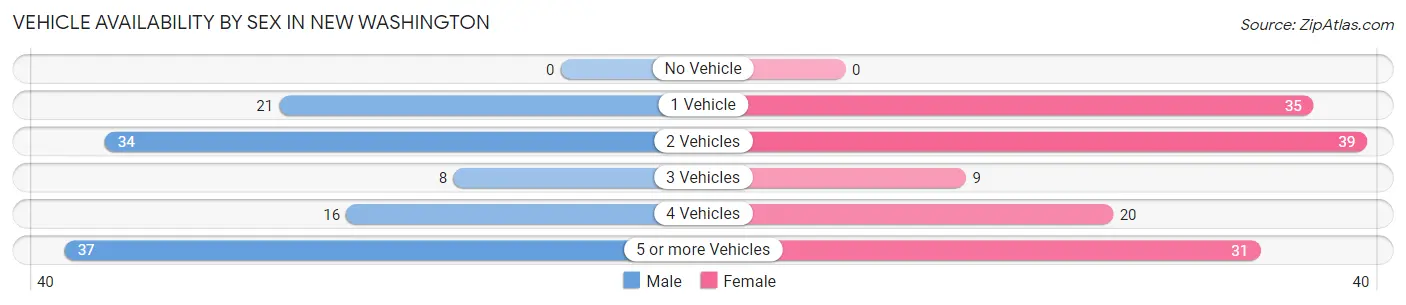
| Vehicles Available | Male | Female |
| No Vehicle | 0 (0.0%) | 0 (0.0%) |
| 1 Vehicle | 21 (18.1%) | 35 (26.1%) |
| 2 Vehicles | 34 (29.3%) | 39 (29.1%) |
| 3 Vehicles | 8 (6.9%) | 9 (6.7%) |
| 4 Vehicles | 16 (13.8%) | 20 (14.9%) |
| 5 or more Vehicles | 37 (31.9%) | 31 (23.1%) |
| Total | 116 (100.0%) | 134 (100.0%) |
Commute Time in New Washington
The most frequently occuring commute durations in New Washington are 45 to 59 minutes (67 commuters, 26.8%), 40 to 44 minutes (46 commuters, 18.4%), and 10 to 14 minutes (33 commuters, 13.2%).
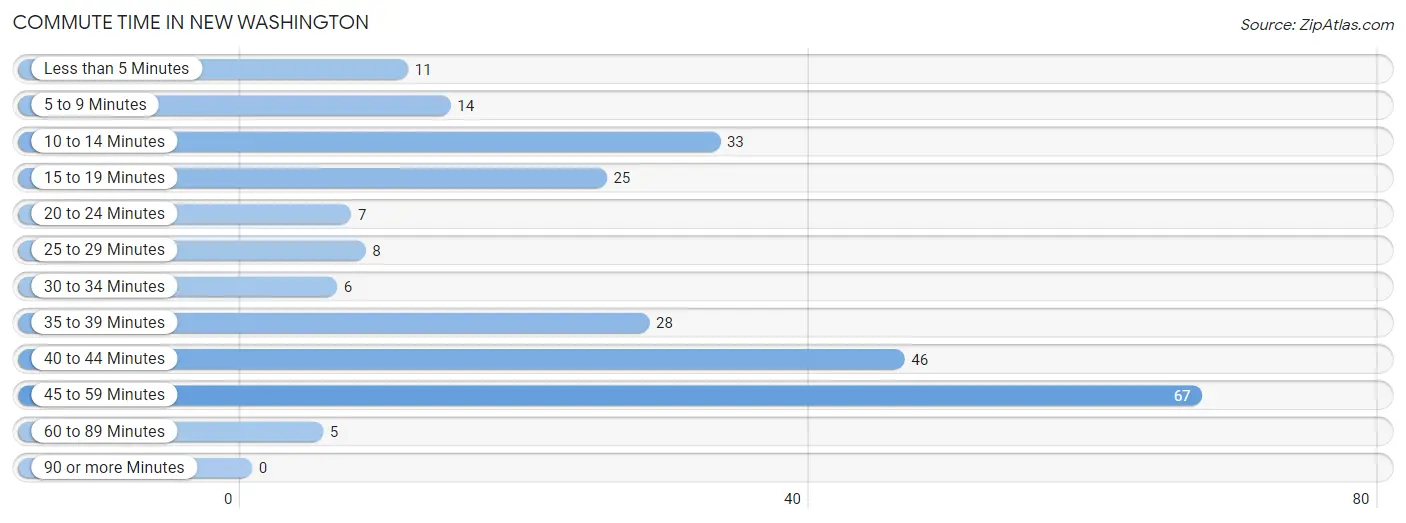
| Commute Time | # Commuters | % Commuters |
| Less than 5 Minutes | 11 | 4.4% |
| 5 to 9 Minutes | 14 | 5.6% |
| 10 to 14 Minutes | 33 | 13.2% |
| 15 to 19 Minutes | 25 | 10.0% |
| 20 to 24 Minutes | 7 | 2.8% |
| 25 to 29 Minutes | 8 | 3.2% |
| 30 to 34 Minutes | 6 | 2.4% |
| 35 to 39 Minutes | 28 | 11.2% |
| 40 to 44 Minutes | 46 | 18.4% |
| 45 to 59 Minutes | 67 | 26.8% |
| 60 to 89 Minutes | 5 | 2.0% |
| 90 or more Minutes | 0 | 0.0% |
Commute Time by Sex in New Washington
The most common commute times in New Washington are 45 to 59 minutes (38 commuters, 32.8%) for males and 10 to 14 minutes (33 commuters, 24.6%) for females.
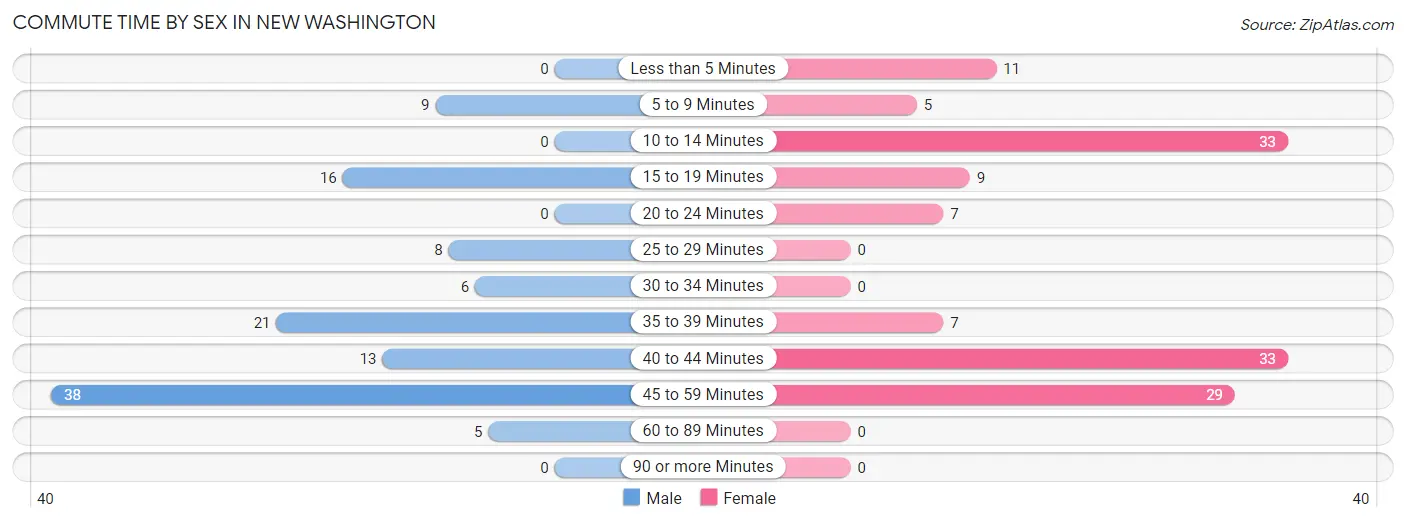
| Commute Time | Male | Female |
| Less than 5 Minutes | 0 (0.0%) | 11 (8.2%) |
| 5 to 9 Minutes | 9 (7.8%) | 5 (3.7%) |
| 10 to 14 Minutes | 0 (0.0%) | 33 (24.6%) |
| 15 to 19 Minutes | 16 (13.8%) | 9 (6.7%) |
| 20 to 24 Minutes | 0 (0.0%) | 7 (5.2%) |
| 25 to 29 Minutes | 8 (6.9%) | 0 (0.0%) |
| 30 to 34 Minutes | 6 (5.2%) | 0 (0.0%) |
| 35 to 39 Minutes | 21 (18.1%) | 7 (5.2%) |
| 40 to 44 Minutes | 13 (11.2%) | 33 (24.6%) |
| 45 to 59 Minutes | 38 (32.8%) | 29 (21.6%) |
| 60 to 89 Minutes | 5 (4.3%) | 0 (0.0%) |
| 90 or more Minutes | 0 (0.0%) | 0 (0.0%) |
Time of Departure to Work by Sex in New Washington
The most frequent times of departure to work in New Washington are 7:00 AM to 7:29 AM (35, 30.2%) for males and 7:30 AM to 7:59 AM (35, 26.1%) for females.

| Time of Departure | Male | Female |
| 12:00 AM to 4:59 AM | 0 (0.0%) | 0 (0.0%) |
| 5:00 AM to 5:29 AM | 0 (0.0%) | 0 (0.0%) |
| 5:30 AM to 5:59 AM | 0 (0.0%) | 30 (22.4%) |
| 6:00 AM to 6:29 AM | 24 (20.7%) | 9 (6.7%) |
| 6:30 AM to 6:59 AM | 24 (20.7%) | 27 (20.2%) |
| 7:00 AM to 7:29 AM | 35 (30.2%) | 6 (4.5%) |
| 7:30 AM to 7:59 AM | 9 (7.8%) | 35 (26.1%) |
| 8:00 AM to 8:29 AM | 0 (0.0%) | 0 (0.0%) |
| 8:30 AM to 8:59 AM | 0 (0.0%) | 0 (0.0%) |
| 9:00 AM to 9:59 AM | 0 (0.0%) | 0 (0.0%) |
| 10:00 AM to 10:59 AM | 0 (0.0%) | 0 (0.0%) |
| 11:00 AM to 11:59 AM | 0 (0.0%) | 0 (0.0%) |
| 12:00 PM to 3:59 PM | 8 (6.9%) | 21 (15.7%) |
| 4:00 PM to 11:59 PM | 16 (13.8%) | 6 (4.5%) |
| Total | 116 (100.0%) | 134 (100.0%) |
Housing Occupancy in New Washington
Occupancy by Ownership in New Washington
Of the total 189 dwellings in New Washington, owner-occupied units account for 156 (82.5%), while renter-occupied units make up 33 (17.5%).
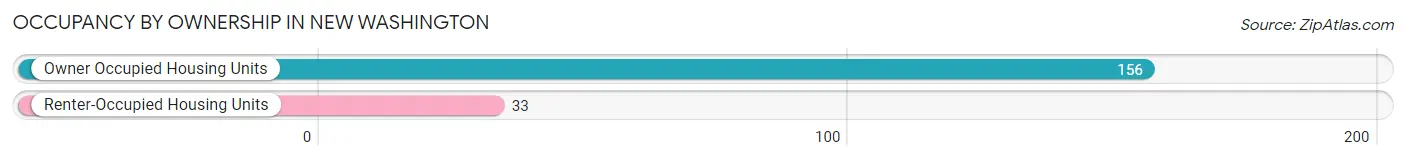
| Occupancy | # Housing Units | % Housing Units |
| Owner Occupied Housing Units | 156 | 82.5% |
| Renter-Occupied Housing Units | 33 | 17.5% |
| Total Occupied Housing Units | 189 | 100.0% |
Occupancy by Household Size in New Washington
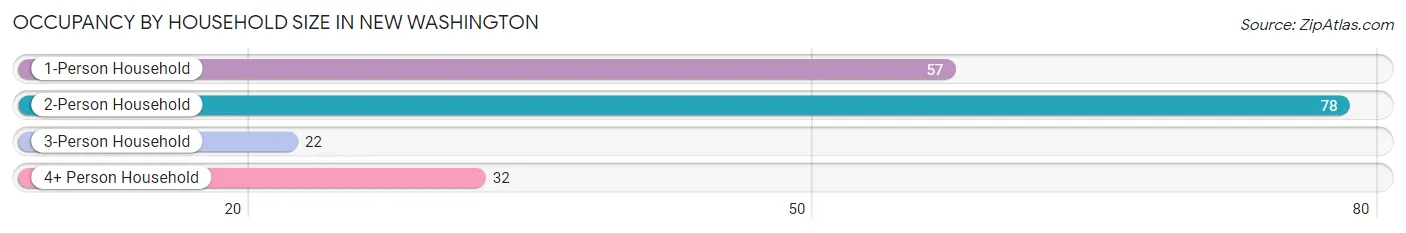
| Household Size | # Housing Units | % Housing Units |
| 1-Person Household | 57 | 30.2% |
| 2-Person Household | 78 | 41.3% |
| 3-Person Household | 22 | 11.6% |
| 4+ Person Household | 32 | 16.9% |
| Total Housing Units | 189 | 100.0% |
Occupancy by Ownership by Household Size in New Washington
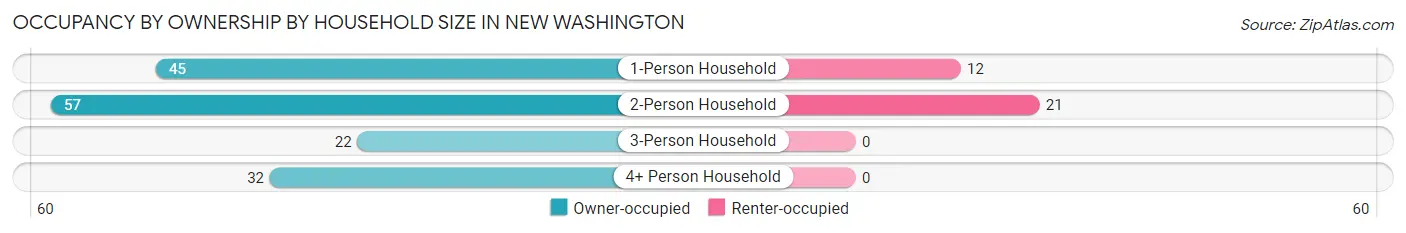
| Household Size | Owner-occupied | Renter-occupied |
| 1-Person Household | 45 (78.9%) | 12 (21.0%) |
| 2-Person Household | 57 (73.1%) | 21 (26.9%) |
| 3-Person Household | 22 (100.0%) | 0 (0.0%) |
| 4+ Person Household | 32 (100.0%) | 0 (0.0%) |
| Total Housing Units | 156 (82.5%) | 33 (17.5%) |
Occupancy by Educational Attainment in New Washington
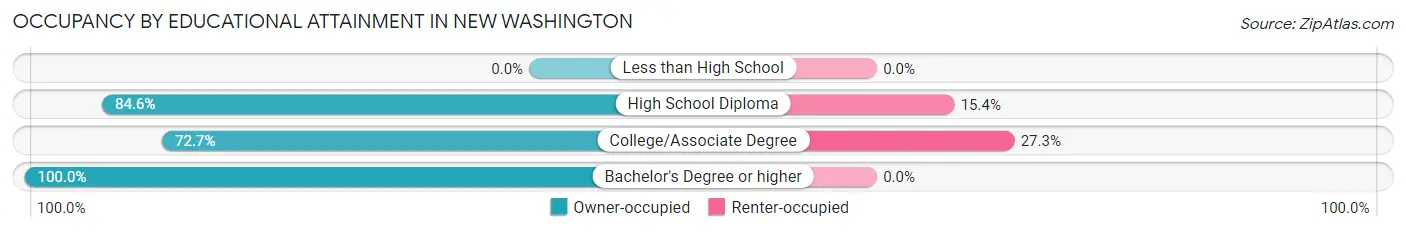
| Household Size | Owner-occupied | Renter-occupied |
| Less than High School | 0 (0.0%) | 0 (0.0%) |
| High School Diploma | 66 (84.6%) | 12 (15.4%) |
| College/Associate Degree | 56 (72.7%) | 21 (27.3%) |
| Bachelor's Degree or higher | 34 (100.0%) | 0 (0.0%) |
Occupancy by Age of Householder in New Washington
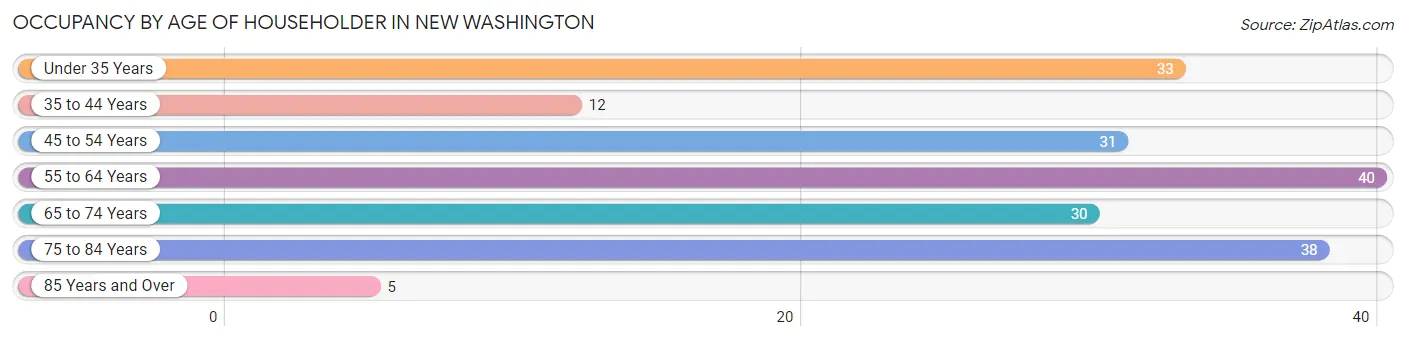
| Age Bracket | # Households | % Households |
| Under 35 Years | 33 | 17.5% |
| 35 to 44 Years | 12 | 6.4% |
| 45 to 54 Years | 31 | 16.4% |
| 55 to 64 Years | 40 | 21.2% |
| 65 to 74 Years | 30 | 15.9% |
| 75 to 84 Years | 38 | 20.1% |
| 85 Years and Over | 5 | 2.6% |
| Total | 189 | 100.0% |
Housing Finances in New Washington
Median Income by Occupancy in New Washington
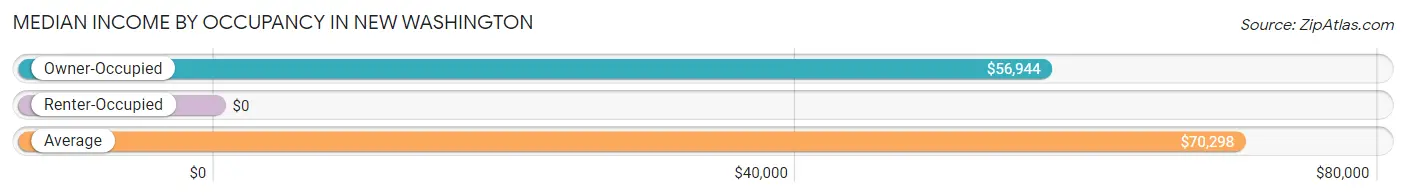
| Occupancy Type | # Households | Median Income |
| Owner-Occupied | 156 (82.5%) | $56,944 |
| Renter-Occupied | 33 (17.5%) | $0 |
| Average | 189 (100.0%) | $70,298 |
Occupancy by Householder Income Bracket in New Washington
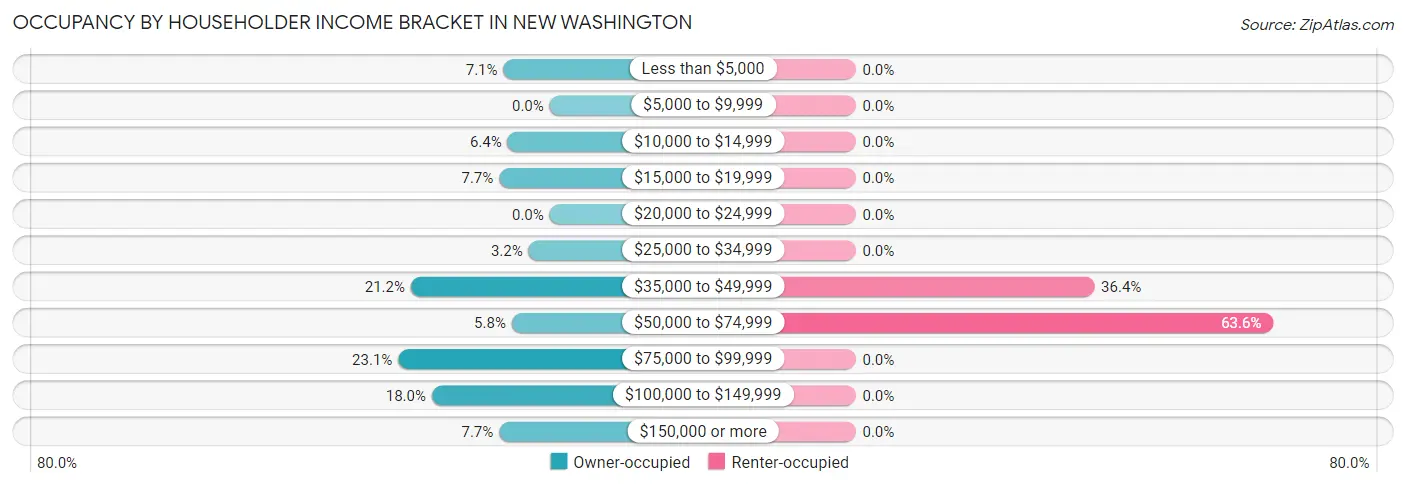
| Income Bracket | Owner-occupied | Renter-occupied |
| Less than $5,000 | 11 (7.0%) | 0 (0.0%) |
| $5,000 to $9,999 | 0 (0.0%) | 0 (0.0%) |
| $10,000 to $14,999 | 10 (6.4%) | 0 (0.0%) |
| $15,000 to $19,999 | 12 (7.7%) | 0 (0.0%) |
| $20,000 to $24,999 | 0 (0.0%) | 0 (0.0%) |
| $25,000 to $34,999 | 5 (3.2%) | 0 (0.0%) |
| $35,000 to $49,999 | 33 (21.1%) | 12 (36.4%) |
| $50,000 to $74,999 | 9 (5.8%) | 21 (63.6%) |
| $75,000 to $99,999 | 36 (23.1%) | 0 (0.0%) |
| $100,000 to $149,999 | 28 (17.9%) | 0 (0.0%) |
| $150,000 or more | 12 (7.7%) | 0 (0.0%) |
| Total | 156 (100.0%) | 33 (100.0%) |
Monthly Housing Cost Tiers in New Washington
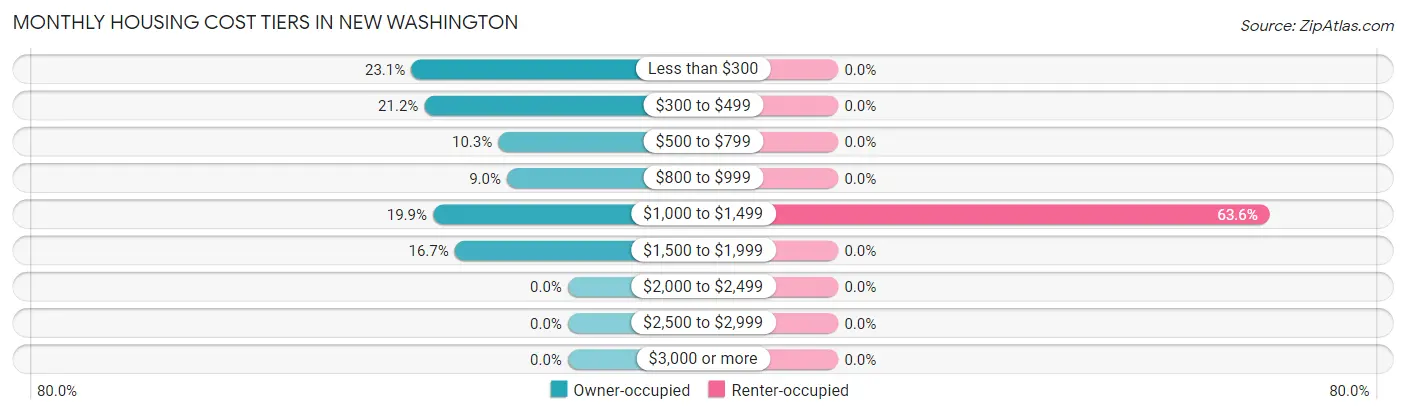
| Monthly Cost | Owner-occupied | Renter-occupied |
| Less than $300 | 36 (23.1%) | 0 (0.0%) |
| $300 to $499 | 33 (21.1%) | 0 (0.0%) |
| $500 to $799 | 16 (10.3%) | 0 (0.0%) |
| $800 to $999 | 14 (9.0%) | 0 (0.0%) |
| $1,000 to $1,499 | 31 (19.9%) | 21 (63.6%) |
| $1,500 to $1,999 | 26 (16.7%) | 0 (0.0%) |
| $2,000 to $2,499 | 0 (0.0%) | 0 (0.0%) |
| $2,500 to $2,999 | 0 (0.0%) | 0 (0.0%) |
| $3,000 or more | 0 (0.0%) | 0 (0.0%) |
| Total | 156 (100.0%) | 33 (100.0%) |
Physical Housing Characteristics in New Washington
Housing Structures in New Washington
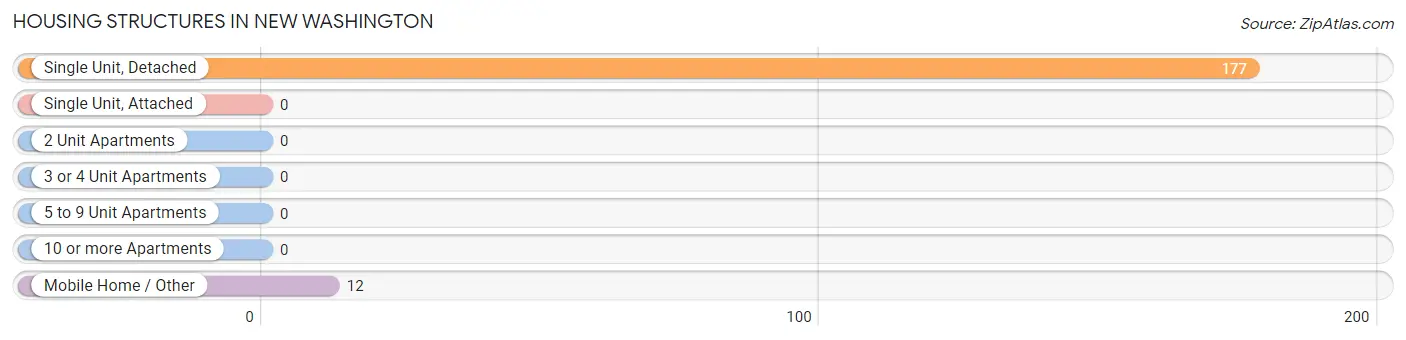
| Structure Type | # Housing Units | % Housing Units |
| Single Unit, Detached | 177 | 93.6% |
| Single Unit, Attached | 0 | 0.0% |
| 2 Unit Apartments | 0 | 0.0% |
| 3 or 4 Unit Apartments | 0 | 0.0% |
| 5 to 9 Unit Apartments | 0 | 0.0% |
| 10 or more Apartments | 0 | 0.0% |
| Mobile Home / Other | 12 | 6.4% |
| Total | 189 | 100.0% |
Housing Structures by Occupancy in New Washington
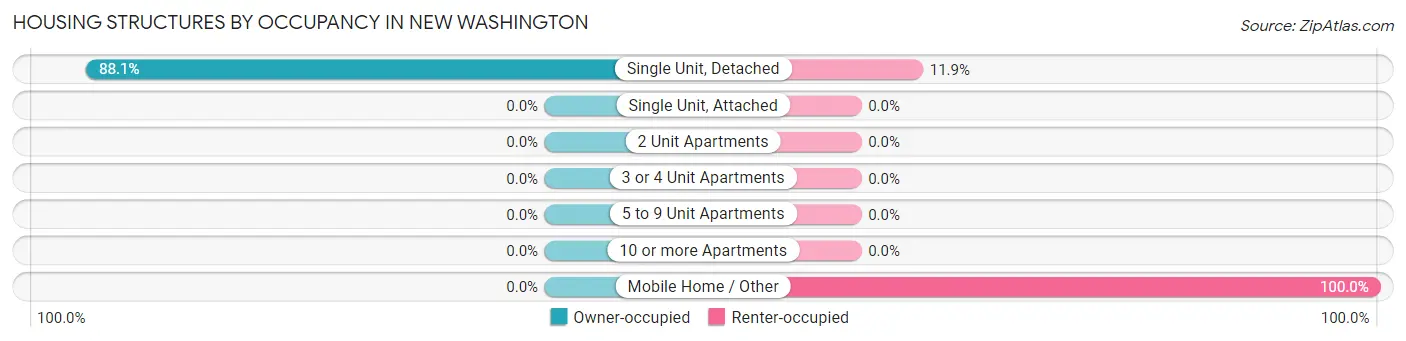
| Structure Type | Owner-occupied | Renter-occupied |
| Single Unit, Detached | 156 (88.1%) | 21 (11.9%) |
| Single Unit, Attached | 0 (0.0%) | 0 (0.0%) |
| 2 Unit Apartments | 0 (0.0%) | 0 (0.0%) |
| 3 or 4 Unit Apartments | 0 (0.0%) | 0 (0.0%) |
| 5 to 9 Unit Apartments | 0 (0.0%) | 0 (0.0%) |
| 10 or more Apartments | 0 (0.0%) | 0 (0.0%) |
| Mobile Home / Other | 0 (0.0%) | 12 (100.0%) |
| Total | 156 (82.5%) | 33 (17.5%) |
Housing Structures by Number of Rooms in New Washington
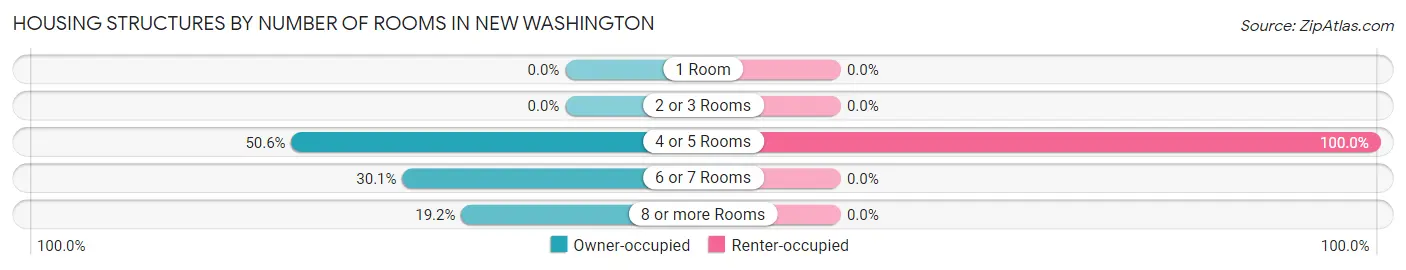
| Number of Rooms | Owner-occupied | Renter-occupied |
| 1 Room | 0 (0.0%) | 0 (0.0%) |
| 2 or 3 Rooms | 0 (0.0%) | 0 (0.0%) |
| 4 or 5 Rooms | 79 (50.6%) | 33 (100.0%) |
| 6 or 7 Rooms | 47 (30.1%) | 0 (0.0%) |
| 8 or more Rooms | 30 (19.2%) | 0 (0.0%) |
| Total | 156 (100.0%) | 33 (100.0%) |
Housing Structure by Heating Type in New Washington
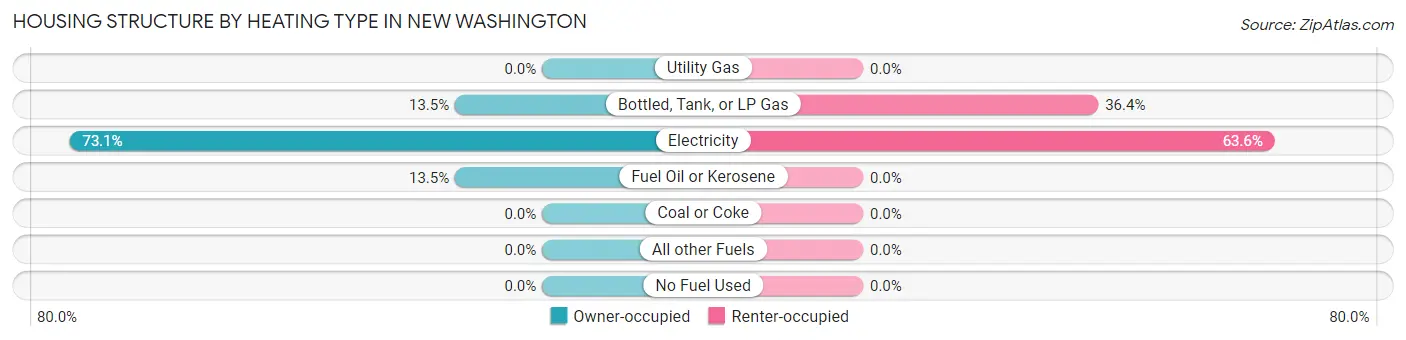
| Heating Type | Owner-occupied | Renter-occupied |
| Utility Gas | 0 (0.0%) | 0 (0.0%) |
| Bottled, Tank, or LP Gas | 21 (13.5%) | 12 (36.4%) |
| Electricity | 114 (73.1%) | 21 (63.6%) |
| Fuel Oil or Kerosene | 21 (13.5%) | 0 (0.0%) |
| Coal or Coke | 0 (0.0%) | 0 (0.0%) |
| All other Fuels | 0 (0.0%) | 0 (0.0%) |
| No Fuel Used | 0 (0.0%) | 0 (0.0%) |
| Total | 156 (100.0%) | 33 (100.0%) |
Household Vehicle Usage in New Washington
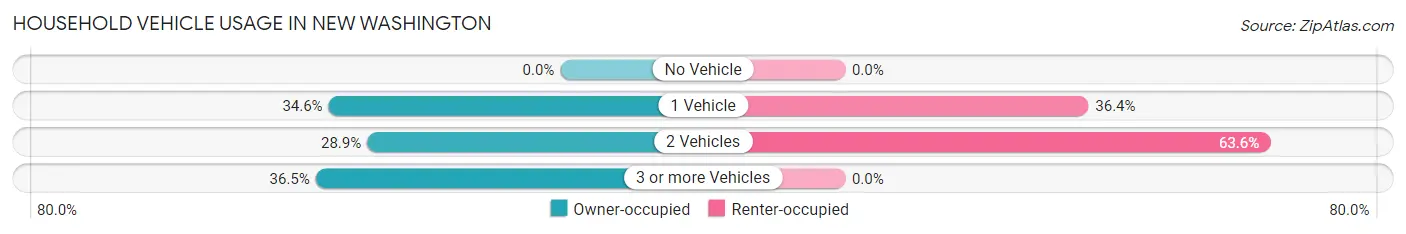
| Vehicles per Household | Owner-occupied | Renter-occupied |
| No Vehicle | 0 (0.0%) | 0 (0.0%) |
| 1 Vehicle | 54 (34.6%) | 12 (36.4%) |
| 2 Vehicles | 45 (28.8%) | 21 (63.6%) |
| 3 or more Vehicles | 57 (36.5%) | 0 (0.0%) |
| Total | 156 (100.0%) | 33 (100.0%) |
Real Estate & Mortgages in New Washington
Real Estate and Mortgage Overview in New Washington
| Characteristic | Without Mortgage | With Mortgage |
| Housing Units | 99 | 57 |
| Median Property Value | $84,900 | $192,000 |
| Median Household Income | $36,719 | $12 |
| Monthly Housing Costs | $342 | $0 |
| Real Estate Taxes | $336 | $0 |
Property Value by Mortgage Status in New Washington
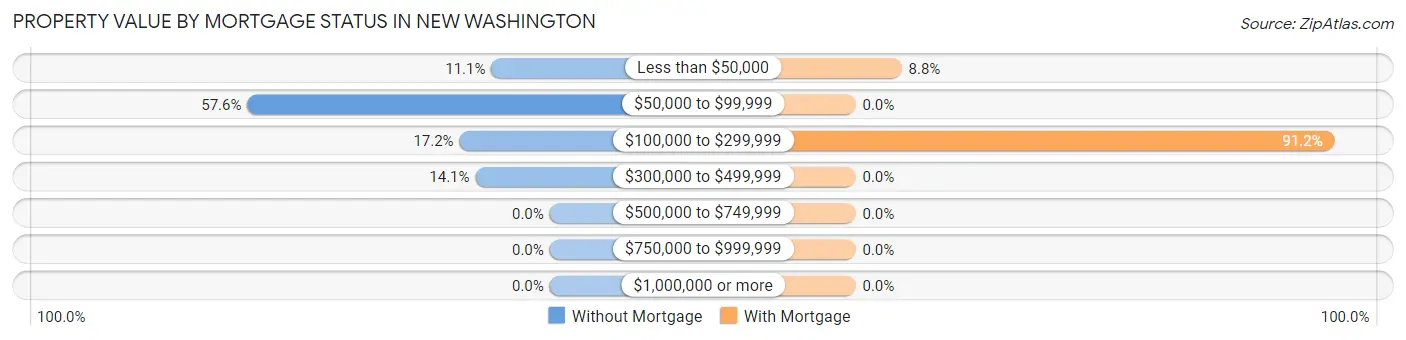
| Property Value | Without Mortgage | With Mortgage |
| Less than $50,000 | 11 (11.1%) | 5 (8.8%) |
| $50,000 to $99,999 | 57 (57.6%) | 0 (0.0%) |
| $100,000 to $299,999 | 17 (17.2%) | 52 (91.2%) |
| $300,000 to $499,999 | 14 (14.1%) | 0 (0.0%) |
| $500,000 to $749,999 | 0 (0.0%) | 0 (0.0%) |
| $750,000 to $999,999 | 0 (0.0%) | 0 (0.0%) |
| $1,000,000 or more | 0 (0.0%) | 0 (0.0%) |
| Total | 99 (100.0%) | 57 (100.0%) |
Household Income by Mortgage Status in New Washington
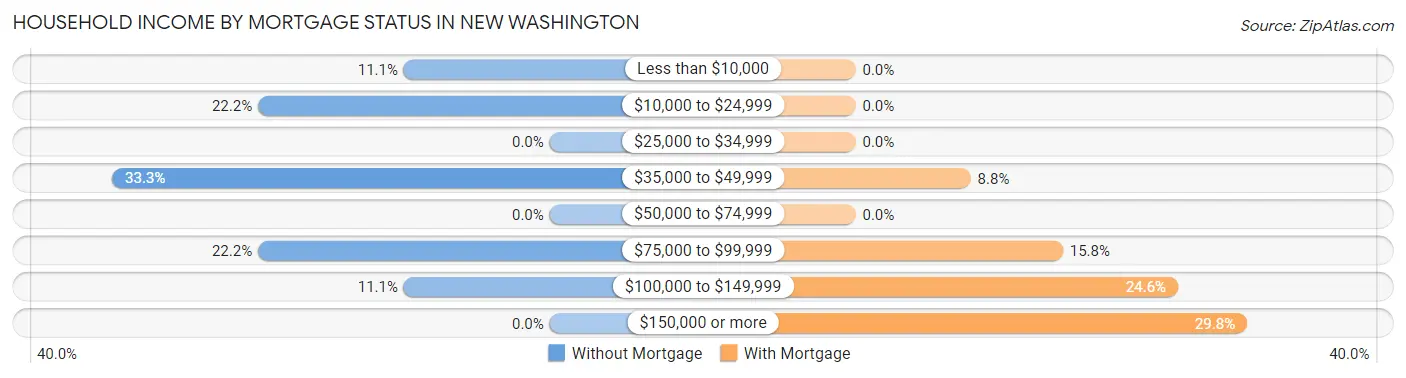
| Household Income | Without Mortgage | With Mortgage |
| Less than $10,000 | 11 (11.1%) | 0 (0.0%) |
| $10,000 to $24,999 | 22 (22.2%) | 0 (0.0%) |
| $25,000 to $34,999 | 0 (0.0%) | 0 (0.0%) |
| $35,000 to $49,999 | 33 (33.3%) | 5 (8.8%) |
| $50,000 to $74,999 | 0 (0.0%) | 0 (0.0%) |
| $75,000 to $99,999 | 22 (22.2%) | 9 (15.8%) |
| $100,000 to $149,999 | 11 (11.1%) | 14 (24.6%) |
| $150,000 or more | 0 (0.0%) | 17 (29.8%) |
| Total | 99 (100.0%) | 57 (100.0%) |
Property Value to Household Income Ratio in New Washington
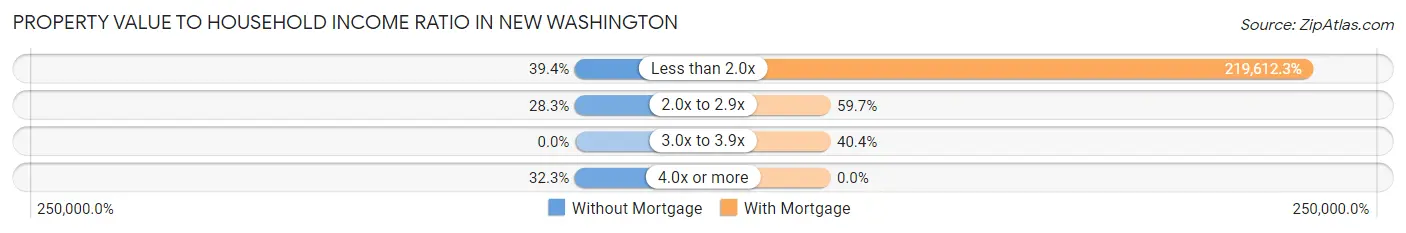
| Value-to-Income Ratio | Without Mortgage | With Mortgage |
| Less than 2.0x | 39 (39.4%) | 125,179 (219,612.3%) |
| 2.0x to 2.9x | 28 (28.3%) | 34 (59.7%) |
| 3.0x to 3.9x | 0 (0.0%) | 23 (40.4%) |
| 4.0x or more | 32 (32.3%) | 0 (0.0%) |
| Total | 99 (100.0%) | 57 (100.0%) |
Real Estate Taxes by Mortgage Status in New Washington
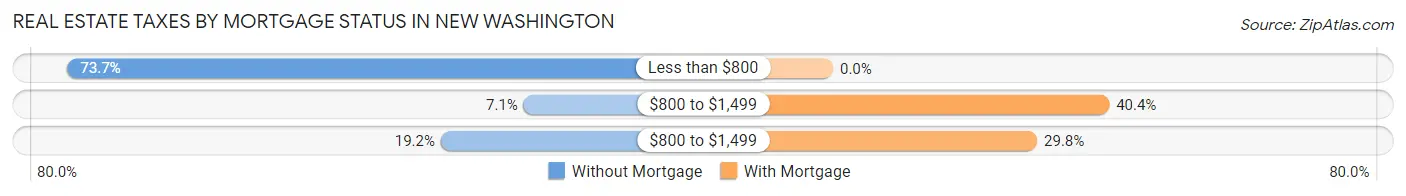
| Property Taxes | Without Mortgage | With Mortgage |
| Less than $800 | 73 (73.7%) | 0 (0.0%) |
| $800 to $1,499 | 7 (7.1%) | 23 (40.4%) |
| $800 to $1,499 | 19 (19.2%) | 17 (29.8%) |
| Total | 99 (100.0%) | 57 (100.0%) |
Health & Disability in New Washington
Health Insurance Coverage by Age in New Washington
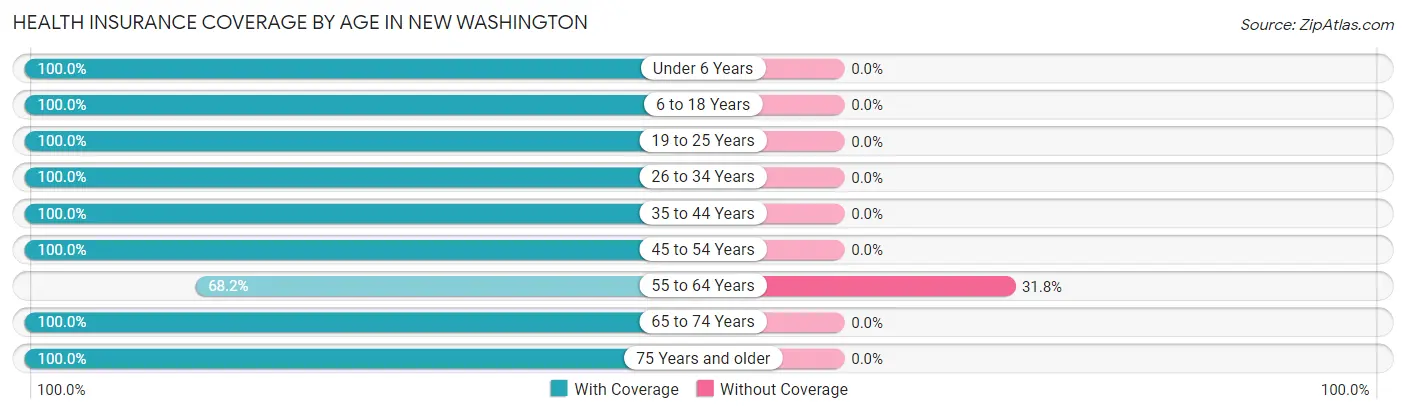
| Age Bracket | With Coverage | Without Coverage |
| Under 6 Years | 19 (100.0%) | 0 (0.0%) |
| 6 to 18 Years | 42 (100.0%) | 0 (0.0%) |
| 19 to 25 Years | 75 (100.0%) | 0 (0.0%) |
| 26 to 34 Years | 43 (100.0%) | 0 (0.0%) |
| 35 to 44 Years | 44 (100.0%) | 0 (0.0%) |
| 45 to 54 Years | 68 (100.0%) | 0 (0.0%) |
| 55 to 64 Years | 45 (68.2%) | 21 (31.8%) |
| 65 to 74 Years | 56 (100.0%) | 0 (0.0%) |
| 75 Years and older | 50 (100.0%) | 0 (0.0%) |
| Total | 442 (95.5%) | 21 (4.5%) |
Health Insurance Coverage by Citizenship Status in New Washington
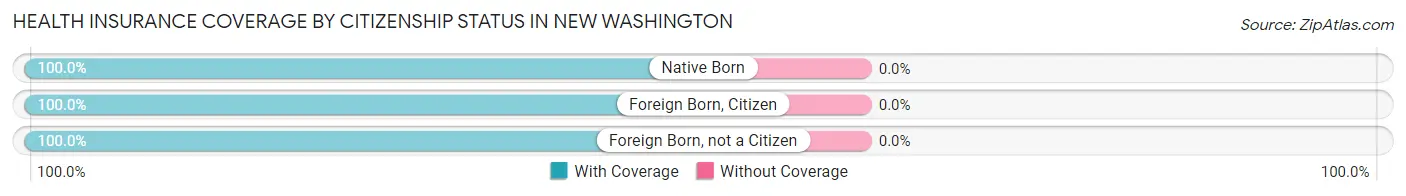
| Citizenship Status | With Coverage | Without Coverage |
| Native Born | 19 (100.0%) | 0 (0.0%) |
| Foreign Born, Citizen | 42 (100.0%) | 0 (0.0%) |
| Foreign Born, not a Citizen | 75 (100.0%) | 0 (0.0%) |
Health Insurance Coverage by Household Income in New Washington
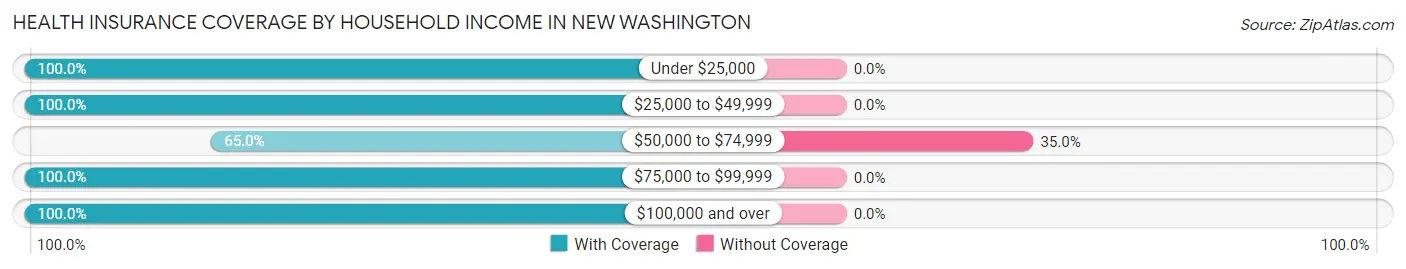
| Household Income | With Coverage | Without Coverage |
| Under $25,000 | 47 (100.0%) | 0 (0.0%) |
| $25,000 to $49,999 | 87 (100.0%) | 0 (0.0%) |
| $50,000 to $74,999 | 39 (65.0%) | 21 (35.0%) |
| $75,000 to $99,999 | 92 (100.0%) | 0 (0.0%) |
| $100,000 and over | 177 (100.0%) | 0 (0.0%) |
Public vs Private Health Insurance Coverage by Age in New Washington
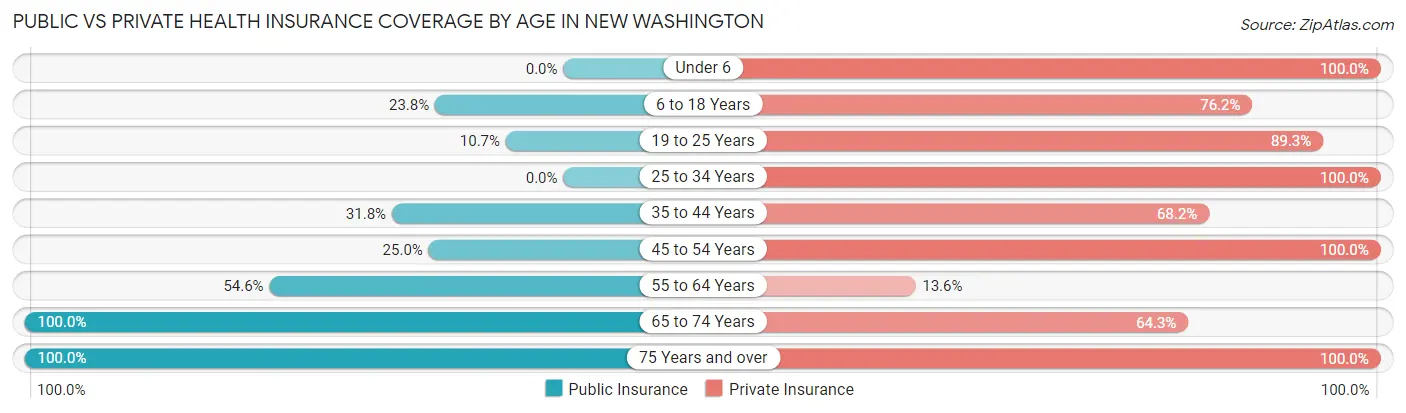
| Age Bracket | Public Insurance | Private Insurance |
| Under 6 | 0 (0.0%) | 19 (100.0%) |
| 6 to 18 Years | 10 (23.8%) | 32 (76.2%) |
| 19 to 25 Years | 8 (10.7%) | 67 (89.3%) |
| 25 to 34 Years | 0 (0.0%) | 43 (100.0%) |
| 35 to 44 Years | 14 (31.8%) | 30 (68.2%) |
| 45 to 54 Years | 17 (25.0%) | 68 (100.0%) |
| 55 to 64 Years | 36 (54.5%) | 9 (13.6%) |
| 65 to 74 Years | 56 (100.0%) | 36 (64.3%) |
| 75 Years and over | 50 (100.0%) | 50 (100.0%) |
| Total | 191 (41.2%) | 354 (76.5%) |
Disability Status by Sex by Age in New Washington
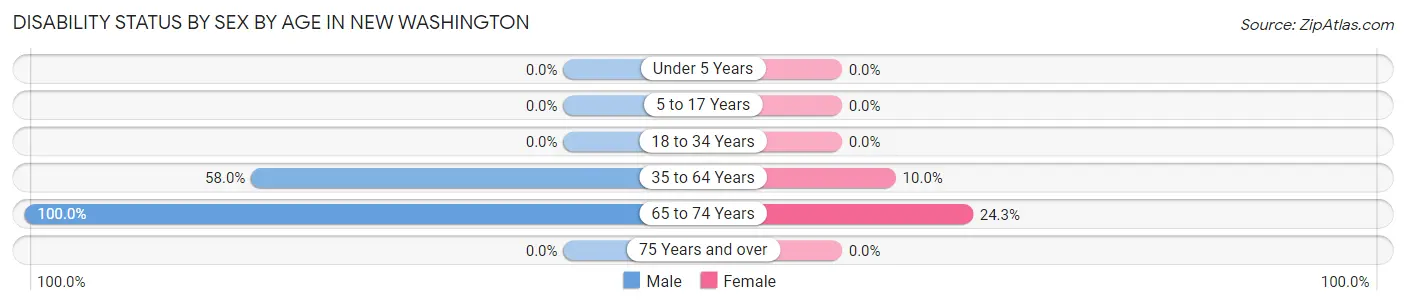
| Age Bracket | Male | Female |
| Under 5 Years | 0 (0.0%) | 0 (0.0%) |
| 5 to 17 Years | 0 (0.0%) | 0 (0.0%) |
| 18 to 34 Years | 0 (0.0%) | 0 (0.0%) |
| 35 to 64 Years | 51 (58.0%) | 9 (10.0%) |
| 65 to 74 Years | 19 (100.0%) | 9 (24.3%) |
| 75 Years and over | 0 (0.0%) | 0 (0.0%) |
Disability Class by Sex by Age in New Washington
Disability Class: Hearing Difficulty
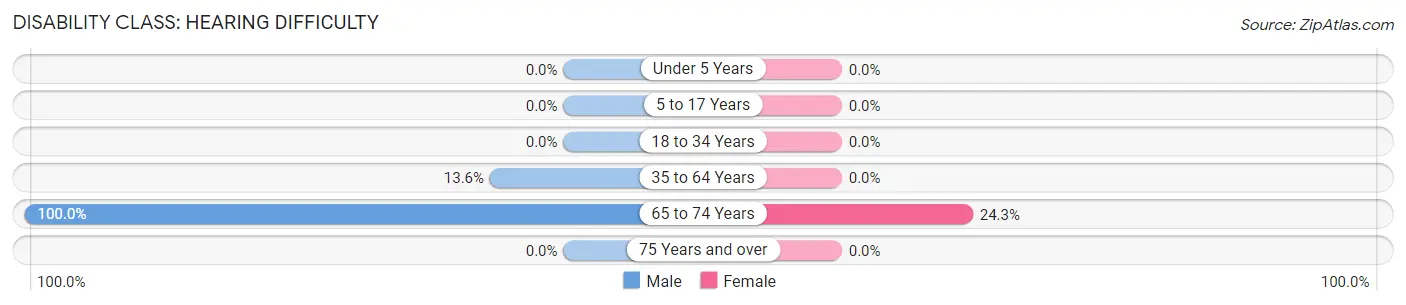
| Age Bracket | Male | Female |
| Under 5 Years | 0 (0.0%) | 0 (0.0%) |
| 5 to 17 Years | 0 (0.0%) | 0 (0.0%) |
| 18 to 34 Years | 0 (0.0%) | 0 (0.0%) |
| 35 to 64 Years | 12 (13.6%) | 0 (0.0%) |
| 65 to 74 Years | 19 (100.0%) | 9 (24.3%) |
| 75 Years and over | 0 (0.0%) | 0 (0.0%) |
Disability Class: Vision Difficulty
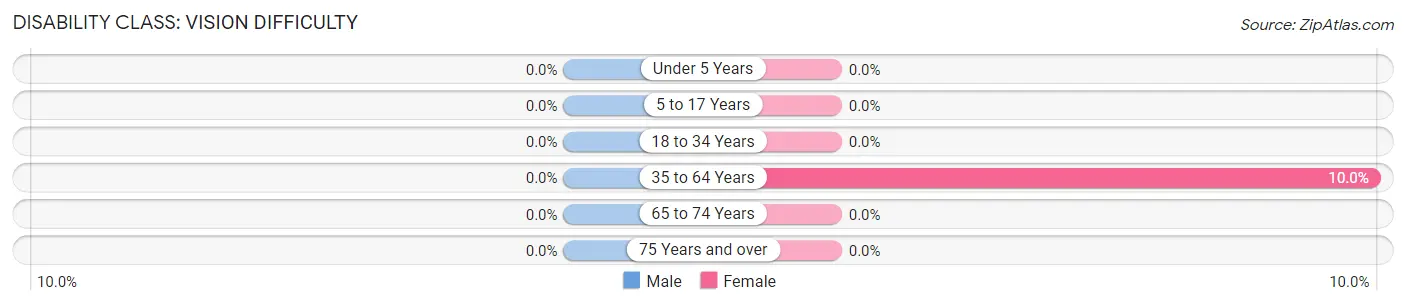
| Age Bracket | Male | Female |
| Under 5 Years | 0 (0.0%) | 0 (0.0%) |
| 5 to 17 Years | 0 (0.0%) | 0 (0.0%) |
| 18 to 34 Years | 0 (0.0%) | 0 (0.0%) |
| 35 to 64 Years | 0 (0.0%) | 9 (10.0%) |
| 65 to 74 Years | 0 (0.0%) | 0 (0.0%) |
| 75 Years and over | 0 (0.0%) | 0 (0.0%) |
Disability Class: Cognitive Difficulty
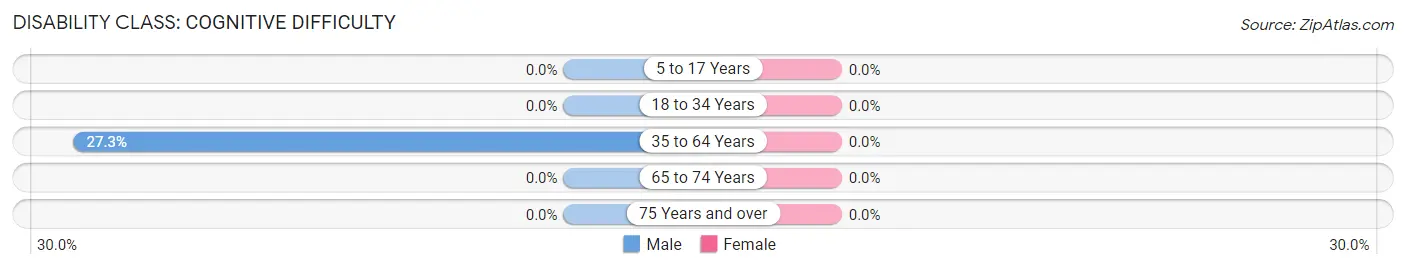
| Age Bracket | Male | Female |
| 5 to 17 Years | 0 (0.0%) | 0 (0.0%) |
| 18 to 34 Years | 0 (0.0%) | 0 (0.0%) |
| 35 to 64 Years | 24 (27.3%) | 0 (0.0%) |
| 65 to 74 Years | 0 (0.0%) | 0 (0.0%) |
| 75 Years and over | 0 (0.0%) | 0 (0.0%) |
Disability Class: Ambulatory Difficulty
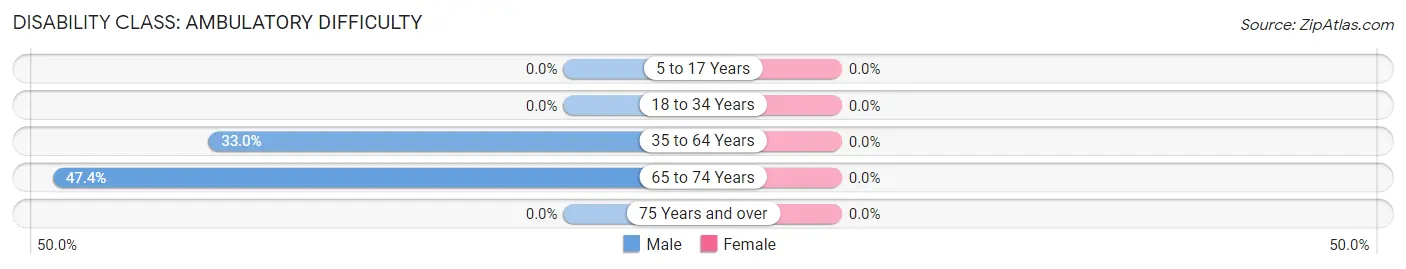
| Age Bracket | Male | Female |
| 5 to 17 Years | 0 (0.0%) | 0 (0.0%) |
| 18 to 34 Years | 0 (0.0%) | 0 (0.0%) |
| 35 to 64 Years | 29 (33.0%) | 0 (0.0%) |
| 65 to 74 Years | 9 (47.4%) | 0 (0.0%) |
| 75 Years and over | 0 (0.0%) | 0 (0.0%) |
Disability Class: Self-Care Difficulty

| Age Bracket | Male | Female |
| 5 to 17 Years | 0 (0.0%) | 0 (0.0%) |
| 18 to 34 Years | 0 (0.0%) | 0 (0.0%) |
| 35 to 64 Years | 0 (0.0%) | 0 (0.0%) |
| 65 to 74 Years | 0 (0.0%) | 0 (0.0%) |
| 75 Years and over | 0 (0.0%) | 0 (0.0%) |
Technology Access in New Washington
Computing Device Access in New Washington
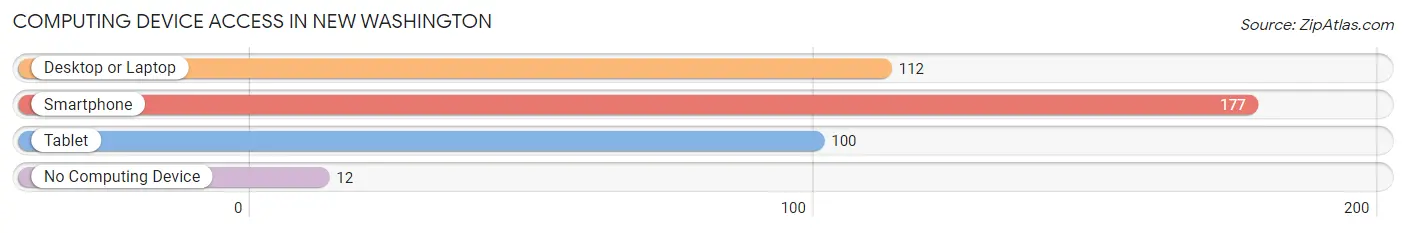
| Device Type | # Households | % Households |
| Desktop or Laptop | 112 | 59.3% |
| Smartphone | 177 | 93.6% |
| Tablet | 100 | 52.9% |
| No Computing Device | 12 | 6.4% |
| Total | 189 | 100.0% |
Internet Access in New Washington
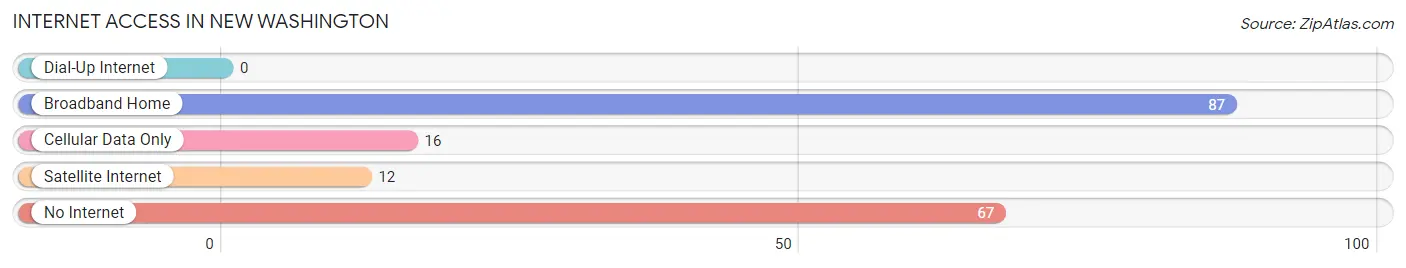
| Internet Type | # Households | % Households |
| Dial-Up Internet | 0 | 0.0% |
| Broadband Home | 87 | 46.0% |
| Cellular Data Only | 16 | 8.5% |
| Satellite Internet | 12 | 6.4% |
| No Internet | 67 | 35.4% |
| Total | 189 | 100.0% |
New Washington Summary
Washington, Indiana is a small town located in Daviess County, Indiana. It is situated in the southwestern part of the state, approximately 30 miles from the state capital of Indianapolis. The town has a population of approximately 8,000 people and is the county seat of Daviess County.
History
Washington, Indiana was founded in 1814 by a group of settlers from North Carolina. The town was named after George Washington, the first president of the United States. The town was originally a trading post and was known as “Washington’s Trading Post”. The town was incorporated in 1817 and was the first town in Daviess County.
In the early 19th century, Washington was a thriving agricultural community. The town was home to several mills, including a grist mill, a saw mill, and a woolen mill. The town also had a blacksmith shop, a tannery, and a distillery.
In the late 19th century, the town began to experience a period of growth and development. The railroad arrived in 1883, and the town was connected to the rest of the state. The town also experienced a period of industrial growth, with several factories being built in the area.
Geography
Washington, Indiana is located in the southwestern part of the state, approximately 30 miles from the state capital of Indianapolis. The town is situated in the Wabash Valley, which is part of the larger Midwest region. The town is located on the banks of the White River, which flows through the town.
The town is located in a mostly rural area, with the majority of the land being used for agricultural purposes. The town is surrounded by rolling hills and farmland, with the nearest major city being Evansville, which is located approximately 40 miles away.
Economy
Washington, Indiana has a diverse economy, with a variety of industries located in the town. The town is home to several manufacturing companies, including a furniture manufacturer, a plastics manufacturer, and a metal fabrication company. The town is also home to several retail stores, including a grocery store, a hardware store, and a clothing store.
The town is also home to several service-based businesses, including a bank, a post office, and a medical clinic. The town is also home to several restaurants, including a pizza shop, a Mexican restaurant, and a Chinese restaurant.
Demographics
As of the 2010 census, the population of Washington, Indiana was 8,093. The town has a population that is predominantly white, with approximately 95% of the population being white. The town also has a small African American population, with approximately 2% of the population being African American. The town also has a small Hispanic population, with approximately 1% of the population being Hispanic.
The town has a median household income of $41,000, which is slightly lower than the state average of $45,000. The town also has a poverty rate of approximately 15%, which is slightly higher than the state average of 13%.
Conclusion
Washington, Indiana is a small town located in Daviess County, Indiana. The town has a population of approximately 8,000 people and is the county seat of Daviess County. The town was founded in 1814 and was originally a trading post. The town has a diverse economy, with a variety of industries located in the town. The town has a population that is predominantly white, with approximately 95% of the population being white. The town also has a median household income of $41,000, which is slightly lower than the state average of $45,000.
Common Questions
What is Per Capita Income in New Washington?
Per Capita income in New Washington is $31,305.
What is the Median Family Income in New Washington?
Median Family Income in New Washington is $78,333.
What is the Median Household income in New Washington?
Median Household Income in New Washington is $70,298.
What is Inequality or Gini Index in New Washington?
Inequality or Gini Index in New Washington is 0.38.
What is the Total Population of New Washington?
Total Population of New Washington is 463.
What is the Total Male Population of New Washington?
Total Male Population of New Washington is 217.
What is the Total Female Population of New Washington?
Total Female Population of New Washington is 246.
What is the Ratio of Males per 100 Females in New Washington?
There are 88.21 Males per 100 Females in New Washington.
What is the Ratio of Females per 100 Males in New Washington?
There are 113.36 Females per 100 Males in New Washington.
What is the Median Population Age in New Washington?
Median Population Age in New Washington is 47.5 Years.
What is the Average Family Size in New Washington
Average Family Size in New Washington is 3.2 People.
What is the Average Household Size in New Washington
Average Household Size in New Washington is 2.5 People.
How Large is the Labor Force in New Washington?
There are 250 People in the Labor Forcein in New Washington.
What is the Percentage of People in the Labor Force in New Washington?
62.2% of People are in the Labor Force in New Washington.