North Webster, IN Map & Demographics
North Webster Map
North Webster Overview
$35,361
PER CAPITA INCOME
$81,500
AVG FAMILY INCOME
$58,421
AVG HOUSEHOLD INCOME
6.4%
WAGE / INCOME GAP [ % ]
93.6¢/ $1
WAGE / INCOME GAP [ $ ]
0.43
INEQUALITY / GINI INDEX
962
TOTAL POPULATION
423
MALE POPULATION
539
FEMALE POPULATION
78.48
MALES / 100 FEMALES
127.42
FEMALES / 100 MALES
43.6
MEDIAN AGE
2.7
AVG FAMILY SIZE
2.0
AVG HOUSEHOLD SIZE
488
LABOR FORCE [ PEOPLE ]
63.5%
PERCENT IN LABOR FORCE
1.8%
UNEMPLOYMENT RATE
North Webster Zip Codes
Income in North Webster
Income Overview in North Webster
Per Capita Income in North Webster is $35,361, while median incomes of families and households are $81,500 and $58,421 respectively.
| Characteristic | Number | Measure |
| Per Capita Income | 962 | $35,361 |
| Median Family Income | 252 | $81,500 |
| Mean Family Income | 252 | $95,463 |
| Median Household Income | 492 | $58,421 |
| Mean Household Income | 492 | $69,948 |
| Income Deficit | 252 | $0 |
| Wage / Income Gap (%) | 962 | 6.44% |
| Wage / Income Gap ($) | 962 | 93.56¢ per $1 |
| Gini / Inequality Index | 962 | 0.43 |
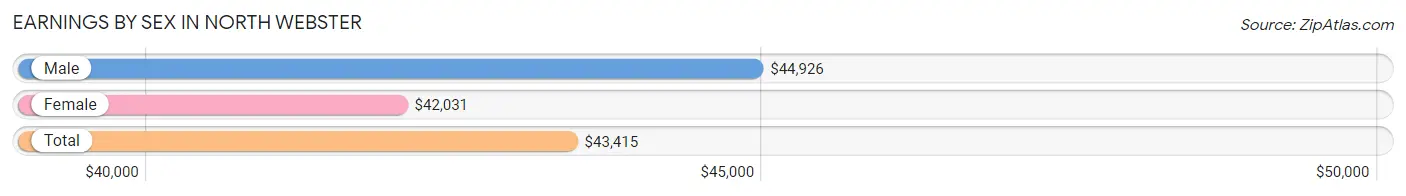
Earnings by Sex in North Webster
Average Earnings in North Webster are $43,415, $44,926 for men and $42,031 for women, a difference of 6.4%.
| Sex | Number | Average Earnings |
| Male | 213 (40.0%) | $44,926 |
| Female | 319 (60.0%) | $42,031 |
| Total | 532 (100.0%) | $43,415 |
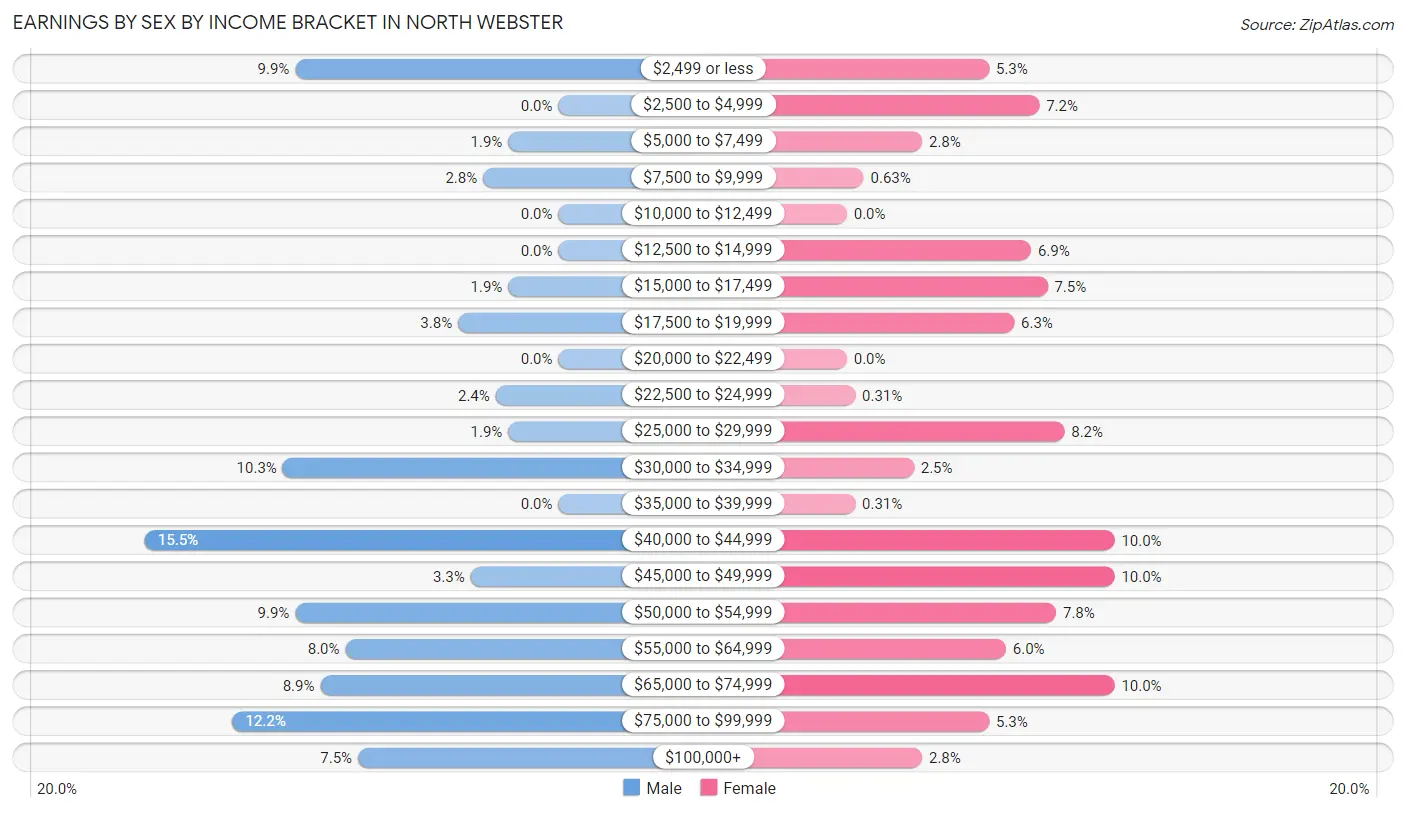
Earnings by Sex by Income Bracket in North Webster
The most common earnings brackets in North Webster are $40,000 to $44,999 for men (33 | 15.5%) and $40,000 to $44,999 for women (32 | 10.0%).
| Income | Male | Female |
| $2,499 or less | 21 (9.9%) | 17 (5.3%) |
| $2,500 to $4,999 | 0 (0.0%) | 23 (7.2%) |
| $5,000 to $7,499 | 4 (1.9%) | 9 (2.8%) |
| $7,500 to $9,999 | 6 (2.8%) | 2 (0.6%) |
| $10,000 to $12,499 | 0 (0.0%) | 0 (0.0%) |
| $12,500 to $14,999 | 0 (0.0%) | 22 (6.9%) |
| $15,000 to $17,499 | 4 (1.9%) | 24 (7.5%) |
| $17,500 to $19,999 | 8 (3.8%) | 20 (6.3%) |
| $20,000 to $22,499 | 0 (0.0%) | 0 (0.0%) |
| $22,500 to $24,999 | 5 (2.4%) | 1 (0.3%) |
| $25,000 to $29,999 | 4 (1.9%) | 26 (8.2%) |
| $30,000 to $34,999 | 22 (10.3%) | 8 (2.5%) |
| $35,000 to $39,999 | 0 (0.0%) | 1 (0.3%) |
| $40,000 to $44,999 | 33 (15.5%) | 32 (10.0%) |
| $45,000 to $49,999 | 7 (3.3%) | 32 (10.0%) |
| $50,000 to $54,999 | 21 (9.9%) | 25 (7.8%) |
| $55,000 to $64,999 | 17 (8.0%) | 19 (6.0%) |
| $65,000 to $74,999 | 19 (8.9%) | 32 (10.0%) |
| $75,000 to $99,999 | 26 (12.2%) | 17 (5.3%) |
| $100,000+ | 16 (7.5%) | 9 (2.8%) |
| Total | 213 (100.0%) | 319 (100.0%) |
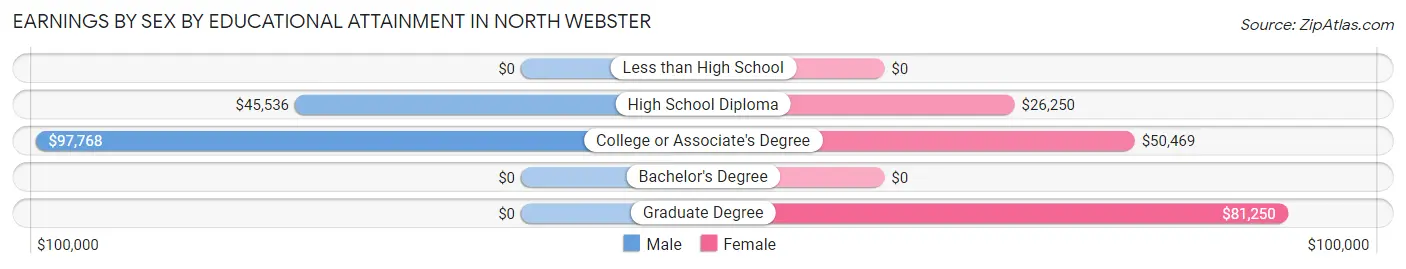
Earnings by Sex by Educational Attainment in North Webster
Average earnings in North Webster are $52,000 for men and $44,219 for women, a difference of 15.0%. Men with an educational attainment of college or associate's degree enjoy the highest average annual earnings of $97,768, while those with high school diploma education earn the least with $45,536. Women with an educational attainment of graduate degree earn the most with the average annual earnings of $81,250, while those with high school diploma education have the smallest earnings of $26,250.
| Educational Attainment | Male Income | Female Income |
| Less than High School | - | - |
| High School Diploma | $45,536 | $26,250 |
| College or Associate's Degree | $97,768 | $50,469 |
| Bachelor's Degree | - | - |
| Graduate Degree | - | - |
| Total | $52,000 | $44,219 |
Family Income in North Webster
Family Income Brackets in North Webster
According to the North Webster family income data, there are 64 families falling into the $100,000 to $149,999 income range, which is the most common income bracket and makes up 25.4% of all families.
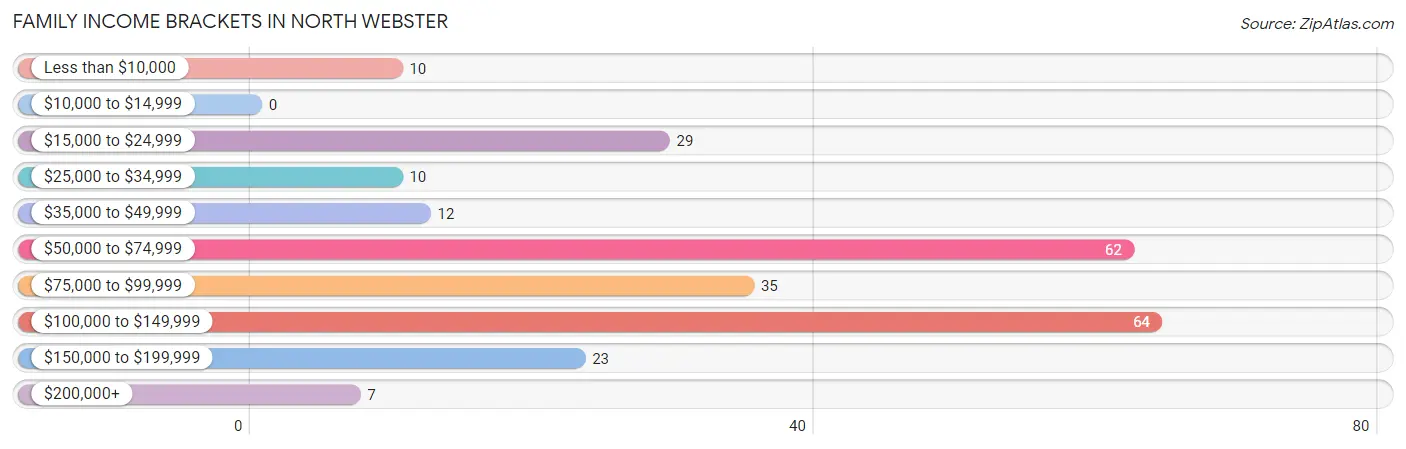
| Income Bracket | # Families | % Families |
| Less than $10,000 | 10 | 4.0% |
| $10,000 to $14,999 | 0 | 0.0% |
| $15,000 to $24,999 | 29 | 11.5% |
| $25,000 to $34,999 | 10 | 4.0% |
| $35,000 to $49,999 | 12 | 4.8% |
| $50,000 to $74,999 | 62 | 24.6% |
| $75,000 to $99,999 | 35 | 13.9% |
| $100,000 to $149,999 | 64 | 25.4% |
| $150,000 to $199,999 | 23 | 9.1% |
| $200,000+ | 7 | 2.8% |
Family Income by Famaliy Size in North Webster
4-person families (27 | 10.7%) account for the highest median family income in North Webster with $170,089 per family, while 4-person families (27 | 10.7%) have the highest median income of $42,522 per family member.
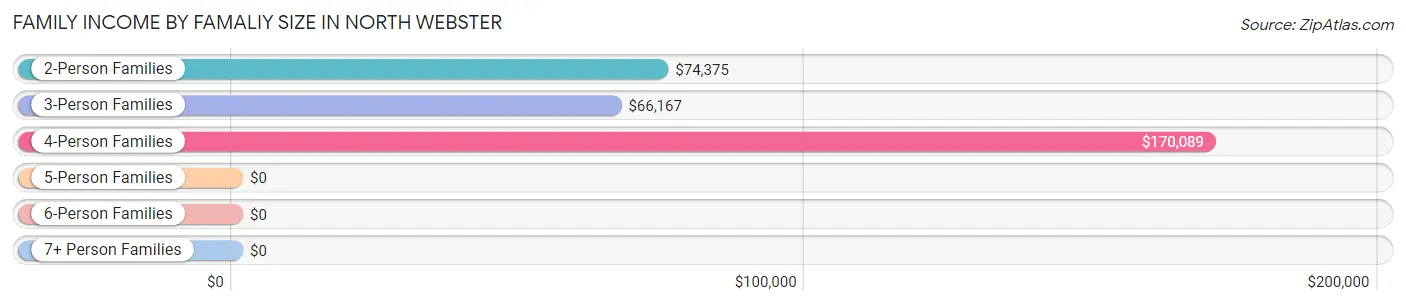
| Income Bracket | # Families | Median Income |
| 2-Person Families | 168 (66.7%) | $74,375 |
| 3-Person Families | 40 (15.9%) | $66,167 |
| 4-Person Families | 27 (10.7%) | $170,089 |
| 5-Person Families | 6 (2.4%) | $0 |
| 6-Person Families | 11 (4.4%) | $0 |
| 7+ Person Families | 0 (0.0%) | $0 |
| Total | 252 (100.0%) | $81,500 |
Family Income by Number of Earners in North Webster
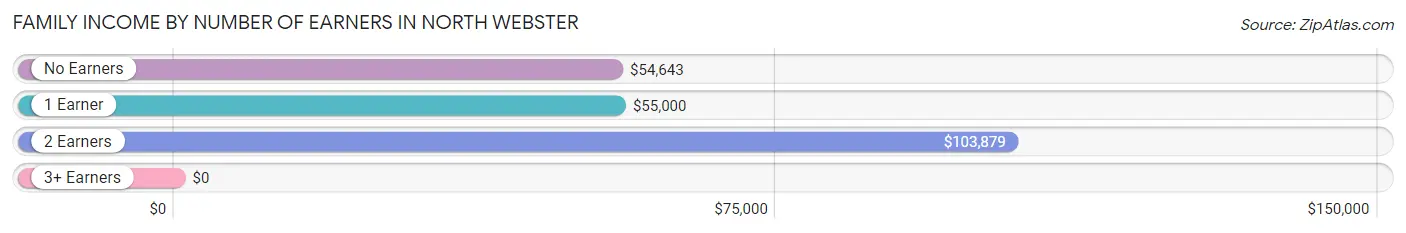
| Number of Earners | # Families | Median Income |
| No Earners | 34 (13.5%) | $54,643 |
| 1 Earner | 86 (34.1%) | $55,000 |
| 2 Earners | 126 (50.0%) | $103,879 |
| 3+ Earners | 6 (2.4%) | $0 |
| Total | 252 (100.0%) | $81,500 |
Household Income in North Webster
Household Income Brackets in North Webster
With 122 households falling in the category, the $50,000 to $74,999 income range is the most frequent in North Webster, accounting for 24.8% of all households. In contrast, only 7 households (1.4%) fall into the $200,000+ income bracket, making it the least populous group.
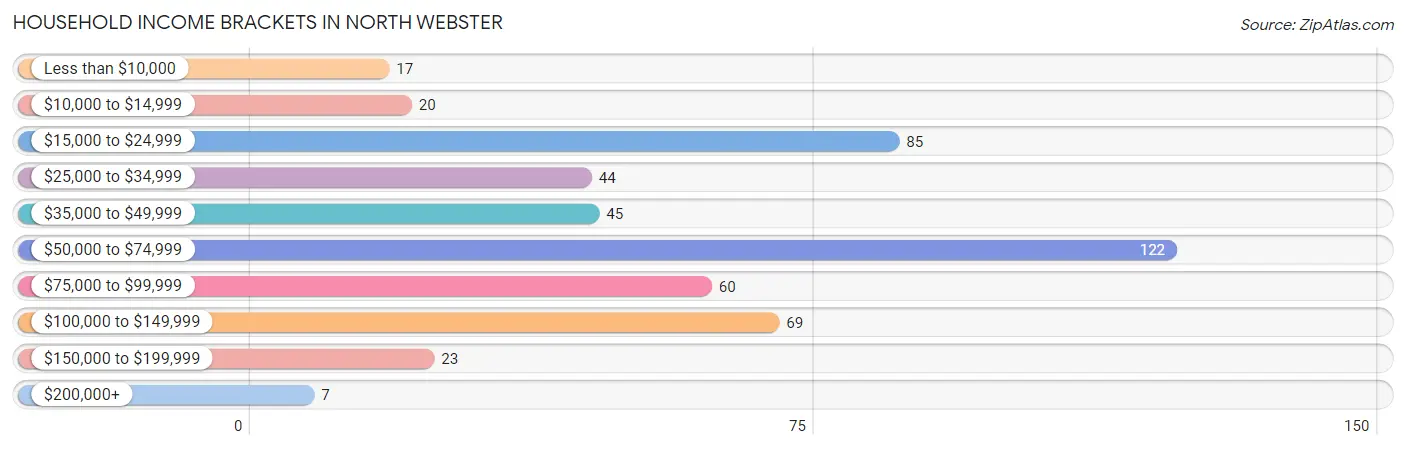
| Income Bracket | # Households | % Households |
| Less than $10,000 | 17 | 3.5% |
| $10,000 to $14,999 | 20 | 4.1% |
| $15,000 to $24,999 | 85 | 17.3% |
| $25,000 to $34,999 | 44 | 8.9% |
| $35,000 to $49,999 | 45 | 9.1% |
| $50,000 to $74,999 | 122 | 24.8% |
| $75,000 to $99,999 | 60 | 12.2% |
| $100,000 to $149,999 | 69 | 14.0% |
| $150,000 to $199,999 | 23 | 4.7% |
| $200,000+ | 7 | 1.4% |
Household Income by Householder Age in North Webster
The median household income in North Webster is $58,421, with the highest median household income of $71,250 found in the 45 to 64 years age bracket for the primary householder. A total of 149 households (30.3%) fall into this category. Meanwhile, the 65+ years age bracket for the primary householder has the lowest median household income of $38,056, with 192 households (39.0%) in this group.
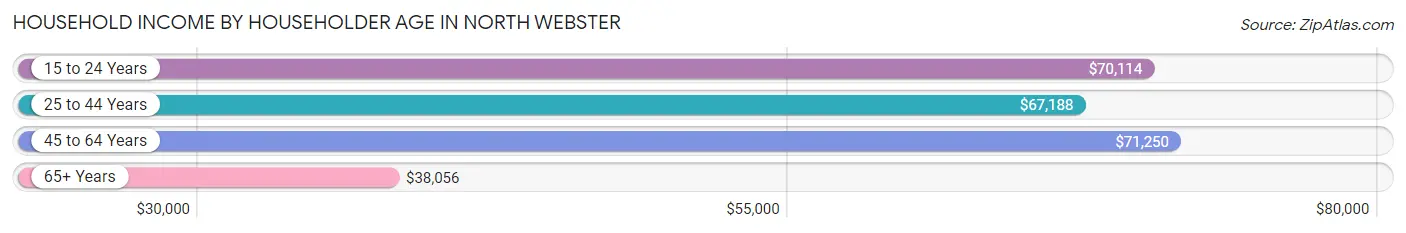
| Income Bracket | # Households | Median Income |
| 15 to 24 Years | 21 (4.3%) | $70,114 |
| 25 to 44 Years | 130 (26.4%) | $67,188 |
| 45 to 64 Years | 149 (30.3%) | $71,250 |
| 65+ Years | 192 (39.0%) | $38,056 |
| Total | 492 (100.0%) | $58,421 |
Poverty in North Webster
Income Below Poverty by Sex and Age in North Webster
With 5.0% poverty level for males and 12.8% for females among the residents of North Webster, 45 to 54 year old males and under 5 year old females are the most vulnerable to poverty, with 9 males (23.1%) and 20 females (50.0%) in their respective age groups living below the poverty level.
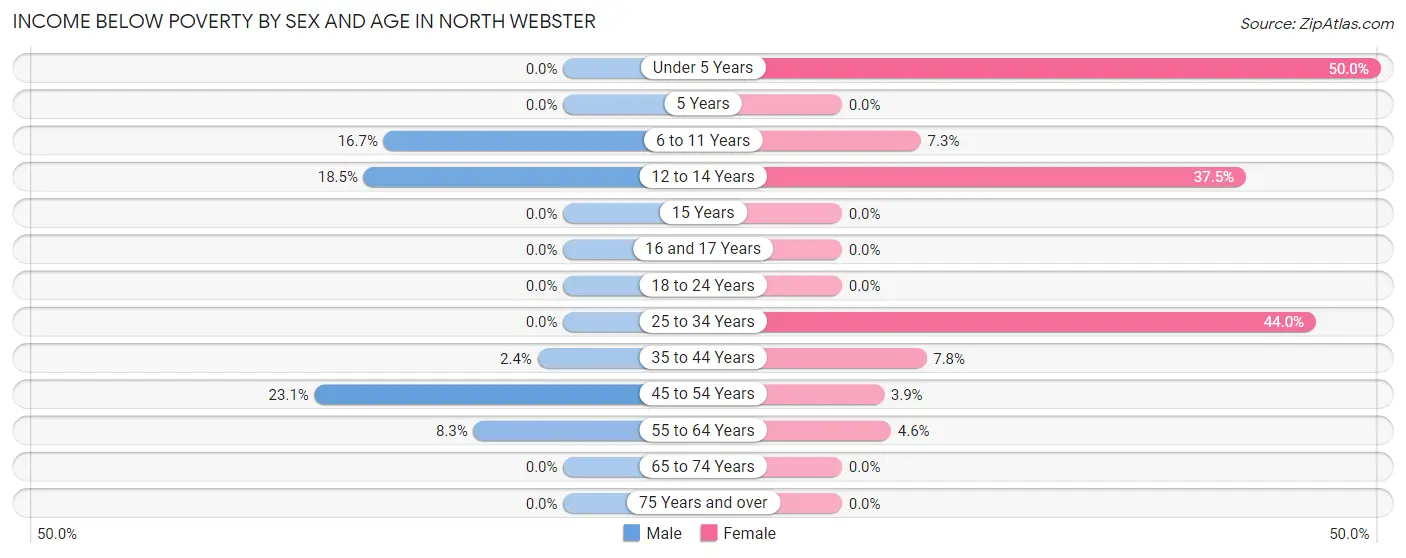
| Age Bracket | Male | Female |
| Under 5 Years | 0 (0.0%) | 20 (50.0%) |
| 5 Years | 0 (0.0%) | 0 (0.0%) |
| 6 to 11 Years | 2 (16.7%) | 3 (7.3%) |
| 12 to 14 Years | 5 (18.5%) | 3 (37.5%) |
| 15 Years | 0 (0.0%) | 0 (0.0%) |
| 16 and 17 Years | 0 (0.0%) | 0 (0.0%) |
| 18 to 24 Years | 0 (0.0%) | 0 (0.0%) |
| 25 to 34 Years | 0 (0.0%) | 33 (44.0%) |
| 35 to 44 Years | 1 (2.4%) | 4 (7.8%) |
| 45 to 54 Years | 9 (23.1%) | 3 (3.9%) |
| 55 to 64 Years | 4 (8.3%) | 3 (4.5%) |
| 65 to 74 Years | 0 (0.0%) | 0 (0.0%) |
| 75 Years and over | 0 (0.0%) | 0 (0.0%) |
| Total | 21 (5.0%) | 69 (12.8%) |
Income Above Poverty by Sex and Age in North Webster
According to the poverty statistics in North Webster, males aged under 5 years and females aged 15 years are the age groups that are most secure financially, with 100.0% of males and 100.0% of females in these age groups living above the poverty line.
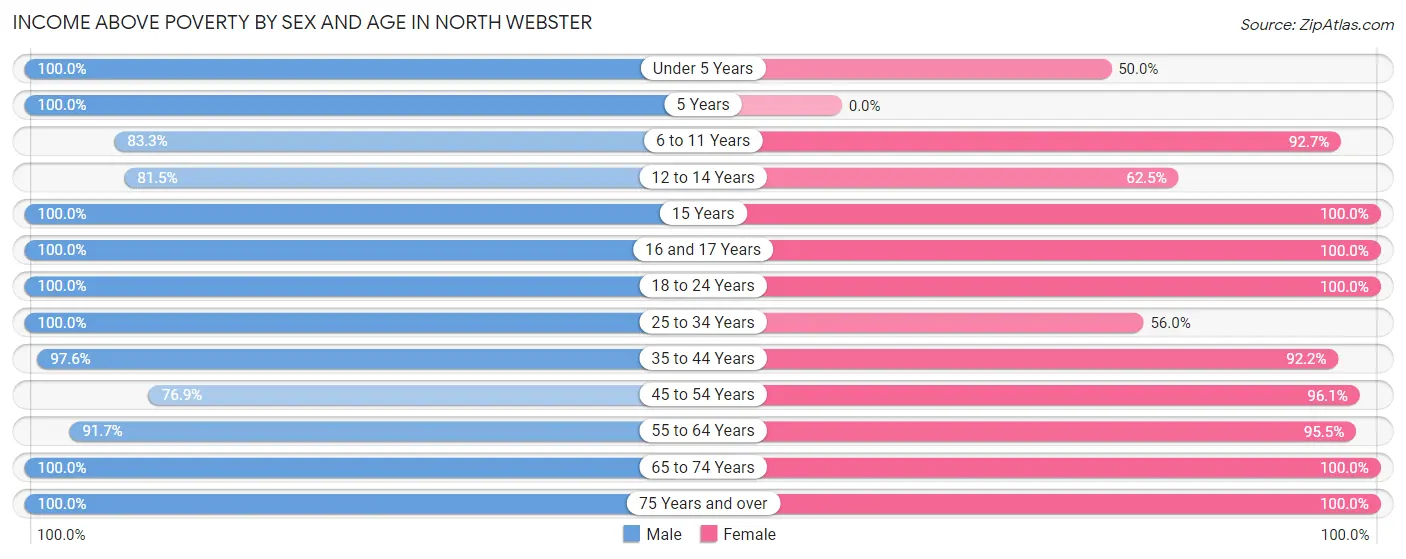
| Age Bracket | Male | Female |
| Under 5 Years | 32 (100.0%) | 20 (50.0%) |
| 5 Years | 5 (100.0%) | 0 (0.0%) |
| 6 to 11 Years | 10 (83.3%) | 38 (92.7%) |
| 12 to 14 Years | 22 (81.5%) | 5 (62.5%) |
| 15 Years | 17 (100.0%) | 12 (100.0%) |
| 16 and 17 Years | 13 (100.0%) | 15 (100.0%) |
| 18 to 24 Years | 31 (100.0%) | 29 (100.0%) |
| 25 to 34 Years | 42 (100.0%) | 42 (56.0%) |
| 35 to 44 Years | 41 (97.6%) | 47 (92.2%) |
| 45 to 54 Years | 30 (76.9%) | 74 (96.1%) |
| 55 to 64 Years | 44 (91.7%) | 63 (95.5%) |
| 65 to 74 Years | 84 (100.0%) | 65 (100.0%) |
| 75 Years and over | 31 (100.0%) | 60 (100.0%) |
| Total | 402 (95.0%) | 470 (87.2%) |
Income Below Poverty Among Married-Couple Families in North Webster
The poverty statistics for married-couple families in North Webster show that 6.2% or 10 of the total 162 families live below the poverty line. Families with 1 or 2 children have the highest poverty rate of 23.7%, comprising of 9 families. On the other hand, families with no children have the lowest poverty rate of 0.0%, which includes 0 families.
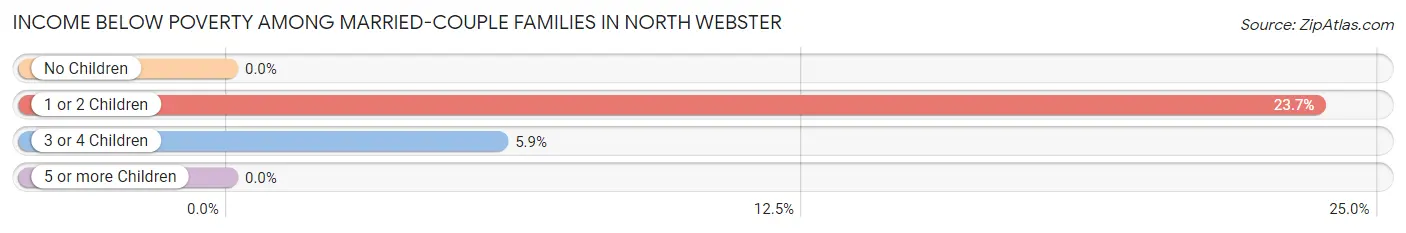
| Children | Above Poverty | Below Poverty |
| No Children | 107 (100.0%) | 0 (0.0%) |
| 1 or 2 Children | 29 (76.3%) | 9 (23.7%) |
| 3 or 4 Children | 16 (94.1%) | 1 (5.9%) |
| 5 or more Children | 0 (0.0%) | 0 (0.0%) |
| Total | 152 (93.8%) | 10 (6.2%) |
Income Below Poverty Among Single-Parent Households in North Webster
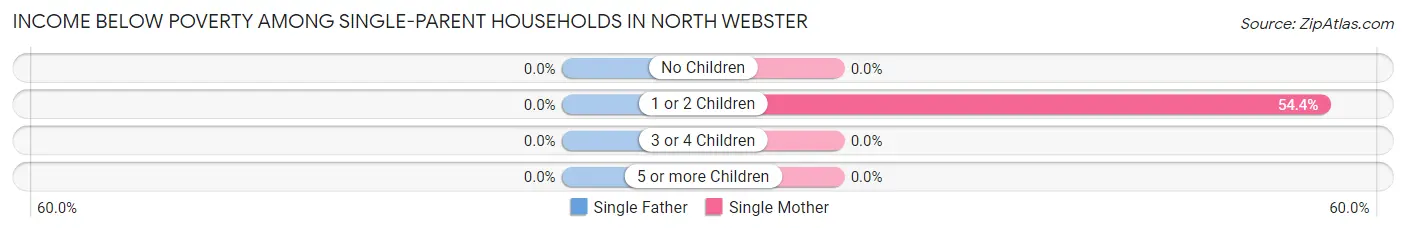
| Children | Single Father | Single Mother |
| No Children | 0 (0.0%) | 0 (0.0%) |
| 1 or 2 Children | 0 (0.0%) | 25 (54.3%) |
| 3 or 4 Children | 0 (0.0%) | 0 (0.0%) |
| 5 or more Children | 0 (0.0%) | 0 (0.0%) |
| Total | 0 (0.0%) | 25 (37.9%) |
Income Below Poverty Among Married-Couple vs Single-Parent Households in North Webster
The poverty data for North Webster shows that 10 of the married-couple family households (6.2%) and 25 of the single-parent households (27.8%) are living below the poverty level. Within the married-couple family households, those with 1 or 2 children have the highest poverty rate, with 9 households (23.7%) falling below the poverty line. Among the single-parent households, those with 1 or 2 children have the highest poverty rate, with 25 household (41.0%) living below poverty.
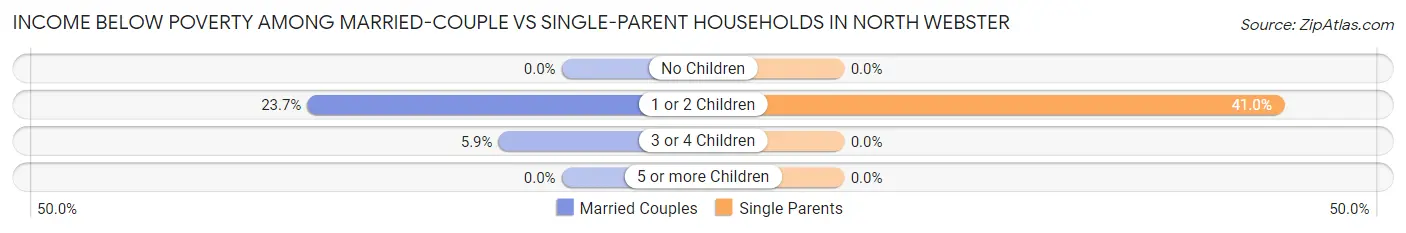
| Children | Married-Couple Families | Single-Parent Households |
| No Children | 0 (0.0%) | 0 (0.0%) |
| 1 or 2 Children | 9 (23.7%) | 25 (41.0%) |
| 3 or 4 Children | 1 (5.9%) | 0 (0.0%) |
| 5 or more Children | 0 (0.0%) | 0 (0.0%) |
| Total | 10 (6.2%) | 25 (27.8%) |
Race in North Webster
The most populous races in North Webster are White / Caucasian (940 | 97.7%), Two or more Races (18 | 1.9%), and Hispanic or Latino (5 | 0.5%).
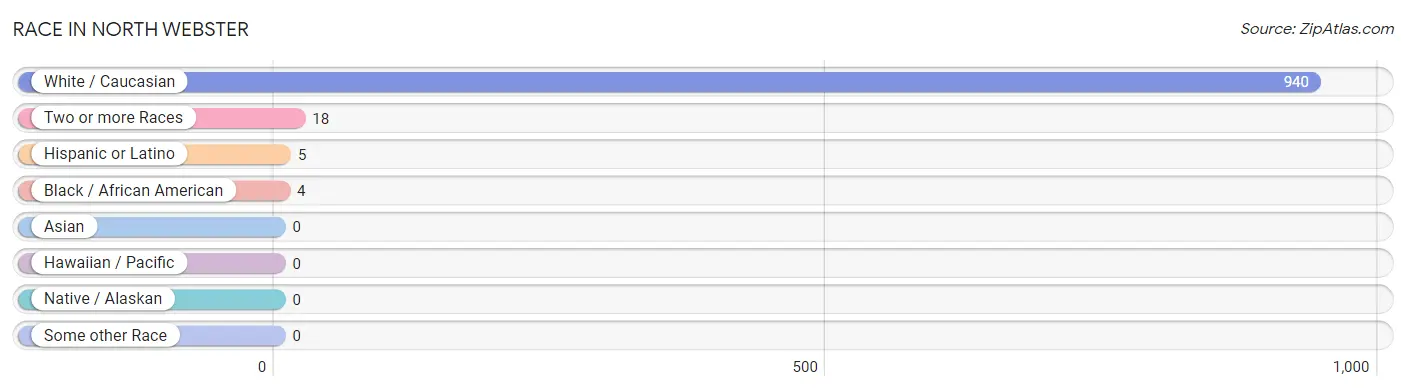
| Race | # Population | % Population |
| Asian | 0 | 0.0% |
| Black / African American | 4 | 0.4% |
| Hawaiian / Pacific | 0 | 0.0% |
| Hispanic or Latino | 5 | 0.5% |
| Native / Alaskan | 0 | 0.0% |
| White / Caucasian | 940 | 97.7% |
| Two or more Races | 18 | 1.9% |
| Some other Race | 0 | 0.0% |
| Total | 962 | 100.0% |
Ancestry in North Webster
The most populous ancestries reported in North Webster are German (210 | 21.8%), Irish (156 | 16.2%), English (127 | 13.2%), Italian (57 | 5.9%), and Dutch (48 | 5.0%), together accounting for 62.2% of all North Webster residents.
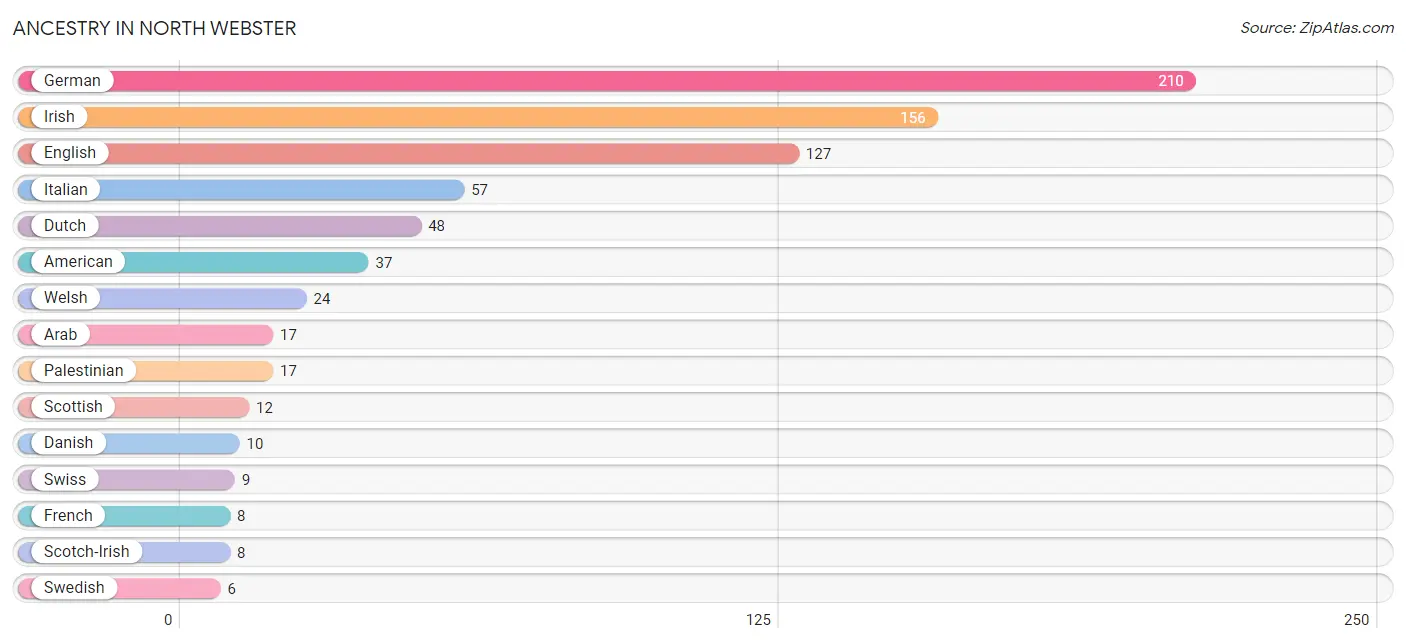
| Ancestry | # Population | % Population |
| African | 4 | 0.4% |
| American | 37 | 3.8% |
| Arab | 17 | 1.8% |
| Danish | 10 | 1.0% |
| Dutch | 48 | 5.0% |
| English | 127 | 13.2% |
| French | 8 | 0.8% |
| French Canadian | 5 | 0.5% |
| German | 210 | 21.8% |
| Irish | 156 | 16.2% |
| Italian | 57 | 5.9% |
| Korean | 1 | 0.1% |
| Mexican | 5 | 0.5% |
| Palestinian | 17 | 1.8% |
| Polish | 4 | 0.4% |
| Scotch-Irish | 8 | 0.8% |
| Scottish | 12 | 1.3% |
| Subsaharan African | 4 | 0.4% |
| Swedish | 6 | 0.6% |
| Swiss | 9 | 0.9% |
| Welsh | 24 | 2.5% | View All 21 Rows |
Immigrants in North Webster
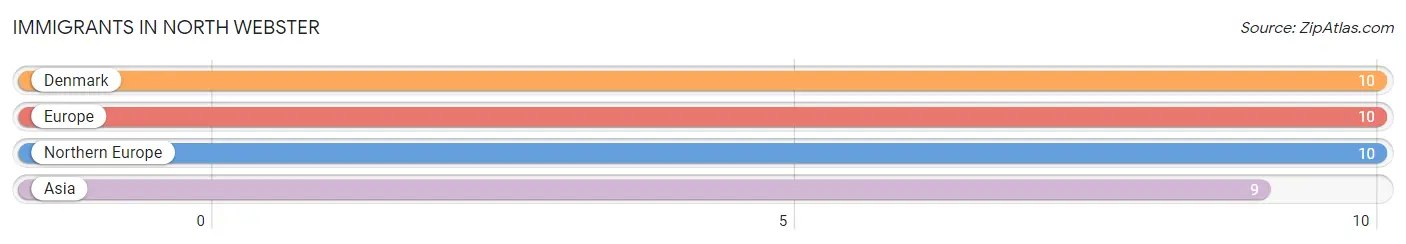
The most numerous immigrant groups reported in North Webster came from Denmark (10 | 1.0%), Europe (10 | 1.0%), Northern Europe (10 | 1.0%), and Asia (9 | 0.9%), together accounting for 4.1% of all North Webster residents.
| Immigration Origin | # Population | % Population |
| Asia | 9 | 0.9% |
| Denmark | 10 | 1.0% |
| Europe | 10 | 1.0% |
| Northern Europe | 10 | 1.0% | View All 4 Rows |
Sex and Age in North Webster
Sex and Age in North Webster
The most populous age groups in North Webster are 65 to 69 Years (46 | 10.9%) for men and 25 to 29 Years (60 | 11.1%) for women.
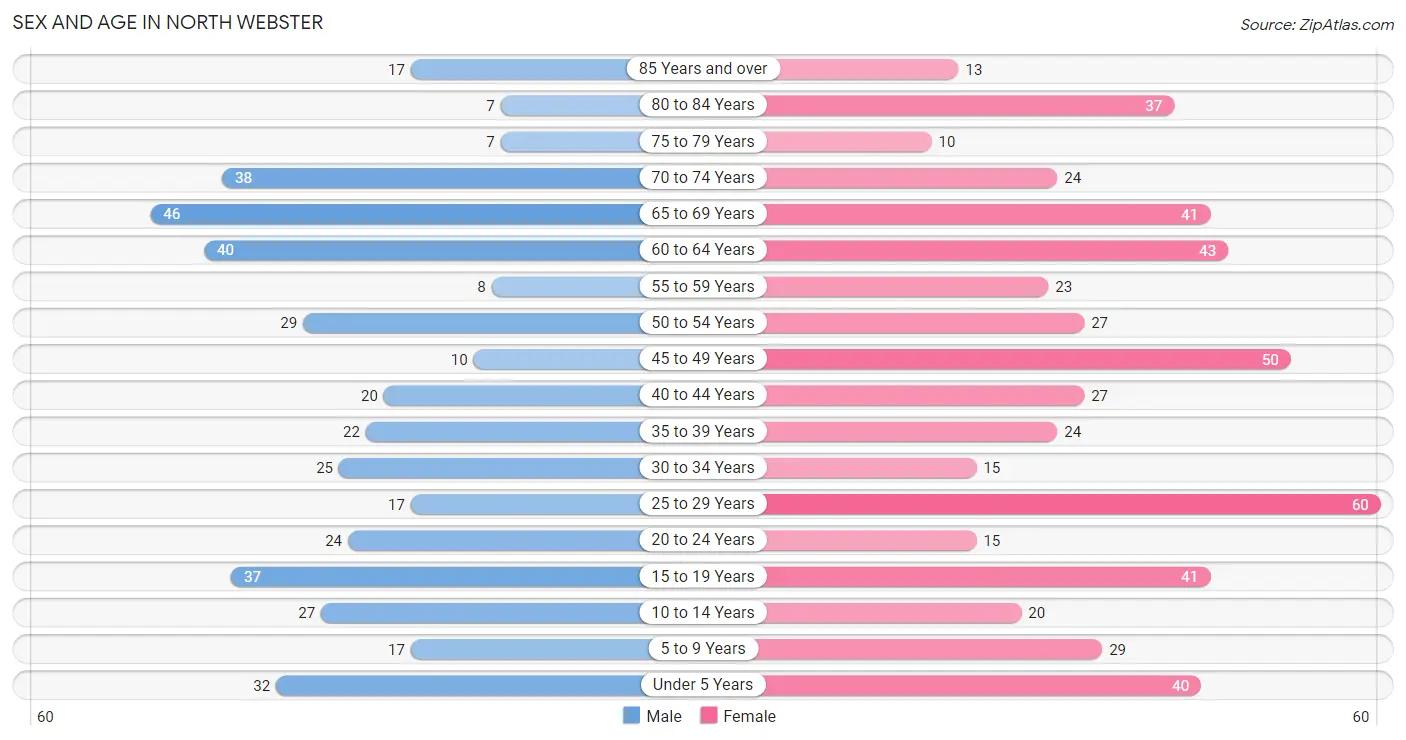
| Age Bracket | Male | Female |
| Under 5 Years | 32 (7.6%) | 40 (7.4%) |
| 5 to 9 Years | 17 (4.0%) | 29 (5.4%) |
| 10 to 14 Years | 27 (6.4%) | 20 (3.7%) |
| 15 to 19 Years | 37 (8.7%) | 41 (7.6%) |
| 20 to 24 Years | 24 (5.7%) | 15 (2.8%) |
| 25 to 29 Years | 17 (4.0%) | 60 (11.1%) |
| 30 to 34 Years | 25 (5.9%) | 15 (2.8%) |
| 35 to 39 Years | 22 (5.2%) | 24 (4.4%) |
| 40 to 44 Years | 20 (4.7%) | 27 (5.0%) |
| 45 to 49 Years | 10 (2.4%) | 50 (9.3%) |
| 50 to 54 Years | 29 (6.9%) | 27 (5.0%) |
| 55 to 59 Years | 8 (1.9%) | 23 (4.3%) |
| 60 to 64 Years | 40 (9.5%) | 43 (8.0%) |
| 65 to 69 Years | 46 (10.9%) | 41 (7.6%) |
| 70 to 74 Years | 38 (9.0%) | 24 (4.4%) |
| 75 to 79 Years | 7 (1.7%) | 10 (1.9%) |
| 80 to 84 Years | 7 (1.7%) | 37 (6.9%) |
| 85 Years and over | 17 (4.0%) | 13 (2.4%) |
| Total | 423 (100.0%) | 539 (100.0%) |
Families and Households in North Webster
Median Family Size in North Webster
The median family size in North Webster is 2.69 persons per family, with married-couple families (162 | 64.3%) accounting for the largest median family size of 2.83 persons per family. On the other hand, single female/mother families (66 | 26.2%) represent the smallest median family size with 2.33 persons per family.
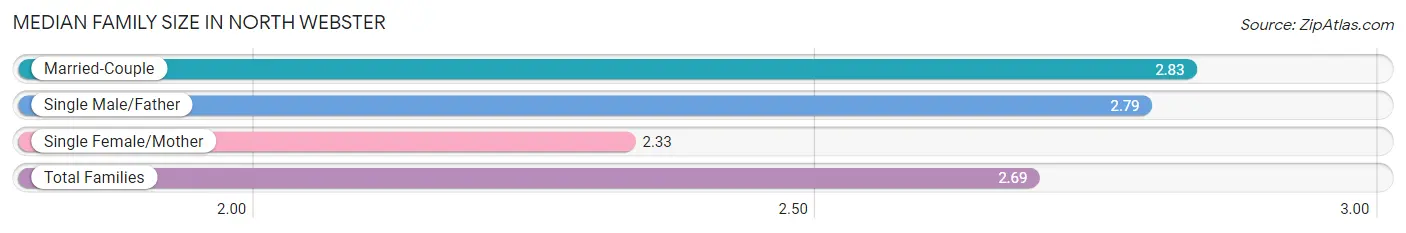
| Family Type | # Families | Family Size |
| Married-Couple | 162 (64.3%) | 2.83 |
| Single Male/Father | 24 (9.5%) | 2.79 |
| Single Female/Mother | 66 (26.2%) | 2.33 |
| Total Families | 252 (100.0%) | 2.69 |
Median Household Size in North Webster
The median household size in North Webster is 1.96 persons per household, with single male/father households (24 | 4.9%) accounting for the largest median household size of 3.25 persons per household. non-family households (240 | 48.8%) represent the smallest median household size with 1.13 persons per household.
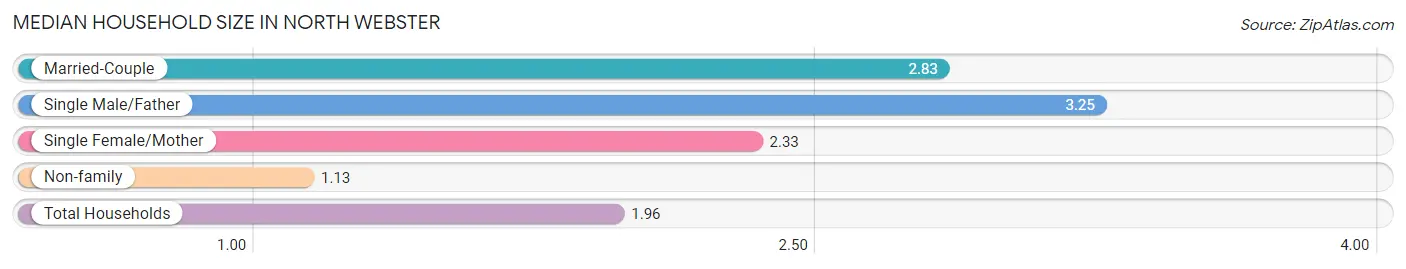
| Household Type | # Households | Household Size |
| Married-Couple | 162 (32.9%) | 2.83 |
| Single Male/Father | 24 (4.9%) | 3.25 |
| Single Female/Mother | 66 (13.4%) | 2.33 |
| Non-family | 240 (48.8%) | 1.13 |
| Total Households | 492 (100.0%) | 1.96 |
Household Size by Marriage Status in North Webster
Out of a total of 492 households in North Webster, 252 (51.2%) are family households, while 240 (48.8%) are nonfamily households. The most numerous type of family households are 2-person households, comprising 168, and the most common type of nonfamily households are 1-person households, comprising 190.
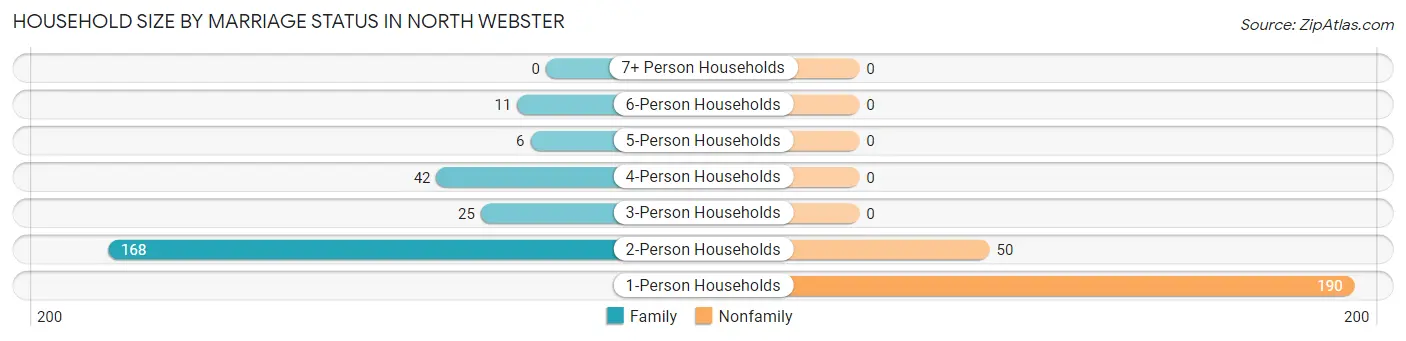
| Household Size | Family Households | Nonfamily Households |
| 1-Person Households | - | 190 (38.6%) |
| 2-Person Households | 168 (34.2%) | 50 (10.2%) |
| 3-Person Households | 25 (5.1%) | 0 (0.0%) |
| 4-Person Households | 42 (8.5%) | 0 (0.0%) |
| 5-Person Households | 6 (1.2%) | 0 (0.0%) |
| 6-Person Households | 11 (2.2%) | 0 (0.0%) |
| 7+ Person Households | 0 (0.0%) | 0 (0.0%) |
| Total | 252 (51.2%) | 240 (48.8%) |
Female Fertility in North Webster
Fertility by Age in North Webster
Average fertility rate in North Webster is 16.0 births per 1,000 women. Women in the age bracket of 35 to 50 years have the highest fertility rate with 33.0 births per 1,000 women. Women in the age bracket of 35 to 50 years acount for 100.0% of all women with births.
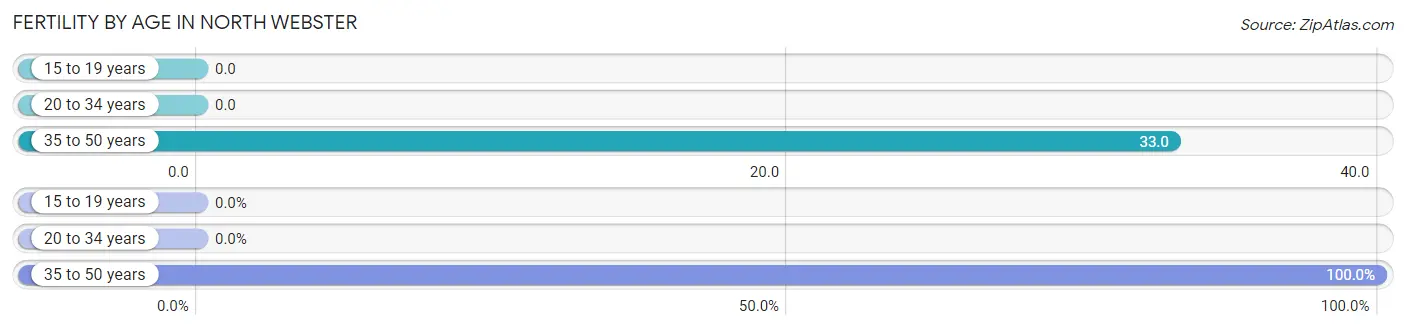
| Age Bracket | Women with Births | Births / 1,000 Women |
| 15 to 19 years | 0 (0.0%) | 0.0 |
| 20 to 34 years | 0 (0.0%) | 0.0 |
| 35 to 50 years | 4 (100.0%) | 33.0 |
| Total | 4 (100.0%) | 16.0 |
Fertility by Age by Marriage Status in North Webster
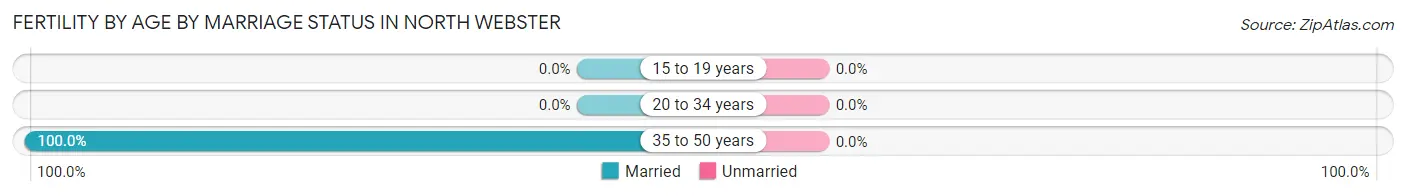
| Age Bracket | Married | Unmarried |
| 15 to 19 years | 0 (0.0%) | 0 (0.0%) |
| 20 to 34 years | 0 (0.0%) | 0 (0.0%) |
| 35 to 50 years | 4 (100.0%) | 0 (0.0%) |
| Total | 4 (100.0%) | 0 (0.0%) |
Fertility by Education in North Webster
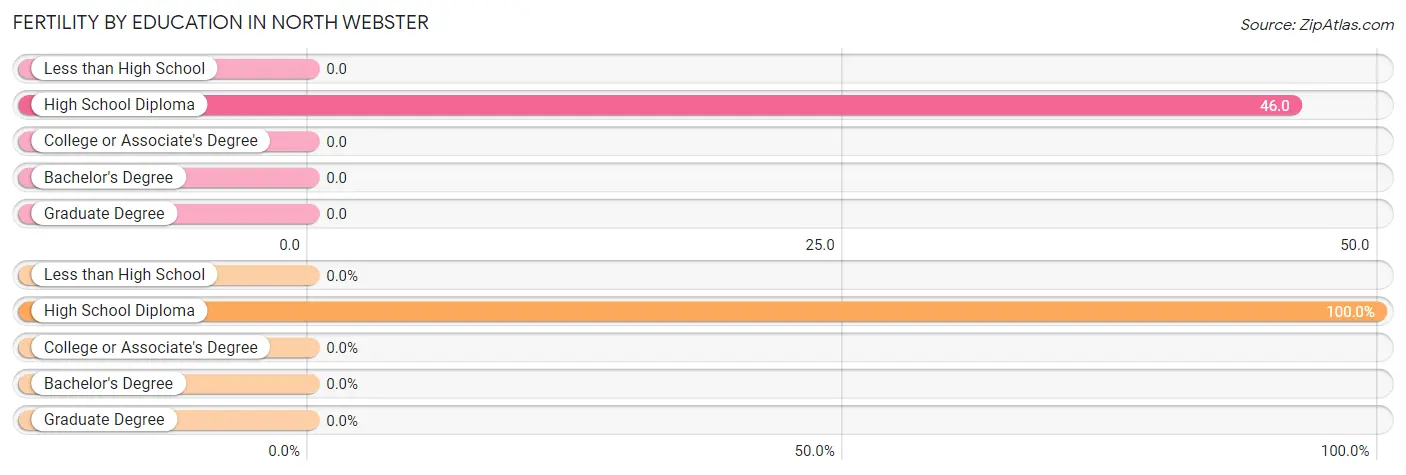
| Educational Attainment | Women with Births | Births / 1,000 Women |
| Less than High School | 0 (0.0%) | 0.0 |
| High School Diploma | 4 (100.0%) | 46.0 |
| College or Associate's Degree | 0 (0.0%) | 0.0 |
| Bachelor's Degree | 0 (0.0%) | 0.0 |
| Graduate Degree | 0 (0.0%) | 0.0 |
| Total | 4 (100.0%) | 16.0 |
Fertility by Education by Marriage Status in North Webster
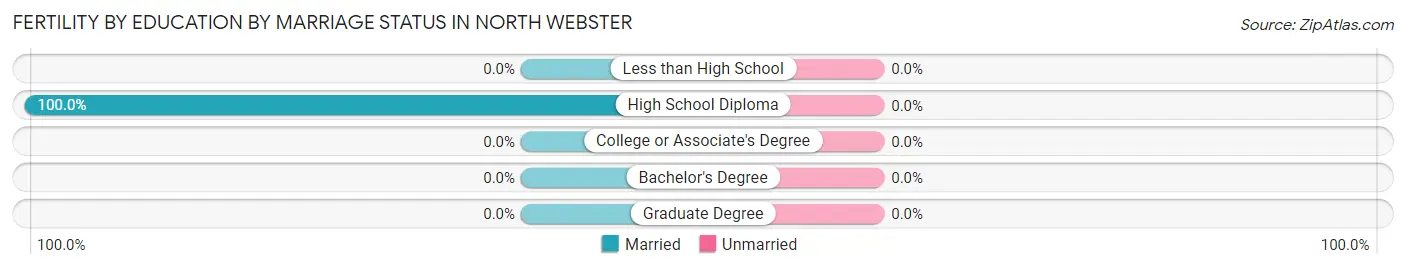
| Educational Attainment | Married | Unmarried |
| Less than High School | 0 (0.0%) | 0 (0.0%) |
| High School Diploma | 4 (100.0%) | 0 (0.0%) |
| College or Associate's Degree | 0 (0.0%) | 0 (0.0%) |
| Bachelor's Degree | 0 (0.0%) | 0 (0.0%) |
| Graduate Degree | 0 (0.0%) | 0 (0.0%) |
| Total | 4 (100.0%) | 0 (0.0%) |
Employment Characteristics in North Webster
Employment by Class of Employer in North Webster
Among the 469 employed individuals in North Webster, private company employees (327 | 69.7%), not-for-profit organizations (57 | 12.1%), and self-employed (not incorporated) (33 | 7.0%) make up the most common classes of employment.
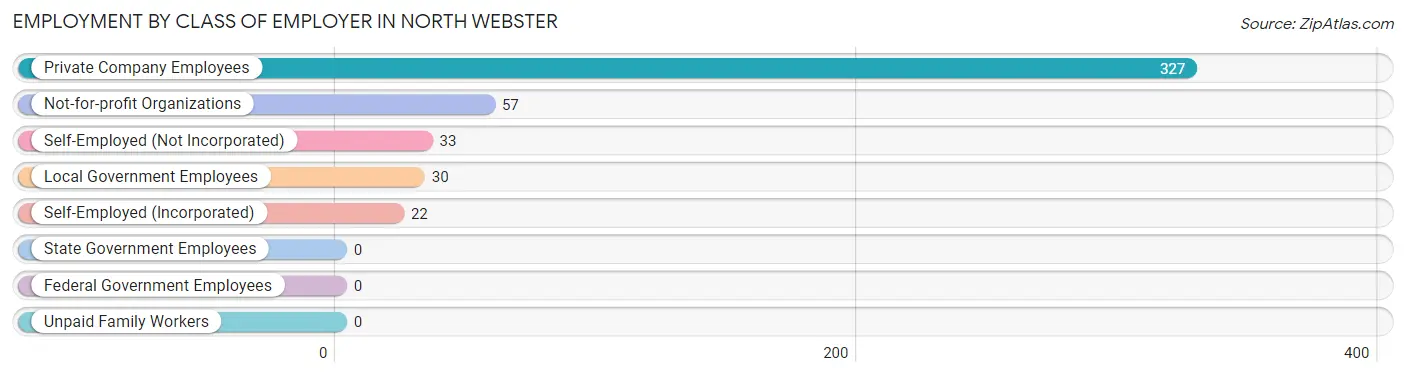
| Employer Class | # Employees | % Employees |
| Private Company Employees | 327 | 69.7% |
| Self-Employed (Incorporated) | 22 | 4.7% |
| Self-Employed (Not Incorporated) | 33 | 7.0% |
| Not-for-profit Organizations | 57 | 12.1% |
| Local Government Employees | 30 | 6.4% |
| State Government Employees | 0 | 0.0% |
| Federal Government Employees | 0 | 0.0% |
| Unpaid Family Workers | 0 | 0.0% |
| Total | 469 | 100.0% |
Employment Status by Age in North Webster
According to the labor force statistics for North Webster, out of the total population over 16 years of age (768), 63.5% or 488 individuals are in the labor force, with 1.8% or 9 of them unemployed. The age group with the highest labor force participation rate is 20 to 24 years, with 100.0% or 39 individuals in the labor force. Within the labor force, the 60 to 64 years age range has the highest percentage of unemployed individuals, with 5.3% or 3 of them being unemployed.
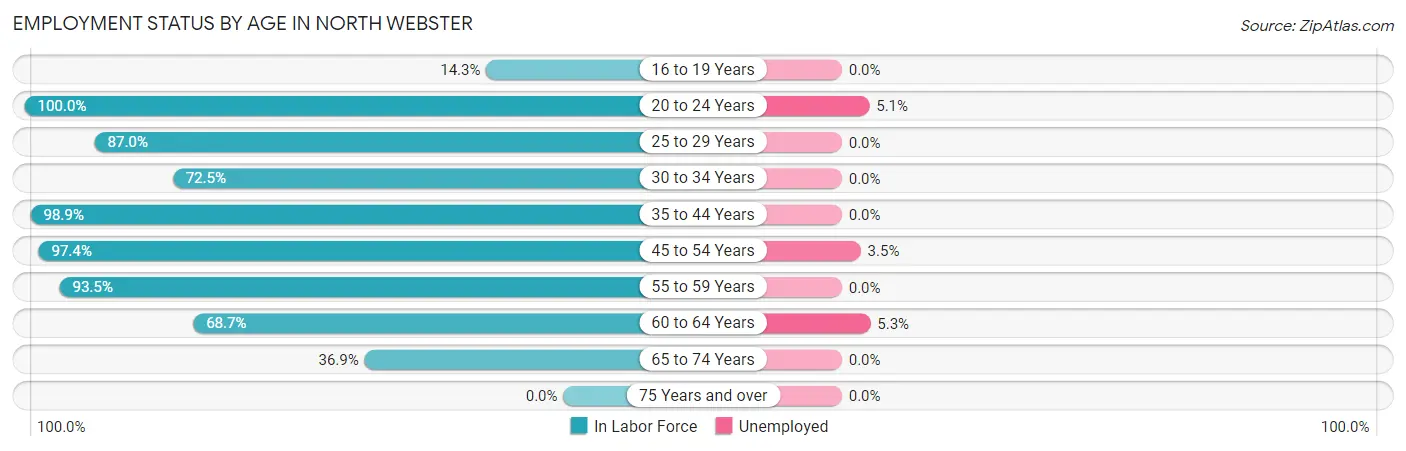
| Age Bracket | In Labor Force | Unemployed |
| 16 to 19 Years | 7 (14.3%) | 0 (0.0%) |
| 20 to 24 Years | 39 (100.0%) | 2 (5.1%) |
| 25 to 29 Years | 67 (87.0%) | 0 (0.0%) |
| 30 to 34 Years | 29 (72.5%) | 0 (0.0%) |
| 35 to 44 Years | 92 (98.9%) | 0 (0.0%) |
| 45 to 54 Years | 113 (97.4%) | 4 (3.5%) |
| 55 to 59 Years | 29 (93.5%) | 0 (0.0%) |
| 60 to 64 Years | 57 (68.7%) | 3 (5.3%) |
| 65 to 74 Years | 55 (36.9%) | 0 (0.0%) |
| 75 Years and over | 0 (0.0%) | 0 (0.0%) |
| Total | 488 (63.5%) | 9 (1.8%) |
Employment Status by Educational Attainment in North Webster
According to labor force statistics for North Webster, 88.0% of individuals (387) out of the total population between 25 and 64 years of age (440) are in the labor force, with 1.8% or 7 of them being unemployed. The group with the highest labor force participation rate are those with the educational attainment of high school diploma, with 93.9% or 168 individuals in the labor force. Within the labor force, individuals with college / associate degree education have the highest percentage of unemployment, with 4.5% or 7 of them being unemployed.
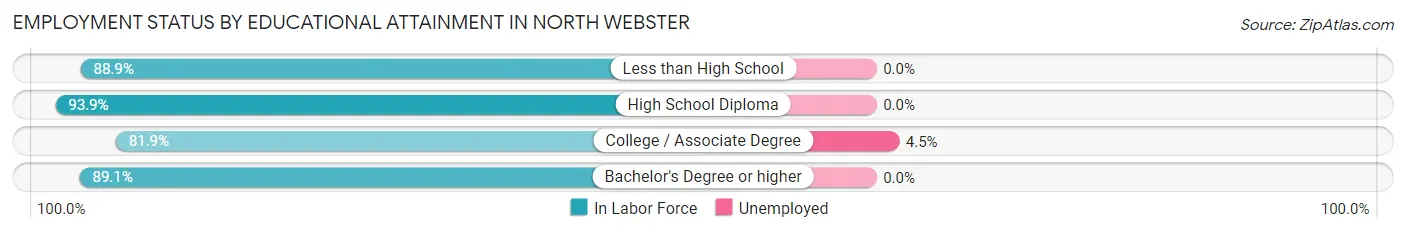
| Educational Attainment | In Labor Force | Unemployed |
| Less than High School | 8 (88.9%) | 0 (0.0%) |
| High School Diploma | 168 (93.9%) | 0 (0.0%) |
| College / Associate Degree | 154 (81.9%) | 8 (4.5%) |
| Bachelor's Degree or higher | 57 (89.1%) | 0 (0.0%) |
| Total | 387 (88.0%) | 8 (1.8%) |
Employment Occupations by Sex in North Webster
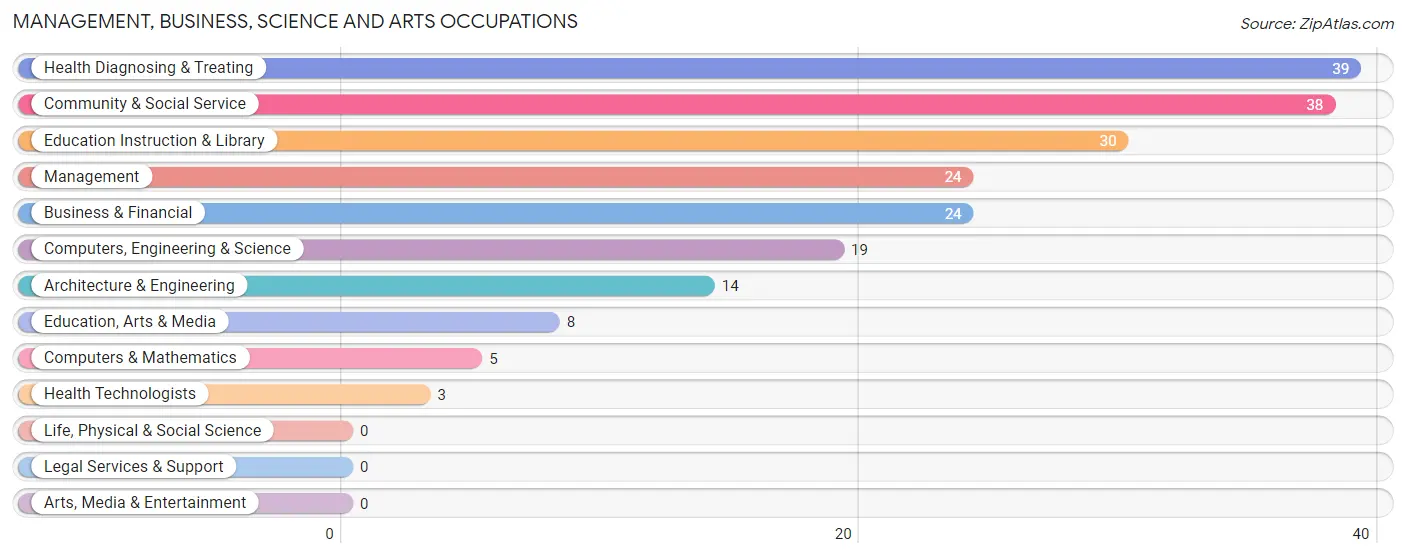
Management, Business, Science and Arts Occupations
The most common Management, Business, Science and Arts occupations in North Webster are Health Diagnosing & Treating (39 | 8.1%), Community & Social Service (38 | 7.9%), Education Instruction & Library (30 | 6.3%), Management (24 | 5.0%), and Business & Financial (24 | 5.0%).
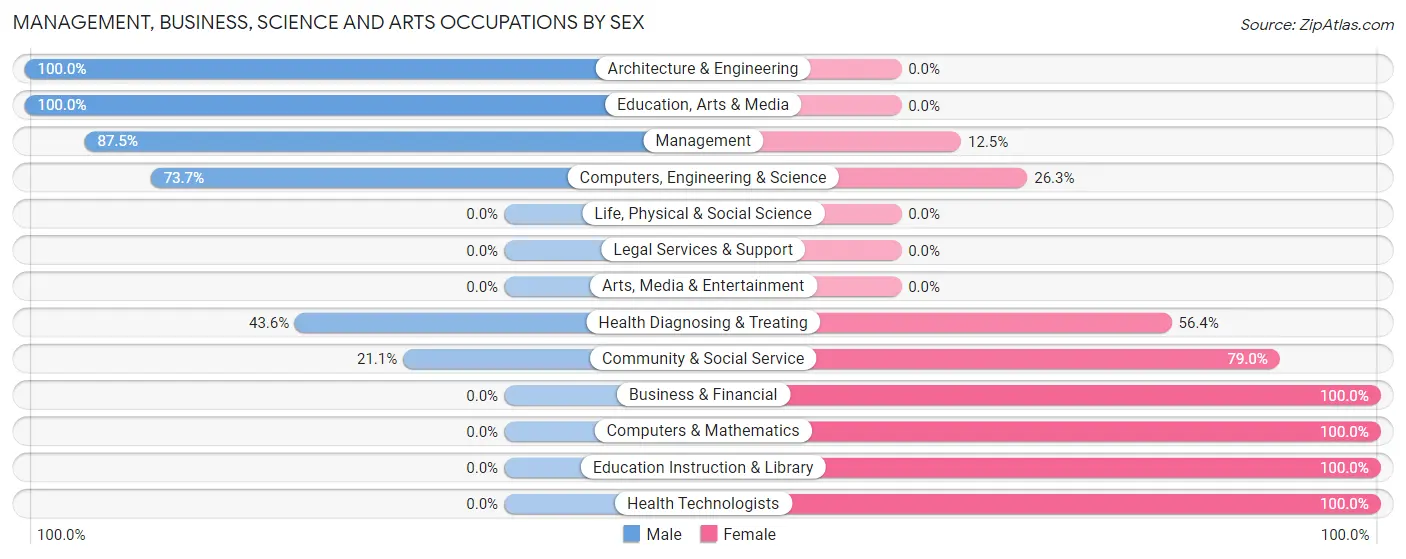
Management, Business, Science and Arts Occupations by Sex
Within the Management, Business, Science and Arts occupations in North Webster, the most male-oriented occupations are Architecture & Engineering (100.0%), Education, Arts & Media (100.0%), and Management (87.5%), while the most female-oriented occupations are Business & Financial (100.0%), Computers & Mathematics (100.0%), and Education Instruction & Library (100.0%).
| Occupation | Male | Female |
| Management | 21 (87.5%) | 3 (12.5%) |
| Business & Financial | 0 (0.0%) | 24 (100.0%) |
| Computers, Engineering & Science | 14 (73.7%) | 5 (26.3%) |
| Computers & Mathematics | 0 (0.0%) | 5 (100.0%) |
| Architecture & Engineering | 14 (100.0%) | 0 (0.0%) |
| Life, Physical & Social Science | 0 (0.0%) | 0 (0.0%) |
| Community & Social Service | 8 (21.0%) | 30 (78.9%) |
| Education, Arts & Media | 8 (100.0%) | 0 (0.0%) |
| Legal Services & Support | 0 (0.0%) | 0 (0.0%) |
| Education Instruction & Library | 0 (0.0%) | 30 (100.0%) |
| Arts, Media & Entertainment | 0 (0.0%) | 0 (0.0%) |
| Health Diagnosing & Treating | 17 (43.6%) | 22 (56.4%) |
| Health Technologists | 0 (0.0%) | 3 (100.0%) |
| Total (Category) | 60 (41.7%) | 84 (58.3%) |
| Total (Overall) | 197 (41.1%) | 282 (58.9%) |
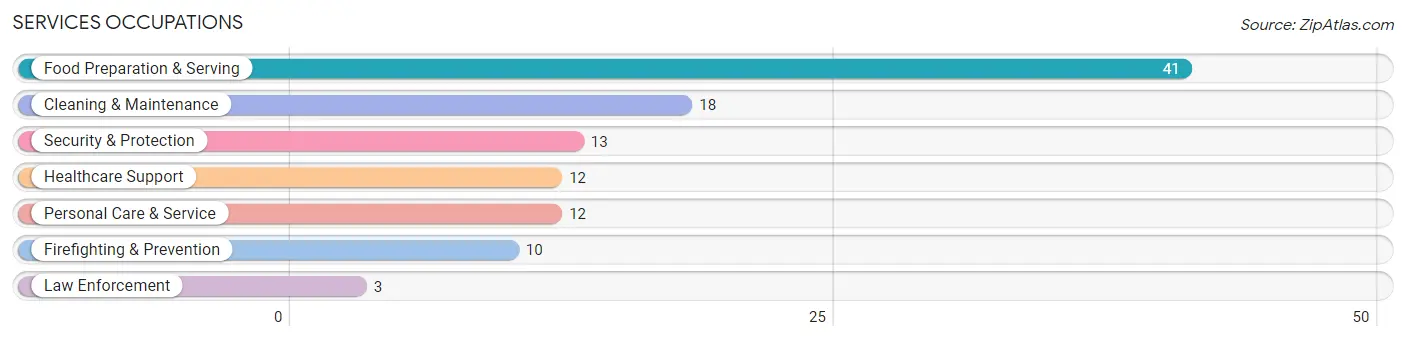
Services Occupations
The most common Services occupations in North Webster are Food Preparation & Serving (41 | 8.6%), Cleaning & Maintenance (18 | 3.8%), Security & Protection (13 | 2.7%), Healthcare Support (12 | 2.5%), and Personal Care & Service (12 | 2.5%).
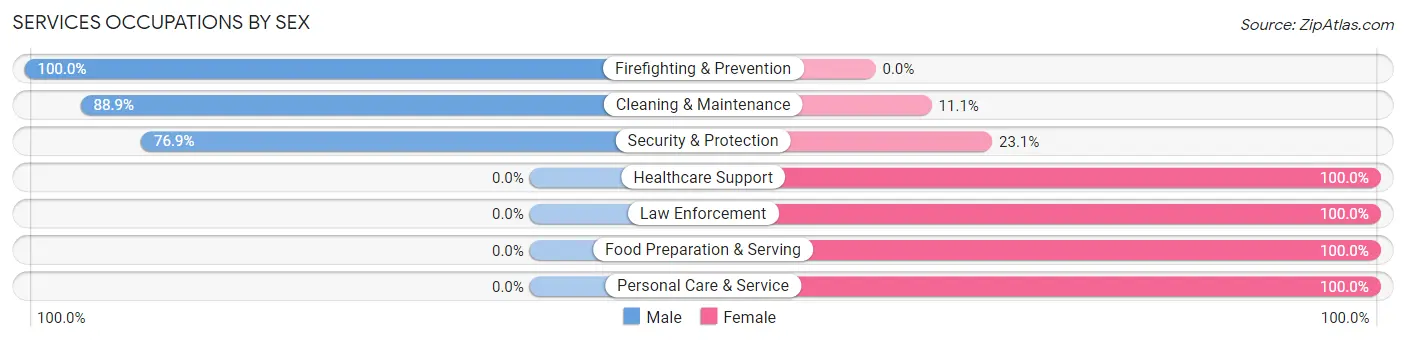
Services Occupations by Sex
Within the Services occupations in North Webster, the most male-oriented occupations are Firefighting & Prevention (100.0%), Cleaning & Maintenance (88.9%), and Security & Protection (76.9%), while the most female-oriented occupations are Healthcare Support (100.0%), Law Enforcement (100.0%), and Food Preparation & Serving (100.0%).
| Occupation | Male | Female |
| Healthcare Support | 0 (0.0%) | 12 (100.0%) |
| Security & Protection | 10 (76.9%) | 3 (23.1%) |
| Firefighting & Prevention | 10 (100.0%) | 0 (0.0%) |
| Law Enforcement | 0 (0.0%) | 3 (100.0%) |
| Food Preparation & Serving | 0 (0.0%) | 41 (100.0%) |
| Cleaning & Maintenance | 16 (88.9%) | 2 (11.1%) |
| Personal Care & Service | 0 (0.0%) | 12 (100.0%) |
| Total (Category) | 26 (27.1%) | 70 (72.9%) |
| Total (Overall) | 197 (41.1%) | 282 (58.9%) |
Sales and Office Occupations
The most common Sales and Office occupations in North Webster are Office & Administration (69 | 14.4%), and Sales & Related (41 | 8.6%).
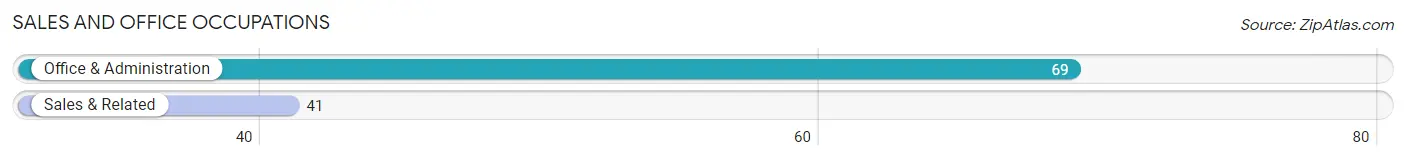
Sales and Office Occupations by Sex
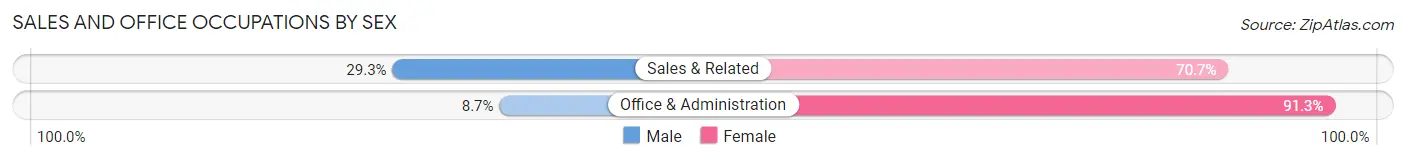
| Occupation | Male | Female |
| Sales & Related | 12 (29.3%) | 29 (70.7%) |
| Office & Administration | 6 (8.7%) | 63 (91.3%) |
| Total (Category) | 18 (16.4%) | 92 (83.6%) |
| Total (Overall) | 197 (41.1%) | 282 (58.9%) |
Natural Resources, Construction and Maintenance Occupations
The most common Natural Resources, Construction and Maintenance occupations in North Webster are Construction & Extraction (33 | 6.9%), and Installation, Maintenance & Repair (6 | 1.3%).
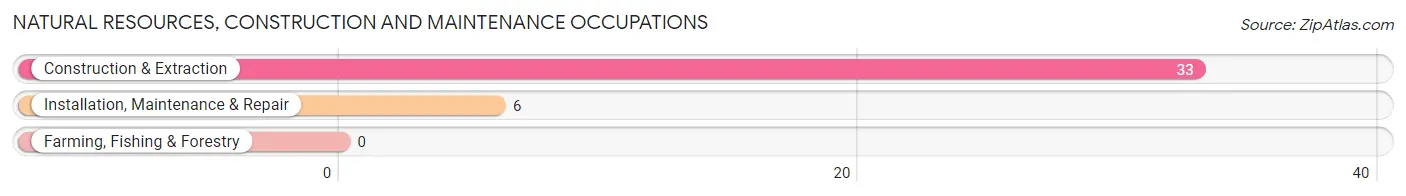
Natural Resources, Construction and Maintenance Occupations by Sex
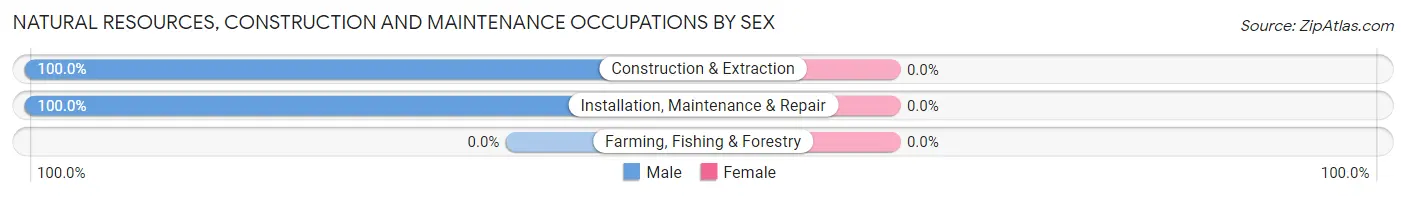
| Occupation | Male | Female |
| Farming, Fishing & Forestry | 0 (0.0%) | 0 (0.0%) |
| Construction & Extraction | 33 (100.0%) | 0 (0.0%) |
| Installation, Maintenance & Repair | 6 (100.0%) | 0 (0.0%) |
| Total (Category) | 39 (100.0%) | 0 (0.0%) |
| Total (Overall) | 197 (41.1%) | 282 (58.9%) |
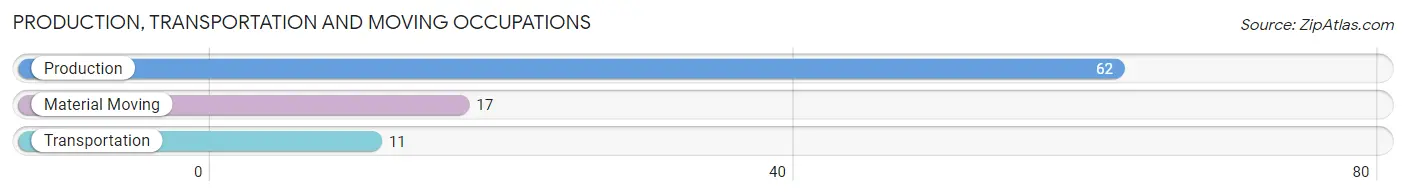
Production, Transportation and Moving Occupations
The most common Production, Transportation and Moving occupations in North Webster are Production (62 | 12.9%), Material Moving (17 | 3.5%), and Transportation (11 | 2.3%).
Production, Transportation and Moving Occupations by Sex
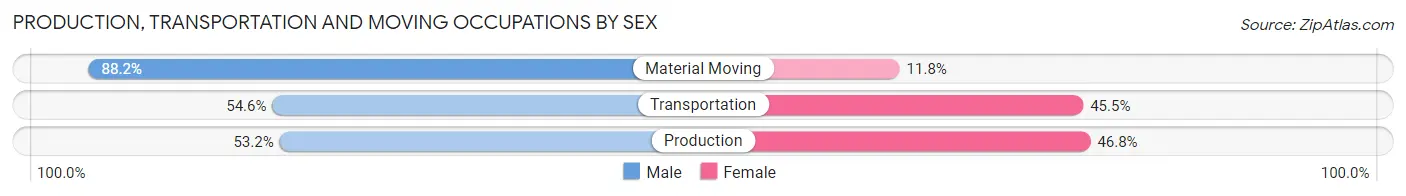
| Occupation | Male | Female |
| Production | 33 (53.2%) | 29 (46.8%) |
| Transportation | 6 (54.5%) | 5 (45.5%) |
| Material Moving | 15 (88.2%) | 2 (11.8%) |
| Total (Category) | 54 (60.0%) | 36 (40.0%) |
| Total (Overall) | 197 (41.1%) | 282 (58.9%) |
Employment Industries by Sex in North Webster
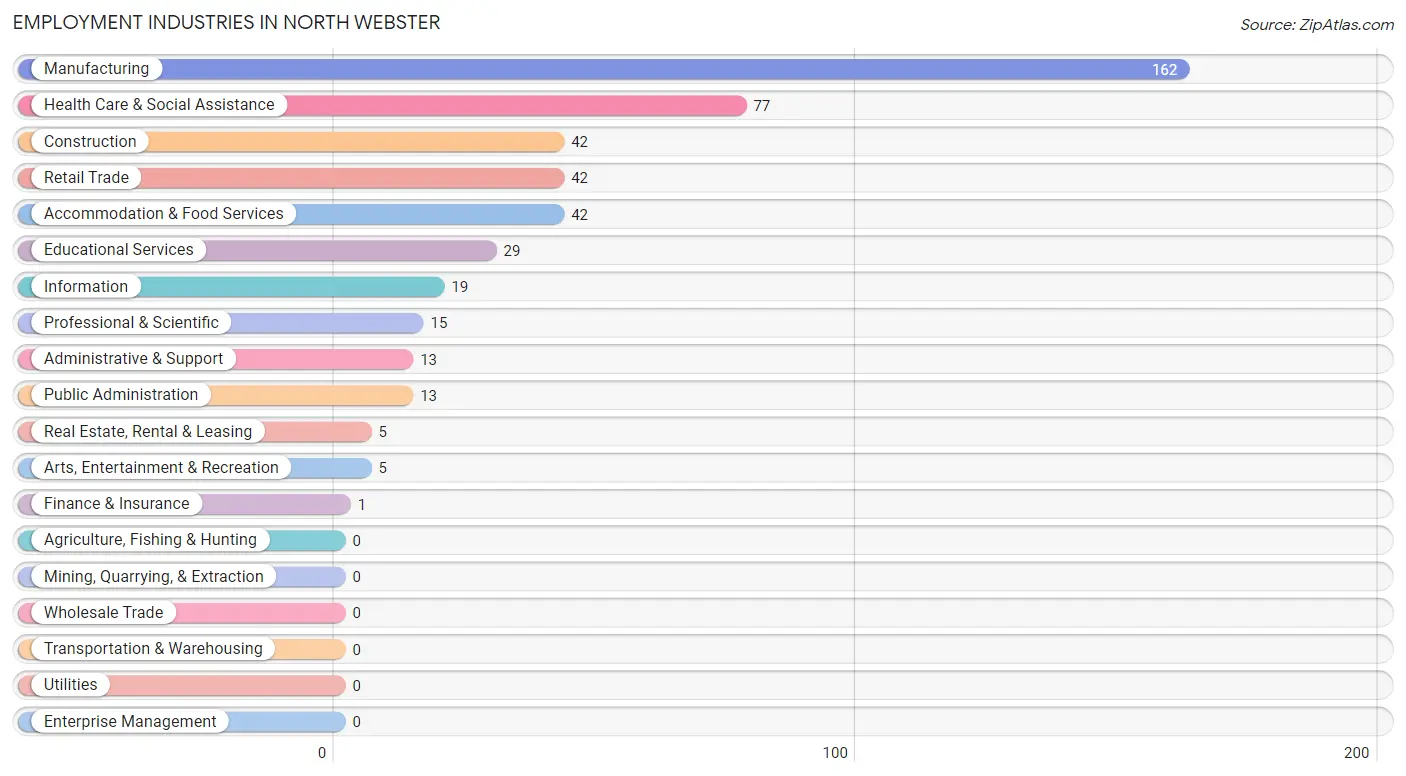
Employment Industries in North Webster
The major employment industries in North Webster include Manufacturing (162 | 33.8%), Health Care & Social Assistance (77 | 16.1%), Construction (42 | 8.8%), Retail Trade (42 | 8.8%), and Accommodation & Food Services (42 | 8.8%).
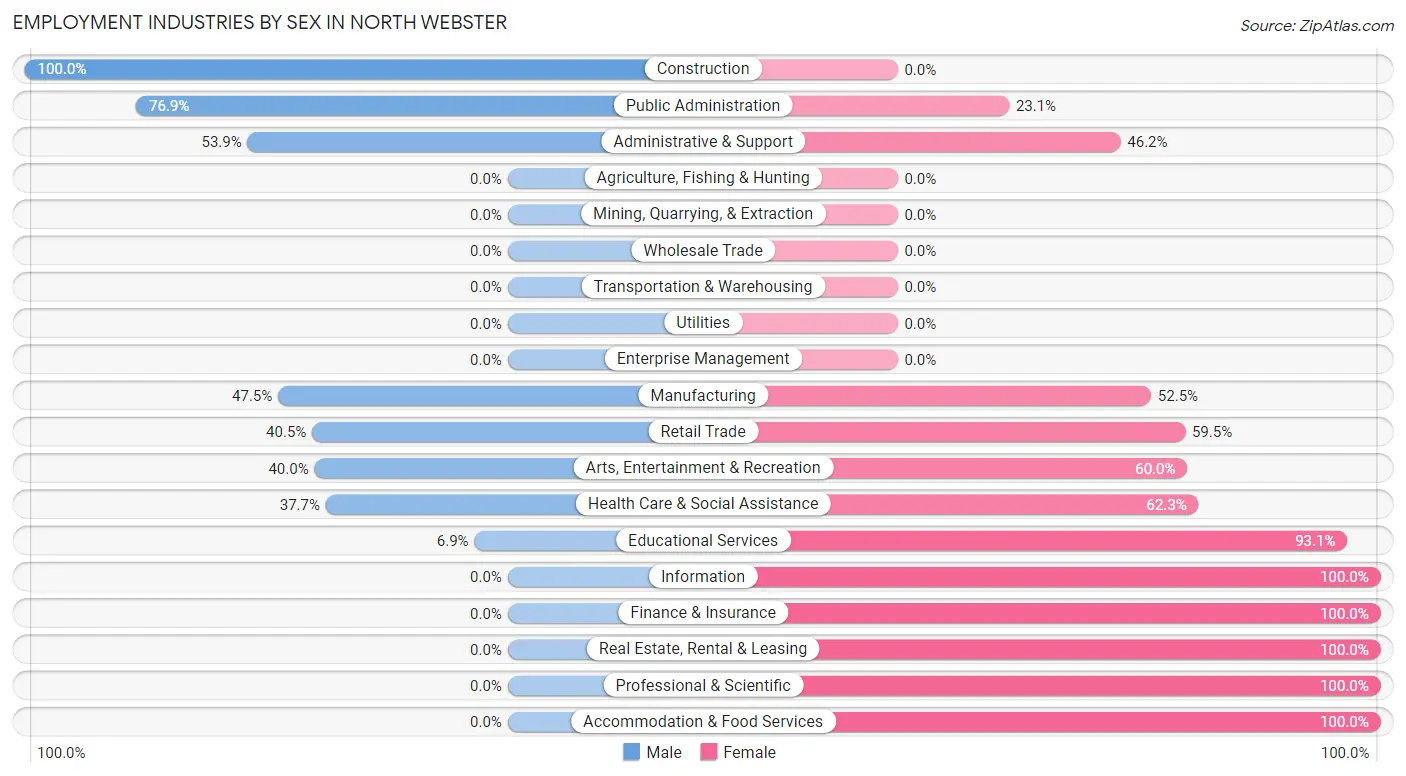
Employment Industries by Sex in North Webster
The North Webster industries that see more men than women are Construction (100.0%), Public Administration (76.9%), and Administrative & Support (53.8%), whereas the industries that tend to have a higher number of women are Information (100.0%), Finance & Insurance (100.0%), and Real Estate, Rental & Leasing (100.0%).
| Industry | Male | Female |
| Agriculture, Fishing & Hunting | 0 (0.0%) | 0 (0.0%) |
| Mining, Quarrying, & Extraction | 0 (0.0%) | 0 (0.0%) |
| Construction | 42 (100.0%) | 0 (0.0%) |
| Manufacturing | 77 (47.5%) | 85 (52.5%) |
| Wholesale Trade | 0 (0.0%) | 0 (0.0%) |
| Retail Trade | 17 (40.5%) | 25 (59.5%) |
| Transportation & Warehousing | 0 (0.0%) | 0 (0.0%) |
| Utilities | 0 (0.0%) | 0 (0.0%) |
| Information | 0 (0.0%) | 19 (100.0%) |
| Finance & Insurance | 0 (0.0%) | 1 (100.0%) |
| Real Estate, Rental & Leasing | 0 (0.0%) | 5 (100.0%) |
| Professional & Scientific | 0 (0.0%) | 15 (100.0%) |
| Enterprise Management | 0 (0.0%) | 0 (0.0%) |
| Administrative & Support | 7 (53.8%) | 6 (46.2%) |
| Educational Services | 2 (6.9%) | 27 (93.1%) |
| Health Care & Social Assistance | 29 (37.7%) | 48 (62.3%) |
| Arts, Entertainment & Recreation | 2 (40.0%) | 3 (60.0%) |
| Accommodation & Food Services | 0 (0.0%) | 42 (100.0%) |
| Public Administration | 10 (76.9%) | 3 (23.1%) |
| Total | 197 (41.1%) | 282 (58.9%) |
Education in North Webster
School Enrollment in North Webster
The most common levels of schooling among the 186 students in North Webster are high school (86 | 46.2%), elementary school (41 | 22.0%), and middle school (27 | 14.5%).
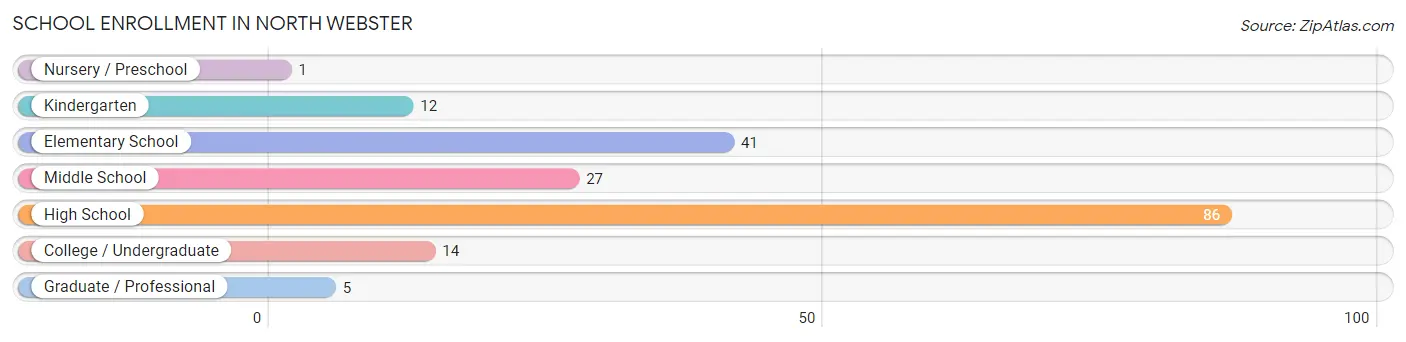
| School Level | # Students | % Students |
| Nursery / Preschool | 1 | 0.5% |
| Kindergarten | 12 | 6.5% |
| Elementary School | 41 | 22.0% |
| Middle School | 27 | 14.5% |
| High School | 86 | 46.2% |
| College / Undergraduate | 14 | 7.5% |
| Graduate / Professional | 5 | 2.7% |
| Total | 186 | 100.0% |
School Enrollment by Age by Funding Source in North Webster
Out of a total of 186 students who are enrolled in schools in North Webster, 7 (3.8%) attend a private institution, while the remaining 179 (96.2%) are enrolled in public schools. The age group of 3 to 4 year olds has the highest likelihood of being enrolled in private schools, with 1 (100.0% in the age bracket) enrolled. Conversely, the age group of 10 to 14 year olds has the lowest likelihood of being enrolled in a private school, with 47 (100.0% in the age bracket) attending a public institution.
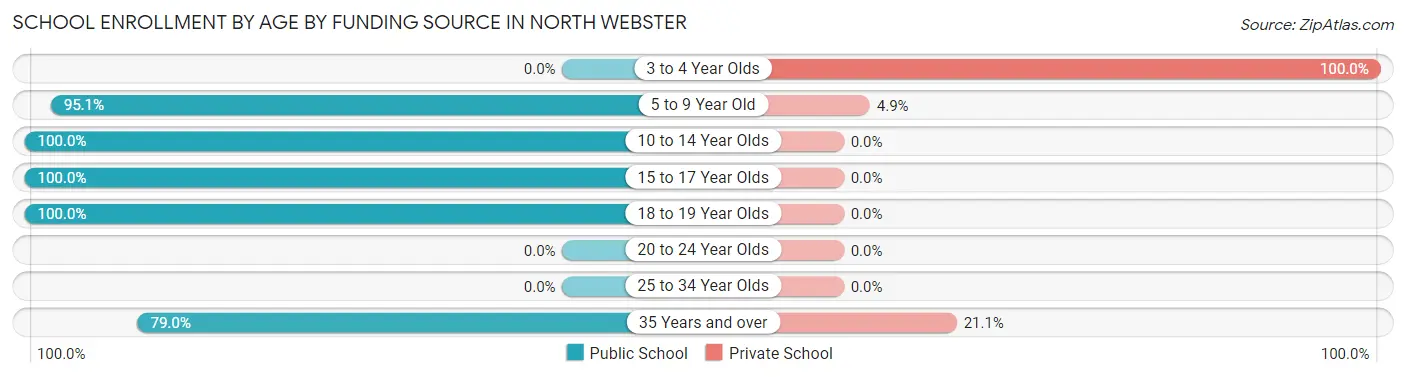
| Age Bracket | Public School | Private School |
| 3 to 4 Year Olds | 0 (0.0%) | 1 (100.0%) |
| 5 to 9 Year Old | 39 (95.1%) | 2 (4.9%) |
| 10 to 14 Year Olds | 47 (100.0%) | 0 (0.0%) |
| 15 to 17 Year Olds | 57 (100.0%) | 0 (0.0%) |
| 18 to 19 Year Olds | 21 (100.0%) | 0 (0.0%) |
| 20 to 24 Year Olds | 0 (0.0%) | 0 (0.0%) |
| 25 to 34 Year Olds | 0 (0.0%) | 0 (0.0%) |
| 35 Years and over | 15 (78.9%) | 4 (21.0%) |
| Total | 179 (96.2%) | 7 (3.8%) |
Educational Attainment by Field of Study in North Webster
Education (39 | 39.0%), business (19 | 19.0%), science & technology (9 | 9.0%), social sciences (8 | 8.0%), and liberal arts & history (8 | 8.0%) are the most common fields of study among 100 individuals in North Webster who have obtained a bachelor's degree or higher.
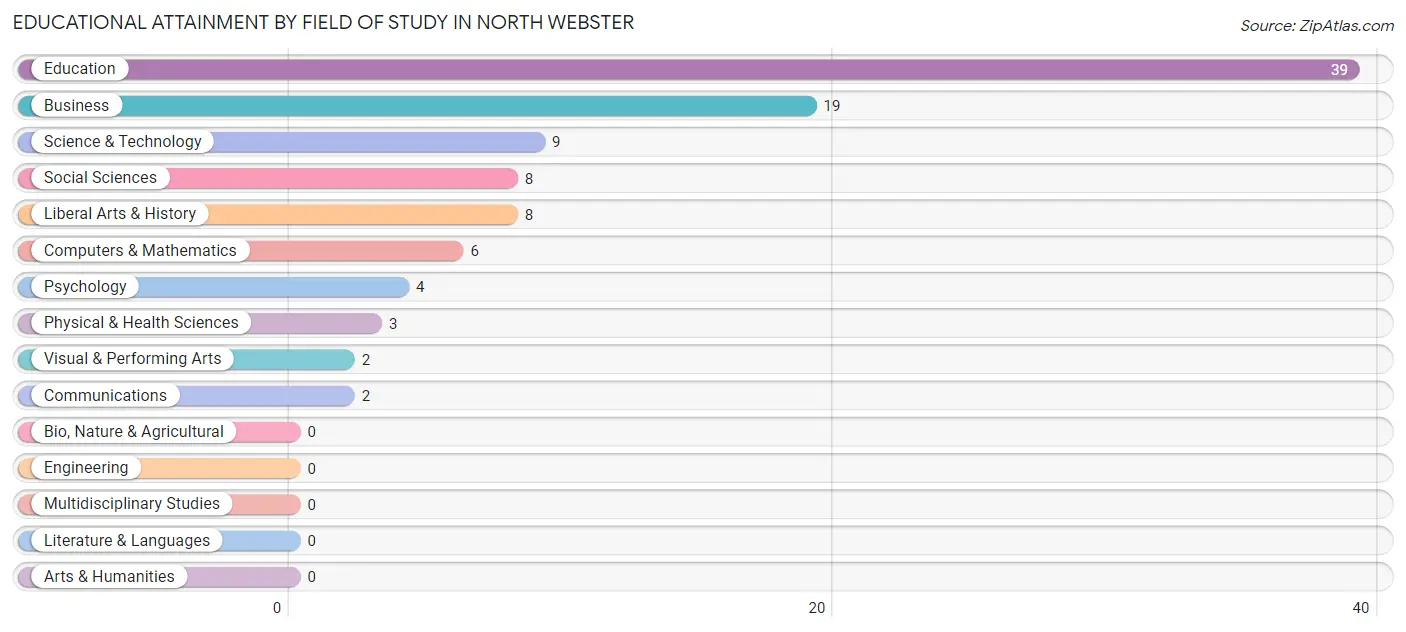
| Field of Study | # Graduates | % Graduates |
| Computers & Mathematics | 6 | 6.0% |
| Bio, Nature & Agricultural | 0 | 0.0% |
| Physical & Health Sciences | 3 | 3.0% |
| Psychology | 4 | 4.0% |
| Social Sciences | 8 | 8.0% |
| Engineering | 0 | 0.0% |
| Multidisciplinary Studies | 0 | 0.0% |
| Science & Technology | 9 | 9.0% |
| Business | 19 | 19.0% |
| Education | 39 | 39.0% |
| Literature & Languages | 0 | 0.0% |
| Liberal Arts & History | 8 | 8.0% |
| Visual & Performing Arts | 2 | 2.0% |
| Communications | 2 | 2.0% |
| Arts & Humanities | 0 | 0.0% |
| Total | 100 | 100.0% |
Transportation & Commute in North Webster
Vehicle Availability by Sex in North Webster
The most prevalent vehicle ownership categories in North Webster are males with 2 vehicles (112, accounting for 59.0%) and females with 2 vehicles (130, making up 40.1%).
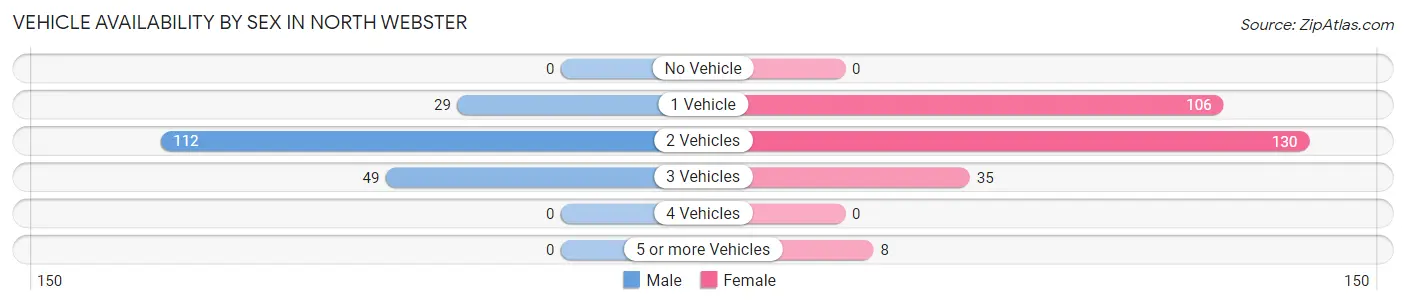
| Vehicles Available | Male | Female |
| No Vehicle | 0 (0.0%) | 0 (0.0%) |
| 1 Vehicle | 29 (15.3%) | 106 (38.0%) |
| 2 Vehicles | 112 (59.0%) | 130 (46.6%) |
| 3 Vehicles | 49 (25.8%) | 35 (12.5%) |
| 4 Vehicles | 0 (0.0%) | 0 (0.0%) |
| 5 or more Vehicles | 0 (0.0%) | 8 (2.9%) |
| Total | 190 (100.0%) | 279 (100.0%) |
Commute Time in North Webster
The most frequently occuring commute durations in North Webster are 5 to 9 minutes (73 commuters, 15.7%), 30 to 34 minutes (71 commuters, 15.3%), and 10 to 14 minutes (63 commuters, 13.6%).
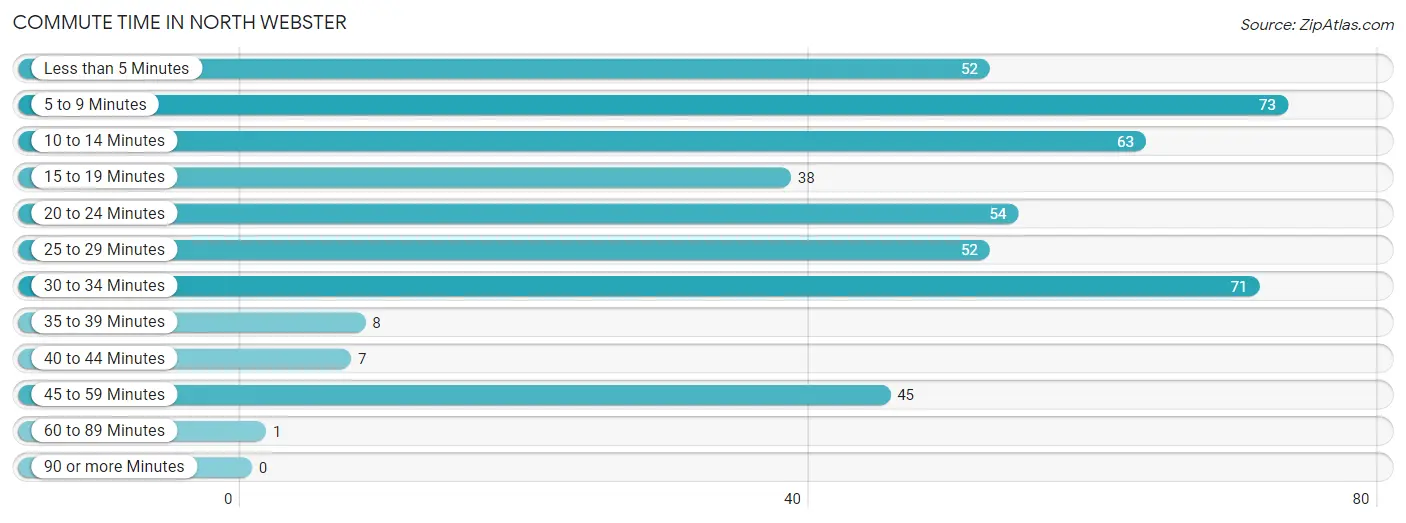
| Commute Time | # Commuters | % Commuters |
| Less than 5 Minutes | 52 | 11.2% |
| 5 to 9 Minutes | 73 | 15.7% |
| 10 to 14 Minutes | 63 | 13.6% |
| 15 to 19 Minutes | 38 | 8.2% |
| 20 to 24 Minutes | 54 | 11.6% |
| 25 to 29 Minutes | 52 | 11.2% |
| 30 to 34 Minutes | 71 | 15.3% |
| 35 to 39 Minutes | 8 | 1.7% |
| 40 to 44 Minutes | 7 | 1.5% |
| 45 to 59 Minutes | 45 | 9.7% |
| 60 to 89 Minutes | 1 | 0.2% |
| 90 or more Minutes | 0 | 0.0% |
Commute Time by Sex in North Webster
The most common commute times in North Webster are less than 5 minutes (38 commuters, 20.0%) for males and 5 to 9 minutes (51 commuters, 18.6%) for females.
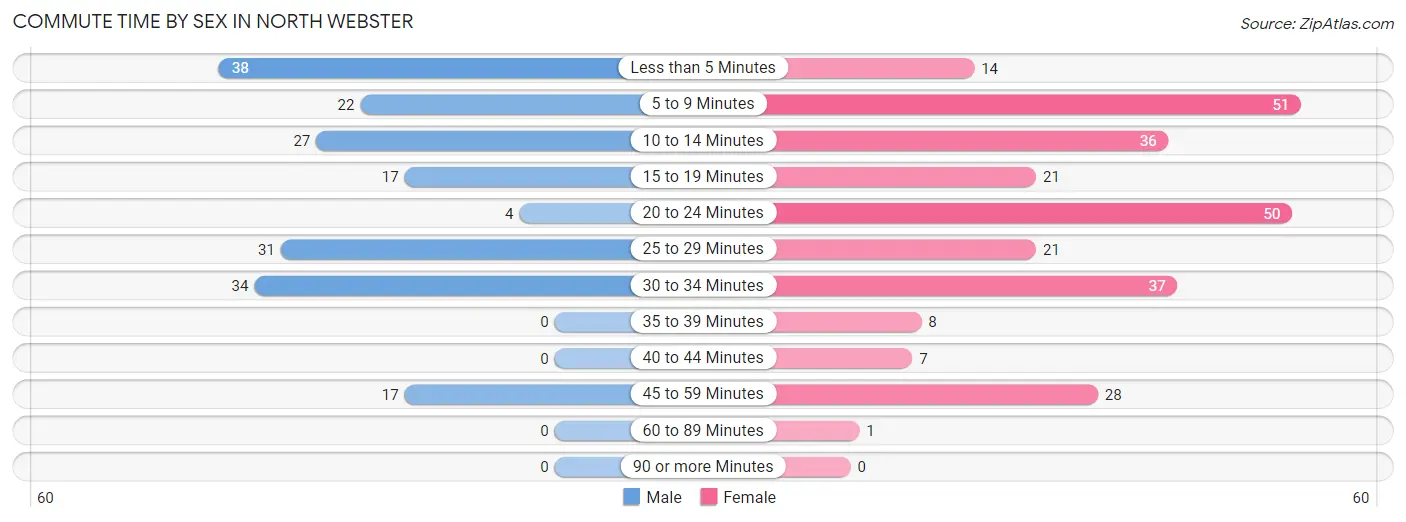
| Commute Time | Male | Female |
| Less than 5 Minutes | 38 (20.0%) | 14 (5.1%) |
| 5 to 9 Minutes | 22 (11.6%) | 51 (18.6%) |
| 10 to 14 Minutes | 27 (14.2%) | 36 (13.1%) |
| 15 to 19 Minutes | 17 (8.9%) | 21 (7.7%) |
| 20 to 24 Minutes | 4 (2.1%) | 50 (18.2%) |
| 25 to 29 Minutes | 31 (16.3%) | 21 (7.7%) |
| 30 to 34 Minutes | 34 (17.9%) | 37 (13.5%) |
| 35 to 39 Minutes | 0 (0.0%) | 8 (2.9%) |
| 40 to 44 Minutes | 0 (0.0%) | 7 (2.5%) |
| 45 to 59 Minutes | 17 (8.9%) | 28 (10.2%) |
| 60 to 89 Minutes | 0 (0.0%) | 1 (0.4%) |
| 90 or more Minutes | 0 (0.0%) | 0 (0.0%) |
Time of Departure to Work by Sex in North Webster
The most frequent times of departure to work in North Webster are 8:00 AM to 8:29 AM (49, 25.8%) for males and 7:00 AM to 7:29 AM (79, 28.8%) for females.
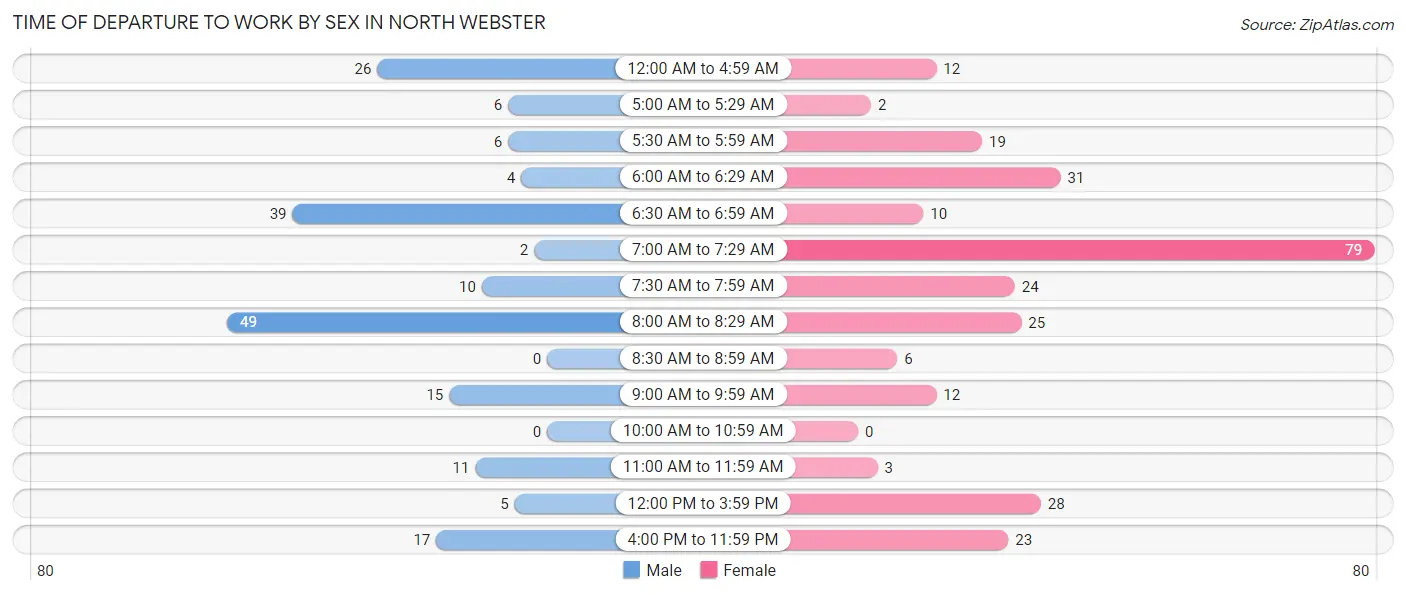
| Time of Departure | Male | Female |
| 12:00 AM to 4:59 AM | 26 (13.7%) | 12 (4.4%) |
| 5:00 AM to 5:29 AM | 6 (3.2%) | 2 (0.7%) |
| 5:30 AM to 5:59 AM | 6 (3.2%) | 19 (6.9%) |
| 6:00 AM to 6:29 AM | 4 (2.1%) | 31 (11.3%) |
| 6:30 AM to 6:59 AM | 39 (20.5%) | 10 (3.6%) |
| 7:00 AM to 7:29 AM | 2 (1.1%) | 79 (28.8%) |
| 7:30 AM to 7:59 AM | 10 (5.3%) | 24 (8.8%) |
| 8:00 AM to 8:29 AM | 49 (25.8%) | 25 (9.1%) |
| 8:30 AM to 8:59 AM | 0 (0.0%) | 6 (2.2%) |
| 9:00 AM to 9:59 AM | 15 (7.9%) | 12 (4.4%) |
| 10:00 AM to 10:59 AM | 0 (0.0%) | 0 (0.0%) |
| 11:00 AM to 11:59 AM | 11 (5.8%) | 3 (1.1%) |
| 12:00 PM to 3:59 PM | 5 (2.6%) | 28 (10.2%) |
| 4:00 PM to 11:59 PM | 17 (8.9%) | 23 (8.4%) |
| Total | 190 (100.0%) | 274 (100.0%) |
Housing Occupancy in North Webster
Occupancy by Ownership in North Webster
Of the total 492 dwellings in North Webster, owner-occupied units account for 368 (74.8%), while renter-occupied units make up 124 (25.2%).
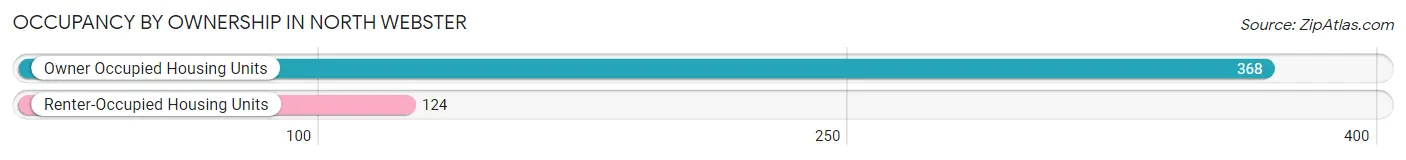
| Occupancy | # Housing Units | % Housing Units |
| Owner Occupied Housing Units | 368 | 74.8% |
| Renter-Occupied Housing Units | 124 | 25.2% |
| Total Occupied Housing Units | 492 | 100.0% |
Occupancy by Household Size in North Webster
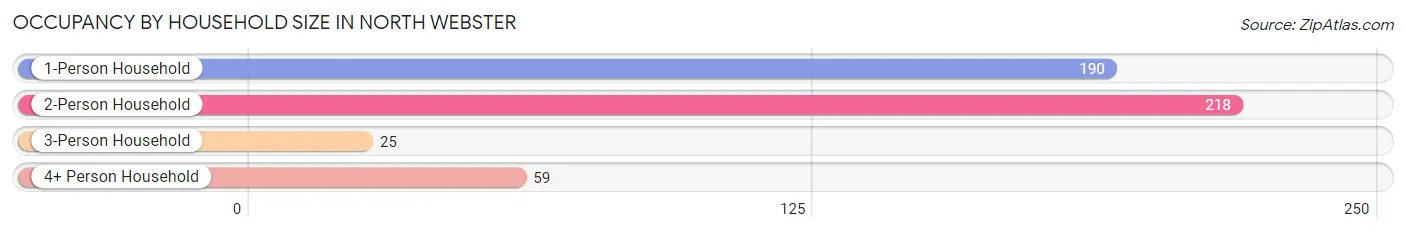
| Household Size | # Housing Units | % Housing Units |
| 1-Person Household | 190 | 38.6% |
| 2-Person Household | 218 | 44.3% |
| 3-Person Household | 25 | 5.1% |
| 4+ Person Household | 59 | 12.0% |
| Total Housing Units | 492 | 100.0% |
Occupancy by Ownership by Household Size in North Webster
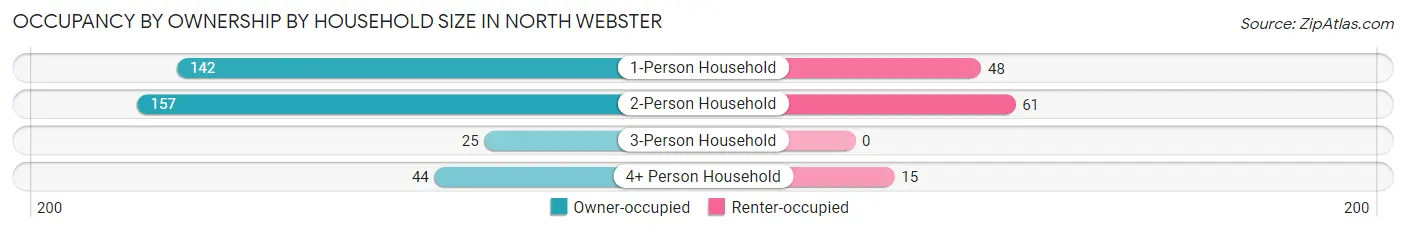
| Household Size | Owner-occupied | Renter-occupied |
| 1-Person Household | 142 (74.7%) | 48 (25.3%) |
| 2-Person Household | 157 (72.0%) | 61 (28.0%) |
| 3-Person Household | 25 (100.0%) | 0 (0.0%) |
| 4+ Person Household | 44 (74.6%) | 15 (25.4%) |
| Total Housing Units | 368 (74.8%) | 124 (25.2%) |
Occupancy by Educational Attainment in North Webster
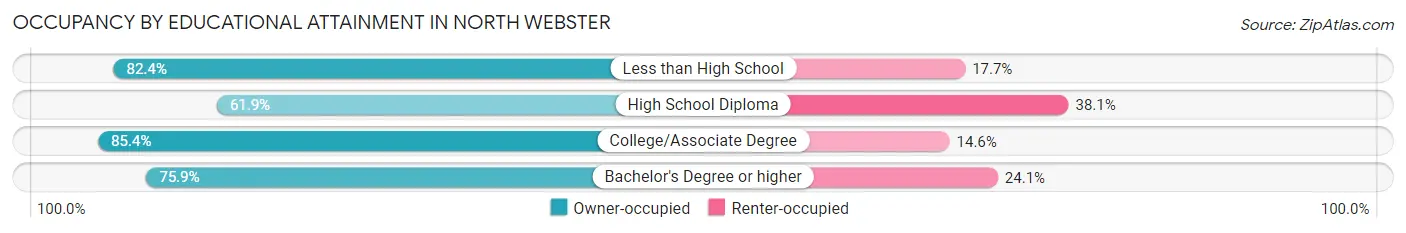
| Household Size | Owner-occupied | Renter-occupied |
| Less than High School | 28 (82.4%) | 6 (17.6%) |
| High School Diploma | 120 (61.9%) | 74 (38.1%) |
| College/Associate Degree | 176 (85.4%) | 30 (14.6%) |
| Bachelor's Degree or higher | 44 (75.9%) | 14 (24.1%) |
Occupancy by Age of Householder in North Webster
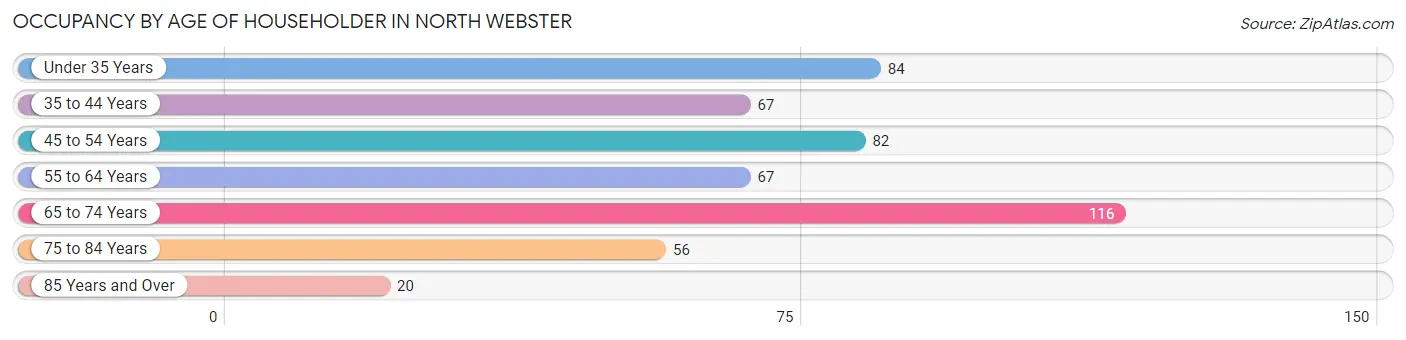
| Age Bracket | # Households | % Households |
| Under 35 Years | 84 | 17.1% |
| 35 to 44 Years | 67 | 13.6% |
| 45 to 54 Years | 82 | 16.7% |
| 55 to 64 Years | 67 | 13.6% |
| 65 to 74 Years | 116 | 23.6% |
| 75 to 84 Years | 56 | 11.4% |
| 85 Years and Over | 20 | 4.1% |
| Total | 492 | 100.0% |
Housing Finances in North Webster
Median Income by Occupancy in North Webster
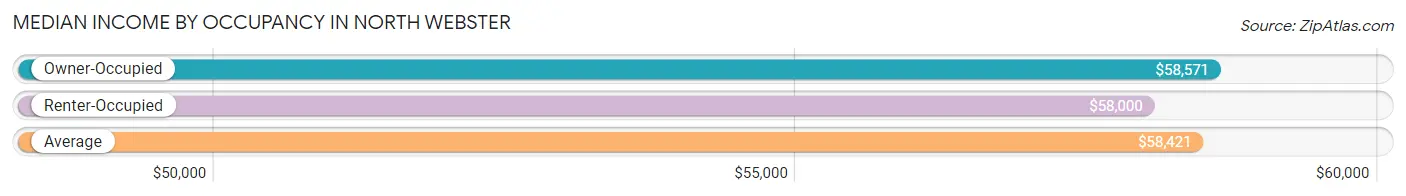
| Occupancy Type | # Households | Median Income |
| Owner-Occupied | 368 (74.8%) | $58,571 |
| Renter-Occupied | 124 (25.2%) | $58,000 |
| Average | 492 (100.0%) | $58,421 |
Occupancy by Householder Income Bracket in North Webster
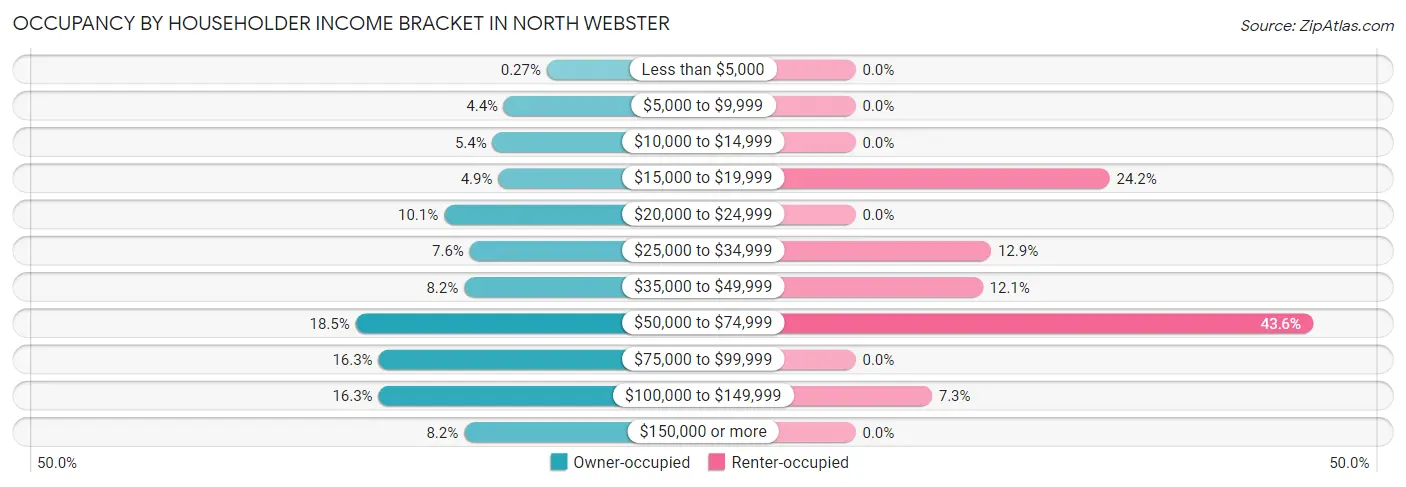
| Income Bracket | Owner-occupied | Renter-occupied |
| Less than $5,000 | 1 (0.3%) | 0 (0.0%) |
| $5,000 to $9,999 | 16 (4.3%) | 0 (0.0%) |
| $10,000 to $14,999 | 20 (5.4%) | 0 (0.0%) |
| $15,000 to $19,999 | 18 (4.9%) | 30 (24.2%) |
| $20,000 to $24,999 | 37 (10.1%) | 0 (0.0%) |
| $25,000 to $34,999 | 28 (7.6%) | 16 (12.9%) |
| $35,000 to $49,999 | 30 (8.2%) | 15 (12.1%) |
| $50,000 to $74,999 | 68 (18.5%) | 54 (43.5%) |
| $75,000 to $99,999 | 60 (16.3%) | 0 (0.0%) |
| $100,000 to $149,999 | 60 (16.3%) | 9 (7.3%) |
| $150,000 or more | 30 (8.2%) | 0 (0.0%) |
| Total | 368 (100.0%) | 124 (100.0%) |
Monthly Housing Cost Tiers in North Webster
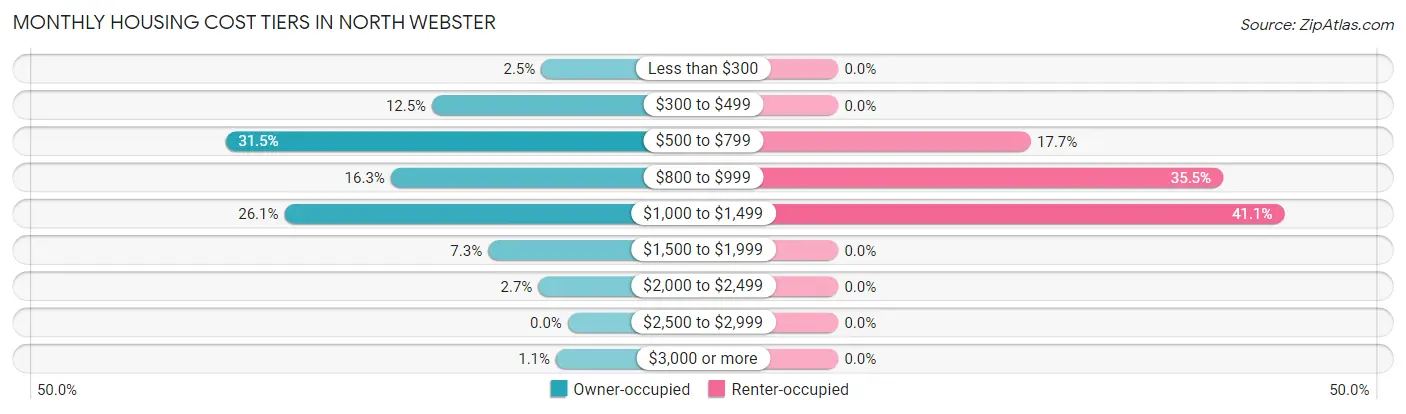
| Monthly Cost | Owner-occupied | Renter-occupied |
| Less than $300 | 9 (2.5%) | 0 (0.0%) |
| $300 to $499 | 46 (12.5%) | 0 (0.0%) |
| $500 to $799 | 116 (31.5%) | 22 (17.7%) |
| $800 to $999 | 60 (16.3%) | 44 (35.5%) |
| $1,000 to $1,499 | 96 (26.1%) | 51 (41.1%) |
| $1,500 to $1,999 | 27 (7.3%) | 0 (0.0%) |
| $2,000 to $2,499 | 10 (2.7%) | 0 (0.0%) |
| $2,500 to $2,999 | 0 (0.0%) | 0 (0.0%) |
| $3,000 or more | 4 (1.1%) | 0 (0.0%) |
| Total | 368 (100.0%) | 124 (100.0%) |
Physical Housing Characteristics in North Webster
Housing Structures in North Webster
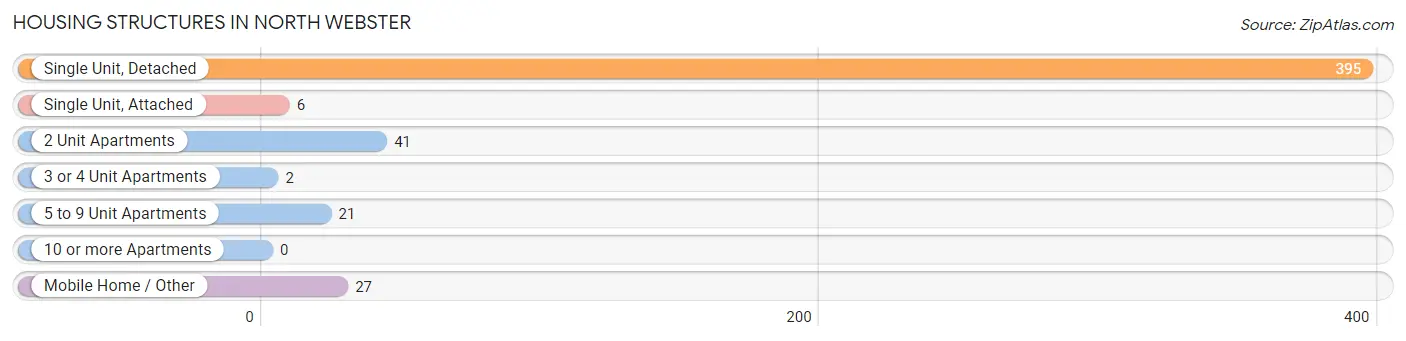
| Structure Type | # Housing Units | % Housing Units |
| Single Unit, Detached | 395 | 80.3% |
| Single Unit, Attached | 6 | 1.2% |
| 2 Unit Apartments | 41 | 8.3% |
| 3 or 4 Unit Apartments | 2 | 0.4% |
| 5 to 9 Unit Apartments | 21 | 4.3% |
| 10 or more Apartments | 0 | 0.0% |
| Mobile Home / Other | 27 | 5.5% |
| Total | 492 | 100.0% |
Housing Structures by Occupancy in North Webster
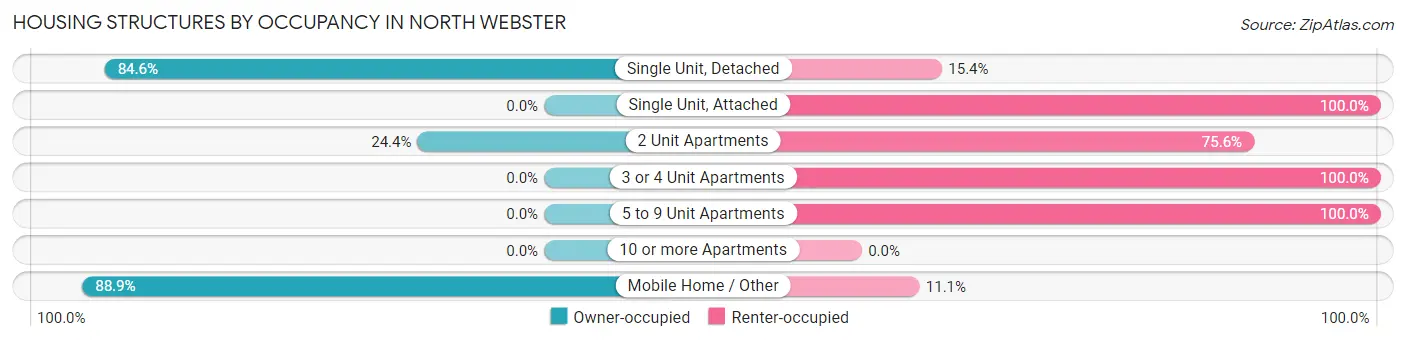
| Structure Type | Owner-occupied | Renter-occupied |
| Single Unit, Detached | 334 (84.6%) | 61 (15.4%) |
| Single Unit, Attached | 0 (0.0%) | 6 (100.0%) |
| 2 Unit Apartments | 10 (24.4%) | 31 (75.6%) |
| 3 or 4 Unit Apartments | 0 (0.0%) | 2 (100.0%) |
| 5 to 9 Unit Apartments | 0 (0.0%) | 21 (100.0%) |
| 10 or more Apartments | 0 (0.0%) | 0 (0.0%) |
| Mobile Home / Other | 24 (88.9%) | 3 (11.1%) |
| Total | 368 (74.8%) | 124 (25.2%) |
Housing Structures by Number of Rooms in North Webster
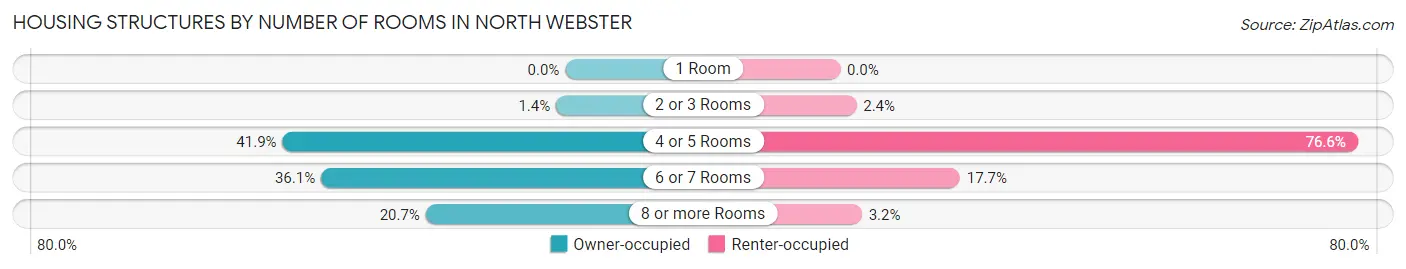
| Number of Rooms | Owner-occupied | Renter-occupied |
| 1 Room | 0 (0.0%) | 0 (0.0%) |
| 2 or 3 Rooms | 5 (1.4%) | 3 (2.4%) |
| 4 or 5 Rooms | 154 (41.8%) | 95 (76.6%) |
| 6 or 7 Rooms | 133 (36.1%) | 22 (17.7%) |
| 8 or more Rooms | 76 (20.6%) | 4 (3.2%) |
| Total | 368 (100.0%) | 124 (100.0%) |
Housing Structure by Heating Type in North Webster
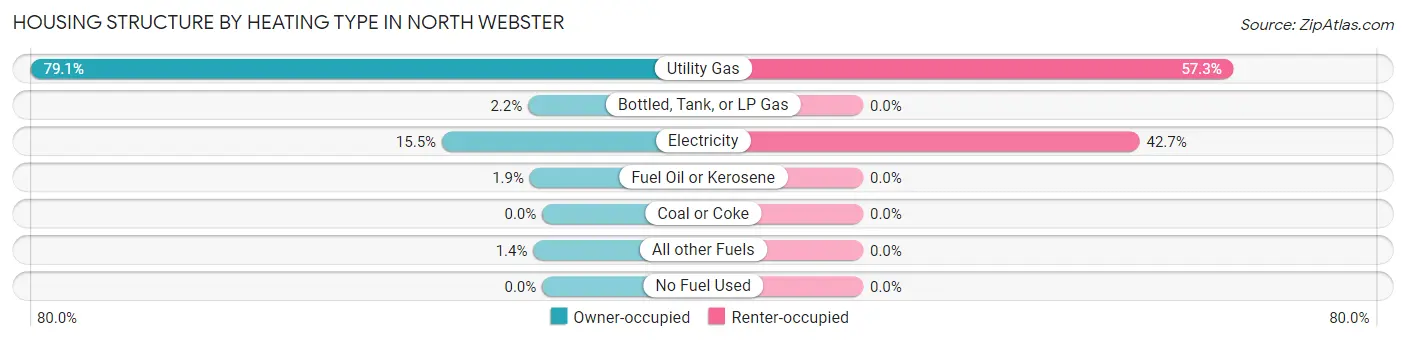
| Heating Type | Owner-occupied | Renter-occupied |
| Utility Gas | 291 (79.1%) | 71 (57.3%) |
| Bottled, Tank, or LP Gas | 8 (2.2%) | 0 (0.0%) |
| Electricity | 57 (15.5%) | 53 (42.7%) |
| Fuel Oil or Kerosene | 7 (1.9%) | 0 (0.0%) |
| Coal or Coke | 0 (0.0%) | 0 (0.0%) |
| All other Fuels | 5 (1.4%) | 0 (0.0%) |
| No Fuel Used | 0 (0.0%) | 0 (0.0%) |
| Total | 368 (100.0%) | 124 (100.0%) |
Household Vehicle Usage in North Webster
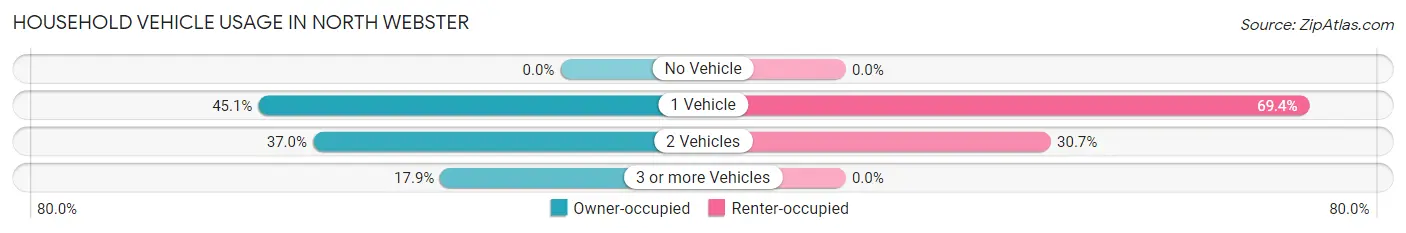
| Vehicles per Household | Owner-occupied | Renter-occupied |
| No Vehicle | 0 (0.0%) | 0 (0.0%) |
| 1 Vehicle | 166 (45.1%) | 86 (69.4%) |
| 2 Vehicles | 136 (37.0%) | 38 (30.6%) |
| 3 or more Vehicles | 66 (17.9%) | 0 (0.0%) |
| Total | 368 (100.0%) | 124 (100.0%) |
Real Estate & Mortgages in North Webster
Real Estate and Mortgage Overview in North Webster
| Characteristic | Without Mortgage | With Mortgage |
| Housing Units | 151 | 217 |
| Median Property Value | $174,300 | $182,600 |
| Median Household Income | $29,271 | $24 |
| Monthly Housing Costs | $525 | $4 |
| Real Estate Taxes | $772 | $2 |
Property Value by Mortgage Status in North Webster
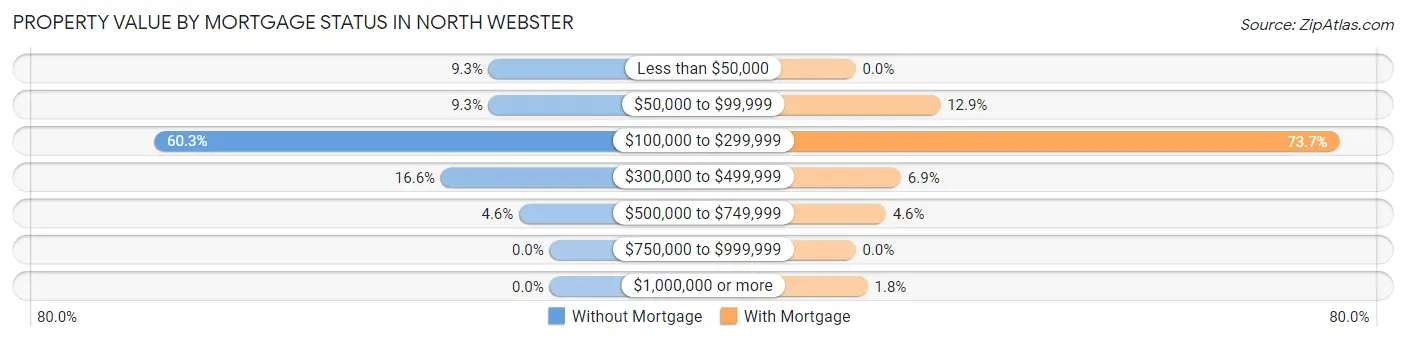
| Property Value | Without Mortgage | With Mortgage |
| Less than $50,000 | 14 (9.3%) | 0 (0.0%) |
| $50,000 to $99,999 | 14 (9.3%) | 28 (12.9%) |
| $100,000 to $299,999 | 91 (60.3%) | 160 (73.7%) |
| $300,000 to $499,999 | 25 (16.6%) | 15 (6.9%) |
| $500,000 to $749,999 | 7 (4.6%) | 10 (4.6%) |
| $750,000 to $999,999 | 0 (0.0%) | 0 (0.0%) |
| $1,000,000 or more | 0 (0.0%) | 4 (1.8%) |
| Total | 151 (100.0%) | 217 (100.0%) |
Household Income by Mortgage Status in North Webster
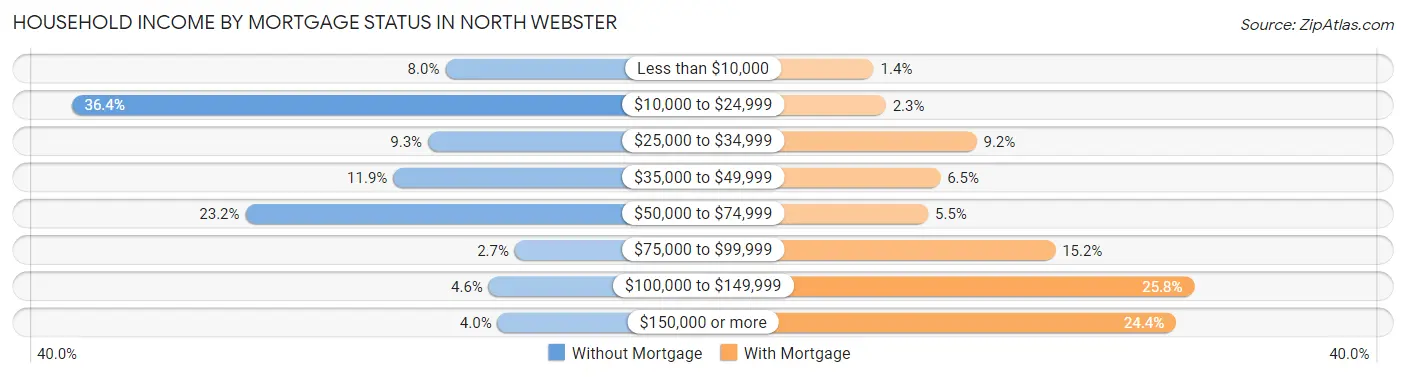
| Household Income | Without Mortgage | With Mortgage |
| Less than $10,000 | 12 (8.0%) | 3 (1.4%) |
| $10,000 to $24,999 | 55 (36.4%) | 5 (2.3%) |
| $25,000 to $34,999 | 14 (9.3%) | 20 (9.2%) |
| $35,000 to $49,999 | 18 (11.9%) | 14 (6.5%) |
| $50,000 to $74,999 | 35 (23.2%) | 12 (5.5%) |
| $75,000 to $99,999 | 4 (2.6%) | 33 (15.2%) |
| $100,000 to $149,999 | 7 (4.6%) | 56 (25.8%) |
| $150,000 or more | 6 (4.0%) | 53 (24.4%) |
| Total | 151 (100.0%) | 217 (100.0%) |
Property Value to Household Income Ratio in North Webster
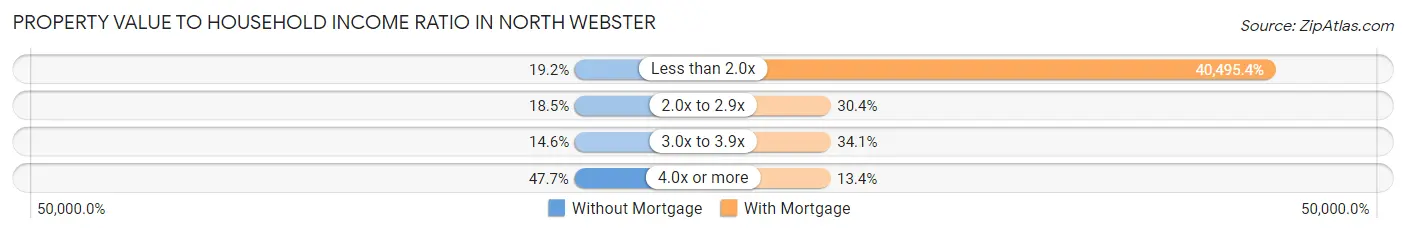
| Value-to-Income Ratio | Without Mortgage | With Mortgage |
| Less than 2.0x | 29 (19.2%) | 87,875 (40,495.4%) |
| 2.0x to 2.9x | 28 (18.5%) | 66 (30.4%) |
| 3.0x to 3.9x | 22 (14.6%) | 74 (34.1%) |
| 4.0x or more | 72 (47.7%) | 29 (13.4%) |
| Total | 151 (100.0%) | 217 (100.0%) |
Real Estate Taxes by Mortgage Status in North Webster
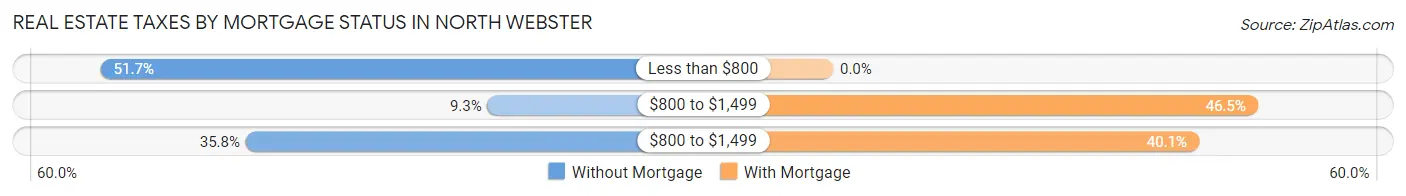
| Property Taxes | Without Mortgage | With Mortgage |
| Less than $800 | 78 (51.7%) | 0 (0.0%) |
| $800 to $1,499 | 14 (9.3%) | 101 (46.5%) |
| $800 to $1,499 | 54 (35.8%) | 87 (40.1%) |
| Total | 151 (100.0%) | 217 (100.0%) |
Health & Disability in North Webster
Health Insurance Coverage by Age in North Webster
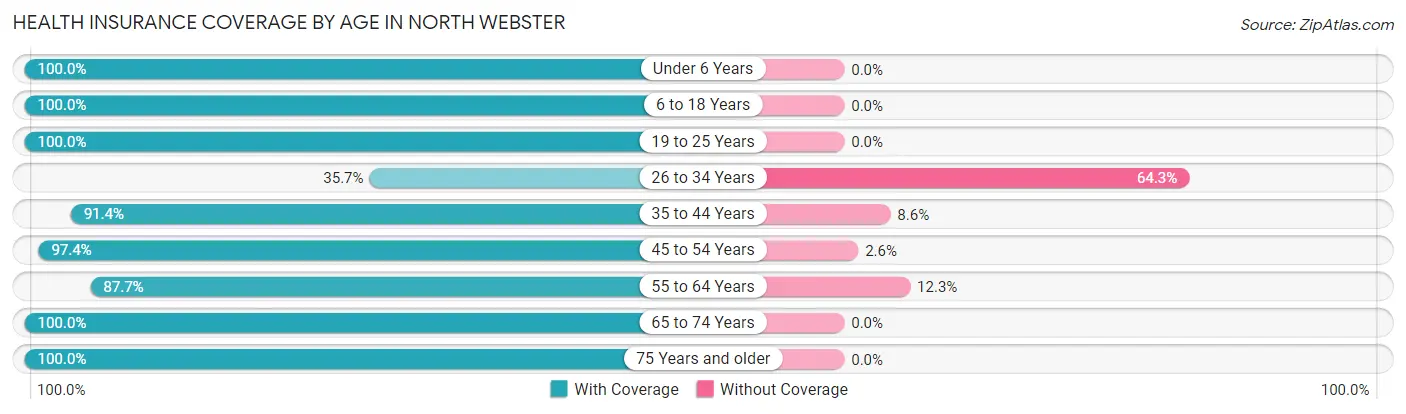
| Age Bracket | With Coverage | Without Coverage |
| Under 6 Years | 77 (100.0%) | 0 (0.0%) |
| 6 to 18 Years | 166 (100.0%) | 0 (0.0%) |
| 19 to 25 Years | 72 (100.0%) | 0 (0.0%) |
| 26 to 34 Years | 30 (35.7%) | 54 (64.3%) |
| 35 to 44 Years | 85 (91.4%) | 8 (8.6%) |
| 45 to 54 Years | 113 (97.4%) | 3 (2.6%) |
| 55 to 64 Years | 100 (87.7%) | 14 (12.3%) |
| 65 to 74 Years | 149 (100.0%) | 0 (0.0%) |
| 75 Years and older | 91 (100.0%) | 0 (0.0%) |
| Total | 883 (91.8%) | 79 (8.2%) |
Health Insurance Coverage by Citizenship Status in North Webster
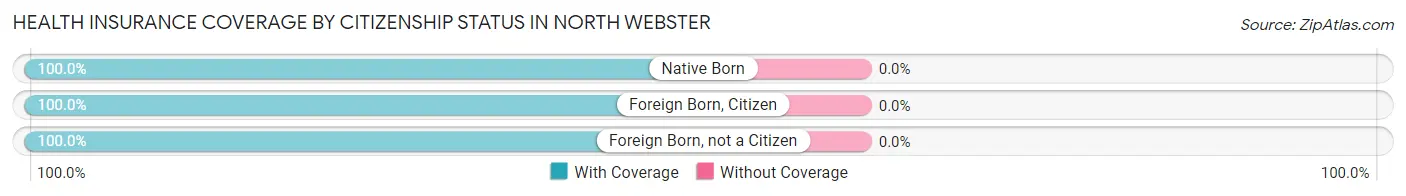
| Citizenship Status | With Coverage | Without Coverage |
| Native Born | 77 (100.0%) | 0 (0.0%) |
| Foreign Born, Citizen | 166 (100.0%) | 0 (0.0%) |
| Foreign Born, not a Citizen | 72 (100.0%) | 0 (0.0%) |
Health Insurance Coverage by Household Income in North Webster
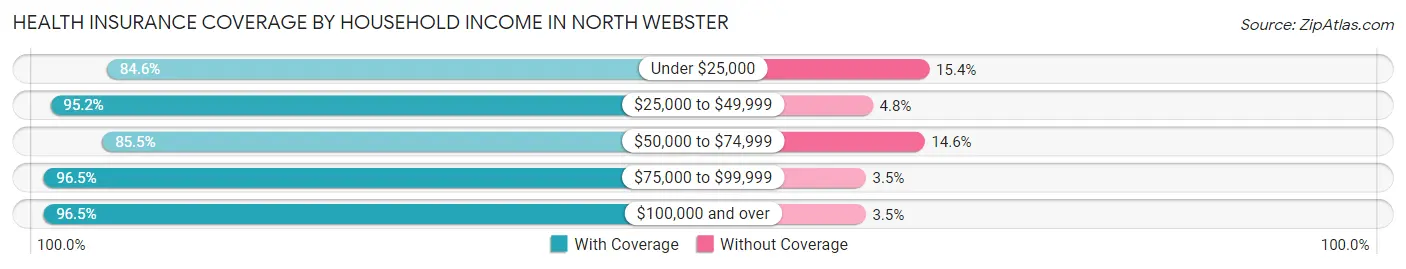
| Household Income | With Coverage | Without Coverage |
| Under $25,000 | 137 (84.6%) | 25 (15.4%) |
| $25,000 to $49,999 | 118 (95.2%) | 6 (4.8%) |
| $50,000 to $74,999 | 188 (85.5%) | 32 (14.5%) |
| $75,000 to $99,999 | 192 (96.5%) | 7 (3.5%) |
| $100,000 and over | 248 (96.5%) | 9 (3.5%) |
Public vs Private Health Insurance Coverage by Age in North Webster
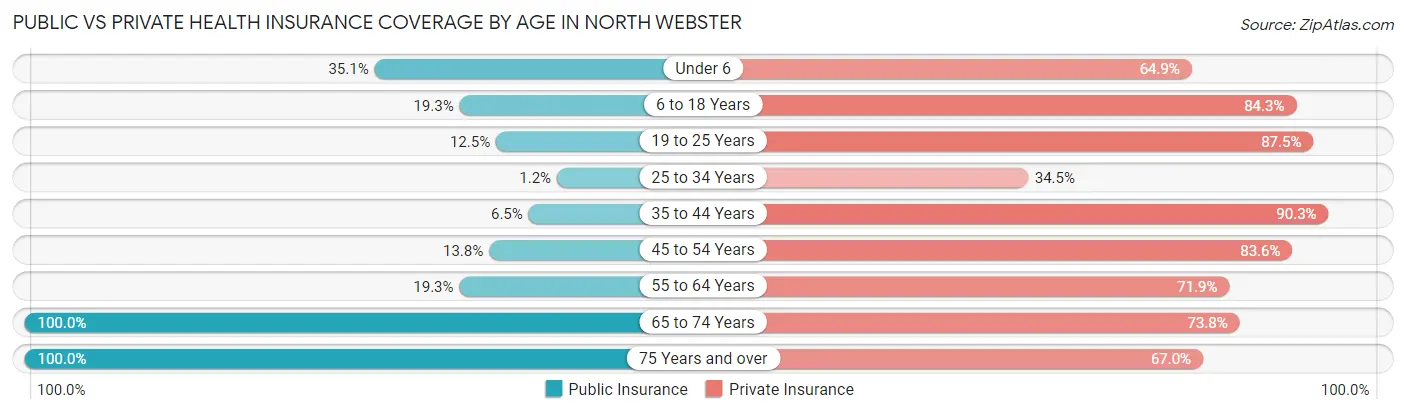
| Age Bracket | Public Insurance | Private Insurance |
| Under 6 | 27 (35.1%) | 50 (64.9%) |
| 6 to 18 Years | 32 (19.3%) | 140 (84.3%) |
| 19 to 25 Years | 9 (12.5%) | 63 (87.5%) |
| 25 to 34 Years | 1 (1.2%) | 29 (34.5%) |
| 35 to 44 Years | 6 (6.5%) | 84 (90.3%) |
| 45 to 54 Years | 16 (13.8%) | 97 (83.6%) |
| 55 to 64 Years | 22 (19.3%) | 82 (71.9%) |
| 65 to 74 Years | 149 (100.0%) | 110 (73.8%) |
| 75 Years and over | 91 (100.0%) | 61 (67.0%) |
| Total | 353 (36.7%) | 716 (74.4%) |
Disability Status by Sex by Age in North Webster
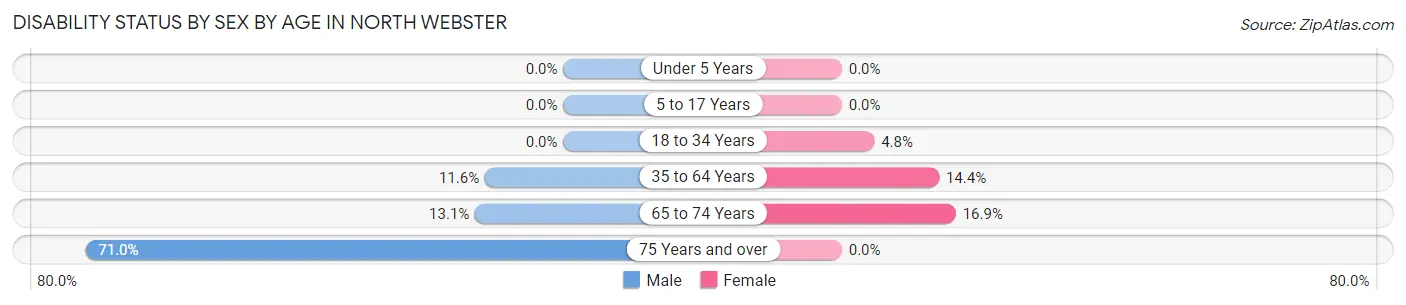
| Age Bracket | Male | Female |
| Under 5 Years | 0 (0.0%) | 0 (0.0%) |
| 5 to 17 Years | 0 (0.0%) | 0 (0.0%) |
| 18 to 34 Years | 0 (0.0%) | 5 (4.8%) |
| 35 to 64 Years | 15 (11.6%) | 28 (14.4%) |
| 65 to 74 Years | 11 (13.1%) | 11 (16.9%) |
| 75 Years and over | 22 (71.0%) | 0 (0.0%) |
Disability Class by Sex by Age in North Webster
Disability Class: Hearing Difficulty
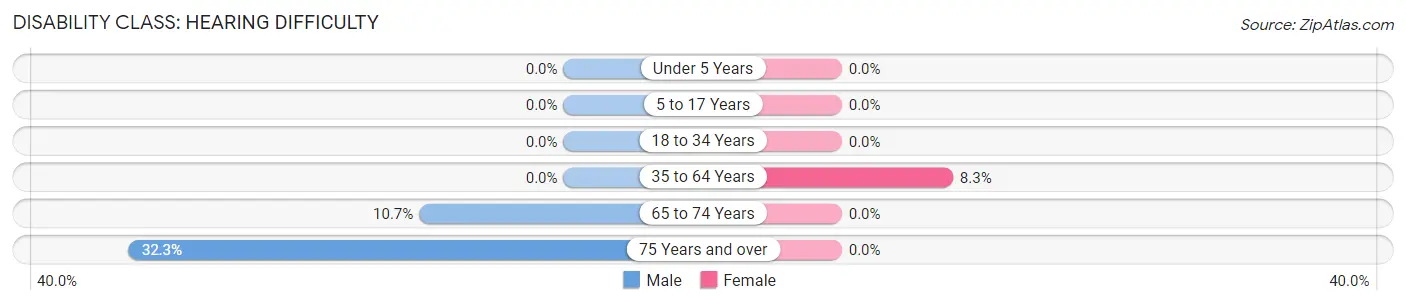
| Age Bracket | Male | Female |
| Under 5 Years | 0 (0.0%) | 0 (0.0%) |
| 5 to 17 Years | 0 (0.0%) | 0 (0.0%) |
| 18 to 34 Years | 0 (0.0%) | 0 (0.0%) |
| 35 to 64 Years | 0 (0.0%) | 16 (8.3%) |
| 65 to 74 Years | 9 (10.7%) | 0 (0.0%) |
| 75 Years and over | 10 (32.3%) | 0 (0.0%) |
Disability Class: Vision Difficulty
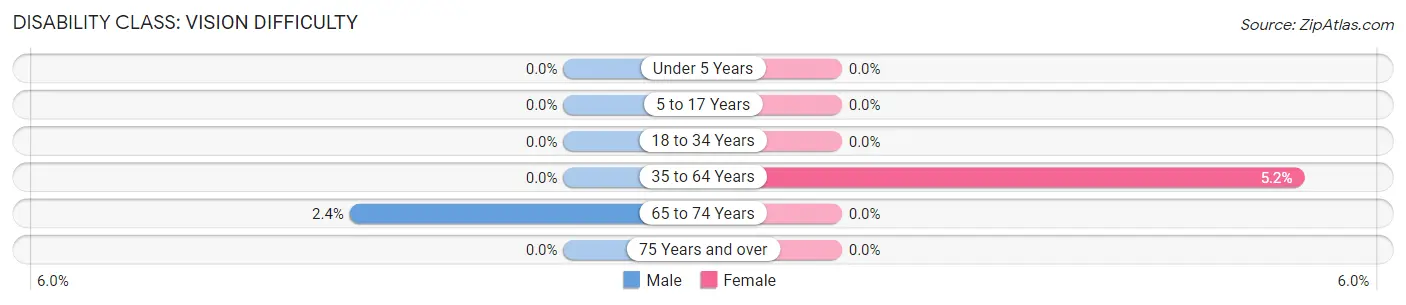
| Age Bracket | Male | Female |
| Under 5 Years | 0 (0.0%) | 0 (0.0%) |
| 5 to 17 Years | 0 (0.0%) | 0 (0.0%) |
| 18 to 34 Years | 0 (0.0%) | 0 (0.0%) |
| 35 to 64 Years | 0 (0.0%) | 10 (5.1%) |
| 65 to 74 Years | 2 (2.4%) | 0 (0.0%) |
| 75 Years and over | 0 (0.0%) | 0 (0.0%) |
Disability Class: Cognitive Difficulty
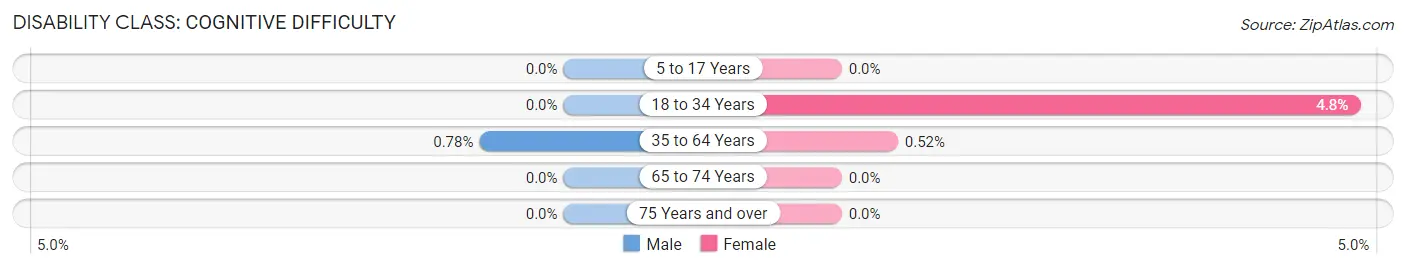
| Age Bracket | Male | Female |
| 5 to 17 Years | 0 (0.0%) | 0 (0.0%) |
| 18 to 34 Years | 0 (0.0%) | 5 (4.8%) |
| 35 to 64 Years | 1 (0.8%) | 1 (0.5%) |
| 65 to 74 Years | 0 (0.0%) | 0 (0.0%) |
| 75 Years and over | 0 (0.0%) | 0 (0.0%) |
Disability Class: Ambulatory Difficulty
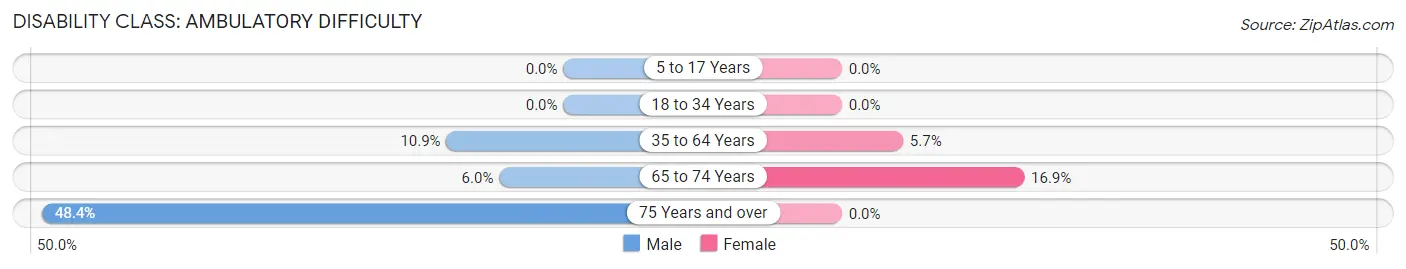
| Age Bracket | Male | Female |
| 5 to 17 Years | 0 (0.0%) | 0 (0.0%) |
| 18 to 34 Years | 0 (0.0%) | 0 (0.0%) |
| 35 to 64 Years | 14 (10.8%) | 11 (5.7%) |
| 65 to 74 Years | 5 (5.9%) | 11 (16.9%) |
| 75 Years and over | 15 (48.4%) | 0 (0.0%) |
Disability Class: Self-Care Difficulty
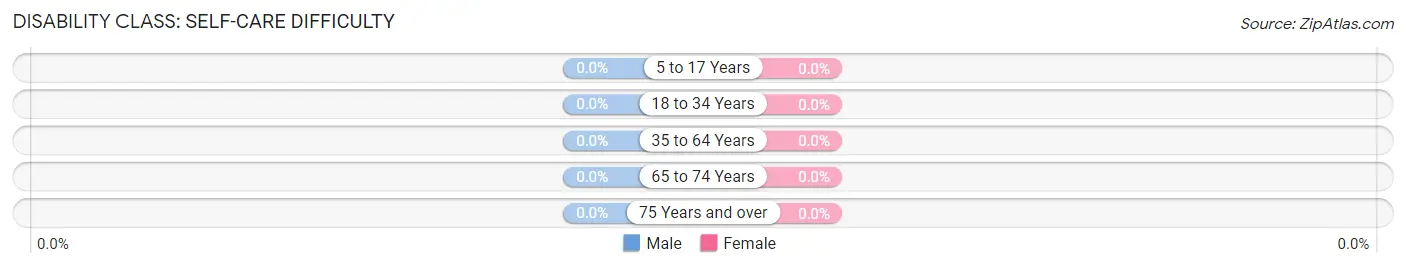
| Age Bracket | Male | Female |
| 5 to 17 Years | 0 (0.0%) | 0 (0.0%) |
| 18 to 34 Years | 0 (0.0%) | 0 (0.0%) |
| 35 to 64 Years | 0 (0.0%) | 0 (0.0%) |
| 65 to 74 Years | 0 (0.0%) | 0 (0.0%) |
| 75 Years and over | 0 (0.0%) | 0 (0.0%) |
Technology Access in North Webster
Computing Device Access in North Webster
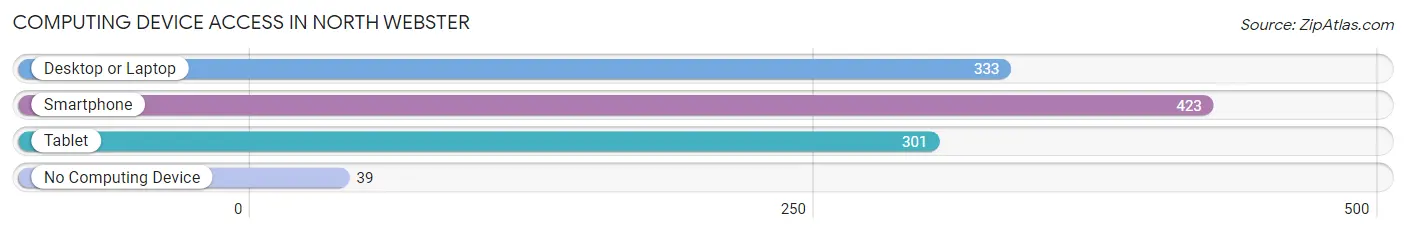
| Device Type | # Households | % Households |
| Desktop or Laptop | 333 | 67.7% |
| Smartphone | 423 | 86.0% |
| Tablet | 301 | 61.2% |
| No Computing Device | 39 | 7.9% |
| Total | 492 | 100.0% |
Internet Access in North Webster
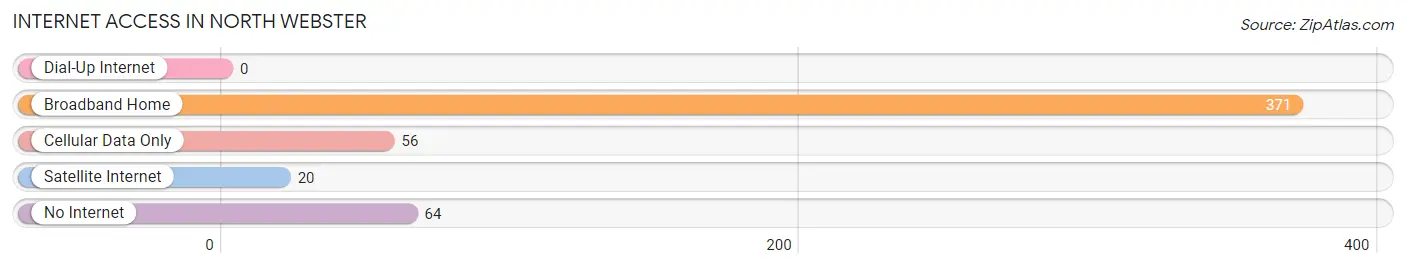
| Internet Type | # Households | % Households |
| Dial-Up Internet | 0 | 0.0% |
| Broadband Home | 371 | 75.4% |
| Cellular Data Only | 56 | 11.4% |
| Satellite Internet | 20 | 4.1% |
| No Internet | 64 | 13.0% |
| Total | 492 | 100.0% |
North Webster Summary
Webster, Indiana is a small town located in Kosciusko County, Indiana. It is situated on the banks of Lake Tippecanoe, a popular recreational lake. The town was founded in 1837 and is named after Daniel Webster, a prominent American statesman. The population of Webster was 1,845 in the 2010 census.
History
Webster was founded in 1837 by a group of settlers from New York. The town was originally called North Webster, but the name was changed to Webster in 1845. The town was named after Daniel Webster, a prominent American statesman. The first post office was established in 1845 and the first school was built in 1848.
The town grew slowly but steadily over the years. In 1876, the first railroad line was built, connecting Webster to Warsaw and Fort Wayne. This allowed for the transportation of goods and people, and helped to spur the growth of the town.
In the early 1900s, Webster was a thriving community. It had a variety of businesses, including a bank, a hotel, a newspaper, a sawmill, and a variety of other stores. The town also had a variety of churches, including Methodist, Baptist, and Presbyterian.
In the 1950s, the town began to decline. The railroad line was abandoned and the businesses began to close. The population of Webster began to decline as well. In the 1970s, the town began to experience a resurgence. The population began to grow again and new businesses began to open.
Geography
Webster is located in Kosciusko County, Indiana. It is situated on the banks of Lake Tippecanoe, a popular recreational lake. The town is located about 25 miles north of Warsaw and about 50 miles south of Fort Wayne.
The town is located in a rural area and is surrounded by farmland. The terrain is mostly flat, with some rolling hills. The climate is humid continental, with hot summers and cold winters.
Economy
The economy of Webster is largely based on agriculture. The town is surrounded by farmland and many of the residents are involved in farming. The town also has a variety of small businesses, including restaurants, stores, and service providers.
The town is also home to a variety of manufacturing companies. These companies produce a variety of products, including furniture, automotive parts, and medical supplies.
Demographics
The population of Webster was 1,845 in the 2010 census. The population is mostly white (94.3%), with a small percentage of African Americans (2.2%) and Hispanics (2.2%). The median household income is $45,000 and the median home value is $117,000.
The town has a variety of religious denominations, including Methodist, Baptist, and Presbyterian. The town also has a variety of recreational activities, including fishing, boating, and camping.
Conclusion
Webster, Indiana is a small town located in Kosciusko County, Indiana. It was founded in 1837 and is named after Daniel Webster, a prominent American statesman. The town has a population of 1,845 and is largely based on agriculture. The town also has a variety of small businesses and manufacturing companies. The town has a variety of religious denominations and recreational activities.
Common Questions
What is Per Capita Income in North Webster?
Per Capita income in North Webster is $35,361.
What is the Median Family Income in North Webster?
Median Family Income in North Webster is $81,500.
What is the Median Household income in North Webster?
Median Household Income in North Webster is $58,421.
What is Income or Wage Gap in North Webster?
Income or Wage Gap in North Webster is 6.4%.
Women in North Webster earn 93.6 cents for every dollar earned by a man.
What is Inequality or Gini Index in North Webster?
Inequality or Gini Index in North Webster is 0.43.
What is the Total Population of North Webster?
Total Population of North Webster is 962.
What is the Total Male Population of North Webster?
Total Male Population of North Webster is 423.
What is the Total Female Population of North Webster?
Total Female Population of North Webster is 539.
What is the Ratio of Males per 100 Females in North Webster?
There are 78.48 Males per 100 Females in North Webster.
What is the Ratio of Females per 100 Males in North Webster?
There are 127.42 Females per 100 Males in North Webster.
What is the Median Population Age in North Webster?
Median Population Age in North Webster is 43.6 Years.
What is the Average Family Size in North Webster
Average Family Size in North Webster is 2.7 People.
What is the Average Household Size in North Webster
Average Household Size in North Webster is 2.0 People.
How Large is the Labor Force in North Webster?
There are 488 People in the Labor Forcein in North Webster.
What is the Percentage of People in the Labor Force in North Webster?
63.5% of People are in the Labor Force in North Webster.
What is the Unemployment Rate in North Webster?
Unemployment Rate in North Webster is 1.8%.