Rockville, IN Map & Demographics
Rockville Map
Rockville Overview
$28,250
PER CAPITA INCOME
$63,341
AVG FAMILY INCOME
$50,625
AVG HOUSEHOLD INCOME
40.5%
WAGE / INCOME GAP [ % ]
59.5¢/ $1
WAGE / INCOME GAP [ $ ]
0.44
INEQUALITY / GINI INDEX
2,537
TOTAL POPULATION
1,180
MALE POPULATION
1,357
FEMALE POPULATION
86.96
MALES / 100 FEMALES
115.00
FEMALES / 100 MALES
49.9
MEDIAN AGE
3.0
AVG FAMILY SIZE
2.4
AVG HOUSEHOLD SIZE
1,102
LABOR FORCE [ PEOPLE ]
51.8%
PERCENT IN LABOR FORCE
8.7%
UNEMPLOYMENT RATE
Rockville Zip Codes
Rockville Area Codes
Income in Rockville
Income Overview in Rockville
Per Capita Income in Rockville is $28,250, while median incomes of families and households are $63,341 and $50,625 respectively.
| Characteristic | Number | Measure |
| Per Capita Income | 2,537 | $28,250 |
| Median Family Income | 637 | $63,341 |
| Mean Family Income | 637 | $78,969 |
| Median Household Income | 1,036 | $50,625 |
| Mean Household Income | 1,036 | $64,303 |
| Income Deficit | 637 | $0 |
| Wage / Income Gap (%) | 2,537 | 40.52% |
| Wage / Income Gap ($) | 2,537 | 59.48¢ per $1 |
| Gini / Inequality Index | 2,537 | 0.44 |
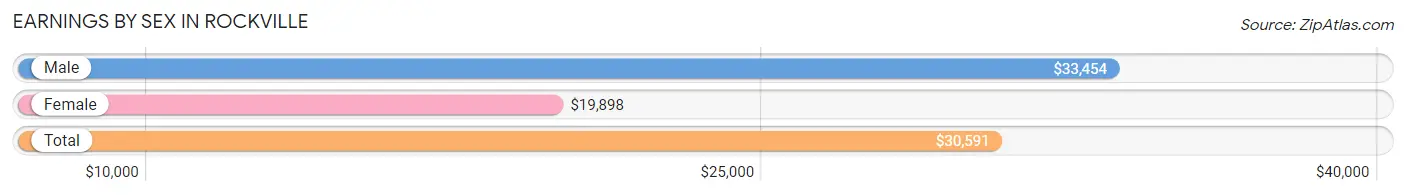
Earnings by Sex in Rockville
Average Earnings in Rockville are $30,591, $33,454 for men and $19,898 for women, a difference of 40.5%.
| Sex | Number | Average Earnings |
| Male | 547 (46.8%) | $33,454 |
| Female | 621 (53.2%) | $19,898 |
| Total | 1,168 (100.0%) | $30,591 |
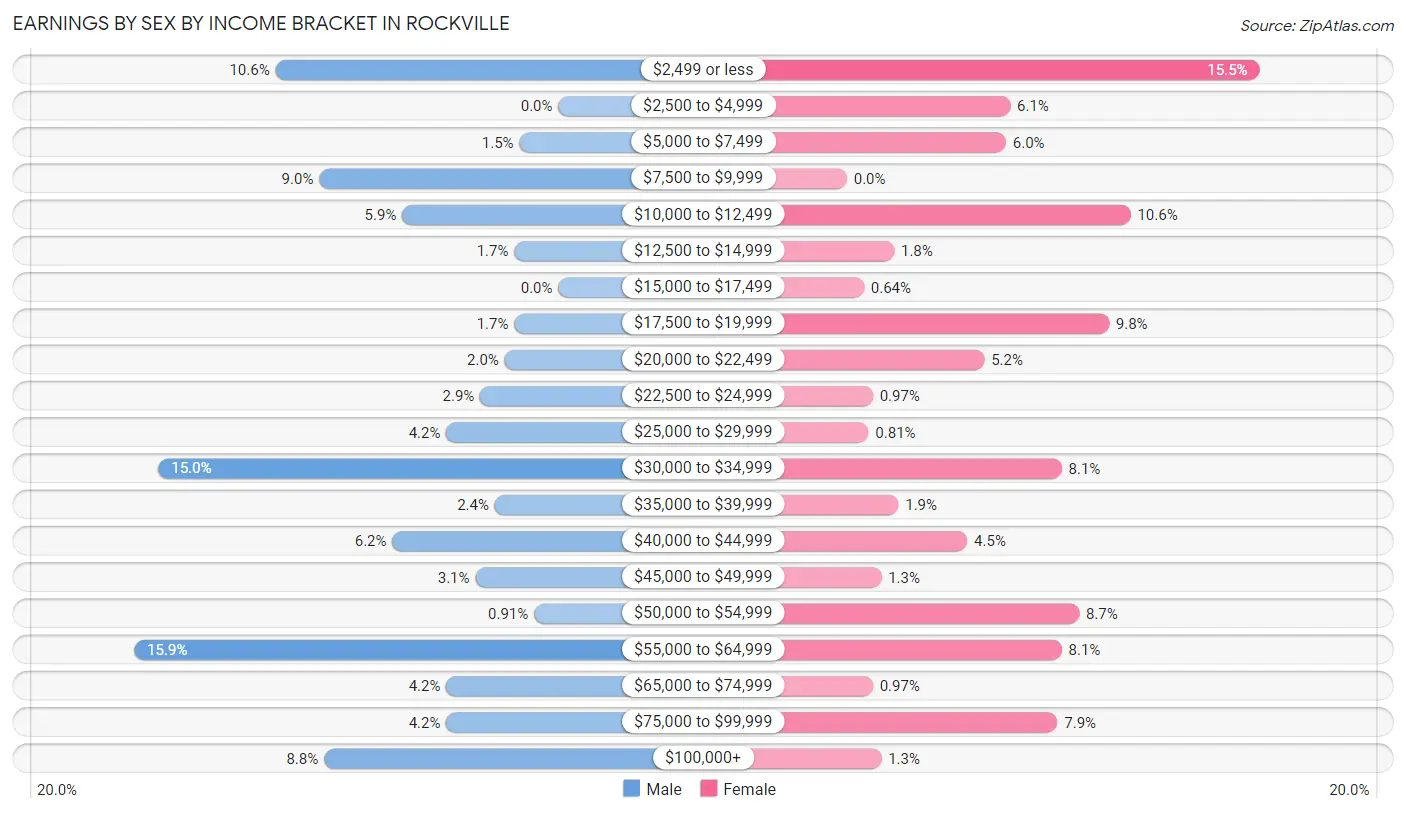
Earnings by Sex by Income Bracket in Rockville
The most common earnings brackets in Rockville are $55,000 to $64,999 for men (87 | 15.9%) and $2,499 or less for women (96 | 15.5%).
| Income | Male | Female |
| $2,499 or less | 58 (10.6%) | 96 (15.5%) |
| $2,500 to $4,999 | 0 (0.0%) | 38 (6.1%) |
| $5,000 to $7,499 | 8 (1.5%) | 37 (6.0%) |
| $7,500 to $9,999 | 49 (9.0%) | 0 (0.0%) |
| $10,000 to $12,499 | 32 (5.9%) | 66 (10.6%) |
| $12,500 to $14,999 | 9 (1.7%) | 11 (1.8%) |
| $15,000 to $17,499 | 0 (0.0%) | 4 (0.6%) |
| $17,500 to $19,999 | 9 (1.7%) | 61 (9.8%) |
| $20,000 to $22,499 | 11 (2.0%) | 32 (5.1%) |
| $22,500 to $24,999 | 16 (2.9%) | 6 (1.0%) |
| $25,000 to $29,999 | 23 (4.2%) | 5 (0.8%) |
| $30,000 to $34,999 | 82 (15.0%) | 50 (8.1%) |
| $35,000 to $39,999 | 13 (2.4%) | 12 (1.9%) |
| $40,000 to $44,999 | 34 (6.2%) | 28 (4.5%) |
| $45,000 to $49,999 | 17 (3.1%) | 8 (1.3%) |
| $50,000 to $54,999 | 5 (0.9%) | 54 (8.7%) |
| $55,000 to $64,999 | 87 (15.9%) | 50 (8.1%) |
| $65,000 to $74,999 | 23 (4.2%) | 6 (1.0%) |
| $75,000 to $99,999 | 23 (4.2%) | 49 (7.9%) |
| $100,000+ | 48 (8.8%) | 8 (1.3%) |
| Total | 547 (100.0%) | 621 (100.0%) |
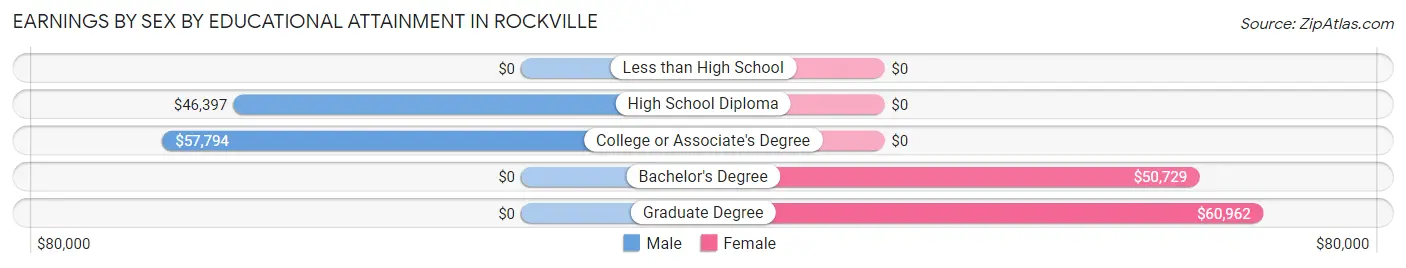
Earnings by Sex by Educational Attainment in Rockville
Average earnings in Rockville are $47,353 for men and $19,980 for women, a difference of 57.8%. Men with an educational attainment of college or associate's degree enjoy the highest average annual earnings of $57,794, while those with high school diploma education earn the least with $46,397. Women with an educational attainment of graduate degree earn the most with the average annual earnings of $60,962, while those with bachelor's degree education have the smallest earnings of $50,729.
| Educational Attainment | Male Income | Female Income |
| Less than High School | - | - |
| High School Diploma | $46,397 | $0 |
| College or Associate's Degree | $57,794 | $0 |
| Bachelor's Degree | - | - |
| Graduate Degree | - | - |
| Total | $47,353 | $19,980 |
Family Income in Rockville
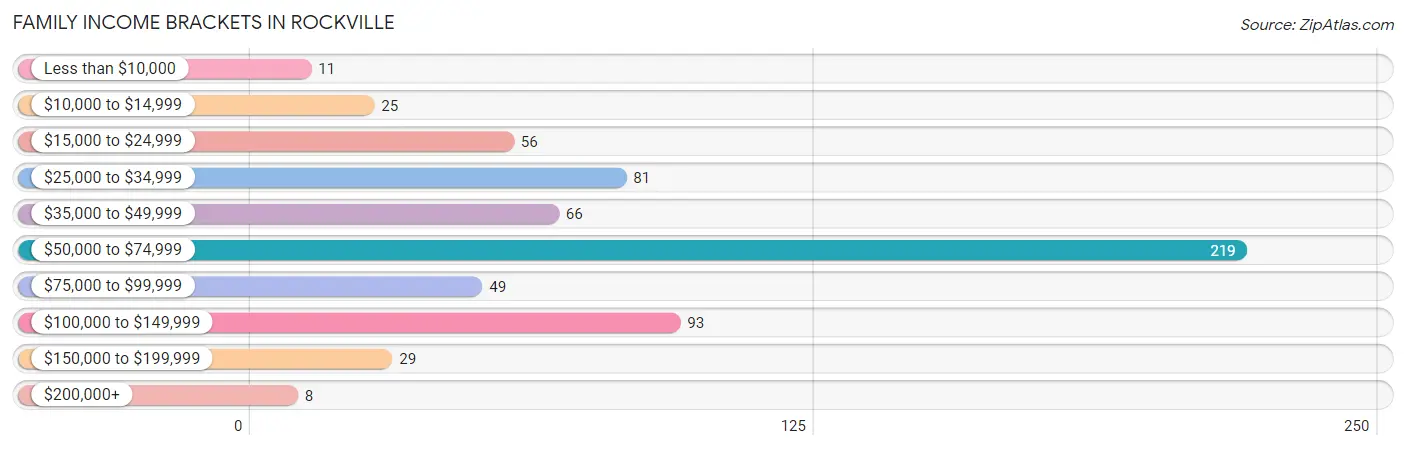
Family Income Brackets in Rockville
According to the Rockville family income data, there are 219 families falling into the $50,000 to $74,999 income range, which is the most common income bracket and makes up 34.4% of all families. Conversely, the $200,000+ income bracket is the least frequent group with only 8 families (1.3%) belonging to this category.
| Income Bracket | # Families | % Families |
| Less than $10,000 | 11 | 1.7% |
| $10,000 to $14,999 | 25 | 3.9% |
| $15,000 to $24,999 | 56 | 8.8% |
| $25,000 to $34,999 | 81 | 12.7% |
| $35,000 to $49,999 | 66 | 10.4% |
| $50,000 to $74,999 | 219 | 34.4% |
| $75,000 to $99,999 | 49 | 7.7% |
| $100,000 to $149,999 | 93 | 14.6% |
| $150,000 to $199,999 | 29 | 4.6% |
| $200,000+ | 8 | 1.3% |
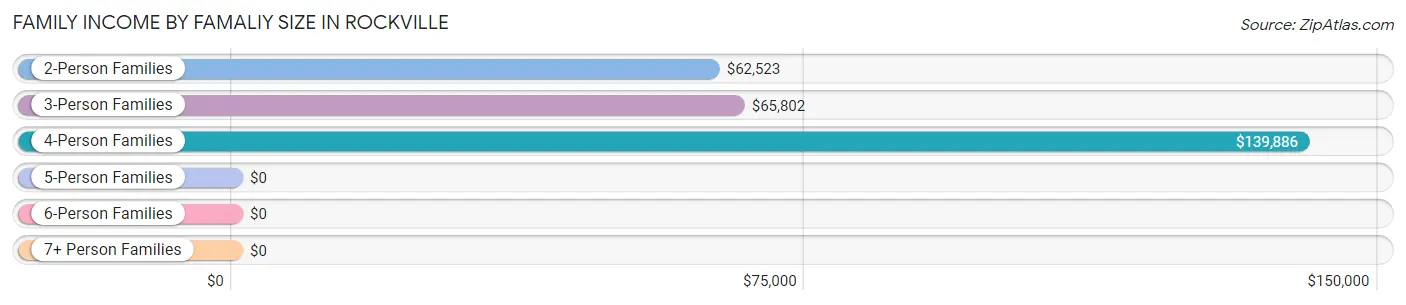
Family Income by Famaliy Size in Rockville
4-person families (27 | 4.2%) account for the highest median family income in Rockville with $139,886 per family, while 4-person families (27 | 4.2%) have the highest median income of $34,972 per family member.
| Income Bracket | # Families | Median Income |
| 2-Person Families | 401 (62.9%) | $62,523 |
| 3-Person Families | 152 (23.9%) | $65,802 |
| 4-Person Families | 27 (4.2%) | $139,886 |
| 5-Person Families | 44 (6.9%) | $0 |
| 6-Person Families | 13 (2.0%) | $0 |
| 7+ Person Families | 0 (0.0%) | $0 |
| Total | 637 (100.0%) | $63,341 |
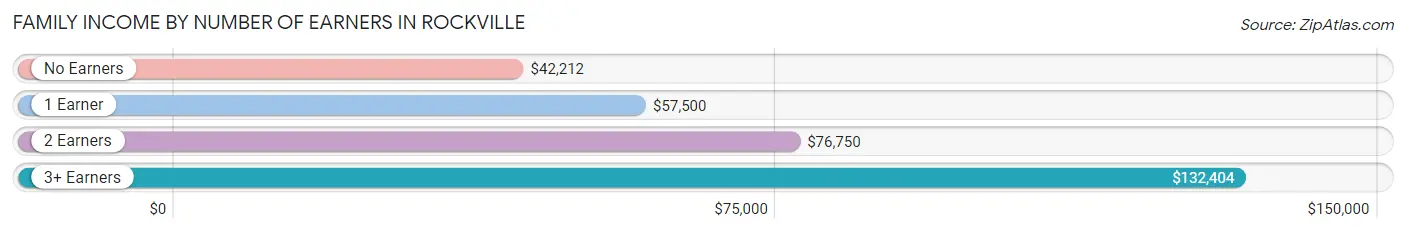
Family Income by Number of Earners in Rockville
The median family income in Rockville is $63,341, with families comprising 3+ earners (39) having the highest median family income of $132,404, while families with no earners (95) have the lowest median family income of $42,212, accounting for 6.1% and 14.9% of families, respectively.
| Number of Earners | # Families | Median Income |
| No Earners | 95 (14.9%) | $42,212 |
| 1 Earner | 316 (49.6%) | $57,500 |
| 2 Earners | 187 (29.4%) | $76,750 |
| 3+ Earners | 39 (6.1%) | $132,404 |
| Total | 637 (100.0%) | $63,341 |
Household Income in Rockville
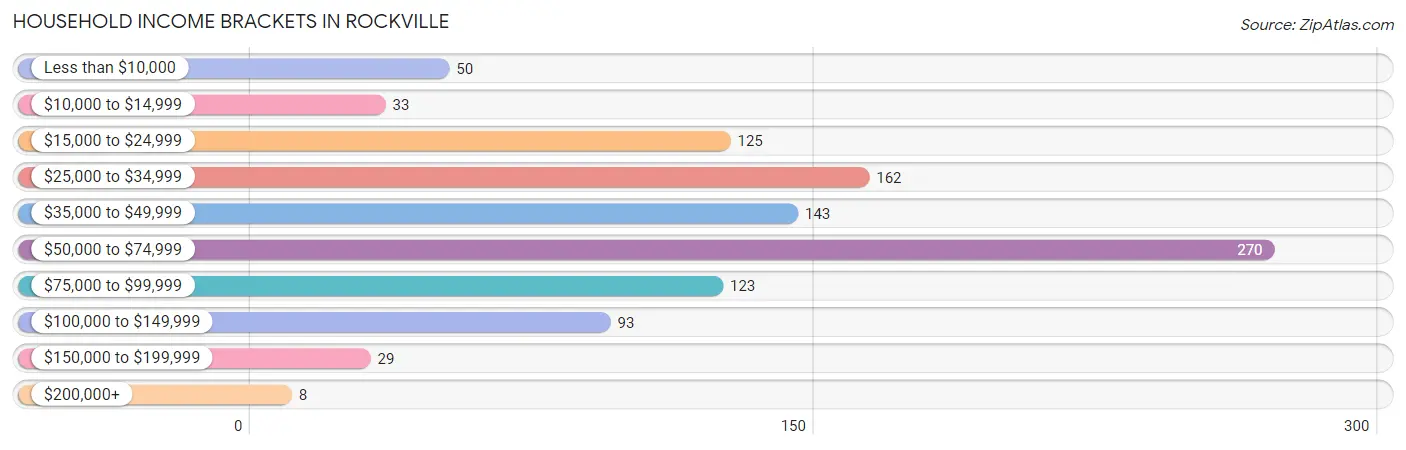
Household Income Brackets in Rockville
With 270 households falling in the category, the $50,000 to $74,999 income range is the most frequent in Rockville, accounting for 26.1% of all households. In contrast, only 8 households (0.8%) fall into the $200,000+ income bracket, making it the least populous group.
| Income Bracket | # Households | % Households |
| Less than $10,000 | 50 | 4.8% |
| $10,000 to $14,999 | 33 | 3.2% |
| $15,000 to $24,999 | 125 | 12.1% |
| $25,000 to $34,999 | 162 | 15.6% |
| $35,000 to $49,999 | 143 | 13.8% |
| $50,000 to $74,999 | 270 | 26.1% |
| $75,000 to $99,999 | 123 | 11.9% |
| $100,000 to $149,999 | 93 | 9.0% |
| $150,000 to $199,999 | 29 | 2.8% |
| $200,000+ | 8 | 0.8% |
Household Income by Householder Age in Rockville
The median household income in Rockville is $50,625, with the highest median household income of $63,912 found in the 45 to 64 years age bracket for the primary householder. A total of 469 households (45.3%) fall into this category. Meanwhile, the 25 to 44 years age bracket for the primary householder has the lowest median household income of $0, with 165 households (15.9%) in this group.
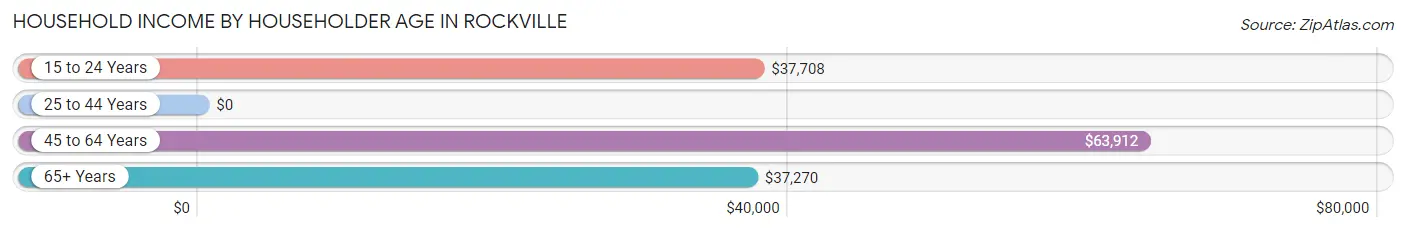
| Income Bracket | # Households | Median Income |
| 15 to 24 Years | 29 (2.8%) | $37,708 |
| 25 to 44 Years | 165 (15.9%) | $0 |
| 45 to 64 Years | 469 (45.3%) | $63,912 |
| 65+ Years | 373 (36.0%) | $37,270 |
| Total | 1,036 (100.0%) | $50,625 |
Poverty in Rockville
Income Below Poverty by Sex and Age in Rockville
With 15.7% poverty level for males and 32.4% for females among the residents of Rockville, under 5 year old males and 6 to 11 year old females are the most vulnerable to poverty, with 25 males (47.2%) and 112 females (100.0%) in their respective age groups living below the poverty level.
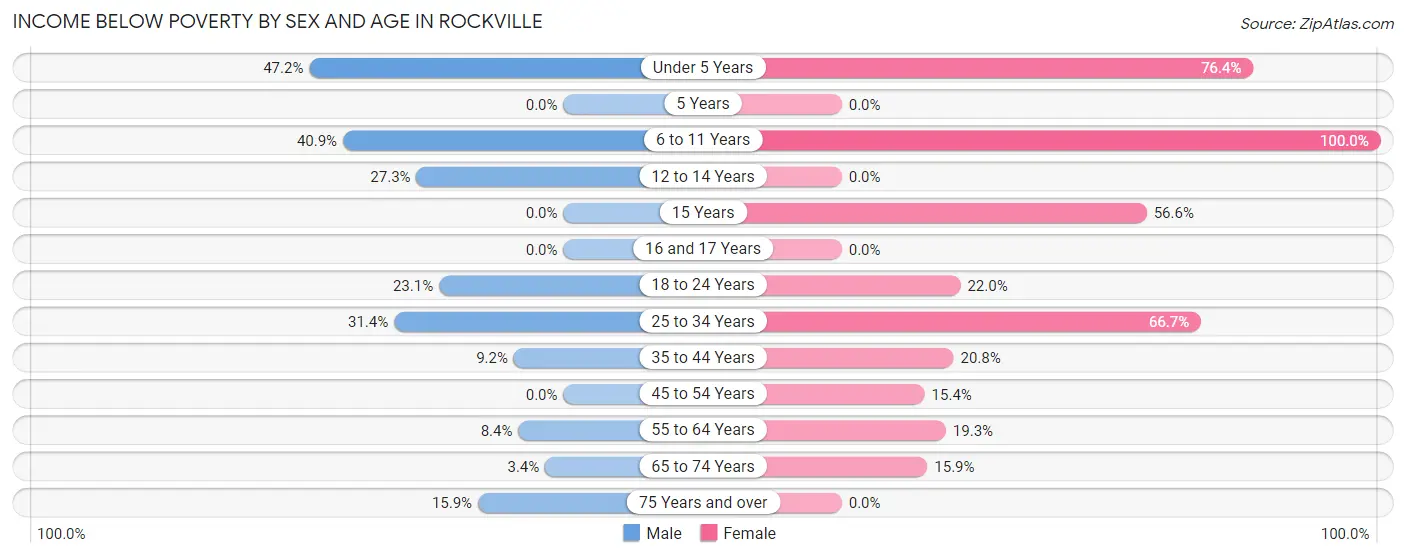
| Age Bracket | Male | Female |
| Under 5 Years | 25 (47.2%) | 42 (76.4%) |
| 5 Years | 0 (0.0%) | 0 (0.0%) |
| 6 to 11 Years | 18 (40.9%) | 112 (100.0%) |
| 12 to 14 Years | 18 (27.3%) | 0 (0.0%) |
| 15 Years | 0 (0.0%) | 30 (56.6%) |
| 16 and 17 Years | 0 (0.0%) | 0 (0.0%) |
| 18 to 24 Years | 45 (23.1%) | 13 (22.0%) |
| 25 to 34 Years | 33 (31.4%) | 136 (66.7%) |
| 35 to 44 Years | 8 (9.2%) | 11 (20.7%) |
| 45 to 54 Years | 0 (0.0%) | 28 (15.4%) |
| 55 to 64 Years | 19 (8.4%) | 40 (19.3%) |
| 65 to 74 Years | 5 (3.4%) | 27 (15.9%) |
| 75 Years and over | 13 (15.9%) | 0 (0.0%) |
| Total | 184 (15.7%) | 439 (32.4%) |
Income Above Poverty by Sex and Age in Rockville
According to the poverty statistics in Rockville, males aged 15 years and females aged 5 years are the age groups that are most secure financially, with 100.0% of males and 100.0% of females in these age groups living above the poverty line.
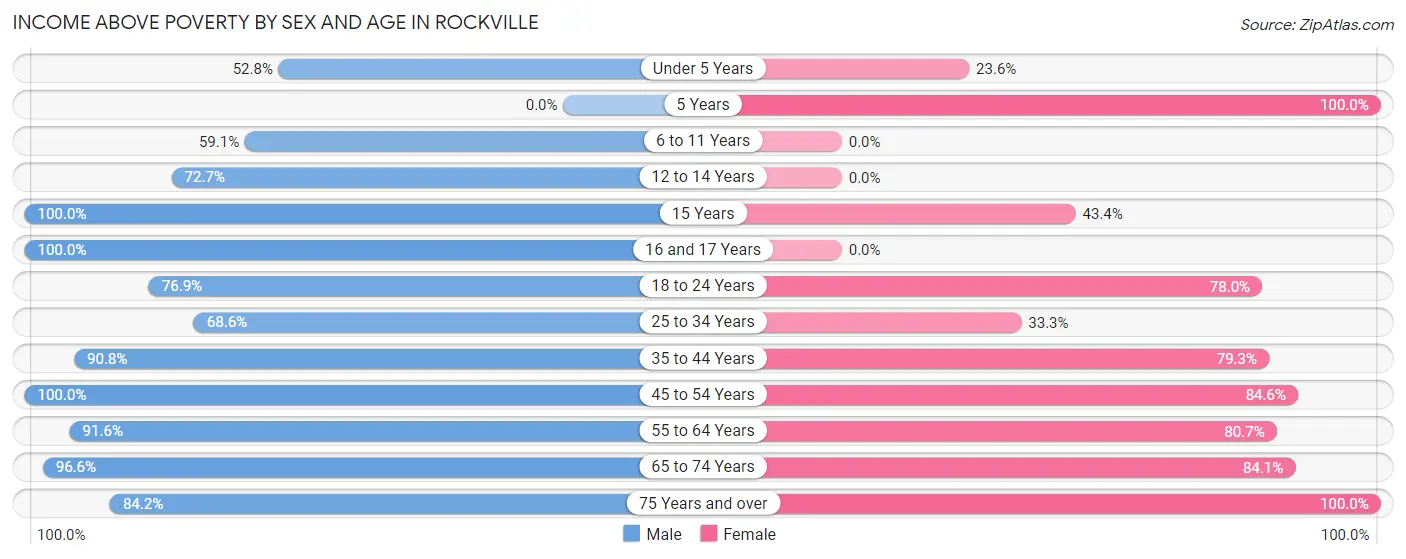
| Age Bracket | Male | Female |
| Under 5 Years | 28 (52.8%) | 13 (23.6%) |
| 5 Years | 0 (0.0%) | 9 (100.0%) |
| 6 to 11 Years | 26 (59.1%) | 0 (0.0%) |
| 12 to 14 Years | 48 (72.7%) | 0 (0.0%) |
| 15 Years | 10 (100.0%) | 23 (43.4%) |
| 16 and 17 Years | 23 (100.0%) | 0 (0.0%) |
| 18 to 24 Years | 150 (76.9%) | 46 (78.0%) |
| 25 to 34 Years | 72 (68.6%) | 68 (33.3%) |
| 35 to 44 Years | 79 (90.8%) | 42 (79.2%) |
| 45 to 54 Years | 133 (100.0%) | 154 (84.6%) |
| 55 to 64 Years | 208 (91.6%) | 167 (80.7%) |
| 65 to 74 Years | 143 (96.6%) | 143 (84.1%) |
| 75 Years and over | 69 (84.2%) | 253 (100.0%) |
| Total | 989 (84.3%) | 918 (67.6%) |
Income Below Poverty Among Married-Couple Families in Rockville
The poverty statistics for married-couple families in Rockville show that 6.9% or 24 of the total 350 families live below the poverty line. Families with 3 or 4 children have the highest poverty rate of 56.7%, comprising of 17 families. On the other hand, families with 1 or 2 children have the lowest poverty rate of 0.0%, which includes 0 families.
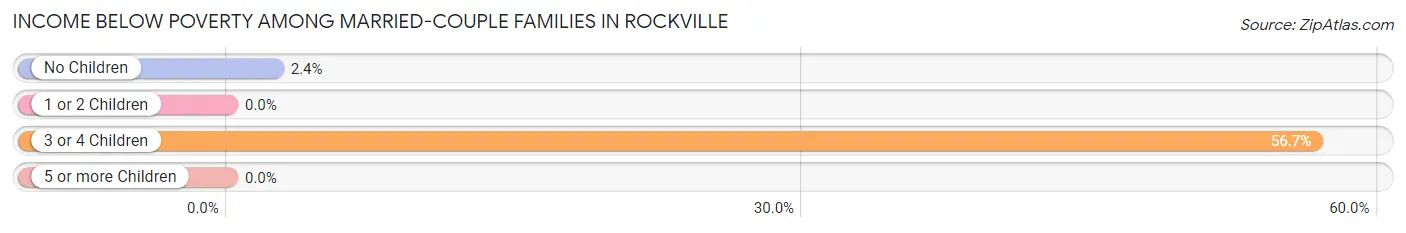
| Children | Above Poverty | Below Poverty |
| No Children | 286 (97.6%) | 7 (2.4%) |
| 1 or 2 Children | 27 (100.0%) | 0 (0.0%) |
| 3 or 4 Children | 13 (43.3%) | 17 (56.7%) |
| 5 or more Children | 0 (0.0%) | 0 (0.0%) |
| Total | 326 (93.1%) | 24 (6.9%) |
Income Below Poverty Among Single-Parent Households in Rockville
According to the poverty data in Rockville, 13.0% or 18 single-father households and 47.0% or 70 single-mother households are living below the poverty line. Among single-father households, those with no children have the highest poverty rate, with 18 households (20.0%) experiencing poverty. Likewise, among single-mother households, those with 3 or 4 children have the highest poverty rate, with 27 households (100.0%) falling below the poverty line.
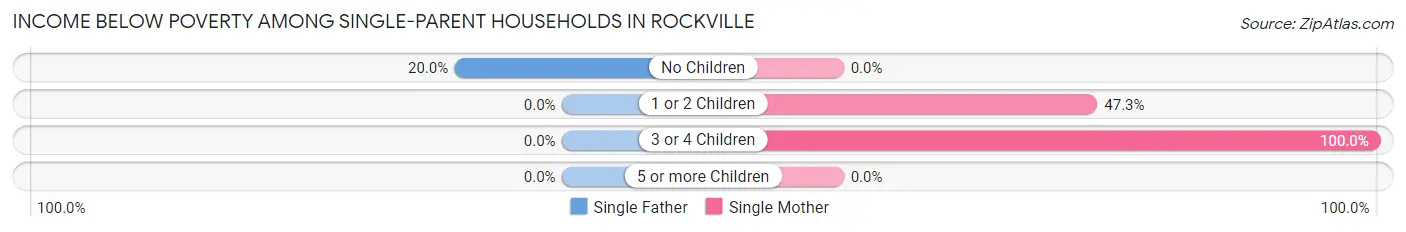
| Children | Single Father | Single Mother |
| No Children | 18 (20.0%) | 0 (0.0%) |
| 1 or 2 Children | 0 (0.0%) | 43 (47.2%) |
| 3 or 4 Children | 0 (0.0%) | 27 (100.0%) |
| 5 or more Children | 0 (0.0%) | 0 (0.0%) |
| Total | 18 (13.0%) | 70 (47.0%) |
Income Below Poverty Among Married-Couple vs Single-Parent Households in Rockville
The poverty data for Rockville shows that 24 of the married-couple family households (6.9%) and 88 of the single-parent households (30.7%) are living below the poverty level. Within the married-couple family households, those with 3 or 4 children have the highest poverty rate, with 17 households (56.7%) falling below the poverty line. Among the single-parent households, those with 3 or 4 children have the highest poverty rate, with 27 household (100.0%) living below poverty.
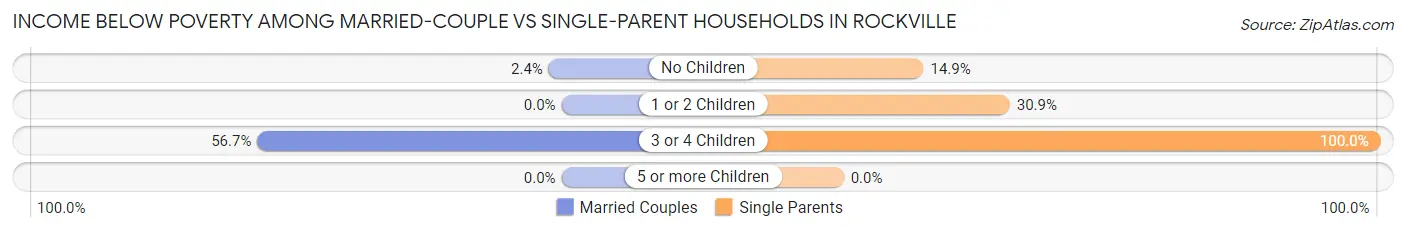
| Children | Married-Couple Families | Single-Parent Households |
| No Children | 7 (2.4%) | 18 (14.9%) |
| 1 or 2 Children | 0 (0.0%) | 43 (30.9%) |
| 3 or 4 Children | 17 (56.7%) | 27 (100.0%) |
| 5 or more Children | 0 (0.0%) | 0 (0.0%) |
| Total | 24 (6.9%) | 88 (30.7%) |
Race in Rockville
The most populous races in Rockville are White / Caucasian (2,403 | 94.7%), Two or more Races (131 | 5.2%), and Black / African American (3 | 0.1%).
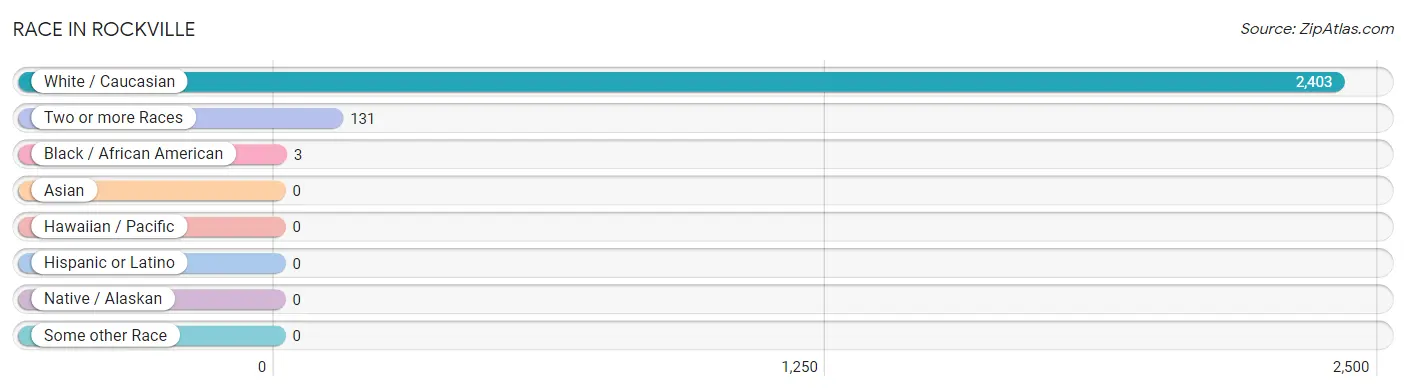
| Race | # Population | % Population |
| Asian | 0 | 0.0% |
| Black / African American | 3 | 0.1% |
| Hawaiian / Pacific | 0 | 0.0% |
| Hispanic or Latino | 0 | 0.0% |
| Native / Alaskan | 0 | 0.0% |
| White / Caucasian | 2,403 | 94.7% |
| Two or more Races | 131 | 5.2% |
| Some other Race | 0 | 0.0% |
| Total | 2,537 | 100.0% |
Ancestry in Rockville
The most populous ancestries reported in Rockville are English (506 | 19.9%), German (445 | 17.5%), Irish (236 | 9.3%), American (233 | 9.2%), and Scottish (118 | 4.6%), together accounting for 60.6% of all Rockville residents.

| Ancestry | # Population | % Population |
| American | 233 | 9.2% |
| British | 29 | 1.1% |
| Cherokee | 12 | 0.5% |
| Dutch | 10 | 0.4% |
| English | 506 | 19.9% |
| European | 75 | 3.0% |
| French | 71 | 2.8% |
| German | 445 | 17.5% |
| Irish | 236 | 9.3% |
| Italian | 44 | 1.7% |
| Pennsylvania German | 6 | 0.2% |
| Polish | 25 | 1.0% |
| Scotch-Irish | 14 | 0.5% |
| Scottish | 118 | 4.6% |
| Swedish | 9 | 0.4% |
| Ukrainian | 3 | 0.1% |
| Welsh | 5 | 0.2% | View All 17 Rows |
Immigrants in Rockville
The most numerous immigrant groups reported in Rockville came from Eastern Europe (3 | 0.1%), Europe (3 | 0.1%), and Ukraine (3 | 0.1%), together accounting for 0.4% of all Rockville residents.
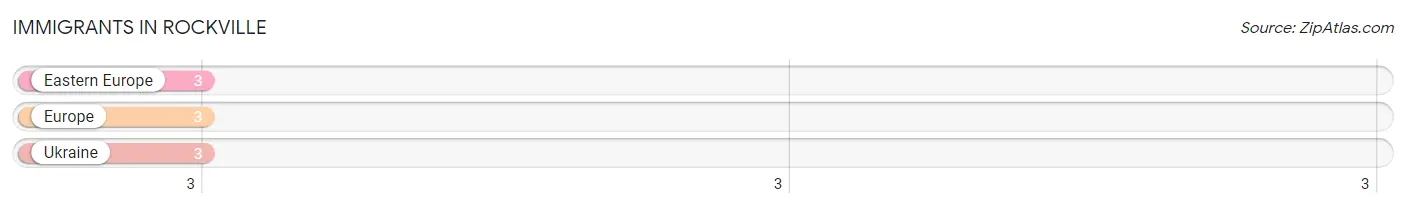
| Immigration Origin | # Population | % Population |
| Eastern Europe | 3 | 0.1% |
| Europe | 3 | 0.1% |
| Ukraine | 3 | 0.1% | View All 3 Rows |
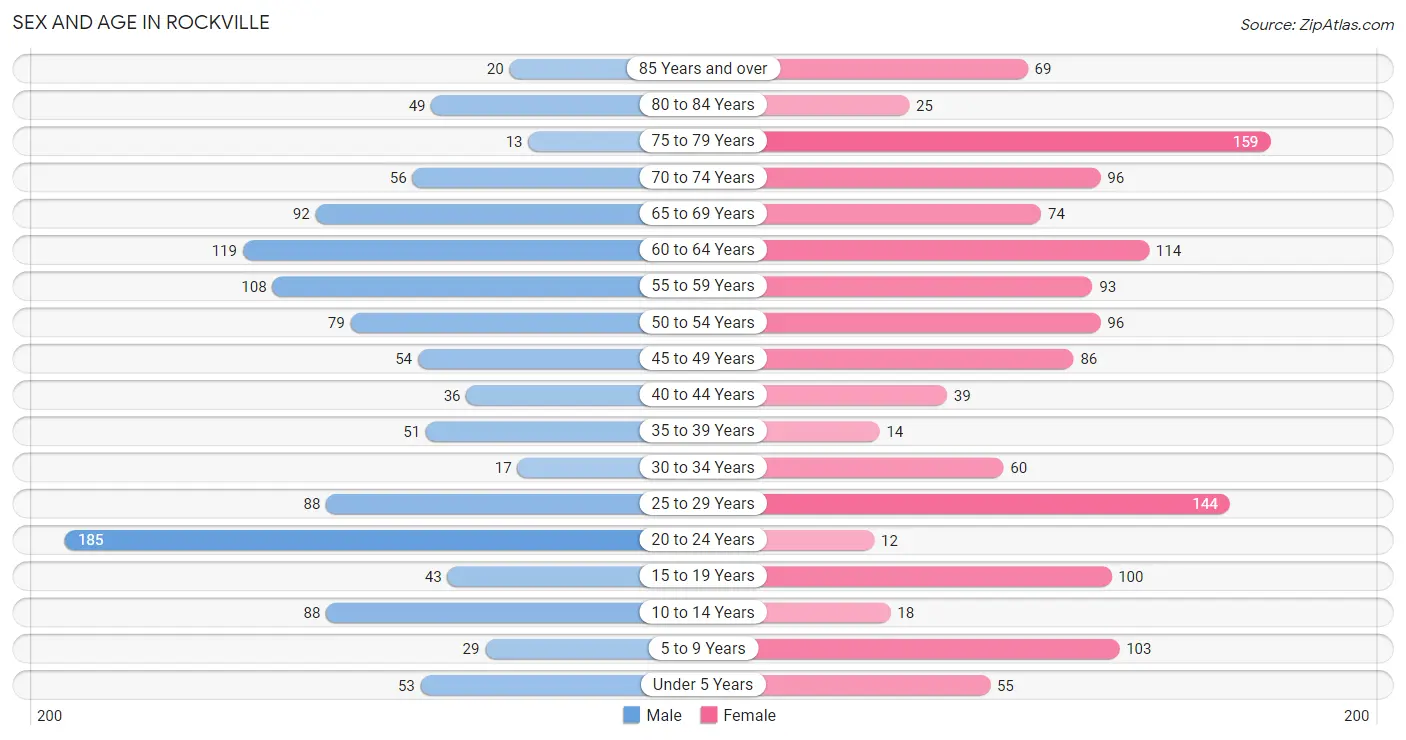
Sex and Age in Rockville
Sex and Age in Rockville
The most populous age groups in Rockville are 20 to 24 Years (185 | 15.7%) for men and 75 to 79 Years (159 | 11.7%) for women.
| Age Bracket | Male | Female |
| Under 5 Years | 53 (4.5%) | 55 (4.1%) |
| 5 to 9 Years | 29 (2.5%) | 103 (7.6%) |
| 10 to 14 Years | 88 (7.5%) | 18 (1.3%) |
| 15 to 19 Years | 43 (3.6%) | 100 (7.4%) |
| 20 to 24 Years | 185 (15.7%) | 12 (0.9%) |
| 25 to 29 Years | 88 (7.5%) | 144 (10.6%) |
| 30 to 34 Years | 17 (1.4%) | 60 (4.4%) |
| 35 to 39 Years | 51 (4.3%) | 14 (1.0%) |
| 40 to 44 Years | 36 (3.0%) | 39 (2.9%) |
| 45 to 49 Years | 54 (4.6%) | 86 (6.3%) |
| 50 to 54 Years | 79 (6.7%) | 96 (7.1%) |
| 55 to 59 Years | 108 (9.1%) | 93 (6.9%) |
| 60 to 64 Years | 119 (10.1%) | 114 (8.4%) |
| 65 to 69 Years | 92 (7.8%) | 74 (5.4%) |
| 70 to 74 Years | 56 (4.8%) | 96 (7.1%) |
| 75 to 79 Years | 13 (1.1%) | 159 (11.7%) |
| 80 to 84 Years | 49 (4.2%) | 25 (1.8%) |
| 85 Years and over | 20 (1.7%) | 69 (5.1%) |
| Total | 1,180 (100.0%) | 1,357 (100.0%) |
Families and Households in Rockville
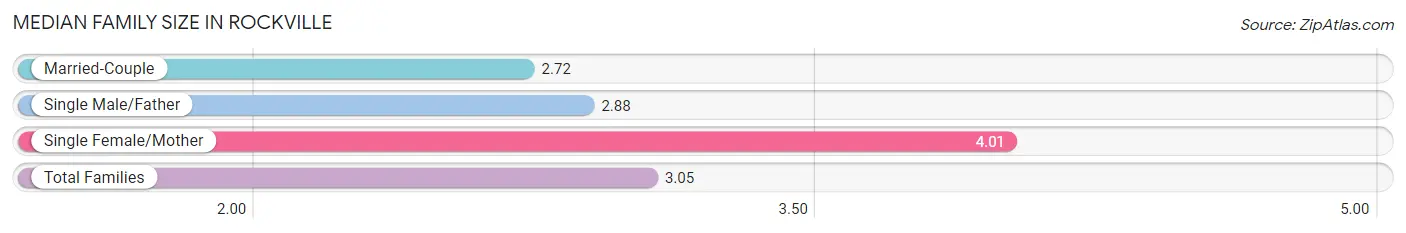
Median Family Size in Rockville
The median family size in Rockville is 3.05 persons per family, with single female/mother families (149 | 23.4%) accounting for the largest median family size of 4.01 persons per family. On the other hand, married-couple families (350 | 54.9%) represent the smallest median family size with 2.72 persons per family.
| Family Type | # Families | Family Size |
| Married-Couple | 350 (54.9%) | 2.72 |
| Single Male/Father | 138 (21.7%) | 2.88 |
| Single Female/Mother | 149 (23.4%) | 4.01 |
| Total Families | 637 (100.0%) | 3.05 |
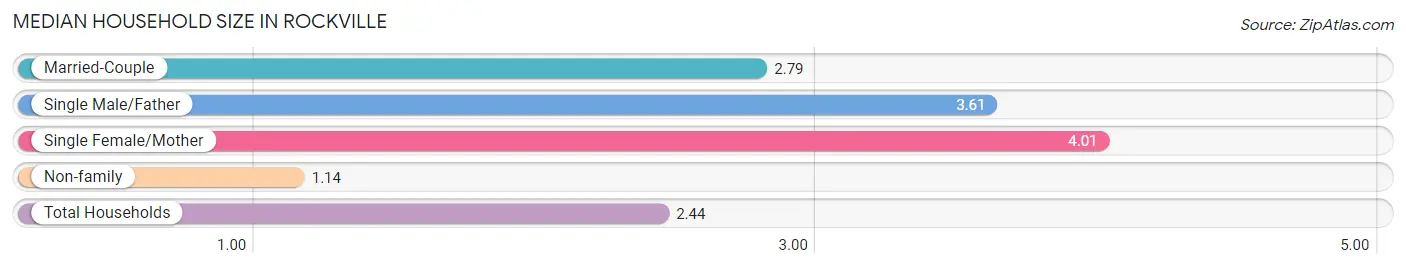
Median Household Size in Rockville
The median household size in Rockville is 2.44 persons per household, with single female/mother households (149 | 14.4%) accounting for the largest median household size of 4.01 persons per household. non-family households (399 | 38.5%) represent the smallest median household size with 1.14 persons per household.
| Household Type | # Households | Household Size |
| Married-Couple | 350 (33.8%) | 2.79 |
| Single Male/Father | 138 (13.3%) | 3.61 |
| Single Female/Mother | 149 (14.4%) | 4.01 |
| Non-family | 399 (38.5%) | 1.14 |
| Total Households | 1,036 (100.0%) | 2.44 |
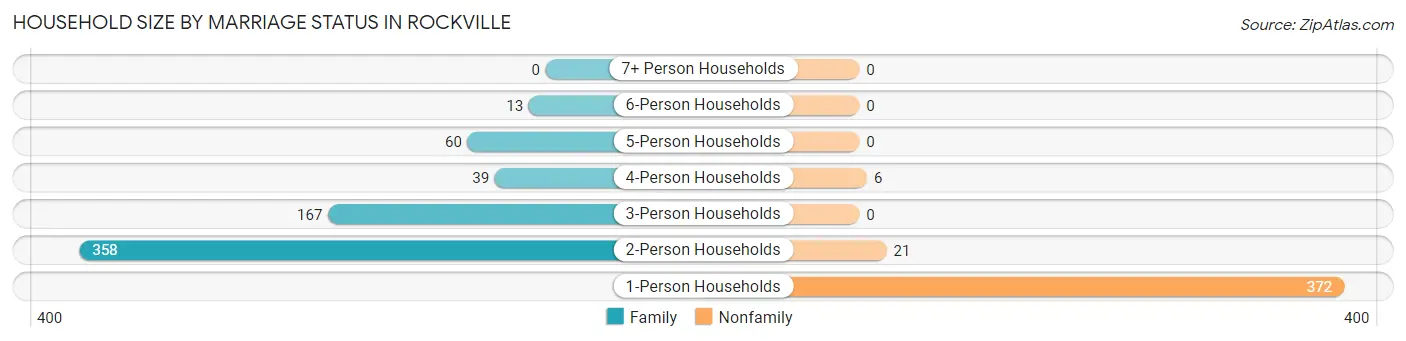
Household Size by Marriage Status in Rockville
Out of a total of 1,036 households in Rockville, 637 (61.5%) are family households, while 399 (38.5%) are nonfamily households. The most numerous type of family households are 2-person households, comprising 358, and the most common type of nonfamily households are 1-person households, comprising 372.
| Household Size | Family Households | Nonfamily Households |
| 1-Person Households | - | 372 (35.9%) |
| 2-Person Households | 358 (34.6%) | 21 (2.0%) |
| 3-Person Households | 167 (16.1%) | 0 (0.0%) |
| 4-Person Households | 39 (3.8%) | 6 (0.6%) |
| 5-Person Households | 60 (5.8%) | 0 (0.0%) |
| 6-Person Households | 13 (1.3%) | 0 (0.0%) |
| 7+ Person Households | 0 (0.0%) | 0 (0.0%) |
| Total | 637 (61.5%) | 399 (38.5%) |
Female Fertility in Rockville
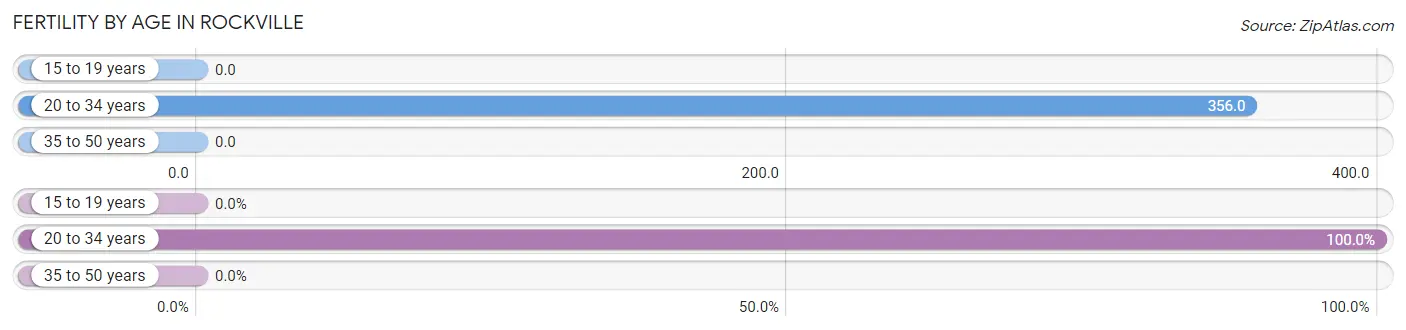
Fertility by Age in Rockville
Average fertility rate in Rockville is 158.0 births per 1,000 women. Women in the age bracket of 20 to 34 years have the highest fertility rate with 356.0 births per 1,000 women. Women in the age bracket of 20 to 34 years acount for 100.0% of all women with births.
| Age Bracket | Women with Births | Births / 1,000 Women |
| 15 to 19 years | 0 (0.0%) | 0.0 |
| 20 to 34 years | 77 (100.0%) | 356.0 |
| 35 to 50 years | 0 (0.0%) | 0.0 |
| Total | 77 (100.0%) | 158.0 |
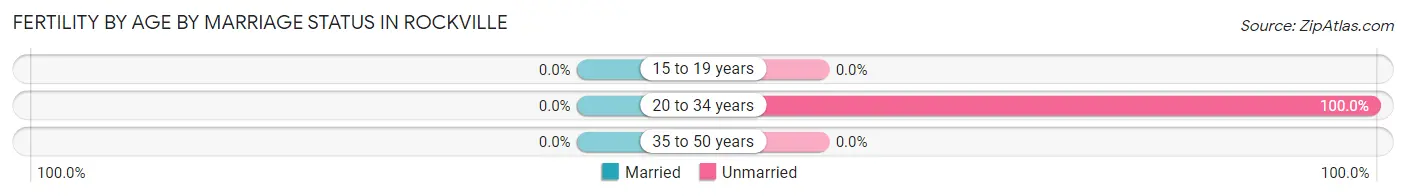
Fertility by Age by Marriage Status in Rockville
| Age Bracket | Married | Unmarried |
| 15 to 19 years | 0 (0.0%) | 0 (0.0%) |
| 20 to 34 years | 0 (0.0%) | 77 (100.0%) |
| 35 to 50 years | 0 (0.0%) | 0 (0.0%) |
| Total | 0 (0.0%) | 77 (100.0%) |
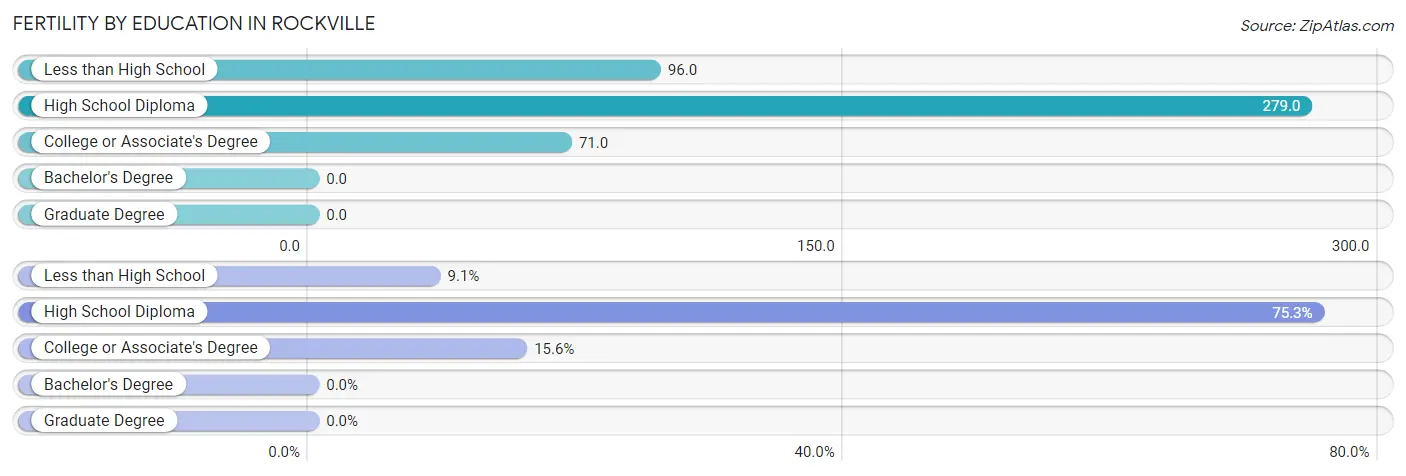
Fertility by Education in Rockville
| Educational Attainment | Women with Births | Births / 1,000 Women |
| Less than High School | 7 (9.1%) | 96.0 |
| High School Diploma | 58 (75.3%) | 279.0 |
| College or Associate's Degree | 12 (15.6%) | 71.0 |
| Bachelor's Degree | 0 (0.0%) | 0.0 |
| Graduate Degree | 0 (0.0%) | 0.0 |
| Total | 77 (100.0%) | 158.0 |
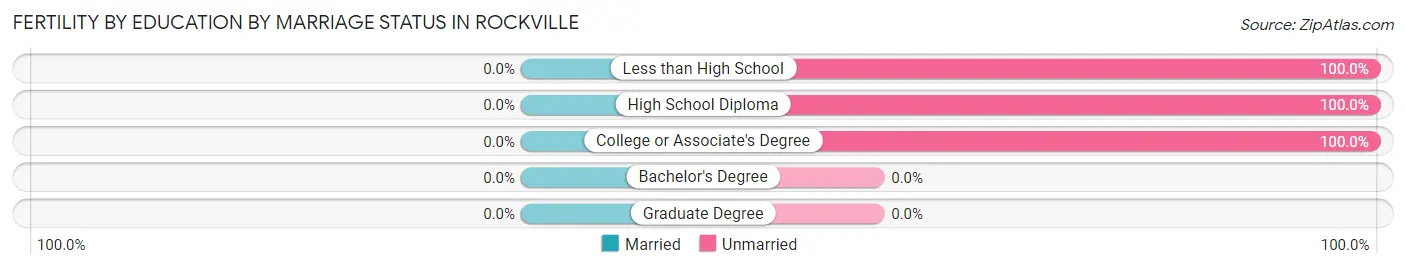
Fertility by Education by Marriage Status in Rockville
| Educational Attainment | Married | Unmarried |
| Less than High School | 0 (0.0%) | 7 (100.0%) |
| High School Diploma | 0 (0.0%) | 58 (100.0%) |
| College or Associate's Degree | 0 (0.0%) | 12 (100.0%) |
| Bachelor's Degree | 0 (0.0%) | 0 (0.0%) |
| Graduate Degree | 0 (0.0%) | 0 (0.0%) |
| Total | 0 (0.0%) | 77 (100.0%) |
Employment Characteristics in Rockville
Employment by Class of Employer in Rockville
Among the 983 employed individuals in Rockville, private company employees (610 | 62.1%), state government employees (89 | 9.0%), and not-for-profit organizations (83 | 8.4%) make up the most common classes of employment.
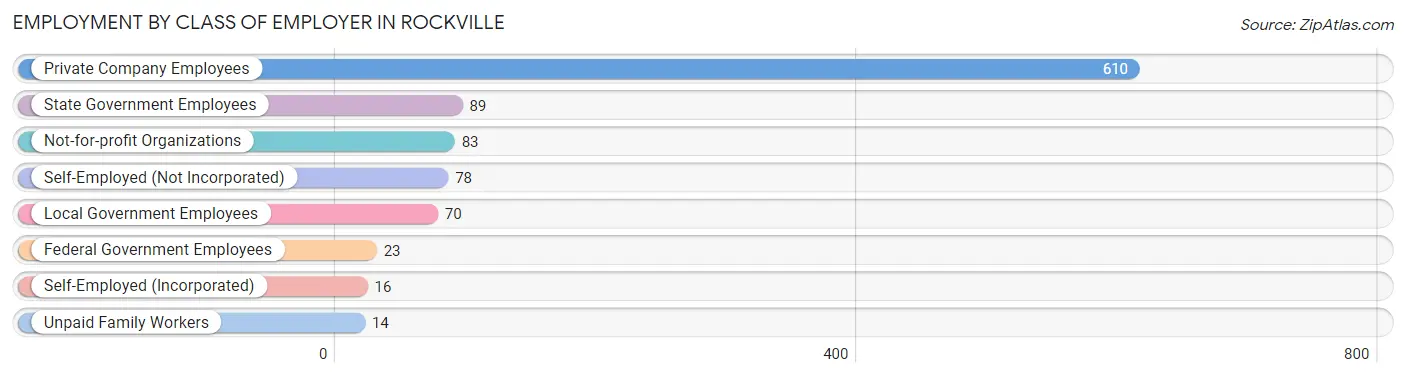
| Employer Class | # Employees | % Employees |
| Private Company Employees | 610 | 62.1% |
| Self-Employed (Incorporated) | 16 | 1.6% |
| Self-Employed (Not Incorporated) | 78 | 7.9% |
| Not-for-profit Organizations | 83 | 8.4% |
| Local Government Employees | 70 | 7.1% |
| State Government Employees | 89 | 9.0% |
| Federal Government Employees | 23 | 2.3% |
| Unpaid Family Workers | 14 | 1.4% |
| Total | 983 | 100.0% |
Employment Status by Age in Rockville
According to the labor force statistics for Rockville, out of the total population over 16 years of age (2,128), 51.8% or 1,102 individuals are in the labor force, with 8.7% or 96 of them unemployed. The age group with the highest labor force participation rate is 20 to 24 years, with 85.3% or 168 individuals in the labor force. Within the labor force, the 16 to 19 years age range has the highest percentage of unemployed individuals, with 36.6% or 15 of them being unemployed.
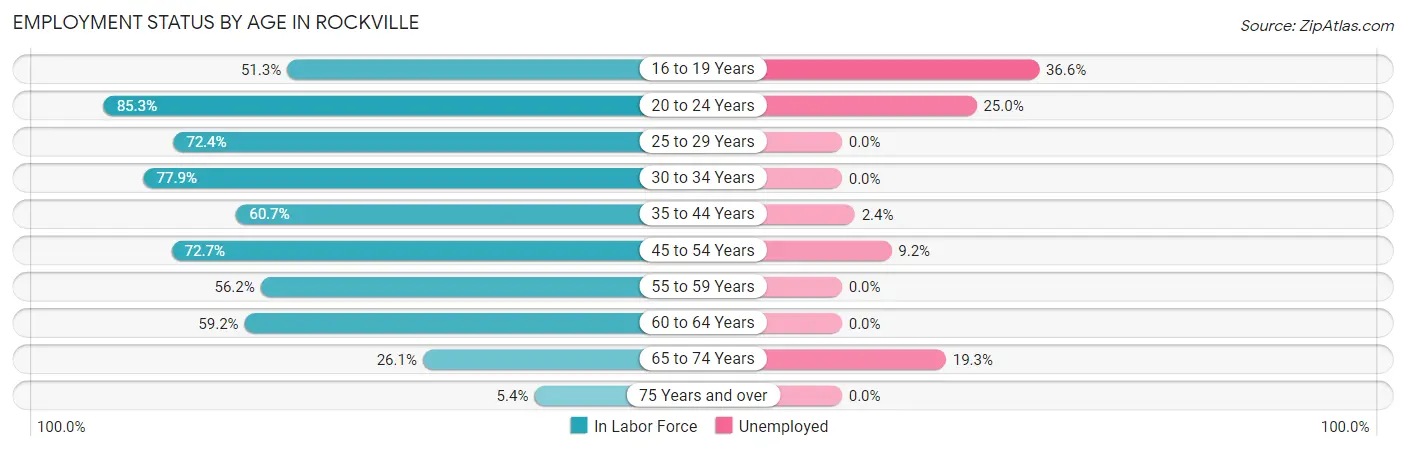
| Age Bracket | In Labor Force | Unemployed |
| 16 to 19 Years | 41 (51.3%) | 15 (36.6%) |
| 20 to 24 Years | 168 (85.3%) | 42 (25.0%) |
| 25 to 29 Years | 168 (72.4%) | 0 (0.0%) |
| 30 to 34 Years | 60 (77.9%) | 0 (0.0%) |
| 35 to 44 Years | 85 (60.7%) | 2 (2.4%) |
| 45 to 54 Years | 229 (72.7%) | 21 (9.2%) |
| 55 to 59 Years | 113 (56.2%) | 0 (0.0%) |
| 60 to 64 Years | 138 (59.2%) | 0 (0.0%) |
| 65 to 74 Years | 83 (26.1%) | 16 (19.3%) |
| 75 Years and over | 18 (5.4%) | 0 (0.0%) |
| Total | 1,102 (51.8%) | 96 (8.7%) |
Employment Status by Educational Attainment in Rockville
According to labor force statistics for Rockville, 66.2% of individuals (793) out of the total population between 25 and 64 years of age (1,198) are in the labor force, with 2.9% or 23 of them being unemployed. The group with the highest labor force participation rate are those with the educational attainment of bachelor's degree or higher, with 84.5% or 169 individuals in the labor force. Within the labor force, individuals with high school diploma education have the highest percentage of unemployment, with 4.8% or 14 of them being unemployed.
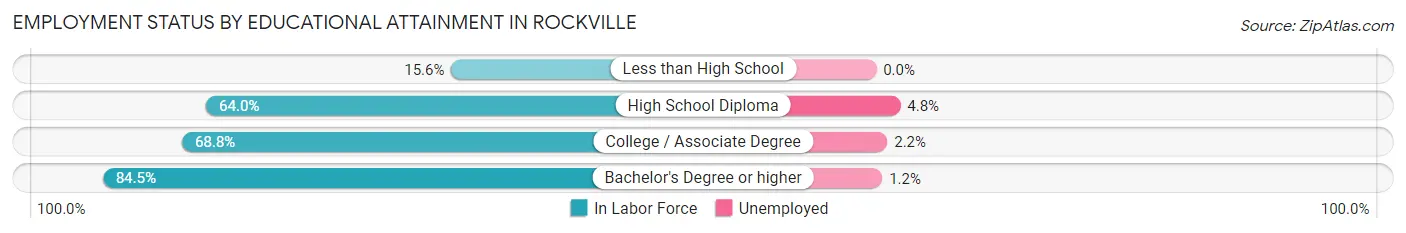
| Educational Attainment | In Labor Force | Unemployed |
| Less than High School | 12 (15.6%) | 0 (0.0%) |
| High School Diploma | 292 (64.0%) | 22 (4.8%) |
| College / Associate Degree | 320 (68.8%) | 10 (2.2%) |
| Bachelor's Degree or higher | 169 (84.5%) | 2 (1.2%) |
| Total | 793 (66.2%) | 35 (2.9%) |
Employment Occupations by Sex in Rockville
Management, Business, Science and Arts Occupations
The most common Management, Business, Science and Arts occupations in Rockville are Management (62 | 6.2%), Community & Social Service (62 | 6.2%), Computers, Engineering & Science (46 | 4.6%), Education Instruction & Library (38 | 3.8%), and Health Diagnosing & Treating (28 | 2.8%).
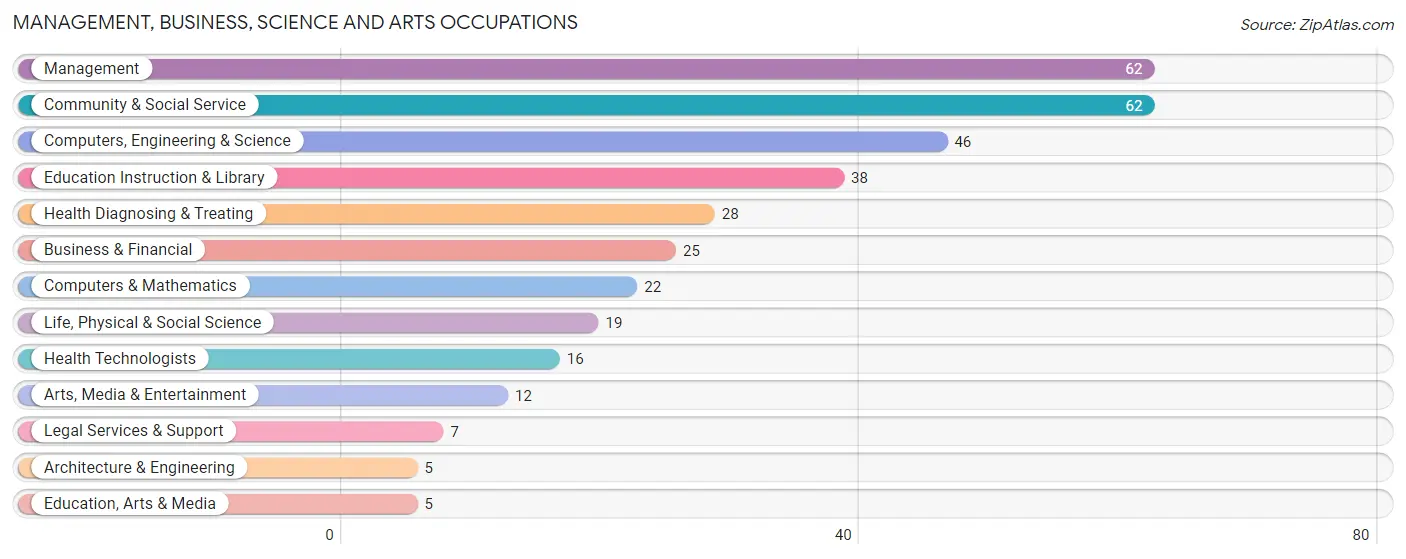
Management, Business, Science and Arts Occupations by Sex
Within the Management, Business, Science and Arts occupations in Rockville, the most male-oriented occupations are Life, Physical & Social Science (100.0%), Computers, Engineering & Science (76.1%), and Business & Financial (76.0%), while the most female-oriented occupations are Architecture & Engineering (100.0%), Education, Arts & Media (100.0%), and Legal Services & Support (100.0%).
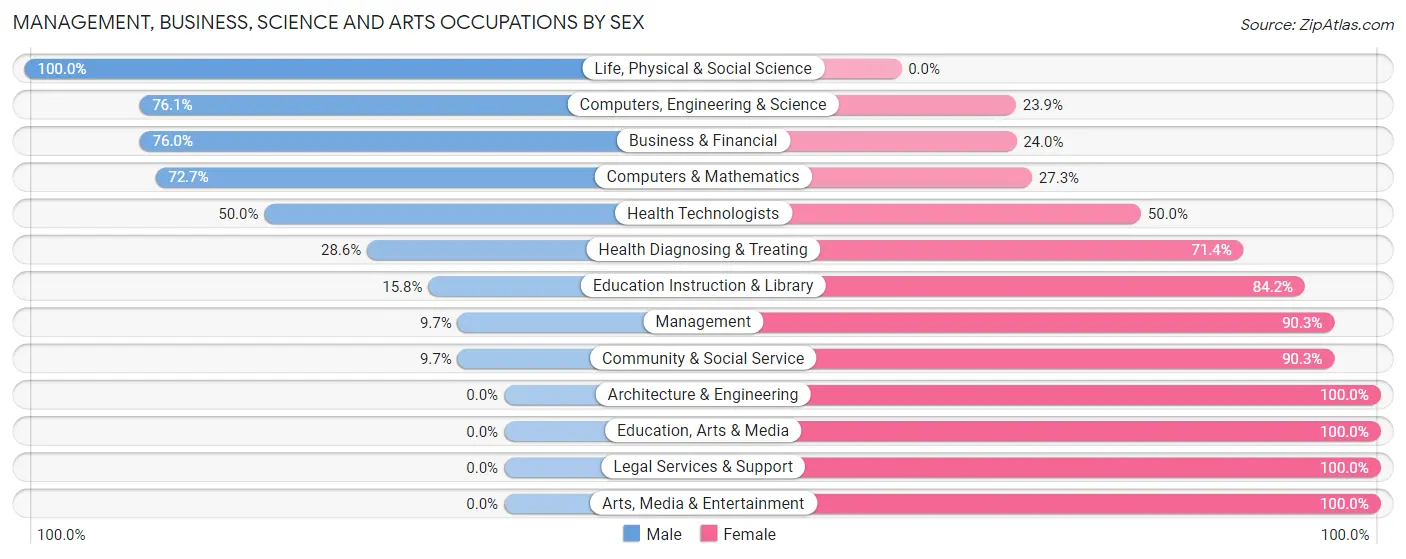
| Occupation | Male | Female |
| Management | 6 (9.7%) | 56 (90.3%) |
| Business & Financial | 19 (76.0%) | 6 (24.0%) |
| Computers, Engineering & Science | 35 (76.1%) | 11 (23.9%) |
| Computers & Mathematics | 16 (72.7%) | 6 (27.3%) |
| Architecture & Engineering | 0 (0.0%) | 5 (100.0%) |
| Life, Physical & Social Science | 19 (100.0%) | 0 (0.0%) |
| Community & Social Service | 6 (9.7%) | 56 (90.3%) |
| Education, Arts & Media | 0 (0.0%) | 5 (100.0%) |
| Legal Services & Support | 0 (0.0%) | 7 (100.0%) |
| Education Instruction & Library | 6 (15.8%) | 32 (84.2%) |
| Arts, Media & Entertainment | 0 (0.0%) | 12 (100.0%) |
| Health Diagnosing & Treating | 8 (28.6%) | 20 (71.4%) |
| Health Technologists | 8 (50.0%) | 8 (50.0%) |
| Total (Category) | 74 (33.2%) | 149 (66.8%) |
| Total (Overall) | 491 (48.8%) | 516 (51.2%) |
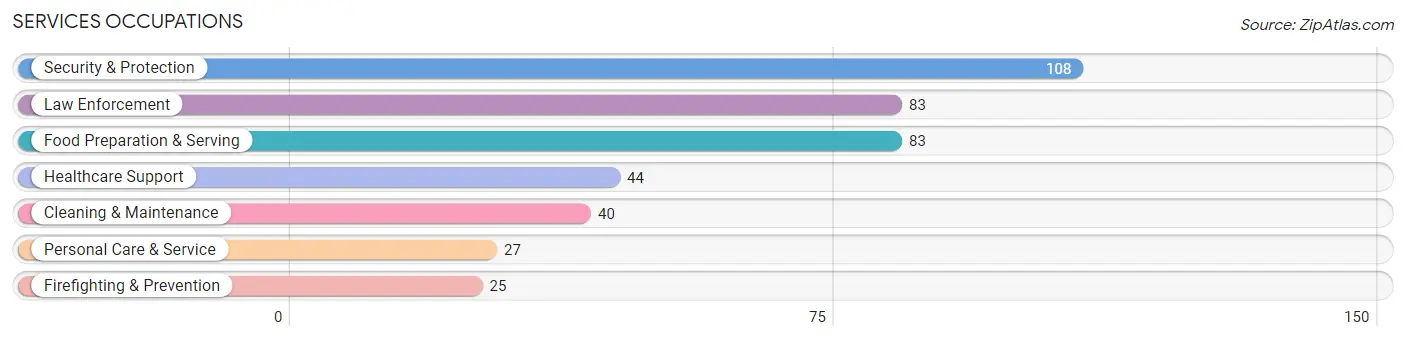
Services Occupations
The most common Services occupations in Rockville are Security & Protection (108 | 10.7%), Law Enforcement (83 | 8.2%), Food Preparation & Serving (83 | 8.2%), Healthcare Support (44 | 4.4%), and Cleaning & Maintenance (40 | 4.0%).
Services Occupations by Sex
Within the Services occupations in Rockville, the most male-oriented occupations are Firefighting & Prevention (100.0%), Security & Protection (92.6%), and Law Enforcement (90.4%), while the most female-oriented occupations are Food Preparation & Serving (89.2%), Personal Care & Service (77.8%), and Healthcare Support (70.5%).
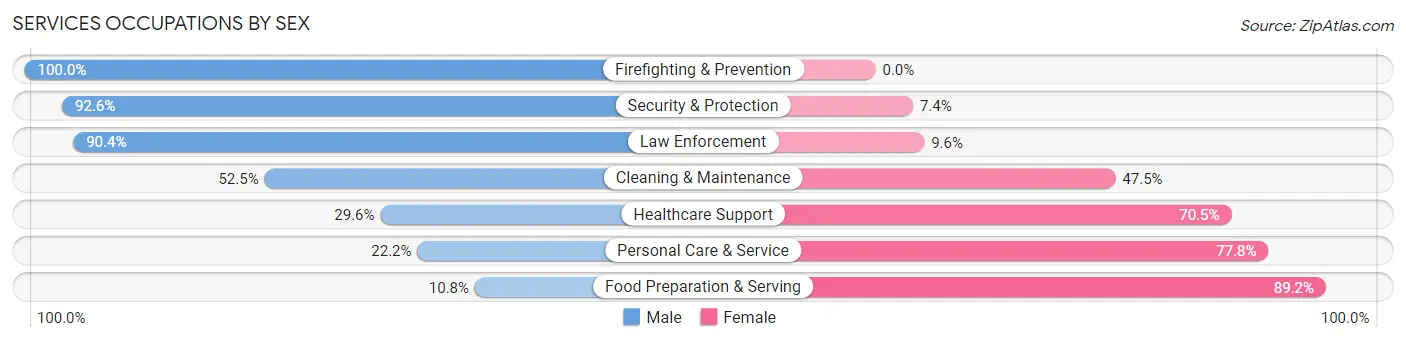
| Occupation | Male | Female |
| Healthcare Support | 13 (29.5%) | 31 (70.5%) |
| Security & Protection | 100 (92.6%) | 8 (7.4%) |
| Firefighting & Prevention | 25 (100.0%) | 0 (0.0%) |
| Law Enforcement | 75 (90.4%) | 8 (9.6%) |
| Food Preparation & Serving | 9 (10.8%) | 74 (89.2%) |
| Cleaning & Maintenance | 21 (52.5%) | 19 (47.5%) |
| Personal Care & Service | 6 (22.2%) | 21 (77.8%) |
| Total (Category) | 149 (49.3%) | 153 (50.7%) |
| Total (Overall) | 491 (48.8%) | 516 (51.2%) |
Sales and Office Occupations
The most common Sales and Office occupations in Rockville are Sales & Related (129 | 12.8%), and Office & Administration (53 | 5.3%).

Sales and Office Occupations by Sex
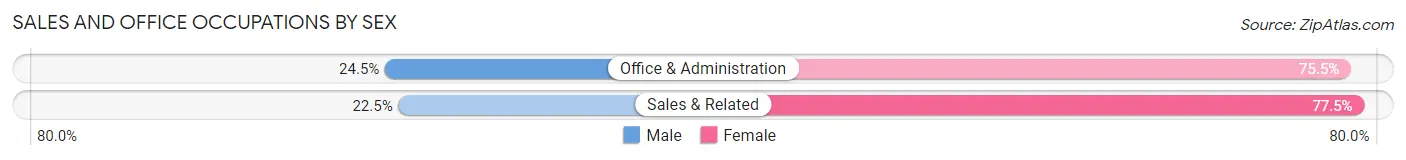
| Occupation | Male | Female |
| Sales & Related | 29 (22.5%) | 100 (77.5%) |
| Office & Administration | 13 (24.5%) | 40 (75.5%) |
| Total (Category) | 42 (23.1%) | 140 (76.9%) |
| Total (Overall) | 491 (48.8%) | 516 (51.2%) |
Natural Resources, Construction and Maintenance Occupations
The most common Natural Resources, Construction and Maintenance occupations in Rockville are Installation, Maintenance & Repair (24 | 2.4%), Construction & Extraction (13 | 1.3%), and Farming, Fishing & Forestry (3 | 0.3%).
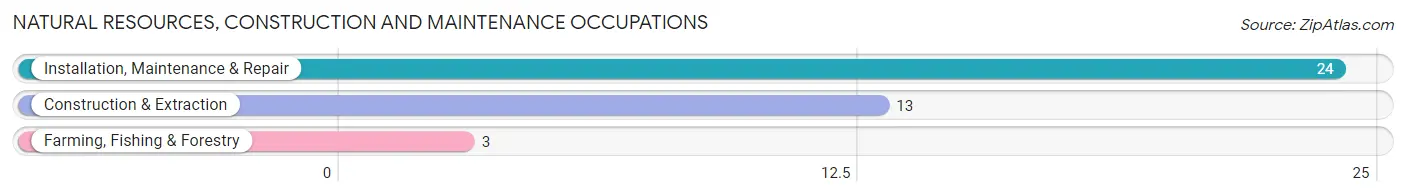
Natural Resources, Construction and Maintenance Occupations by Sex

| Occupation | Male | Female |
| Farming, Fishing & Forestry | 3 (100.0%) | 0 (0.0%) |
| Construction & Extraction | 13 (100.0%) | 0 (0.0%) |
| Installation, Maintenance & Repair | 24 (100.0%) | 0 (0.0%) |
| Total (Category) | 40 (100.0%) | 0 (0.0%) |
| Total (Overall) | 491 (48.8%) | 516 (51.2%) |
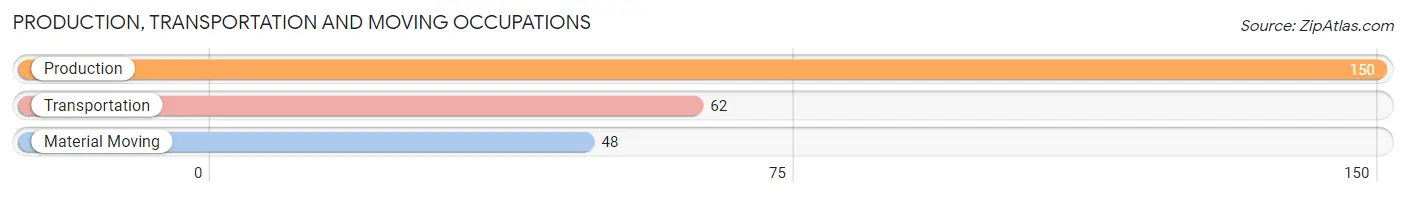
Production, Transportation and Moving Occupations
The most common Production, Transportation and Moving occupations in Rockville are Production (150 | 14.9%), Transportation (62 | 6.2%), and Material Moving (48 | 4.8%).
Production, Transportation and Moving Occupations by Sex
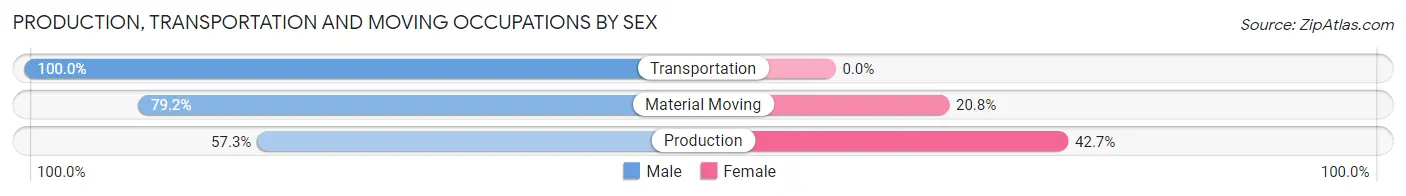
| Occupation | Male | Female |
| Production | 86 (57.3%) | 64 (42.7%) |
| Transportation | 62 (100.0%) | 0 (0.0%) |
| Material Moving | 38 (79.2%) | 10 (20.8%) |
| Total (Category) | 186 (71.5%) | 74 (28.5%) |
| Total (Overall) | 491 (48.8%) | 516 (51.2%) |
Employment Industries by Sex in Rockville
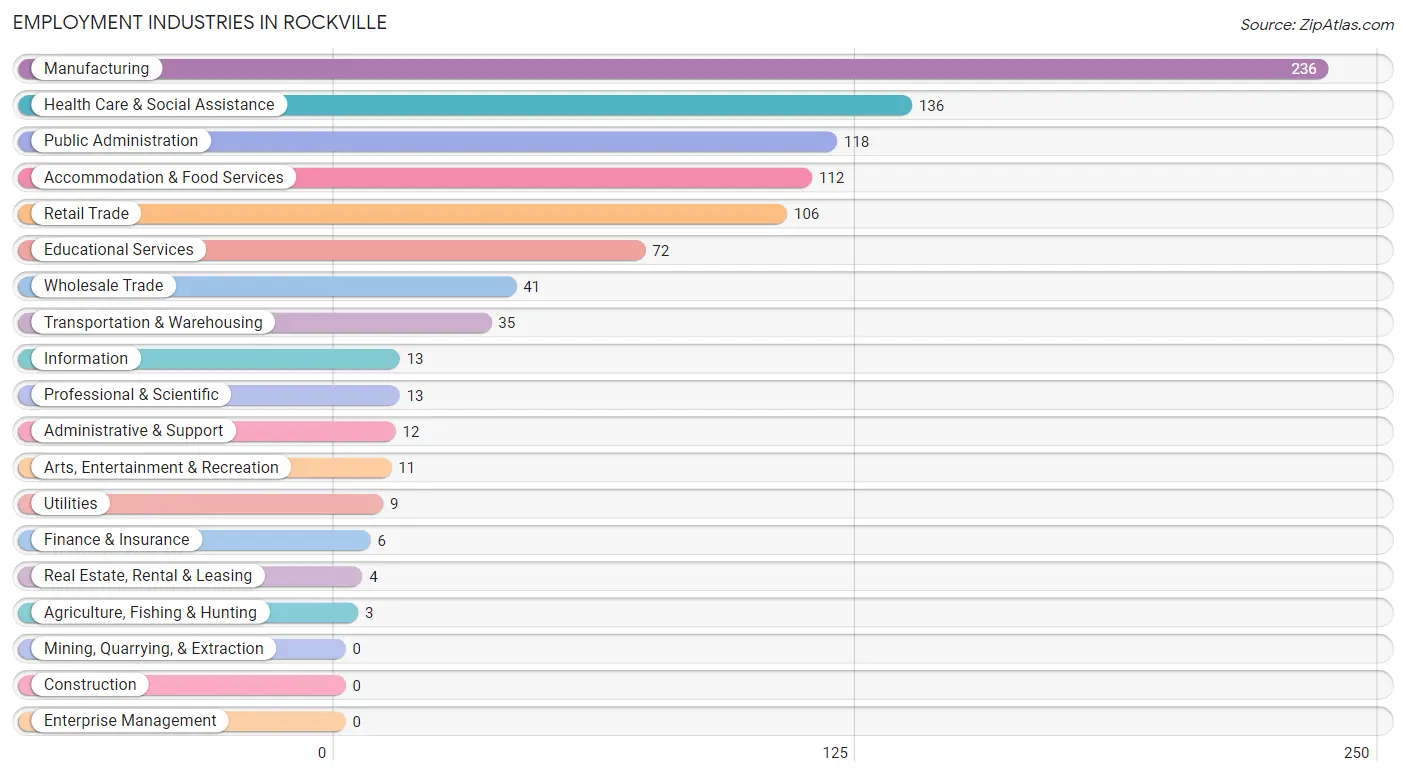
Employment Industries in Rockville
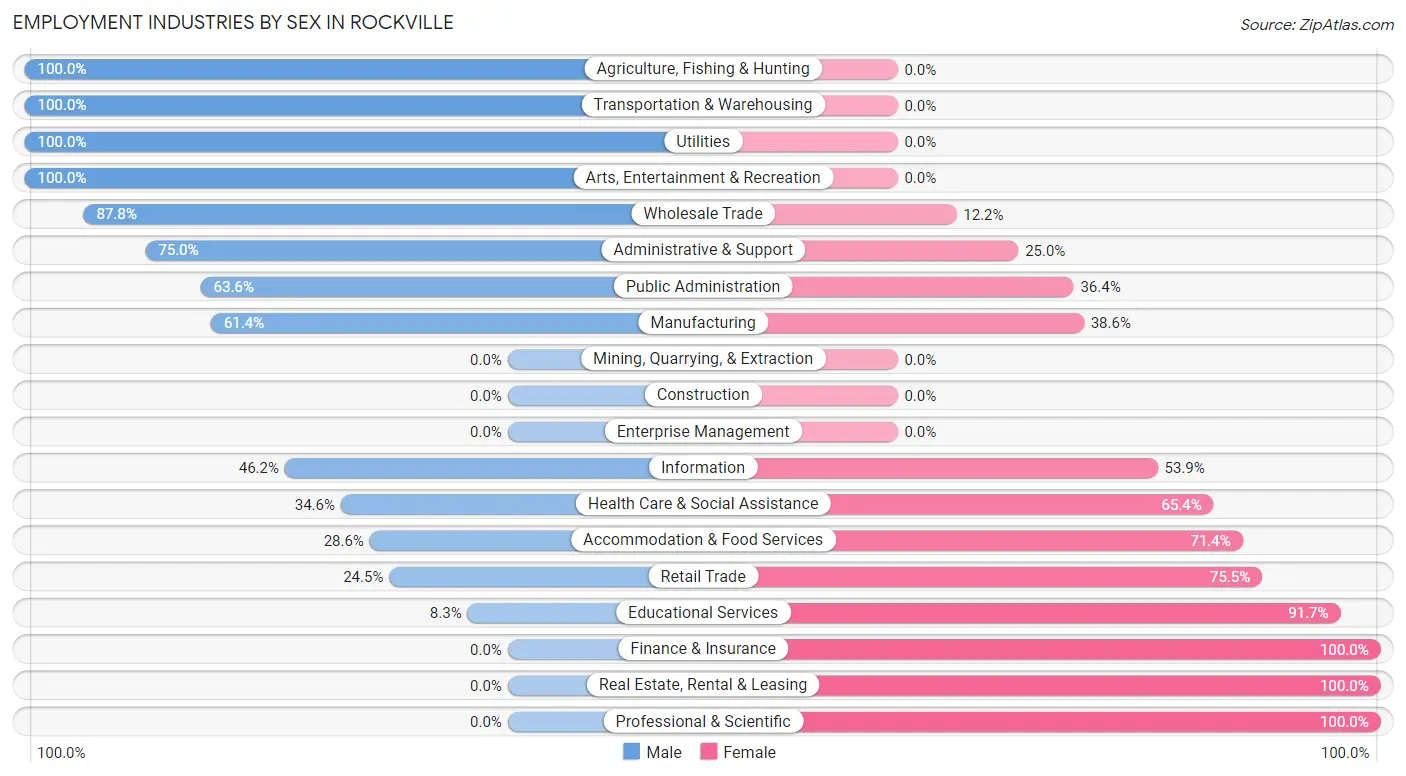
The major employment industries in Rockville include Manufacturing (236 | 23.4%), Health Care & Social Assistance (136 | 13.5%), Public Administration (118 | 11.7%), Accommodation & Food Services (112 | 11.1%), and Retail Trade (106 | 10.5%).
Employment Industries by Sex in Rockville
The Rockville industries that see more men than women are Agriculture, Fishing & Hunting (100.0%), Transportation & Warehousing (100.0%), and Utilities (100.0%), whereas the industries that tend to have a higher number of women are Finance & Insurance (100.0%), Real Estate, Rental & Leasing (100.0%), and Professional & Scientific (100.0%).
| Industry | Male | Female |
| Agriculture, Fishing & Hunting | 3 (100.0%) | 0 (0.0%) |
| Mining, Quarrying, & Extraction | 0 (0.0%) | 0 (0.0%) |
| Construction | 0 (0.0%) | 0 (0.0%) |
| Manufacturing | 145 (61.4%) | 91 (38.6%) |
| Wholesale Trade | 36 (87.8%) | 5 (12.2%) |
| Retail Trade | 26 (24.5%) | 80 (75.5%) |
| Transportation & Warehousing | 35 (100.0%) | 0 (0.0%) |
| Utilities | 9 (100.0%) | 0 (0.0%) |
| Information | 6 (46.2%) | 7 (53.8%) |
| Finance & Insurance | 0 (0.0%) | 6 (100.0%) |
| Real Estate, Rental & Leasing | 0 (0.0%) | 4 (100.0%) |
| Professional & Scientific | 0 (0.0%) | 13 (100.0%) |
| Enterprise Management | 0 (0.0%) | 0 (0.0%) |
| Administrative & Support | 9 (75.0%) | 3 (25.0%) |
| Educational Services | 6 (8.3%) | 66 (91.7%) |
| Health Care & Social Assistance | 47 (34.6%) | 89 (65.4%) |
| Arts, Entertainment & Recreation | 11 (100.0%) | 0 (0.0%) |
| Accommodation & Food Services | 32 (28.6%) | 80 (71.4%) |
| Public Administration | 75 (63.6%) | 43 (36.4%) |
| Total | 491 (48.8%) | 516 (51.2%) |
Education in Rockville
School Enrollment in Rockville
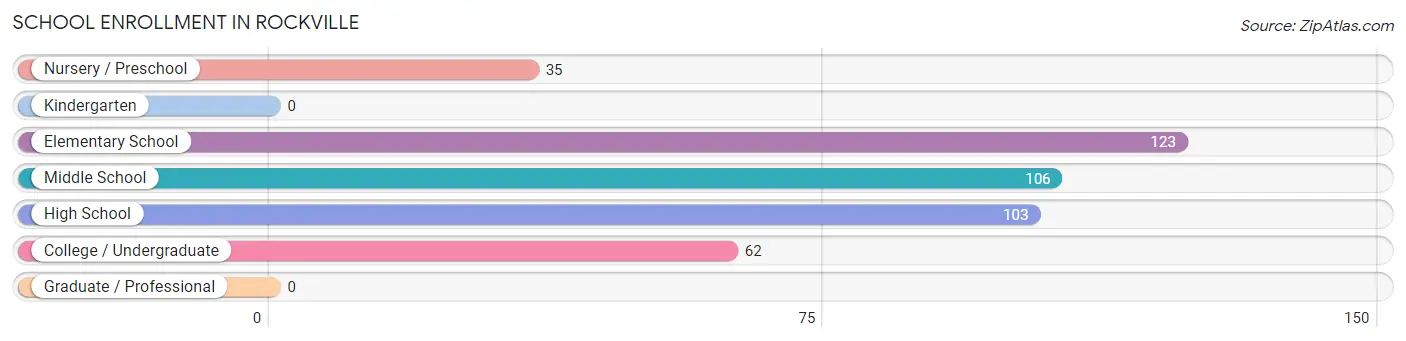
The most common levels of schooling among the 429 students in Rockville are elementary school (123 | 28.7%), middle school (106 | 24.7%), and high school (103 | 24.0%).
| School Level | # Students | % Students |
| Nursery / Preschool | 35 | 8.2% |
| Kindergarten | 0 | 0.0% |
| Elementary School | 123 | 28.7% |
| Middle School | 106 | 24.7% |
| High School | 103 | 24.0% |
| College / Undergraduate | 62 | 14.4% |
| Graduate / Professional | 0 | 0.0% |
| Total | 429 | 100.0% |
School Enrollment by Age by Funding Source in Rockville
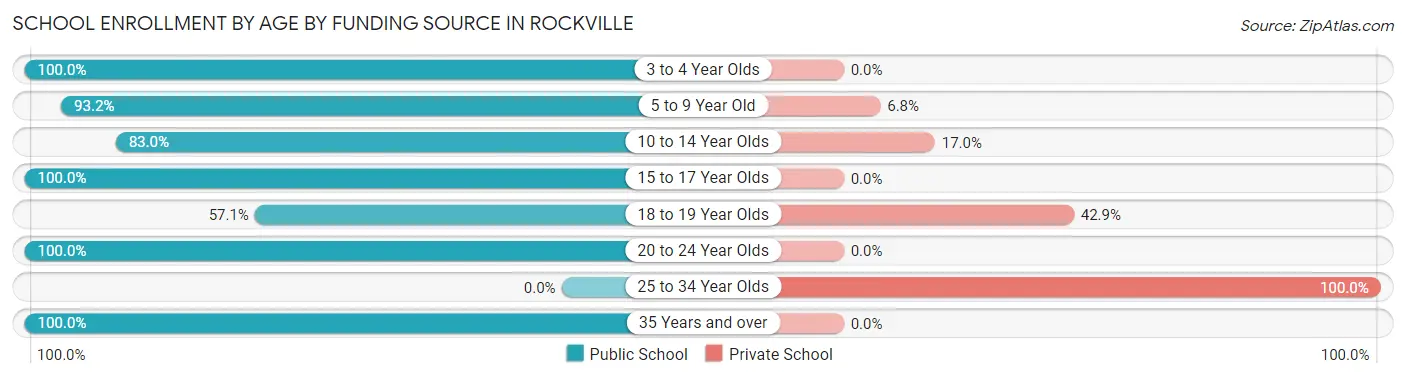
Out of a total of 429 students who are enrolled in schools in Rockville, 55 (12.8%) attend a private institution, while the remaining 374 (87.2%) are enrolled in public schools. The age group of 25 to 34 year olds has the highest likelihood of being enrolled in private schools, with 10 (100.0% in the age bracket) enrolled. Conversely, the age group of 3 to 4 year olds has the lowest likelihood of being enrolled in a private school, with 26 (100.0% in the age bracket) attending a public institution.
| Age Bracket | Public School | Private School |
| 3 to 4 Year Olds | 26 (100.0%) | 0 (0.0%) |
| 5 to 9 Year Old | 123 (93.2%) | 9 (6.8%) |
| 10 to 14 Year Olds | 88 (83.0%) | 18 (17.0%) |
| 15 to 17 Year Olds | 86 (100.0%) | 0 (0.0%) |
| 18 to 19 Year Olds | 24 (57.1%) | 18 (42.9%) |
| 20 to 24 Year Olds | 26 (100.0%) | 0 (0.0%) |
| 25 to 34 Year Olds | 0 (0.0%) | 10 (100.0%) |
| 35 Years and over | 1 (100.0%) | 0 (0.0%) |
| Total | 374 (87.2%) | 55 (12.8%) |
Educational Attainment by Field of Study in Rockville
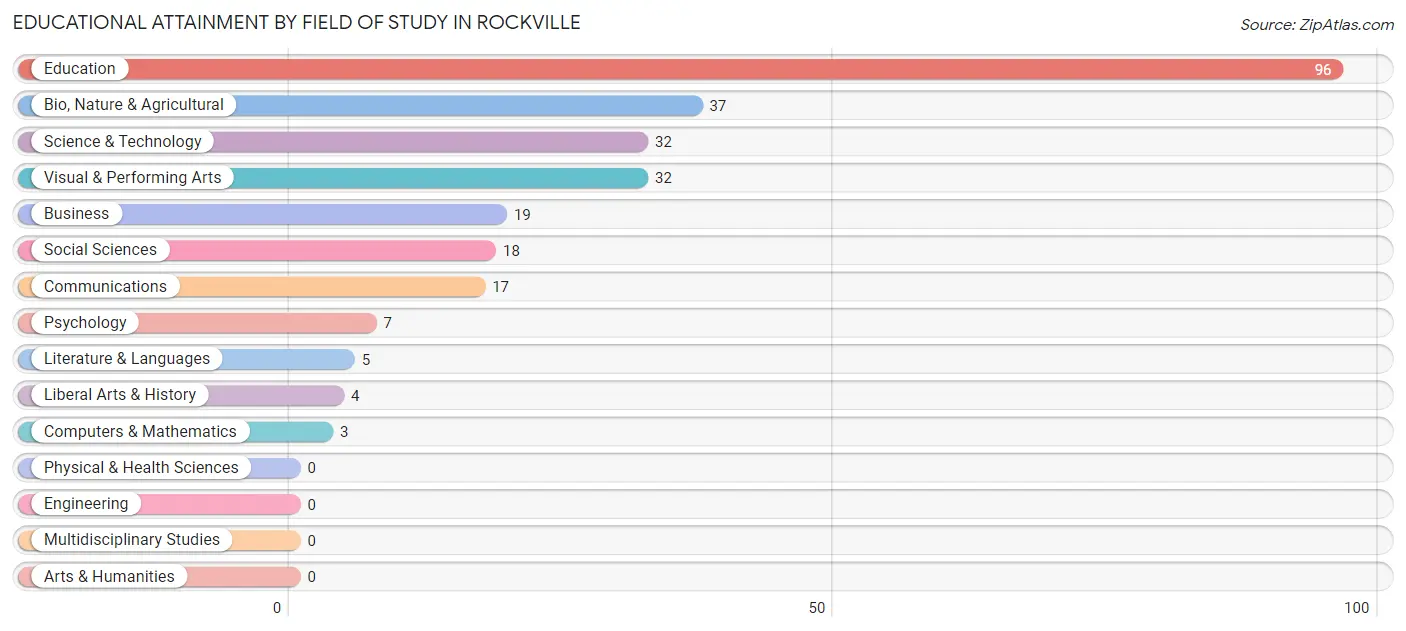
Education (96 | 35.6%), bio, nature & agricultural (37 | 13.7%), science & technology (32 | 11.8%), visual & performing arts (32 | 11.8%), and business (19 | 7.0%) are the most common fields of study among 270 individuals in Rockville who have obtained a bachelor's degree or higher.
| Field of Study | # Graduates | % Graduates |
| Computers & Mathematics | 3 | 1.1% |
| Bio, Nature & Agricultural | 37 | 13.7% |
| Physical & Health Sciences | 0 | 0.0% |
| Psychology | 7 | 2.6% |
| Social Sciences | 18 | 6.7% |
| Engineering | 0 | 0.0% |
| Multidisciplinary Studies | 0 | 0.0% |
| Science & Technology | 32 | 11.8% |
| Business | 19 | 7.0% |
| Education | 96 | 35.6% |
| Literature & Languages | 5 | 1.8% |
| Liberal Arts & History | 4 | 1.5% |
| Visual & Performing Arts | 32 | 11.8% |
| Communications | 17 | 6.3% |
| Arts & Humanities | 0 | 0.0% |
| Total | 270 | 100.0% |
Transportation & Commute in Rockville
Vehicle Availability by Sex in Rockville
The most prevalent vehicle ownership categories in Rockville are males with 2 vehicles (240, accounting for 48.9%) and females with 2 vehicles (210, making up 48.8%).
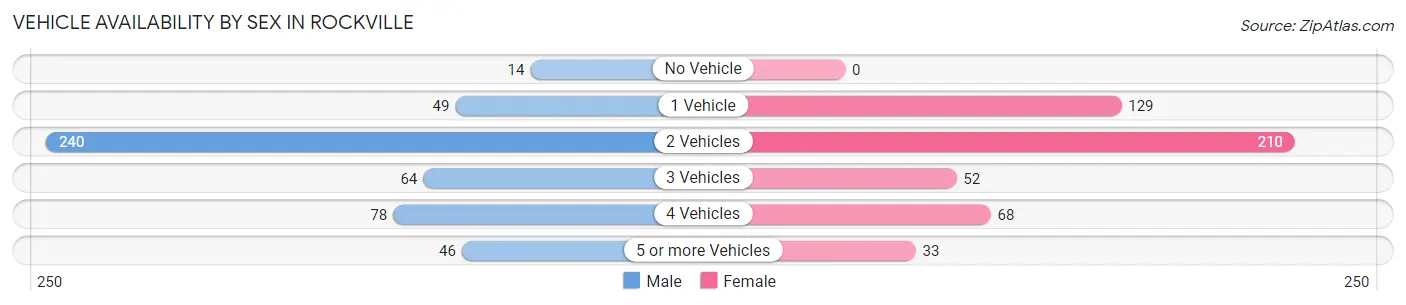
| Vehicles Available | Male | Female |
| No Vehicle | 14 (2.9%) | 0 (0.0%) |
| 1 Vehicle | 49 (10.0%) | 129 (26.2%) |
| 2 Vehicles | 240 (48.9%) | 210 (42.7%) |
| 3 Vehicles | 64 (13.0%) | 52 (10.6%) |
| 4 Vehicles | 78 (15.9%) | 68 (13.8%) |
| 5 or more Vehicles | 46 (9.4%) | 33 (6.7%) |
| Total | 491 (100.0%) | 492 (100.0%) |
Commute Time in Rockville
The most frequently occuring commute durations in Rockville are 45 to 59 minutes (171 commuters, 18.5%), 10 to 14 minutes (165 commuters, 17.9%), and 5 to 9 minutes (157 commuters, 17.0%).
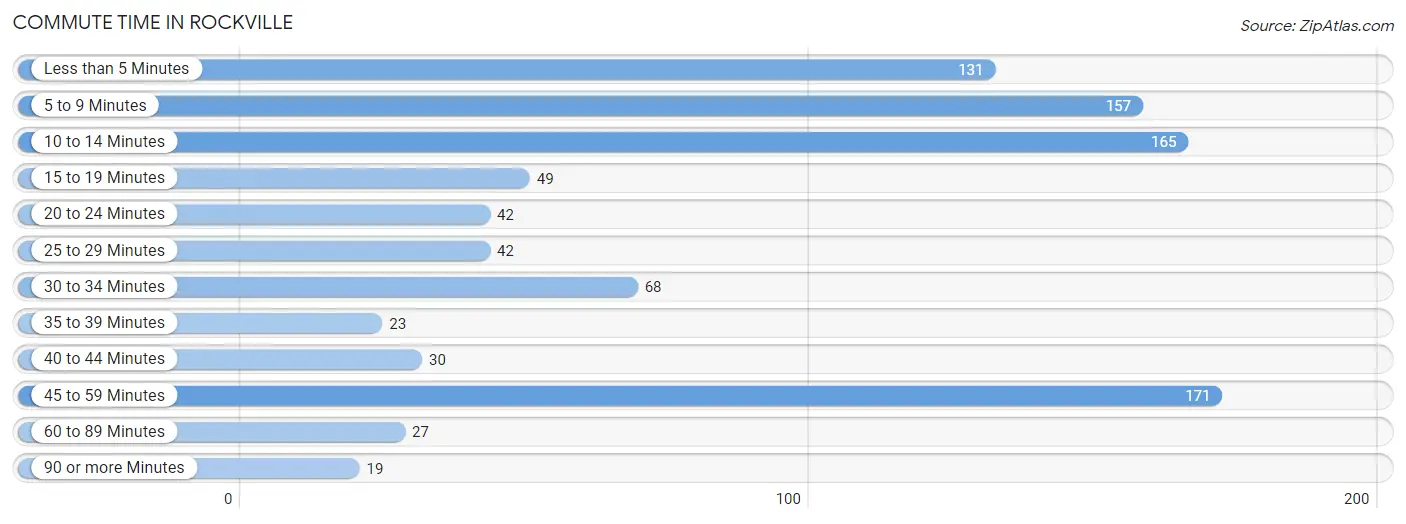
| Commute Time | # Commuters | % Commuters |
| Less than 5 Minutes | 131 | 14.2% |
| 5 to 9 Minutes | 157 | 17.0% |
| 10 to 14 Minutes | 165 | 17.9% |
| 15 to 19 Minutes | 49 | 5.3% |
| 20 to 24 Minutes | 42 | 4.5% |
| 25 to 29 Minutes | 42 | 4.5% |
| 30 to 34 Minutes | 68 | 7.4% |
| 35 to 39 Minutes | 23 | 2.5% |
| 40 to 44 Minutes | 30 | 3.3% |
| 45 to 59 Minutes | 171 | 18.5% |
| 60 to 89 Minutes | 27 | 2.9% |
| 90 or more Minutes | 19 | 2.1% |
Commute Time by Sex in Rockville
The most common commute times in Rockville are 5 to 9 minutes (88 commuters, 17.9%) for males and 45 to 59 minutes (117 commuters, 27.0%) for females.
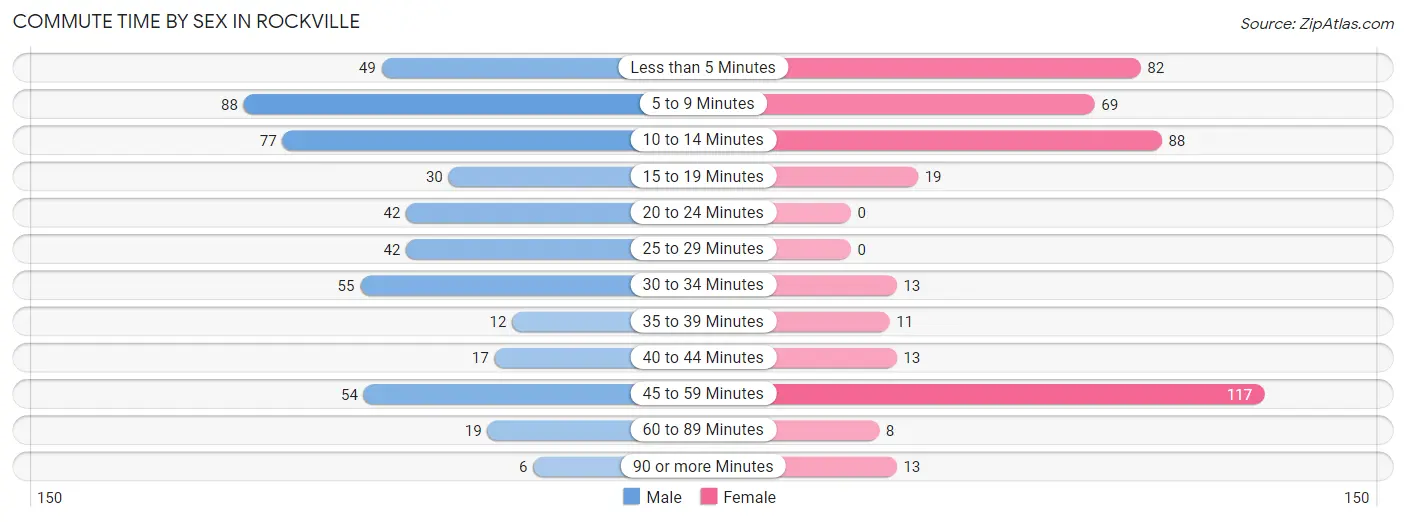
| Commute Time | Male | Female |
| Less than 5 Minutes | 49 (10.0%) | 82 (18.9%) |
| 5 to 9 Minutes | 88 (17.9%) | 69 (15.9%) |
| 10 to 14 Minutes | 77 (15.7%) | 88 (20.3%) |
| 15 to 19 Minutes | 30 (6.1%) | 19 (4.4%) |
| 20 to 24 Minutes | 42 (8.6%) | 0 (0.0%) |
| 25 to 29 Minutes | 42 (8.6%) | 0 (0.0%) |
| 30 to 34 Minutes | 55 (11.2%) | 13 (3.0%) |
| 35 to 39 Minutes | 12 (2.4%) | 11 (2.5%) |
| 40 to 44 Minutes | 17 (3.5%) | 13 (3.0%) |
| 45 to 59 Minutes | 54 (11.0%) | 117 (27.0%) |
| 60 to 89 Minutes | 19 (3.9%) | 8 (1.8%) |
| 90 or more Minutes | 6 (1.2%) | 13 (3.0%) |
Time of Departure to Work by Sex in Rockville
The most frequent times of departure to work in Rockville are 4:00 PM to 11:59 PM (144, 29.3%) for males and 7:30 AM to 7:59 AM (78, 18.0%) for females.
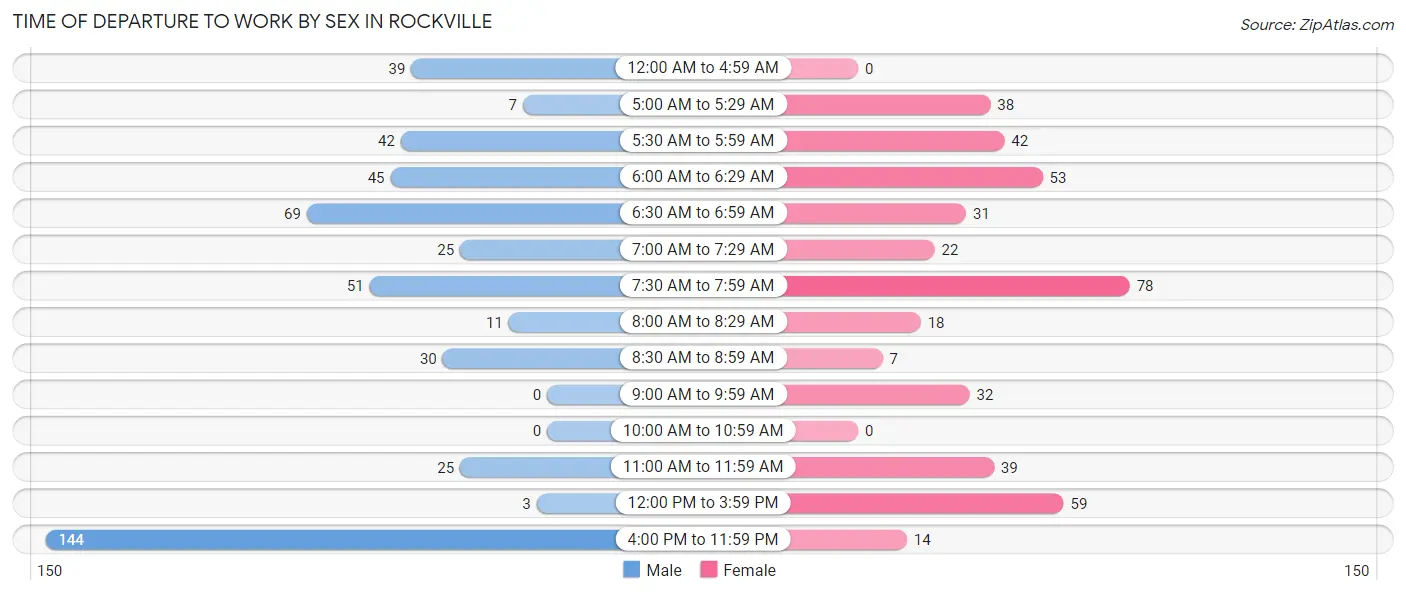
| Time of Departure | Male | Female |
| 12:00 AM to 4:59 AM | 39 (7.9%) | 0 (0.0%) |
| 5:00 AM to 5:29 AM | 7 (1.4%) | 38 (8.8%) |
| 5:30 AM to 5:59 AM | 42 (8.6%) | 42 (9.7%) |
| 6:00 AM to 6:29 AM | 45 (9.2%) | 53 (12.2%) |
| 6:30 AM to 6:59 AM | 69 (14.1%) | 31 (7.2%) |
| 7:00 AM to 7:29 AM | 25 (5.1%) | 22 (5.1%) |
| 7:30 AM to 7:59 AM | 51 (10.4%) | 78 (18.0%) |
| 8:00 AM to 8:29 AM | 11 (2.2%) | 18 (4.2%) |
| 8:30 AM to 8:59 AM | 30 (6.1%) | 7 (1.6%) |
| 9:00 AM to 9:59 AM | 0 (0.0%) | 32 (7.4%) |
| 10:00 AM to 10:59 AM | 0 (0.0%) | 0 (0.0%) |
| 11:00 AM to 11:59 AM | 25 (5.1%) | 39 (9.0%) |
| 12:00 PM to 3:59 PM | 3 (0.6%) | 59 (13.6%) |
| 4:00 PM to 11:59 PM | 144 (29.3%) | 14 (3.2%) |
| Total | 491 (100.0%) | 433 (100.0%) |
Housing Occupancy in Rockville
Occupancy by Ownership in Rockville
Of the total 1,036 dwellings in Rockville, owner-occupied units account for 759 (73.3%), while renter-occupied units make up 277 (26.7%).
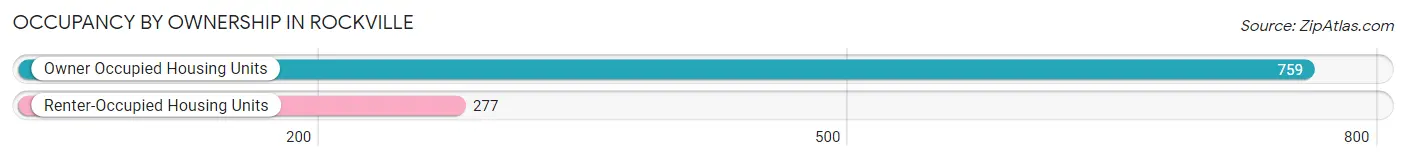
| Occupancy | # Housing Units | % Housing Units |
| Owner Occupied Housing Units | 759 | 73.3% |
| Renter-Occupied Housing Units | 277 | 26.7% |
| Total Occupied Housing Units | 1,036 | 100.0% |
Occupancy by Household Size in Rockville
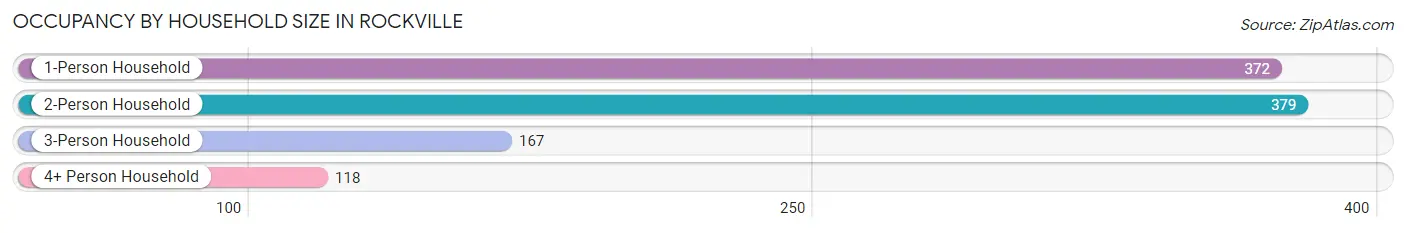
| Household Size | # Housing Units | % Housing Units |
| 1-Person Household | 372 | 35.9% |
| 2-Person Household | 379 | 36.6% |
| 3-Person Household | 167 | 16.1% |
| 4+ Person Household | 118 | 11.4% |
| Total Housing Units | 1,036 | 100.0% |
Occupancy by Ownership by Household Size in Rockville
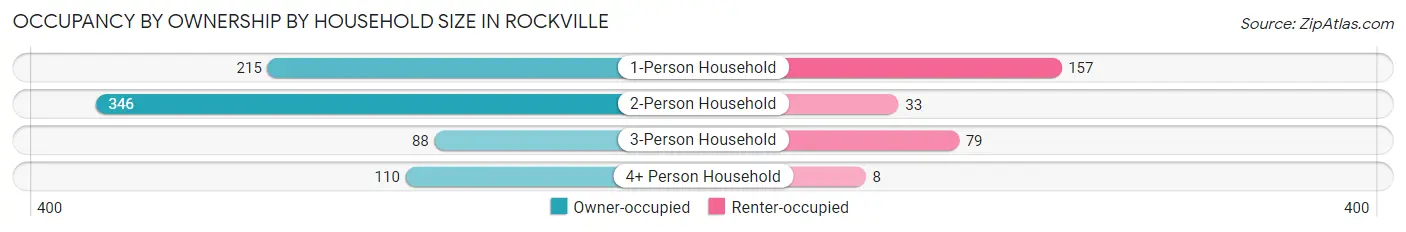
| Household Size | Owner-occupied | Renter-occupied |
| 1-Person Household | 215 (57.8%) | 157 (42.2%) |
| 2-Person Household | 346 (91.3%) | 33 (8.7%) |
| 3-Person Household | 88 (52.7%) | 79 (47.3%) |
| 4+ Person Household | 110 (93.2%) | 8 (6.8%) |
| Total Housing Units | 759 (73.3%) | 277 (26.7%) |
Occupancy by Educational Attainment in Rockville
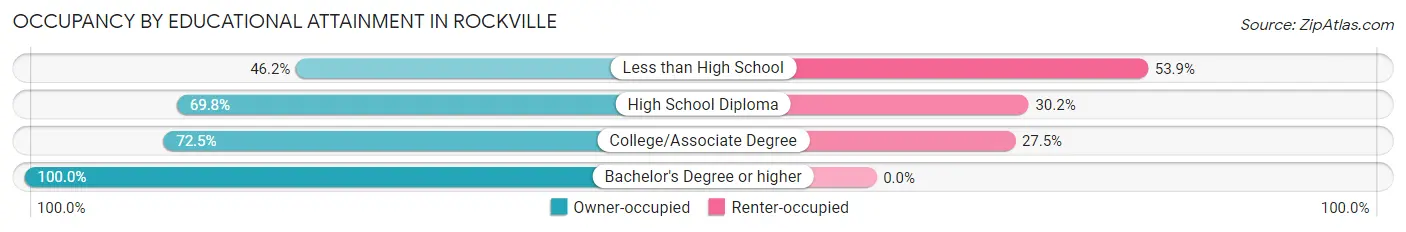
| Household Size | Owner-occupied | Renter-occupied |
| Less than High School | 36 (46.2%) | 42 (53.8%) |
| High School Diploma | 245 (69.8%) | 106 (30.2%) |
| College/Associate Degree | 340 (72.5%) | 129 (27.5%) |
| Bachelor's Degree or higher | 138 (100.0%) | 0 (0.0%) |
Occupancy by Age of Householder in Rockville
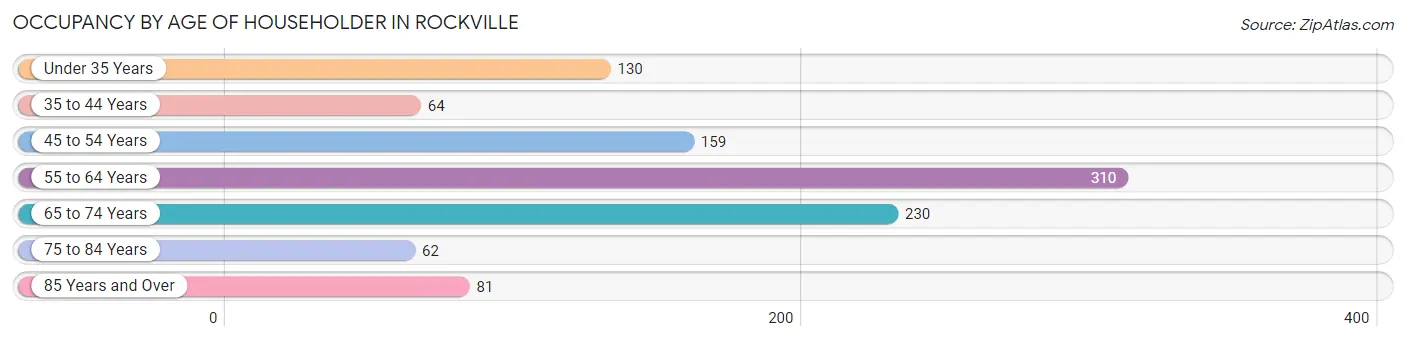
| Age Bracket | # Households | % Households |
| Under 35 Years | 130 | 12.6% |
| 35 to 44 Years | 64 | 6.2% |
| 45 to 54 Years | 159 | 15.3% |
| 55 to 64 Years | 310 | 29.9% |
| 65 to 74 Years | 230 | 22.2% |
| 75 to 84 Years | 62 | 6.0% |
| 85 Years and Over | 81 | 7.8% |
| Total | 1,036 | 100.0% |
Housing Finances in Rockville
Median Income by Occupancy in Rockville
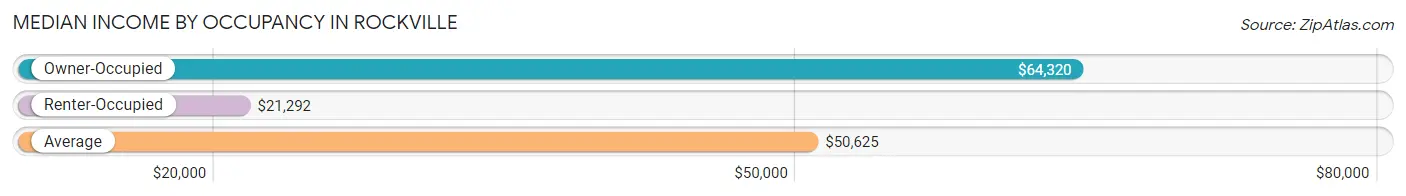
| Occupancy Type | # Households | Median Income |
| Owner-Occupied | 759 (73.3%) | $64,320 |
| Renter-Occupied | 277 (26.7%) | $21,292 |
| Average | 1,036 (100.0%) | $50,625 |
Occupancy by Householder Income Bracket in Rockville
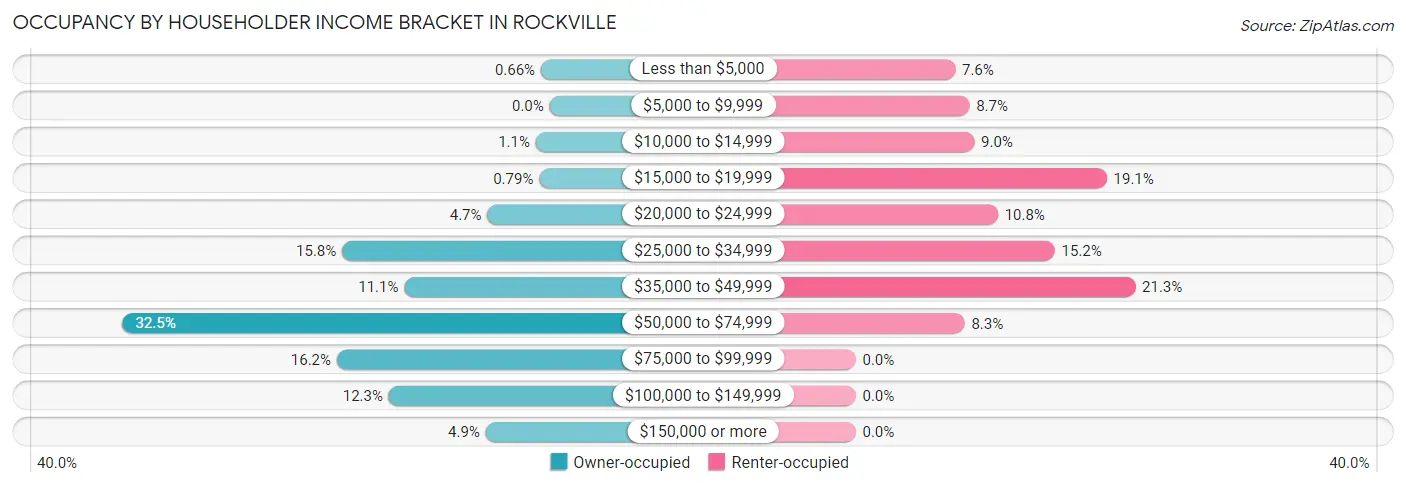
| Income Bracket | Owner-occupied | Renter-occupied |
| Less than $5,000 | 5 (0.7%) | 21 (7.6%) |
| $5,000 to $9,999 | 0 (0.0%) | 24 (8.7%) |
| $10,000 to $14,999 | 8 (1.1%) | 25 (9.0%) |
| $15,000 to $19,999 | 6 (0.8%) | 53 (19.1%) |
| $20,000 to $24,999 | 36 (4.7%) | 30 (10.8%) |
| $25,000 to $34,999 | 120 (15.8%) | 42 (15.2%) |
| $35,000 to $49,999 | 84 (11.1%) | 59 (21.3%) |
| $50,000 to $74,999 | 247 (32.5%) | 23 (8.3%) |
| $75,000 to $99,999 | 123 (16.2%) | 0 (0.0%) |
| $100,000 to $149,999 | 93 (12.2%) | 0 (0.0%) |
| $150,000 or more | 37 (4.9%) | 0 (0.0%) |
| Total | 759 (100.0%) | 277 (100.0%) |
Monthly Housing Cost Tiers in Rockville
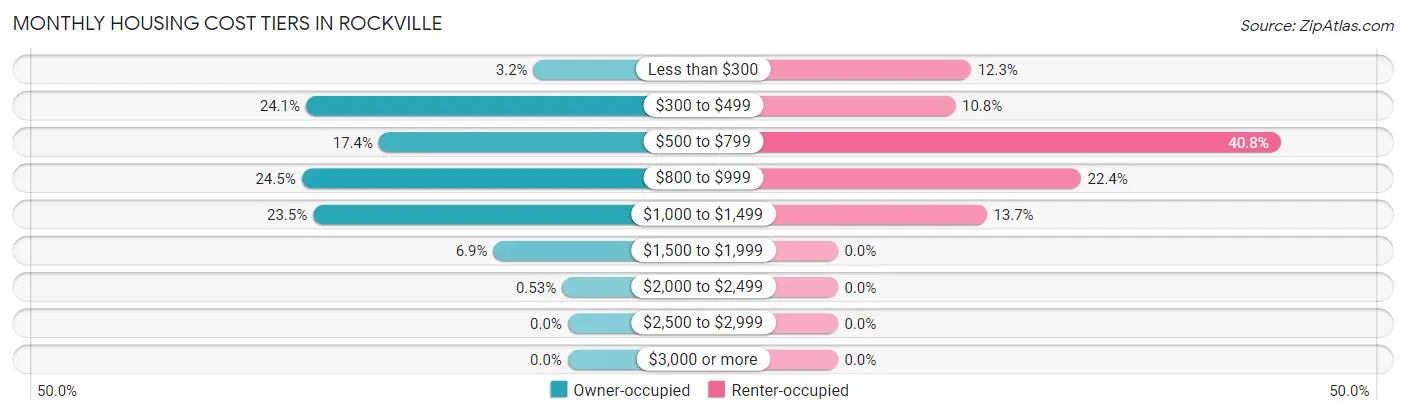
| Monthly Cost | Owner-occupied | Renter-occupied |
| Less than $300 | 24 (3.2%) | 34 (12.3%) |
| $300 to $499 | 183 (24.1%) | 30 (10.8%) |
| $500 to $799 | 132 (17.4%) | 113 (40.8%) |
| $800 to $999 | 186 (24.5%) | 62 (22.4%) |
| $1,000 to $1,499 | 178 (23.4%) | 38 (13.7%) |
| $1,500 to $1,999 | 52 (6.9%) | 0 (0.0%) |
| $2,000 to $2,499 | 4 (0.5%) | 0 (0.0%) |
| $2,500 to $2,999 | 0 (0.0%) | 0 (0.0%) |
| $3,000 or more | 0 (0.0%) | 0 (0.0%) |
| Total | 759 (100.0%) | 277 (100.0%) |
Physical Housing Characteristics in Rockville
Housing Structures in Rockville
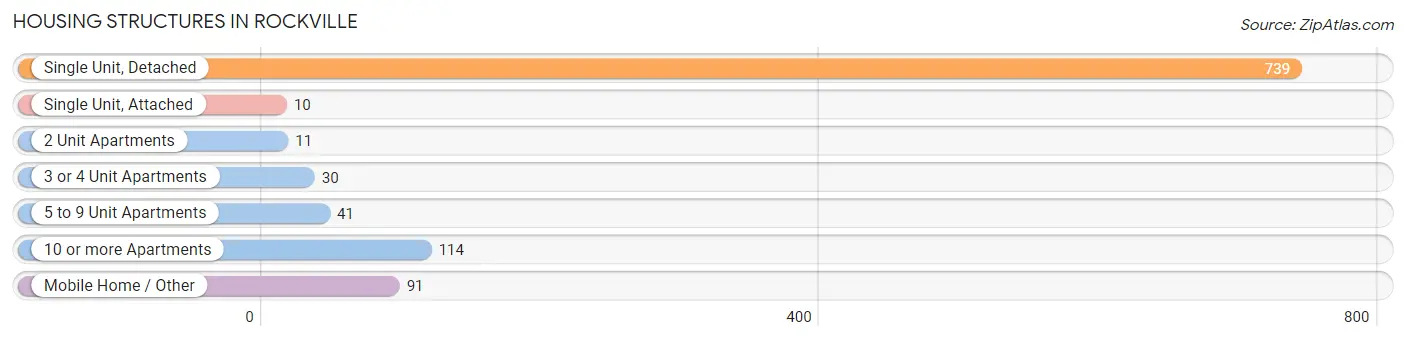
| Structure Type | # Housing Units | % Housing Units |
| Single Unit, Detached | 739 | 71.3% |
| Single Unit, Attached | 10 | 1.0% |
| 2 Unit Apartments | 11 | 1.1% |
| 3 or 4 Unit Apartments | 30 | 2.9% |
| 5 to 9 Unit Apartments | 41 | 4.0% |
| 10 or more Apartments | 114 | 11.0% |
| Mobile Home / Other | 91 | 8.8% |
| Total | 1,036 | 100.0% |
Housing Structures by Occupancy in Rockville
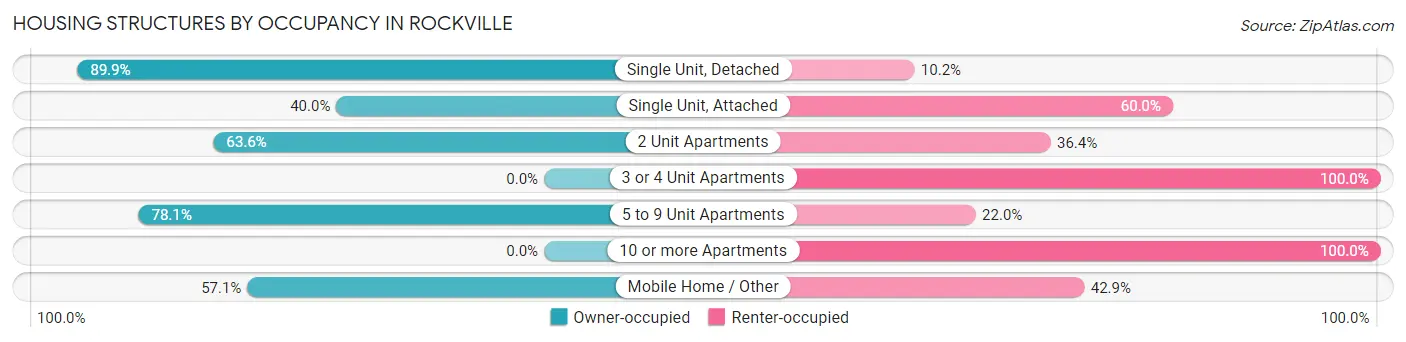
| Structure Type | Owner-occupied | Renter-occupied |
| Single Unit, Detached | 664 (89.8%) | 75 (10.2%) |
| Single Unit, Attached | 4 (40.0%) | 6 (60.0%) |
| 2 Unit Apartments | 7 (63.6%) | 4 (36.4%) |
| 3 or 4 Unit Apartments | 0 (0.0%) | 30 (100.0%) |
| 5 to 9 Unit Apartments | 32 (78.0%) | 9 (22.0%) |
| 10 or more Apartments | 0 (0.0%) | 114 (100.0%) |
| Mobile Home / Other | 52 (57.1%) | 39 (42.9%) |
| Total | 759 (73.3%) | 277 (26.7%) |
Housing Structures by Number of Rooms in Rockville
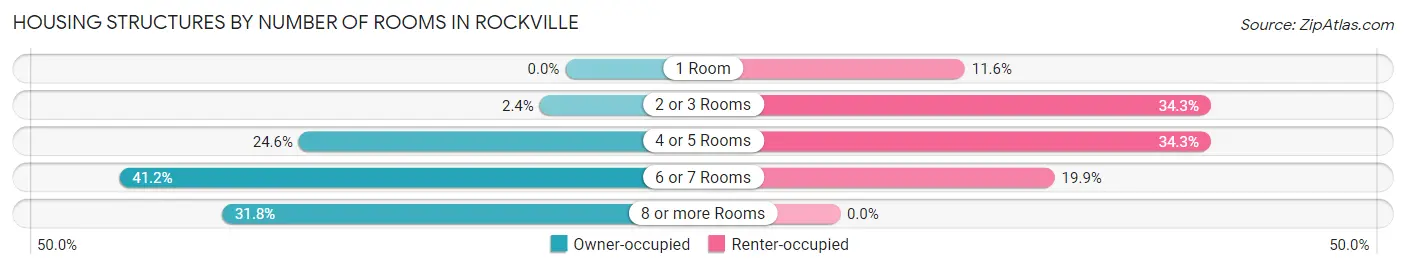
| Number of Rooms | Owner-occupied | Renter-occupied |
| 1 Room | 0 (0.0%) | 32 (11.6%) |
| 2 or 3 Rooms | 18 (2.4%) | 95 (34.3%) |
| 4 or 5 Rooms | 187 (24.6%) | 95 (34.3%) |
| 6 or 7 Rooms | 313 (41.2%) | 55 (19.9%) |
| 8 or more Rooms | 241 (31.8%) | 0 (0.0%) |
| Total | 759 (100.0%) | 277 (100.0%) |
Housing Structure by Heating Type in Rockville
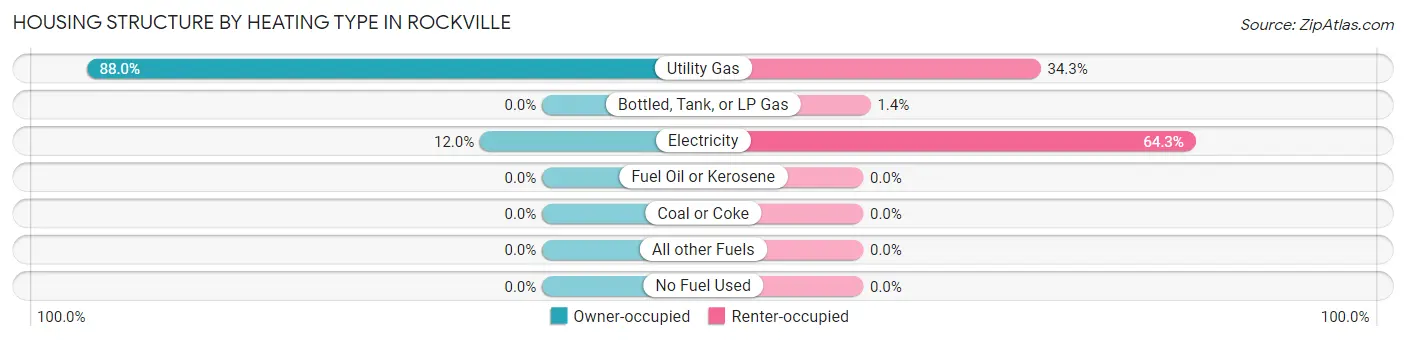
| Heating Type | Owner-occupied | Renter-occupied |
| Utility Gas | 668 (88.0%) | 95 (34.3%) |
| Bottled, Tank, or LP Gas | 0 (0.0%) | 4 (1.4%) |
| Electricity | 91 (12.0%) | 178 (64.3%) |
| Fuel Oil or Kerosene | 0 (0.0%) | 0 (0.0%) |
| Coal or Coke | 0 (0.0%) | 0 (0.0%) |
| All other Fuels | 0 (0.0%) | 0 (0.0%) |
| No Fuel Used | 0 (0.0%) | 0 (0.0%) |
| Total | 759 (100.0%) | 277 (100.0%) |
Household Vehicle Usage in Rockville
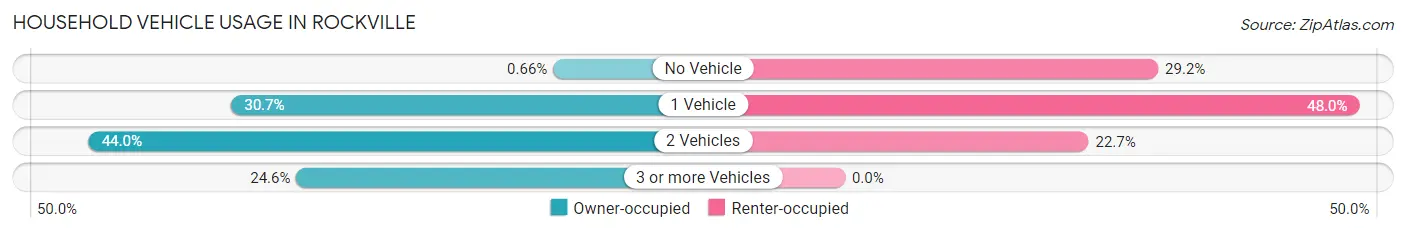
| Vehicles per Household | Owner-occupied | Renter-occupied |
| No Vehicle | 5 (0.7%) | 81 (29.2%) |
| 1 Vehicle | 233 (30.7%) | 133 (48.0%) |
| 2 Vehicles | 334 (44.0%) | 63 (22.7%) |
| 3 or more Vehicles | 187 (24.6%) | 0 (0.0%) |
| Total | 759 (100.0%) | 277 (100.0%) |
Real Estate & Mortgages in Rockville
Real Estate and Mortgage Overview in Rockville
| Characteristic | Without Mortgage | With Mortgage |
| Housing Units | 268 | 491 |
| Median Property Value | $80,000 | $105,900 |
| Median Household Income | $52,885 | $29 |
| Monthly Housing Costs | $350 | $0 |
| Real Estate Taxes | $202 | $6 |
Property Value by Mortgage Status in Rockville
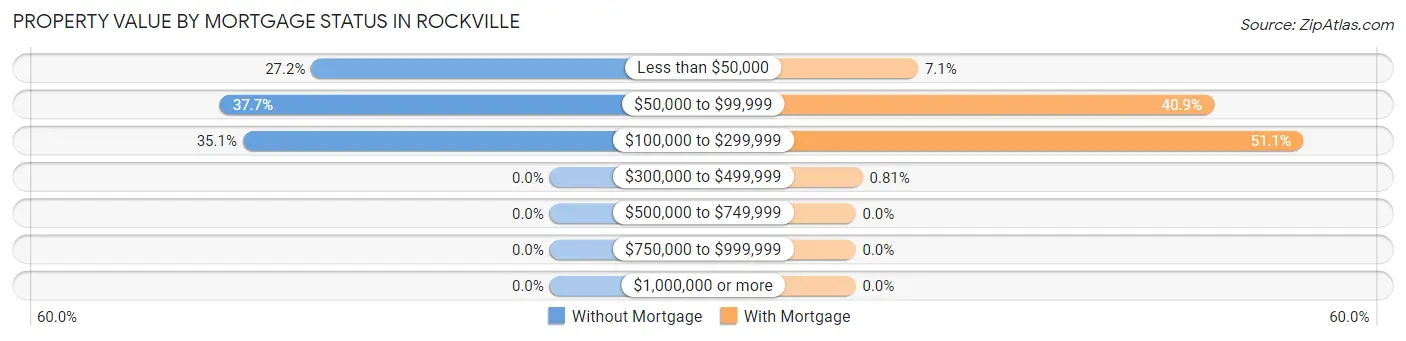
| Property Value | Without Mortgage | With Mortgage |
| Less than $50,000 | 73 (27.2%) | 35 (7.1%) |
| $50,000 to $99,999 | 101 (37.7%) | 201 (40.9%) |
| $100,000 to $299,999 | 94 (35.1%) | 251 (51.1%) |
| $300,000 to $499,999 | 0 (0.0%) | 4 (0.8%) |
| $500,000 to $749,999 | 0 (0.0%) | 0 (0.0%) |
| $750,000 to $999,999 | 0 (0.0%) | 0 (0.0%) |
| $1,000,000 or more | 0 (0.0%) | 0 (0.0%) |
| Total | 268 (100.0%) | 491 (100.0%) |
Household Income by Mortgage Status in Rockville
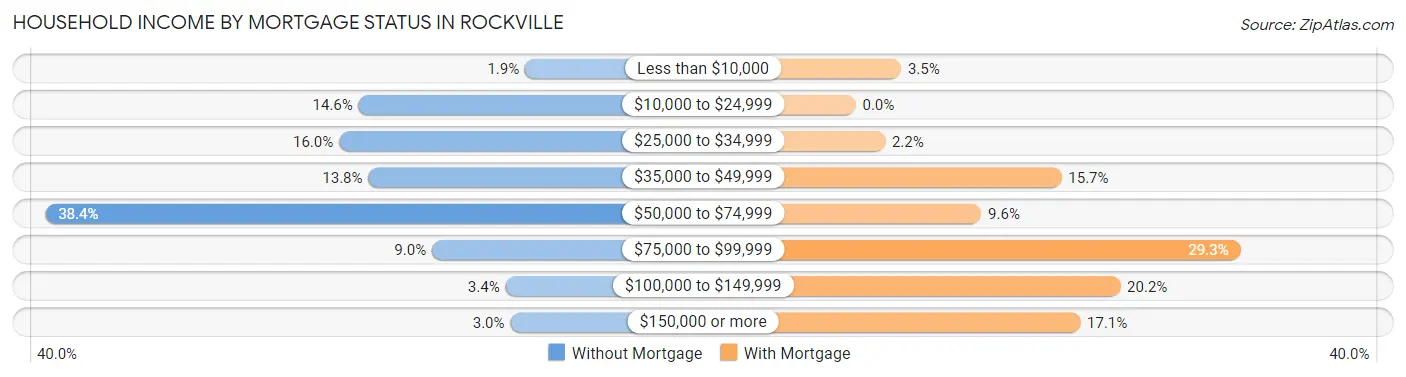
| Household Income | Without Mortgage | With Mortgage |
| Less than $10,000 | 5 (1.9%) | 17 (3.5%) |
| $10,000 to $24,999 | 39 (14.5%) | 0 (0.0%) |
| $25,000 to $34,999 | 43 (16.0%) | 11 (2.2%) |
| $35,000 to $49,999 | 37 (13.8%) | 77 (15.7%) |
| $50,000 to $74,999 | 103 (38.4%) | 47 (9.6%) |
| $75,000 to $99,999 | 24 (9.0%) | 144 (29.3%) |
| $100,000 to $149,999 | 9 (3.4%) | 99 (20.2%) |
| $150,000 or more | 8 (3.0%) | 84 (17.1%) |
| Total | 268 (100.0%) | 491 (100.0%) |
Property Value to Household Income Ratio in Rockville
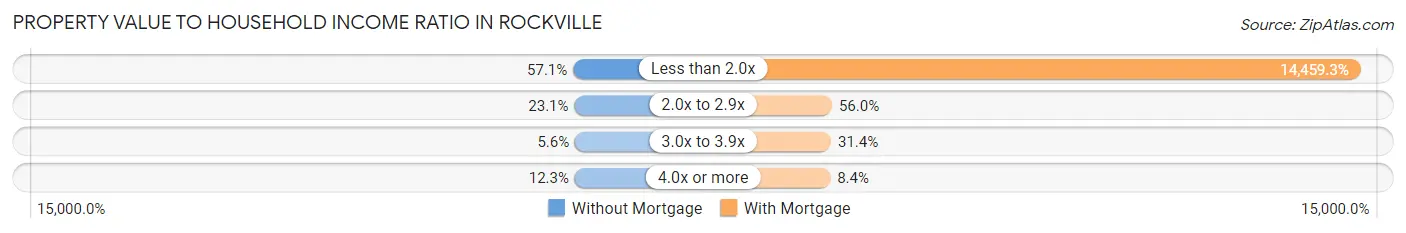
| Value-to-Income Ratio | Without Mortgage | With Mortgage |
| Less than 2.0x | 153 (57.1%) | 70,995 (14,459.3%) |
| 2.0x to 2.9x | 62 (23.1%) | 275 (56.0%) |
| 3.0x to 3.9x | 15 (5.6%) | 154 (31.4%) |
| 4.0x or more | 33 (12.3%) | 41 (8.4%) |
| Total | 268 (100.0%) | 491 (100.0%) |
Real Estate Taxes by Mortgage Status in Rockville
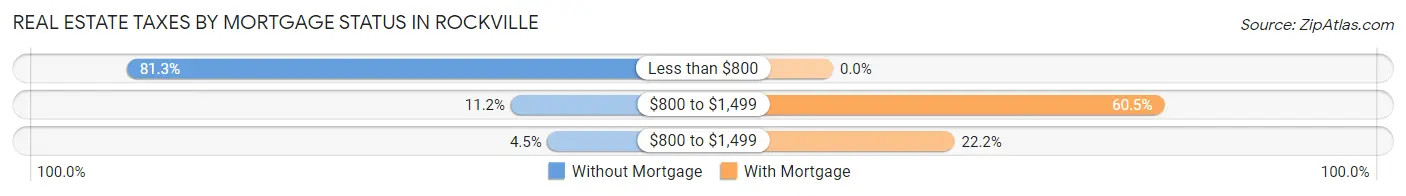
| Property Taxes | Without Mortgage | With Mortgage |
| Less than $800 | 218 (81.3%) | 0 (0.0%) |
| $800 to $1,499 | 30 (11.2%) | 297 (60.5%) |
| $800 to $1,499 | 12 (4.5%) | 109 (22.2%) |
| Total | 268 (100.0%) | 491 (100.0%) |
Health & Disability in Rockville
Health Insurance Coverage by Age in Rockville
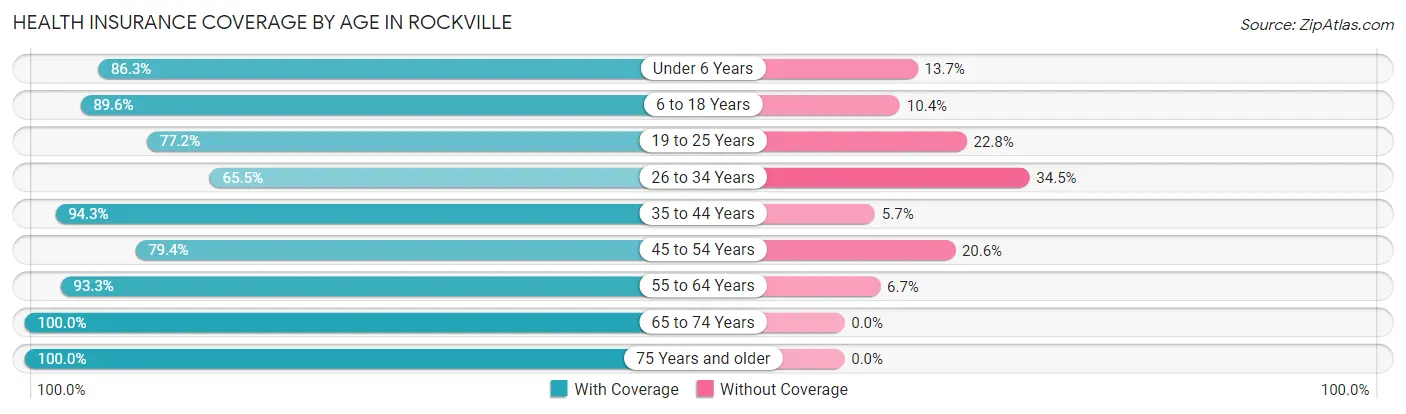
| Age Bracket | With Coverage | Without Coverage |
| Under 6 Years | 101 (86.3%) | 16 (13.7%) |
| 6 to 18 Years | 311 (89.6%) | 36 (10.4%) |
| 19 to 25 Years | 193 (77.2%) | 57 (22.8%) |
| 26 to 34 Years | 184 (65.5%) | 97 (34.5%) |
| 35 to 44 Years | 132 (94.3%) | 8 (5.7%) |
| 45 to 54 Years | 250 (79.4%) | 65 (20.6%) |
| 55 to 64 Years | 405 (93.3%) | 29 (6.7%) |
| 65 to 74 Years | 318 (100.0%) | 0 (0.0%) |
| 75 Years and older | 335 (100.0%) | 0 (0.0%) |
| Total | 2,229 (87.9%) | 308 (12.1%) |
Health Insurance Coverage by Citizenship Status in Rockville
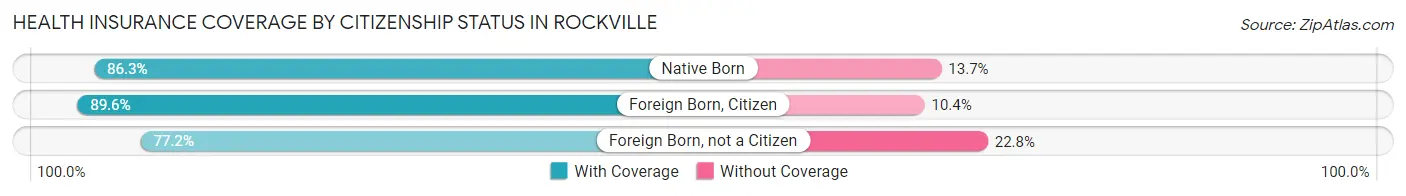
| Citizenship Status | With Coverage | Without Coverage |
| Native Born | 101 (86.3%) | 16 (13.7%) |
| Foreign Born, Citizen | 311 (89.6%) | 36 (10.4%) |
| Foreign Born, not a Citizen | 193 (77.2%) | 57 (22.8%) |
Health Insurance Coverage by Household Income in Rockville
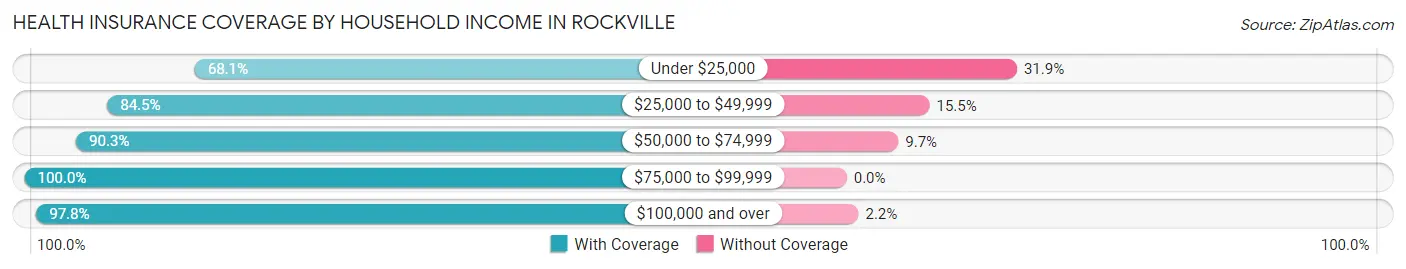
| Household Income | With Coverage | Without Coverage |
| Under $25,000 | 284 (68.1%) | 133 (31.9%) |
| $25,000 to $49,999 | 556 (84.5%) | 102 (15.5%) |
| $50,000 to $74,999 | 608 (90.3%) | 65 (9.7%) |
| $75,000 to $99,999 | 415 (100.0%) | 0 (0.0%) |
| $100,000 and over | 356 (97.8%) | 8 (2.2%) |
Public vs Private Health Insurance Coverage by Age in Rockville
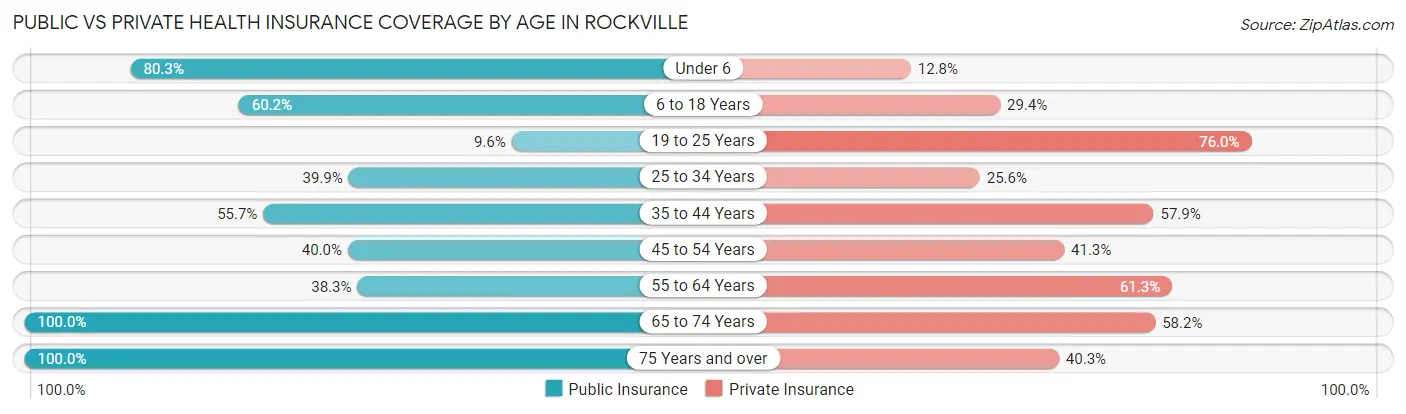
| Age Bracket | Public Insurance | Private Insurance |
| Under 6 | 94 (80.3%) | 15 (12.8%) |
| 6 to 18 Years | 209 (60.2%) | 102 (29.4%) |
| 19 to 25 Years | 24 (9.6%) | 190 (76.0%) |
| 25 to 34 Years | 112 (39.9%) | 72 (25.6%) |
| 35 to 44 Years | 78 (55.7%) | 81 (57.9%) |
| 45 to 54 Years | 126 (40.0%) | 130 (41.3%) |
| 55 to 64 Years | 166 (38.3%) | 266 (61.3%) |
| 65 to 74 Years | 318 (100.0%) | 185 (58.2%) |
| 75 Years and over | 335 (100.0%) | 135 (40.3%) |
| Total | 1,462 (57.6%) | 1,176 (46.4%) |
Disability Status by Sex by Age in Rockville
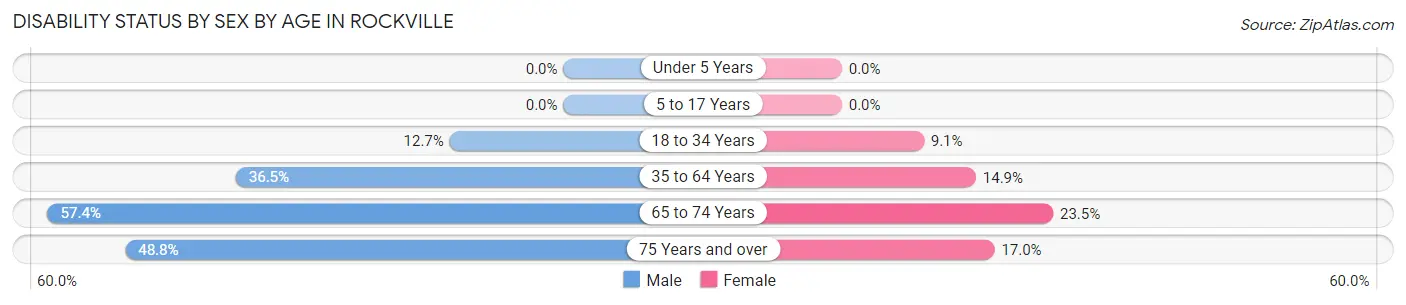
| Age Bracket | Male | Female |
| Under 5 Years | 0 (0.0%) | 0 (0.0%) |
| 5 to 17 Years | 0 (0.0%) | 0 (0.0%) |
| 18 to 34 Years | 38 (12.7%) | 24 (9.1%) |
| 35 to 64 Years | 163 (36.5%) | 66 (14.9%) |
| 65 to 74 Years | 85 (57.4%) | 40 (23.5%) |
| 75 Years and over | 40 (48.8%) | 43 (17.0%) |
Disability Class by Sex by Age in Rockville
Disability Class: Hearing Difficulty
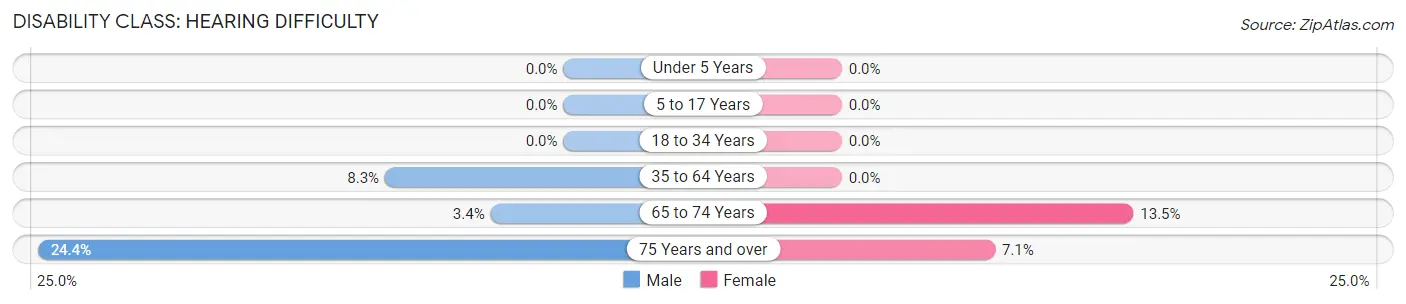
| Age Bracket | Male | Female |
| Under 5 Years | 0 (0.0%) | 0 (0.0%) |
| 5 to 17 Years | 0 (0.0%) | 0 (0.0%) |
| 18 to 34 Years | 0 (0.0%) | 0 (0.0%) |
| 35 to 64 Years | 37 (8.3%) | 0 (0.0%) |
| 65 to 74 Years | 5 (3.4%) | 23 (13.5%) |
| 75 Years and over | 20 (24.4%) | 18 (7.1%) |
Disability Class: Vision Difficulty
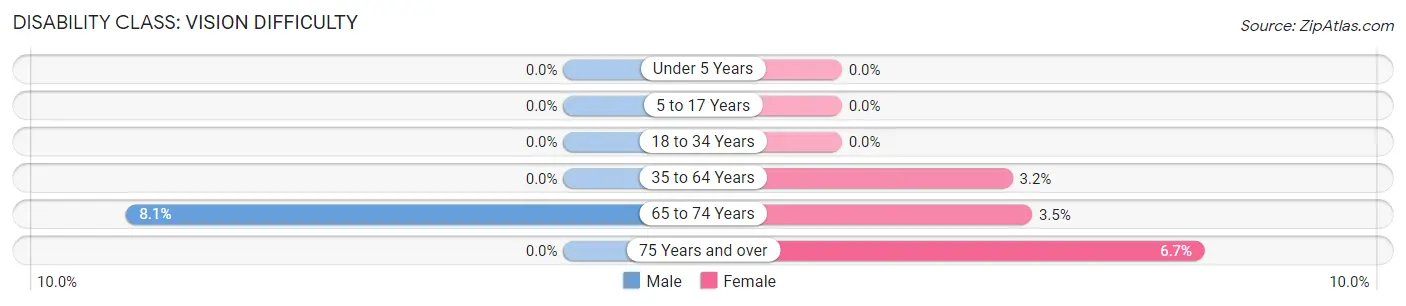
| Age Bracket | Male | Female |
| Under 5 Years | 0 (0.0%) | 0 (0.0%) |
| 5 to 17 Years | 0 (0.0%) | 0 (0.0%) |
| 18 to 34 Years | 0 (0.0%) | 0 (0.0%) |
| 35 to 64 Years | 0 (0.0%) | 14 (3.2%) |
| 65 to 74 Years | 12 (8.1%) | 6 (3.5%) |
| 75 Years and over | 0 (0.0%) | 17 (6.7%) |
Disability Class: Cognitive Difficulty
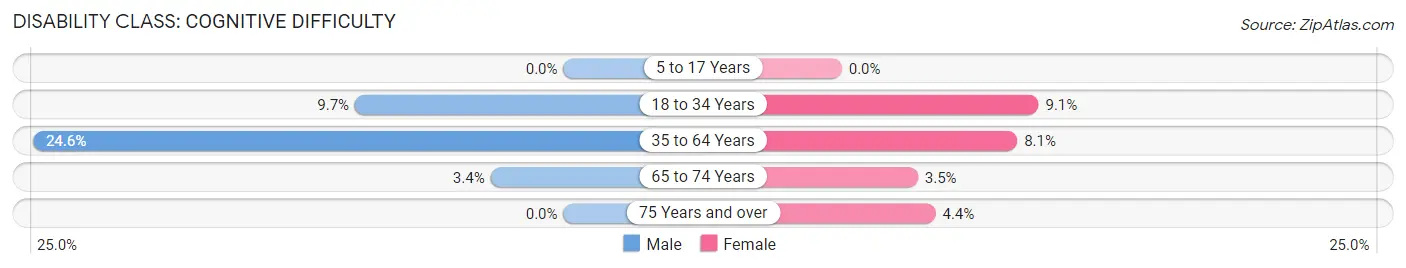
| Age Bracket | Male | Female |
| 5 to 17 Years | 0 (0.0%) | 0 (0.0%) |
| 18 to 34 Years | 29 (9.7%) | 24 (9.1%) |
| 35 to 64 Years | 110 (24.6%) | 36 (8.1%) |
| 65 to 74 Years | 5 (3.4%) | 6 (3.5%) |
| 75 Years and over | 0 (0.0%) | 11 (4.3%) |
Disability Class: Ambulatory Difficulty
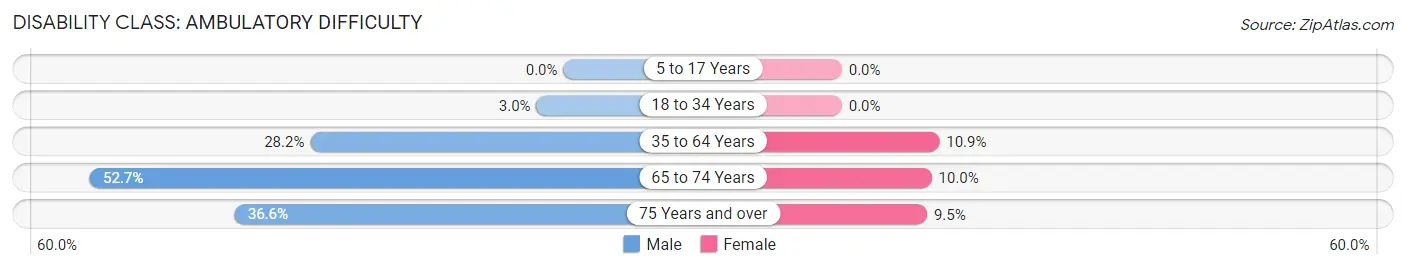
| Age Bracket | Male | Female |
| 5 to 17 Years | 0 (0.0%) | 0 (0.0%) |
| 18 to 34 Years | 9 (3.0%) | 0 (0.0%) |
| 35 to 64 Years | 126 (28.2%) | 48 (10.9%) |
| 65 to 74 Years | 78 (52.7%) | 17 (10.0%) |
| 75 Years and over | 30 (36.6%) | 24 (9.5%) |
Disability Class: Self-Care Difficulty
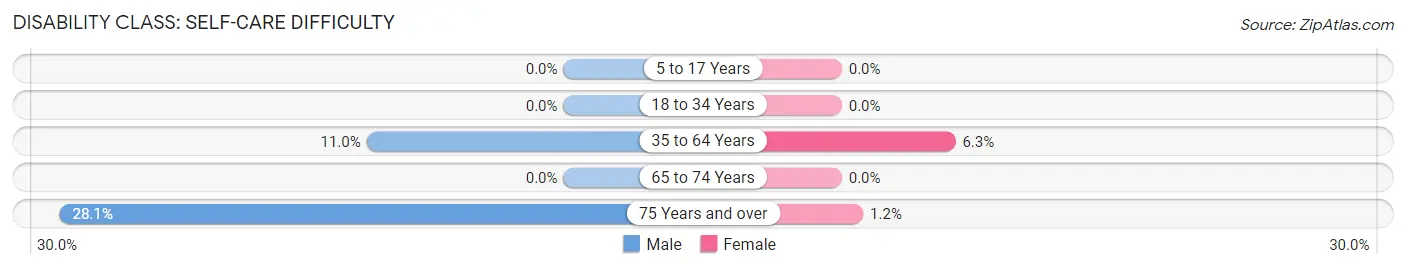
| Age Bracket | Male | Female |
| 5 to 17 Years | 0 (0.0%) | 0 (0.0%) |
| 18 to 34 Years | 0 (0.0%) | 0 (0.0%) |
| 35 to 64 Years | 49 (11.0%) | 28 (6.3%) |
| 65 to 74 Years | 0 (0.0%) | 0 (0.0%) |
| 75 Years and over | 23 (28.1%) | 3 (1.2%) |
Technology Access in Rockville
Computing Device Access in Rockville
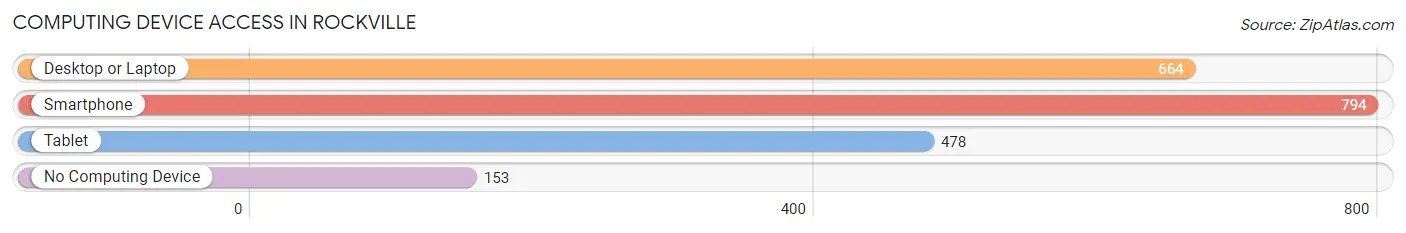
| Device Type | # Households | % Households |
| Desktop or Laptop | 664 | 64.1% |
| Smartphone | 794 | 76.6% |
| Tablet | 478 | 46.1% |
| No Computing Device | 153 | 14.8% |
| Total | 1,036 | 100.0% |
Internet Access in Rockville
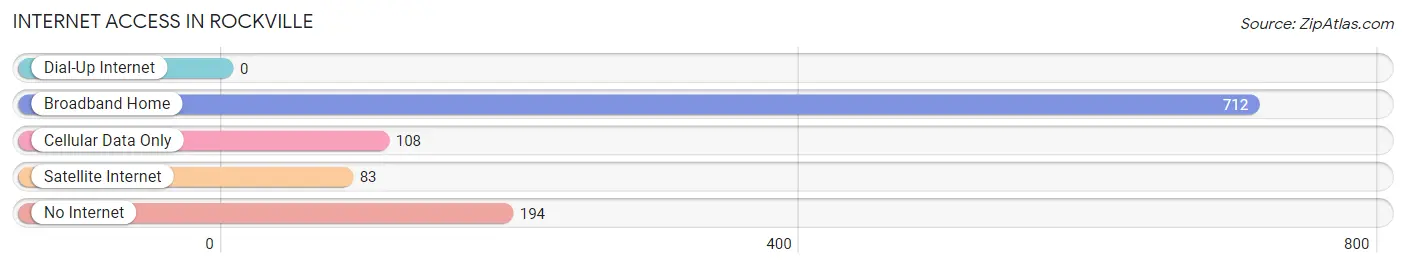
| Internet Type | # Households | % Households |
| Dial-Up Internet | 0 | 0.0% |
| Broadband Home | 712 | 68.7% |
| Cellular Data Only | 108 | 10.4% |
| Satellite Internet | 83 | 8.0% |
| No Internet | 194 | 18.7% |
| Total | 1,036 | 100.0% |
Rockville Summary
Rockville, Indiana is a small town located in Parke County, Indiana. It is situated in the Wabash Valley region of the state, and is approximately 50 miles west of Indianapolis. The town was founded in 1824 and is the county seat of Parke County. As of the 2010 census, the population of Rockville was 2,382.
History
Rockville was founded in 1824 by William Rock, a Quaker from North Carolina. He purchased the land from the government and named the town after himself. The town was officially incorporated in 1837.
In the early days, Rockville was a small farming community. The town was known for its production of wheat, corn, and other grains. In the late 1800s, the town began to grow and develop. The railroad came to Rockville in 1871, and the town became a hub for the surrounding area.
The town was also home to several industries, including a flour mill, a sawmill, and a brickyard. These industries helped to fuel the growth of the town.
Geography
Rockville is located in the Wabash Valley region of Indiana. The town is situated in the western part of Parke County, approximately 50 miles west of Indianapolis. The town is located on the banks of the Wabash River.
The terrain of the area is mostly flat, with some rolling hills. The climate is humid continental, with hot summers and cold winters. The average annual temperature is around 50 degrees Fahrenheit.
Economy
The economy of Rockville is largely based on agriculture and manufacturing. The town is home to several large farms, which produce corn, soybeans, wheat, and other crops. The town is also home to several manufacturing companies, including a furniture factory, a plastics factory, and a metal fabrication plant.
The town is also home to several small businesses, including restaurants, shops, and other services. The town is also home to several tourist attractions, including the Parke County Courthouse, the Rockville Historic District, and the Rockville Lake Park.
Demographics
As of the 2010 census, the population of Rockville was 2,382. The racial makeup of the town was 97.3% White, 0.7% African American, 0.2% Native American, 0.3% Asian, 0.1% Pacific Islander, 0.4% from other races, and 1.0% from two or more races. Hispanic or Latino of any race were 1.2% of the population.
The median household income in Rockville was $37,917, and the median family income was $45,938. The per capita income was $19,945. About 11.3% of families and 14.2% of the population were below the poverty line, including 19.2% of those under age 18 and 8.2% of those age 65 or over.
Conclusion
Rockville, Indiana is a small town located in Parke County, Indiana. It was founded in 1824 and is the county seat of Parke County. The town is situated in the Wabash Valley region of the state, and is approximately 50 miles west of Indianapolis. The economy of Rockville is largely based on agriculture and manufacturing. As of the 2010 census, the population of Rockville was 2,382. The town is home to several tourist attractions, including the Parke County Courthouse, the Rockville Historic District, and the Rockville Lake Park.
Common Questions
What is Per Capita Income in Rockville?
Per Capita income in Rockville is $28,250.
What is the Median Family Income in Rockville?
Median Family Income in Rockville is $63,341.
What is the Median Household income in Rockville?
Median Household Income in Rockville is $50,625.
What is Income or Wage Gap in Rockville?
Income or Wage Gap in Rockville is 40.5%.
Women in Rockville earn 59.5 cents for every dollar earned by a man.
What is Inequality or Gini Index in Rockville?
Inequality or Gini Index in Rockville is 0.44.
What is the Total Population of Rockville?
Total Population of Rockville is 2,537.
What is the Total Male Population of Rockville?
Total Male Population of Rockville is 1,180.
What is the Total Female Population of Rockville?
Total Female Population of Rockville is 1,357.
What is the Ratio of Males per 100 Females in Rockville?
There are 86.96 Males per 100 Females in Rockville.
What is the Ratio of Females per 100 Males in Rockville?
There are 115.00 Females per 100 Males in Rockville.
What is the Median Population Age in Rockville?
Median Population Age in Rockville is 49.9 Years.
What is the Average Family Size in Rockville
Average Family Size in Rockville is 3.0 People.
What is the Average Household Size in Rockville
Average Household Size in Rockville is 2.4 People.
How Large is the Labor Force in Rockville?
There are 1,102 People in the Labor Forcein in Rockville.
What is the Percentage of People in the Labor Force in Rockville?
51.8% of People are in the Labor Force in Rockville.
What is the Unemployment Rate in Rockville?
Unemployment Rate in Rockville is 8.7%.