Marion, IN Map & Demographics
Marion Map
Marion Overview
$38,235
PER CAPITA INCOME
$66,635
AVG HOUSEHOLD INCOME
36.9%
WAGE / INCOME GAP [ % ]
63.1¢/ $1
WAGE / INCOME GAP [ $ ]
0.21
INEQUALITY / GINI INDEX
207
TOTAL POPULATION
100
MALE POPULATION
107
FEMALE POPULATION
93.46
MALES / 100 FEMALES
107.00
FEMALES / 100 MALES
42.1
MEDIAN AGE
2.4
AVG FAMILY SIZE
1.9
AVG HOUSEHOLD SIZE
161
LABOR FORCE [ PEOPLE ]
87.0%
PERCENT IN LABOR FORCE
Marion Area Codes
Income in Marion
Income Overview in Marion
| Characteristic | Number | Measure |
| Per Capita Income | 207 | $38,235 |
| Median Family Income | 56 | $0 |
| Mean Family Income | 56 | $61,859 |
| Median Household Income | 111 | $66,635 |
| Mean Household Income | 111 | $72,866 |
| Income Deficit | 56 | $0 |
| Wage / Income Gap (%) | 207 | 36.90% |
| Wage / Income Gap ($) | 207 | 63.10¢ per $1 |
| Gini / Inequality Index | 207 | 0.21 |
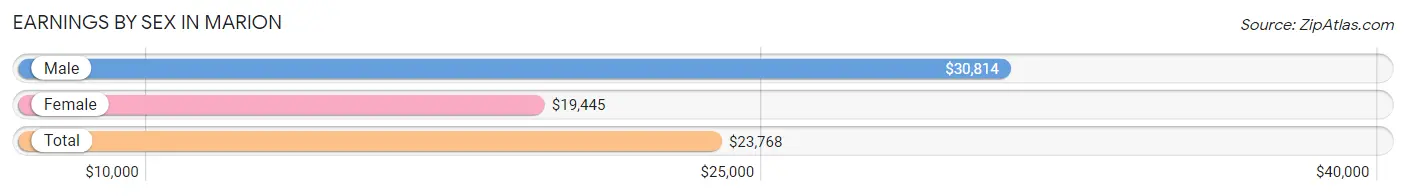
Earnings by Sex in Marion
Average Earnings in Marion are $23,768, $30,814 for men and $19,445 for women, a difference of 36.9%.
| Sex | Number | Average Earnings |
| Male | 67 (41.6%) | $30,814 |
| Female | 94 (58.4%) | $19,445 |
| Total | 161 (100.0%) | $23,768 |
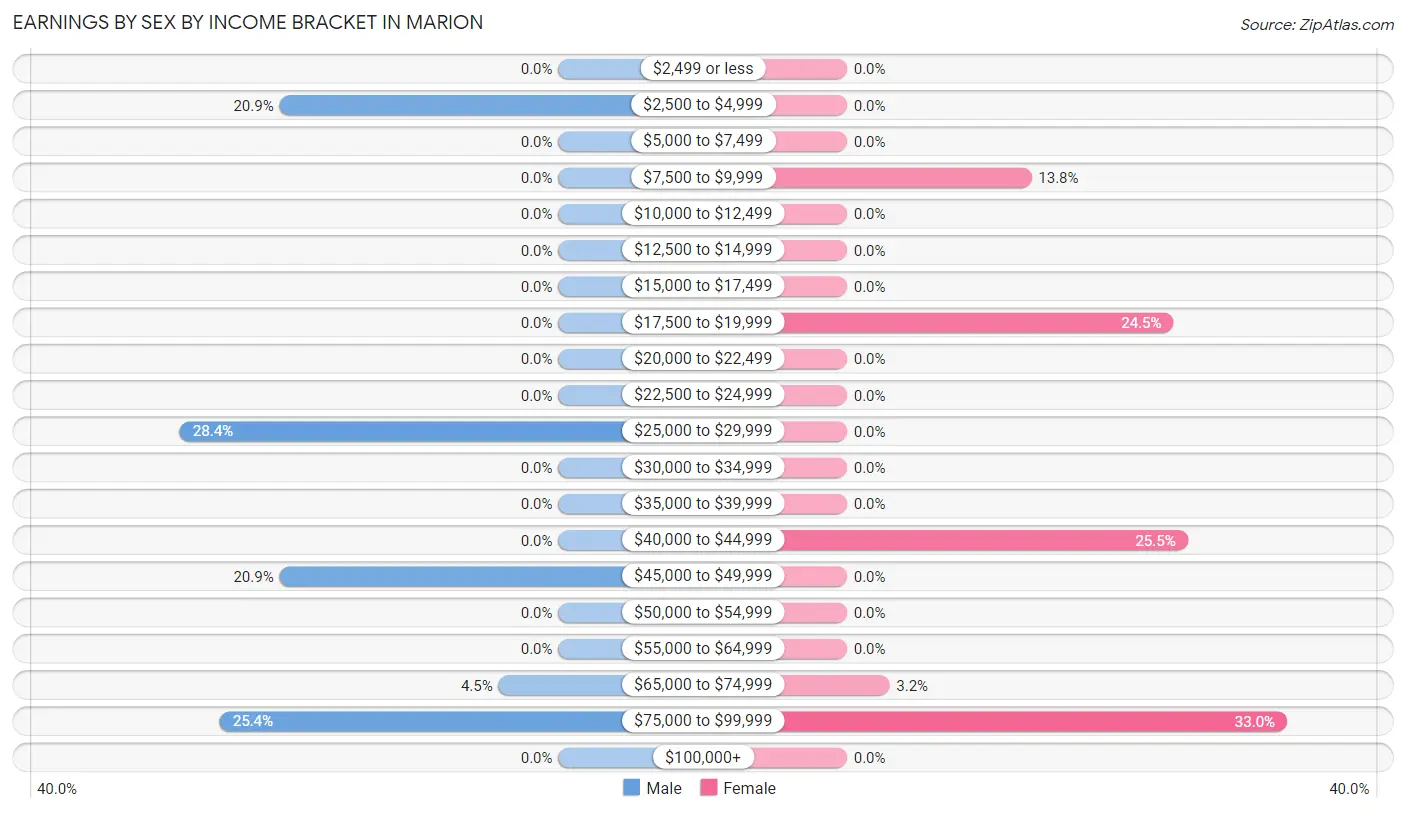
Earnings by Sex by Income Bracket in Marion
The most common earnings brackets in Marion are $25,000 to $29,999 for men (19 | 28.4%) and $75,000 to $99,999 for women (31 | 33.0%).
| Income | Male | Female |
| $2,499 or less | 0 (0.0%) | 0 (0.0%) |
| $2,500 to $4,999 | 14 (20.9%) | 0 (0.0%) |
| $5,000 to $7,499 | 0 (0.0%) | 0 (0.0%) |
| $7,500 to $9,999 | 0 (0.0%) | 13 (13.8%) |
| $10,000 to $12,499 | 0 (0.0%) | 0 (0.0%) |
| $12,500 to $14,999 | 0 (0.0%) | 0 (0.0%) |
| $15,000 to $17,499 | 0 (0.0%) | 0 (0.0%) |
| $17,500 to $19,999 | 0 (0.0%) | 23 (24.5%) |
| $20,000 to $22,499 | 0 (0.0%) | 0 (0.0%) |
| $22,500 to $24,999 | 0 (0.0%) | 0 (0.0%) |
| $25,000 to $29,999 | 19 (28.4%) | 0 (0.0%) |
| $30,000 to $34,999 | 0 (0.0%) | 0 (0.0%) |
| $35,000 to $39,999 | 0 (0.0%) | 0 (0.0%) |
| $40,000 to $44,999 | 0 (0.0%) | 24 (25.5%) |
| $45,000 to $49,999 | 14 (20.9%) | 0 (0.0%) |
| $50,000 to $54,999 | 0 (0.0%) | 0 (0.0%) |
| $55,000 to $64,999 | 0 (0.0%) | 0 (0.0%) |
| $65,000 to $74,999 | 3 (4.5%) | 3 (3.2%) |
| $75,000 to $99,999 | 17 (25.4%) | 31 (33.0%) |
| $100,000+ | 0 (0.0%) | 0 (0.0%) |
| Total | 67 (100.0%) | 94 (100.0%) |
Earnings by Sex by Educational Attainment in Marion
| Educational Attainment | Male Income | Female Income |
| Less than High School | - | - |
| High School Diploma | - | - |
| College or Associate's Degree | - | - |
| Bachelor's Degree | - | - |
| Graduate Degree | - | - |
| Total | $76,250 | $0 |
Family Income in Marion
Family Income Brackets in Marion
According to the Marion family income data, there are 23 families falling into the $15,000 to $24,999 income range, which is the most common income bracket and makes up 41.1% of all families.
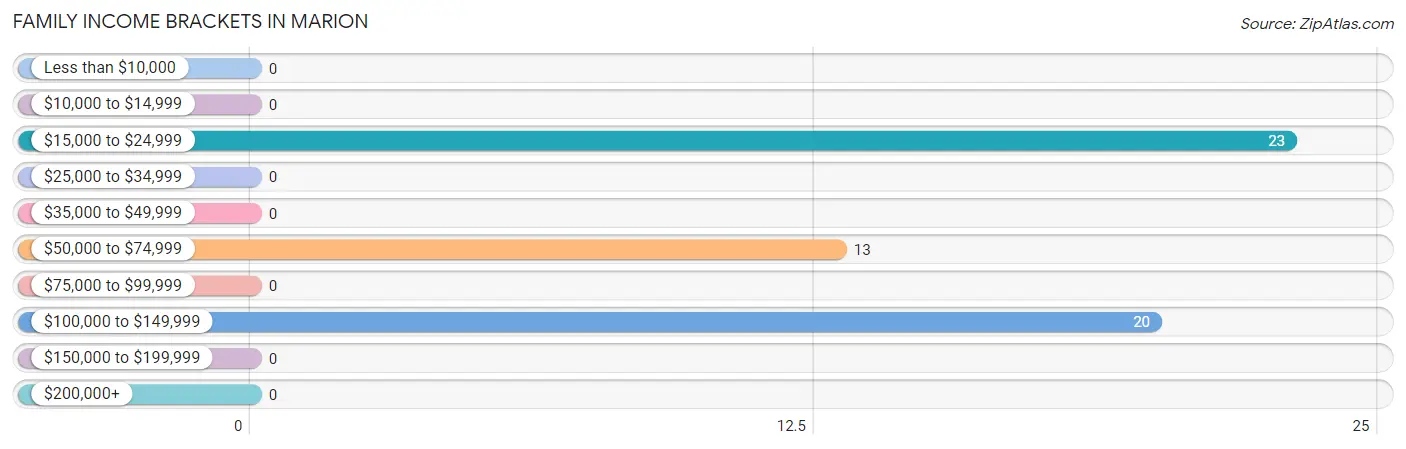
| Income Bracket | # Families | % Families |
| Less than $10,000 | 0 | 0.0% |
| $10,000 to $14,999 | 0 | 0.0% |
| $15,000 to $24,999 | 23 | 41.1% |
| $25,000 to $34,999 | 0 | 0.0% |
| $35,000 to $49,999 | 0 | 0.0% |
| $50,000 to $74,999 | 13 | 23.2% |
| $75,000 to $99,999 | 0 | 0.0% |
| $100,000 to $149,999 | 20 | 35.7% |
| $150,000 to $199,999 | 0 | 0.0% |
| $200,000+ | 0 | 0.0% |
Family Income by Famaliy Size in Marion
| Income Bracket | # Families | Median Income |
| 2-Person Families | 26 (46.4%) | $0 |
| 3-Person Families | 30 (53.6%) | $0 |
| 4-Person Families | 0 (0.0%) | $0 |
| 5-Person Families | 0 (0.0%) | $0 |
| 6-Person Families | 0 (0.0%) | $0 |
| 7+ Person Families | 0 (0.0%) | $0 |
| Total | 56 (100.0%) | $0 |
Family Income by Number of Earners in Marion
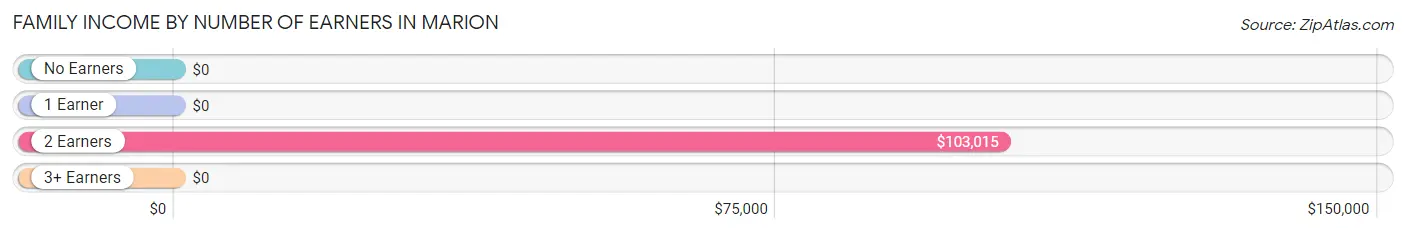
| Number of Earners | # Families | Median Income |
| No Earners | 0 (0.0%) | $0 |
| 1 Earner | 23 (41.1%) | $0 |
| 2 Earners | 33 (58.9%) | $103,015 |
| 3+ Earners | 0 (0.0%) | $0 |
| Total | 56 (100.0%) | $0 |
Household Income in Marion
Household Income Brackets in Marion
With 47 households falling in the category, the $35,000 to $49,999 income range is the most frequent in Marion, accounting for 42.3% of all households.
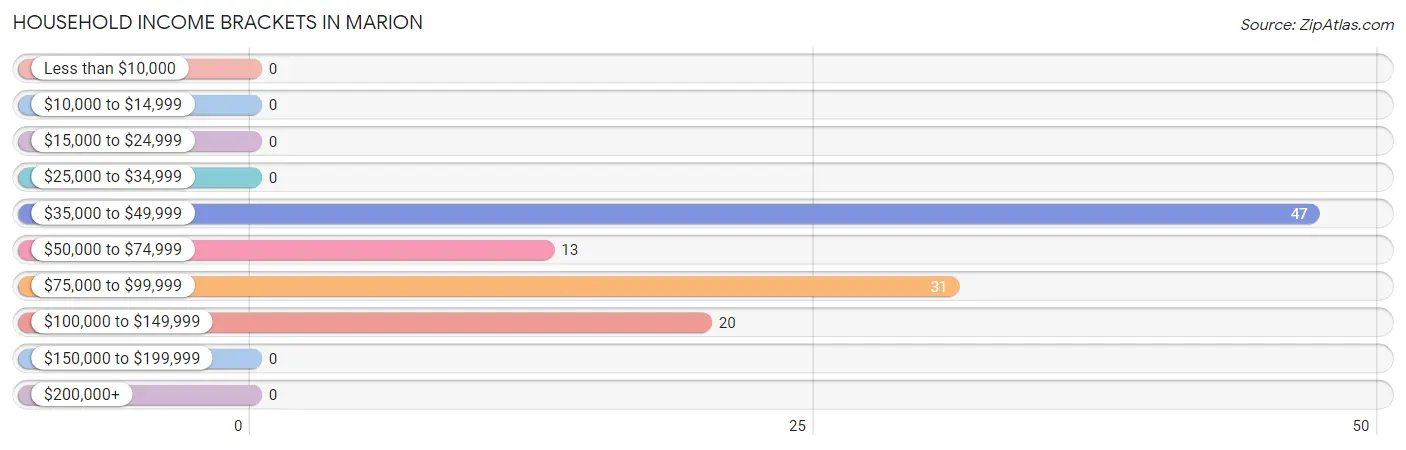
| Income Bracket | # Households | % Households |
| Less than $10,000 | 0 | 0.0% |
| $10,000 to $14,999 | 0 | 0.0% |
| $15,000 to $24,999 | 0 | 0.0% |
| $25,000 to $34,999 | 0 | 0.0% |
| $35,000 to $49,999 | 47 | 42.3% |
| $50,000 to $74,999 | 13 | 11.7% |
| $75,000 to $99,999 | 31 | 27.9% |
| $100,000 to $149,999 | 20 | 18.0% |
| $150,000 to $199,999 | 0 | 0.0% |
| $200,000+ | 0 | 0.0% |
Household Income by Householder Age in Marion
The median household income in Marion is $66,635, with the highest median household income of $96,089 found in the 45 to 64 years age bracket for the primary householder. A total of 75 households (67.6%) fall into this category. Meanwhile, the 15 to 24 years age bracket for the primary householder has the lowest median household income of $0, with 23 households (20.7%) in this group.
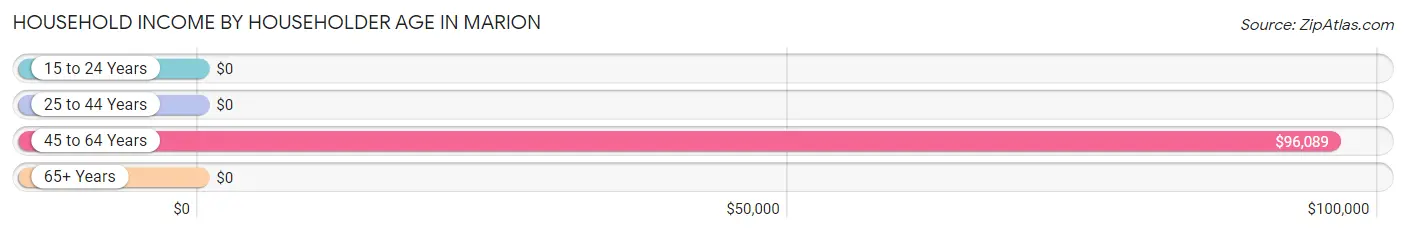
| Income Bracket | # Households | Median Income |
| 15 to 24 Years | 23 (20.7%) | $0 |
| 25 to 44 Years | 13 (11.7%) | $0 |
| 45 to 64 Years | 75 (67.6%) | $96,089 |
| 65+ Years | 0 (0.0%) | $0 |
| Total | 111 (100.0%) | $66,635 |
Poverty in Marion
Income Below Poverty by Sex and Age in Marion
With 22.0% poverty level for males and 21.5% for females among the residents of Marion, under 5 year old males and 18 to 24 year old females are the most vulnerable to poverty, with 22 males (100.0%) and 23 females (100.0%) in their respective age groups living below the poverty level.
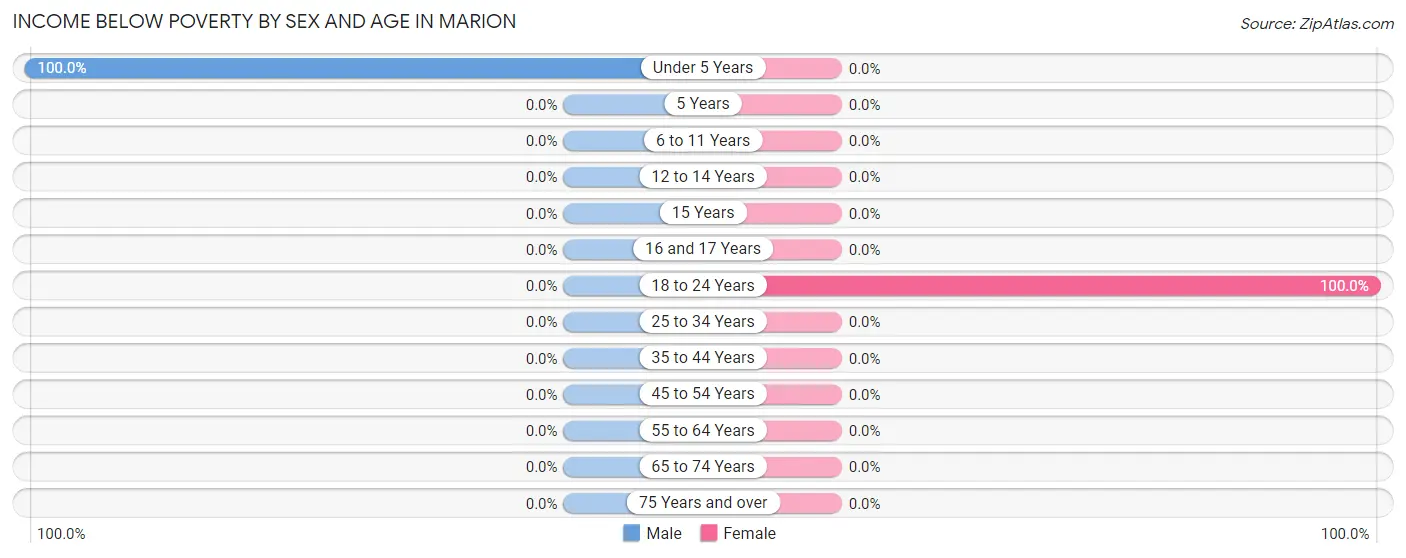
| Age Bracket | Male | Female |
| Under 5 Years | 22 (100.0%) | 0 (0.0%) |
| 5 Years | 0 (0.0%) | 0 (0.0%) |
| 6 to 11 Years | 0 (0.0%) | 0 (0.0%) |
| 12 to 14 Years | 0 (0.0%) | 0 (0.0%) |
| 15 Years | 0 (0.0%) | 0 (0.0%) |
| 16 and 17 Years | 0 (0.0%) | 0 (0.0%) |
| 18 to 24 Years | 0 (0.0%) | 23 (100.0%) |
| 25 to 34 Years | 0 (0.0%) | 0 (0.0%) |
| 35 to 44 Years | 0 (0.0%) | 0 (0.0%) |
| 45 to 54 Years | 0 (0.0%) | 0 (0.0%) |
| 55 to 64 Years | 0 (0.0%) | 0 (0.0%) |
| 65 to 74 Years | 0 (0.0%) | 0 (0.0%) |
| 75 Years and over | 0 (0.0%) | 0 (0.0%) |
| Total | 22 (22.0%) | 23 (21.5%) |
Income Above Poverty by Sex and Age in Marion
According to the poverty statistics in Marion, males aged 16 and 17 years and females aged 35 to 44 years are the age groups that are most secure financially, with 100.0% of males and 100.0% of females in these age groups living above the poverty line.
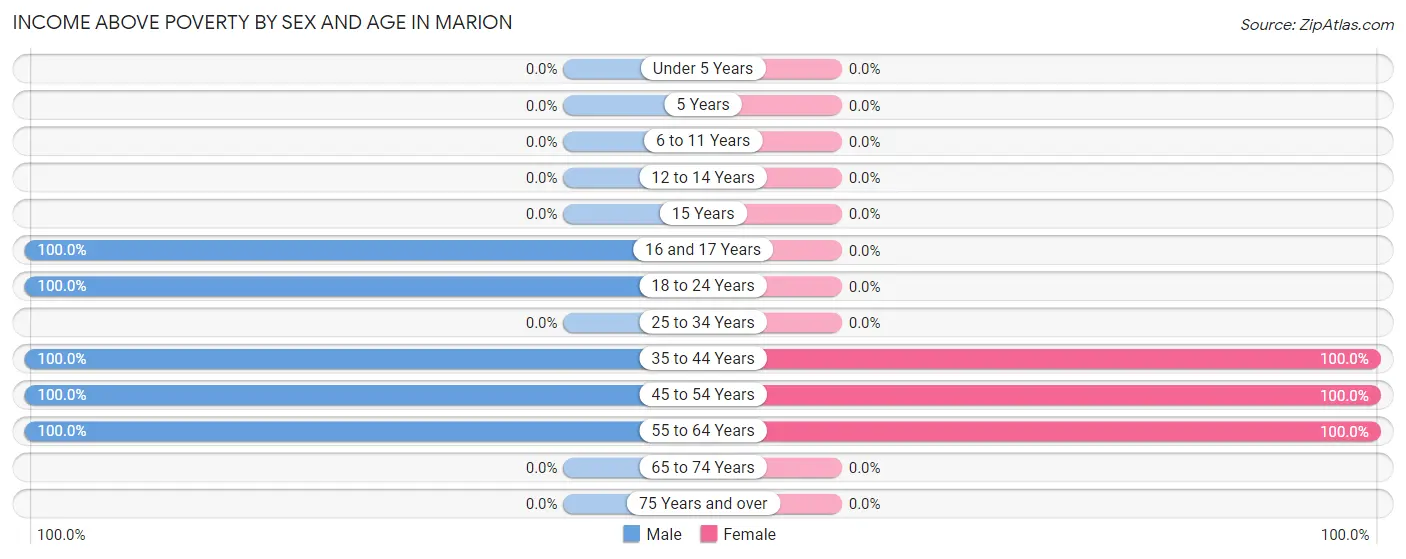
| Age Bracket | Male | Female |
| Under 5 Years | 0 (0.0%) | 0 (0.0%) |
| 5 Years | 0 (0.0%) | 0 (0.0%) |
| 6 to 11 Years | 0 (0.0%) | 0 (0.0%) |
| 12 to 14 Years | 0 (0.0%) | 0 (0.0%) |
| 15 Years | 0 (0.0%) | 0 (0.0%) |
| 16 and 17 Years | 25 (100.0%) | 0 (0.0%) |
| 18 to 24 Years | 19 (100.0%) | 0 (0.0%) |
| 25 to 34 Years | 0 (0.0%) | 0 (0.0%) |
| 35 to 44 Years | 14 (100.0%) | 16 (100.0%) |
| 45 to 54 Years | 17 (100.0%) | 13 (100.0%) |
| 55 to 64 Years | 3 (100.0%) | 55 (100.0%) |
| 65 to 74 Years | 0 (0.0%) | 0 (0.0%) |
| 75 Years and over | 0 (0.0%) | 0 (0.0%) |
| Total | 78 (78.0%) | 84 (78.5%) |
Income Below Poverty Among Married-Couple Families in Marion
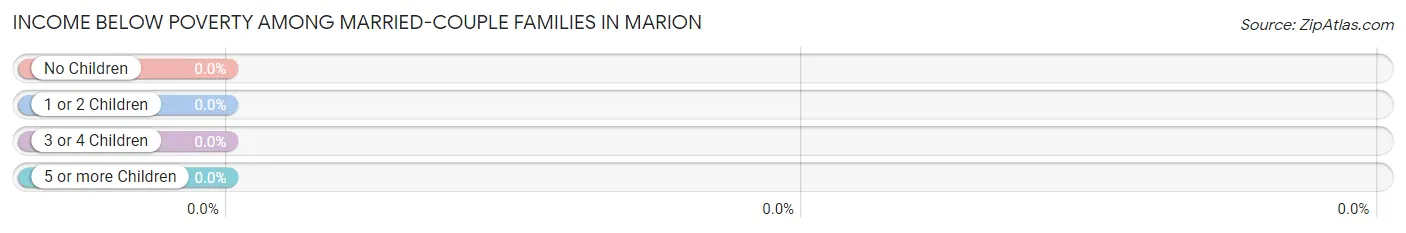
| Children | Above Poverty | Below Poverty |
| No Children | 3 (100.0%) | 0 (0.0%) |
| 1 or 2 Children | 30 (100.0%) | 0 (0.0%) |
| 3 or 4 Children | 0 (0.0%) | 0 (0.0%) |
| 5 or more Children | 0 (0.0%) | 0 (0.0%) |
| Total | 33 (100.0%) | 0 (0.0%) |
Income Below Poverty Among Single-Parent Households in Marion
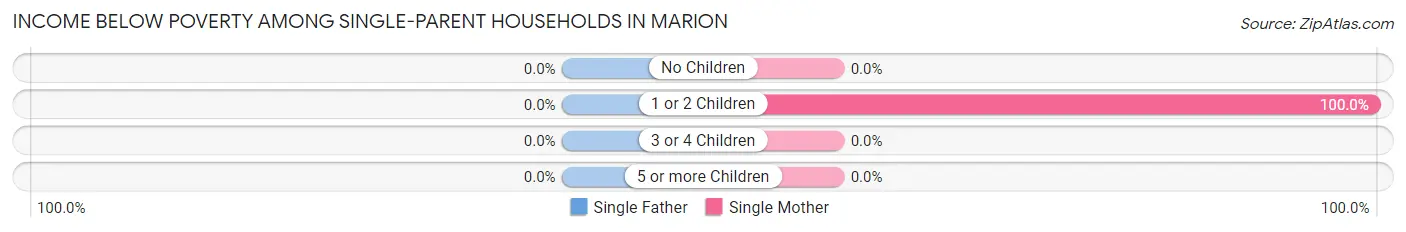
| Children | Single Father | Single Mother |
| No Children | 0 (0.0%) | 0 (0.0%) |
| 1 or 2 Children | 0 (0.0%) | 23 (100.0%) |
| 3 or 4 Children | 0 (0.0%) | 0 (0.0%) |
| 5 or more Children | 0 (0.0%) | 0 (0.0%) |
| Total | 0 (0.0%) | 23 (100.0%) |
Income Below Poverty Among Married-Couple vs Single-Parent Households in Marion
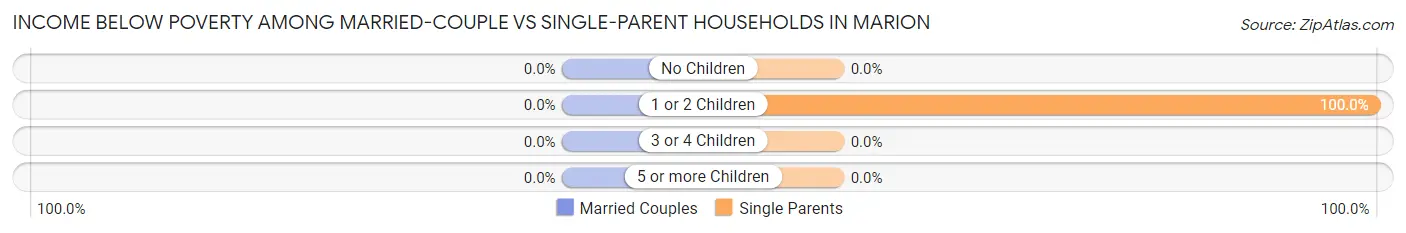
| Children | Married-Couple Families | Single-Parent Households |
| No Children | 0 (0.0%) | 0 (0.0%) |
| 1 or 2 Children | 0 (0.0%) | 23 (100.0%) |
| 3 or 4 Children | 0 (0.0%) | 0 (0.0%) |
| 5 or more Children | 0 (0.0%) | 0 (0.0%) |
| Total | 0 (0.0%) | 23 (100.0%) |
Race in Marion
The most populous races in Marion are , and White / Caucasian (207 | 100.0%).
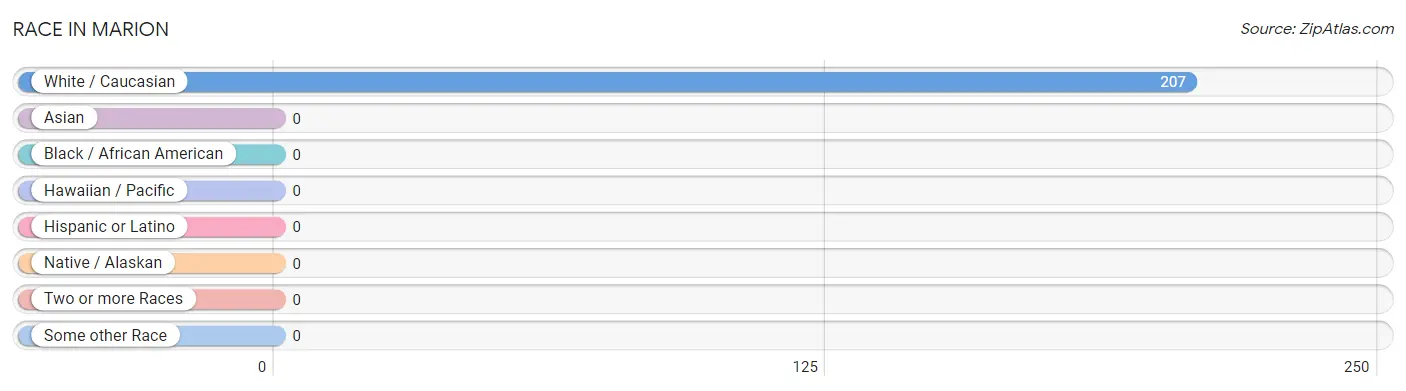
| Race | # Population | % Population |
| Asian | 0 | 0.0% |
| Black / African American | 0 | 0.0% |
| Hawaiian / Pacific | 0 | 0.0% |
| Hispanic or Latino | 0 | 0.0% |
| Native / Alaskan | 0 | 0.0% |
| White / Caucasian | 207 | 100.0% |
| Two or more Races | 0 | 0.0% |
| Some other Race | 0 | 0.0% |
| Total | 207 | 100.0% |
Ancestry in Marion
The most populous ancestries reported in Marion are English (31 | 15.0%), and American (24 | 11.6%), together accounting for 26.6% of all Marion residents.
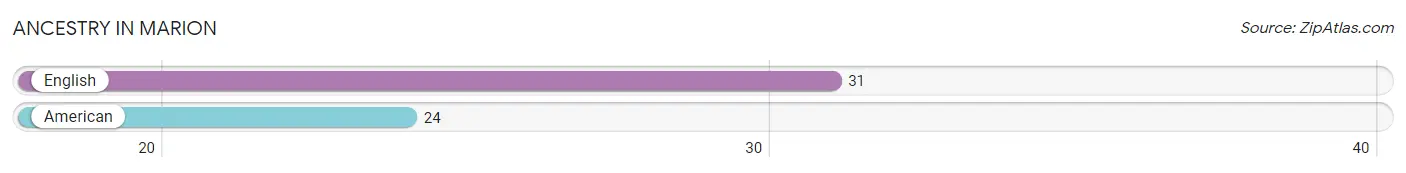
| Ancestry | # Population | % Population |
| American | 24 | 11.6% |
| English | 31 | 15.0% | View All 2 Rows |
Immigrants in Marion

| Immigration Origin | # Population | % Population | View All 0 Rows |
Sex and Age in Marion
Sex and Age in Marion
The most populous age groups in Marion are 15 to 19 Years (25 | 25.0%) for men and 55 to 59 Years (31 | 29.0%) for women.
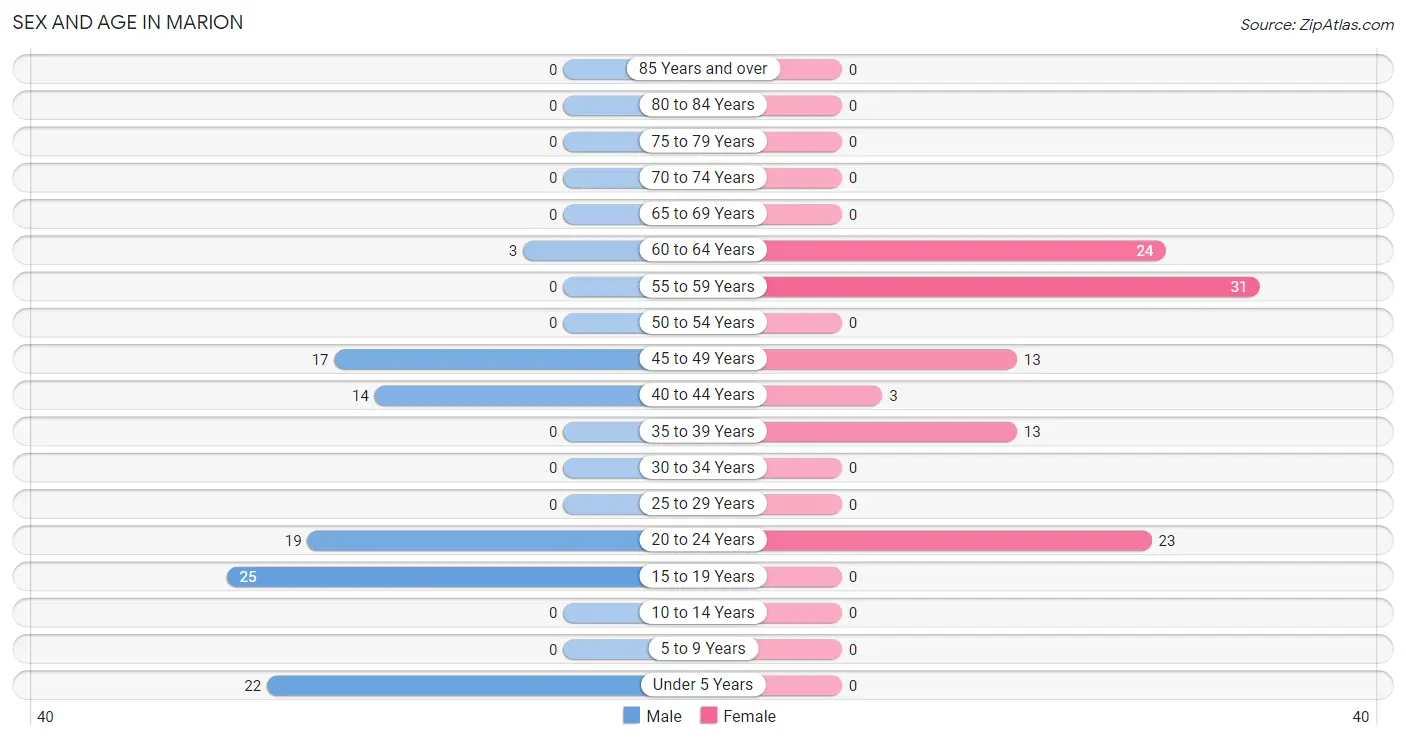
| Age Bracket | Male | Female |
| Under 5 Years | 22 (22.0%) | 0 (0.0%) |
| 5 to 9 Years | 0 (0.0%) | 0 (0.0%) |
| 10 to 14 Years | 0 (0.0%) | 0 (0.0%) |
| 15 to 19 Years | 25 (25.0%) | 0 (0.0%) |
| 20 to 24 Years | 19 (19.0%) | 23 (21.5%) |
| 25 to 29 Years | 0 (0.0%) | 0 (0.0%) |
| 30 to 34 Years | 0 (0.0%) | 0 (0.0%) |
| 35 to 39 Years | 0 (0.0%) | 13 (12.1%) |
| 40 to 44 Years | 14 (14.0%) | 3 (2.8%) |
| 45 to 49 Years | 17 (17.0%) | 13 (12.1%) |
| 50 to 54 Years | 0 (0.0%) | 0 (0.0%) |
| 55 to 59 Years | 0 (0.0%) | 31 (29.0%) |
| 60 to 64 Years | 3 (3.0%) | 24 (22.4%) |
| 65 to 69 Years | 0 (0.0%) | 0 (0.0%) |
| 70 to 74 Years | 0 (0.0%) | 0 (0.0%) |
| 75 to 79 Years | 0 (0.0%) | 0 (0.0%) |
| 80 to 84 Years | 0 (0.0%) | 0 (0.0%) |
| 85 Years and over | 0 (0.0%) | 0 (0.0%) |
| Total | 100 (100.0%) | 107 (100.0%) |
Families and Households in Marion
Median Family Size in Marion
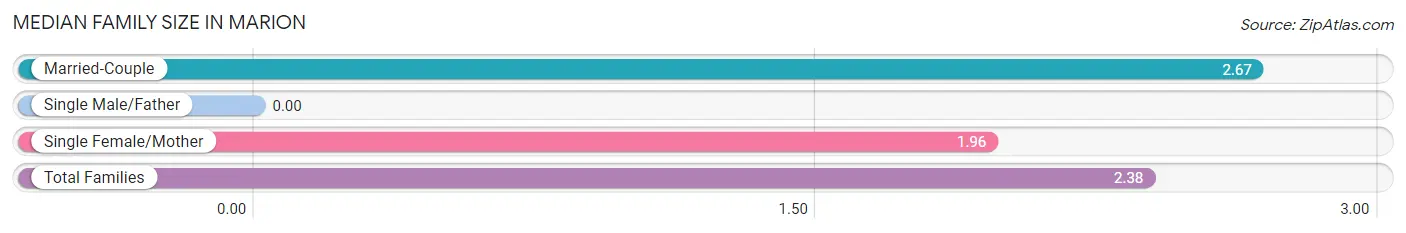
| Family Type | # Families | Family Size |
| Married-Couple | 33 (58.9%) | 2.67 |
| Single Male/Father | 0 (0.0%) | - |
| Single Female/Mother | 23 (41.1%) | 1.96 |
| Total Families | 56 (100.0%) | 2.38 |
Median Household Size in Marion
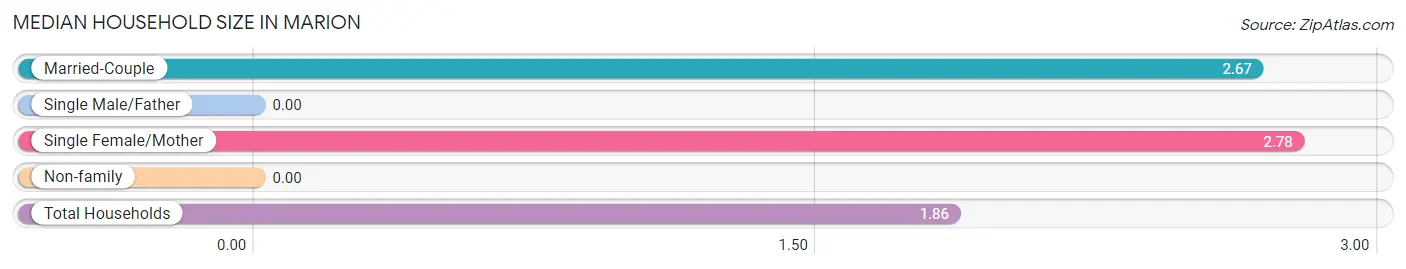
| Household Type | # Households | Household Size |
| Married-Couple | 33 (29.7%) | 2.67 |
| Single Male/Father | 0 (0.0%) | - |
| Single Female/Mother | 23 (20.7%) | 2.78 |
| Non-family | 55 (49.5%) | - |
| Total Households | 111 (100.0%) | 1.86 |
Household Size by Marriage Status in Marion
Out of a total of 111 households in Marion, 56 (50.4%) are family households, while 55 (49.5%) are nonfamily households. The most numerous type of family households are 3-person households, comprising 53, and the most common type of nonfamily households are 1-person households, comprising 55.
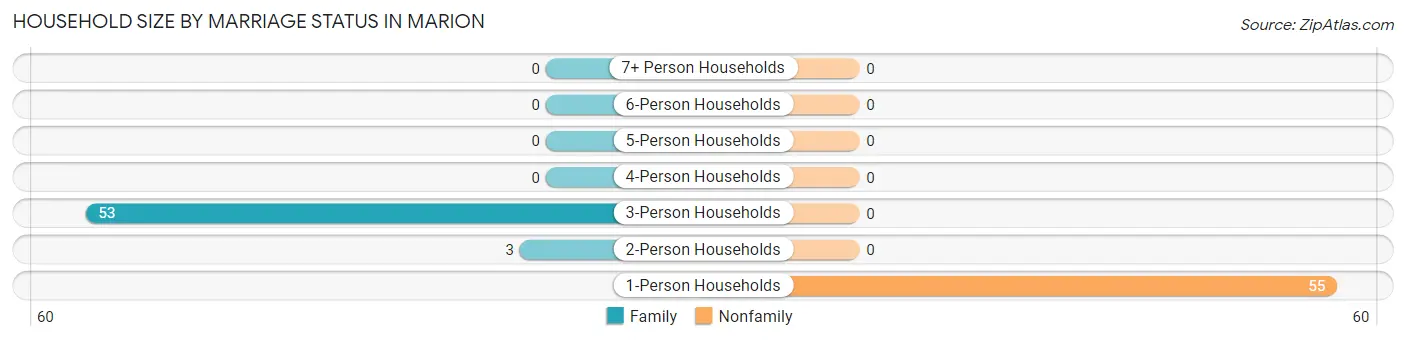
| Household Size | Family Households | Nonfamily Households |
| 1-Person Households | - | 55 (49.5%) |
| 2-Person Households | 3 (2.7%) | 0 (0.0%) |
| 3-Person Households | 53 (47.7%) | 0 (0.0%) |
| 4-Person Households | 0 (0.0%) | 0 (0.0%) |
| 5-Person Households | 0 (0.0%) | 0 (0.0%) |
| 6-Person Households | 0 (0.0%) | 0 (0.0%) |
| 7+ Person Households | 0 (0.0%) | 0 (0.0%) |
| Total | 56 (50.4%) | 55 (49.5%) |
Female Fertility in Marion
Fertility by Age in Marion
Average fertility rate in Marion is 442.0 births per 1,000 women. Women in the age bracket of 20 to 34 years have the highest fertility rate with 1,000.0 births per 1,000 women. Women in the age bracket of 20 to 34 years acount for 100.0% of all women with births.
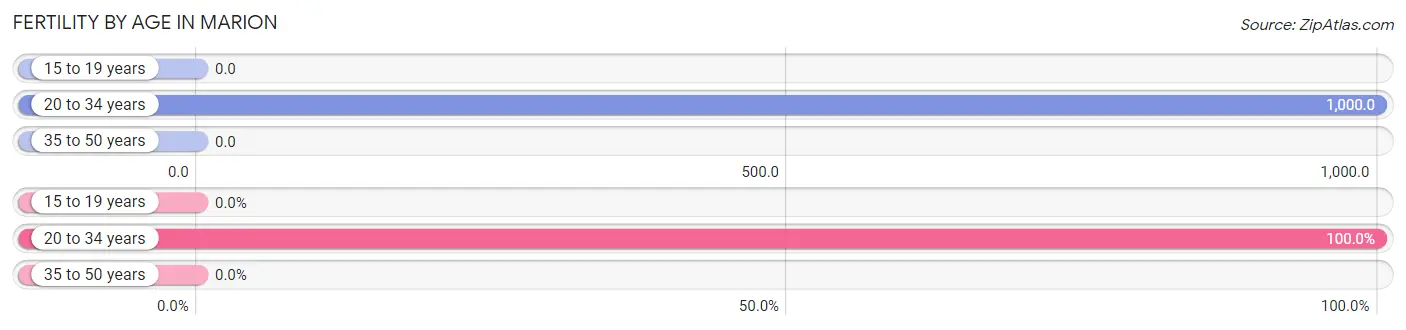
| Age Bracket | Women with Births | Births / 1,000 Women |
| 15 to 19 years | 0 (0.0%) | 0.0 |
| 20 to 34 years | 23 (100.0%) | 1,000.0 |
| 35 to 50 years | 0 (0.0%) | 0.0 |
| Total | 23 (100.0%) | 442.0 |
Fertility by Age by Marriage Status in Marion
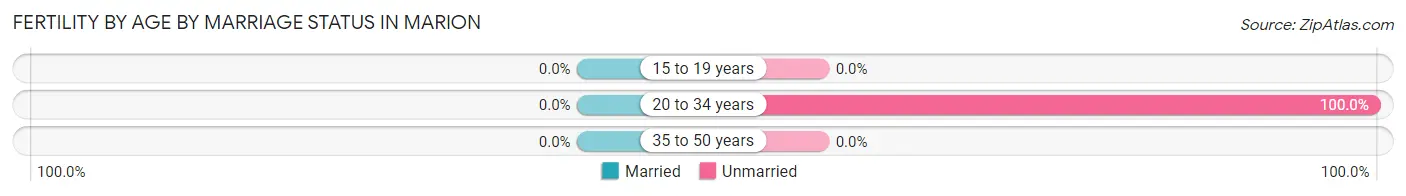
| Age Bracket | Married | Unmarried |
| 15 to 19 years | 0 (0.0%) | 0 (0.0%) |
| 20 to 34 years | 0 (0.0%) | 23 (100.0%) |
| 35 to 50 years | 0 (0.0%) | 0 (0.0%) |
| Total | 0 (0.0%) | 23 (100.0%) |
Fertility by Education in Marion
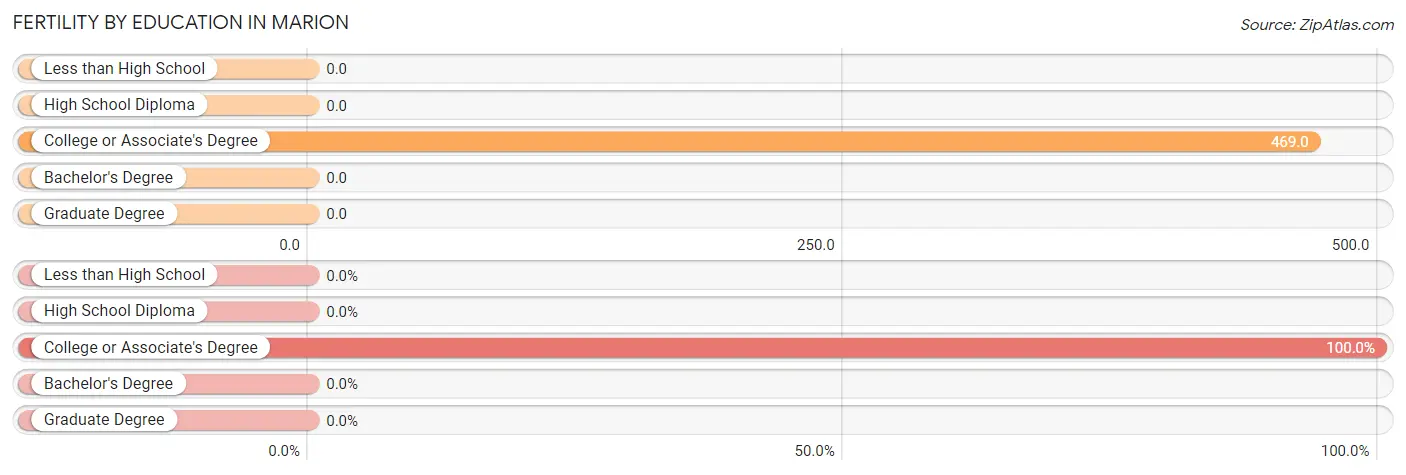
| Educational Attainment | Women with Births | Births / 1,000 Women |
| Less than High School | 0 (0.0%) | 0.0 |
| High School Diploma | 0 (0.0%) | 0.0 |
| College or Associate's Degree | 23 (100.0%) | 469.0 |
| Bachelor's Degree | 0 (0.0%) | 0.0 |
| Graduate Degree | 0 (0.0%) | 0.0 |
| Total | 23 (100.0%) | 442.0 |
Fertility by Education by Marriage Status in Marion
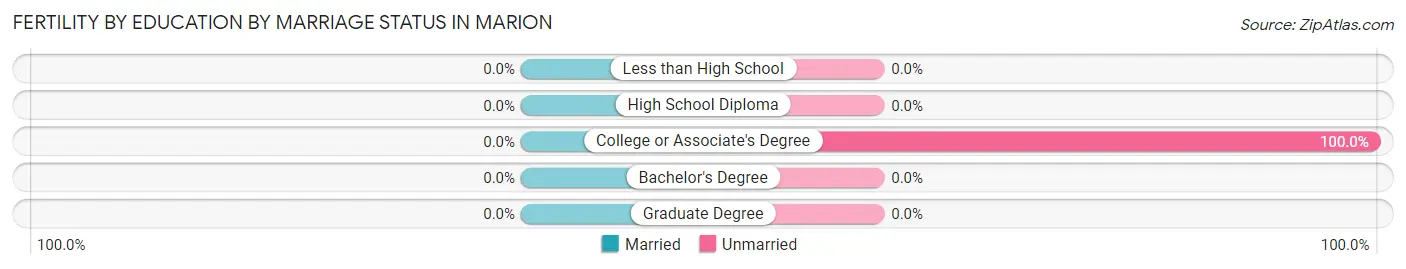
| Educational Attainment | Married | Unmarried |
| Less than High School | 0 (0.0%) | 0 (0.0%) |
| High School Diploma | 0 (0.0%) | 0 (0.0%) |
| College or Associate's Degree | 0 (0.0%) | 23 (100.0%) |
| Bachelor's Degree | 0 (0.0%) | 0 (0.0%) |
| Graduate Degree | 0 (0.0%) | 0 (0.0%) |
| Total | 0 (0.0%) | 23 (100.0%) |
Employment Characteristics in Marion
Employment by Class of Employer in Marion
Among the 161 employed individuals in Marion, private company employees (120 | 74.5%), local government employees (38 | 23.6%), and self-employed (incorporated) (3 | 1.9%) make up the most common classes of employment.
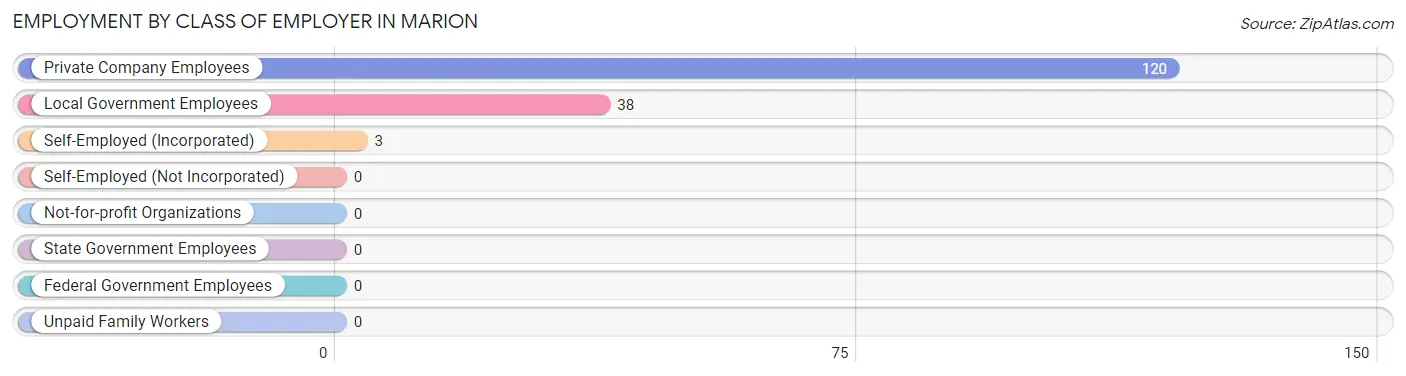
| Employer Class | # Employees | % Employees |
| Private Company Employees | 120 | 74.5% |
| Self-Employed (Incorporated) | 3 | 1.9% |
| Self-Employed (Not Incorporated) | 0 | 0.0% |
| Not-for-profit Organizations | 0 | 0.0% |
| Local Government Employees | 38 | 23.6% |
| State Government Employees | 0 | 0.0% |
| Federal Government Employees | 0 | 0.0% |
| Unpaid Family Workers | 0 | 0.0% |
| Total | 161 | 100.0% |
Employment Status by Age in Marion
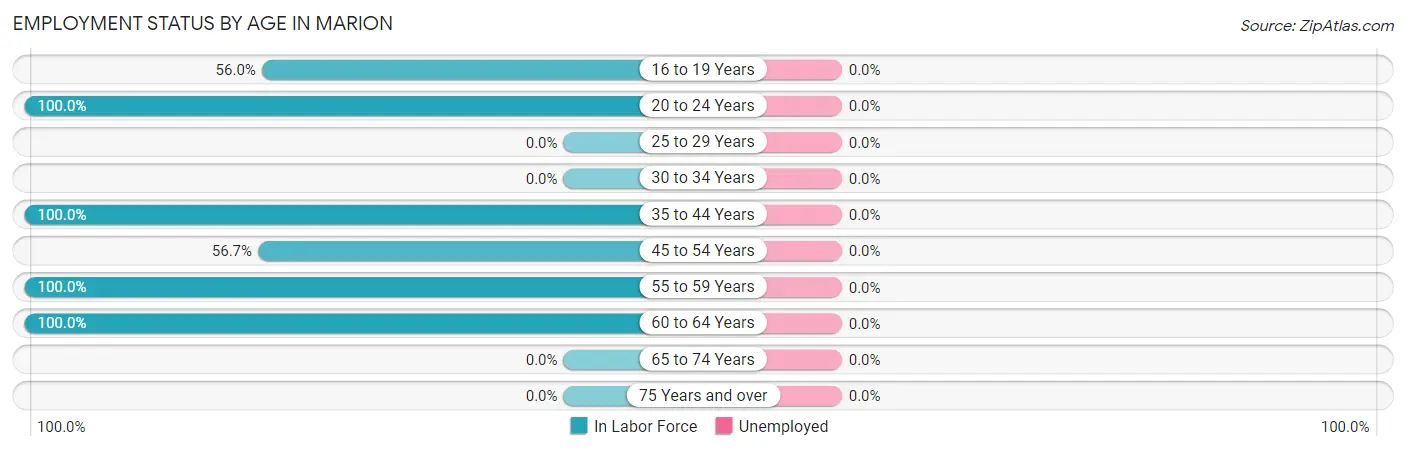
| Age Bracket | In Labor Force | Unemployed |
| 16 to 19 Years | 14 (56.0%) | 0 (0.0%) |
| 20 to 24 Years | 42 (100.0%) | 0 (0.0%) |
| 25 to 29 Years | 0 (0.0%) | 0 (0.0%) |
| 30 to 34 Years | 0 (0.0%) | 0 (0.0%) |
| 35 to 44 Years | 30 (100.0%) | 0 (0.0%) |
| 45 to 54 Years | 17 (56.7%) | 0 (0.0%) |
| 55 to 59 Years | 31 (100.0%) | 0 (0.0%) |
| 60 to 64 Years | 27 (100.0%) | 0 (0.0%) |
| 65 to 74 Years | 0 (0.0%) | 0 (0.0%) |
| 75 Years and over | 0 (0.0%) | 0 (0.0%) |
| Total | 161 (87.0%) | 0 (0.0%) |
Employment Status by Educational Attainment in Marion
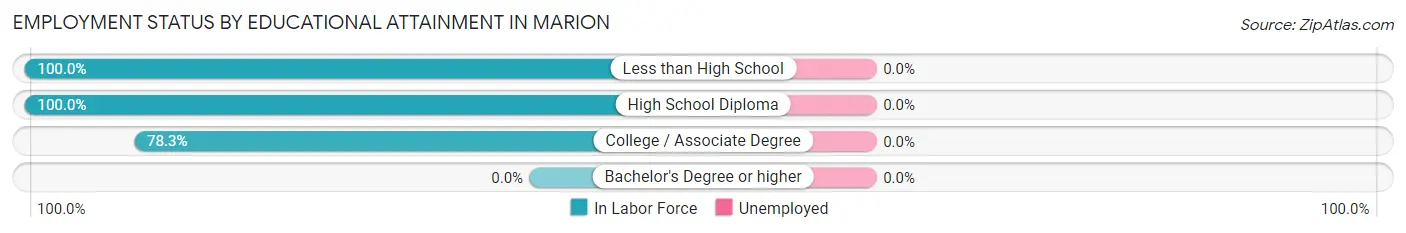
| Educational Attainment | In Labor Force | Unemployed |
| Less than High School | 17 (100.0%) | 0 (0.0%) |
| High School Diploma | 41 (100.0%) | 0 (0.0%) |
| College / Associate Degree | 47 (78.3%) | 0 (0.0%) |
| Bachelor's Degree or higher | 0 (0.0%) | 0 (0.0%) |
| Total | 105 (89.0%) | 0 (0.0%) |
Employment Occupations by Sex in Marion
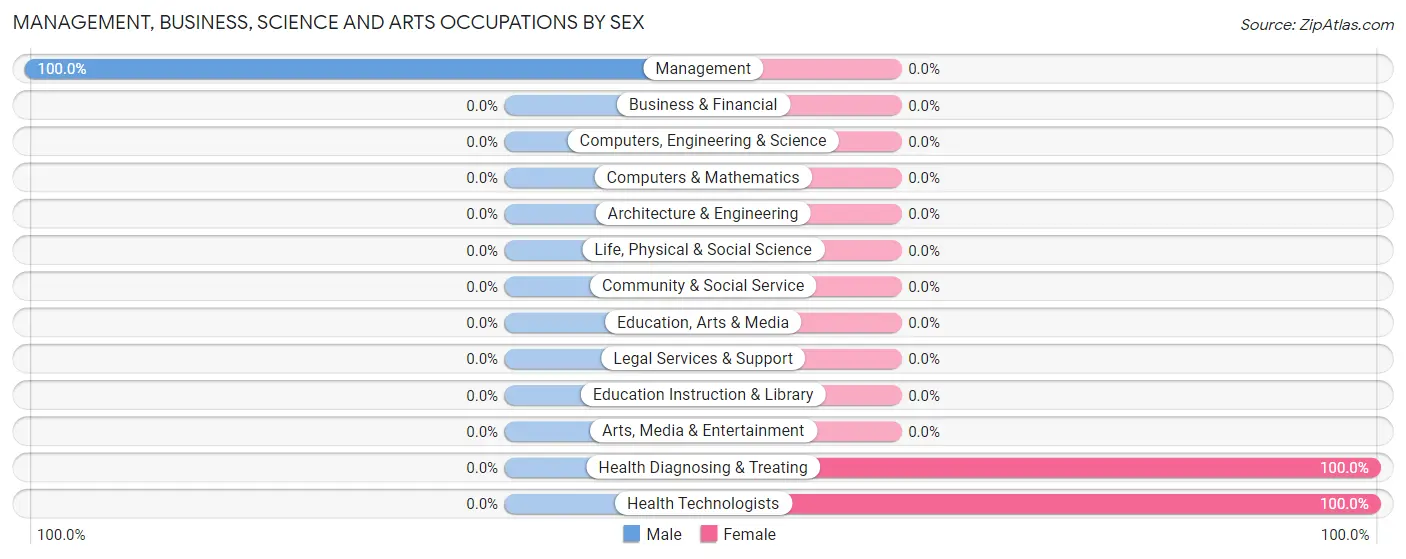
Management, Business, Science and Arts Occupations
The most common Management, Business, Science and Arts occupations in Marion are Health Diagnosing & Treating (31 | 19.3%), Health Technologists (31 | 19.3%), and Management (17 | 10.6%).
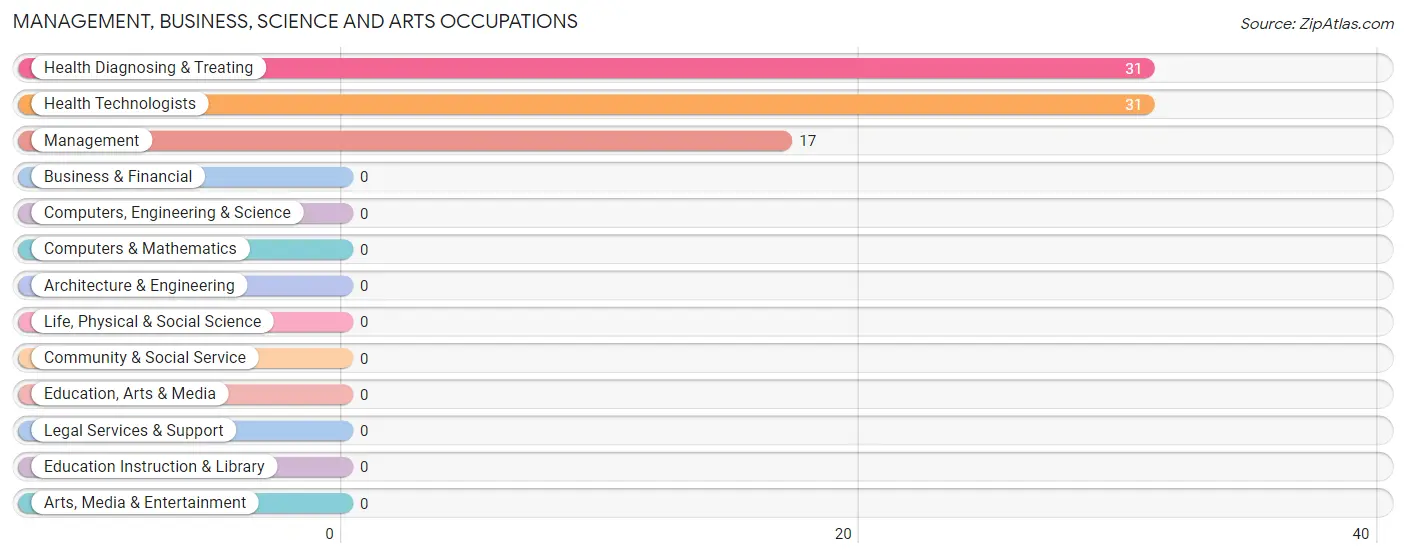
Management, Business, Science and Arts Occupations by Sex
| Occupation | Male | Female |
| Management | 17 (100.0%) | 0 (0.0%) |
| Business & Financial | 0 (0.0%) | 0 (0.0%) |
| Computers, Engineering & Science | 0 (0.0%) | 0 (0.0%) |
| Computers & Mathematics | 0 (0.0%) | 0 (0.0%) |
| Architecture & Engineering | 0 (0.0%) | 0 (0.0%) |
| Life, Physical & Social Science | 0 (0.0%) | 0 (0.0%) |
| Community & Social Service | 0 (0.0%) | 0 (0.0%) |
| Education, Arts & Media | 0 (0.0%) | 0 (0.0%) |
| Legal Services & Support | 0 (0.0%) | 0 (0.0%) |
| Education Instruction & Library | 0 (0.0%) | 0 (0.0%) |
| Arts, Media & Entertainment | 0 (0.0%) | 0 (0.0%) |
| Health Diagnosing & Treating | 0 (0.0%) | 31 (100.0%) |
| Health Technologists | 0 (0.0%) | 31 (100.0%) |
| Total (Category) | 17 (35.4%) | 31 (64.6%) |
| Total (Overall) | 67 (41.6%) | 94 (58.4%) |
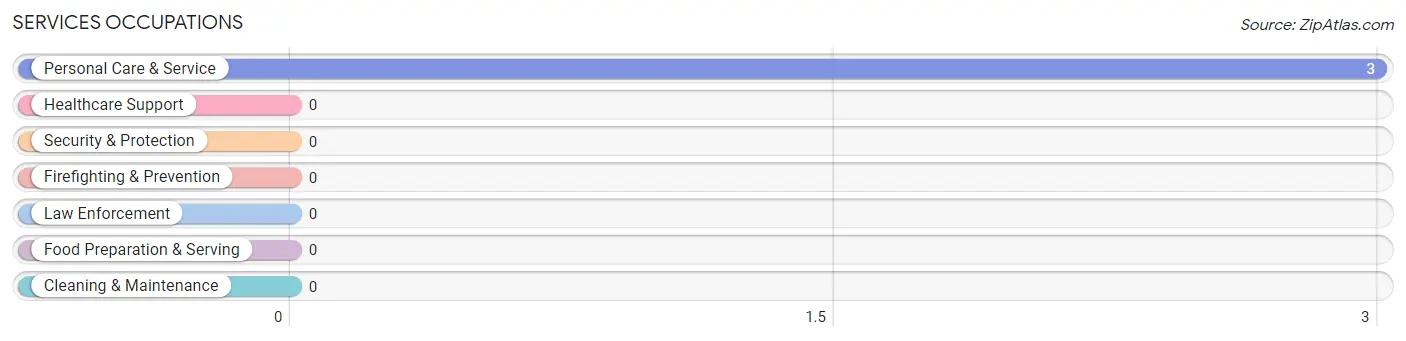
Services Occupations
The most common Services occupations in Marion are , and Personal Care & Service (3 | 1.9%).
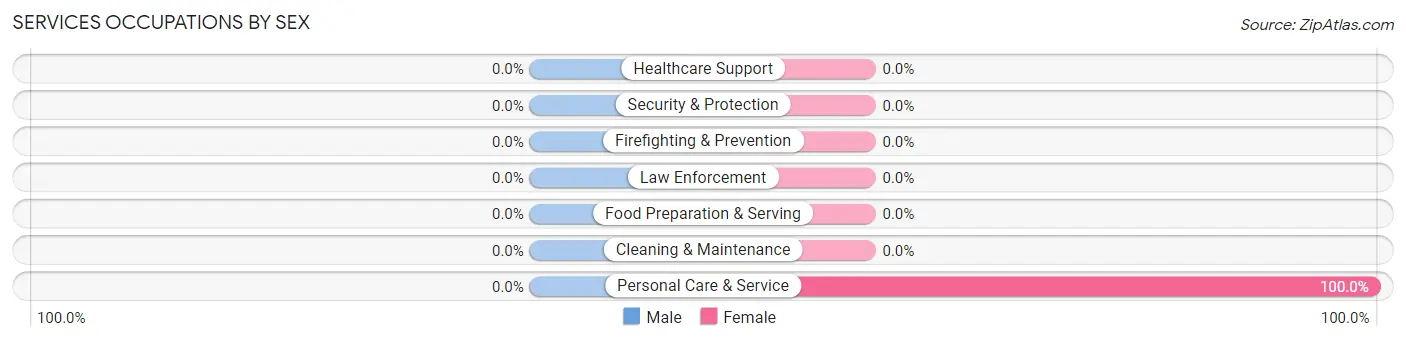
Services Occupations by Sex
| Occupation | Male | Female |
| Healthcare Support | 0 (0.0%) | 0 (0.0%) |
| Security & Protection | 0 (0.0%) | 0 (0.0%) |
| Firefighting & Prevention | 0 (0.0%) | 0 (0.0%) |
| Law Enforcement | 0 (0.0%) | 0 (0.0%) |
| Food Preparation & Serving | 0 (0.0%) | 0 (0.0%) |
| Cleaning & Maintenance | 0 (0.0%) | 0 (0.0%) |
| Personal Care & Service | 0 (0.0%) | 3 (100.0%) |
| Total (Category) | 0 (0.0%) | 3 (100.0%) |
| Total (Overall) | 67 (41.6%) | 94 (58.4%) |
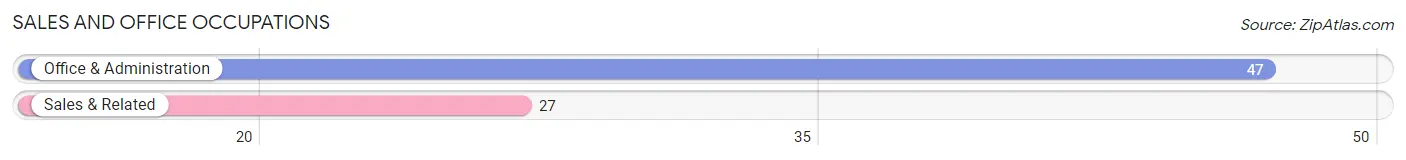
Sales and Office Occupations
The most common Sales and Office occupations in Marion are Office & Administration (47 | 29.2%), and Sales & Related (27 | 16.8%).
Sales and Office Occupations by Sex
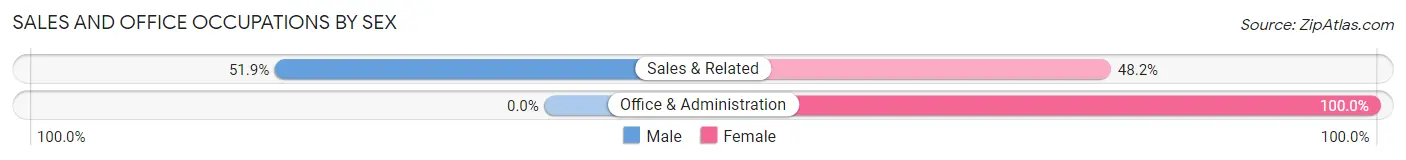
| Occupation | Male | Female |
| Sales & Related | 14 (51.8%) | 13 (48.1%) |
| Office & Administration | 0 (0.0%) | 47 (100.0%) |
| Total (Category) | 14 (18.9%) | 60 (81.1%) |
| Total (Overall) | 67 (41.6%) | 94 (58.4%) |
Natural Resources, Construction and Maintenance Occupations
The most common Natural Resources, Construction and Maintenance occupations in Marion are , and Construction & Extraction (19 | 11.8%).
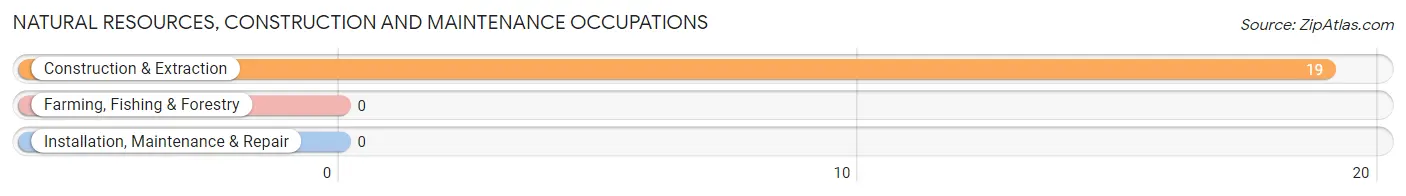
Natural Resources, Construction and Maintenance Occupations by Sex
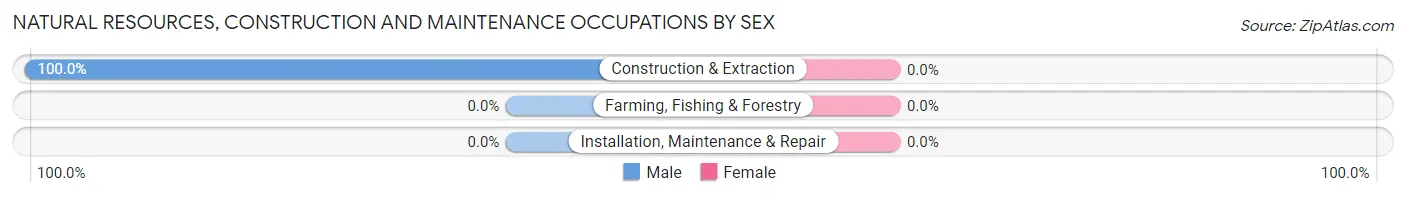
| Occupation | Male | Female |
| Farming, Fishing & Forestry | 0 (0.0%) | 0 (0.0%) |
| Construction & Extraction | 19 (100.0%) | 0 (0.0%) |
| Installation, Maintenance & Repair | 0 (0.0%) | 0 (0.0%) |
| Total (Category) | 19 (100.0%) | 0 (0.0%) |
| Total (Overall) | 67 (41.6%) | 94 (58.4%) |
Production, Transportation and Moving Occupations
The most common Production, Transportation and Moving occupations in Marion are Production (14 | 8.7%), and Transportation (3 | 1.9%).
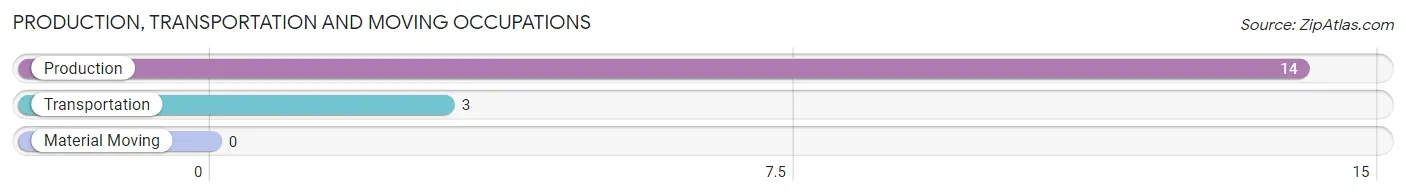
Production, Transportation and Moving Occupations by Sex
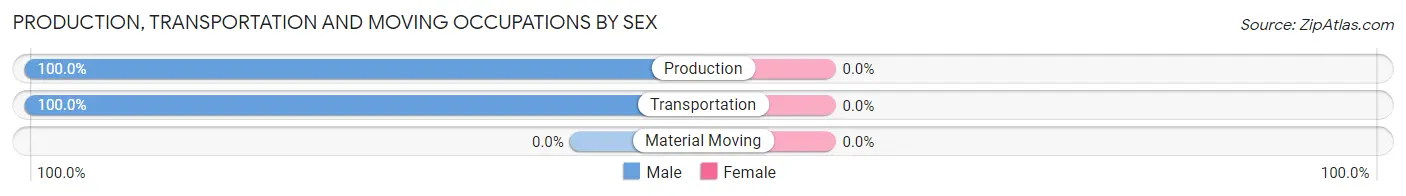
| Occupation | Male | Female |
| Production | 14 (100.0%) | 0 (0.0%) |
| Transportation | 3 (100.0%) | 0 (0.0%) |
| Material Moving | 0 (0.0%) | 0 (0.0%) |
| Total (Category) | 17 (100.0%) | 0 (0.0%) |
| Total (Overall) | 67 (41.6%) | 94 (58.4%) |
Employment Industries by Sex in Marion
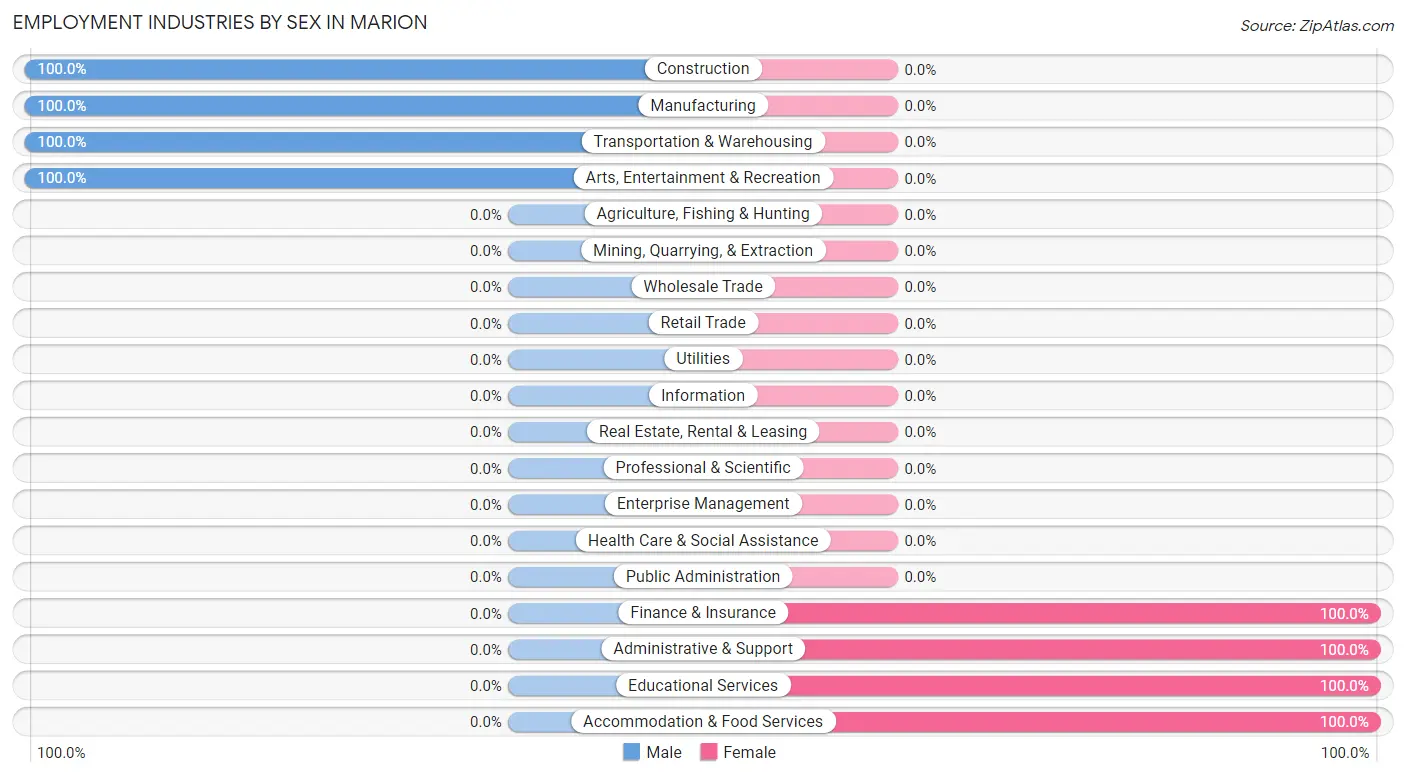
Employment Industries in Marion
The major employment industries in Marion include Construction (36 | 22.4%), Administrative & Support (34 | 21.1%), Educational Services (24 | 14.9%), Finance & Insurance (23 | 14.3%), and Manufacturing (14 | 8.7%).
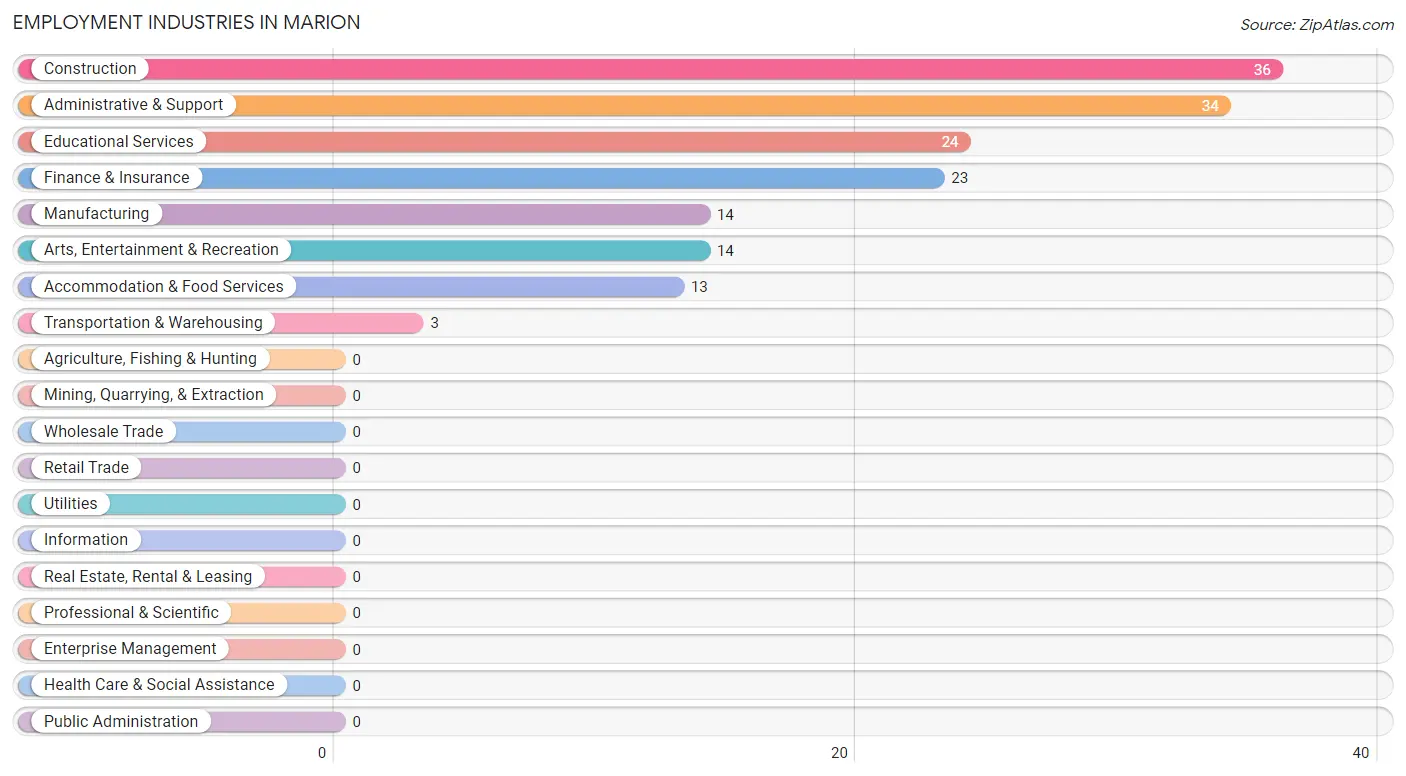
Employment Industries by Sex in Marion
The Marion industries that see more men than women are Construction (100.0%), Manufacturing (100.0%), and Transportation & Warehousing (100.0%), whereas the industries that tend to have a higher number of women are Finance & Insurance (100.0%), Administrative & Support (100.0%), and Educational Services (100.0%).
| Industry | Male | Female |
| Agriculture, Fishing & Hunting | 0 (0.0%) | 0 (0.0%) |
| Mining, Quarrying, & Extraction | 0 (0.0%) | 0 (0.0%) |
| Construction | 36 (100.0%) | 0 (0.0%) |
| Manufacturing | 14 (100.0%) | 0 (0.0%) |
| Wholesale Trade | 0 (0.0%) | 0 (0.0%) |
| Retail Trade | 0 (0.0%) | 0 (0.0%) |
| Transportation & Warehousing | 3 (100.0%) | 0 (0.0%) |
| Utilities | 0 (0.0%) | 0 (0.0%) |
| Information | 0 (0.0%) | 0 (0.0%) |
| Finance & Insurance | 0 (0.0%) | 23 (100.0%) |
| Real Estate, Rental & Leasing | 0 (0.0%) | 0 (0.0%) |
| Professional & Scientific | 0 (0.0%) | 0 (0.0%) |
| Enterprise Management | 0 (0.0%) | 0 (0.0%) |
| Administrative & Support | 0 (0.0%) | 34 (100.0%) |
| Educational Services | 0 (0.0%) | 24 (100.0%) |
| Health Care & Social Assistance | 0 (0.0%) | 0 (0.0%) |
| Arts, Entertainment & Recreation | 14 (100.0%) | 0 (0.0%) |
| Accommodation & Food Services | 0 (0.0%) | 13 (100.0%) |
| Public Administration | 0 (0.0%) | 0 (0.0%) |
| Total | 67 (41.6%) | 94 (58.4%) |
Education in Marion
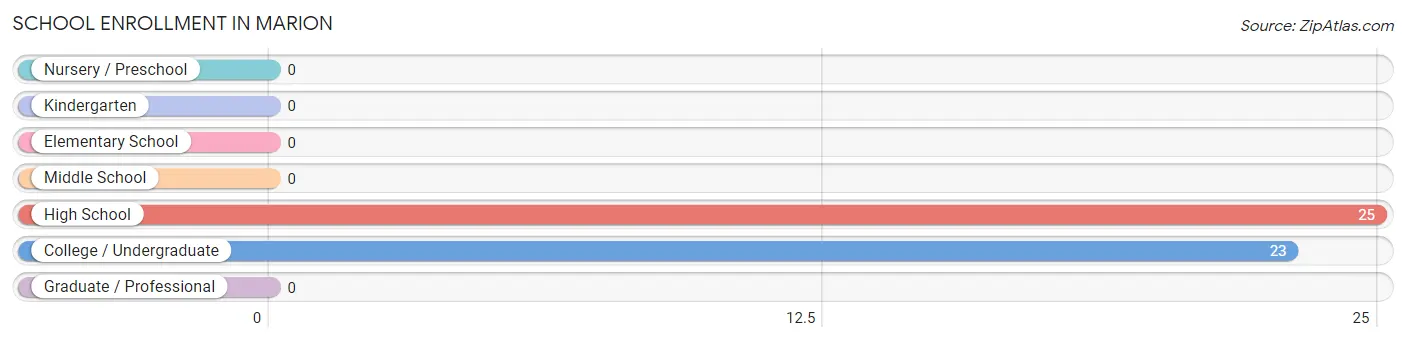
School Enrollment in Marion
The most common levels of schooling among the 48 students in Marion are high school (25 | 52.1%), and college / undergraduate (23 | 47.9%).
| School Level | # Students | % Students |
| Nursery / Preschool | 0 | 0.0% |
| Kindergarten | 0 | 0.0% |
| Elementary School | 0 | 0.0% |
| Middle School | 0 | 0.0% |
| High School | 25 | 52.1% |
| College / Undergraduate | 23 | 47.9% |
| Graduate / Professional | 0 | 0.0% |
| Total | 48 | 100.0% |
School Enrollment by Age by Funding Source in Marion
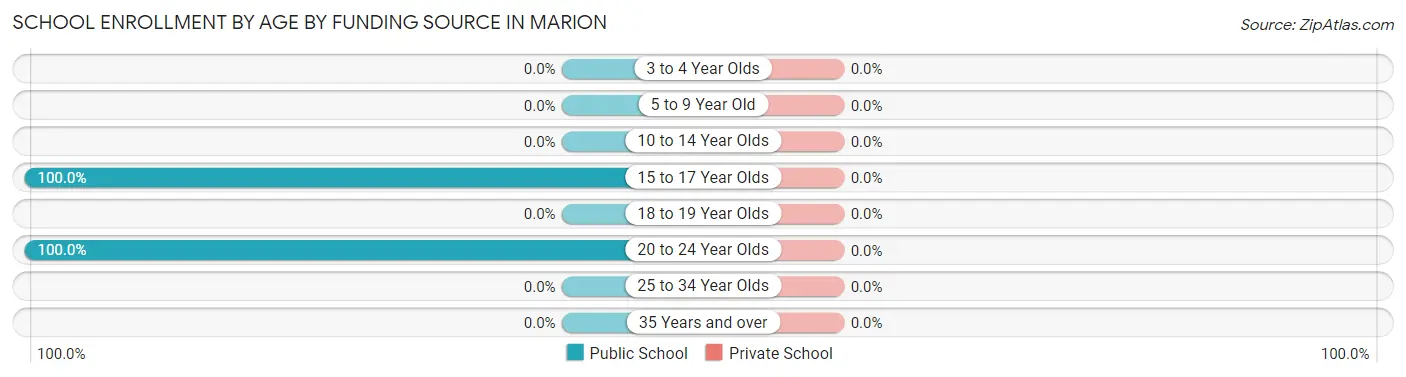
| Age Bracket | Public School | Private School |
| 3 to 4 Year Olds | 0 (0.0%) | 0 (0.0%) |
| 5 to 9 Year Old | 0 (0.0%) | 0 (0.0%) |
| 10 to 14 Year Olds | 0 (0.0%) | 0 (0.0%) |
| 15 to 17 Year Olds | 25 (100.0%) | 0 (0.0%) |
| 18 to 19 Year Olds | 0 (0.0%) | 0 (0.0%) |
| 20 to 24 Year Olds | 23 (100.0%) | 0 (0.0%) |
| 25 to 34 Year Olds | 0 (0.0%) | 0 (0.0%) |
| 35 Years and over | 0 (0.0%) | 0 (0.0%) |
| Total | 48 (100.0%) | 0 (0.0%) |
Educational Attainment by Field of Study in Marion
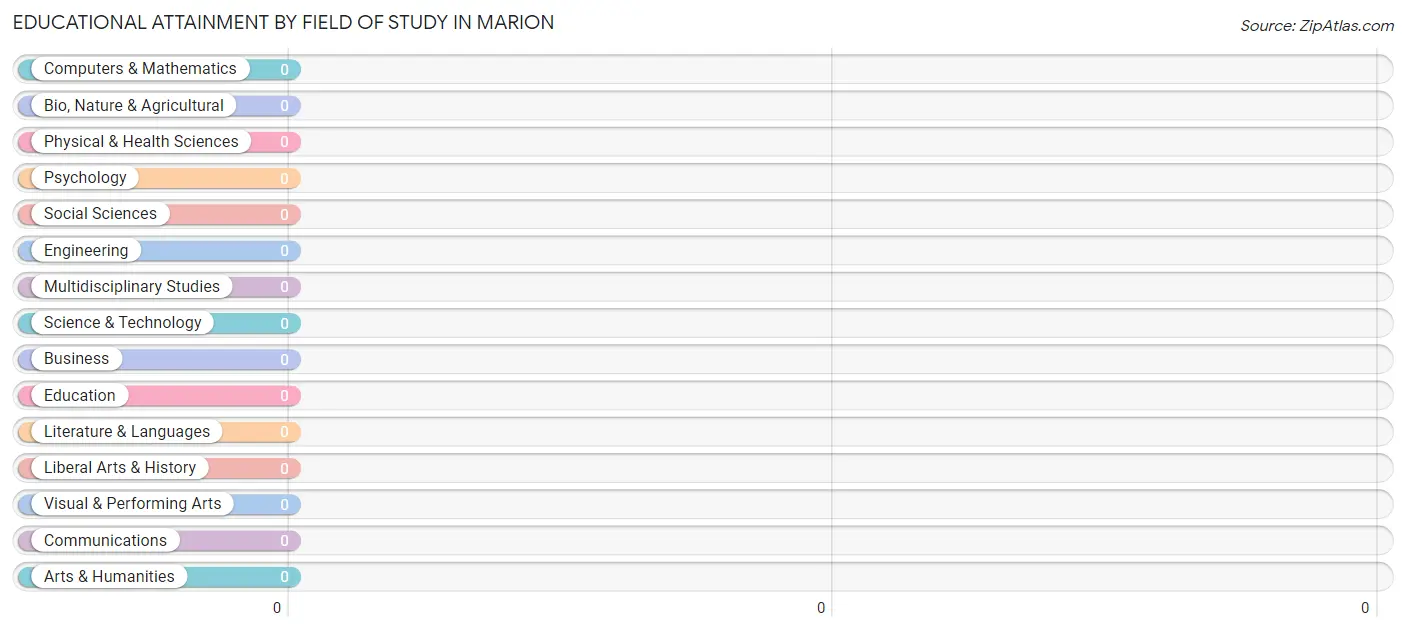
| Field of Study | # Graduates | % Graduates |
| Computers & Mathematics | 0 | 0.0% |
| Bio, Nature & Agricultural | 0 | 0.0% |
| Physical & Health Sciences | 0 | 0.0% |
| Psychology | 0 | 0.0% |
| Social Sciences | 0 | 0.0% |
| Engineering | 0 | 0.0% |
| Multidisciplinary Studies | 0 | 0.0% |
| Science & Technology | 0 | 0.0% |
| Business | 0 | 0.0% |
| Education | 0 | 0.0% |
| Literature & Languages | 0 | 0.0% |
| Liberal Arts & History | 0 | 0.0% |
| Visual & Performing Arts | 0 | 0.0% |
| Communications | 0 | 0.0% |
| Arts & Humanities | 0 | 0.0% |
| Total | 0 | 0.0% |
Transportation & Commute in Marion
Vehicle Availability by Sex in Marion
The most prevalent vehicle ownership categories in Marion are males with 4 vehicles (31, accounting for 46.3%) and females with 4 vehicles (0, making up 33.0%).
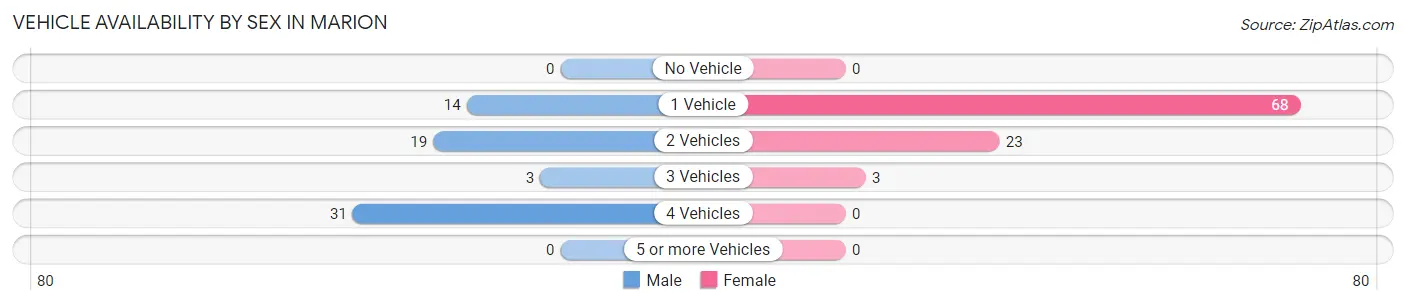
| Vehicles Available | Male | Female |
| No Vehicle | 0 (0.0%) | 0 (0.0%) |
| 1 Vehicle | 14 (20.9%) | 68 (72.3%) |
| 2 Vehicles | 19 (28.4%) | 23 (24.5%) |
| 3 Vehicles | 3 (4.5%) | 3 (3.2%) |
| 4 Vehicles | 31 (46.3%) | 0 (0.0%) |
| 5 or more Vehicles | 0 (0.0%) | 0 (0.0%) |
| Total | 67 (100.0%) | 94 (100.0%) |
Commute Time in Marion
The most frequently occuring commute durations in Marion are 10 to 14 minutes (60 commuters, 41.7%), 45 to 59 minutes (34 commuters, 23.6%), and less than 5 minutes (19 commuters, 13.2%).
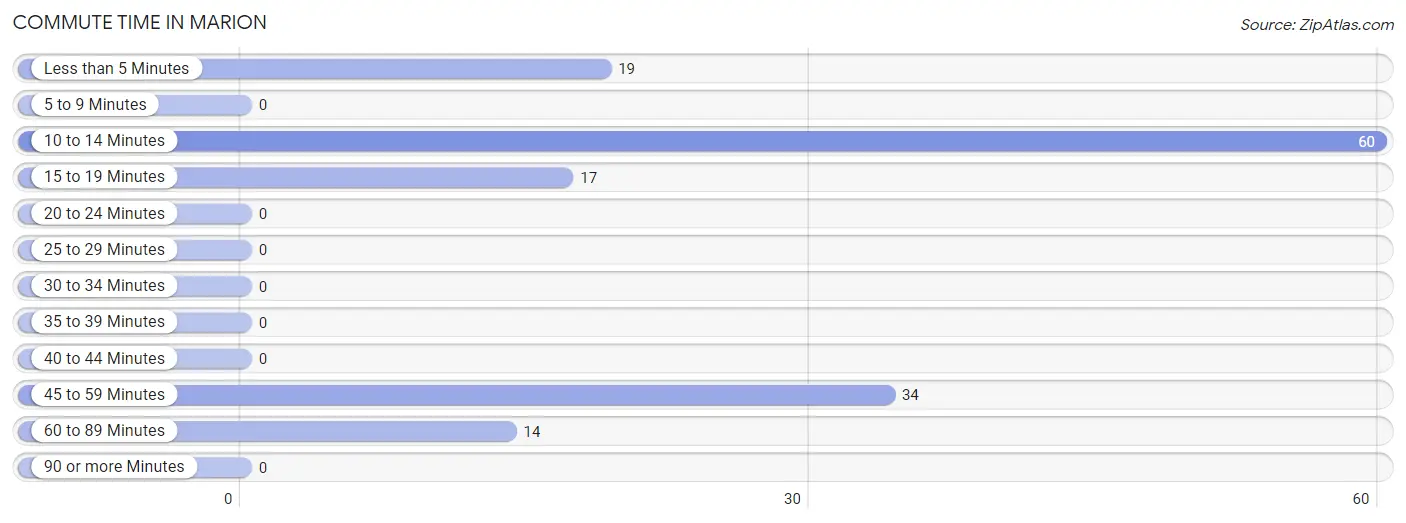
| Commute Time | # Commuters | % Commuters |
| Less than 5 Minutes | 19 | 13.2% |
| 5 to 9 Minutes | 0 | 0.0% |
| 10 to 14 Minutes | 60 | 41.7% |
| 15 to 19 Minutes | 17 | 11.8% |
| 20 to 24 Minutes | 0 | 0.0% |
| 25 to 29 Minutes | 0 | 0.0% |
| 30 to 34 Minutes | 0 | 0.0% |
| 35 to 39 Minutes | 0 | 0.0% |
| 40 to 44 Minutes | 0 | 0.0% |
| 45 to 59 Minutes | 34 | 23.6% |
| 60 to 89 Minutes | 14 | 9.7% |
| 90 or more Minutes | 0 | 0.0% |
Commute Time by Sex in Marion
The most common commute times in Marion are less than 5 minutes (19 commuters, 38.0%) for males and 10 to 14 minutes (60 commuters, 63.8%) for females.
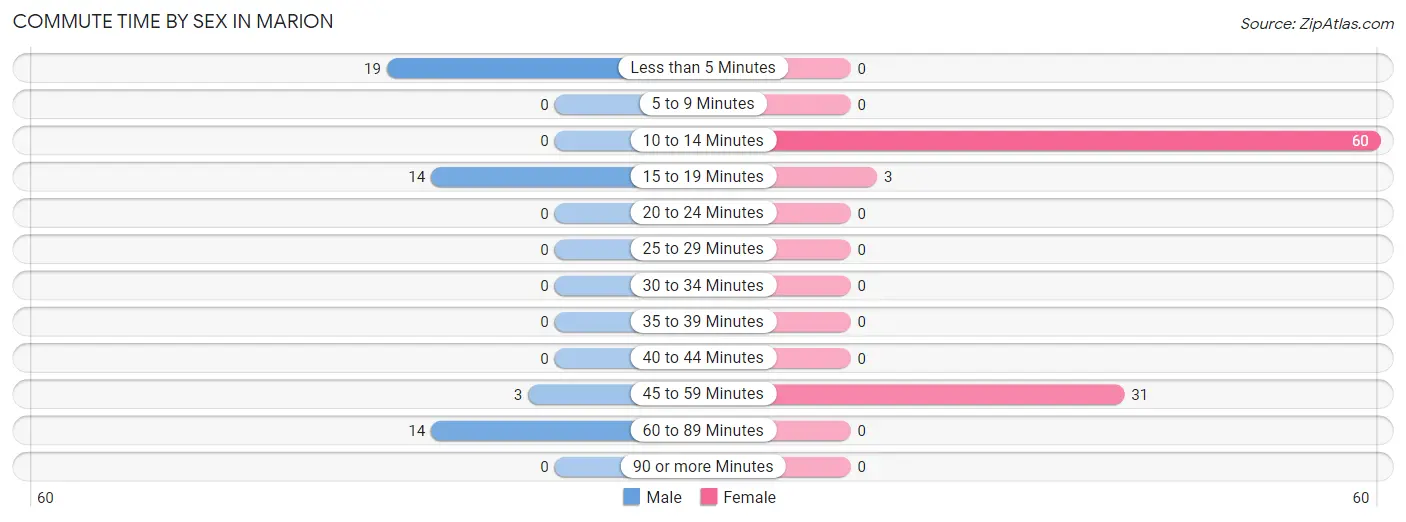
| Commute Time | Male | Female |
| Less than 5 Minutes | 19 (38.0%) | 0 (0.0%) |
| 5 to 9 Minutes | 0 (0.0%) | 0 (0.0%) |
| 10 to 14 Minutes | 0 (0.0%) | 60 (63.8%) |
| 15 to 19 Minutes | 14 (28.0%) | 3 (3.2%) |
| 20 to 24 Minutes | 0 (0.0%) | 0 (0.0%) |
| 25 to 29 Minutes | 0 (0.0%) | 0 (0.0%) |
| 30 to 34 Minutes | 0 (0.0%) | 0 (0.0%) |
| 35 to 39 Minutes | 0 (0.0%) | 0 (0.0%) |
| 40 to 44 Minutes | 0 (0.0%) | 0 (0.0%) |
| 45 to 59 Minutes | 3 (6.0%) | 31 (33.0%) |
| 60 to 89 Minutes | 14 (28.0%) | 0 (0.0%) |
| 90 or more Minutes | 0 (0.0%) | 0 (0.0%) |
Time of Departure to Work by Sex in Marion
The most frequent times of departure to work in Marion are 5:00 AM to 5:29 AM (19, 38.0%) for males and 4:00 PM to 11:59 PM (37, 39.4%) for females.
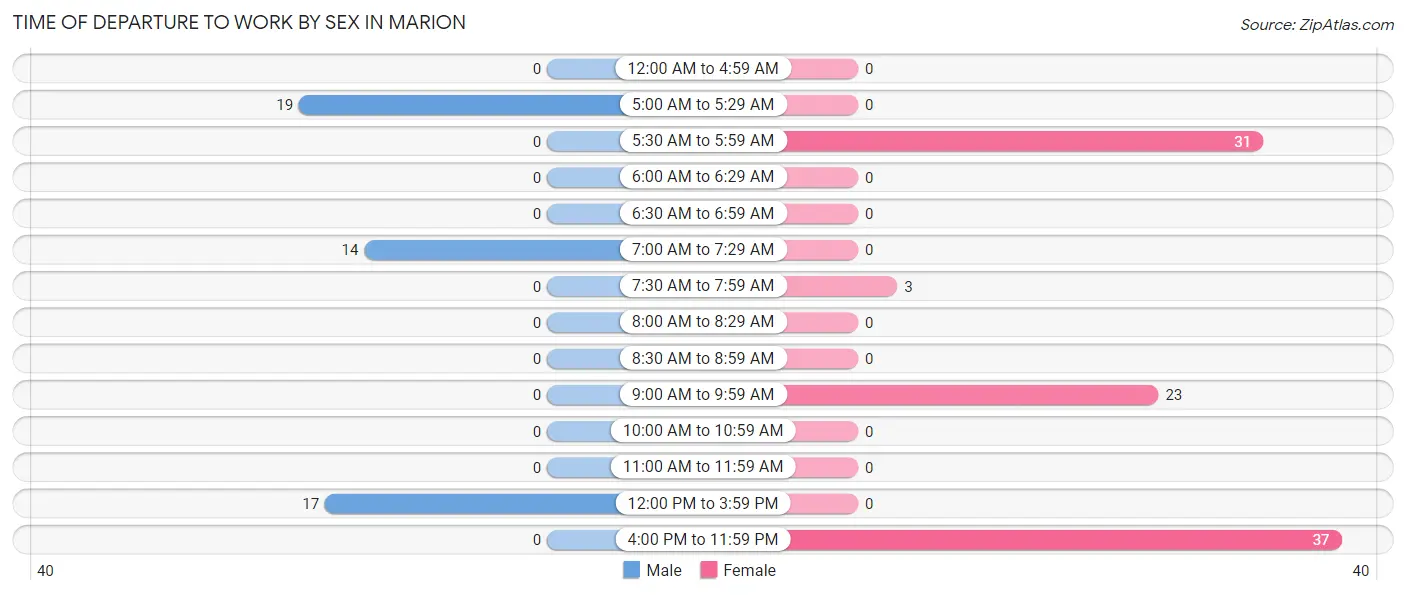
| Time of Departure | Male | Female |
| 12:00 AM to 4:59 AM | 0 (0.0%) | 0 (0.0%) |
| 5:00 AM to 5:29 AM | 19 (38.0%) | 0 (0.0%) |
| 5:30 AM to 5:59 AM | 0 (0.0%) | 31 (33.0%) |
| 6:00 AM to 6:29 AM | 0 (0.0%) | 0 (0.0%) |
| 6:30 AM to 6:59 AM | 0 (0.0%) | 0 (0.0%) |
| 7:00 AM to 7:29 AM | 14 (28.0%) | 0 (0.0%) |
| 7:30 AM to 7:59 AM | 0 (0.0%) | 3 (3.2%) |
| 8:00 AM to 8:29 AM | 0 (0.0%) | 0 (0.0%) |
| 8:30 AM to 8:59 AM | 0 (0.0%) | 0 (0.0%) |
| 9:00 AM to 9:59 AM | 0 (0.0%) | 23 (24.5%) |
| 10:00 AM to 10:59 AM | 0 (0.0%) | 0 (0.0%) |
| 11:00 AM to 11:59 AM | 0 (0.0%) | 0 (0.0%) |
| 12:00 PM to 3:59 PM | 17 (34.0%) | 0 (0.0%) |
| 4:00 PM to 11:59 PM | 0 (0.0%) | 37 (39.4%) |
| Total | 50 (100.0%) | 94 (100.0%) |
Housing Occupancy in Marion
Occupancy by Ownership in Marion
Of the total 10,855 dwellings in Marion, owner-occupied units account for 6,391 (58.9%), while renter-occupied units make up 4,464 (41.1%).
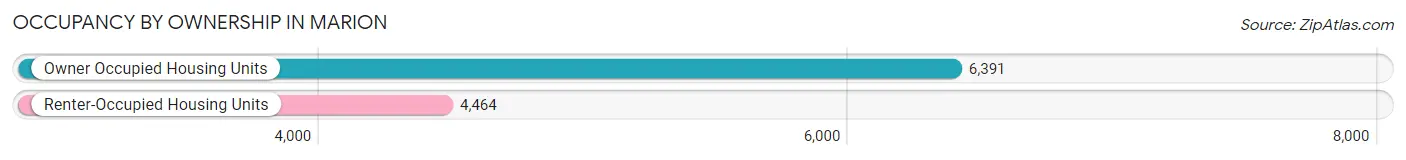
| Occupancy | # Housing Units | % Housing Units |
| Owner Occupied Housing Units | 6,391 | 58.9% |
| Renter-Occupied Housing Units | 4,464 | 41.1% |
| Total Occupied Housing Units | 10,855 | 100.0% |
Occupancy by Household Size in Marion
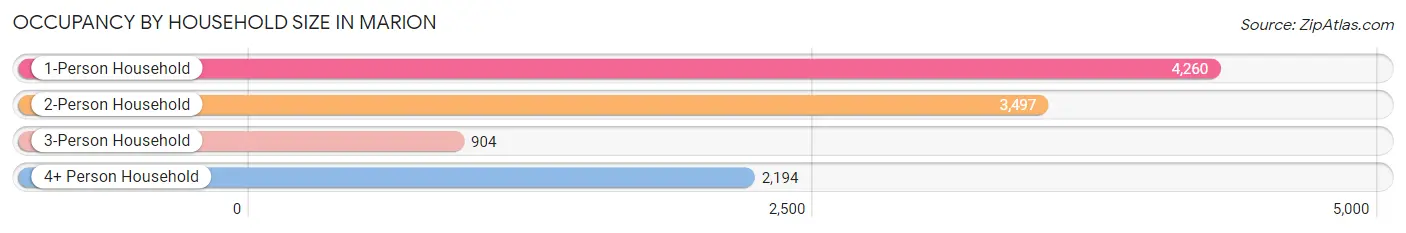
| Household Size | # Housing Units | % Housing Units |
| 1-Person Household | 4,260 | 39.2% |
| 2-Person Household | 3,497 | 32.2% |
| 3-Person Household | 904 | 8.3% |
| 4+ Person Household | 2,194 | 20.2% |
| Total Housing Units | 10,855 | 100.0% |
Occupancy by Ownership by Household Size in Marion
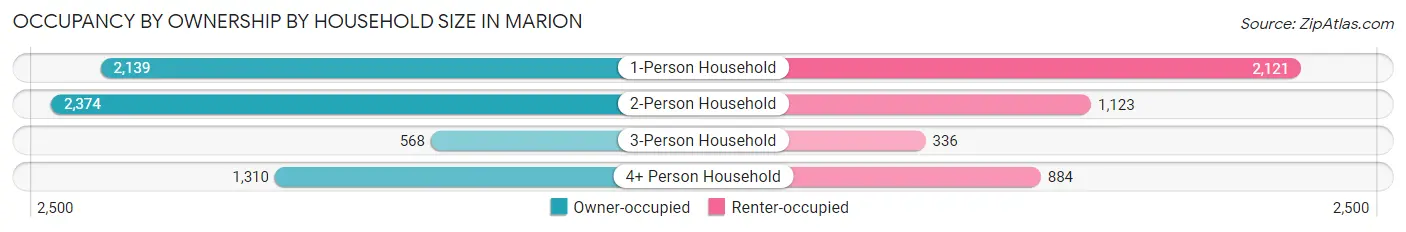
| Household Size | Owner-occupied | Renter-occupied |
| 1-Person Household | 2,139 (50.2%) | 2,121 (49.8%) |
| 2-Person Household | 2,374 (67.9%) | 1,123 (32.1%) |
| 3-Person Household | 568 (62.8%) | 336 (37.2%) |
| 4+ Person Household | 1,310 (59.7%) | 884 (40.3%) |
| Total Housing Units | 6,391 (58.9%) | 4,464 (41.1%) |
Occupancy by Educational Attainment in Marion
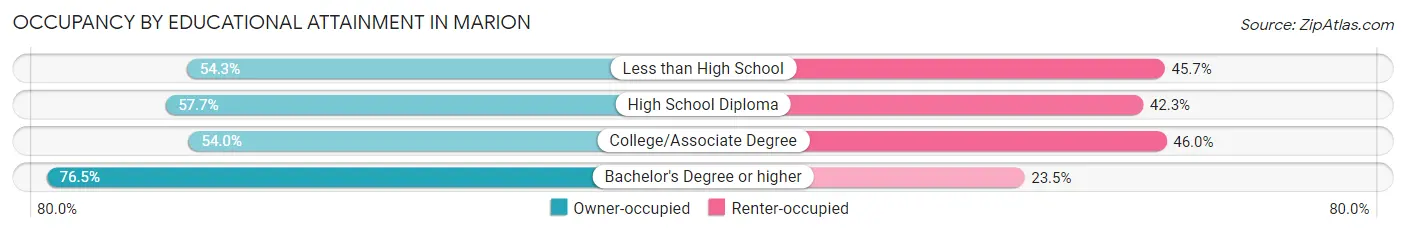
| Household Size | Owner-occupied | Renter-occupied |
| Less than High School | 841 (54.3%) | 709 (45.7%) |
| High School Diploma | 2,337 (57.7%) | 1,714 (42.3%) |
| College/Associate Degree | 1,934 (54.0%) | 1,648 (46.0%) |
| Bachelor's Degree or higher | 1,279 (76.5%) | 393 (23.5%) |
Occupancy by Age of Householder in Marion
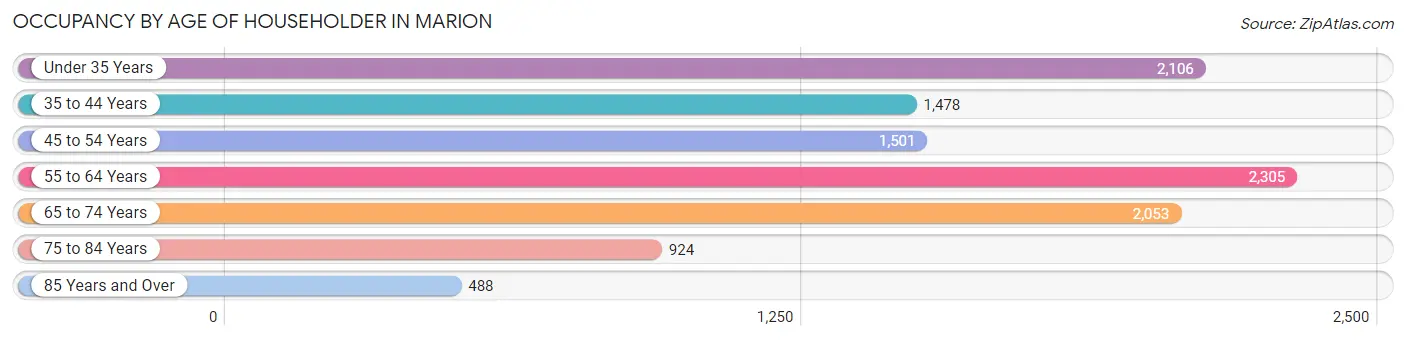
| Age Bracket | # Households | % Households |
| Under 35 Years | 2,106 | 19.4% |
| 35 to 44 Years | 1,478 | 13.6% |
| 45 to 54 Years | 1,501 | 13.8% |
| 55 to 64 Years | 2,305 | 21.2% |
| 65 to 74 Years | 2,053 | 18.9% |
| 75 to 84 Years | 924 | 8.5% |
| 85 Years and Over | 488 | 4.5% |
| Total | 10,855 | 100.0% |
Housing Finances in Marion
Median Income by Occupancy in Marion
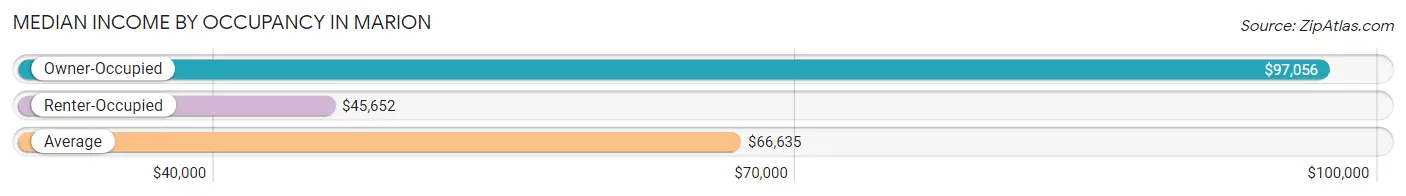
| Occupancy Type | # Households | Median Income |
| Owner-Occupied | 51 (46.0%) | $97,056 |
| Renter-Occupied | 60 (54.0%) | $45,652 |
| Average | 111 (100.0%) | $66,635 |
Occupancy by Householder Income Bracket in Marion
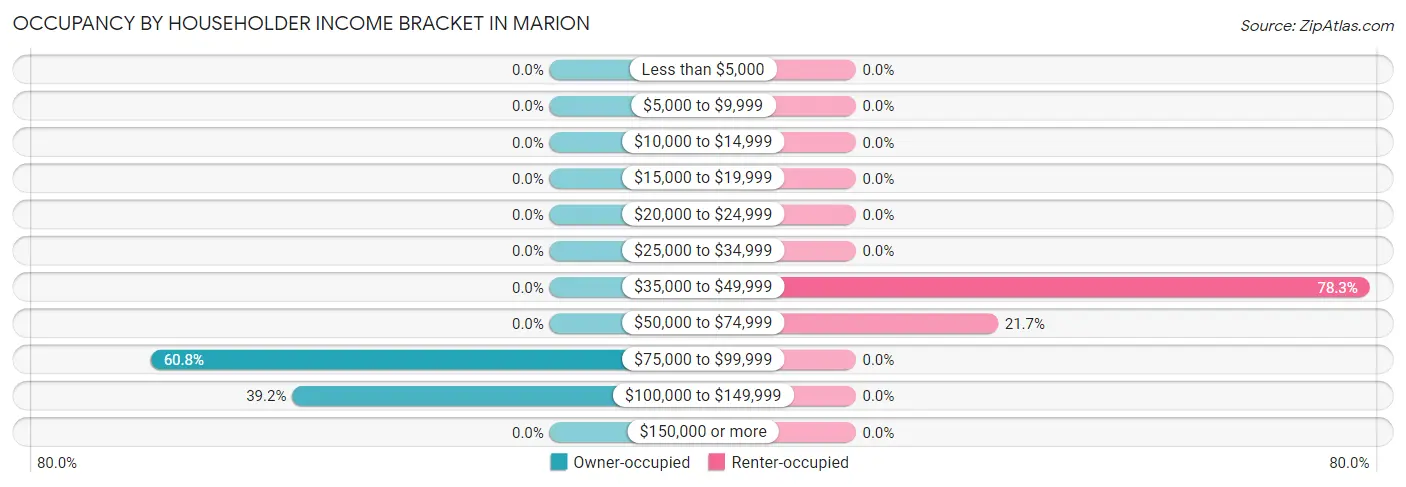
| Income Bracket | Owner-occupied | Renter-occupied |
| Less than $5,000 | 0 (0.0%) | 0 (0.0%) |
| $5,000 to $9,999 | 0 (0.0%) | 0 (0.0%) |
| $10,000 to $14,999 | 0 (0.0%) | 0 (0.0%) |
| $15,000 to $19,999 | 0 (0.0%) | 0 (0.0%) |
| $20,000 to $24,999 | 0 (0.0%) | 0 (0.0%) |
| $25,000 to $34,999 | 0 (0.0%) | 0 (0.0%) |
| $35,000 to $49,999 | 0 (0.0%) | 47 (78.3%) |
| $50,000 to $74,999 | 0 (0.0%) | 13 (21.7%) |
| $75,000 to $99,999 | 31 (60.8%) | 0 (0.0%) |
| $100,000 to $149,999 | 20 (39.2%) | 0 (0.0%) |
| $150,000 or more | 0 (0.0%) | 0 (0.0%) |
| Total | 51 (100.0%) | 60 (100.0%) |
Monthly Housing Cost Tiers in Marion
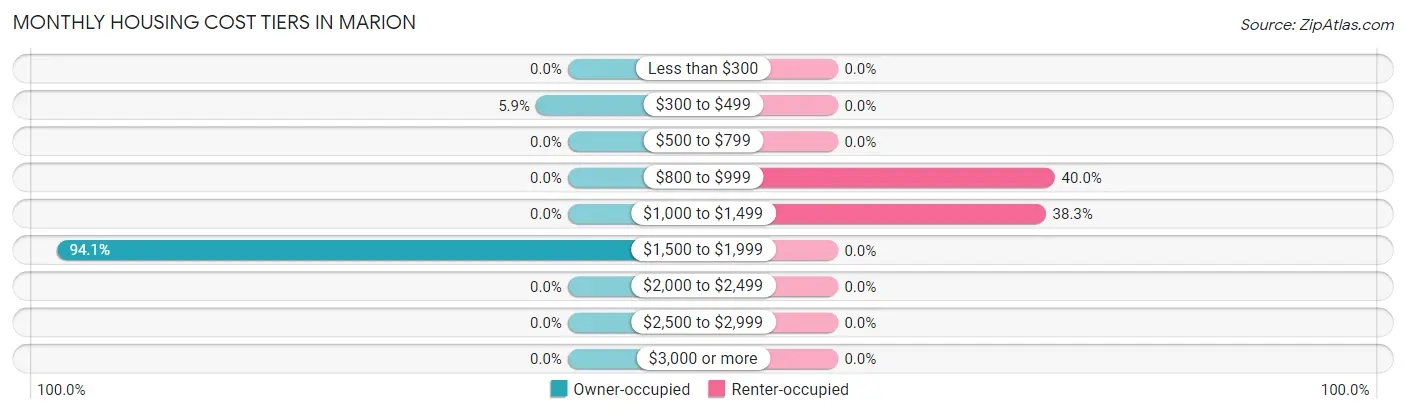
| Monthly Cost | Owner-occupied | Renter-occupied |
| Less than $300 | 0 (0.0%) | 0 (0.0%) |
| $300 to $499 | 3 (5.9%) | 0 (0.0%) |
| $500 to $799 | 0 (0.0%) | 0 (0.0%) |
| $800 to $999 | 0 (0.0%) | 24 (40.0%) |
| $1,000 to $1,499 | 0 (0.0%) | 23 (38.3%) |
| $1,500 to $1,999 | 48 (94.1%) | 0 (0.0%) |
| $2,000 to $2,499 | 0 (0.0%) | 0 (0.0%) |
| $2,500 to $2,999 | 0 (0.0%) | 0 (0.0%) |
| $3,000 or more | 0 (0.0%) | 0 (0.0%) |
| Total | 51 (100.0%) | 60 (100.0%) |
Physical Housing Characteristics in Marion
Housing Structures in Marion
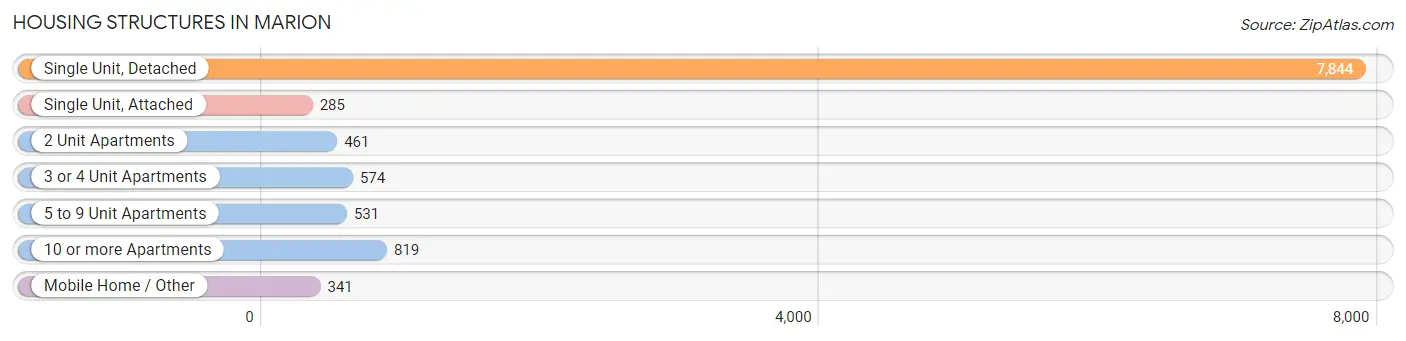
| Structure Type | # Housing Units | % Housing Units |
| Single Unit, Detached | 7,844 | 72.3% |
| Single Unit, Attached | 285 | 2.6% |
| 2 Unit Apartments | 461 | 4.3% |
| 3 or 4 Unit Apartments | 574 | 5.3% |
| 5 to 9 Unit Apartments | 531 | 4.9% |
| 10 or more Apartments | 819 | 7.5% |
| Mobile Home / Other | 341 | 3.1% |
| Total | 10,855 | 100.0% |
Housing Structures by Occupancy in Marion
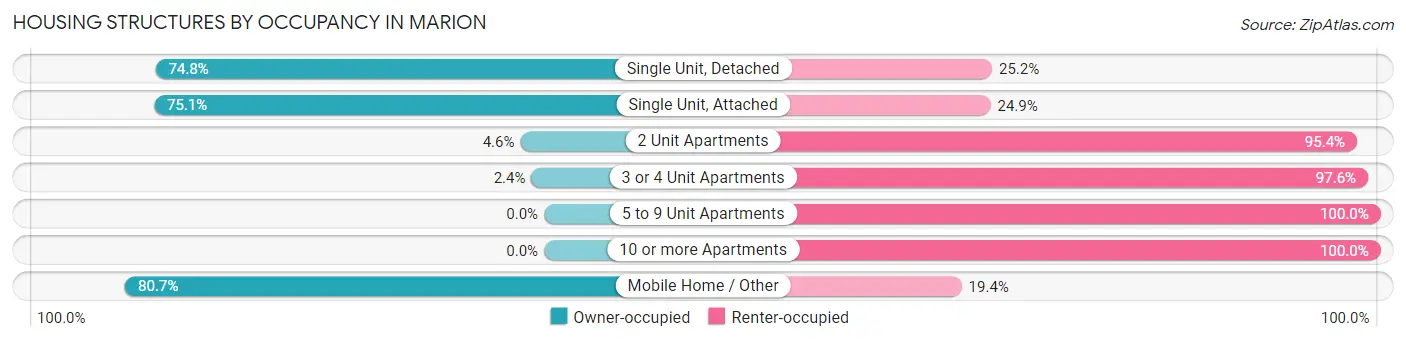
| Structure Type | Owner-occupied | Renter-occupied |
| Single Unit, Detached | 5,867 (74.8%) | 1,977 (25.2%) |
| Single Unit, Attached | 214 (75.1%) | 71 (24.9%) |
| 2 Unit Apartments | 21 (4.6%) | 440 (95.4%) |
| 3 or 4 Unit Apartments | 14 (2.4%) | 560 (97.6%) |
| 5 to 9 Unit Apartments | 0 (0.0%) | 531 (100.0%) |
| 10 or more Apartments | 0 (0.0%) | 819 (100.0%) |
| Mobile Home / Other | 275 (80.6%) | 66 (19.4%) |
| Total | 6,391 (58.9%) | 4,464 (41.1%) |
Housing Structures by Number of Rooms in Marion
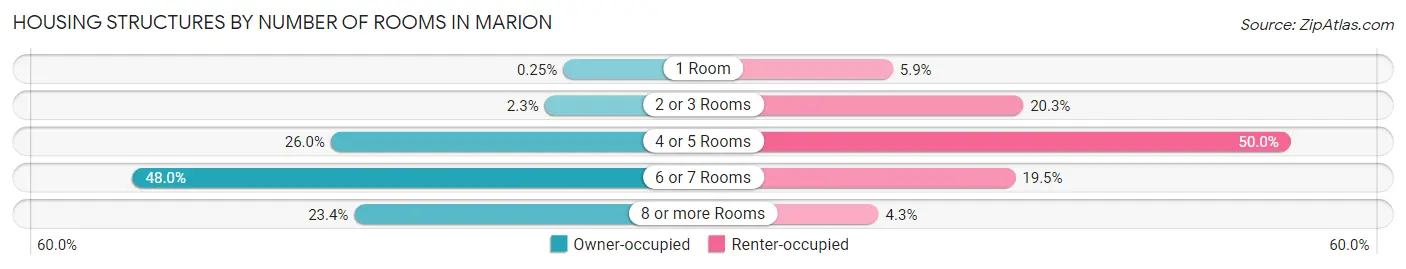
| Number of Rooms | Owner-occupied | Renter-occupied |
| 1 Room | 16 (0.3%) | 262 (5.9%) |
| 2 or 3 Rooms | 147 (2.3%) | 908 (20.3%) |
| 4 or 5 Rooms | 1,663 (26.0%) | 2,233 (50.0%) |
| 6 or 7 Rooms | 3,068 (48.0%) | 869 (19.5%) |
| 8 or more Rooms | 1,497 (23.4%) | 192 (4.3%) |
| Total | 6,391 (100.0%) | 4,464 (100.0%) |
Housing Structure by Heating Type in Marion
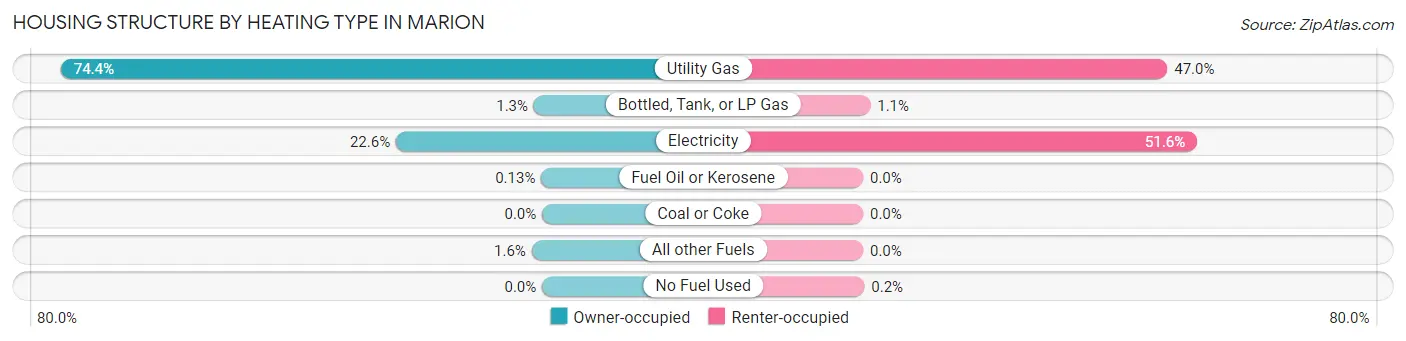
| Heating Type | Owner-occupied | Renter-occupied |
| Utility Gas | 4,755 (74.4%) | 2,100 (47.0%) |
| Bottled, Tank, or LP Gas | 81 (1.3%) | 50 (1.1%) |
| Electricity | 1,444 (22.6%) | 2,305 (51.6%) |
| Fuel Oil or Kerosene | 8 (0.1%) | 0 (0.0%) |
| Coal or Coke | 0 (0.0%) | 0 (0.0%) |
| All other Fuels | 103 (1.6%) | 0 (0.0%) |
| No Fuel Used | 0 (0.0%) | 9 (0.2%) |
| Total | 6,391 (100.0%) | 4,464 (100.0%) |
Household Vehicle Usage in Marion
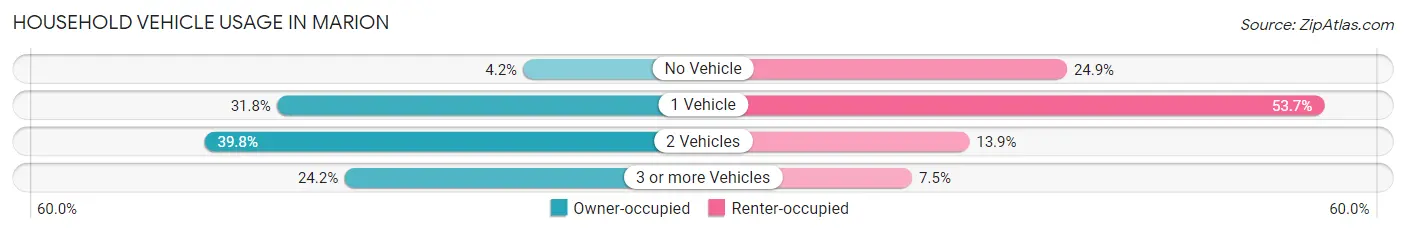
| Vehicles per Household | Owner-occupied | Renter-occupied |
| No Vehicle | 267 (4.2%) | 1,110 (24.9%) |
| 1 Vehicle | 2,030 (31.8%) | 2,396 (53.7%) |
| 2 Vehicles | 2,546 (39.8%) | 622 (13.9%) |
| 3 or more Vehicles | 1,548 (24.2%) | 336 (7.5%) |
| Total | 6,391 (100.0%) | 4,464 (100.0%) |
Real Estate & Mortgages in Marion
Real Estate and Mortgage Overview in Marion
| Characteristic | Without Mortgage | With Mortgage |
| Housing Units | 3,145 | 48 |
| Median Property Value | $71,800 | $0 |
| Median Household Income | $40,069 | $0 |
| Monthly Housing Costs | $368 | $0 |
| Real Estate Taxes | $582 | $0 |
Property Value by Mortgage Status in Marion
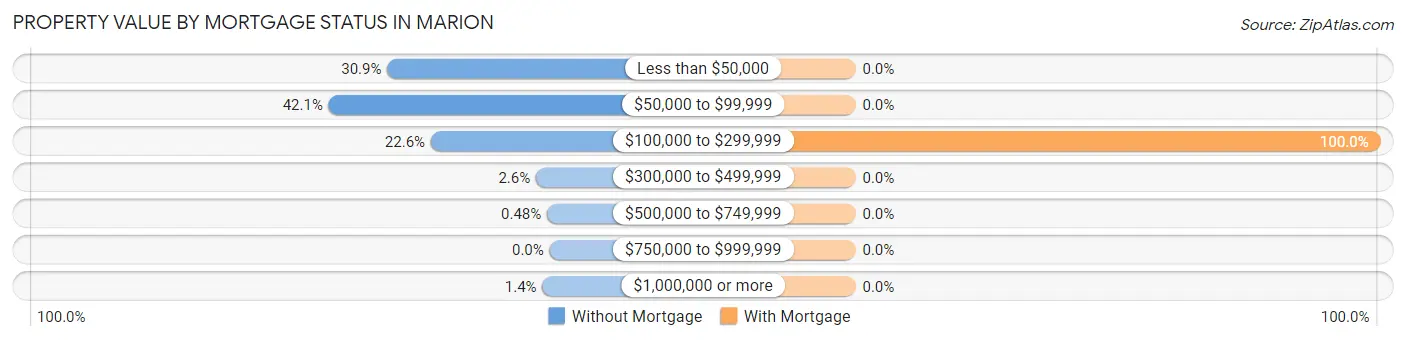
| Property Value | Without Mortgage | With Mortgage |
| Less than $50,000 | 972 (30.9%) | 0 (0.0%) |
| $50,000 to $99,999 | 1,323 (42.1%) | 0 (0.0%) |
| $100,000 to $299,999 | 711 (22.6%) | 48 (100.0%) |
| $300,000 to $499,999 | 81 (2.6%) | 0 (0.0%) |
| $500,000 to $749,999 | 15 (0.5%) | 0 (0.0%) |
| $750,000 to $999,999 | 0 (0.0%) | 0 (0.0%) |
| $1,000,000 or more | 43 (1.4%) | 0 (0.0%) |
| Total | 3,145 (100.0%) | 48 (100.0%) |
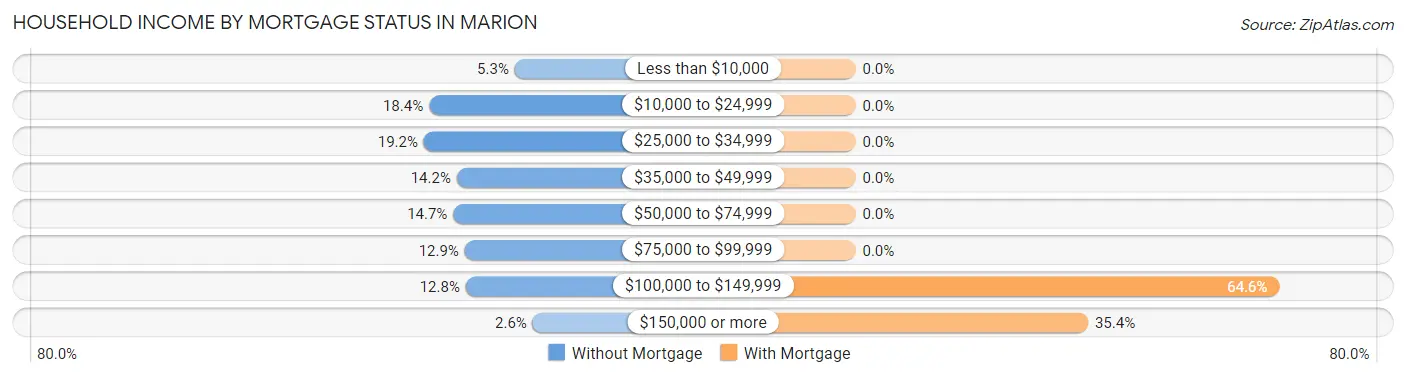
Household Income by Mortgage Status in Marion
| Household Income | Without Mortgage | With Mortgage |
| Less than $10,000 | 167 (5.3%) | 0 (0.0%) |
| $10,000 to $24,999 | 578 (18.4%) | 0 (0.0%) |
| $25,000 to $34,999 | 603 (19.2%) | 0 (0.0%) |
| $35,000 to $49,999 | 445 (14.1%) | 0 (0.0%) |
| $50,000 to $74,999 | 462 (14.7%) | 0 (0.0%) |
| $75,000 to $99,999 | 407 (12.9%) | 0 (0.0%) |
| $100,000 to $149,999 | 402 (12.8%) | 31 (64.6%) |
| $150,000 or more | 81 (2.6%) | 17 (35.4%) |
| Total | 3,145 (100.0%) | 48 (100.0%) |
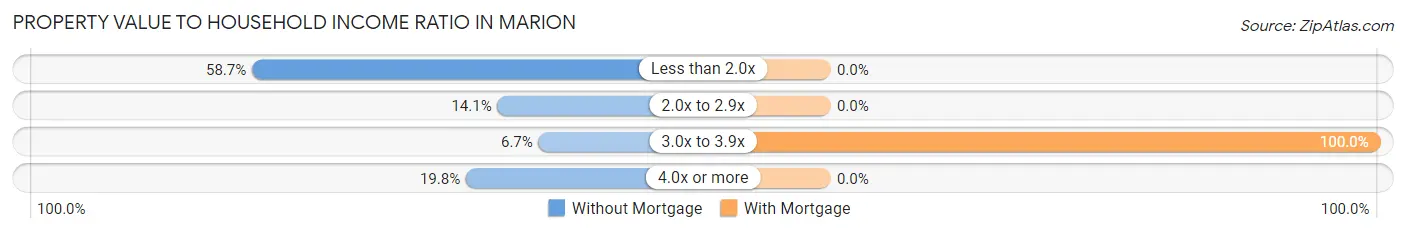
Property Value to Household Income Ratio in Marion
| Value-to-Income Ratio | Without Mortgage | With Mortgage |
| Less than 2.0x | 1,846 (58.7%) | 0 (0.0%) |
| 2.0x to 2.9x | 444 (14.1%) | 0 (0.0%) |
| 3.0x to 3.9x | 209 (6.7%) | 48 (100.0%) |
| 4.0x or more | 624 (19.8%) | 0 (0.0%) |
| Total | 3,145 (100.0%) | 48 (100.0%) |
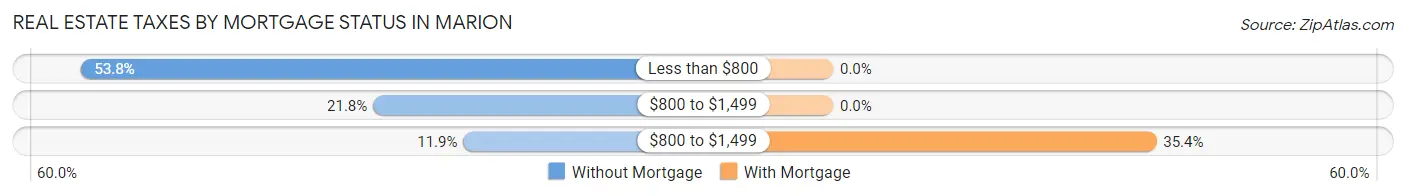
Real Estate Taxes by Mortgage Status in Marion
| Property Taxes | Without Mortgage | With Mortgage |
| Less than $800 | 1,691 (53.8%) | 0 (0.0%) |
| $800 to $1,499 | 686 (21.8%) | 0 (0.0%) |
| $800 to $1,499 | 375 (11.9%) | 17 (35.4%) |
| Total | 3,145 (100.0%) | 48 (100.0%) |
Health & Disability in Marion
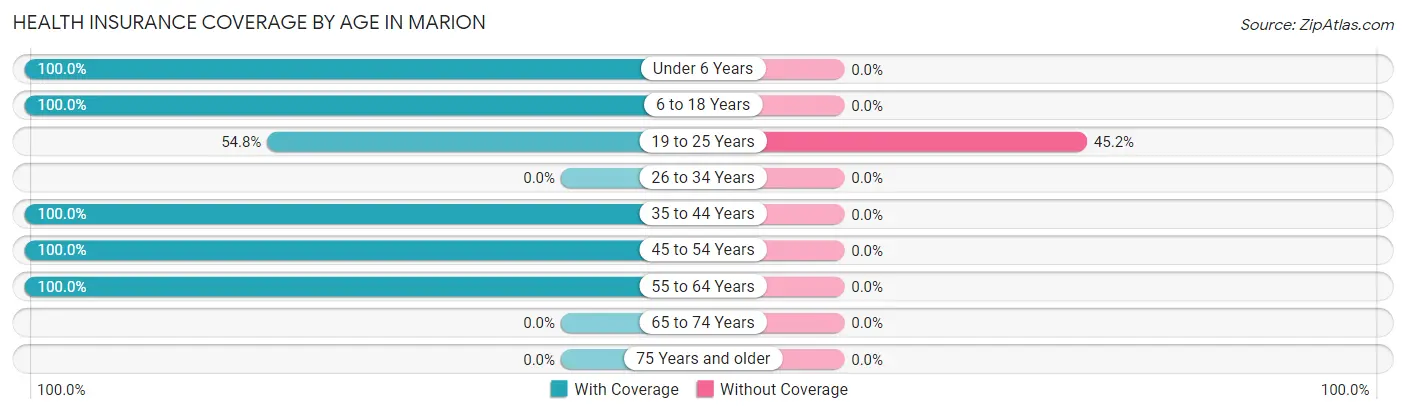
Health Insurance Coverage by Age in Marion
| Age Bracket | With Coverage | Without Coverage |
| Under 6 Years | 22 (100.0%) | 0 (0.0%) |
| 6 to 18 Years | 25 (100.0%) | 0 (0.0%) |
| 19 to 25 Years | 23 (54.8%) | 19 (45.2%) |
| 26 to 34 Years | 0 (0.0%) | 0 (0.0%) |
| 35 to 44 Years | 30 (100.0%) | 0 (0.0%) |
| 45 to 54 Years | 30 (100.0%) | 0 (0.0%) |
| 55 to 64 Years | 58 (100.0%) | 0 (0.0%) |
| 65 to 74 Years | 0 (0.0%) | 0 (0.0%) |
| 75 Years and older | 0 (0.0%) | 0 (0.0%) |
| Total | 188 (90.8%) | 19 (9.2%) |
Health Insurance Coverage by Citizenship Status in Marion
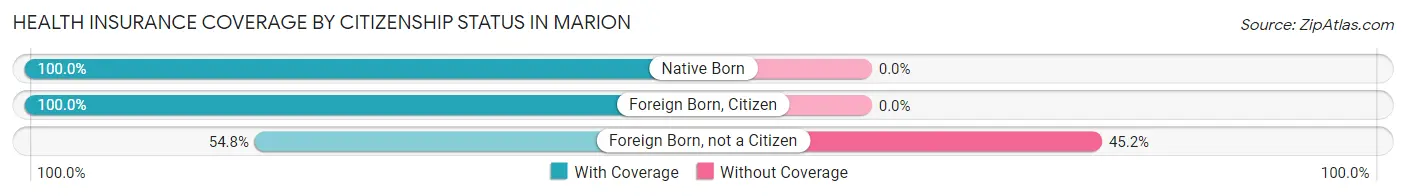
| Citizenship Status | With Coverage | Without Coverage |
| Native Born | 22 (100.0%) | 0 (0.0%) |
| Foreign Born, Citizen | 25 (100.0%) | 0 (0.0%) |
| Foreign Born, not a Citizen | 23 (54.8%) | 19 (45.2%) |
Health Insurance Coverage by Household Income in Marion
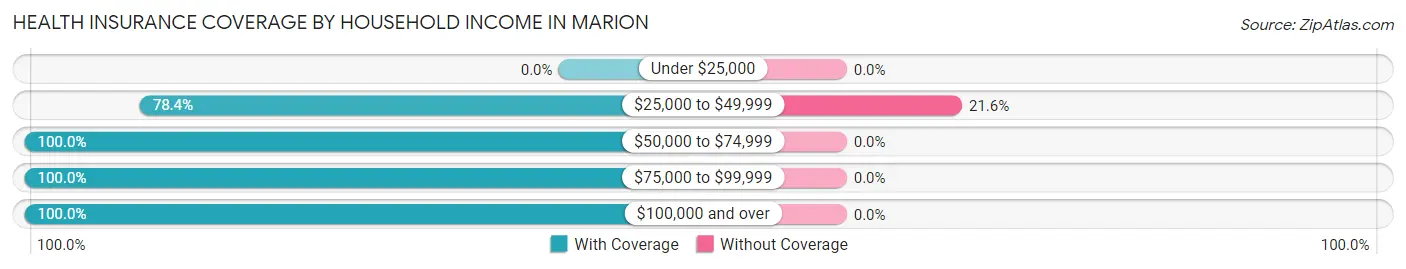
| Household Income | With Coverage | Without Coverage |
| Under $25,000 | 0 (0.0%) | 0 (0.0%) |
| $25,000 to $49,999 | 69 (78.4%) | 19 (21.6%) |
| $50,000 to $74,999 | 38 (100.0%) | 0 (0.0%) |
| $75,000 to $99,999 | 31 (100.0%) | 0 (0.0%) |
| $100,000 and over | 50 (100.0%) | 0 (0.0%) |
Public vs Private Health Insurance Coverage by Age in Marion
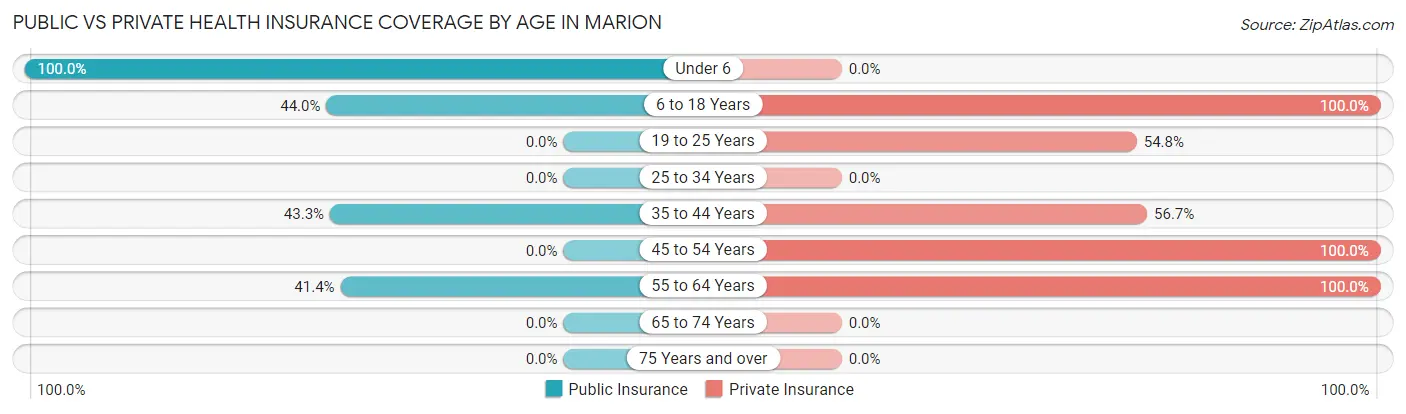
| Age Bracket | Public Insurance | Private Insurance |
| Under 6 | 22 (100.0%) | 0 (0.0%) |
| 6 to 18 Years | 11 (44.0%) | 25 (100.0%) |
| 19 to 25 Years | 0 (0.0%) | 23 (54.8%) |
| 25 to 34 Years | 0 (0.0%) | 0 (0.0%) |
| 35 to 44 Years | 13 (43.3%) | 17 (56.7%) |
| 45 to 54 Years | 0 (0.0%) | 30 (100.0%) |
| 55 to 64 Years | 24 (41.4%) | 58 (100.0%) |
| 65 to 74 Years | 0 (0.0%) | 0 (0.0%) |
| 75 Years and over | 0 (0.0%) | 0 (0.0%) |
| Total | 70 (33.8%) | 153 (73.9%) |
Disability Status by Sex by Age in Marion
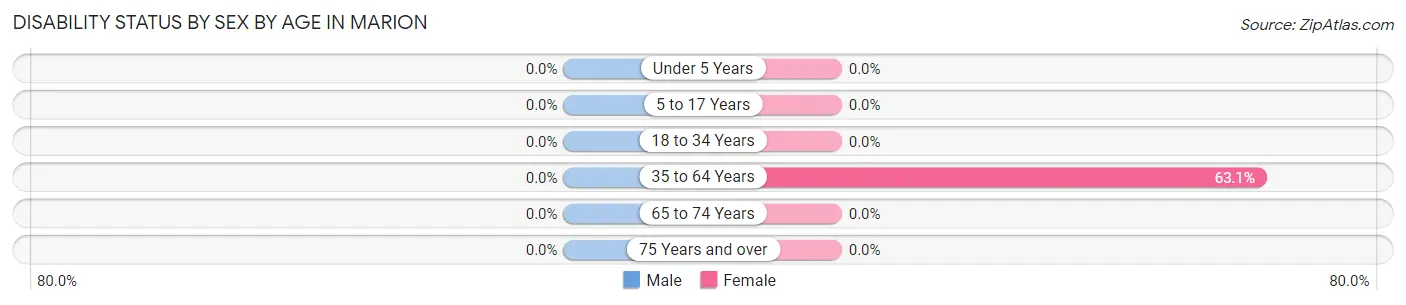
| Age Bracket | Male | Female |
| Under 5 Years | 0 (0.0%) | 0 (0.0%) |
| 5 to 17 Years | 0 (0.0%) | 0 (0.0%) |
| 18 to 34 Years | 0 (0.0%) | 0 (0.0%) |
| 35 to 64 Years | 0 (0.0%) | 53 (63.1%) |
| 65 to 74 Years | 0 (0.0%) | 0 (0.0%) |
| 75 Years and over | 0 (0.0%) | 0 (0.0%) |
Disability Class by Sex by Age in Marion
Disability Class: Hearing Difficulty
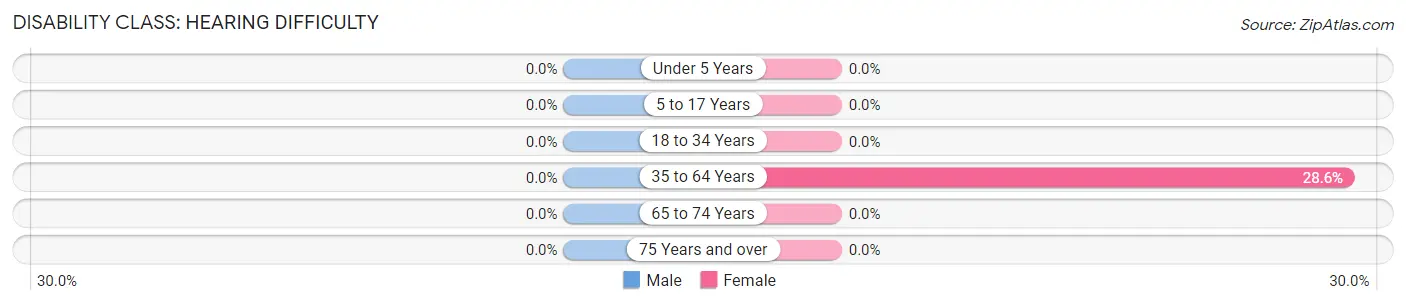
| Age Bracket | Male | Female |
| Under 5 Years | 0 (0.0%) | 0 (0.0%) |
| 5 to 17 Years | 0 (0.0%) | 0 (0.0%) |
| 18 to 34 Years | 0 (0.0%) | 0 (0.0%) |
| 35 to 64 Years | 0 (0.0%) | 24 (28.6%) |
| 65 to 74 Years | 0 (0.0%) | 0 (0.0%) |
| 75 Years and over | 0 (0.0%) | 0 (0.0%) |
Disability Class: Vision Difficulty

| Age Bracket | Male | Female |
| Under 5 Years | 0 (0.0%) | 0 (0.0%) |
| 5 to 17 Years | 0 (0.0%) | 0 (0.0%) |
| 18 to 34 Years | 0 (0.0%) | 0 (0.0%) |
| 35 to 64 Years | 0 (0.0%) | 16 (19.1%) |
| 65 to 74 Years | 0 (0.0%) | 0 (0.0%) |
| 75 Years and over | 0 (0.0%) | 0 (0.0%) |
Disability Class: Cognitive Difficulty
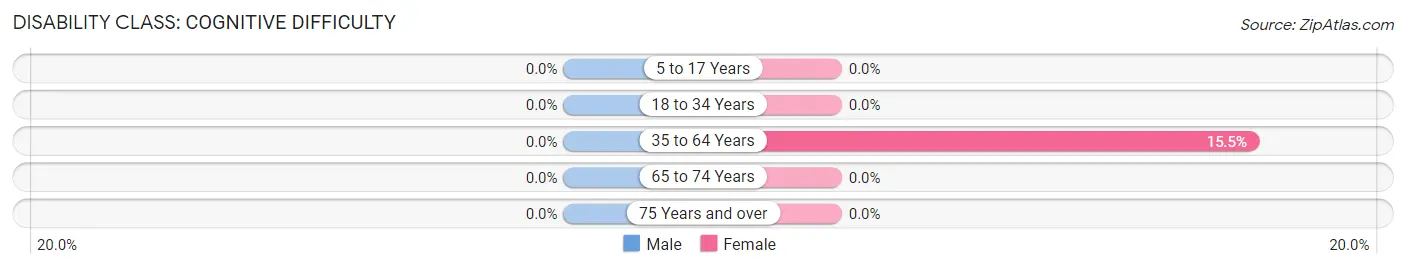
| Age Bracket | Male | Female |
| 5 to 17 Years | 0 (0.0%) | 0 (0.0%) |
| 18 to 34 Years | 0 (0.0%) | 0 (0.0%) |
| 35 to 64 Years | 0 (0.0%) | 13 (15.5%) |
| 65 to 74 Years | 0 (0.0%) | 0 (0.0%) |
| 75 Years and over | 0 (0.0%) | 0 (0.0%) |
Disability Class: Ambulatory Difficulty
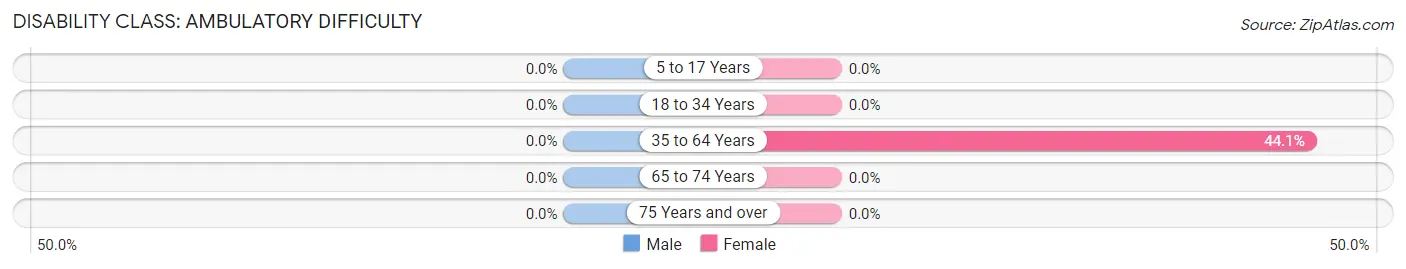
| Age Bracket | Male | Female |
| 5 to 17 Years | 0 (0.0%) | 0 (0.0%) |
| 18 to 34 Years | 0 (0.0%) | 0 (0.0%) |
| 35 to 64 Years | 0 (0.0%) | 37 (44.1%) |
| 65 to 74 Years | 0 (0.0%) | 0 (0.0%) |
| 75 Years and over | 0 (0.0%) | 0 (0.0%) |
Disability Class: Self-Care Difficulty
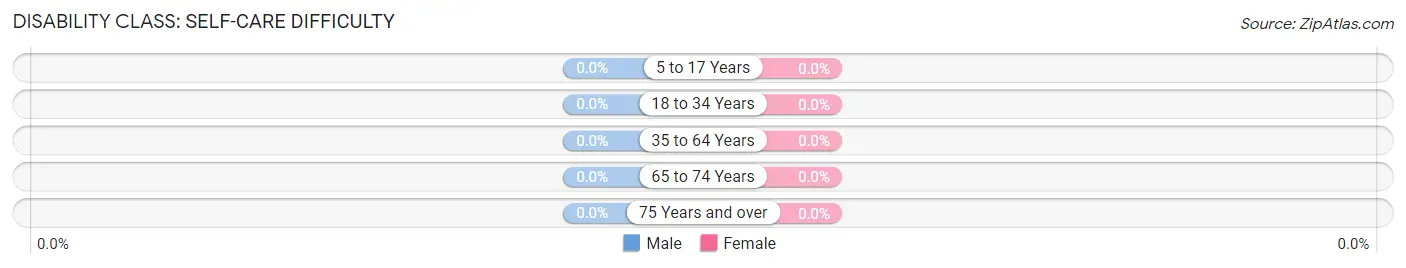
| Age Bracket | Male | Female |
| 5 to 17 Years | 0 (0.0%) | 0 (0.0%) |
| 18 to 34 Years | 0 (0.0%) | 0 (0.0%) |
| 35 to 64 Years | 0 (0.0%) | 0 (0.0%) |
| 65 to 74 Years | 0 (0.0%) | 0 (0.0%) |
| 75 Years and over | 0 (0.0%) | 0 (0.0%) |
Technology Access in Marion
Computing Device Access in Marion
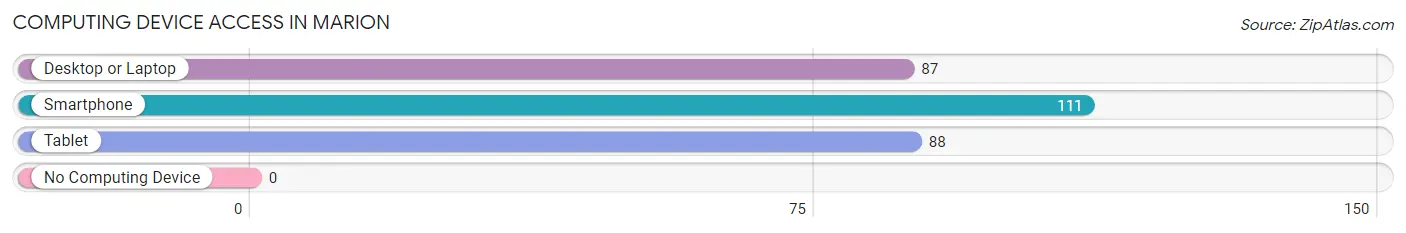
| Device Type | # Households | % Households |
| Desktop or Laptop | 87 | 78.4% |
| Smartphone | 111 | 100.0% |
| Tablet | 88 | 79.3% |
| No Computing Device | 0 | 0.0% |
| Total | 111 | 100.0% |
Internet Access in Marion
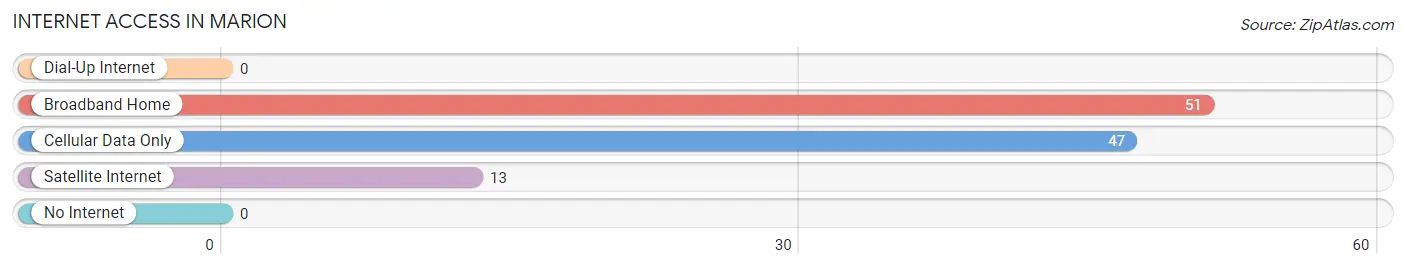
| Internet Type | # Households | % Households |
| Dial-Up Internet | 0 | 0.0% |
| Broadband Home | 51 | 46.0% |
| Cellular Data Only | 47 | 42.3% |
| Satellite Internet | 13 | 11.7% |
| No Internet | 0 | 0.0% |
| Total | 111 | 100.0% |
Marion Summary
Marion, Indiana is a city located in Grant County, Indiana, United States. It is the county seat of Grant County and is located in the east-central portion of the state. The population of Marion was estimated to be 30,914 in 2019.
History
Marion was founded in 1831 by General William Jones and named after Revolutionary War hero Francis Marion. The city was incorporated in 1835 and became the county seat of Grant County in 1836. The city was a major stop on the Underground Railroad, and was the site of the first African-American church in the state.
In the late 19th century, Marion was a major industrial center, with several factories producing a variety of products. The city was also home to the Marion Steam Shovel Company, which manufactured steam shovels and other heavy equipment.
In the early 20th century, Marion was a major center of the automobile industry, with several automobile manufacturers located in the city. The city was also home to the Marion Power Shovel Company, which manufactured heavy equipment for the construction industry.
Geography
Marion is located in east-central Indiana, in Grant County. The city is situated on the Mississinewa River, which flows through the city. The city is located approximately 60 miles northeast of Indianapolis and 40 miles southwest of Fort Wayne.
The city has a total area of 11.3 square miles, of which 11.2 square miles is land and 0.1 square miles is water. The city is located in the Central Till Plains region of Indiana, and is characterized by flat terrain and rolling hills.
Economy
Marion’s economy is largely based on manufacturing and healthcare. The city is home to several major employers, including General Motors, Indiana Packers Corporation, and Marion General Hospital.
The city is also home to several smaller businesses, including restaurants, retail stores, and service providers. The city is also home to several educational institutions, including Indiana Wesleyan University and Ivy Tech Community College.
Demographics
As of the 2019 census, the population of Marion was estimated to be 30,914. The racial makeup of the city was 79.2% White, 15.2% African American, 0.5% Native American, 1.2% Asian, 0.1% Pacific Islander, 1.3% from other races, and 2.7% from two or more races. Hispanic or Latino of any race were 4.2% of the population.
The median household income in Marion was $37,945, and the median family income was $45,945. The per capita income in the city was $20,945. About 17.2% of the population was below the poverty line.
Common Questions
What is Per Capita Income in Marion?
Per Capita income in Marion is $38,235.
What is the Median Household income in Marion?
Median Household Income in Marion is $66,635.
What is Income or Wage Gap in Marion?
Income or Wage Gap in Marion is 36.9%.
Women in Marion earn 63.1 cents for every dollar earned by a man.
What is Inequality or Gini Index in Marion?
Inequality or Gini Index in Marion is 0.21.
What is the Total Population of Marion?
Total Population of Marion is 207.
What is the Total Male Population of Marion?
Total Male Population of Marion is 100.
What is the Total Female Population of Marion?
Total Female Population of Marion is 107.
What is the Ratio of Males per 100 Females in Marion?
There are 93.46 Males per 100 Females in Marion.
What is the Ratio of Females per 100 Males in Marion?
There are 107.00 Females per 100 Males in Marion.
What is the Median Population Age in Marion?
Median Population Age in Marion is 42.1 Years.
What is the Average Family Size in Marion
Average Family Size in Marion is 2.4 People.
What is the Average Household Size in Marion
Average Household Size in Marion is 1.9 People.
How Large is the Labor Force in Marion?
There are 161 People in the Labor Forcein in Marion.
What is the Percentage of People in the Labor Force in Marion?
87.0% of People are in the Labor Force in Marion.