Rising Sun, IN Map & Demographics
Rising Sun Map
Rising Sun Overview
$29,038
PER CAPITA INCOME
$50,192
AVG FAMILY INCOME
$46,214
AVG HOUSEHOLD INCOME
34.9%
WAGE / INCOME GAP [ % ]
65.1¢/ $1
WAGE / INCOME GAP [ $ ]
0.45
INEQUALITY / GINI INDEX
2,420
TOTAL POPULATION
1,023
MALE POPULATION
1,397
FEMALE POPULATION
73.23
MALES / 100 FEMALES
136.56
FEMALES / 100 MALES
47.6
MEDIAN AGE
2.6
AVG FAMILY SIZE
2.2
AVG HOUSEHOLD SIZE
1,101
LABOR FORCE [ PEOPLE ]
55.3%
PERCENT IN LABOR FORCE
1.4%
UNEMPLOYMENT RATE
Rising Sun Zip Codes
Rising Sun Area Codes
Income in Rising Sun
Income Overview in Rising Sun
Per Capita Income in Rising Sun is $29,038, while median incomes of families and households are $50,192 and $46,214 respectively.
| Characteristic | Number | Measure |
| Per Capita Income | 2,420 | $29,038 |
| Median Family Income | 690 | $50,192 |
| Mean Family Income | 690 | $74,264 |
| Median Household Income | 1,056 | $46,214 |
| Mean Household Income | 1,056 | $64,124 |
| Income Deficit | 690 | $0 |
| Wage / Income Gap (%) | 2,420 | 34.87% |
| Wage / Income Gap ($) | 2,420 | 65.13¢ per $1 |
| Gini / Inequality Index | 2,420 | 0.45 |
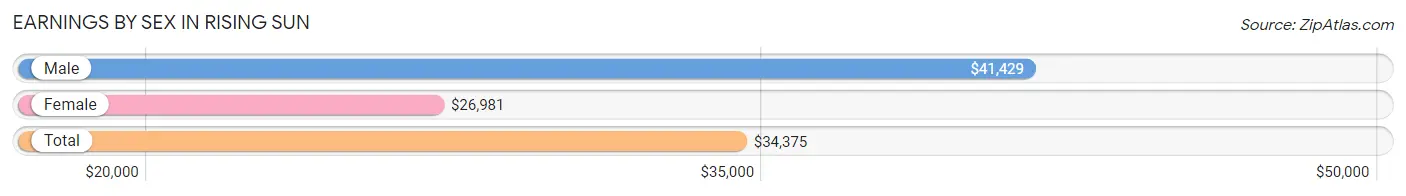
Earnings by Sex in Rising Sun
Average Earnings in Rising Sun are $34,375, $41,429 for men and $26,981 for women, a difference of 34.9%.
| Sex | Number | Average Earnings |
| Male | 540 (45.1%) | $41,429 |
| Female | 658 (54.9%) | $26,981 |
| Total | 1,198 (100.0%) | $34,375 |
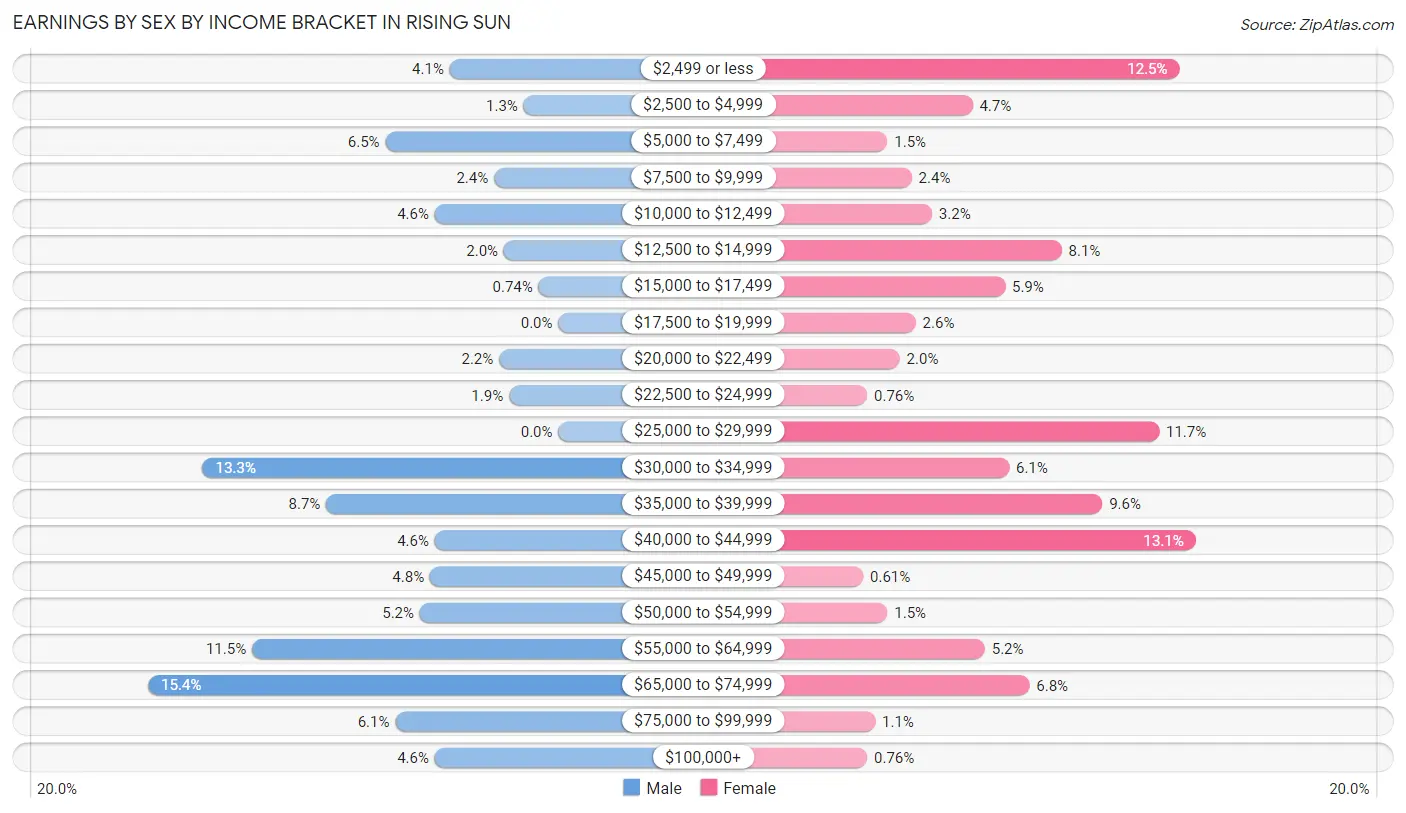
Earnings by Sex by Income Bracket in Rising Sun
The most common earnings brackets in Rising Sun are $65,000 to $74,999 for men (83 | 15.4%) and $40,000 to $44,999 for women (86 | 13.1%).
| Income | Male | Female |
| $2,499 or less | 22 (4.1%) | 82 (12.5%) |
| $2,500 to $4,999 | 7 (1.3%) | 31 (4.7%) |
| $5,000 to $7,499 | 35 (6.5%) | 10 (1.5%) |
| $7,500 to $9,999 | 13 (2.4%) | 16 (2.4%) |
| $10,000 to $12,499 | 25 (4.6%) | 21 (3.2%) |
| $12,500 to $14,999 | 11 (2.0%) | 53 (8.1%) |
| $15,000 to $17,499 | 4 (0.7%) | 39 (5.9%) |
| $17,500 to $19,999 | 0 (0.0%) | 17 (2.6%) |
| $20,000 to $22,499 | 12 (2.2%) | 13 (2.0%) |
| $22,500 to $24,999 | 10 (1.8%) | 5 (0.8%) |
| $25,000 to $29,999 | 0 (0.0%) | 77 (11.7%) |
| $30,000 to $34,999 | 72 (13.3%) | 40 (6.1%) |
| $35,000 to $39,999 | 47 (8.7%) | 63 (9.6%) |
| $40,000 to $44,999 | 25 (4.6%) | 86 (13.1%) |
| $45,000 to $49,999 | 26 (4.8%) | 4 (0.6%) |
| $50,000 to $54,999 | 28 (5.2%) | 10 (1.5%) |
| $55,000 to $64,999 | 62 (11.5%) | 34 (5.2%) |
| $65,000 to $74,999 | 83 (15.4%) | 45 (6.8%) |
| $75,000 to $99,999 | 33 (6.1%) | 7 (1.1%) |
| $100,000+ | 25 (4.6%) | 5 (0.8%) |
| Total | 540 (100.0%) | 658 (100.0%) |
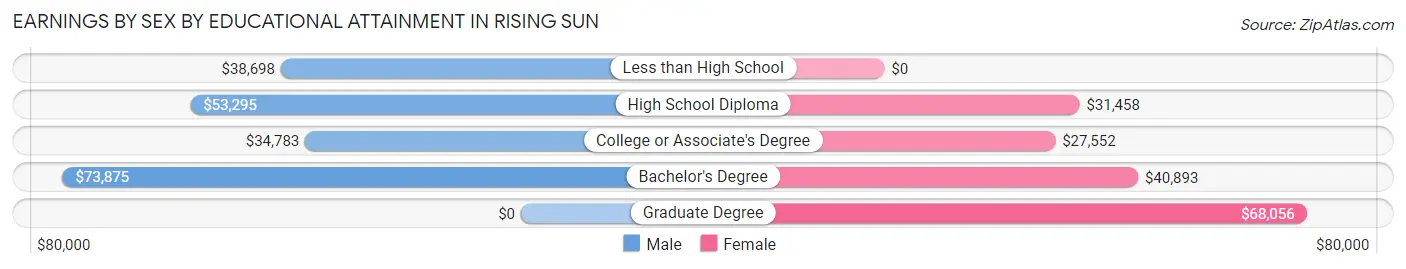
Earnings by Sex by Educational Attainment in Rising Sun
Average earnings in Rising Sun are $49,375 for men and $31,285 for women, a difference of 36.6%. Men with an educational attainment of bachelor's degree enjoy the highest average annual earnings of $73,875, while those with college or associate's degree education earn the least with $34,783. Women with an educational attainment of graduate degree earn the most with the average annual earnings of $68,056, while those with college or associate's degree education have the smallest earnings of $27,552.
| Educational Attainment | Male Income | Female Income |
| Less than High School | $38,698 | $0 |
| High School Diploma | $53,295 | $31,458 |
| College or Associate's Degree | $34,783 | $27,552 |
| Bachelor's Degree | $73,875 | $40,893 |
| Graduate Degree | - | - |
| Total | $49,375 | $31,285 |
Family Income in Rising Sun
Family Income Brackets in Rising Sun
According to the Rising Sun family income data, there are 201 families falling into the $35,000 to $49,999 income range, which is the most common income bracket and makes up 29.1% of all families. Conversely, the $150,000 to $199,999 income bracket is the least frequent group with only 9 families (1.3%) belonging to this category.
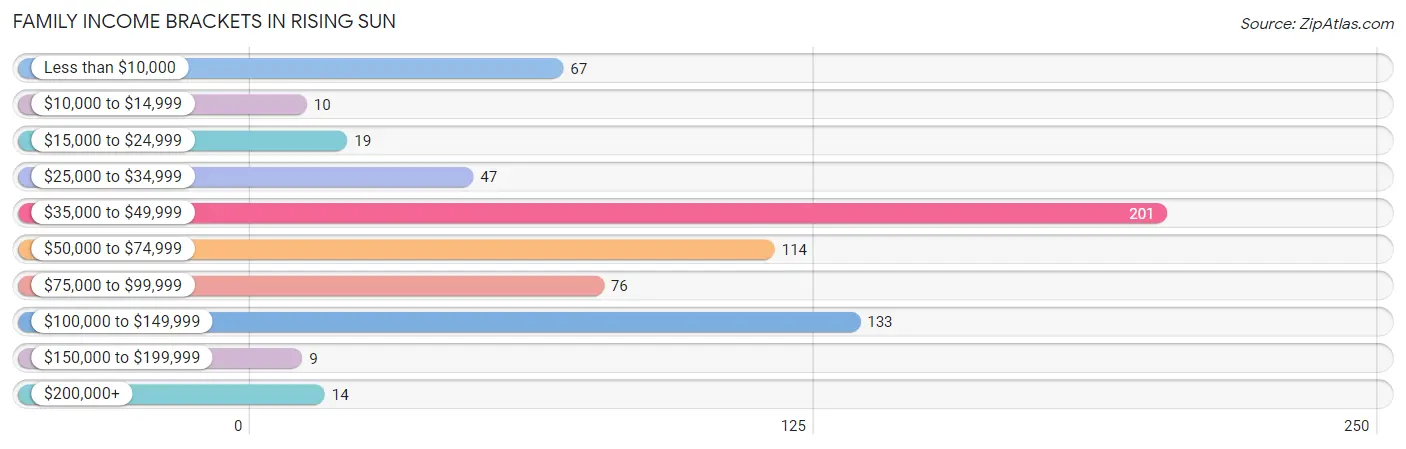
| Income Bracket | # Families | % Families |
| Less than $10,000 | 67 | 9.7% |
| $10,000 to $14,999 | 10 | 1.4% |
| $15,000 to $24,999 | 19 | 2.8% |
| $25,000 to $34,999 | 47 | 6.8% |
| $35,000 to $49,999 | 201 | 29.1% |
| $50,000 to $74,999 | 114 | 16.5% |
| $75,000 to $99,999 | 76 | 11.0% |
| $100,000 to $149,999 | 133 | 19.3% |
| $150,000 to $199,999 | 9 | 1.3% |
| $200,000+ | 14 | 2.0% |
Family Income by Famaliy Size in Rising Sun
5-person families (38 | 5.5%) account for the highest median family income in Rising Sun with $94,375 per family, while 2-person families (429 | 62.2%) have the highest median income of $24,948 per family member.
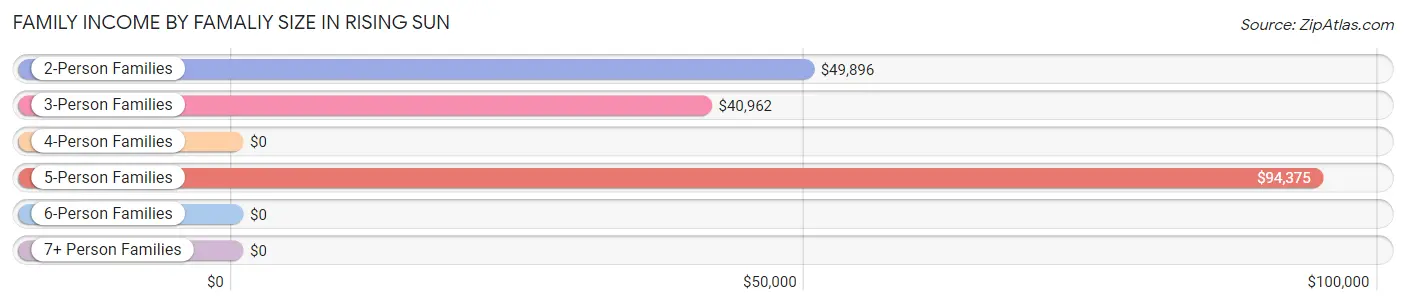
| Income Bracket | # Families | Median Income |
| 2-Person Families | 429 (62.2%) | $49,896 |
| 3-Person Families | 124 (18.0%) | $40,962 |
| 4-Person Families | 94 (13.6%) | $0 |
| 5-Person Families | 38 (5.5%) | $94,375 |
| 6-Person Families | 5 (0.7%) | $0 |
| 7+ Person Families | 0 (0.0%) | $0 |
| Total | 690 (100.0%) | $50,192 |
Family Income by Number of Earners in Rising Sun
The median family income in Rising Sun is $50,192, with families comprising 3+ earners (46) having the highest median family income of $108,472, while families with no earners (133) have the lowest median family income of $37,917, accounting for 6.7% and 19.3% of families, respectively.
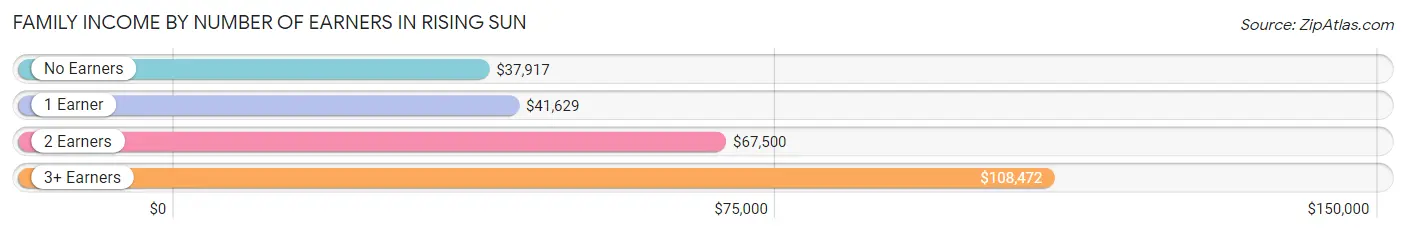
| Number of Earners | # Families | Median Income |
| No Earners | 133 (19.3%) | $37,917 |
| 1 Earner | 281 (40.7%) | $41,629 |
| 2 Earners | 230 (33.3%) | $67,500 |
| 3+ Earners | 46 (6.7%) | $108,472 |
| Total | 690 (100.0%) | $50,192 |
Household Income in Rising Sun
Household Income Brackets in Rising Sun
With 244 households falling in the category, the $35,000 to $49,999 income range is the most frequent in Rising Sun, accounting for 23.1% of all households. In contrast, only 10 households (0.9%) fall into the $150,000 to $199,999 income bracket, making it the least populous group.
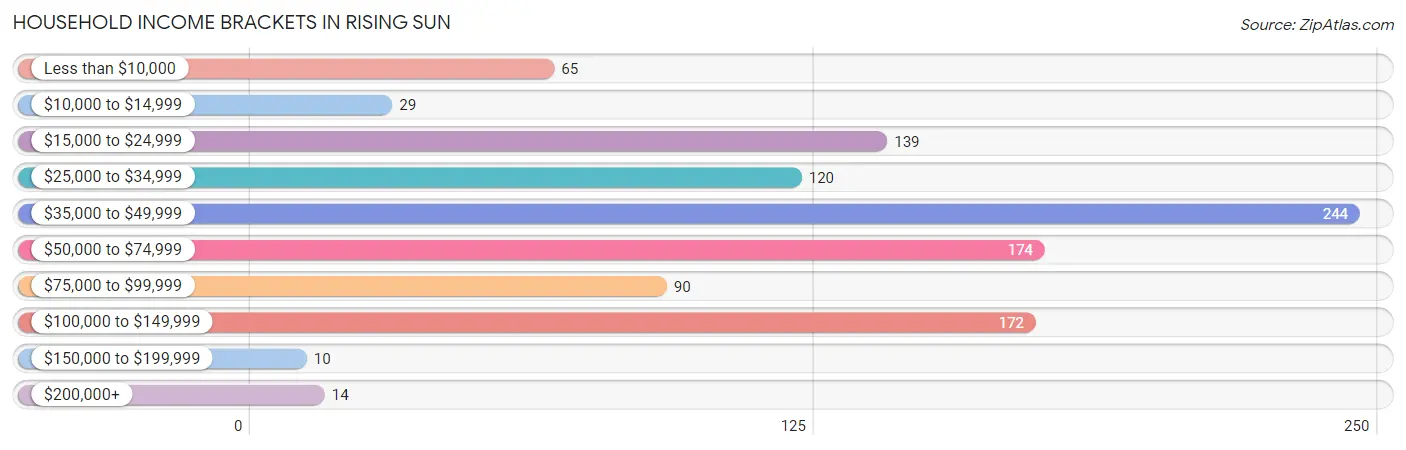
| Income Bracket | # Households | % Households |
| Less than $10,000 | 65 | 6.2% |
| $10,000 to $14,999 | 29 | 2.7% |
| $15,000 to $24,999 | 139 | 13.2% |
| $25,000 to $34,999 | 120 | 11.4% |
| $35,000 to $49,999 | 244 | 23.1% |
| $50,000 to $74,999 | 174 | 16.5% |
| $75,000 to $99,999 | 90 | 8.5% |
| $100,000 to $149,999 | 172 | 16.3% |
| $150,000 to $199,999 | 10 | 0.9% |
| $200,000+ | 14 | 1.3% |
Household Income by Householder Age in Rising Sun
The median household income in Rising Sun is $46,214, with the highest median household income of $56,300 found in the 45 to 64 years age bracket for the primary householder. A total of 418 households (39.6%) fall into this category. Meanwhile, the 15 to 24 years age bracket for the primary householder has the lowest median household income of $0, with 20 households (1.9%) in this group.
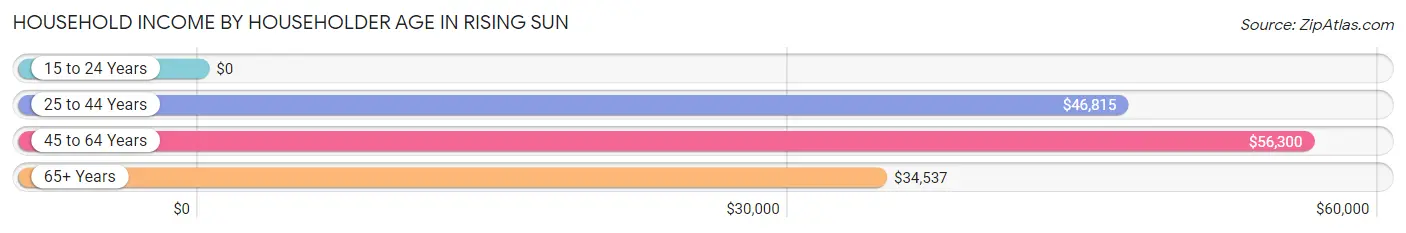
| Income Bracket | # Households | Median Income |
| 15 to 24 Years | 20 (1.9%) | $0 |
| 25 to 44 Years | 288 (27.3%) | $46,815 |
| 45 to 64 Years | 418 (39.6%) | $56,300 |
| 65+ Years | 330 (31.2%) | $34,537 |
| Total | 1,056 (100.0%) | $46,214 |
Poverty in Rising Sun
Income Below Poverty by Sex and Age in Rising Sun
With 10.3% poverty level for males and 19.5% for females among the residents of Rising Sun, under 5 year old males and 5 year old females are the most vulnerable to poverty, with 18 males (66.7%) and 14 females (82.4%) in their respective age groups living below the poverty level.
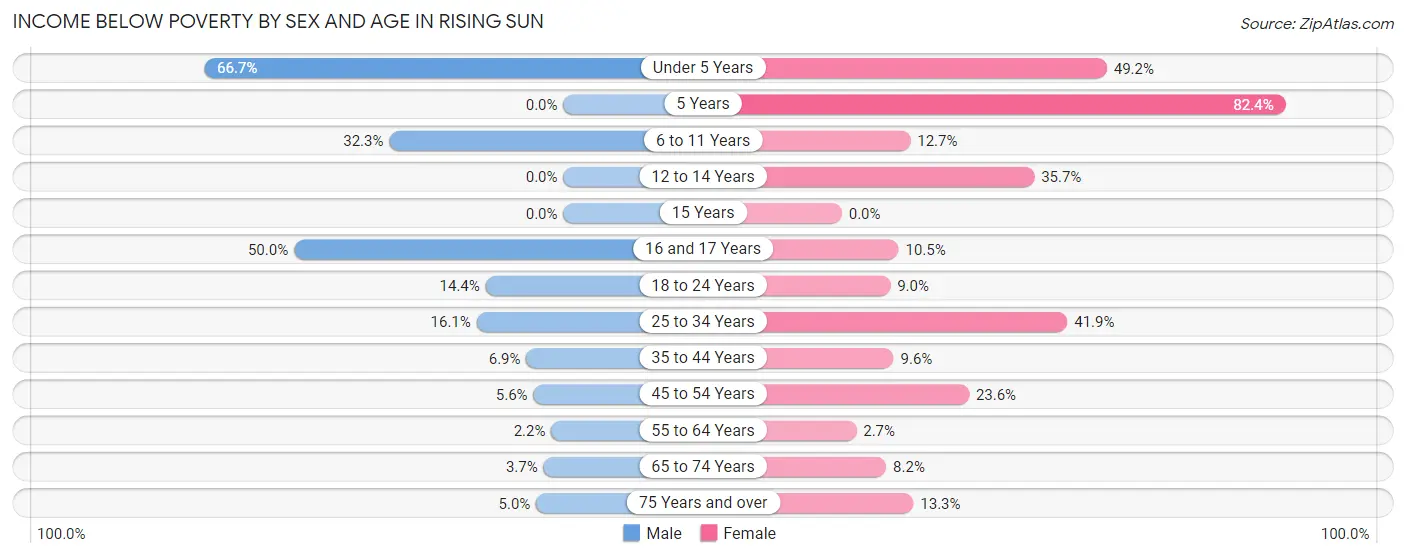
| Age Bracket | Male | Female |
| Under 5 Years | 18 (66.7%) | 61 (49.2%) |
| 5 Years | 0 (0.0%) | 14 (82.4%) |
| 6 to 11 Years | 21 (32.3%) | 15 (12.7%) |
| 12 to 14 Years | 0 (0.0%) | 5 (35.7%) |
| 15 Years | 0 (0.0%) | 0 (0.0%) |
| 16 and 17 Years | 2 (50.0%) | 4 (10.5%) |
| 18 to 24 Years | 14 (14.4%) | 8 (9.0%) |
| 25 to 34 Years | 19 (16.1%) | 72 (41.9%) |
| 35 to 44 Years | 7 (6.9%) | 10 (9.6%) |
| 45 to 54 Years | 6 (5.6%) | 42 (23.6%) |
| 55 to 64 Years | 3 (2.2%) | 6 (2.7%) |
| 65 to 74 Years | 6 (3.7%) | 13 (8.2%) |
| 75 Years and over | 6 (5.0%) | 17 (13.3%) |
| Total | 102 (10.3%) | 267 (19.5%) |
Income Above Poverty by Sex and Age in Rising Sun
According to the poverty statistics in Rising Sun, males aged 5 years and females aged 15 years are the age groups that are most secure financially, with 100.0% of males and 100.0% of females in these age groups living above the poverty line.
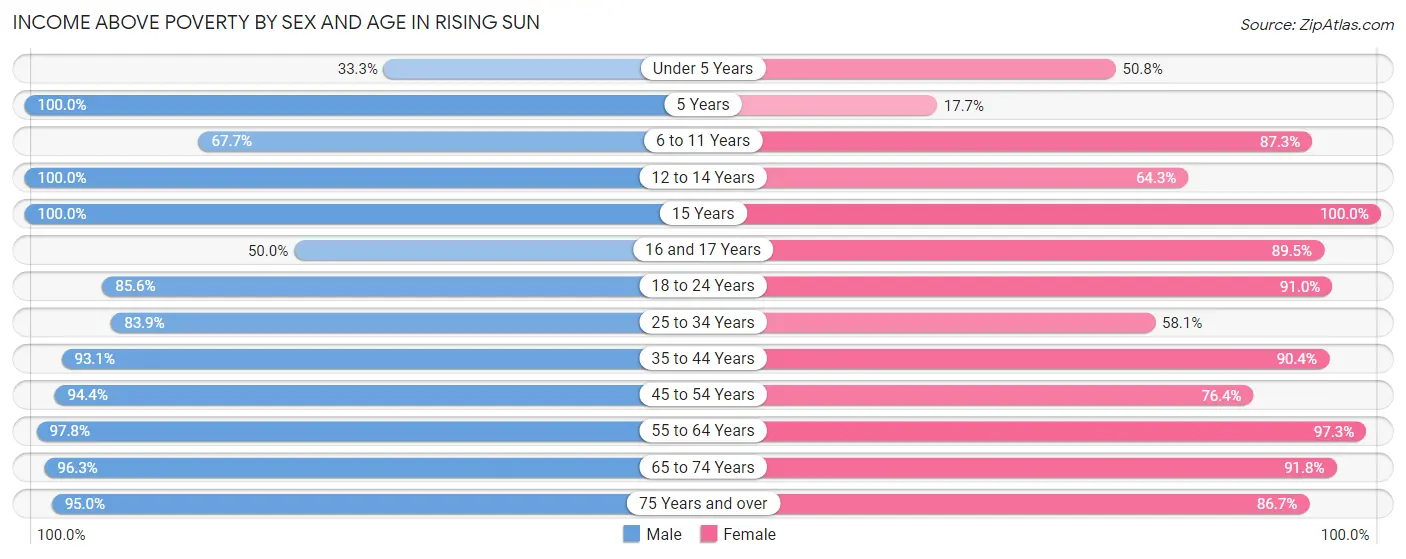
| Age Bracket | Male | Female |
| Under 5 Years | 9 (33.3%) | 63 (50.8%) |
| 5 Years | 9 (100.0%) | 3 (17.6%) |
| 6 to 11 Years | 44 (67.7%) | 103 (87.3%) |
| 12 to 14 Years | 5 (100.0%) | 9 (64.3%) |
| 15 Years | 38 (100.0%) | 4 (100.0%) |
| 16 and 17 Years | 2 (50.0%) | 34 (89.5%) |
| 18 to 24 Years | 83 (85.6%) | 81 (91.0%) |
| 25 to 34 Years | 99 (83.9%) | 100 (58.1%) |
| 35 to 44 Years | 95 (93.1%) | 94 (90.4%) |
| 45 to 54 Years | 102 (94.4%) | 136 (76.4%) |
| 55 to 64 Years | 131 (97.8%) | 217 (97.3%) |
| 65 to 74 Years | 157 (96.3%) | 145 (91.8%) |
| 75 Years and over | 113 (95.0%) | 111 (86.7%) |
| Total | 887 (89.7%) | 1,100 (80.5%) |
Income Below Poverty Among Married-Couple Families in Rising Sun
The poverty statistics for married-couple families in Rising Sun show that 1.7% or 6 of the total 353 families live below the poverty line. Families with no children have the highest poverty rate of 2.2%, comprising of 6 families. On the other hand, families with 1 or 2 children have the lowest poverty rate of 0.0%, which includes 0 families.
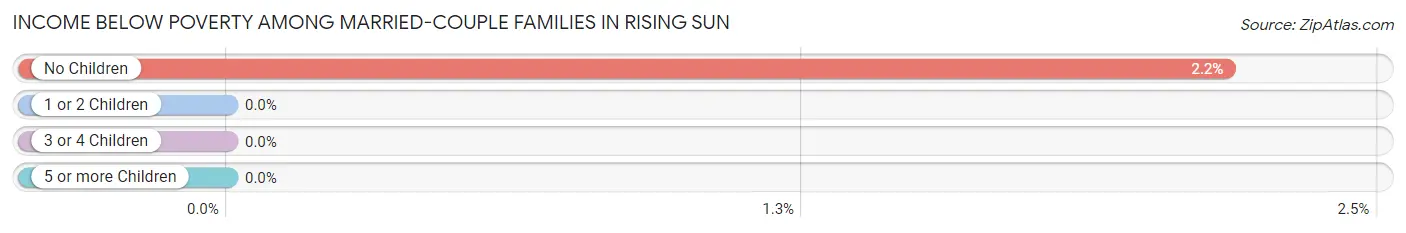
| Children | Above Poverty | Below Poverty |
| No Children | 270 (97.8%) | 6 (2.2%) |
| 1 or 2 Children | 63 (100.0%) | 0 (0.0%) |
| 3 or 4 Children | 14 (100.0%) | 0 (0.0%) |
| 5 or more Children | 0 (0.0%) | 0 (0.0%) |
| Total | 347 (98.3%) | 6 (1.7%) |
Income Below Poverty Among Single-Parent Households in Rising Sun
According to the poverty data in Rising Sun, 20.2% or 19 single-father households and 31.7% or 77 single-mother households are living below the poverty line. Among single-father households, those with 1 or 2 children have the highest poverty rate, with 19 households (41.3%) experiencing poverty. Likewise, among single-mother households, those with 3 or 4 children have the highest poverty rate, with 11 households (100.0%) falling below the poverty line.
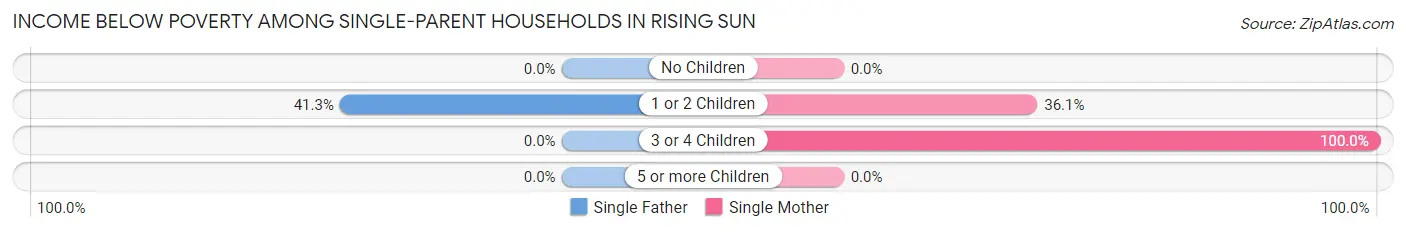
| Children | Single Father | Single Mother |
| No Children | 0 (0.0%) | 0 (0.0%) |
| 1 or 2 Children | 19 (41.3%) | 66 (36.1%) |
| 3 or 4 Children | 0 (0.0%) | 11 (100.0%) |
| 5 or more Children | 0 (0.0%) | 0 (0.0%) |
| Total | 19 (20.2%) | 77 (31.7%) |
Income Below Poverty Among Married-Couple vs Single-Parent Households in Rising Sun
The poverty data for Rising Sun shows that 6 of the married-couple family households (1.7%) and 96 of the single-parent households (28.5%) are living below the poverty level. Within the married-couple family households, those with no children have the highest poverty rate, with 6 households (2.2%) falling below the poverty line. Among the single-parent households, those with 3 or 4 children have the highest poverty rate, with 11 household (68.8%) living below poverty.
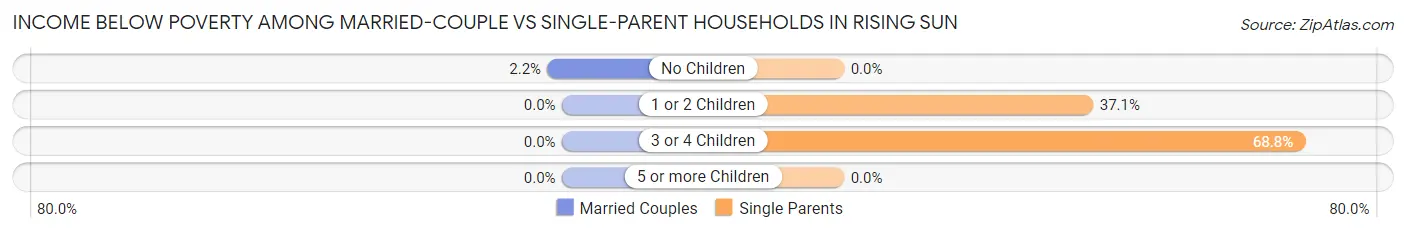
| Children | Married-Couple Families | Single-Parent Households |
| No Children | 6 (2.2%) | 0 (0.0%) |
| 1 or 2 Children | 0 (0.0%) | 85 (37.1%) |
| 3 or 4 Children | 0 (0.0%) | 11 (68.8%) |
| 5 or more Children | 0 (0.0%) | 0 (0.0%) |
| Total | 6 (1.7%) | 96 (28.5%) |
Race in Rising Sun
The most populous races in Rising Sun are White / Caucasian (2,255 | 93.2%), Two or more Races (118 | 4.9%), and Native / Alaskan (26 | 1.1%).
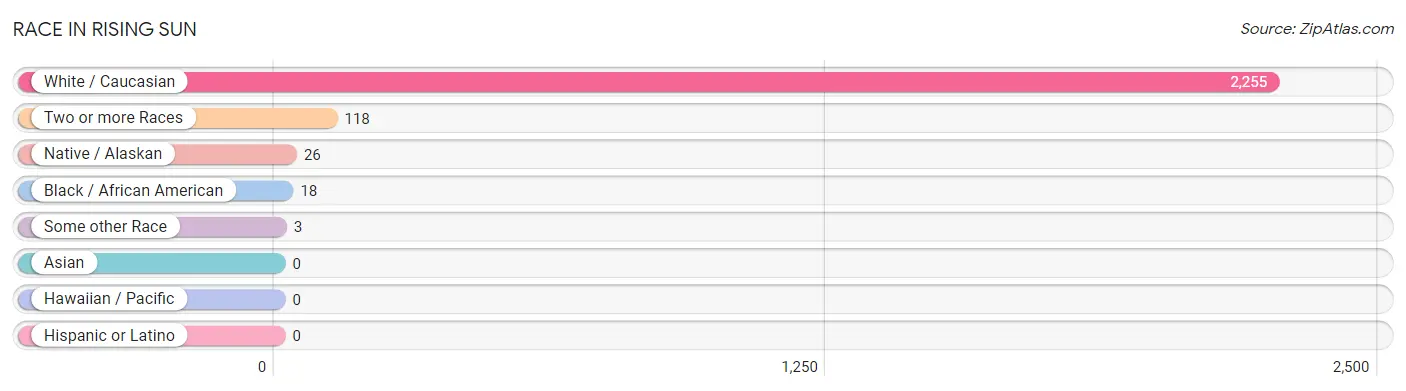
| Race | # Population | % Population |
| Asian | 0 | 0.0% |
| Black / African American | 18 | 0.7% |
| Hawaiian / Pacific | 0 | 0.0% |
| Hispanic or Latino | 0 | 0.0% |
| Native / Alaskan | 26 | 1.1% |
| White / Caucasian | 2,255 | 93.2% |
| Two or more Races | 118 | 4.9% |
| Some other Race | 3 | 0.1% |
| Total | 2,420 | 100.0% |
Ancestry in Rising Sun
The most populous ancestries reported in Rising Sun are German (866 | 35.8%), Irish (314 | 13.0%), English (304 | 12.6%), Italian (175 | 7.2%), and American (152 | 6.3%), together accounting for 74.8% of all Rising Sun residents.
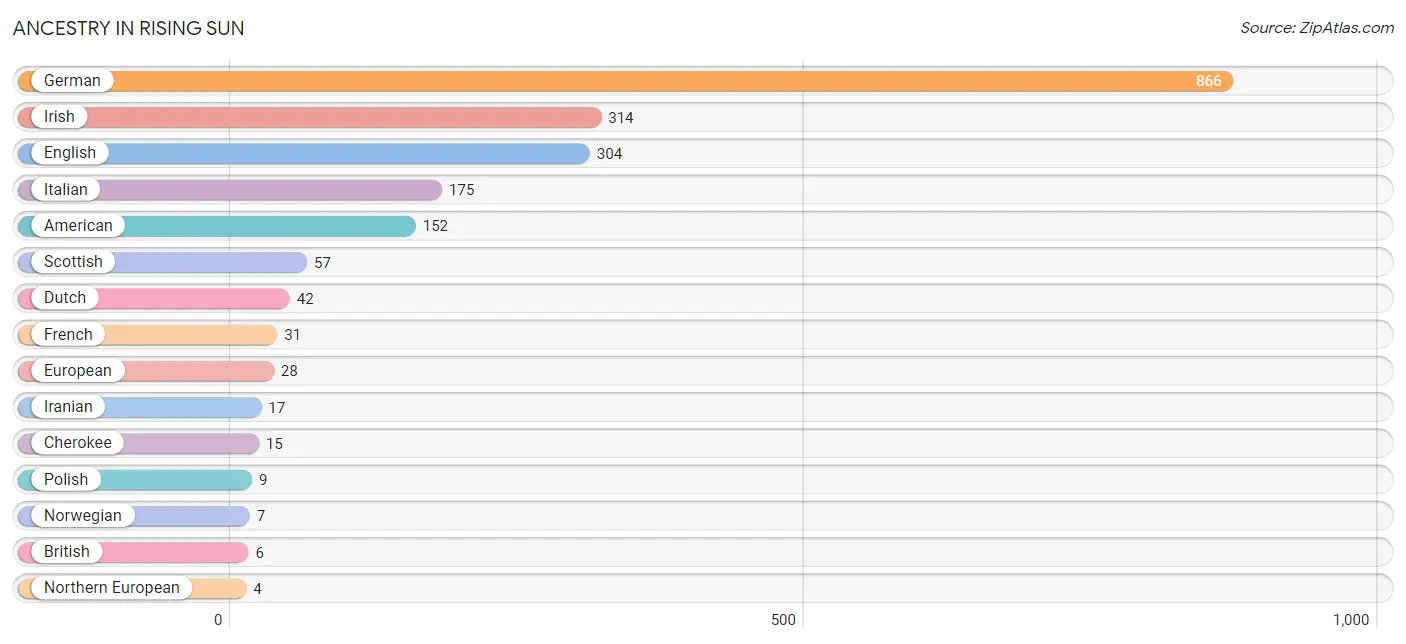
| Ancestry | # Population | % Population |
| American | 152 | 6.3% |
| British | 6 | 0.3% |
| Canadian | 3 | 0.1% |
| Cherokee | 15 | 0.6% |
| Delaware | 1 | 0.0% |
| Dutch | 42 | 1.7% |
| English | 304 | 12.6% |
| European | 28 | 1.2% |
| French | 31 | 1.3% |
| German | 866 | 35.8% |
| Iranian | 17 | 0.7% |
| Irish | 314 | 13.0% |
| Italian | 175 | 7.2% |
| Northern European | 4 | 0.2% |
| Norwegian | 7 | 0.3% |
| Polish | 9 | 0.4% |
| Scotch-Irish | 3 | 0.1% |
| Scottish | 57 | 2.4% |
| Swedish | 4 | 0.2% |
| Welsh | 1 | 0.0% | View All 20 Rows |
Immigrants in Rising Sun
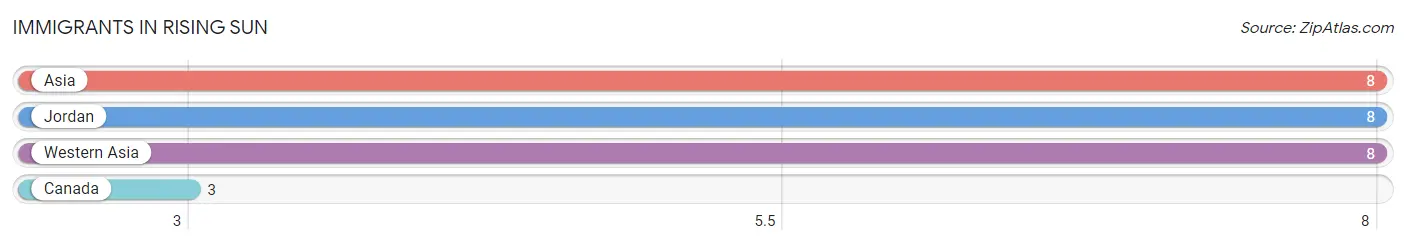
The most numerous immigrant groups reported in Rising Sun came from Asia (8 | 0.3%), Jordan (8 | 0.3%), Western Asia (8 | 0.3%), and Canada (3 | 0.1%), together accounting for 1.1% of all Rising Sun residents.
| Immigration Origin | # Population | % Population |
| Asia | 8 | 0.3% |
| Canada | 3 | 0.1% |
| Jordan | 8 | 0.3% |
| Western Asia | 8 | 0.3% | View All 4 Rows |
Sex and Age in Rising Sun
Sex and Age in Rising Sun
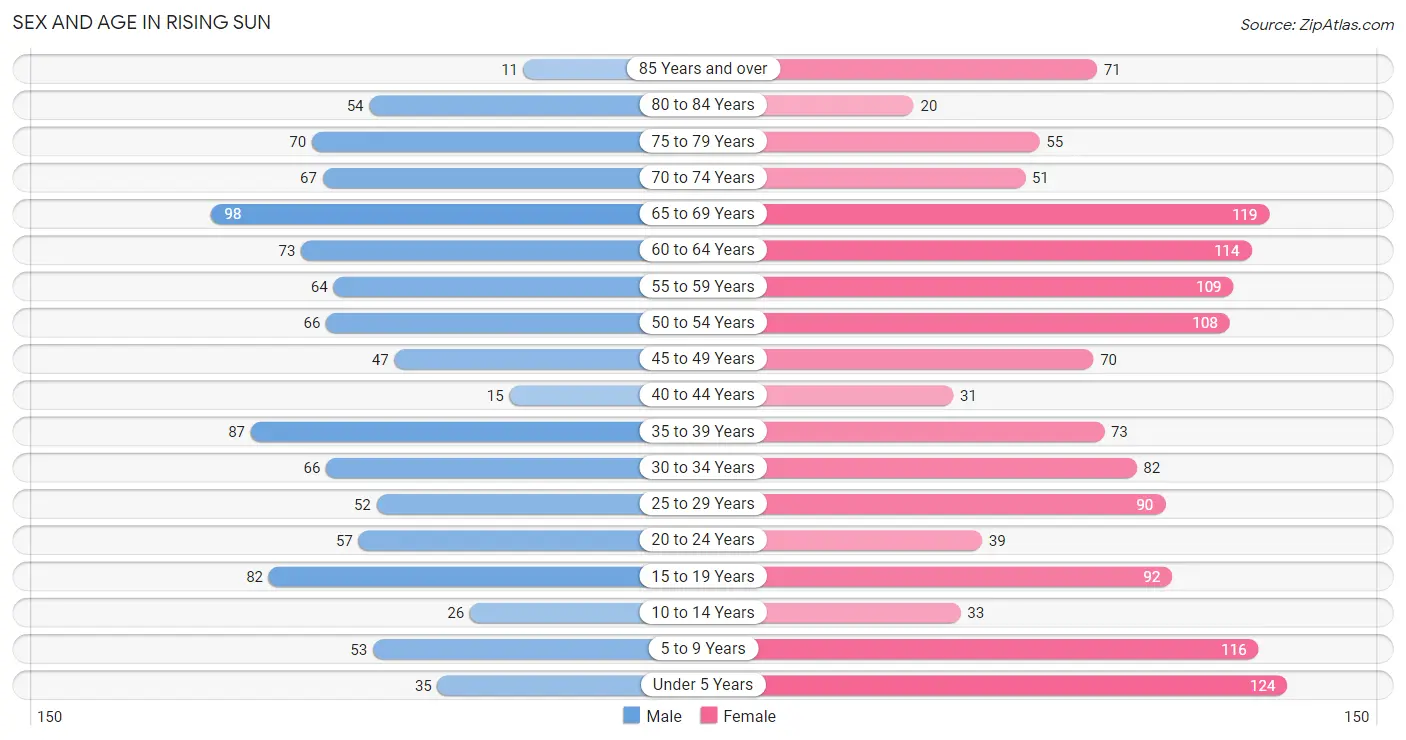
The most populous age groups in Rising Sun are 65 to 69 Years (98 | 9.6%) for men and Under 5 Years (124 | 8.9%) for women.
| Age Bracket | Male | Female |
| Under 5 Years | 35 (3.4%) | 124 (8.9%) |
| 5 to 9 Years | 53 (5.2%) | 116 (8.3%) |
| 10 to 14 Years | 26 (2.5%) | 33 (2.4%) |
| 15 to 19 Years | 82 (8.0%) | 92 (6.6%) |
| 20 to 24 Years | 57 (5.6%) | 39 (2.8%) |
| 25 to 29 Years | 52 (5.1%) | 90 (6.4%) |
| 30 to 34 Years | 66 (6.5%) | 82 (5.9%) |
| 35 to 39 Years | 87 (8.5%) | 73 (5.2%) |
| 40 to 44 Years | 15 (1.5%) | 31 (2.2%) |
| 45 to 49 Years | 47 (4.6%) | 70 (5.0%) |
| 50 to 54 Years | 66 (6.5%) | 108 (7.7%) |
| 55 to 59 Years | 64 (6.3%) | 109 (7.8%) |
| 60 to 64 Years | 73 (7.1%) | 114 (8.2%) |
| 65 to 69 Years | 98 (9.6%) | 119 (8.5%) |
| 70 to 74 Years | 67 (6.6%) | 51 (3.6%) |
| 75 to 79 Years | 70 (6.8%) | 55 (3.9%) |
| 80 to 84 Years | 54 (5.3%) | 20 (1.4%) |
| 85 Years and over | 11 (1.1%) | 71 (5.1%) |
| Total | 1,023 (100.0%) | 1,397 (100.0%) |
Families and Households in Rising Sun
Median Family Size in Rising Sun
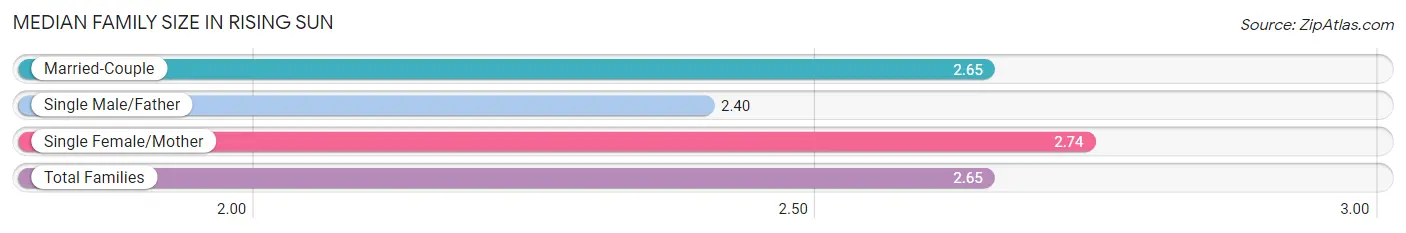
The median family size in Rising Sun is 2.65 persons per family, with single female/mother families (243 | 35.2%) accounting for the largest median family size of 2.74 persons per family. On the other hand, single male/father families (94 | 13.6%) represent the smallest median family size with 2.40 persons per family.
| Family Type | # Families | Family Size |
| Married-Couple | 353 (51.2%) | 2.65 |
| Single Male/Father | 94 (13.6%) | 2.40 |
| Single Female/Mother | 243 (35.2%) | 2.74 |
| Total Families | 690 (100.0%) | 2.65 |
Median Household Size in Rising Sun
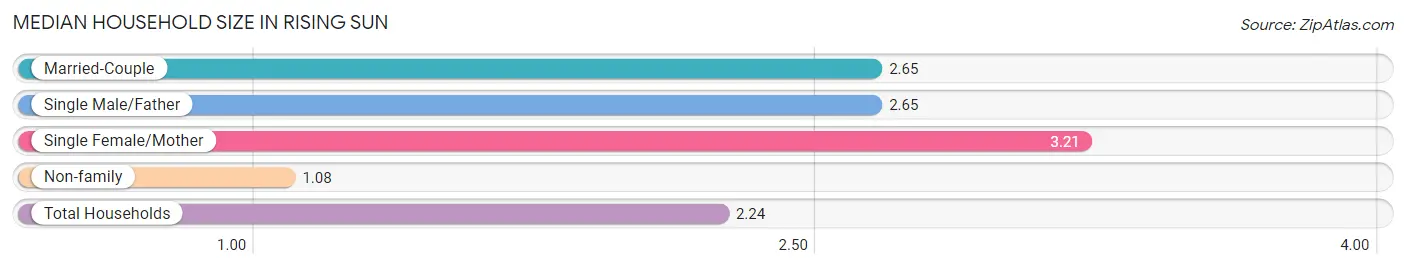
The median household size in Rising Sun is 2.24 persons per household, with single female/mother households (243 | 23.0%) accounting for the largest median household size of 3.21 persons per household. non-family households (366 | 34.7%) represent the smallest median household size with 1.08 persons per household.
| Household Type | # Households | Household Size |
| Married-Couple | 353 (33.4%) | 2.65 |
| Single Male/Father | 94 (8.9%) | 2.65 |
| Single Female/Mother | 243 (23.0%) | 3.21 |
| Non-family | 366 (34.7%) | 1.08 |
| Total Households | 1,056 (100.0%) | 2.24 |
Household Size by Marriage Status in Rising Sun
Out of a total of 1,056 households in Rising Sun, 690 (65.3%) are family households, while 366 (34.7%) are nonfamily households. The most numerous type of family households are 2-person households, comprising 366, and the most common type of nonfamily households are 1-person households, comprising 348.
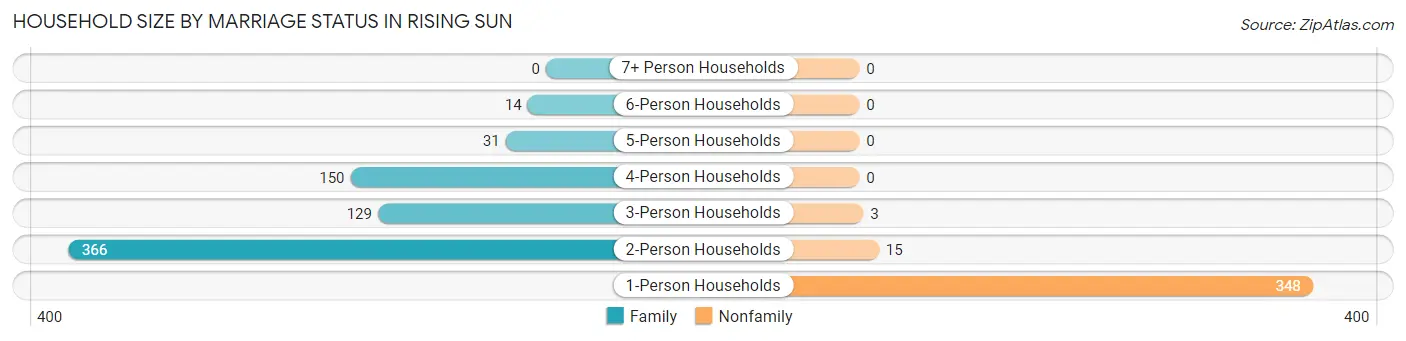
| Household Size | Family Households | Nonfamily Households |
| 1-Person Households | - | 348 (33.0%) |
| 2-Person Households | 366 (34.7%) | 15 (1.4%) |
| 3-Person Households | 129 (12.2%) | 3 (0.3%) |
| 4-Person Households | 150 (14.2%) | 0 (0.0%) |
| 5-Person Households | 31 (2.9%) | 0 (0.0%) |
| 6-Person Households | 14 (1.3%) | 0 (0.0%) |
| 7+ Person Households | 0 (0.0%) | 0 (0.0%) |
| Total | 690 (65.3%) | 366 (34.7%) |
Female Fertility in Rising Sun
Fertility by Age in Rising Sun
Average fertility rate in Rising Sun is 16.0 births per 1,000 women. Women in the age bracket of 20 to 34 years have the highest fertility rate with 38.0 births per 1,000 women. Women in the age bracket of 20 to 34 years acount for 100.0% of all women with births.
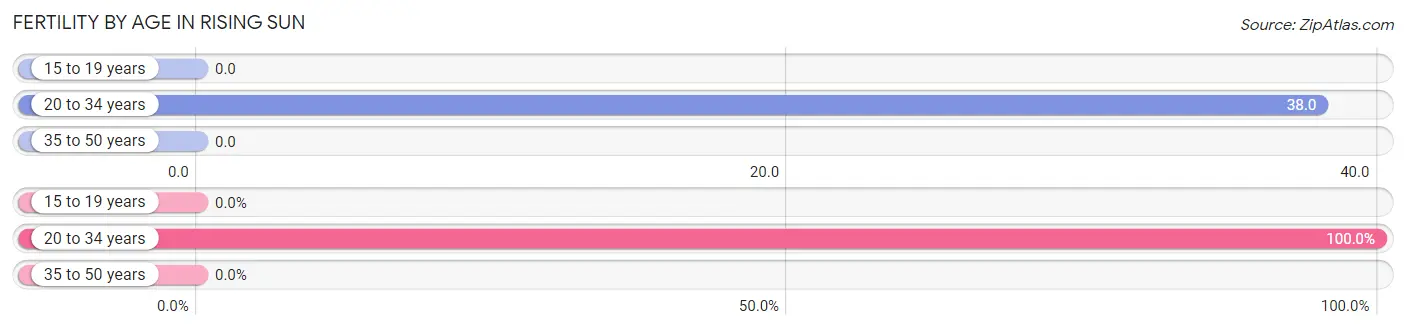
| Age Bracket | Women with Births | Births / 1,000 Women |
| 15 to 19 years | 0 (0.0%) | 0.0 |
| 20 to 34 years | 8 (100.0%) | 38.0 |
| 35 to 50 years | 0 (0.0%) | 0.0 |
| Total | 8 (100.0%) | 16.0 |
Fertility by Age by Marriage Status in Rising Sun
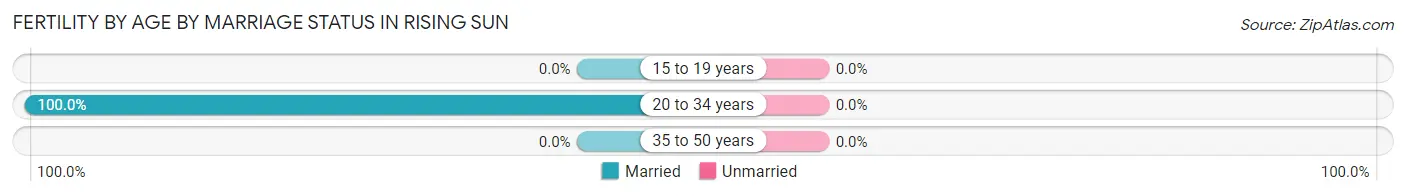
| Age Bracket | Married | Unmarried |
| 15 to 19 years | 0 (0.0%) | 0 (0.0%) |
| 20 to 34 years | 8 (100.0%) | 0 (0.0%) |
| 35 to 50 years | 0 (0.0%) | 0 (0.0%) |
| Total | 8 (100.0%) | 0 (0.0%) |
Fertility by Education in Rising Sun
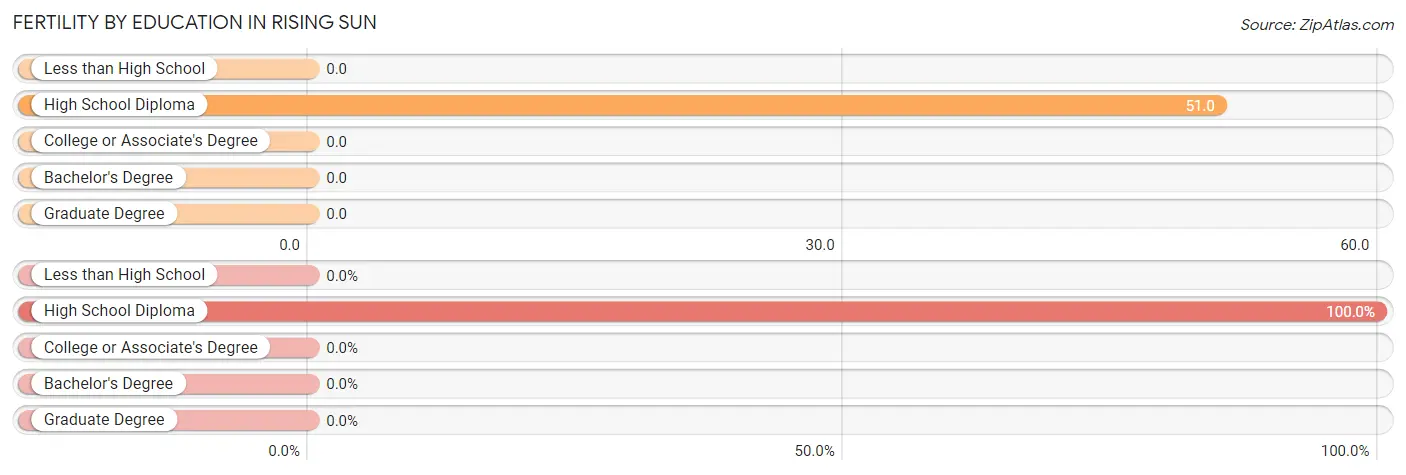
| Educational Attainment | Women with Births | Births / 1,000 Women |
| Less than High School | 0 (0.0%) | 0.0 |
| High School Diploma | 8 (100.0%) | 51.0 |
| College or Associate's Degree | 0 (0.0%) | 0.0 |
| Bachelor's Degree | 0 (0.0%) | 0.0 |
| Graduate Degree | 0 (0.0%) | 0.0 |
| Total | 8 (100.0%) | 16.0 |
Fertility by Education by Marriage Status in Rising Sun
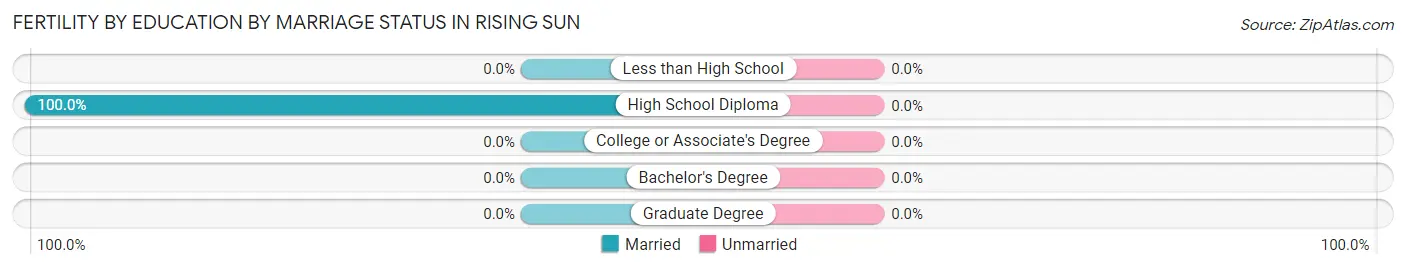
| Educational Attainment | Married | Unmarried |
| Less than High School | 0 (0.0%) | 0 (0.0%) |
| High School Diploma | 8 (100.0%) | 0 (0.0%) |
| College or Associate's Degree | 0 (0.0%) | 0 (0.0%) |
| Bachelor's Degree | 0 (0.0%) | 0 (0.0%) |
| Graduate Degree | 0 (0.0%) | 0 (0.0%) |
| Total | 8 (100.0%) | 0 (0.0%) |
Employment Characteristics in Rising Sun
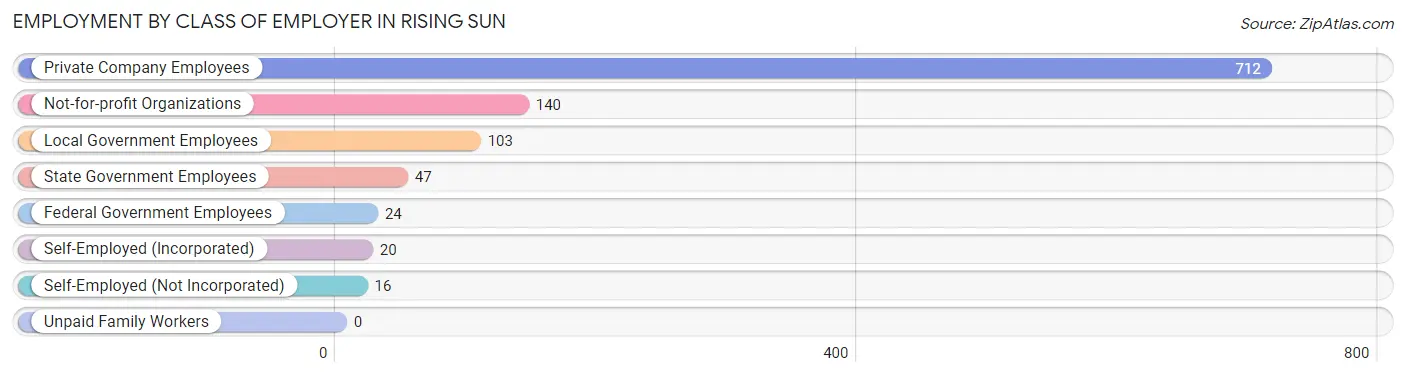
Employment by Class of Employer in Rising Sun
Among the 1,062 employed individuals in Rising Sun, private company employees (712 | 67.0%), not-for-profit organizations (140 | 13.2%), and local government employees (103 | 9.7%) make up the most common classes of employment.
| Employer Class | # Employees | % Employees |
| Private Company Employees | 712 | 67.0% |
| Self-Employed (Incorporated) | 20 | 1.9% |
| Self-Employed (Not Incorporated) | 16 | 1.5% |
| Not-for-profit Organizations | 140 | 13.2% |
| Local Government Employees | 103 | 9.7% |
| State Government Employees | 47 | 4.4% |
| Federal Government Employees | 24 | 2.3% |
| Unpaid Family Workers | 0 | 0.0% |
| Total | 1,062 | 100.0% |
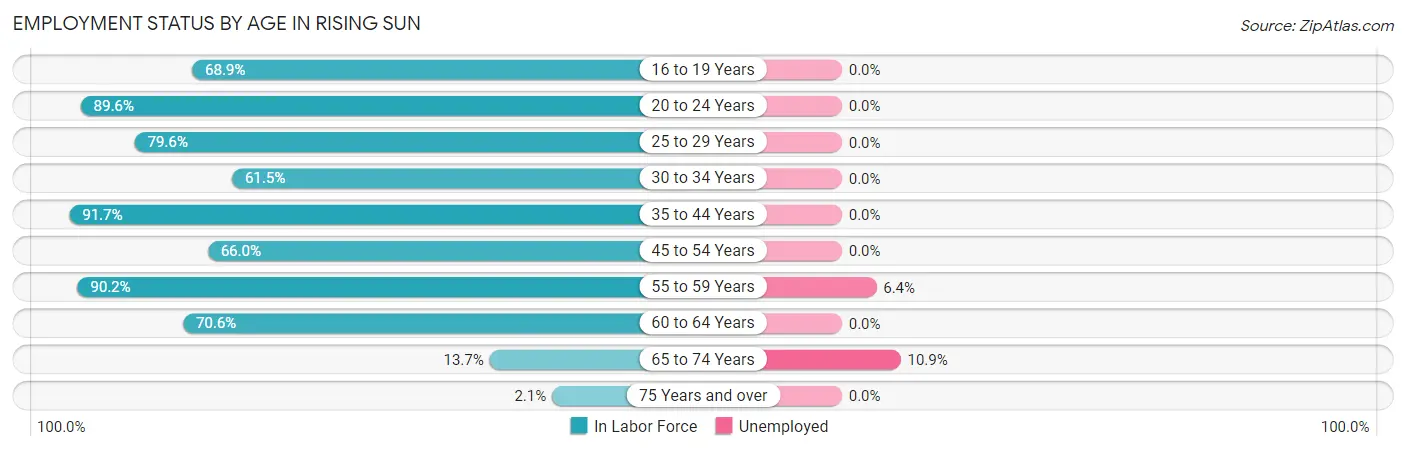
Employment Status by Age in Rising Sun
According to the labor force statistics for Rising Sun, out of the total population over 16 years of age (1,991), 55.3% or 1,101 individuals are in the labor force, with 1.4% or 15 of them unemployed. The age group with the highest labor force participation rate is 35 to 44 years, with 91.7% or 189 individuals in the labor force. Within the labor force, the 65 to 74 years age range has the highest percentage of unemployed individuals, with 10.9% or 5 of them being unemployed.
| Age Bracket | In Labor Force | Unemployed |
| 16 to 19 Years | 91 (68.9%) | 0 (0.0%) |
| 20 to 24 Years | 86 (89.6%) | 0 (0.0%) |
| 25 to 29 Years | 113 (79.6%) | 0 (0.0%) |
| 30 to 34 Years | 91 (61.5%) | 0 (0.0%) |
| 35 to 44 Years | 189 (91.7%) | 0 (0.0%) |
| 45 to 54 Years | 192 (66.0%) | 0 (0.0%) |
| 55 to 59 Years | 156 (90.2%) | 10 (6.4%) |
| 60 to 64 Years | 132 (70.6%) | 0 (0.0%) |
| 65 to 74 Years | 46 (13.7%) | 5 (10.9%) |
| 75 Years and over | 6 (2.1%) | 0 (0.0%) |
| Total | 1,101 (55.3%) | 15 (1.4%) |
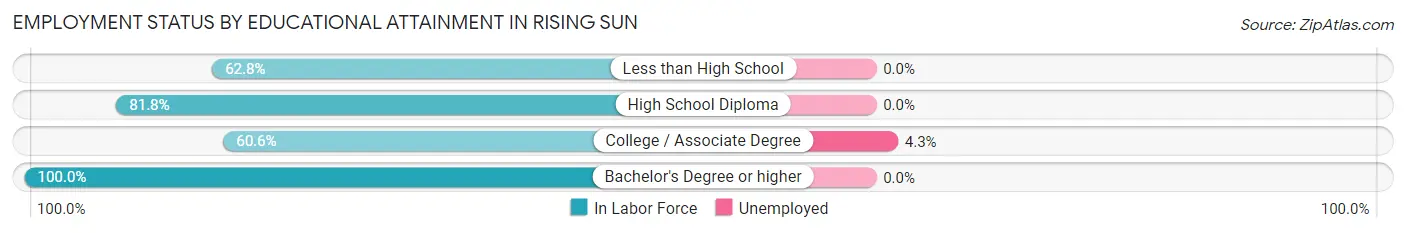
Employment Status by Educational Attainment in Rising Sun
According to labor force statistics for Rising Sun, 76.1% of individuals (873) out of the total population between 25 and 64 years of age (1,147) are in the labor force, with 1.1% or 10 of them being unemployed. The group with the highest labor force participation rate are those with the educational attainment of bachelor's degree or higher, with 100.0% or 174 individuals in the labor force. Within the labor force, individuals with college / associate degree education have the highest percentage of unemployment, with 4.3% or 10 of them being unemployed.
| Educational Attainment | In Labor Force | Unemployed |
| Less than High School | 54 (62.8%) | 0 (0.0%) |
| High School Diploma | 414 (81.8%) | 0 (0.0%) |
| College / Associate Degree | 231 (60.6%) | 16 (4.3%) |
| Bachelor's Degree or higher | 174 (100.0%) | 0 (0.0%) |
| Total | 873 (76.1%) | 13 (1.1%) |
Employment Occupations by Sex in Rising Sun
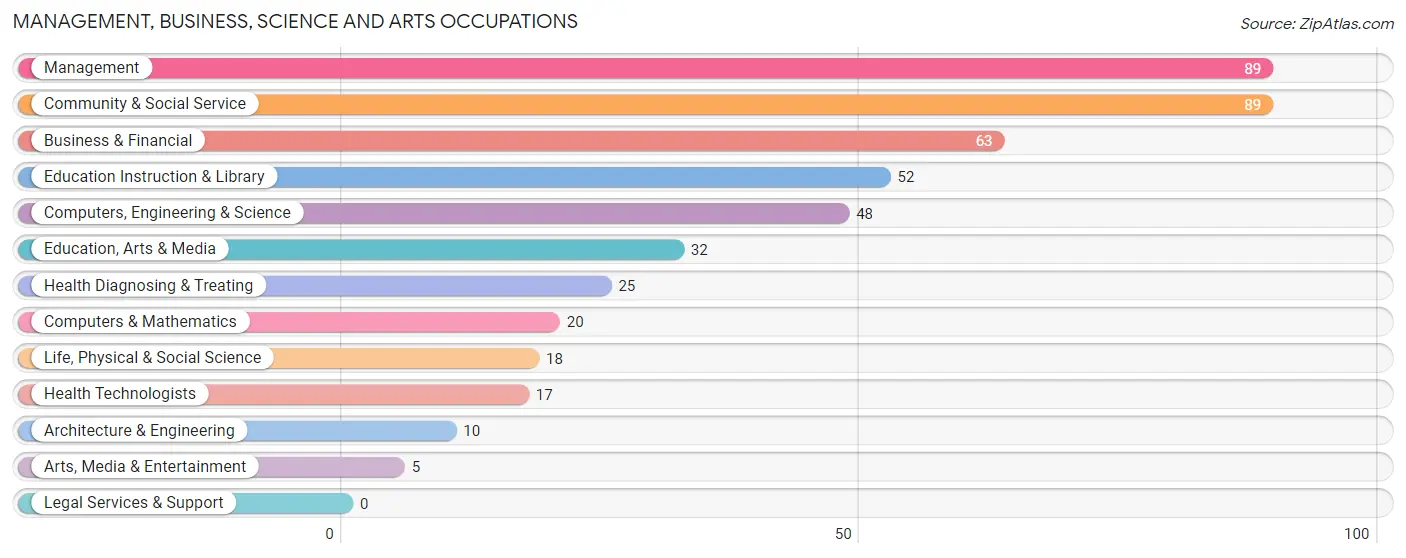
Management, Business, Science and Arts Occupations
The most common Management, Business, Science and Arts occupations in Rising Sun are Management (89 | 8.2%), Community & Social Service (89 | 8.2%), Business & Financial (63 | 5.8%), Education Instruction & Library (52 | 4.8%), and Computers, Engineering & Science (48 | 4.4%).
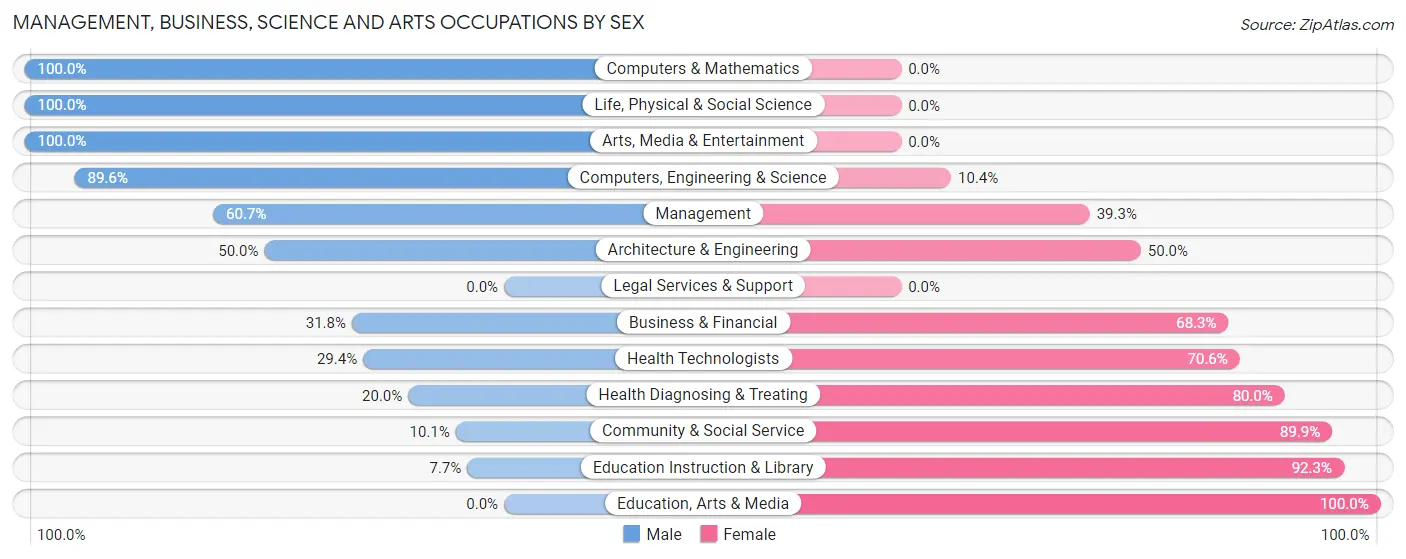
Management, Business, Science and Arts Occupations by Sex
Within the Management, Business, Science and Arts occupations in Rising Sun, the most male-oriented occupations are Computers & Mathematics (100.0%), Life, Physical & Social Science (100.0%), and Arts, Media & Entertainment (100.0%), while the most female-oriented occupations are Education, Arts & Media (100.0%), Education Instruction & Library (92.3%), and Community & Social Service (89.9%).
| Occupation | Male | Female |
| Management | 54 (60.7%) | 35 (39.3%) |
| Business & Financial | 20 (31.8%) | 43 (68.2%) |
| Computers, Engineering & Science | 43 (89.6%) | 5 (10.4%) |
| Computers & Mathematics | 20 (100.0%) | 0 (0.0%) |
| Architecture & Engineering | 5 (50.0%) | 5 (50.0%) |
| Life, Physical & Social Science | 18 (100.0%) | 0 (0.0%) |
| Community & Social Service | 9 (10.1%) | 80 (89.9%) |
| Education, Arts & Media | 0 (0.0%) | 32 (100.0%) |
| Legal Services & Support | 0 (0.0%) | 0 (0.0%) |
| Education Instruction & Library | 4 (7.7%) | 48 (92.3%) |
| Arts, Media & Entertainment | 5 (100.0%) | 0 (0.0%) |
| Health Diagnosing & Treating | 5 (20.0%) | 20 (80.0%) |
| Health Technologists | 5 (29.4%) | 12 (70.6%) |
| Total (Category) | 131 (41.7%) | 183 (58.3%) |
| Total (Overall) | 535 (49.2%) | 552 (50.8%) |
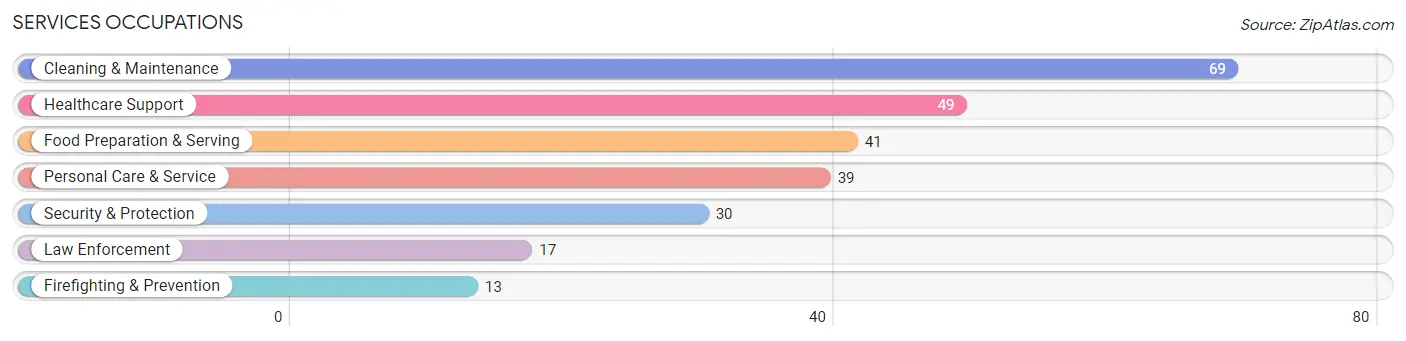
Services Occupations
The most common Services occupations in Rising Sun are Cleaning & Maintenance (69 | 6.4%), Healthcare Support (49 | 4.5%), Food Preparation & Serving (41 | 3.8%), Personal Care & Service (39 | 3.6%), and Security & Protection (30 | 2.8%).
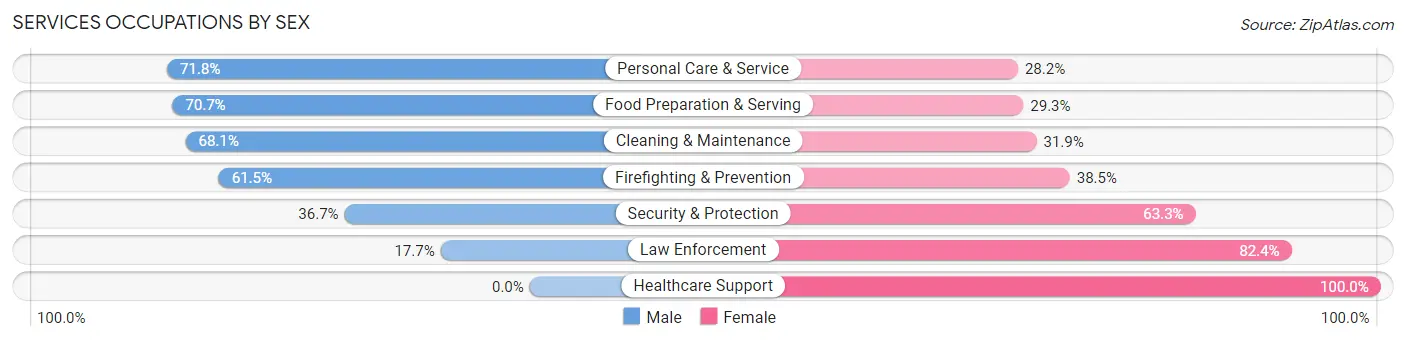
Services Occupations by Sex
Within the Services occupations in Rising Sun, the most male-oriented occupations are Personal Care & Service (71.8%), Food Preparation & Serving (70.7%), and Cleaning & Maintenance (68.1%), while the most female-oriented occupations are Healthcare Support (100.0%), Law Enforcement (82.4%), and Security & Protection (63.3%).
| Occupation | Male | Female |
| Healthcare Support | 0 (0.0%) | 49 (100.0%) |
| Security & Protection | 11 (36.7%) | 19 (63.3%) |
| Firefighting & Prevention | 8 (61.5%) | 5 (38.5%) |
| Law Enforcement | 3 (17.6%) | 14 (82.4%) |
| Food Preparation & Serving | 29 (70.7%) | 12 (29.3%) |
| Cleaning & Maintenance | 47 (68.1%) | 22 (31.9%) |
| Personal Care & Service | 28 (71.8%) | 11 (28.2%) |
| Total (Category) | 115 (50.4%) | 113 (49.6%) |
| Total (Overall) | 535 (49.2%) | 552 (50.8%) |
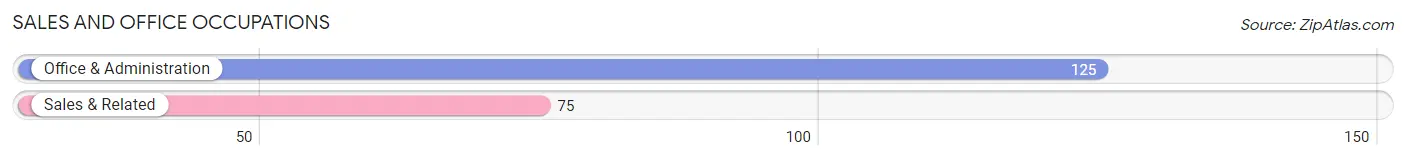
Sales and Office Occupations
The most common Sales and Office occupations in Rising Sun are Office & Administration (125 | 11.5%), and Sales & Related (75 | 6.9%).
Sales and Office Occupations by Sex
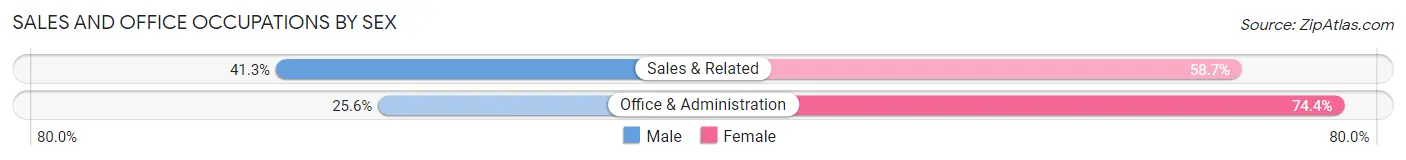
| Occupation | Male | Female |
| Sales & Related | 31 (41.3%) | 44 (58.7%) |
| Office & Administration | 32 (25.6%) | 93 (74.4%) |
| Total (Category) | 63 (31.5%) | 137 (68.5%) |
| Total (Overall) | 535 (49.2%) | 552 (50.8%) |
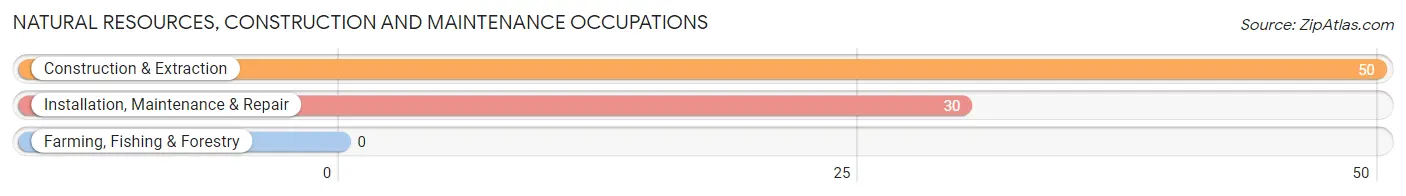
Natural Resources, Construction and Maintenance Occupations
The most common Natural Resources, Construction and Maintenance occupations in Rising Sun are Construction & Extraction (50 | 4.6%), and Installation, Maintenance & Repair (30 | 2.8%).
Natural Resources, Construction and Maintenance Occupations by Sex
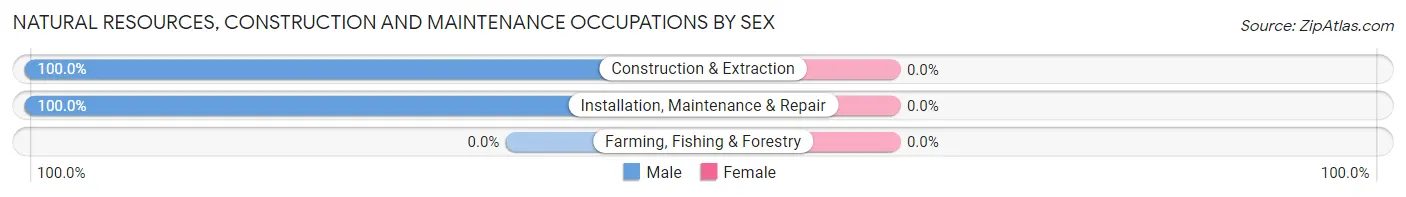
| Occupation | Male | Female |
| Farming, Fishing & Forestry | 0 (0.0%) | 0 (0.0%) |
| Construction & Extraction | 50 (100.0%) | 0 (0.0%) |
| Installation, Maintenance & Repair | 30 (100.0%) | 0 (0.0%) |
| Total (Category) | 80 (100.0%) | 0 (0.0%) |
| Total (Overall) | 535 (49.2%) | 552 (50.8%) |
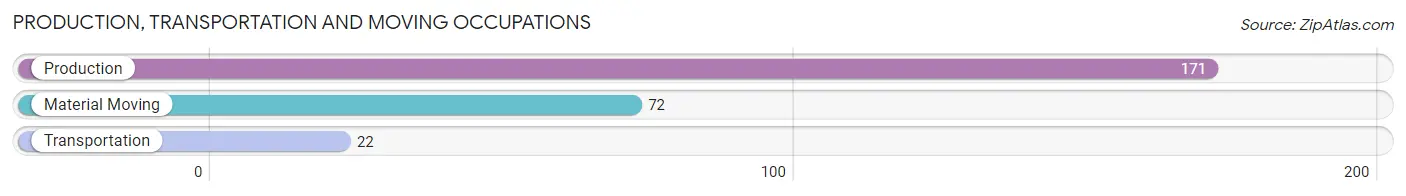
Production, Transportation and Moving Occupations
The most common Production, Transportation and Moving occupations in Rising Sun are Production (171 | 15.7%), Material Moving (72 | 6.6%), and Transportation (22 | 2.0%).
Production, Transportation and Moving Occupations by Sex
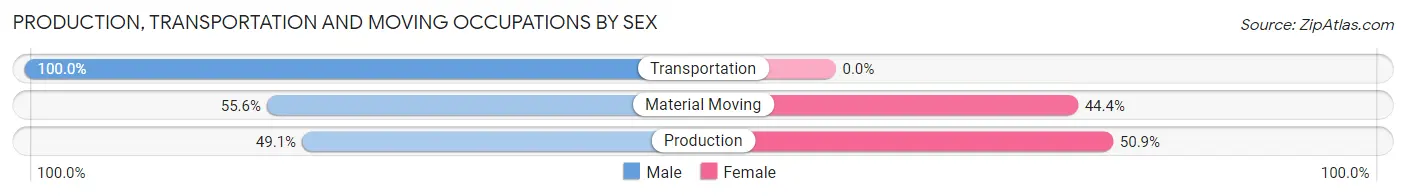
| Occupation | Male | Female |
| Production | 84 (49.1%) | 87 (50.9%) |
| Transportation | 22 (100.0%) | 0 (0.0%) |
| Material Moving | 40 (55.6%) | 32 (44.4%) |
| Total (Category) | 146 (55.1%) | 119 (44.9%) |
| Total (Overall) | 535 (49.2%) | 552 (50.8%) |
Employment Industries by Sex in Rising Sun
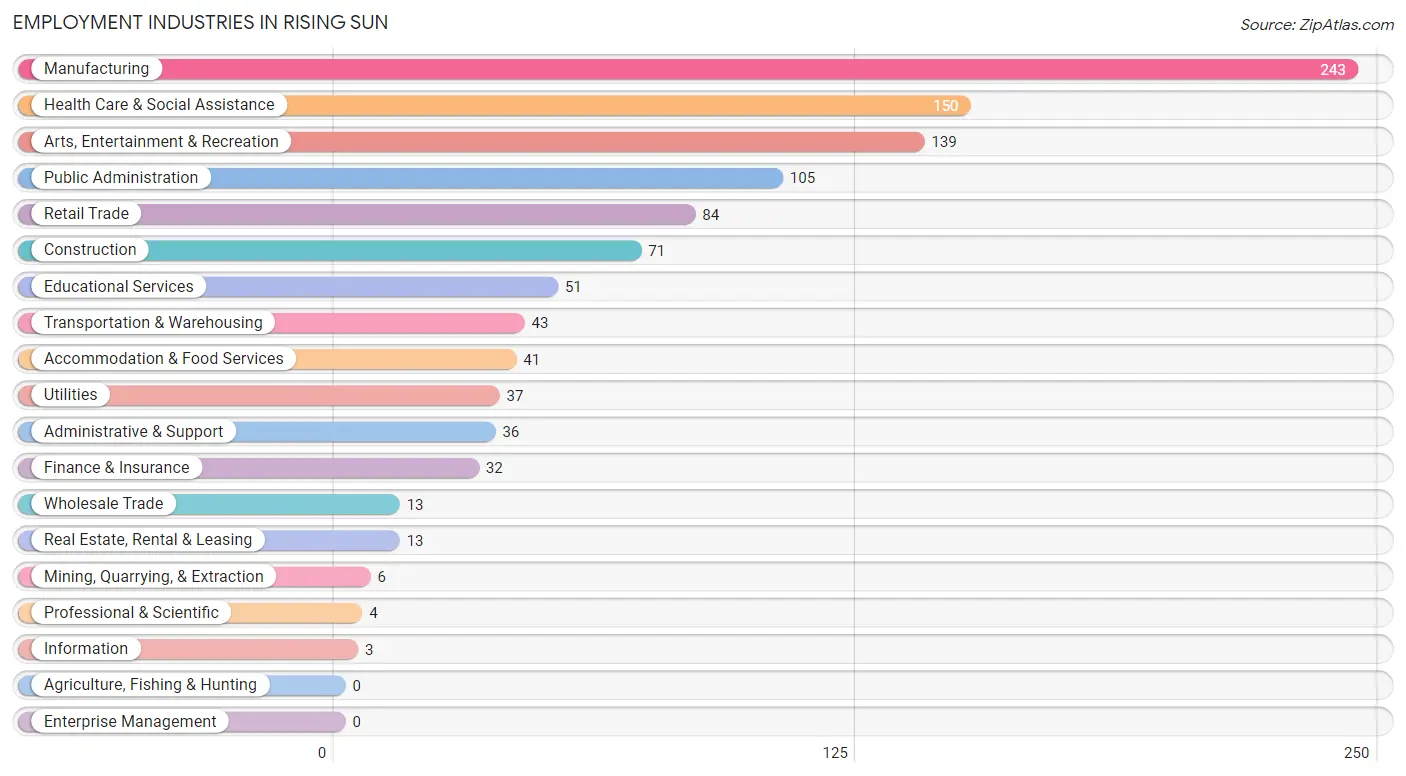
Employment Industries in Rising Sun
The major employment industries in Rising Sun include Manufacturing (243 | 22.4%), Health Care & Social Assistance (150 | 13.8%), Arts, Entertainment & Recreation (139 | 12.8%), Public Administration (105 | 9.7%), and Retail Trade (84 | 7.7%).
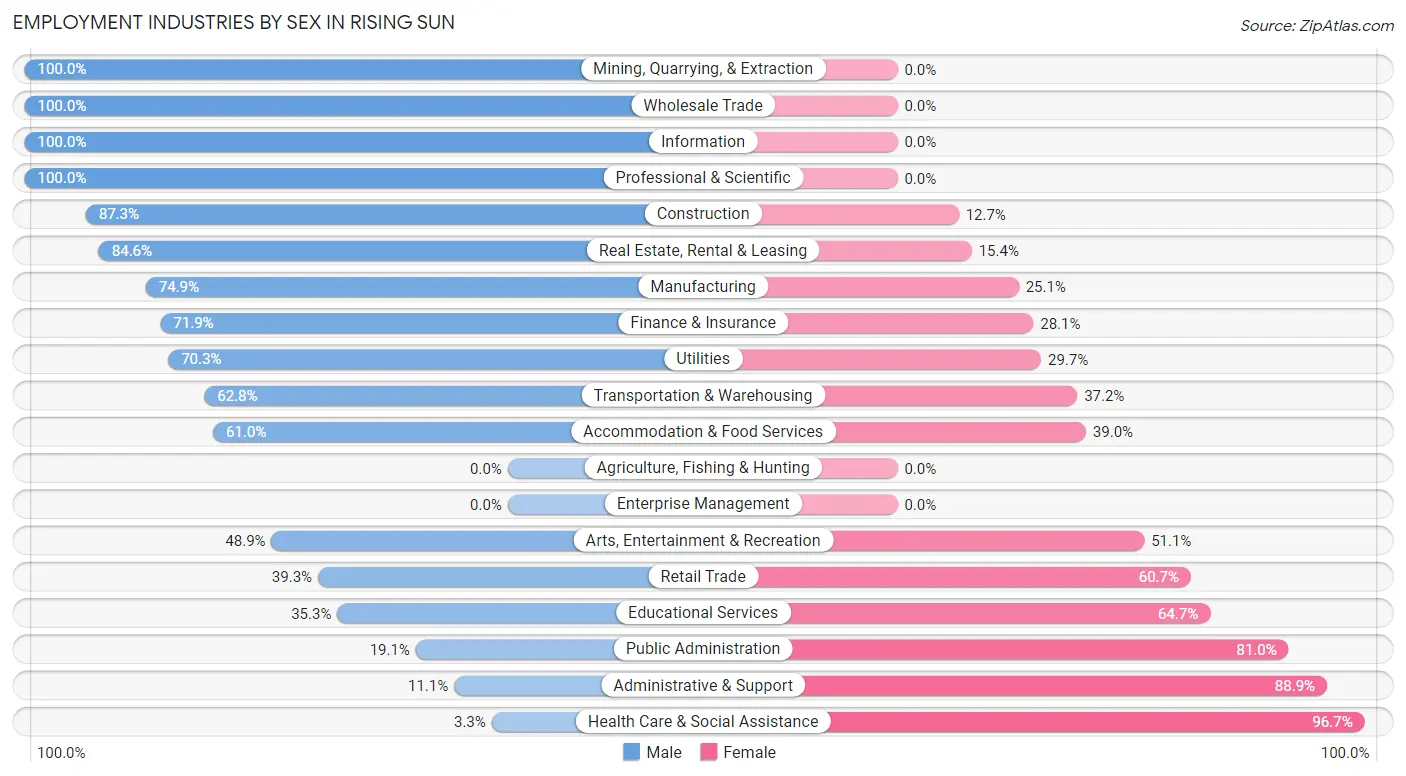
Employment Industries by Sex in Rising Sun
The Rising Sun industries that see more men than women are Mining, Quarrying, & Extraction (100.0%), Wholesale Trade (100.0%), and Information (100.0%), whereas the industries that tend to have a higher number of women are Health Care & Social Assistance (96.7%), Administrative & Support (88.9%), and Public Administration (80.9%).
| Industry | Male | Female |
| Agriculture, Fishing & Hunting | 0 (0.0%) | 0 (0.0%) |
| Mining, Quarrying, & Extraction | 6 (100.0%) | 0 (0.0%) |
| Construction | 62 (87.3%) | 9 (12.7%) |
| Manufacturing | 182 (74.9%) | 61 (25.1%) |
| Wholesale Trade | 13 (100.0%) | 0 (0.0%) |
| Retail Trade | 33 (39.3%) | 51 (60.7%) |
| Transportation & Warehousing | 27 (62.8%) | 16 (37.2%) |
| Utilities | 26 (70.3%) | 11 (29.7%) |
| Information | 3 (100.0%) | 0 (0.0%) |
| Finance & Insurance | 23 (71.9%) | 9 (28.1%) |
| Real Estate, Rental & Leasing | 11 (84.6%) | 2 (15.4%) |
| Professional & Scientific | 4 (100.0%) | 0 (0.0%) |
| Enterprise Management | 0 (0.0%) | 0 (0.0%) |
| Administrative & Support | 4 (11.1%) | 32 (88.9%) |
| Educational Services | 18 (35.3%) | 33 (64.7%) |
| Health Care & Social Assistance | 5 (3.3%) | 145 (96.7%) |
| Arts, Entertainment & Recreation | 68 (48.9%) | 71 (51.1%) |
| Accommodation & Food Services | 25 (61.0%) | 16 (39.0%) |
| Public Administration | 20 (19.1%) | 85 (80.9%) |
| Total | 535 (49.2%) | 552 (50.8%) |
Education in Rising Sun
School Enrollment in Rising Sun
The most common levels of schooling among the 527 students in Rising Sun are college / undergraduate (172 | 32.6%), elementary school (133 | 25.2%), and high school (124 | 23.5%).
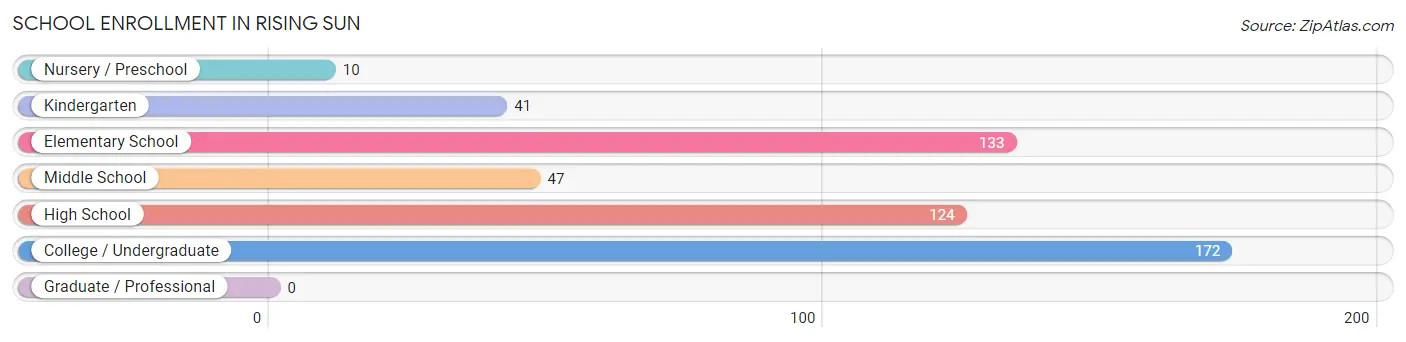
| School Level | # Students | % Students |
| Nursery / Preschool | 10 | 1.9% |
| Kindergarten | 41 | 7.8% |
| Elementary School | 133 | 25.2% |
| Middle School | 47 | 8.9% |
| High School | 124 | 23.5% |
| College / Undergraduate | 172 | 32.6% |
| Graduate / Professional | 0 | 0.0% |
| Total | 527 | 100.0% |
School Enrollment by Age by Funding Source in Rising Sun
Out of a total of 527 students who are enrolled in schools in Rising Sun, 28 (5.3%) attend a private institution, while the remaining 499 (94.7%) are enrolled in public schools. The age group of 18 to 19 year olds has the highest likelihood of being enrolled in private schools, with 28 (32.6% in the age bracket) enrolled. Conversely, the age group of 5 to 9 year old has the lowest likelihood of being enrolled in a private school, with 169 (100.0% in the age bracket) attending a public institution.
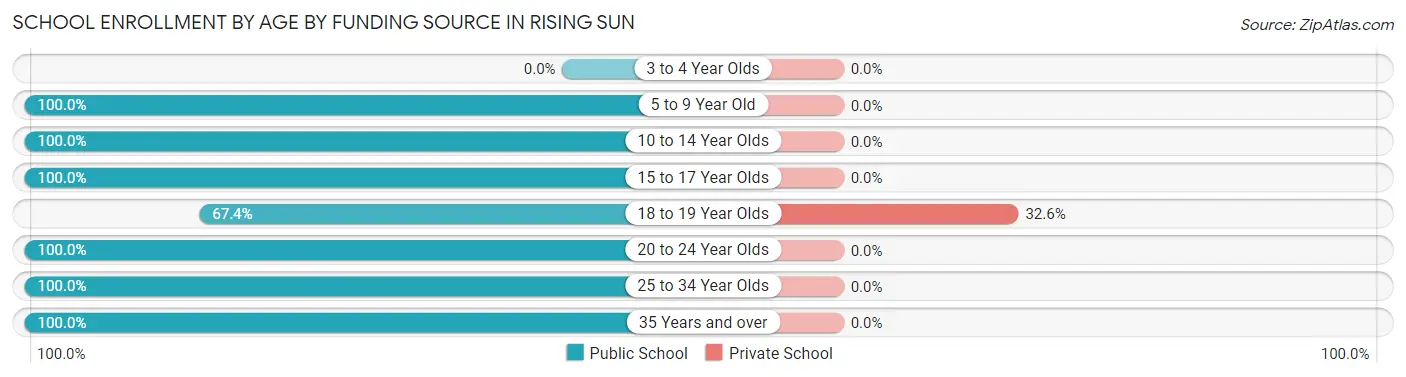
| Age Bracket | Public School | Private School |
| 3 to 4 Year Olds | 0 (0.0%) | 0 (0.0%) |
| 5 to 9 Year Old | 169 (100.0%) | 0 (0.0%) |
| 10 to 14 Year Olds | 59 (100.0%) | 0 (0.0%) |
| 15 to 17 Year Olds | 74 (100.0%) | 0 (0.0%) |
| 18 to 19 Year Olds | 58 (67.4%) | 28 (32.6%) |
| 20 to 24 Year Olds | 14 (100.0%) | 0 (0.0%) |
| 25 to 34 Year Olds | 97 (100.0%) | 0 (0.0%) |
| 35 Years and over | 28 (100.0%) | 0 (0.0%) |
| Total | 499 (94.7%) | 28 (5.3%) |
Educational Attainment by Field of Study in Rising Sun
Science & technology (85 | 28.3%), business (61 | 20.3%), education (45 | 15.0%), engineering (24 | 8.0%), and arts & humanities (19 | 6.3%) are the most common fields of study among 300 individuals in Rising Sun who have obtained a bachelor's degree or higher.
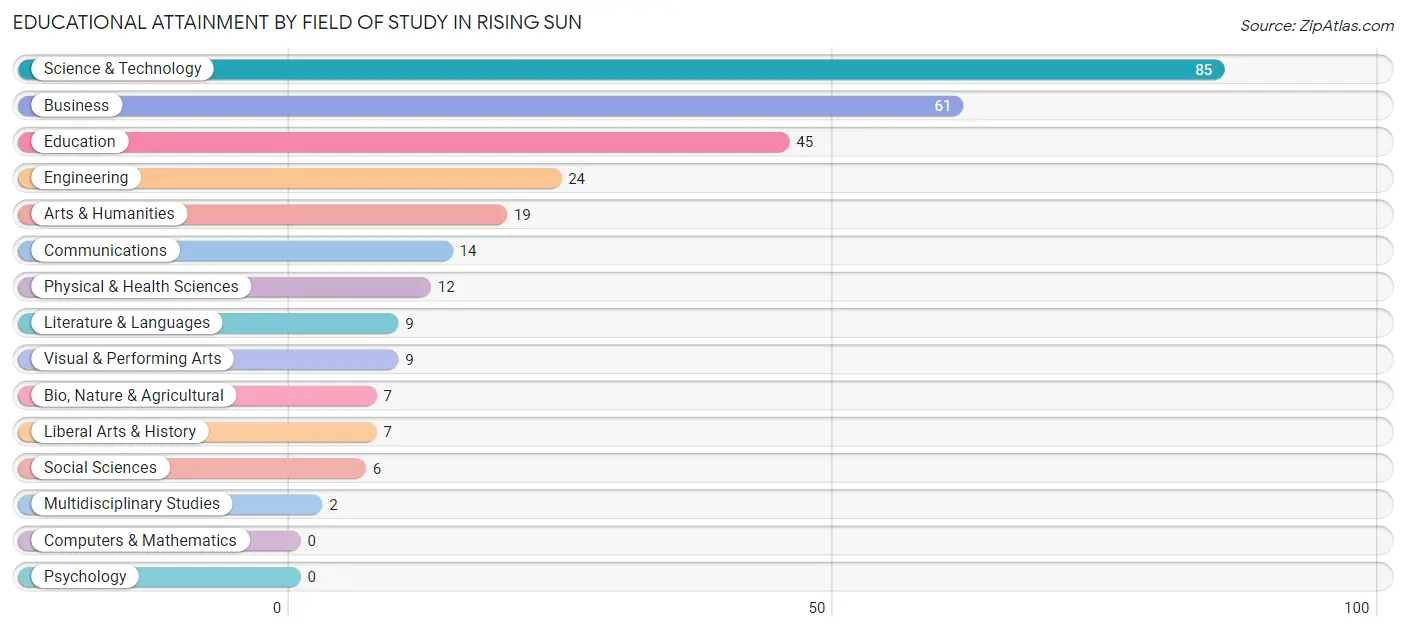
| Field of Study | # Graduates | % Graduates |
| Computers & Mathematics | 0 | 0.0% |
| Bio, Nature & Agricultural | 7 | 2.3% |
| Physical & Health Sciences | 12 | 4.0% |
| Psychology | 0 | 0.0% |
| Social Sciences | 6 | 2.0% |
| Engineering | 24 | 8.0% |
| Multidisciplinary Studies | 2 | 0.7% |
| Science & Technology | 85 | 28.3% |
| Business | 61 | 20.3% |
| Education | 45 | 15.0% |
| Literature & Languages | 9 | 3.0% |
| Liberal Arts & History | 7 | 2.3% |
| Visual & Performing Arts | 9 | 3.0% |
| Communications | 14 | 4.7% |
| Arts & Humanities | 19 | 6.3% |
| Total | 300 | 100.0% |
Transportation & Commute in Rising Sun
Vehicle Availability by Sex in Rising Sun
The most prevalent vehicle ownership categories in Rising Sun are males with 2 vehicles (189, accounting for 37.1%) and females with 2 vehicles (228, making up 34.2%).
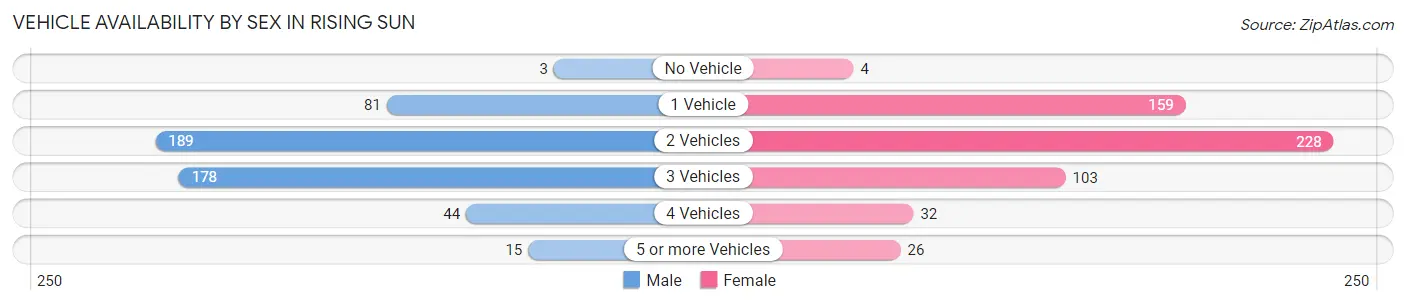
| Vehicles Available | Male | Female |
| No Vehicle | 3 (0.6%) | 4 (0.7%) |
| 1 Vehicle | 81 (15.9%) | 159 (28.8%) |
| 2 Vehicles | 189 (37.1%) | 228 (41.3%) |
| 3 Vehicles | 178 (34.9%) | 103 (18.7%) |
| 4 Vehicles | 44 (8.6%) | 32 (5.8%) |
| 5 or more Vehicles | 15 (2.9%) | 26 (4.7%) |
| Total | 510 (100.0%) | 552 (100.0%) |
Commute Time in Rising Sun
The most frequently occuring commute durations in Rising Sun are 5 to 9 minutes (209 commuters, 20.6%), less than 5 minutes (138 commuters, 13.6%), and 60 to 89 minutes (133 commuters, 13.1%).
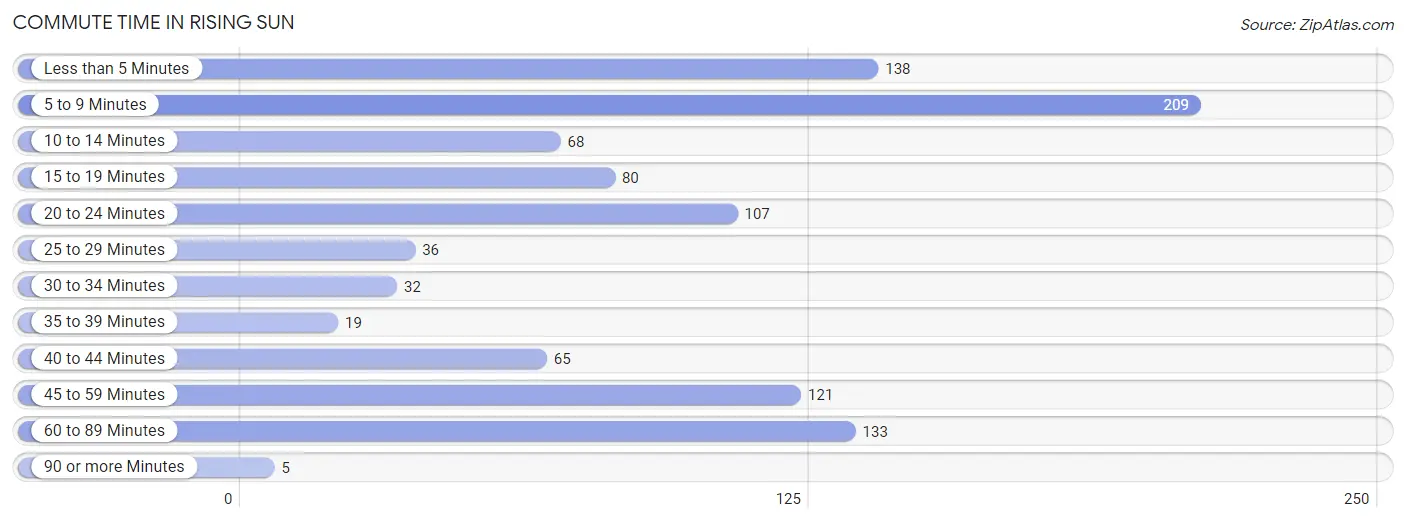
| Commute Time | # Commuters | % Commuters |
| Less than 5 Minutes | 138 | 13.6% |
| 5 to 9 Minutes | 209 | 20.6% |
| 10 to 14 Minutes | 68 | 6.7% |
| 15 to 19 Minutes | 80 | 7.9% |
| 20 to 24 Minutes | 107 | 10.6% |
| 25 to 29 Minutes | 36 | 3.5% |
| 30 to 34 Minutes | 32 | 3.2% |
| 35 to 39 Minutes | 19 | 1.9% |
| 40 to 44 Minutes | 65 | 6.4% |
| 45 to 59 Minutes | 121 | 11.9% |
| 60 to 89 Minutes | 133 | 13.1% |
| 90 or more Minutes | 5 | 0.5% |
Commute Time by Sex in Rising Sun
The most common commute times in Rising Sun are 60 to 89 minutes (68 commuters, 14.2%) for males and 5 to 9 minutes (142 commuters, 26.5%) for females.
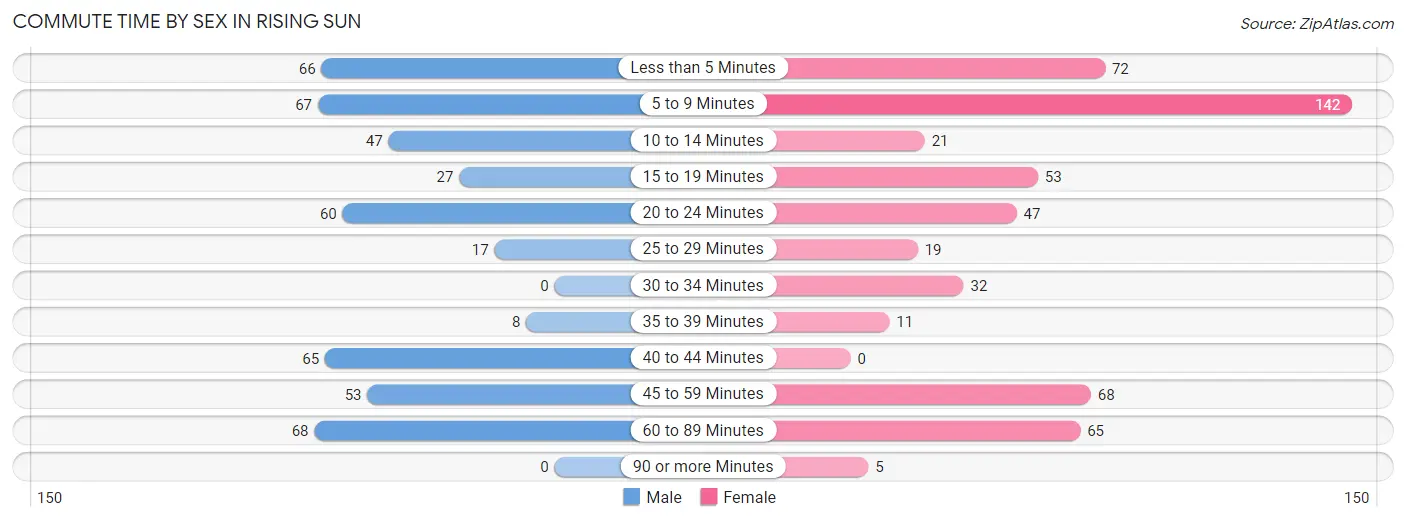
| Commute Time | Male | Female |
| Less than 5 Minutes | 66 (13.8%) | 72 (13.5%) |
| 5 to 9 Minutes | 67 (14.0%) | 142 (26.5%) |
| 10 to 14 Minutes | 47 (9.8%) | 21 (3.9%) |
| 15 to 19 Minutes | 27 (5.7%) | 53 (9.9%) |
| 20 to 24 Minutes | 60 (12.6%) | 47 (8.8%) |
| 25 to 29 Minutes | 17 (3.6%) | 19 (3.5%) |
| 30 to 34 Minutes | 0 (0.0%) | 32 (6.0%) |
| 35 to 39 Minutes | 8 (1.7%) | 11 (2.1%) |
| 40 to 44 Minutes | 65 (13.6%) | 0 (0.0%) |
| 45 to 59 Minutes | 53 (11.1%) | 68 (12.7%) |
| 60 to 89 Minutes | 68 (14.2%) | 65 (12.1%) |
| 90 or more Minutes | 0 (0.0%) | 5 (0.9%) |
Time of Departure to Work by Sex in Rising Sun
The most frequent times of departure to work in Rising Sun are 7:30 AM to 7:59 AM (91, 19.0%) for males and 5:30 AM to 5:59 AM (109, 20.4%) for females.
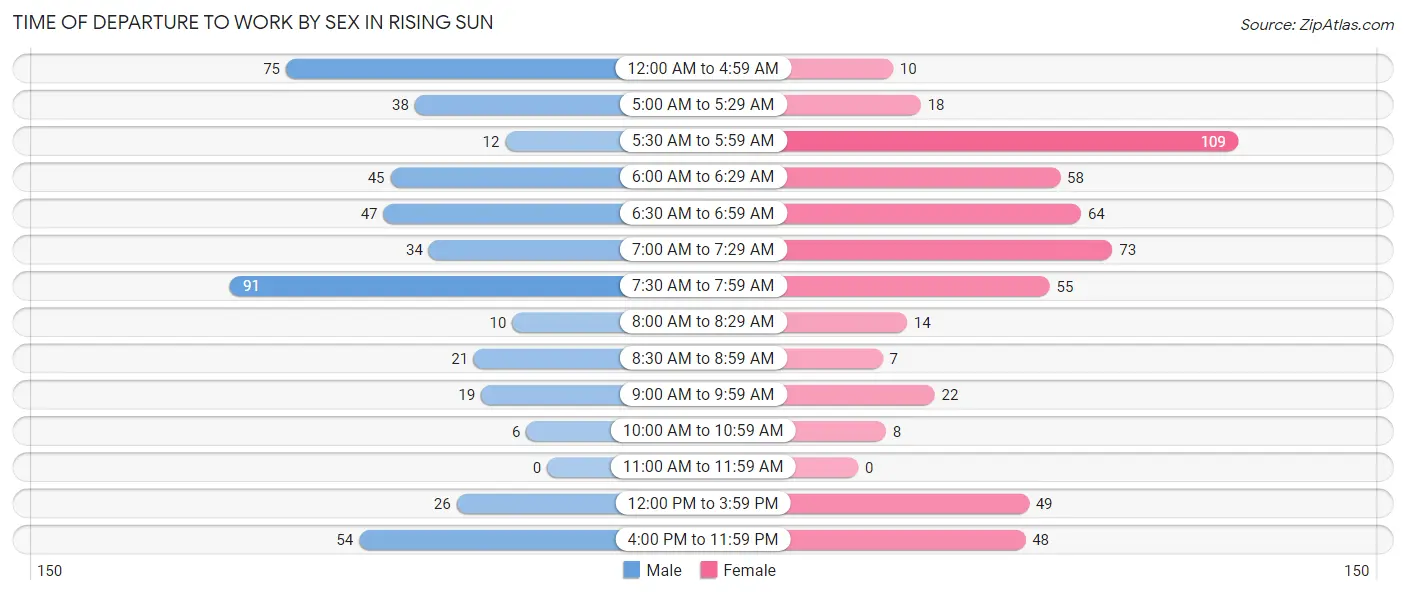
| Time of Departure | Male | Female |
| 12:00 AM to 4:59 AM | 75 (15.7%) | 10 (1.9%) |
| 5:00 AM to 5:29 AM | 38 (8.0%) | 18 (3.4%) |
| 5:30 AM to 5:59 AM | 12 (2.5%) | 109 (20.4%) |
| 6:00 AM to 6:29 AM | 45 (9.4%) | 58 (10.8%) |
| 6:30 AM to 6:59 AM | 47 (9.8%) | 64 (12.0%) |
| 7:00 AM to 7:29 AM | 34 (7.1%) | 73 (13.6%) |
| 7:30 AM to 7:59 AM | 91 (19.0%) | 55 (10.3%) |
| 8:00 AM to 8:29 AM | 10 (2.1%) | 14 (2.6%) |
| 8:30 AM to 8:59 AM | 21 (4.4%) | 7 (1.3%) |
| 9:00 AM to 9:59 AM | 19 (4.0%) | 22 (4.1%) |
| 10:00 AM to 10:59 AM | 6 (1.3%) | 8 (1.5%) |
| 11:00 AM to 11:59 AM | 0 (0.0%) | 0 (0.0%) |
| 12:00 PM to 3:59 PM | 26 (5.4%) | 49 (9.2%) |
| 4:00 PM to 11:59 PM | 54 (11.3%) | 48 (9.0%) |
| Total | 478 (100.0%) | 535 (100.0%) |
Housing Occupancy in Rising Sun
Occupancy by Ownership in Rising Sun
Of the total 1,056 dwellings in Rising Sun, owner-occupied units account for 685 (64.9%), while renter-occupied units make up 371 (35.1%).
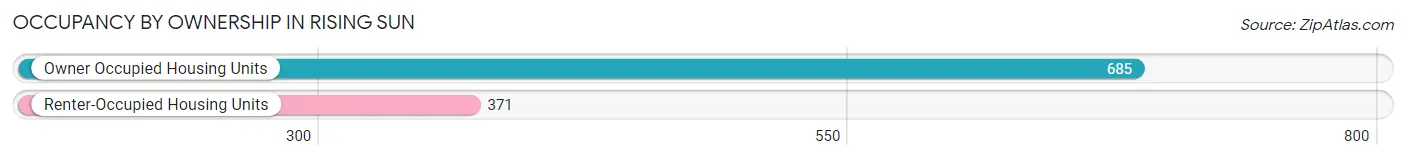
| Occupancy | # Housing Units | % Housing Units |
| Owner Occupied Housing Units | 685 | 64.9% |
| Renter-Occupied Housing Units | 371 | 35.1% |
| Total Occupied Housing Units | 1,056 | 100.0% |
Occupancy by Household Size in Rising Sun
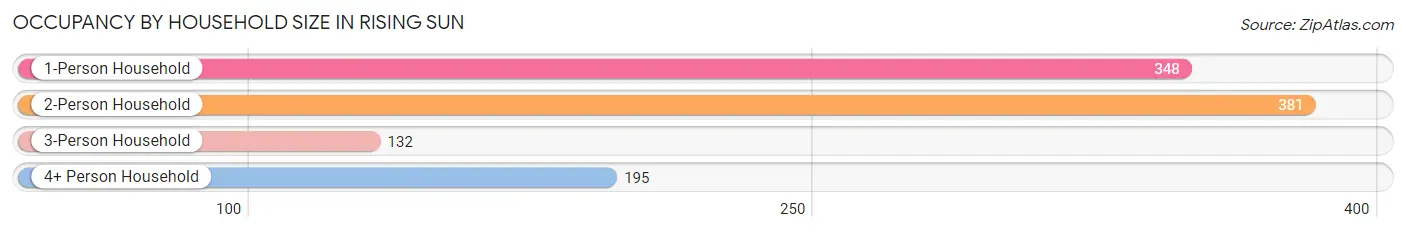
| Household Size | # Housing Units | % Housing Units |
| 1-Person Household | 348 | 33.0% |
| 2-Person Household | 381 | 36.1% |
| 3-Person Household | 132 | 12.5% |
| 4+ Person Household | 195 | 18.5% |
| Total Housing Units | 1,056 | 100.0% |
Occupancy by Ownership by Household Size in Rising Sun
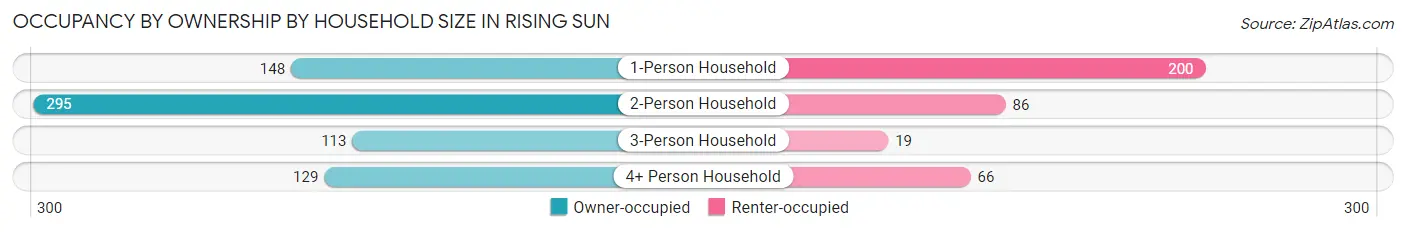
| Household Size | Owner-occupied | Renter-occupied |
| 1-Person Household | 148 (42.5%) | 200 (57.5%) |
| 2-Person Household | 295 (77.4%) | 86 (22.6%) |
| 3-Person Household | 113 (85.6%) | 19 (14.4%) |
| 4+ Person Household | 129 (66.1%) | 66 (33.9%) |
| Total Housing Units | 685 (64.9%) | 371 (35.1%) |
Occupancy by Educational Attainment in Rising Sun
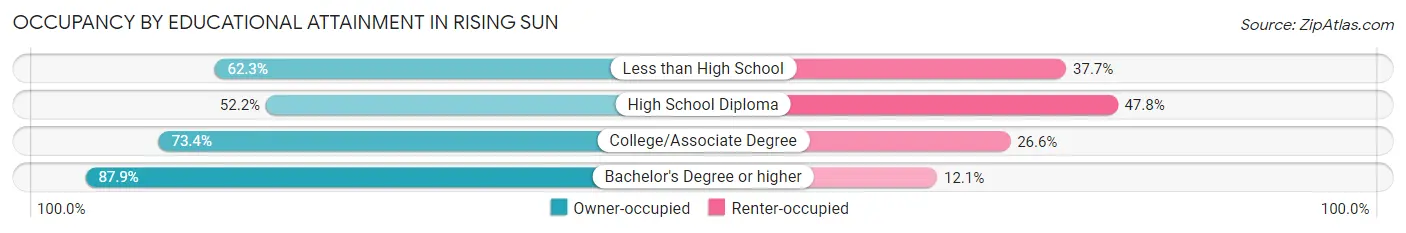
| Household Size | Owner-occupied | Renter-occupied |
| Less than High School | 48 (62.3%) | 29 (37.7%) |
| High School Diploma | 242 (52.2%) | 222 (47.8%) |
| College/Associate Degree | 293 (73.4%) | 106 (26.6%) |
| Bachelor's Degree or higher | 102 (87.9%) | 14 (12.1%) |
Occupancy by Age of Householder in Rising Sun
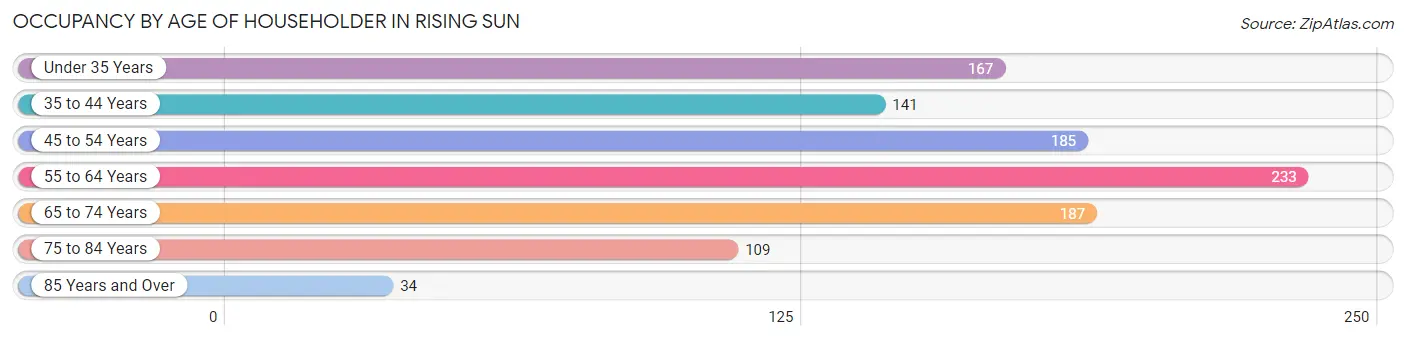
| Age Bracket | # Households | % Households |
| Under 35 Years | 167 | 15.8% |
| 35 to 44 Years | 141 | 13.4% |
| 45 to 54 Years | 185 | 17.5% |
| 55 to 64 Years | 233 | 22.1% |
| 65 to 74 Years | 187 | 17.7% |
| 75 to 84 Years | 109 | 10.3% |
| 85 Years and Over | 34 | 3.2% |
| Total | 1,056 | 100.0% |
Housing Finances in Rising Sun
Median Income by Occupancy in Rising Sun
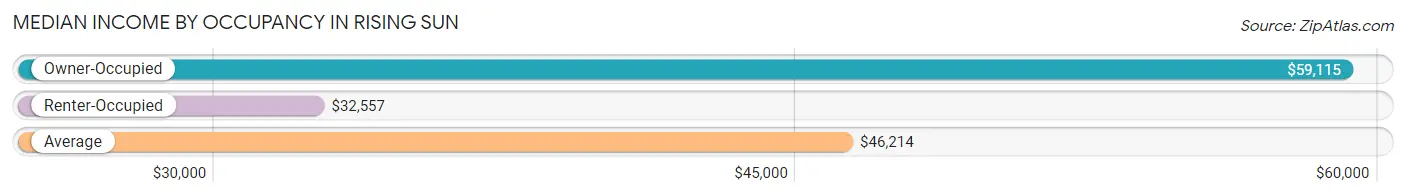
| Occupancy Type | # Households | Median Income |
| Owner-Occupied | 685 (64.9%) | $59,115 |
| Renter-Occupied | 371 (35.1%) | $32,557 |
| Average | 1,056 (100.0%) | $46,214 |
Occupancy by Householder Income Bracket in Rising Sun
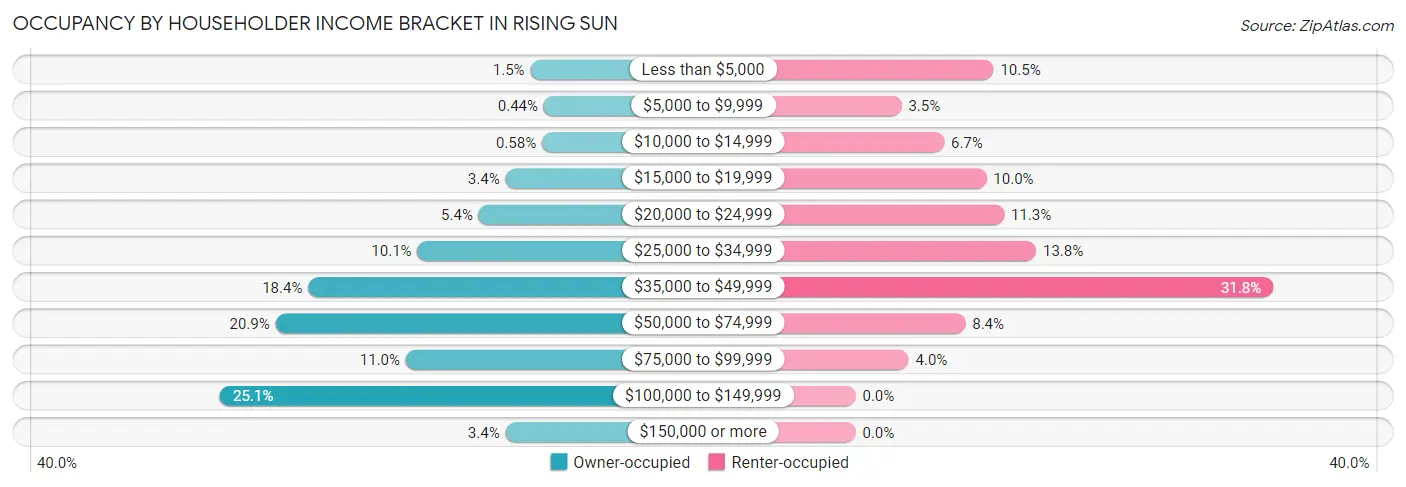
| Income Bracket | Owner-occupied | Renter-occupied |
| Less than $5,000 | 10 (1.5%) | 39 (10.5%) |
| $5,000 to $9,999 | 3 (0.4%) | 13 (3.5%) |
| $10,000 to $14,999 | 4 (0.6%) | 25 (6.7%) |
| $15,000 to $19,999 | 23 (3.4%) | 37 (10.0%) |
| $20,000 to $24,999 | 37 (5.4%) | 42 (11.3%) |
| $25,000 to $34,999 | 69 (10.1%) | 51 (13.8%) |
| $35,000 to $49,999 | 126 (18.4%) | 118 (31.8%) |
| $50,000 to $74,999 | 143 (20.9%) | 31 (8.4%) |
| $75,000 to $99,999 | 75 (11.0%) | 15 (4.0%) |
| $100,000 to $149,999 | 172 (25.1%) | 0 (0.0%) |
| $150,000 or more | 23 (3.4%) | 0 (0.0%) |
| Total | 685 (100.0%) | 371 (100.0%) |
Monthly Housing Cost Tiers in Rising Sun
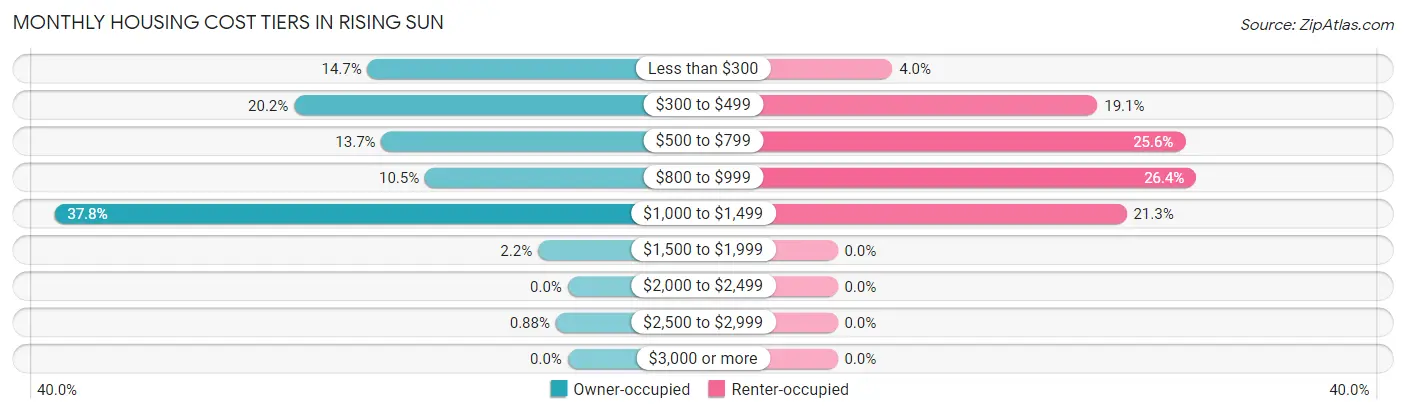
| Monthly Cost | Owner-occupied | Renter-occupied |
| Less than $300 | 101 (14.7%) | 15 (4.0%) |
| $300 to $499 | 138 (20.2%) | 71 (19.1%) |
| $500 to $799 | 94 (13.7%) | 95 (25.6%) |
| $800 to $999 | 72 (10.5%) | 98 (26.4%) |
| $1,000 to $1,499 | 259 (37.8%) | 79 (21.3%) |
| $1,500 to $1,999 | 15 (2.2%) | 0 (0.0%) |
| $2,000 to $2,499 | 0 (0.0%) | 0 (0.0%) |
| $2,500 to $2,999 | 6 (0.9%) | 0 (0.0%) |
| $3,000 or more | 0 (0.0%) | 0 (0.0%) |
| Total | 685 (100.0%) | 371 (100.0%) |
Physical Housing Characteristics in Rising Sun
Housing Structures in Rising Sun
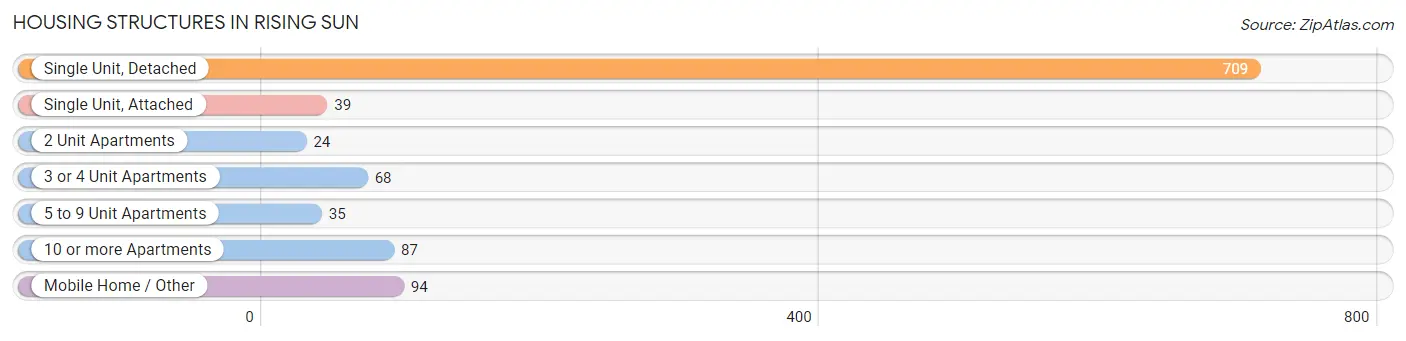
| Structure Type | # Housing Units | % Housing Units |
| Single Unit, Detached | 709 | 67.1% |
| Single Unit, Attached | 39 | 3.7% |
| 2 Unit Apartments | 24 | 2.3% |
| 3 or 4 Unit Apartments | 68 | 6.4% |
| 5 to 9 Unit Apartments | 35 | 3.3% |
| 10 or more Apartments | 87 | 8.2% |
| Mobile Home / Other | 94 | 8.9% |
| Total | 1,056 | 100.0% |
Housing Structures by Occupancy in Rising Sun
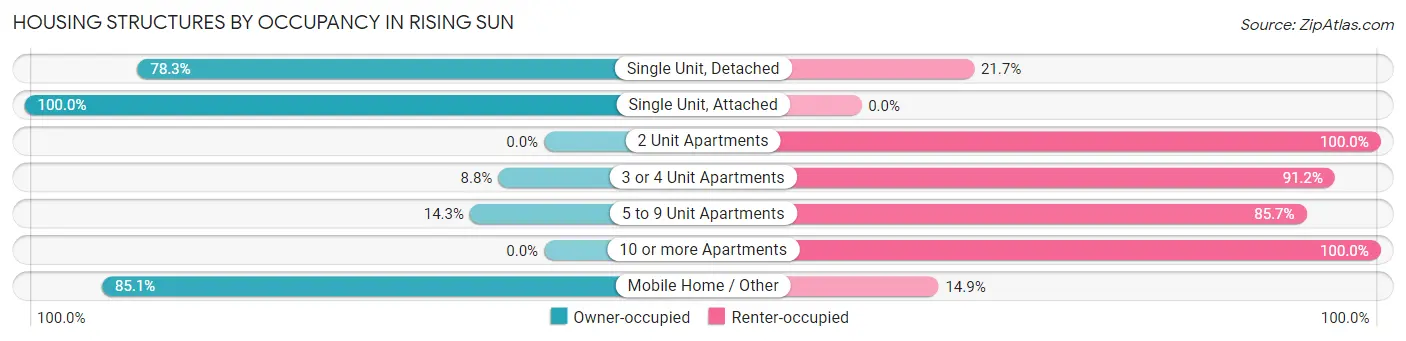
| Structure Type | Owner-occupied | Renter-occupied |
| Single Unit, Detached | 555 (78.3%) | 154 (21.7%) |
| Single Unit, Attached | 39 (100.0%) | 0 (0.0%) |
| 2 Unit Apartments | 0 (0.0%) | 24 (100.0%) |
| 3 or 4 Unit Apartments | 6 (8.8%) | 62 (91.2%) |
| 5 to 9 Unit Apartments | 5 (14.3%) | 30 (85.7%) |
| 10 or more Apartments | 0 (0.0%) | 87 (100.0%) |
| Mobile Home / Other | 80 (85.1%) | 14 (14.9%) |
| Total | 685 (64.9%) | 371 (35.1%) |
Housing Structures by Number of Rooms in Rising Sun
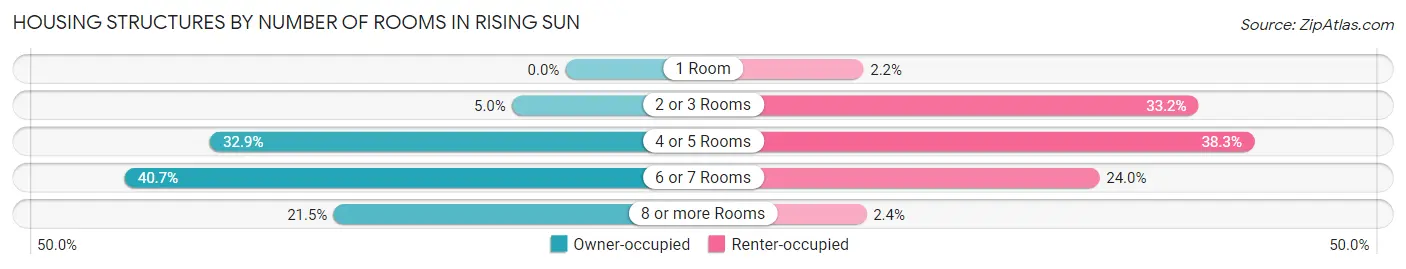
| Number of Rooms | Owner-occupied | Renter-occupied |
| 1 Room | 0 (0.0%) | 8 (2.2%) |
| 2 or 3 Rooms | 34 (5.0%) | 123 (33.2%) |
| 4 or 5 Rooms | 225 (32.9%) | 142 (38.3%) |
| 6 or 7 Rooms | 279 (40.7%) | 89 (24.0%) |
| 8 or more Rooms | 147 (21.5%) | 9 (2.4%) |
| Total | 685 (100.0%) | 371 (100.0%) |
Housing Structure by Heating Type in Rising Sun
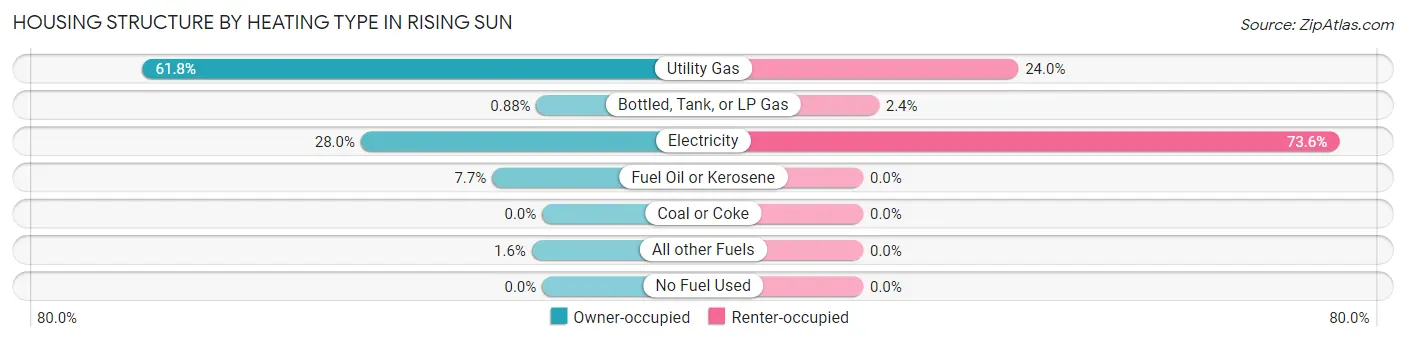
| Heating Type | Owner-occupied | Renter-occupied |
| Utility Gas | 423 (61.8%) | 89 (24.0%) |
| Bottled, Tank, or LP Gas | 6 (0.9%) | 9 (2.4%) |
| Electricity | 192 (28.0%) | 273 (73.6%) |
| Fuel Oil or Kerosene | 53 (7.7%) | 0 (0.0%) |
| Coal or Coke | 0 (0.0%) | 0 (0.0%) |
| All other Fuels | 11 (1.6%) | 0 (0.0%) |
| No Fuel Used | 0 (0.0%) | 0 (0.0%) |
| Total | 685 (100.0%) | 371 (100.0%) |
Household Vehicle Usage in Rising Sun
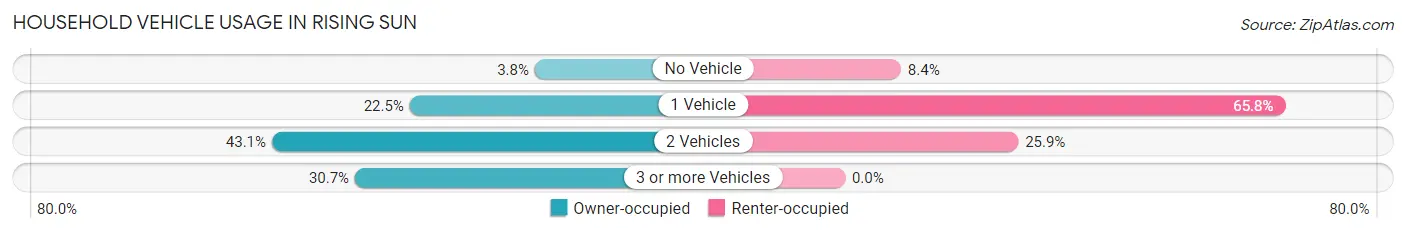
| Vehicles per Household | Owner-occupied | Renter-occupied |
| No Vehicle | 26 (3.8%) | 31 (8.4%) |
| 1 Vehicle | 154 (22.5%) | 244 (65.8%) |
| 2 Vehicles | 295 (43.1%) | 96 (25.9%) |
| 3 or more Vehicles | 210 (30.7%) | 0 (0.0%) |
| Total | 685 (100.0%) | 371 (100.0%) |
Real Estate & Mortgages in Rising Sun
Real Estate and Mortgage Overview in Rising Sun
| Characteristic | Without Mortgage | With Mortgage |
| Housing Units | 255 | 430 |
| Median Property Value | $120,600 | $138,500 |
| Median Household Income | $41,250 | $14 |
| Monthly Housing Costs | $331 | $0 |
| Real Estate Taxes | $704 | $13 |
Property Value by Mortgage Status in Rising Sun
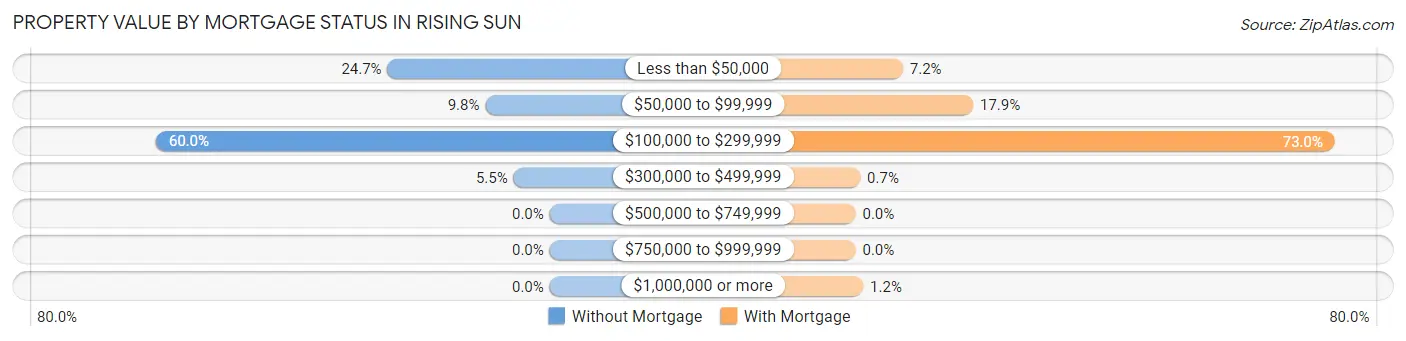
| Property Value | Without Mortgage | With Mortgage |
| Less than $50,000 | 63 (24.7%) | 31 (7.2%) |
| $50,000 to $99,999 | 25 (9.8%) | 77 (17.9%) |
| $100,000 to $299,999 | 153 (60.0%) | 314 (73.0%) |
| $300,000 to $499,999 | 14 (5.5%) | 3 (0.7%) |
| $500,000 to $749,999 | 0 (0.0%) | 0 (0.0%) |
| $750,000 to $999,999 | 0 (0.0%) | 0 (0.0%) |
| $1,000,000 or more | 0 (0.0%) | 5 (1.2%) |
| Total | 255 (100.0%) | 430 (100.0%) |
Household Income by Mortgage Status in Rising Sun
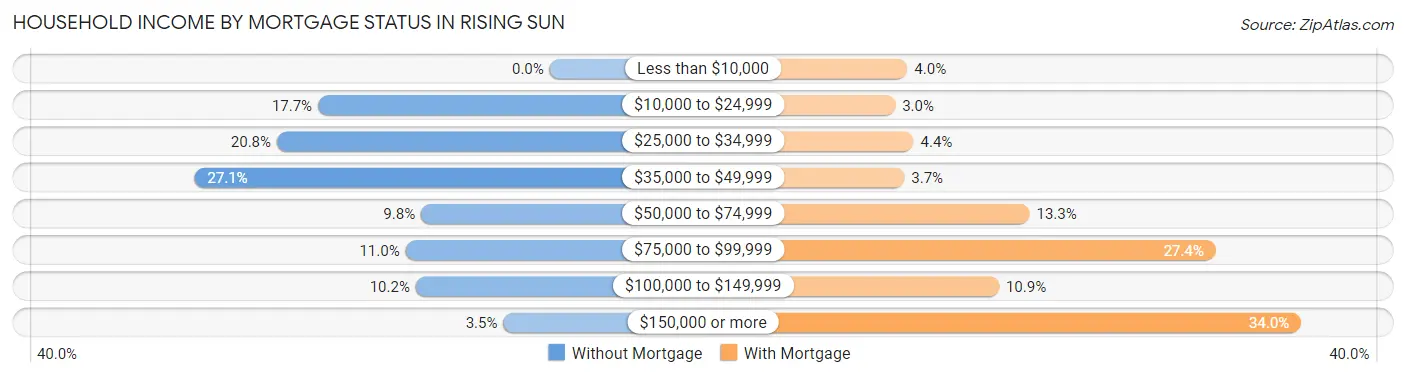
| Household Income | Without Mortgage | With Mortgage |
| Less than $10,000 | 0 (0.0%) | 17 (4.0%) |
| $10,000 to $24,999 | 45 (17.6%) | 13 (3.0%) |
| $25,000 to $34,999 | 53 (20.8%) | 19 (4.4%) |
| $35,000 to $49,999 | 69 (27.1%) | 16 (3.7%) |
| $50,000 to $74,999 | 25 (9.8%) | 57 (13.3%) |
| $75,000 to $99,999 | 28 (11.0%) | 118 (27.4%) |
| $100,000 to $149,999 | 26 (10.2%) | 47 (10.9%) |
| $150,000 or more | 9 (3.5%) | 146 (34.0%) |
| Total | 255 (100.0%) | 430 (100.0%) |
Property Value to Household Income Ratio in Rising Sun
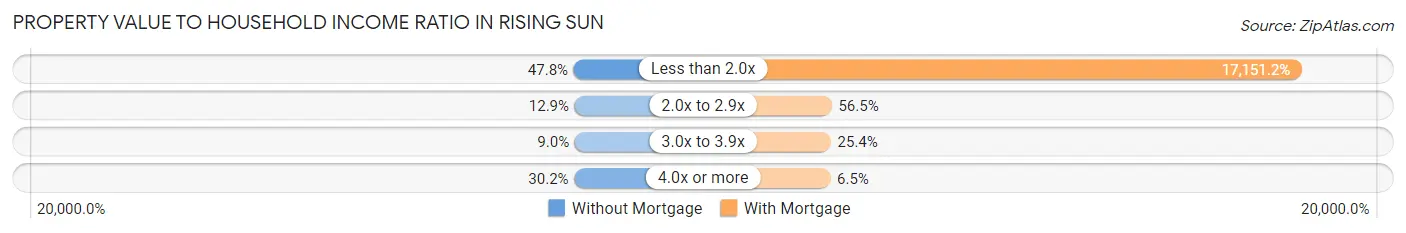
| Value-to-Income Ratio | Without Mortgage | With Mortgage |
| Less than 2.0x | 122 (47.8%) | 73,750 (17,151.2%) |
| 2.0x to 2.9x | 33 (12.9%) | 243 (56.5%) |
| 3.0x to 3.9x | 23 (9.0%) | 109 (25.4%) |
| 4.0x or more | 77 (30.2%) | 28 (6.5%) |
| Total | 255 (100.0%) | 430 (100.0%) |
Real Estate Taxes by Mortgage Status in Rising Sun
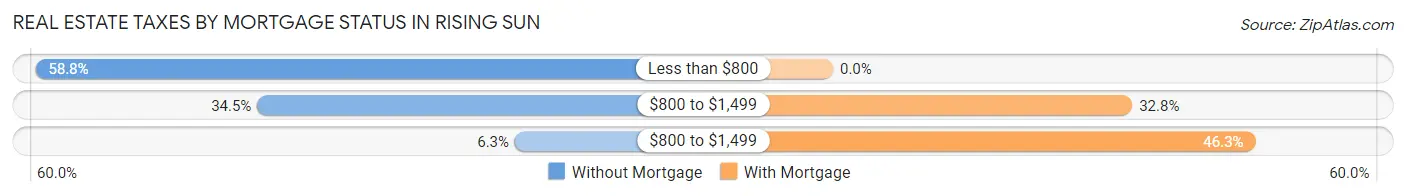
| Property Taxes | Without Mortgage | With Mortgage |
| Less than $800 | 150 (58.8%) | 0 (0.0%) |
| $800 to $1,499 | 88 (34.5%) | 141 (32.8%) |
| $800 to $1,499 | 16 (6.3%) | 199 (46.3%) |
| Total | 255 (100.0%) | 430 (100.0%) |
Health & Disability in Rising Sun
Health Insurance Coverage by Age in Rising Sun
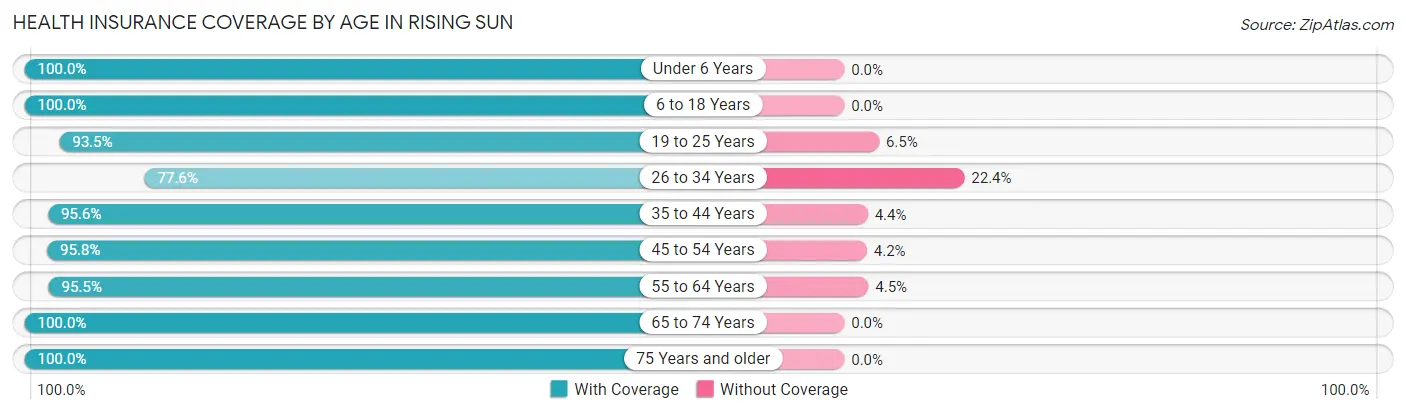
| Age Bracket | With Coverage | Without Coverage |
| Under 6 Years | 185 (100.0%) | 0 (0.0%) |
| 6 to 18 Years | 324 (100.0%) | 0 (0.0%) |
| 19 to 25 Years | 159 (93.5%) | 11 (6.5%) |
| 26 to 34 Years | 208 (77.6%) | 60 (22.4%) |
| 35 to 44 Years | 197 (95.6%) | 9 (4.4%) |
| 45 to 54 Years | 274 (95.8%) | 12 (4.2%) |
| 55 to 64 Years | 341 (95.5%) | 16 (4.5%) |
| 65 to 74 Years | 321 (100.0%) | 0 (0.0%) |
| 75 Years and older | 247 (100.0%) | 0 (0.0%) |
| Total | 2,256 (95.4%) | 108 (4.6%) |
Health Insurance Coverage by Citizenship Status in Rising Sun
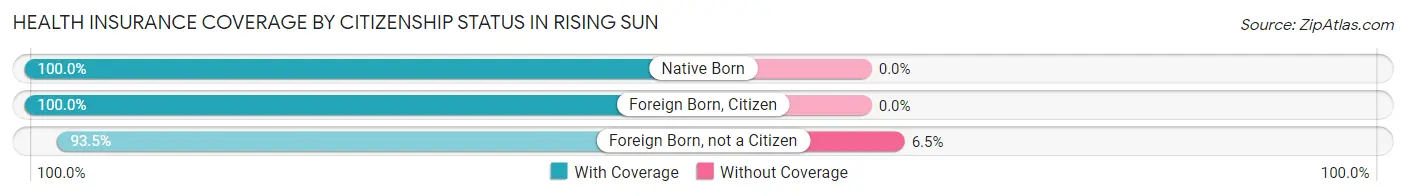
| Citizenship Status | With Coverage | Without Coverage |
| Native Born | 185 (100.0%) | 0 (0.0%) |
| Foreign Born, Citizen | 324 (100.0%) | 0 (0.0%) |
| Foreign Born, not a Citizen | 159 (93.5%) | 11 (6.5%) |
Health Insurance Coverage by Household Income in Rising Sun
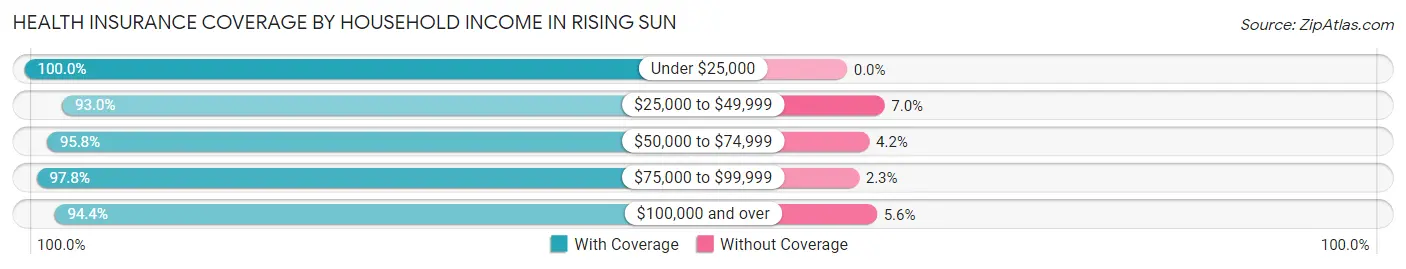
| Household Income | With Coverage | Without Coverage |
| Under $25,000 | 326 (100.0%) | 0 (0.0%) |
| $25,000 to $49,999 | 673 (93.0%) | 51 (7.0%) |
| $50,000 to $74,999 | 321 (95.8%) | 14 (4.2%) |
| $75,000 to $99,999 | 347 (97.8%) | 8 (2.2%) |
| $100,000 and over | 589 (94.4%) | 35 (5.6%) |
Public vs Private Health Insurance Coverage by Age in Rising Sun
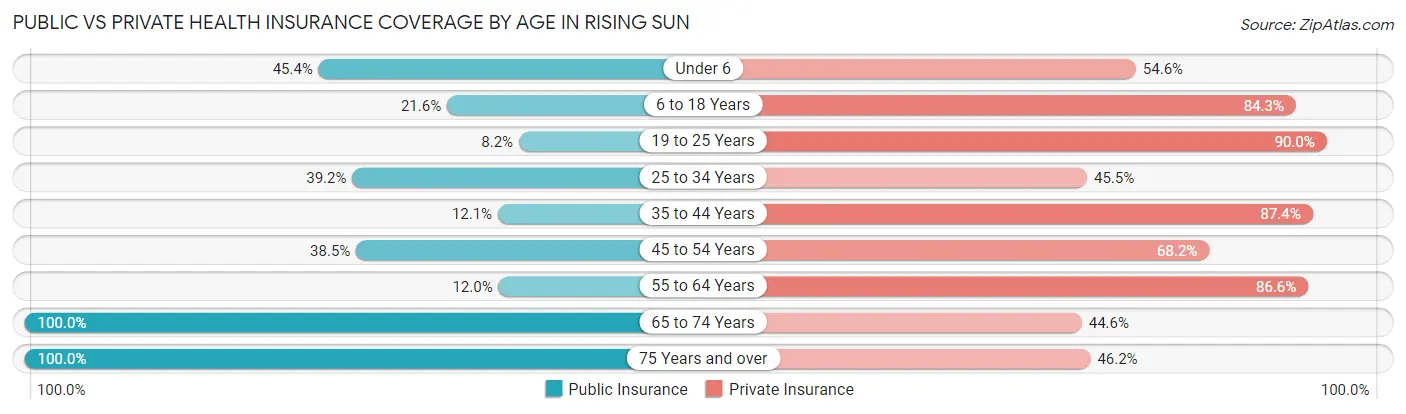
| Age Bracket | Public Insurance | Private Insurance |
| Under 6 | 84 (45.4%) | 101 (54.6%) |
| 6 to 18 Years | 70 (21.6%) | 273 (84.3%) |
| 19 to 25 Years | 14 (8.2%) | 153 (90.0%) |
| 25 to 34 Years | 105 (39.2%) | 122 (45.5%) |
| 35 to 44 Years | 25 (12.1%) | 180 (87.4%) |
| 45 to 54 Years | 110 (38.5%) | 195 (68.2%) |
| 55 to 64 Years | 43 (12.0%) | 309 (86.6%) |
| 65 to 74 Years | 321 (100.0%) | 143 (44.6%) |
| 75 Years and over | 247 (100.0%) | 114 (46.2%) |
| Total | 1,019 (43.1%) | 1,590 (67.3%) |
Disability Status by Sex by Age in Rising Sun
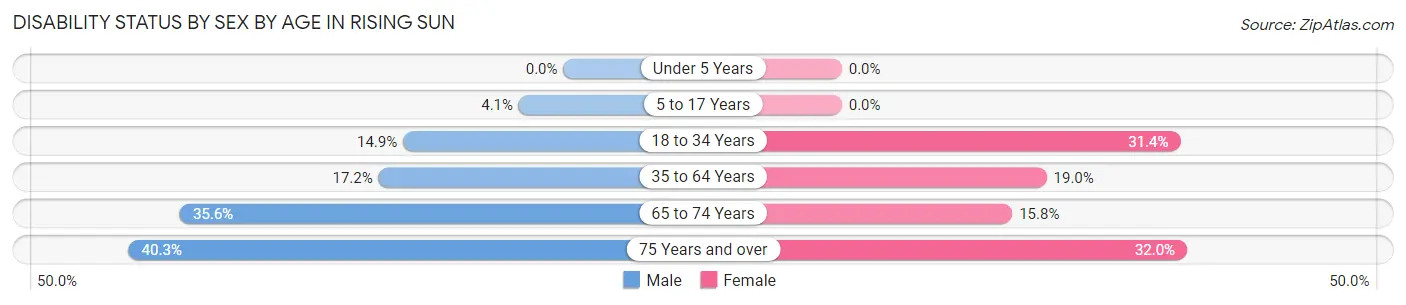
| Age Bracket | Male | Female |
| Under 5 Years | 0 (0.0%) | 0 (0.0%) |
| 5 to 17 Years | 5 (4.1%) | 0 (0.0%) |
| 18 to 34 Years | 32 (14.9%) | 82 (31.4%) |
| 35 to 64 Years | 59 (17.2%) | 96 (19.0%) |
| 65 to 74 Years | 58 (35.6%) | 25 (15.8%) |
| 75 Years and over | 48 (40.3%) | 41 (32.0%) |
Disability Class by Sex by Age in Rising Sun
Disability Class: Hearing Difficulty
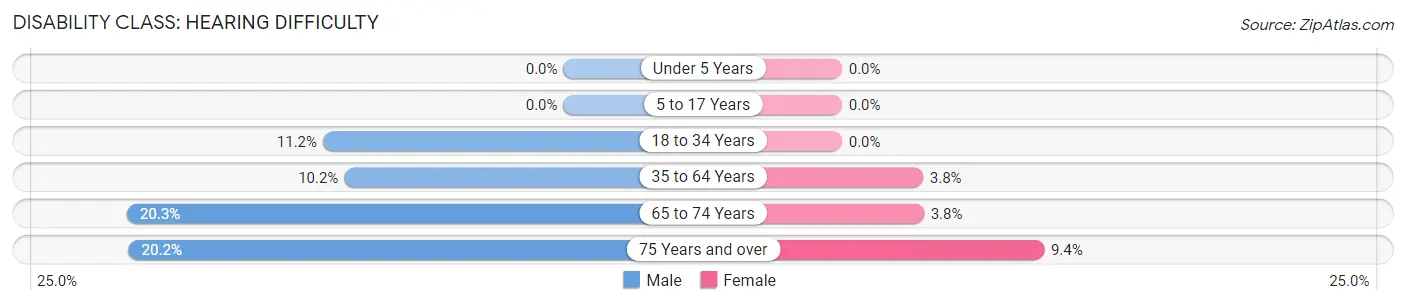
| Age Bracket | Male | Female |
| Under 5 Years | 0 (0.0%) | 0 (0.0%) |
| 5 to 17 Years | 0 (0.0%) | 0 (0.0%) |
| 18 to 34 Years | 24 (11.2%) | 0 (0.0%) |
| 35 to 64 Years | 35 (10.2%) | 19 (3.8%) |
| 65 to 74 Years | 33 (20.3%) | 6 (3.8%) |
| 75 Years and over | 24 (20.2%) | 12 (9.4%) |
Disability Class: Vision Difficulty
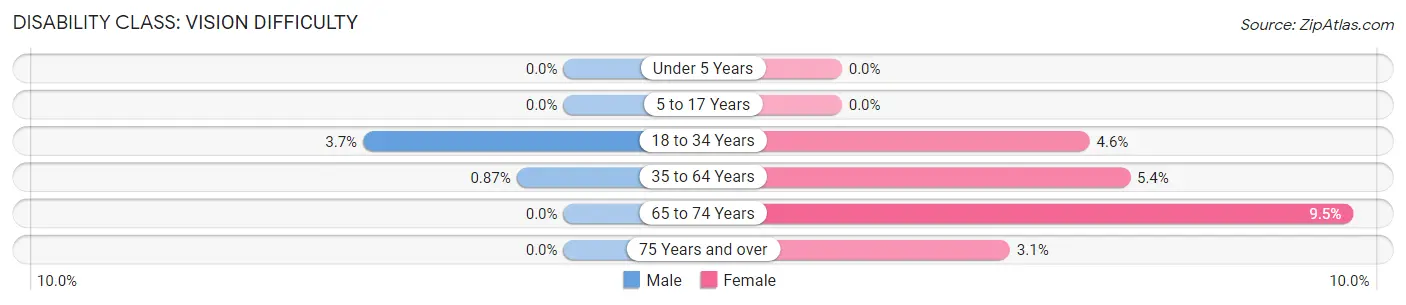
| Age Bracket | Male | Female |
| Under 5 Years | 0 (0.0%) | 0 (0.0%) |
| 5 to 17 Years | 0 (0.0%) | 0 (0.0%) |
| 18 to 34 Years | 8 (3.7%) | 12 (4.6%) |
| 35 to 64 Years | 3 (0.9%) | 27 (5.3%) |
| 65 to 74 Years | 0 (0.0%) | 15 (9.5%) |
| 75 Years and over | 0 (0.0%) | 4 (3.1%) |
Disability Class: Cognitive Difficulty
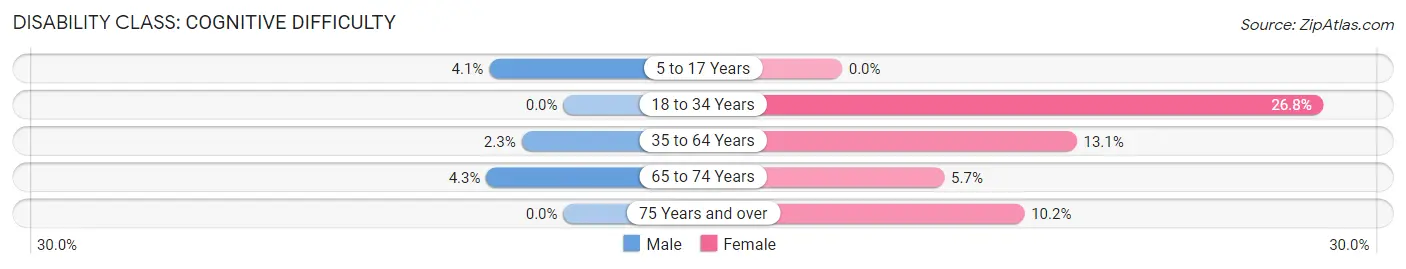
| Age Bracket | Male | Female |
| 5 to 17 Years | 5 (4.1%) | 0 (0.0%) |
| 18 to 34 Years | 0 (0.0%) | 70 (26.8%) |
| 35 to 64 Years | 8 (2.3%) | 66 (13.1%) |
| 65 to 74 Years | 7 (4.3%) | 9 (5.7%) |
| 75 Years and over | 0 (0.0%) | 13 (10.2%) |
Disability Class: Ambulatory Difficulty
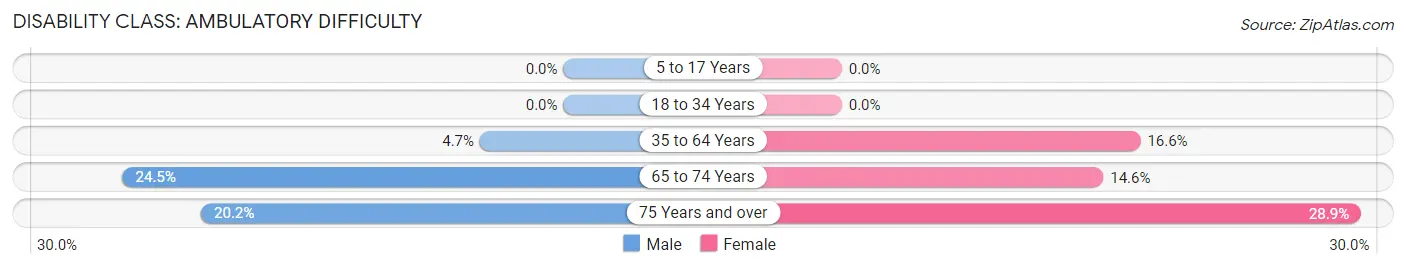
| Age Bracket | Male | Female |
| 5 to 17 Years | 0 (0.0%) | 0 (0.0%) |
| 18 to 34 Years | 0 (0.0%) | 0 (0.0%) |
| 35 to 64 Years | 16 (4.6%) | 84 (16.6%) |
| 65 to 74 Years | 40 (24.5%) | 23 (14.6%) |
| 75 Years and over | 24 (20.2%) | 37 (28.9%) |
Disability Class: Self-Care Difficulty
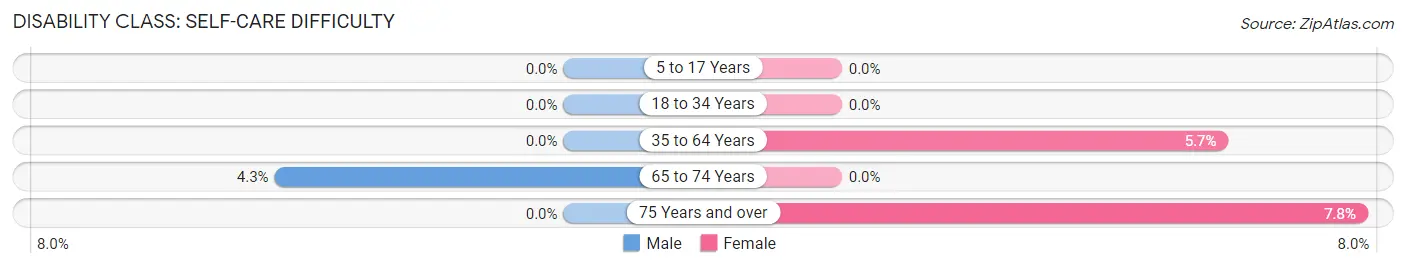
| Age Bracket | Male | Female |
| 5 to 17 Years | 0 (0.0%) | 0 (0.0%) |
| 18 to 34 Years | 0 (0.0%) | 0 (0.0%) |
| 35 to 64 Years | 0 (0.0%) | 29 (5.7%) |
| 65 to 74 Years | 7 (4.3%) | 0 (0.0%) |
| 75 Years and over | 0 (0.0%) | 10 (7.8%) |
Technology Access in Rising Sun
Computing Device Access in Rising Sun
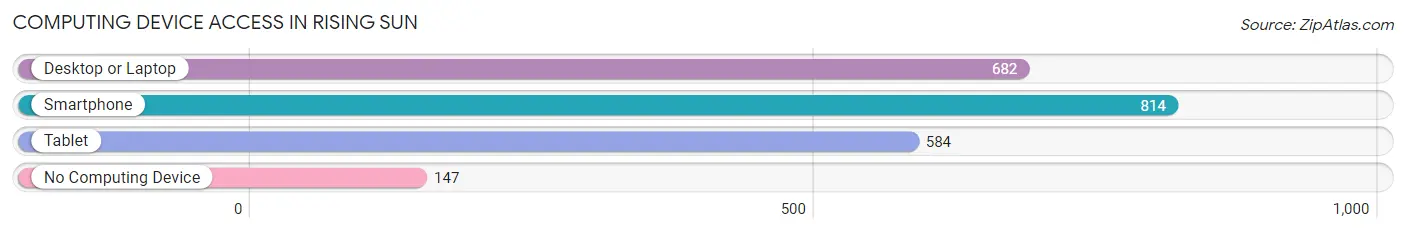
| Device Type | # Households | % Households |
| Desktop or Laptop | 682 | 64.6% |
| Smartphone | 814 | 77.1% |
| Tablet | 584 | 55.3% |
| No Computing Device | 147 | 13.9% |
| Total | 1,056 | 100.0% |
Internet Access in Rising Sun
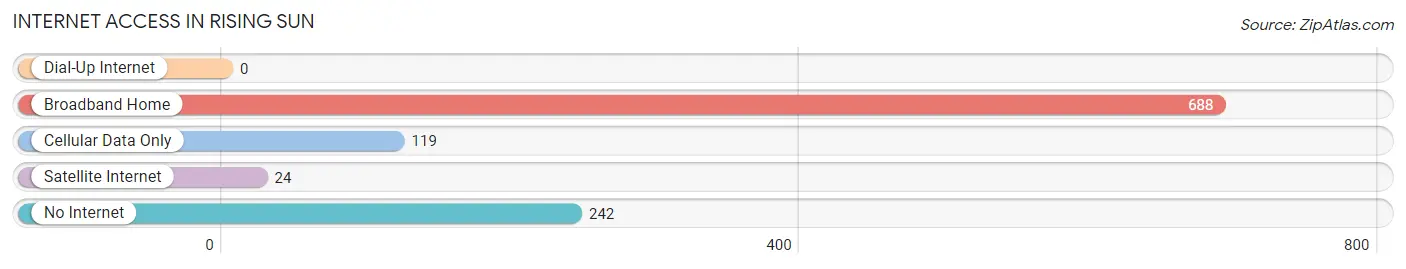
| Internet Type | # Households | % Households |
| Dial-Up Internet | 0 | 0.0% |
| Broadband Home | 688 | 65.1% |
| Cellular Data Only | 119 | 11.3% |
| Satellite Internet | 24 | 2.3% |
| No Internet | 242 | 22.9% |
| Total | 1,056 | 100.0% |
Rising Sun Summary
Rising Sun is a small city located in the southeastern corner of Indiana, in Ohio County. It is situated on the banks of the Ohio River, just across from the state of Kentucky. The city has a population of 2,304 as of the 2010 census, and is the county seat of Ohio County.
History
Rising Sun was founded in 1814 by a group of settlers from North Carolina. The town was named after the Rising Sun Tavern, which was located near the original settlement. The tavern was named after the Rising Sun flag, which was the symbol of the British East India Company.
The town was originally a trading post for the local Native American tribes, and was a popular stop for travelers on the Ohio River. In 1818, the first post office was established in Rising Sun, and the town was officially incorporated in 1844.
In the late 19th century, the town became a popular tourist destination, due to its proximity to the Ohio River. The town was also home to a number of factories, including a glass factory, a paper mill, and a flour mill.
Geography
Rising Sun is located at 38°45'N 84°59'W (38.75, -84.98). The city is situated on the banks of the Ohio River, just across from the state of Kentucky. The city has a total area of 1.3 square miles, all of which is land.
The city is located in the humid continental climate zone, with hot, humid summers and cold, snowy winters. The average temperature in the summer is around 75°F, and the average temperature in the winter is around 30°F.
Economy
Rising Sun's economy is largely based on tourism and manufacturing. The city is home to a number of tourist attractions, including the Ohio River Scenic Byway, the Ohio River Museum, and the Rising Sun Historic District.
The city is also home to a number of manufacturing companies, including a glass factory, a paper mill, and a flour mill. The city is also home to a number of retail stores, restaurants, and other businesses.
Demographics
As of the 2010 census, there were 2,304 people, 945 households, and 602 families residing in the city. The population density was 1,764.3 people per square mile. The racial makeup of the city was 97.2% White, 0.7% African American, 0.2% Native American, 0.2% Asian, 0.1% Pacific Islander, 0.4% from other races, and 1.2% from two or more races. Hispanic or Latino of any race were 1.2% of the population.
The median income for a household in the city was $37,917, and the median income for a family was $45,000. The per capita income for the city was $19,845. About 11.2% of families and 14.2% of the population were below the poverty line, including 19.2% of those under age 18 and 8.2% of those age 65 or over.
Common Questions
What is Per Capita Income in Rising Sun?
Per Capita income in Rising Sun is $29,038.
What is the Median Family Income in Rising Sun?
Median Family Income in Rising Sun is $50,192.
What is the Median Household income in Rising Sun?
Median Household Income in Rising Sun is $46,214.
What is Income or Wage Gap in Rising Sun?
Income or Wage Gap in Rising Sun is 34.9%.
Women in Rising Sun earn 65.1 cents for every dollar earned by a man.
What is Inequality or Gini Index in Rising Sun?
Inequality or Gini Index in Rising Sun is 0.45.
What is the Total Population of Rising Sun?
Total Population of Rising Sun is 2,420.
What is the Total Male Population of Rising Sun?
Total Male Population of Rising Sun is 1,023.
What is the Total Female Population of Rising Sun?
Total Female Population of Rising Sun is 1,397.
What is the Ratio of Males per 100 Females in Rising Sun?
There are 73.23 Males per 100 Females in Rising Sun.
What is the Ratio of Females per 100 Males in Rising Sun?
There are 136.56 Females per 100 Males in Rising Sun.
What is the Median Population Age in Rising Sun?
Median Population Age in Rising Sun is 47.6 Years.
What is the Average Family Size in Rising Sun
Average Family Size in Rising Sun is 2.6 People.
What is the Average Household Size in Rising Sun
Average Household Size in Rising Sun is 2.2 People.
How Large is the Labor Force in Rising Sun?
There are 1,101 People in the Labor Forcein in Rising Sun.
What is the Percentage of People in the Labor Force in Rising Sun?
55.3% of People are in the Labor Force in Rising Sun.
What is the Unemployment Rate in Rising Sun?
Unemployment Rate in Rising Sun is 1.4%.