Chesterton, IN Map & Demographics
Chesterton Map
Chesterton Overview
$47,273
PER CAPITA INCOME
$105,451
AVG FAMILY INCOME
$90,753
AVG HOUSEHOLD INCOME
36.9%
WAGE / INCOME GAP [ % ]
63.1¢/ $1
WAGE / INCOME GAP [ $ ]
$14,983
FAMILY INCOME DEFICIT
0.44
INEQUALITY / GINI INDEX
14,191
TOTAL POPULATION
7,104
MALE POPULATION
7,087
FEMALE POPULATION
100.24
MALES / 100 FEMALES
99.76
FEMALES / 100 MALES
36.9
MEDIAN AGE
3.2
AVG FAMILY SIZE
2.4
AVG HOUSEHOLD SIZE
7,415
LABOR FORCE [ PEOPLE ]
69.1%
PERCENT IN LABOR FORCE
8.2%
UNEMPLOYMENT RATE
Chesterton Zip Codes
Chesterton Area Codes
Income in Chesterton
Income Overview in Chesterton
Per Capita Income in Chesterton is $47,273, while median incomes of families and households are $105,451 and $90,753 respectively.
| Characteristic | Number | Measure |
| Per Capita Income | 14,191 | $47,273 |
| Median Family Income | 3,341 | $105,451 |
| Mean Family Income | 3,341 | $124,337 |
| Median Household Income | 5,727 | $90,753 |
| Mean Household Income | 5,727 | $112,402 |
| Income Deficit | 3,341 | $14,983 |
| Wage / Income Gap (%) | 14,191 | 36.89% |
| Wage / Income Gap ($) | 14,191 | 63.11¢ per $1 |
| Gini / Inequality Index | 14,191 | 0.44 |
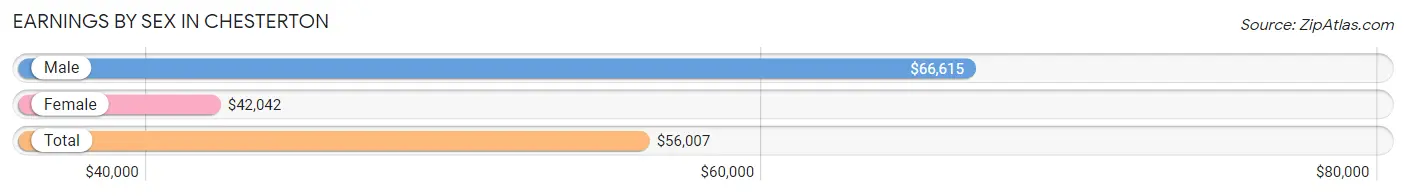
Earnings by Sex in Chesterton
Average Earnings in Chesterton are $56,007, $66,615 for men and $42,042 for women, a difference of 36.9%.
| Sex | Number | Average Earnings |
| Male | 4,233 (55.0%) | $66,615 |
| Female | 3,468 (45.0%) | $42,042 |
| Total | 7,701 (100.0%) | $56,007 |
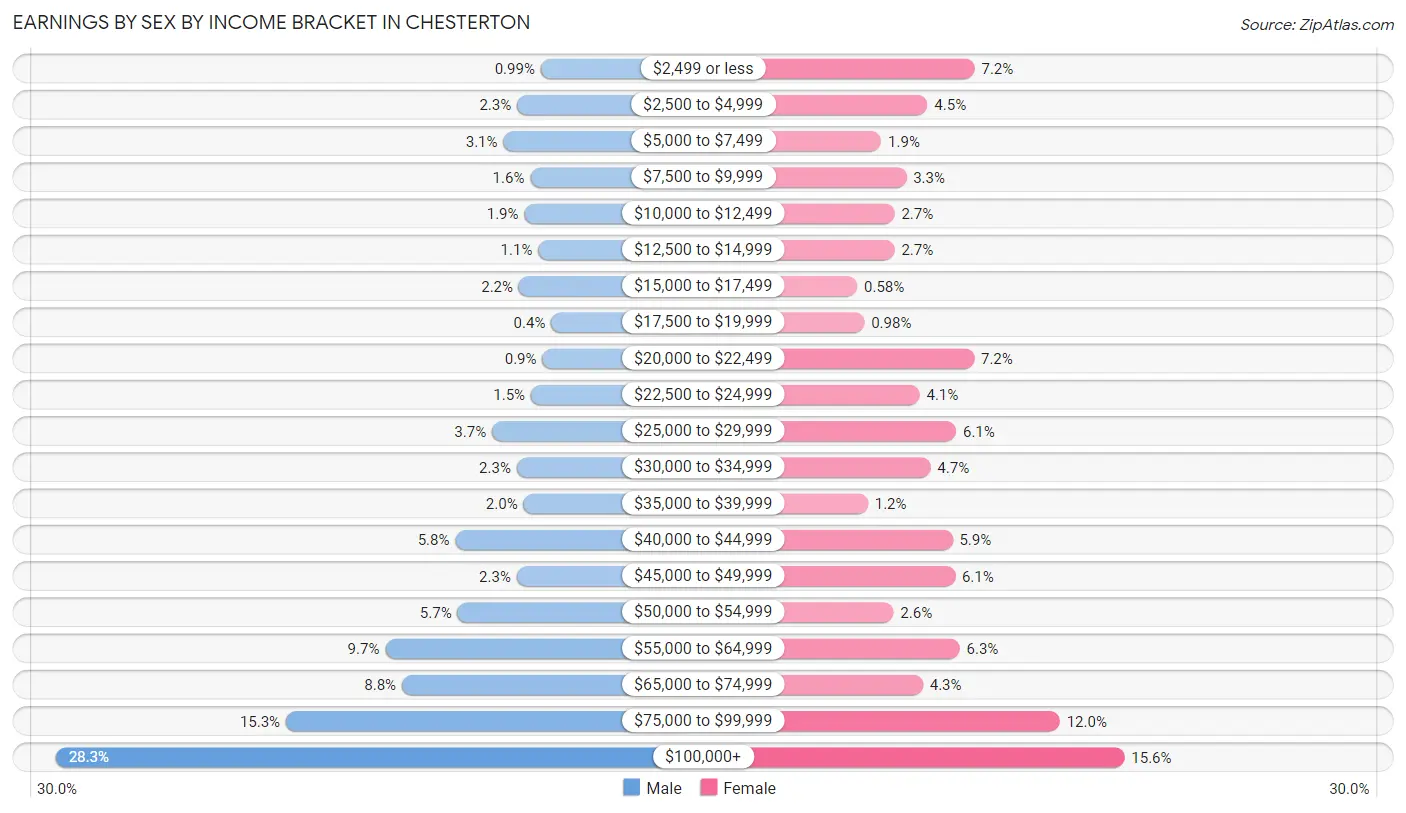
Earnings by Sex by Income Bracket in Chesterton
The most common earnings brackets in Chesterton are $100,000+ for men (1,196 | 28.2%) and $100,000+ for women (541 | 15.6%).
| Income | Male | Female |
| $2,499 or less | 42 (1.0%) | 249 (7.2%) |
| $2,500 to $4,999 | 98 (2.3%) | 157 (4.5%) |
| $5,000 to $7,499 | 131 (3.1%) | 67 (1.9%) |
| $7,500 to $9,999 | 67 (1.6%) | 116 (3.3%) |
| $10,000 to $12,499 | 81 (1.9%) | 93 (2.7%) |
| $12,500 to $14,999 | 48 (1.1%) | 93 (2.7%) |
| $15,000 to $17,499 | 94 (2.2%) | 20 (0.6%) |
| $17,500 to $19,999 | 17 (0.4%) | 34 (1.0%) |
| $20,000 to $22,499 | 38 (0.9%) | 248 (7.1%) |
| $22,500 to $24,999 | 65 (1.5%) | 142 (4.1%) |
| $25,000 to $29,999 | 158 (3.7%) | 213 (6.1%) |
| $30,000 to $34,999 | 99 (2.3%) | 163 (4.7%) |
| $35,000 to $39,999 | 83 (2.0%) | 41 (1.2%) |
| $40,000 to $44,999 | 245 (5.8%) | 206 (5.9%) |
| $45,000 to $49,999 | 99 (2.3%) | 211 (6.1%) |
| $50,000 to $54,999 | 240 (5.7%) | 91 (2.6%) |
| $55,000 to $64,999 | 412 (9.7%) | 220 (6.3%) |
| $65,000 to $74,999 | 372 (8.8%) | 148 (4.3%) |
| $75,000 to $99,999 | 648 (15.3%) | 415 (12.0%) |
| $100,000+ | 1,196 (28.2%) | 541 (15.6%) |
| Total | 4,233 (100.0%) | 3,468 (100.0%) |
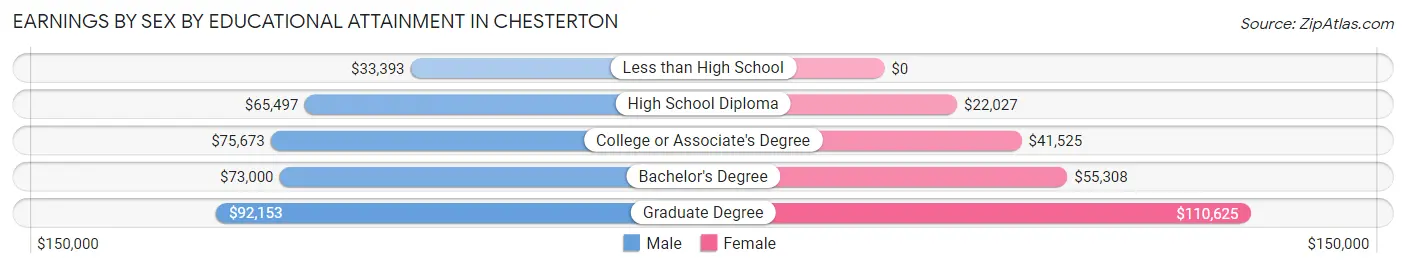
Earnings by Sex by Educational Attainment in Chesterton
Average earnings in Chesterton are $69,784 for men and $45,218 for women, a difference of 35.2%. Men with an educational attainment of graduate degree enjoy the highest average annual earnings of $92,153, while those with less than high school education earn the least with $33,393. Women with an educational attainment of graduate degree earn the most with the average annual earnings of $110,625, while those with high school diploma education have the smallest earnings of $22,027.
| Educational Attainment | Male Income | Female Income |
| Less than High School | $33,393 | $0 |
| High School Diploma | $65,497 | $22,027 |
| College or Associate's Degree | $75,673 | $41,525 |
| Bachelor's Degree | $73,000 | $55,308 |
| Graduate Degree | $92,153 | $110,625 |
| Total | $69,784 | $45,218 |
Family Income in Chesterton
Family Income Brackets in Chesterton
According to the Chesterton family income data, there are 678 families falling into the $100,000 to $149,999 income range, which is the most common income bracket and makes up 20.3% of all families. Conversely, the $15,000 to $24,999 income bracket is the least frequent group with only 74 families (2.2%) belonging to this category.
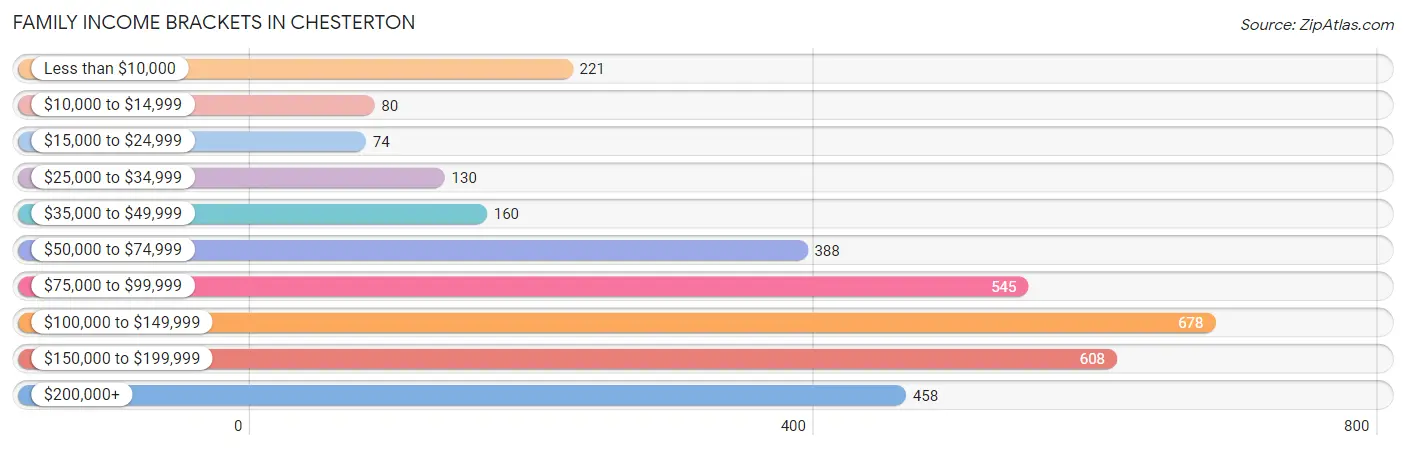
| Income Bracket | # Families | % Families |
| Less than $10,000 | 221 | 6.6% |
| $10,000 to $14,999 | 80 | 2.4% |
| $15,000 to $24,999 | 74 | 2.2% |
| $25,000 to $34,999 | 130 | 3.9% |
| $35,000 to $49,999 | 160 | 4.8% |
| $50,000 to $74,999 | 388 | 11.6% |
| $75,000 to $99,999 | 545 | 16.3% |
| $100,000 to $149,999 | 678 | 20.3% |
| $150,000 to $199,999 | 608 | 18.2% |
| $200,000+ | 458 | 13.7% |
Family Income by Famaliy Size in Chesterton
4-person families (892 | 26.7%) account for the highest median family income in Chesterton with $130,455 per family, while 2-person families (1,437 | 43.0%) have the highest median income of $44,760 per family member.
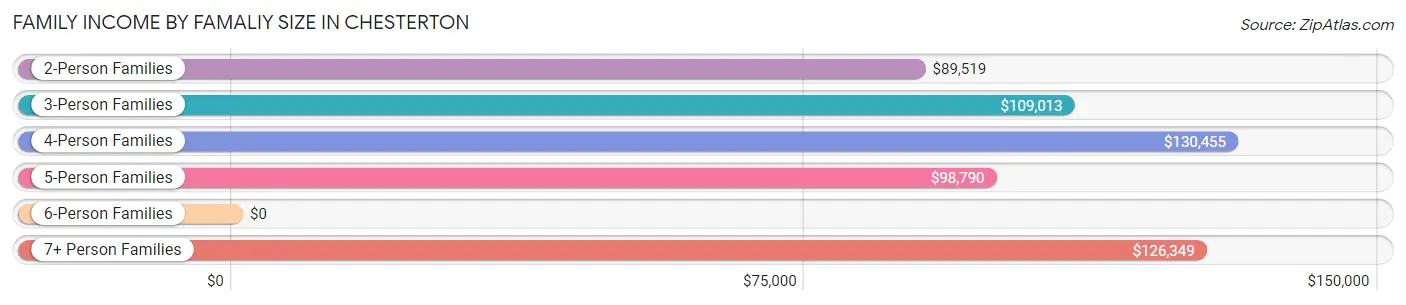
| Income Bracket | # Families | Median Income |
| 2-Person Families | 1,437 (43.0%) | $89,519 |
| 3-Person Families | 676 (20.2%) | $109,013 |
| 4-Person Families | 892 (26.7%) | $130,455 |
| 5-Person Families | 244 (7.3%) | $98,790 |
| 6-Person Families | 27 (0.8%) | $0 |
| 7+ Person Families | 65 (1.9%) | $126,349 |
| Total | 3,341 (100.0%) | $105,451 |
Family Income by Number of Earners in Chesterton
The median family income in Chesterton is $105,451, with families comprising 2 earners (1,591) having the highest median family income of $150,529, while families with no earners (475) have the lowest median family income of $59,213, accounting for 47.6% and 14.2% of families, respectively.
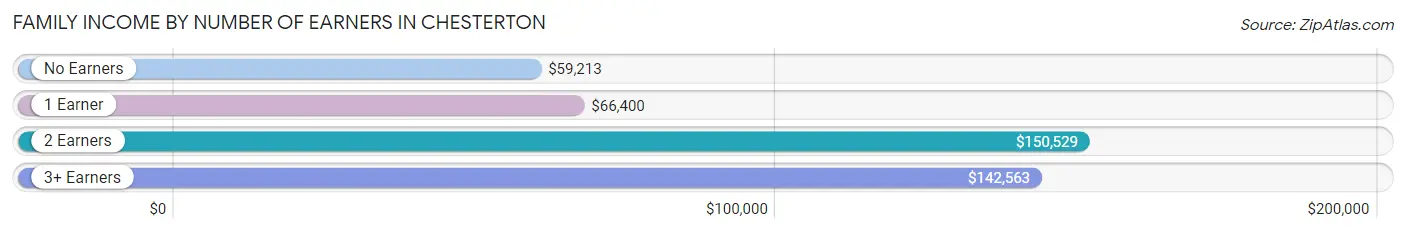
| Number of Earners | # Families | Median Income |
| No Earners | 475 (14.2%) | $59,213 |
| 1 Earner | 1,080 (32.3%) | $66,400 |
| 2 Earners | 1,591 (47.6%) | $150,529 |
| 3+ Earners | 195 (5.8%) | $142,563 |
| Total | 3,341 (100.0%) | $105,451 |
Household Income in Chesterton
Household Income Brackets in Chesterton
With 1,065 households falling in the category, the $100,000 to $149,999 income range is the most frequent in Chesterton, accounting for 18.6% of all households. In contrast, only 160 households (2.8%) fall into the $10,000 to $14,999 income bracket, making it the least populous group.
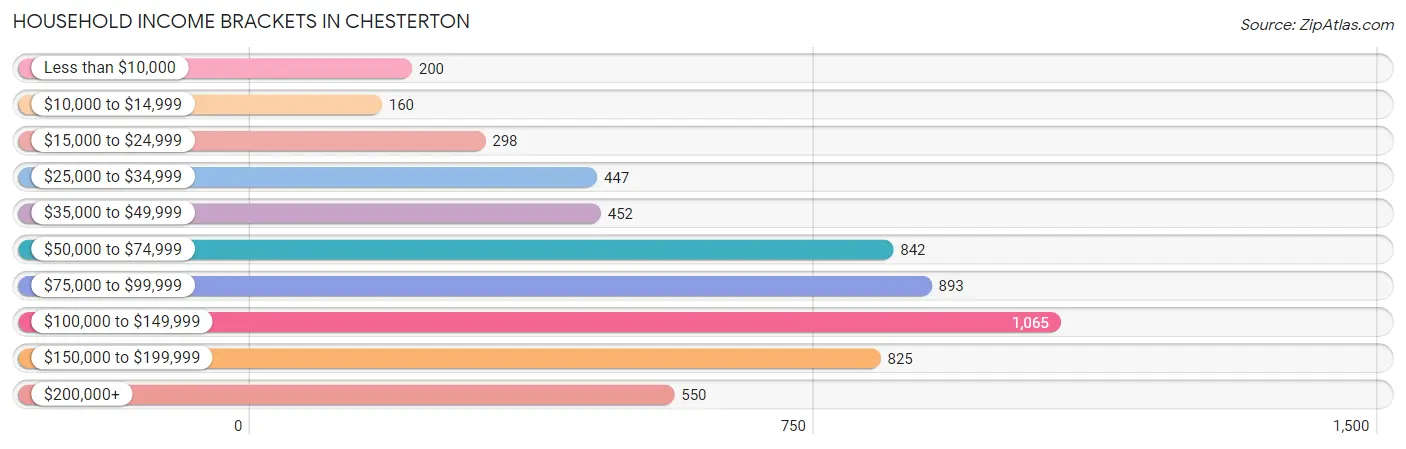
| Income Bracket | # Households | % Households |
| Less than $10,000 | 200 | 3.5% |
| $10,000 to $14,999 | 160 | 2.8% |
| $15,000 to $24,999 | 298 | 5.2% |
| $25,000 to $34,999 | 447 | 7.8% |
| $35,000 to $49,999 | 452 | 7.9% |
| $50,000 to $74,999 | 842 | 14.7% |
| $75,000 to $99,999 | 893 | 15.6% |
| $100,000 to $149,999 | 1,065 | 18.6% |
| $150,000 to $199,999 | 825 | 14.4% |
| $200,000+ | 550 | 9.6% |
Household Income by Householder Age in Chesterton
The median household income in Chesterton is $90,753, with the highest median household income of $107,500 found in the 45 to 64 years age bracket for the primary householder. A total of 1,756 households (30.7%) fall into this category. Meanwhile, the 15 to 24 years age bracket for the primary householder has the lowest median household income of $44,853, with 176 households (3.1%) in this group.
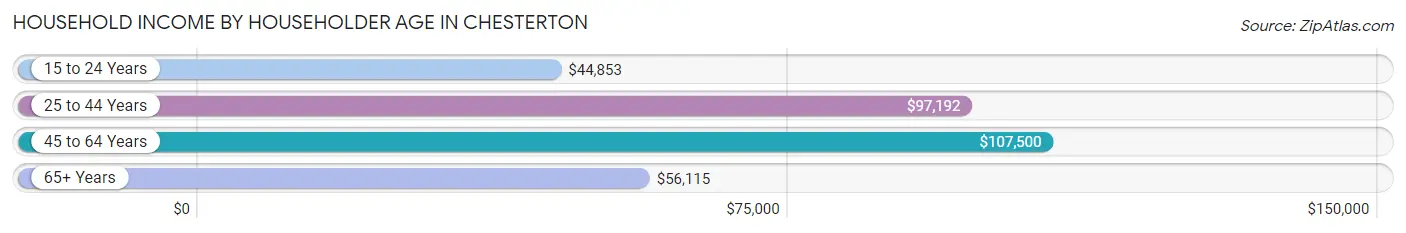
| Income Bracket | # Households | Median Income |
| 15 to 24 Years | 176 (3.1%) | $44,853 |
| 25 to 44 Years | 2,384 (41.6%) | $97,192 |
| 45 to 64 Years | 1,756 (30.7%) | $107,500 |
| 65+ Years | 1,411 (24.6%) | $56,115 |
| Total | 5,727 (100.0%) | $90,753 |
Poverty in Chesterton
Income Below Poverty by Sex and Age in Chesterton
With 7.5% poverty level for males and 13.9% for females among the residents of Chesterton, under 5 year old males and 12 to 14 year old females are the most vulnerable to poverty, with 139 males (19.6%) and 116 females (44.3%) in their respective age groups living below the poverty level.
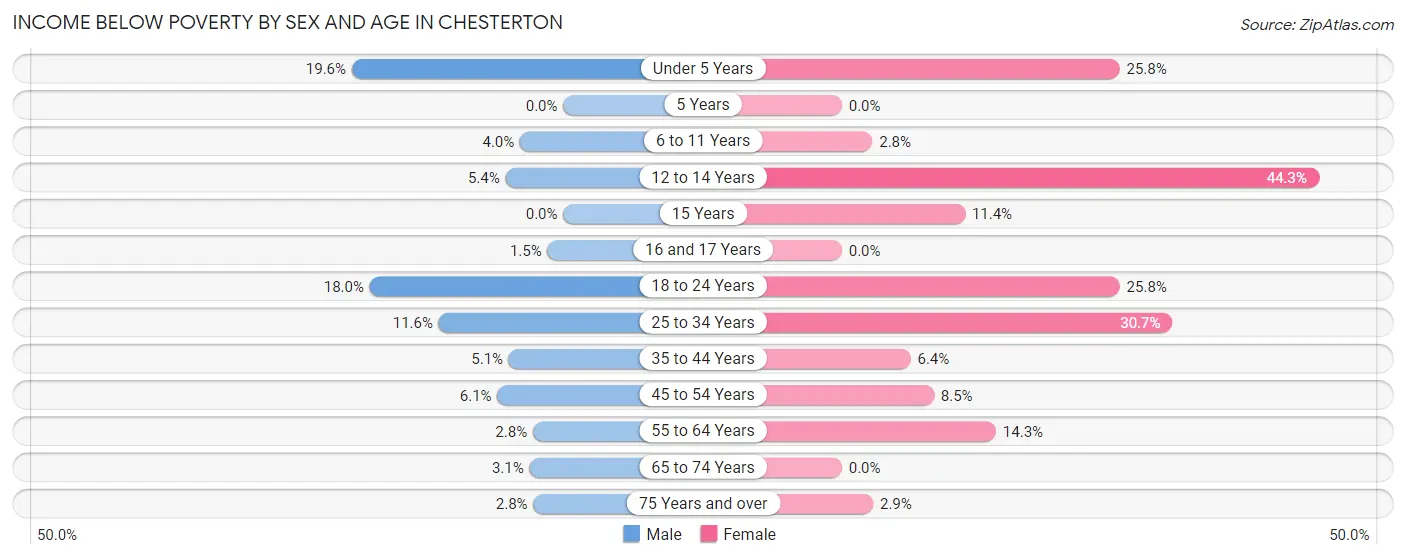
| Age Bracket | Male | Female |
| Under 5 Years | 139 (19.6%) | 108 (25.8%) |
| 5 Years | 0 (0.0%) | 0 (0.0%) |
| 6 to 11 Years | 23 (4.0%) | 19 (2.8%) |
| 12 to 14 Years | 17 (5.4%) | 116 (44.3%) |
| 15 Years | 0 (0.0%) | 24 (11.4%) |
| 16 and 17 Years | 2 (1.5%) | 0 (0.0%) |
| 18 to 24 Years | 74 (18.0%) | 98 (25.8%) |
| 25 to 34 Years | 112 (11.6%) | 326 (30.7%) |
| 35 to 44 Years | 71 (5.1%) | 79 (6.4%) |
| 45 to 54 Years | 49 (6.1%) | 51 (8.5%) |
| 55 to 64 Years | 18 (2.8%) | 123 (14.3%) |
| 65 to 74 Years | 15 (3.1%) | 0 (0.0%) |
| 75 Years and over | 11 (2.8%) | 19 (2.9%) |
| Total | 531 (7.5%) | 963 (13.9%) |
Income Above Poverty by Sex and Age in Chesterton
According to the poverty statistics in Chesterton, males aged 5 years and females aged 5 years are the age groups that are most secure financially, with 100.0% of males and 100.0% of females in these age groups living above the poverty line.
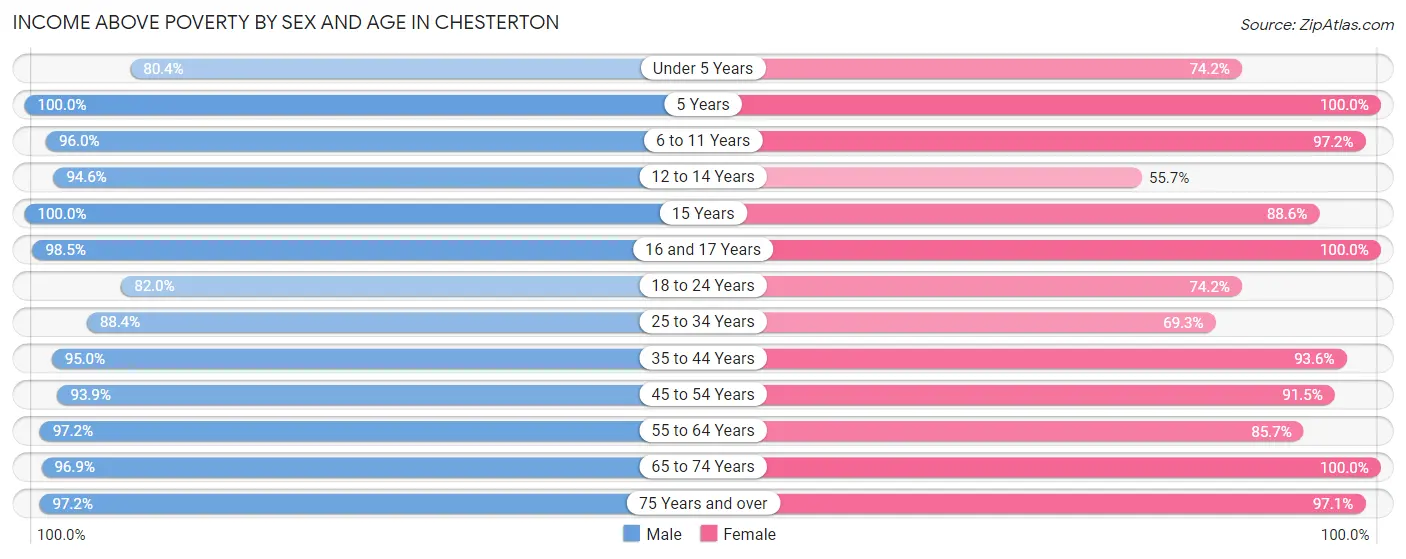
| Age Bracket | Male | Female |
| Under 5 Years | 569 (80.4%) | 311 (74.2%) |
| 5 Years | 119 (100.0%) | 50 (100.0%) |
| 6 to 11 Years | 550 (96.0%) | 653 (97.2%) |
| 12 to 14 Years | 300 (94.6%) | 146 (55.7%) |
| 15 Years | 123 (100.0%) | 186 (88.6%) |
| 16 and 17 Years | 134 (98.5%) | 130 (100.0%) |
| 18 to 24 Years | 338 (82.0%) | 282 (74.2%) |
| 25 to 34 Years | 857 (88.4%) | 737 (69.3%) |
| 35 to 44 Years | 1,335 (95.0%) | 1,160 (93.6%) |
| 45 to 54 Years | 751 (93.9%) | 546 (91.5%) |
| 55 to 64 Years | 621 (97.2%) | 737 (85.7%) |
| 65 to 74 Years | 463 (96.9%) | 408 (100.0%) |
| 75 Years and over | 384 (97.2%) | 636 (97.1%) |
| Total | 6,544 (92.5%) | 5,982 (86.1%) |
Income Below Poverty Among Married-Couple Families in Chesterton
The poverty statistics for married-couple families in Chesterton show that 5.0% or 131 of the total 2,600 families live below the poverty line. Families with 3 or 4 children have the highest poverty rate of 22.7%, comprising of 46 families. On the other hand, families with 5 or more children have the lowest poverty rate of 0.0%, which includes 0 families.
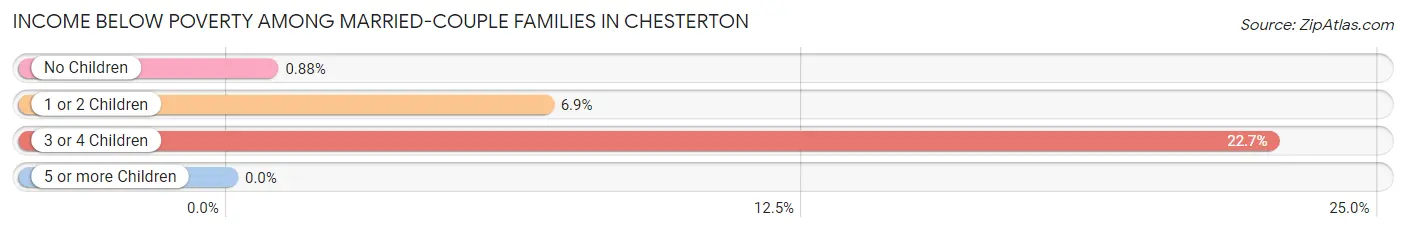
| Children | Above Poverty | Below Poverty |
| No Children | 1,244 (99.1%) | 11 (0.9%) |
| 1 or 2 Children | 1,003 (93.1%) | 74 (6.9%) |
| 3 or 4 Children | 157 (77.3%) | 46 (22.7%) |
| 5 or more Children | 65 (100.0%) | 0 (0.0%) |
| Total | 2,469 (95.0%) | 131 (5.0%) |
Income Below Poverty Among Single-Parent Households in Chesterton
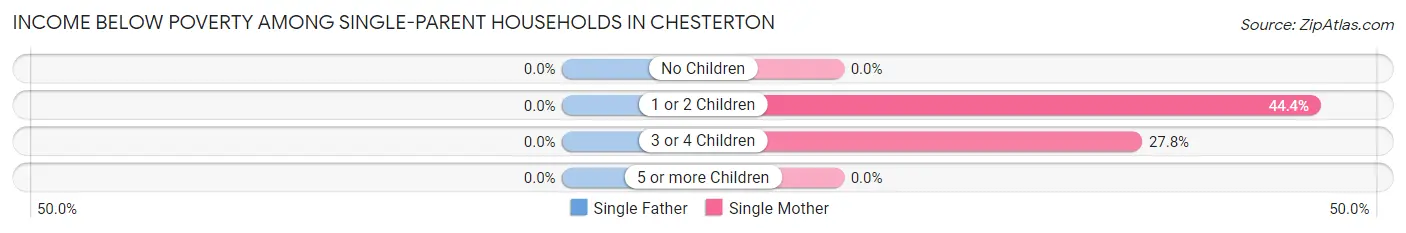
| Children | Single Father | Single Mother |
| No Children | 0 (0.0%) | 0 (0.0%) |
| 1 or 2 Children | 0 (0.0%) | 196 (44.4%) |
| 3 or 4 Children | 0 (0.0%) | 15 (27.8%) |
| 5 or more Children | 0 (0.0%) | 0 (0.0%) |
| Total | 0 (0.0%) | 211 (34.4%) |
Income Below Poverty Among Married-Couple vs Single-Parent Households in Chesterton
The poverty data for Chesterton shows that 131 of the married-couple family households (5.0%) and 211 of the single-parent households (28.5%) are living below the poverty level. Within the married-couple family households, those with 3 or 4 children have the highest poverty rate, with 46 households (22.7%) falling below the poverty line. Among the single-parent households, those with 1 or 2 children have the highest poverty rate, with 196 household (39.9%) living below poverty.
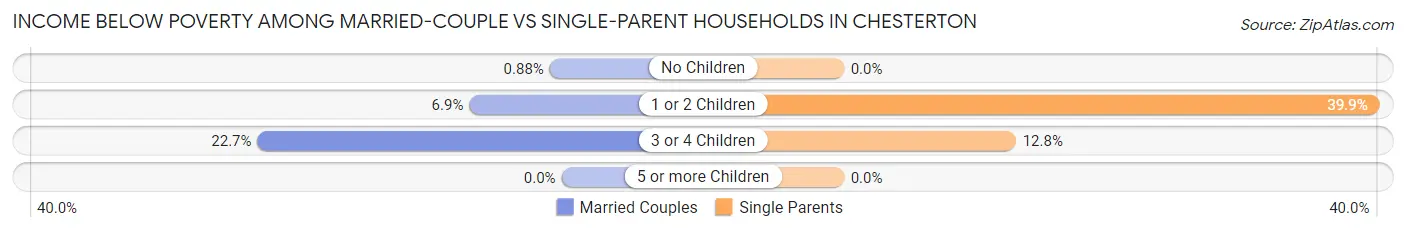
| Children | Married-Couple Families | Single-Parent Households |
| No Children | 11 (0.9%) | 0 (0.0%) |
| 1 or 2 Children | 74 (6.9%) | 196 (39.9%) |
| 3 or 4 Children | 46 (22.7%) | 15 (12.8%) |
| 5 or more Children | 0 (0.0%) | 0 (0.0%) |
| Total | 131 (5.0%) | 211 (28.5%) |
Race in Chesterton
The most populous races in Chesterton are White / Caucasian (12,491 | 88.0%), Hispanic or Latino (1,363 | 9.6%), and Two or more Races (999 | 7.0%).
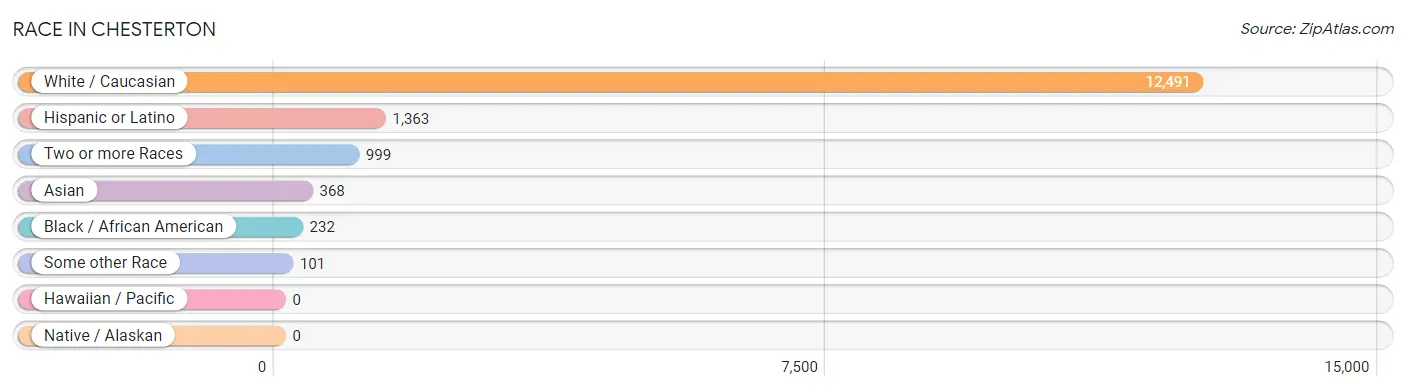
| Race | # Population | % Population |
| Asian | 368 | 2.6% |
| Black / African American | 232 | 1.6% |
| Hawaiian / Pacific | 0 | 0.0% |
| Hispanic or Latino | 1,363 | 9.6% |
| Native / Alaskan | 0 | 0.0% |
| White / Caucasian | 12,491 | 88.0% |
| Two or more Races | 999 | 7.0% |
| Some other Race | 101 | 0.7% |
| Total | 14,191 | 100.0% |
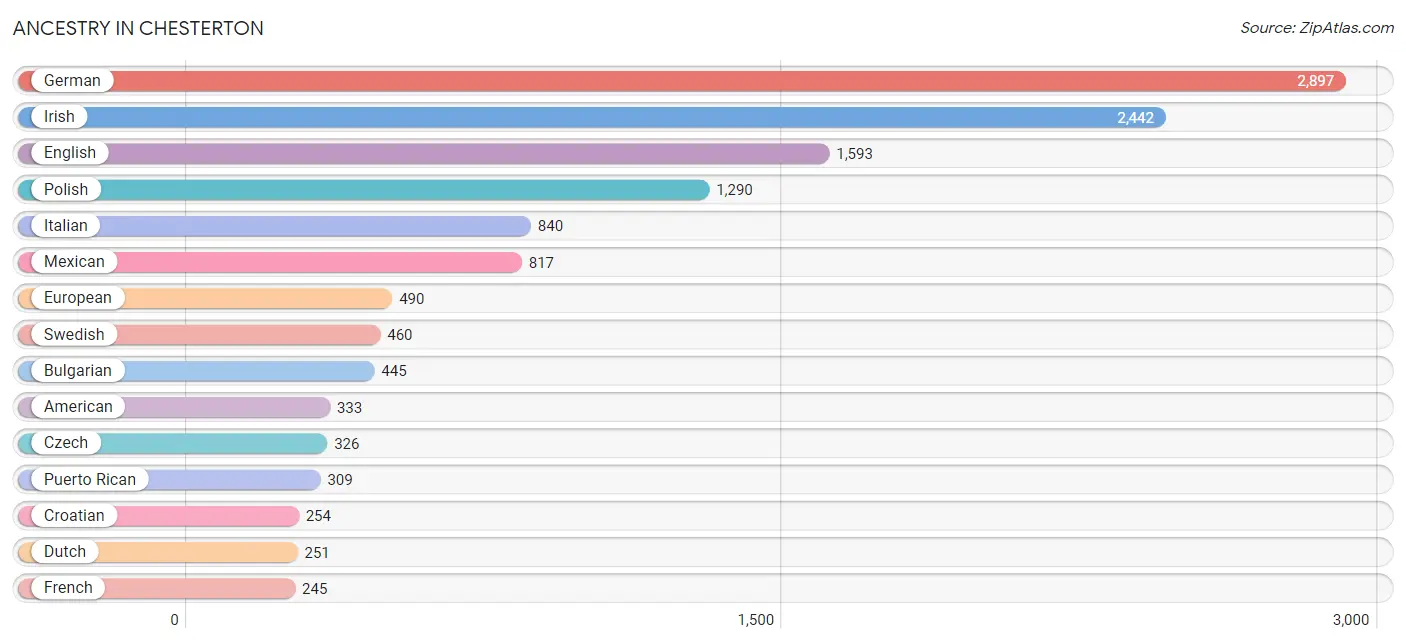
Ancestry in Chesterton
The most populous ancestries reported in Chesterton are German (2,897 | 20.4%), Irish (2,442 | 17.2%), English (1,593 | 11.2%), Polish (1,290 | 9.1%), and Italian (840 | 5.9%), together accounting for 63.9% of all Chesterton residents.
| Ancestry | # Population | % Population |
| American | 333 | 2.4% |
| Arab | 67 | 0.5% |
| Armenian | 14 | 0.1% |
| Austrian | 37 | 0.3% |
| Belgian | 15 | 0.1% |
| Bhutanese | 140 | 1.0% |
| Blackfeet | 36 | 0.3% |
| British | 109 | 0.8% |
| Bulgarian | 445 | 3.1% |
| Burmese | 59 | 0.4% |
| Canadian | 20 | 0.1% |
| Central American | 79 | 0.6% |
| Cherokee | 24 | 0.2% |
| Choctaw | 13 | 0.1% |
| Croatian | 254 | 1.8% |
| Czech | 326 | 2.3% |
| Czechoslovakian | 40 | 0.3% |
| Danish | 13 | 0.1% |
| Dominican | 14 | 0.1% |
| Dutch | 251 | 1.8% |
| Eastern European | 88 | 0.6% |
| English | 1,593 | 11.2% |
| European | 490 | 3.5% |
| Finnish | 20 | 0.1% |
| French | 245 | 1.7% |
| French Canadian | 81 | 0.6% |
| German | 2,897 | 20.4% |
| Greek | 232 | 1.6% |
| Guatemalan | 45 | 0.3% |
| Honduran | 34 | 0.2% |
| Hungarian | 199 | 1.4% |
| Indian (Asian) | 79 | 0.6% |
| Irish | 2,442 | 17.2% |
| Italian | 840 | 5.9% |
| Korean | 51 | 0.4% |
| Lithuanian | 32 | 0.2% |
| Macedonian | 12 | 0.1% |
| Mexican | 817 | 5.8% |
| Navajo | 5 | 0.0% |
| Northern European | 10 | 0.1% |
| Norwegian | 74 | 0.5% |
| Peruvian | 22 | 0.2% |
| Polish | 1,290 | 9.1% |
| Portuguese | 31 | 0.2% |
| Puerto Rican | 309 | 2.2% |
| Romanian | 33 | 0.2% |
| Russian | 219 | 1.5% |
| Scandinavian | 39 | 0.3% |
| Scotch-Irish | 97 | 0.7% |
| Scottish | 168 | 1.2% |
| Serbian | 99 | 0.7% |
| Slovak | 210 | 1.5% |
| Slovene | 23 | 0.2% |
| South American | 22 | 0.2% |
| Spanish | 21 | 0.2% |
| Swedish | 460 | 3.2% |
| Swiss | 24 | 0.2% |
| Syrian | 67 | 0.5% |
| Thai | 209 | 1.5% |
| Turkish | 14 | 0.1% |
| Ukrainian | 69 | 0.5% |
| Welsh | 37 | 0.3% |
| Yugoslavian | 38 | 0.3% | View All 63 Rows |
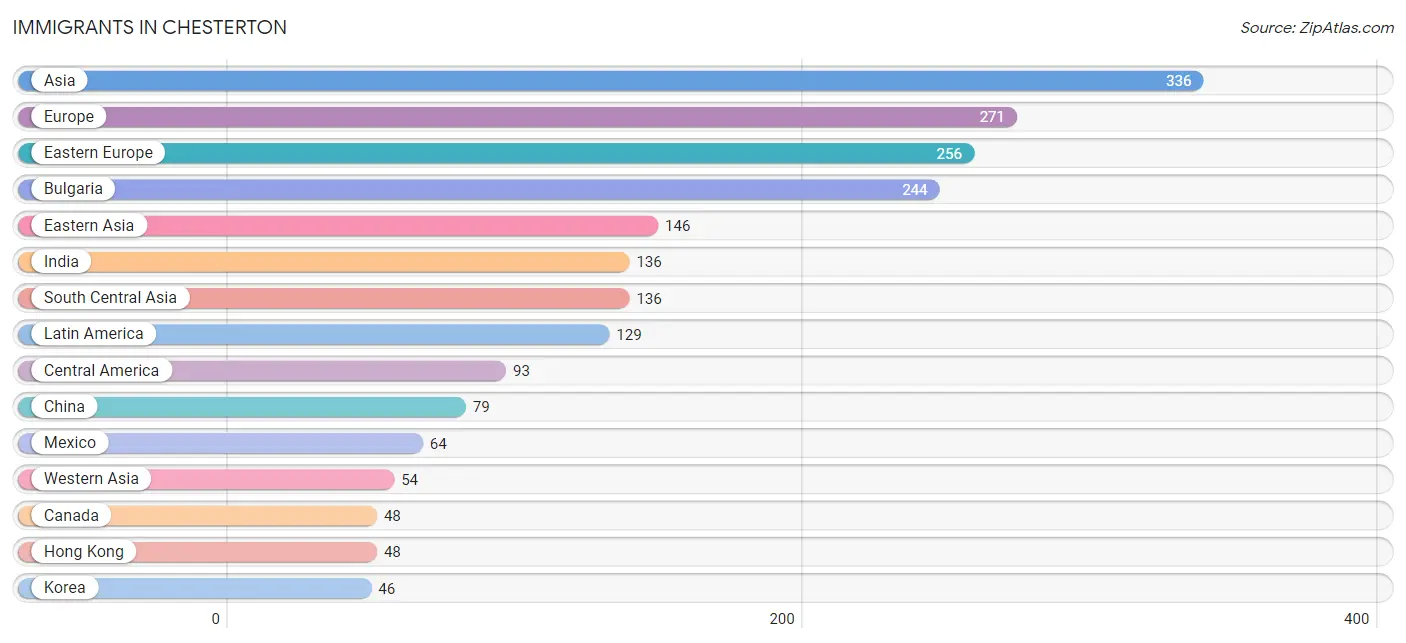
Immigrants in Chesterton
The most numerous immigrant groups reported in Chesterton came from Asia (336 | 2.4%), Europe (271 | 1.9%), Eastern Europe (256 | 1.8%), Bulgaria (244 | 1.7%), and Eastern Asia (146 | 1.0%), together accounting for 8.8% of all Chesterton residents.
| Immigration Origin | # Population | % Population |
| Africa | 9 | 0.1% |
| Asia | 336 | 2.4% |
| Bulgaria | 244 | 1.7% |
| Canada | 48 | 0.3% |
| Caribbean | 14 | 0.1% |
| Central America | 93 | 0.7% |
| China | 79 | 0.6% |
| Dominican Republic | 14 | 0.1% |
| Eastern Africa | 9 | 0.1% |
| Eastern Asia | 146 | 1.0% |
| Eastern Europe | 256 | 1.8% |
| Europe | 271 | 1.9% |
| Guatemala | 2 | 0.0% |
| Hong Kong | 48 | 0.3% |
| India | 136 | 1.0% |
| Japan | 21 | 0.2% |
| Korea | 46 | 0.3% |
| Latin America | 129 | 0.9% |
| Mexico | 64 | 0.4% |
| Moldova | 12 | 0.1% |
| Northern Europe | 15 | 0.1% |
| Panama | 27 | 0.2% |
| Peru | 22 | 0.2% |
| South America | 22 | 0.2% |
| South Central Asia | 136 | 1.0% |
| Syria | 40 | 0.3% |
| Turkey | 14 | 0.1% |
| Uganda | 9 | 0.1% |
| Western Asia | 54 | 0.4% | View All 29 Rows |
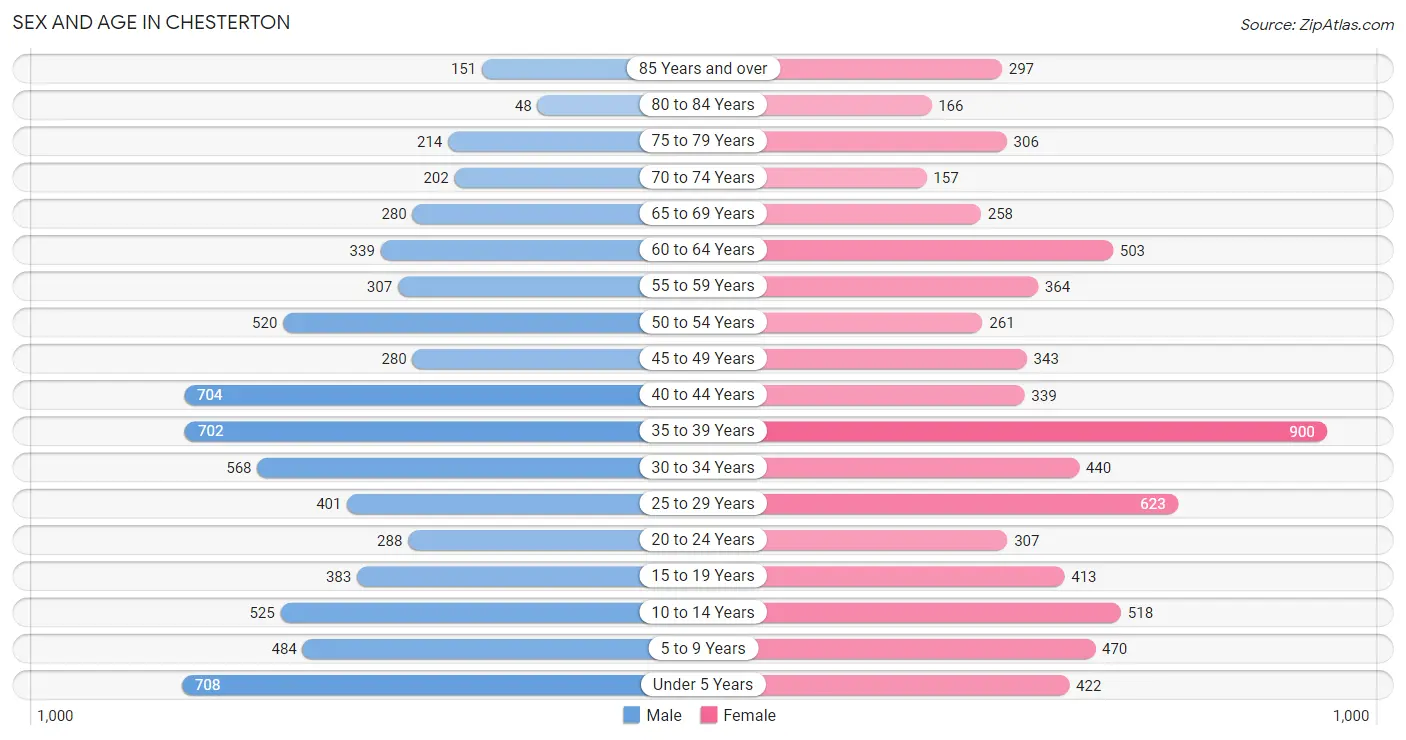
Sex and Age in Chesterton
Sex and Age in Chesterton
The most populous age groups in Chesterton are Under 5 Years (708 | 10.0%) for men and 35 to 39 Years (900 | 12.7%) for women.
| Age Bracket | Male | Female |
| Under 5 Years | 708 (10.0%) | 422 (5.9%) |
| 5 to 9 Years | 484 (6.8%) | 470 (6.6%) |
| 10 to 14 Years | 525 (7.4%) | 518 (7.3%) |
| 15 to 19 Years | 383 (5.4%) | 413 (5.8%) |
| 20 to 24 Years | 288 (4.1%) | 307 (4.3%) |
| 25 to 29 Years | 401 (5.6%) | 623 (8.8%) |
| 30 to 34 Years | 568 (8.0%) | 440 (6.2%) |
| 35 to 39 Years | 702 (9.9%) | 900 (12.7%) |
| 40 to 44 Years | 704 (9.9%) | 339 (4.8%) |
| 45 to 49 Years | 280 (3.9%) | 343 (4.8%) |
| 50 to 54 Years | 520 (7.3%) | 261 (3.7%) |
| 55 to 59 Years | 307 (4.3%) | 364 (5.1%) |
| 60 to 64 Years | 339 (4.8%) | 503 (7.1%) |
| 65 to 69 Years | 280 (3.9%) | 258 (3.6%) |
| 70 to 74 Years | 202 (2.8%) | 157 (2.2%) |
| 75 to 79 Years | 214 (3.0%) | 306 (4.3%) |
| 80 to 84 Years | 48 (0.7%) | 166 (2.3%) |
| 85 Years and over | 151 (2.1%) | 297 (4.2%) |
| Total | 7,104 (100.0%) | 7,087 (100.0%) |
Families and Households in Chesterton
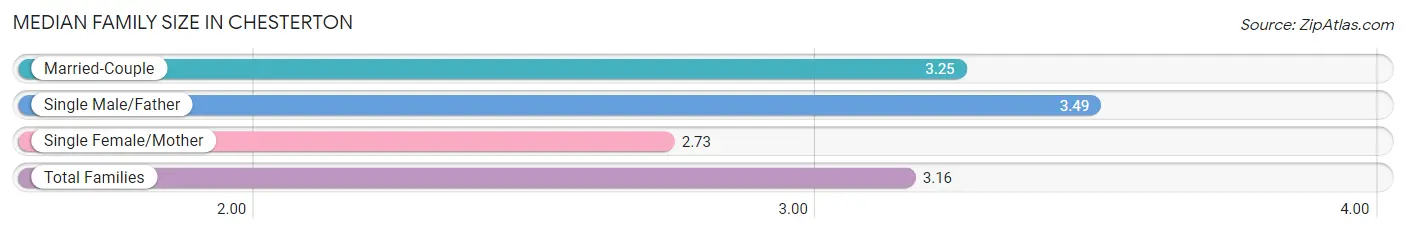
Median Family Size in Chesterton
The median family size in Chesterton is 3.16 persons per family, with single male/father families (127 | 3.8%) accounting for the largest median family size of 3.49 persons per family. On the other hand, single female/mother families (614 | 18.4%) represent the smallest median family size with 2.73 persons per family.
| Family Type | # Families | Family Size |
| Married-Couple | 2,600 (77.8%) | 3.25 |
| Single Male/Father | 127 (3.8%) | 3.49 |
| Single Female/Mother | 614 (18.4%) | 2.73 |
| Total Families | 3,341 (100.0%) | 3.16 |
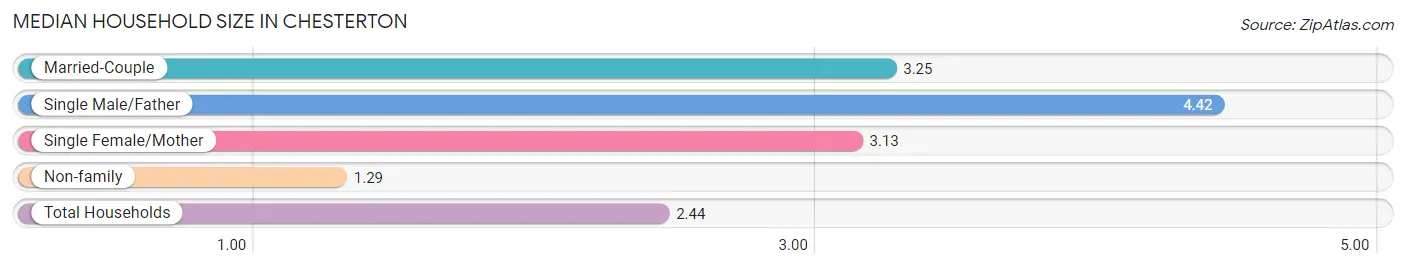
Median Household Size in Chesterton
The median household size in Chesterton is 2.44 persons per household, with single male/father households (127 | 2.2%) accounting for the largest median household size of 4.42 persons per household. non-family households (2,386 | 41.7%) represent the smallest median household size with 1.29 persons per household.
| Household Type | # Households | Household Size |
| Married-Couple | 2,600 (45.4%) | 3.25 |
| Single Male/Father | 127 (2.2%) | 4.42 |
| Single Female/Mother | 614 (10.7%) | 3.13 |
| Non-family | 2,386 (41.7%) | 1.29 |
| Total Households | 5,727 (100.0%) | 2.44 |
Household Size by Marriage Status in Chesterton
Out of a total of 5,727 households in Chesterton, 3,341 (58.3%) are family households, while 2,386 (41.7%) are nonfamily households. The most numerous type of family households are 2-person households, comprising 1,280, and the most common type of nonfamily households are 1-person households, comprising 1,834.
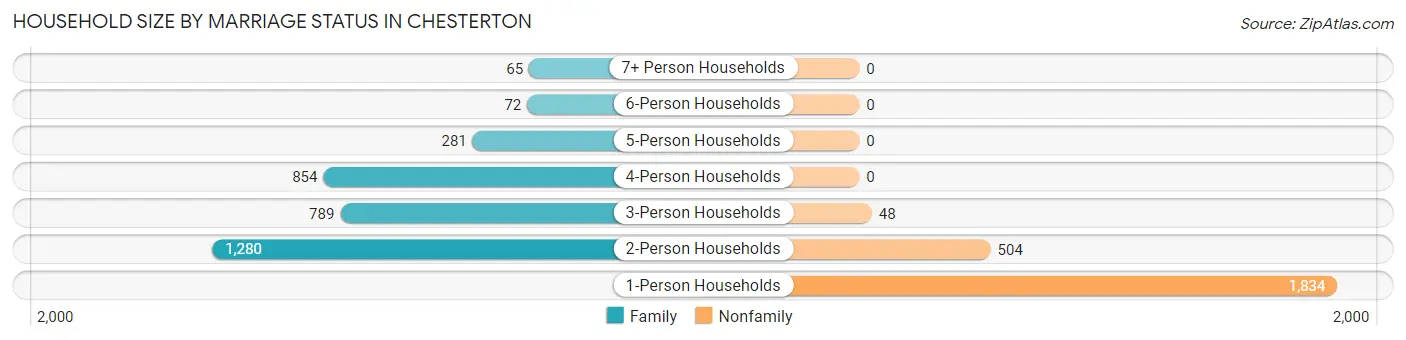
| Household Size | Family Households | Nonfamily Households |
| 1-Person Households | - | 1,834 (32.0%) |
| 2-Person Households | 1,280 (22.4%) | 504 (8.8%) |
| 3-Person Households | 789 (13.8%) | 48 (0.8%) |
| 4-Person Households | 854 (14.9%) | 0 (0.0%) |
| 5-Person Households | 281 (4.9%) | 0 (0.0%) |
| 6-Person Households | 72 (1.3%) | 0 (0.0%) |
| 7+ Person Households | 65 (1.1%) | 0 (0.0%) |
| Total | 3,341 (58.3%) | 2,386 (41.7%) |
Female Fertility in Chesterton
Fertility by Age in Chesterton
Average fertility rate in Chesterton is 42.0 births per 1,000 women. Women in the age bracket of 20 to 34 years have the highest fertility rate with 77.0 births per 1,000 women. Women in the age bracket of 20 to 34 years acount for 75.2% of all women with births.
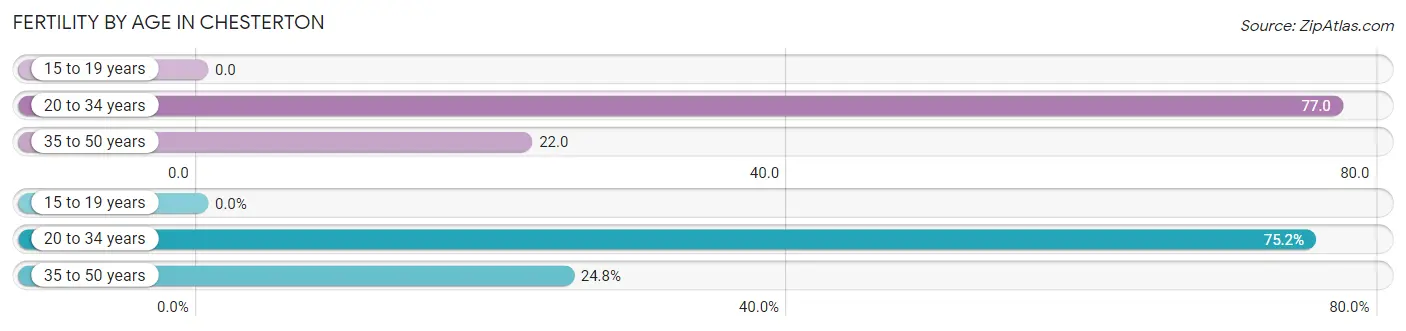
| Age Bracket | Women with Births | Births / 1,000 Women |
| 15 to 19 years | 0 (0.0%) | 0.0 |
| 20 to 34 years | 106 (75.2%) | 77.0 |
| 35 to 50 years | 35 (24.8%) | 22.0 |
| Total | 141 (100.0%) | 42.0 |
Fertility by Age by Marriage Status in Chesterton
31.2% of women with births (141) in Chesterton are married. The highest percentage of unmarried women with births falls into 20 to 34 years age bracket with 73.6% of them unmarried at the time of birth, while the lowest percentage of unmarried women with births belong to 35 to 50 years age bracket with 54.3% of them unmarried.
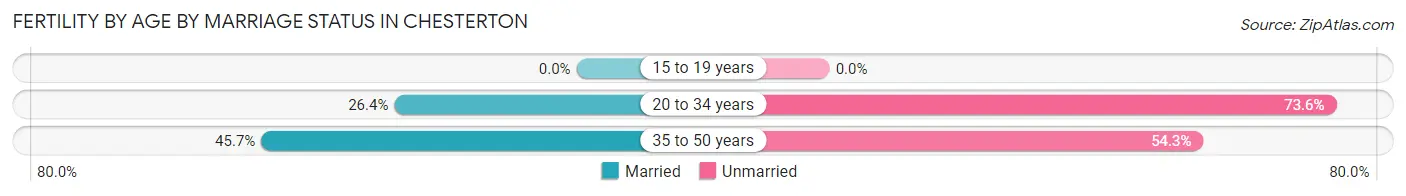
| Age Bracket | Married | Unmarried |
| 15 to 19 years | 0 (0.0%) | 0 (0.0%) |
| 20 to 34 years | 28 (26.4%) | 78 (73.6%) |
| 35 to 50 years | 16 (45.7%) | 19 (54.3%) |
| Total | 44 (31.2%) | 97 (68.8%) |
Fertility by Education in Chesterton
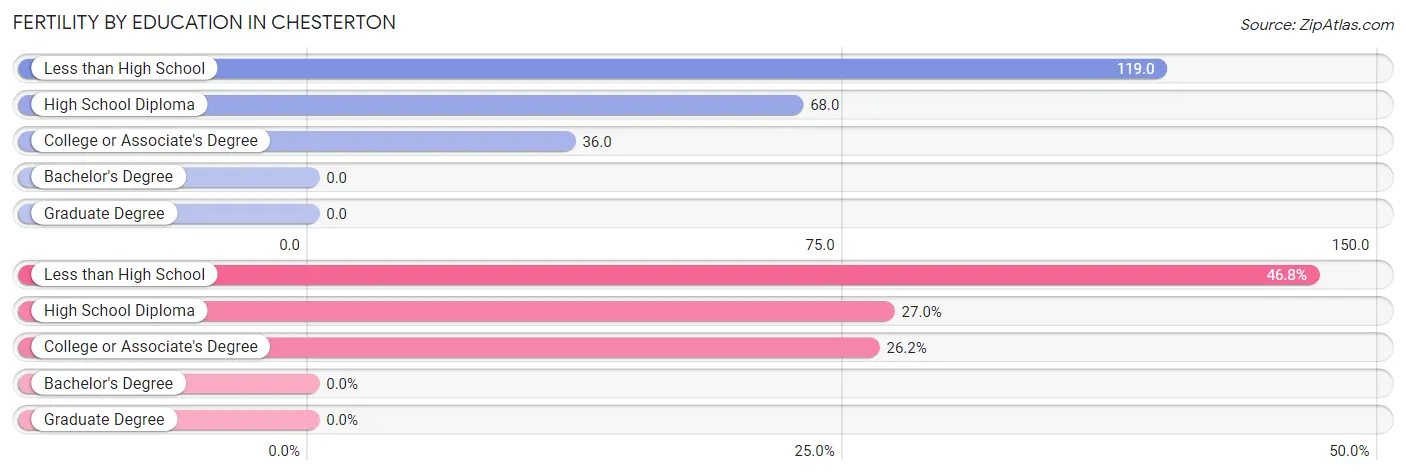
| Educational Attainment | Women with Births | Births / 1,000 Women |
| Less than High School | 66 (46.8%) | 119.0 |
| High School Diploma | 38 (27.0%) | 68.0 |
| College or Associate's Degree | 37 (26.2%) | 36.0 |
| Bachelor's Degree | 0 (0.0%) | 0.0 |
| Graduate Degree | 0 (0.0%) | 0.0 |
| Total | 141 (100.0%) | 42.0 |
Fertility by Education by Marriage Status in Chesterton
68.8% of women with births in Chesterton are unmarried. Women with the educational attainment of high school diploma are most likely to be married with 68.4% of them married at childbirth, while women with the educational attainment of less than high school are least likely to be married with 100.0% of them unmarried at childbirth.
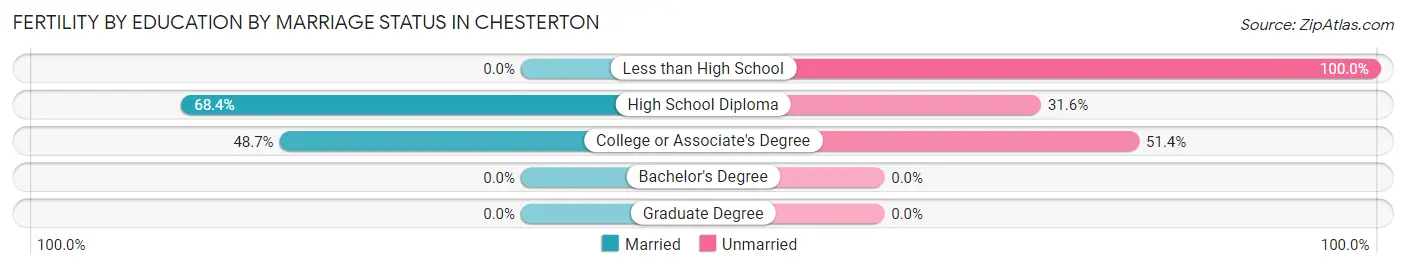
| Educational Attainment | Married | Unmarried |
| Less than High School | 0 (0.0%) | 66 (100.0%) |
| High School Diploma | 26 (68.4%) | 12 (31.6%) |
| College or Associate's Degree | 18 (48.6%) | 19 (51.3%) |
| Bachelor's Degree | 0 (0.0%) | 0 (0.0%) |
| Graduate Degree | 0 (0.0%) | 0 (0.0%) |
| Total | 44 (31.2%) | 97 (68.8%) |
Employment Characteristics in Chesterton
Employment by Class of Employer in Chesterton
Among the 6,739 employed individuals in Chesterton, private company employees (4,887 | 72.5%), not-for-profit organizations (489 | 7.3%), and local government employees (445 | 6.6%) make up the most common classes of employment.
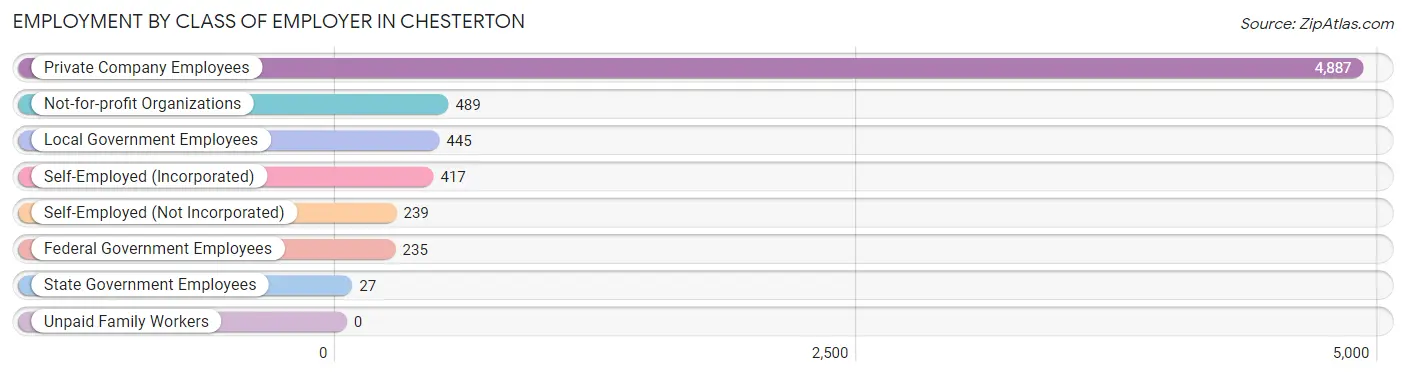
| Employer Class | # Employees | % Employees |
| Private Company Employees | 4,887 | 72.5% |
| Self-Employed (Incorporated) | 417 | 6.2% |
| Self-Employed (Not Incorporated) | 239 | 3.5% |
| Not-for-profit Organizations | 489 | 7.3% |
| Local Government Employees | 445 | 6.6% |
| State Government Employees | 27 | 0.4% |
| Federal Government Employees | 235 | 3.5% |
| Unpaid Family Workers | 0 | 0.0% |
| Total | 6,739 | 100.0% |
Employment Status by Age in Chesterton
According to the labor force statistics for Chesterton, out of the total population over 16 years of age (10,731), 69.1% or 7,415 individuals are in the labor force, with 8.2% or 608 of them unemployed. The age group with the highest labor force participation rate is 25 to 29 years, with 87.3% or 894 individuals in the labor force. Within the labor force, the 20 to 24 years age range has the highest percentage of unemployed individuals, with 33.0% or 148 of them being unemployed.
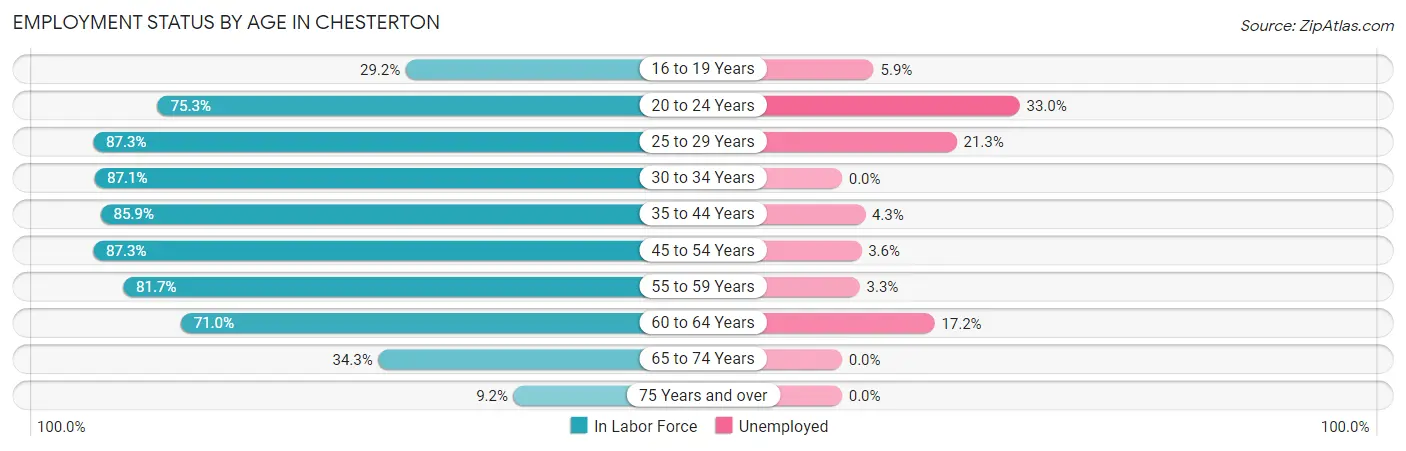
| Age Bracket | In Labor Force | Unemployed |
| 16 to 19 Years | 135 (29.2%) | 8 (5.9%) |
| 20 to 24 Years | 448 (75.3%) | 148 (33.0%) |
| 25 to 29 Years | 894 (87.3%) | 190 (21.3%) |
| 30 to 34 Years | 878 (87.1%) | 0 (0.0%) |
| 35 to 44 Years | 2,272 (85.9%) | 98 (4.3%) |
| 45 to 54 Years | 1,226 (87.3%) | 44 (3.6%) |
| 55 to 59 Years | 548 (81.7%) | 18 (3.3%) |
| 60 to 64 Years | 598 (71.0%) | 103 (17.2%) |
| 65 to 74 Years | 308 (34.3%) | 0 (0.0%) |
| 75 Years and over | 109 (9.2%) | 0 (0.0%) |
| Total | 7,415 (69.1%) | 608 (8.2%) |
Employment Status by Educational Attainment in Chesterton
According to labor force statistics for Chesterton, 84.5% of individuals (6,417) out of the total population between 25 and 64 years of age (7,594) are in the labor force, with 7.0% or 449 of them being unemployed. The group with the highest labor force participation rate are those with the educational attainment of bachelor's degree or higher, with 91.1% or 2,934 individuals in the labor force. Within the labor force, individuals with high school diploma education have the highest percentage of unemployment, with 13.5% or 217 of them being unemployed.
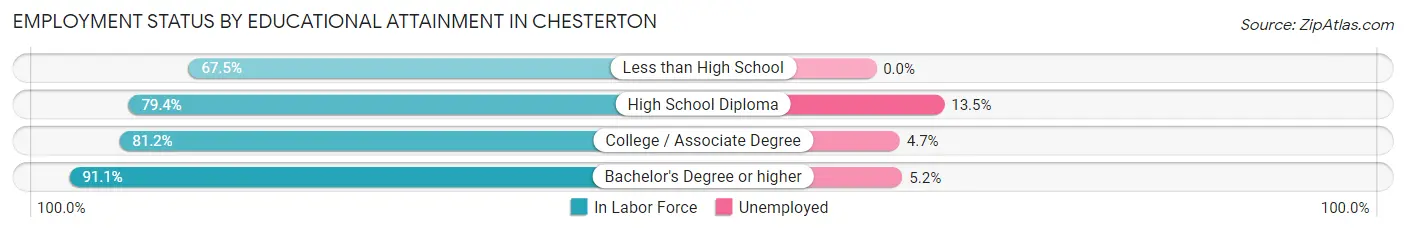
| Educational Attainment | In Labor Force | Unemployed |
| Less than High School | 162 (67.5%) | 0 (0.0%) |
| High School Diploma | 1,610 (79.4%) | 274 (13.5%) |
| College / Associate Degree | 1,709 (81.2%) | 99 (4.7%) |
| Bachelor's Degree or higher | 2,934 (91.1%) | 167 (5.2%) |
| Total | 6,417 (84.5%) | 532 (7.0%) |
Employment Occupations by Sex in Chesterton
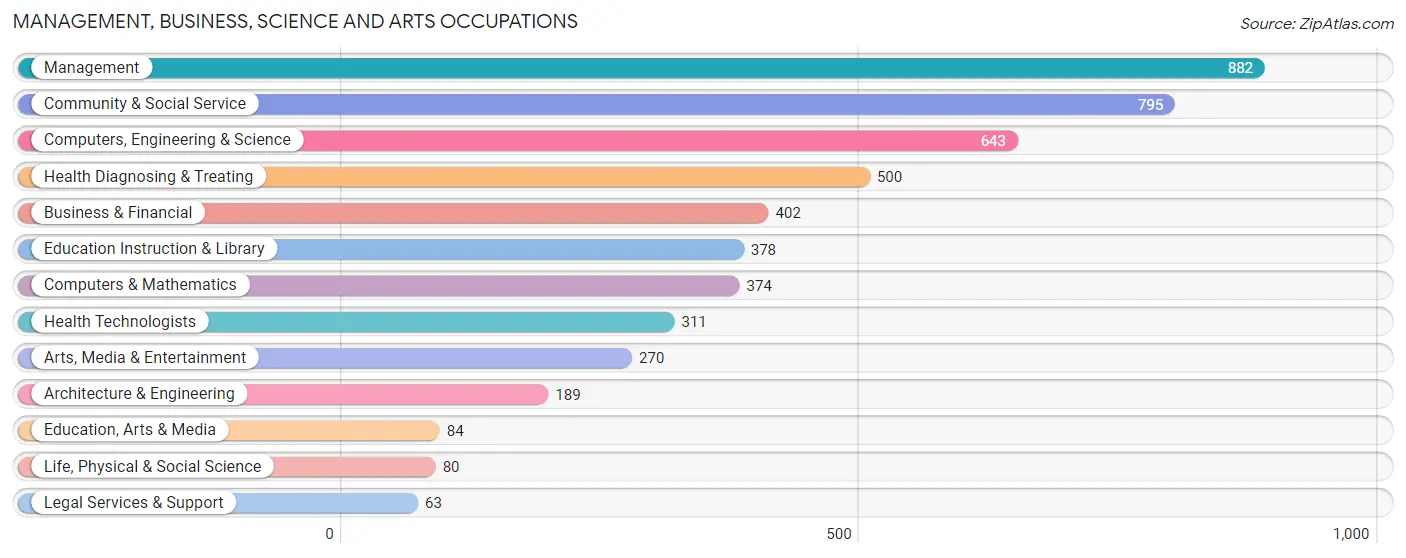
Management, Business, Science and Arts Occupations
The most common Management, Business, Science and Arts occupations in Chesterton are Management (882 | 13.0%), Community & Social Service (795 | 11.7%), Computers, Engineering & Science (643 | 9.5%), Health Diagnosing & Treating (500 | 7.3%), and Business & Financial (402 | 5.9%).
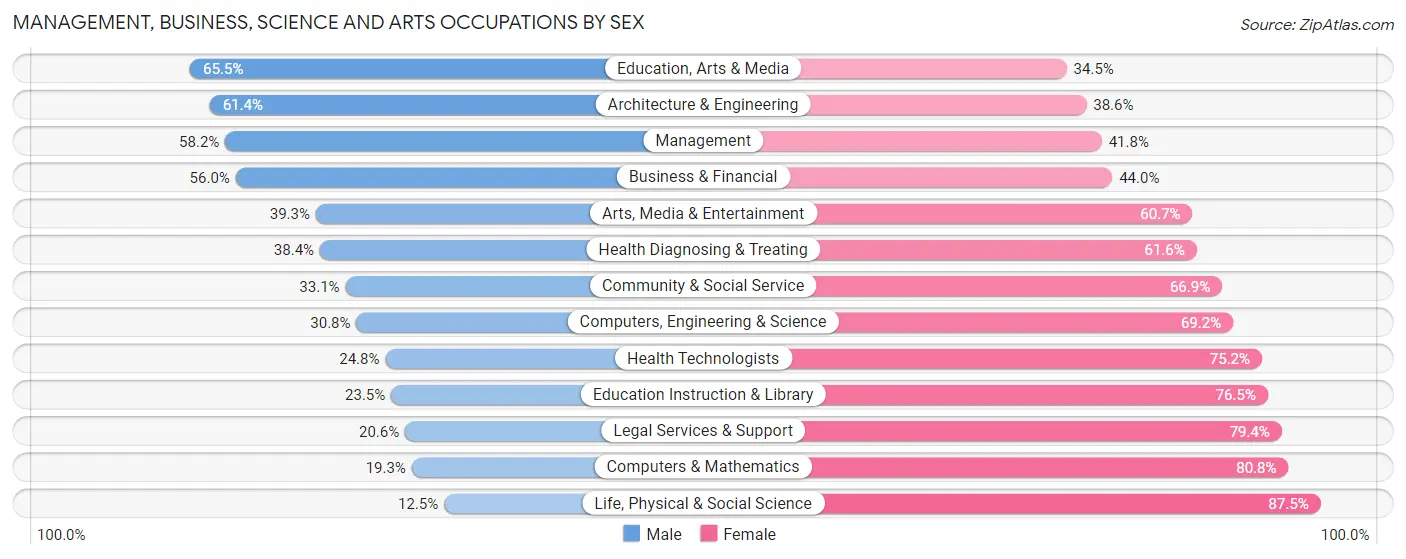
Management, Business, Science and Arts Occupations by Sex
Within the Management, Business, Science and Arts occupations in Chesterton, the most male-oriented occupations are Education, Arts & Media (65.5%), Architecture & Engineering (61.4%), and Management (58.2%), while the most female-oriented occupations are Life, Physical & Social Science (87.5%), Computers & Mathematics (80.7%), and Legal Services & Support (79.4%).
| Occupation | Male | Female |
| Management | 513 (58.2%) | 369 (41.8%) |
| Business & Financial | 225 (56.0%) | 177 (44.0%) |
| Computers, Engineering & Science | 198 (30.8%) | 445 (69.2%) |
| Computers & Mathematics | 72 (19.3%) | 302 (80.7%) |
| Architecture & Engineering | 116 (61.4%) | 73 (38.6%) |
| Life, Physical & Social Science | 10 (12.5%) | 70 (87.5%) |
| Community & Social Service | 263 (33.1%) | 532 (66.9%) |
| Education, Arts & Media | 55 (65.5%) | 29 (34.5%) |
| Legal Services & Support | 13 (20.6%) | 50 (79.4%) |
| Education Instruction & Library | 89 (23.5%) | 289 (76.5%) |
| Arts, Media & Entertainment | 106 (39.3%) | 164 (60.7%) |
| Health Diagnosing & Treating | 192 (38.4%) | 308 (61.6%) |
| Health Technologists | 77 (24.8%) | 234 (75.2%) |
| Total (Category) | 1,391 (43.2%) | 1,831 (56.8%) |
| Total (Overall) | 3,760 (55.2%) | 3,047 (44.8%) |
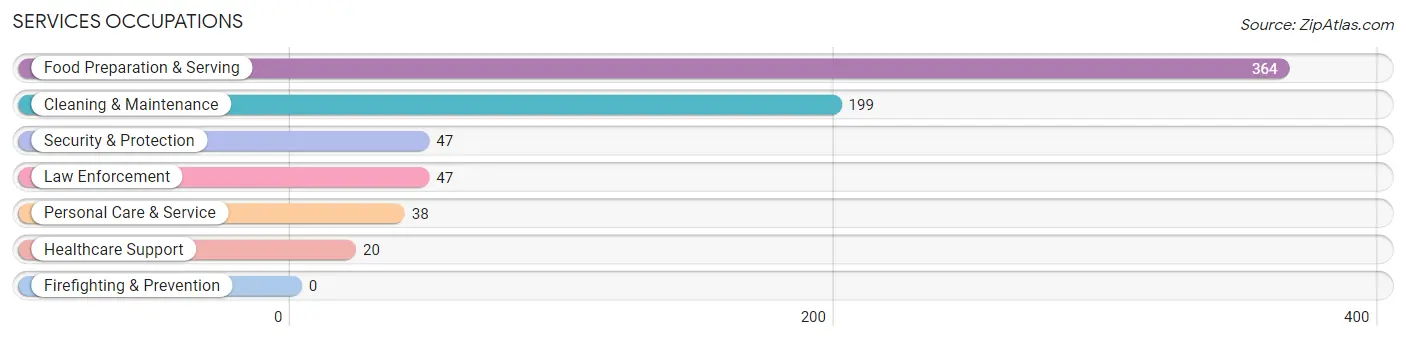
Services Occupations
The most common Services occupations in Chesterton are Food Preparation & Serving (364 | 5.3%), Cleaning & Maintenance (199 | 2.9%), Security & Protection (47 | 0.7%), Law Enforcement (47 | 0.7%), and Personal Care & Service (38 | 0.6%).
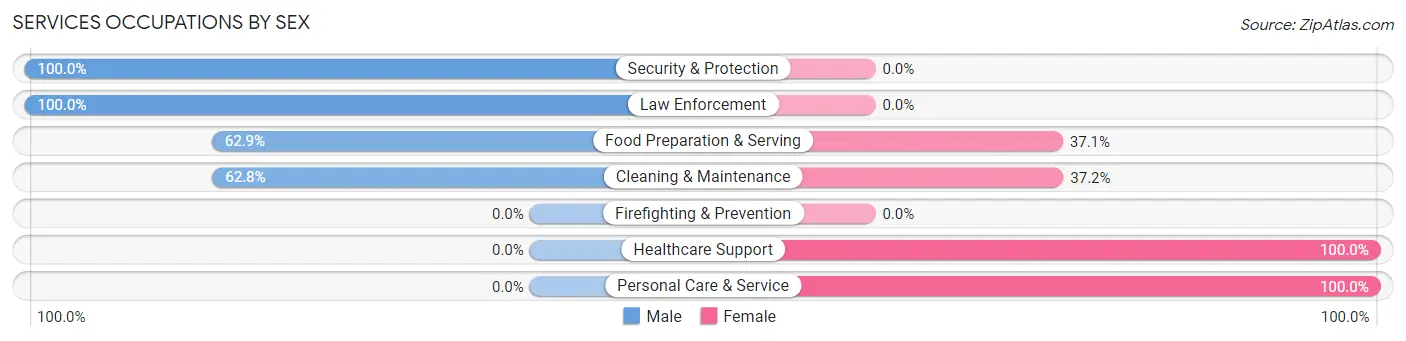
Services Occupations by Sex
Within the Services occupations in Chesterton, the most male-oriented occupations are Security & Protection (100.0%), Law Enforcement (100.0%), and Food Preparation & Serving (62.9%), while the most female-oriented occupations are Healthcare Support (100.0%), Personal Care & Service (100.0%), and Cleaning & Maintenance (37.2%).
| Occupation | Male | Female |
| Healthcare Support | 0 (0.0%) | 20 (100.0%) |
| Security & Protection | 47 (100.0%) | 0 (0.0%) |
| Firefighting & Prevention | 0 (0.0%) | 0 (0.0%) |
| Law Enforcement | 47 (100.0%) | 0 (0.0%) |
| Food Preparation & Serving | 229 (62.9%) | 135 (37.1%) |
| Cleaning & Maintenance | 125 (62.8%) | 74 (37.2%) |
| Personal Care & Service | 0 (0.0%) | 38 (100.0%) |
| Total (Category) | 401 (60.0%) | 267 (40.0%) |
| Total (Overall) | 3,760 (55.2%) | 3,047 (44.8%) |
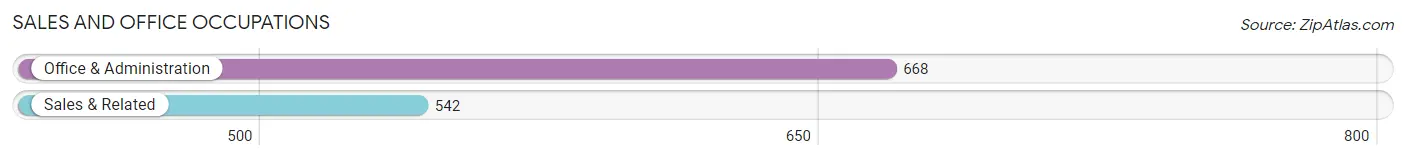
Sales and Office Occupations
The most common Sales and Office occupations in Chesterton are Office & Administration (668 | 9.8%), and Sales & Related (542 | 8.0%).
Sales and Office Occupations by Sex
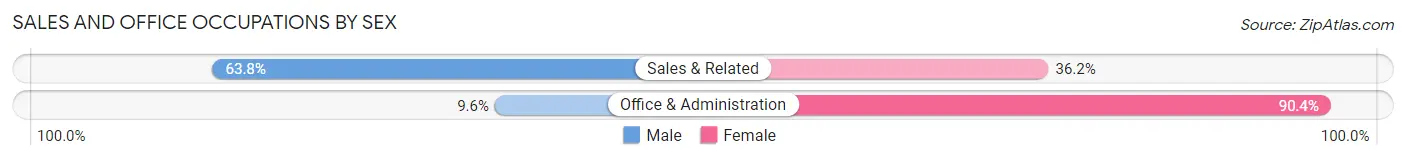
| Occupation | Male | Female |
| Sales & Related | 346 (63.8%) | 196 (36.2%) |
| Office & Administration | 64 (9.6%) | 604 (90.4%) |
| Total (Category) | 410 (33.9%) | 800 (66.1%) |
| Total (Overall) | 3,760 (55.2%) | 3,047 (44.8%) |
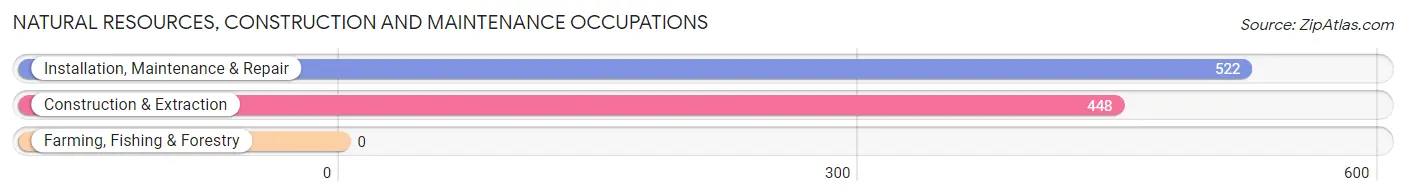
Natural Resources, Construction and Maintenance Occupations
The most common Natural Resources, Construction and Maintenance occupations in Chesterton are Installation, Maintenance & Repair (522 | 7.7%), and Construction & Extraction (448 | 6.6%).
Natural Resources, Construction and Maintenance Occupations by Sex
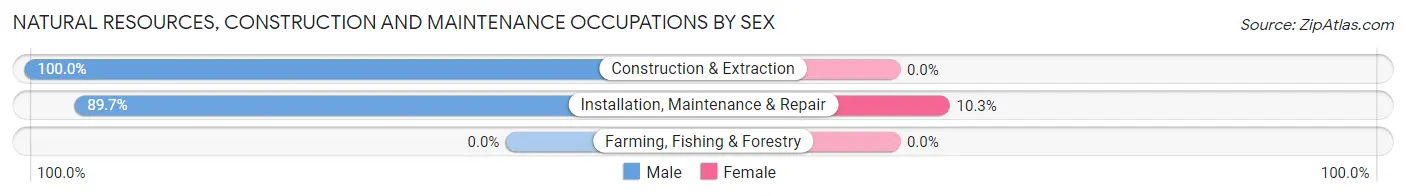
| Occupation | Male | Female |
| Farming, Fishing & Forestry | 0 (0.0%) | 0 (0.0%) |
| Construction & Extraction | 448 (100.0%) | 0 (0.0%) |
| Installation, Maintenance & Repair | 468 (89.7%) | 54 (10.3%) |
| Total (Category) | 916 (94.4%) | 54 (5.6%) |
| Total (Overall) | 3,760 (55.2%) | 3,047 (44.8%) |
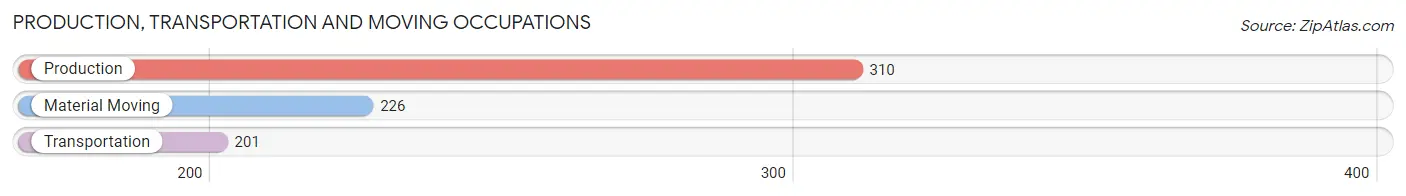
Production, Transportation and Moving Occupations
The most common Production, Transportation and Moving occupations in Chesterton are Production (310 | 4.5%), Material Moving (226 | 3.3%), and Transportation (201 | 2.9%).
Production, Transportation and Moving Occupations by Sex
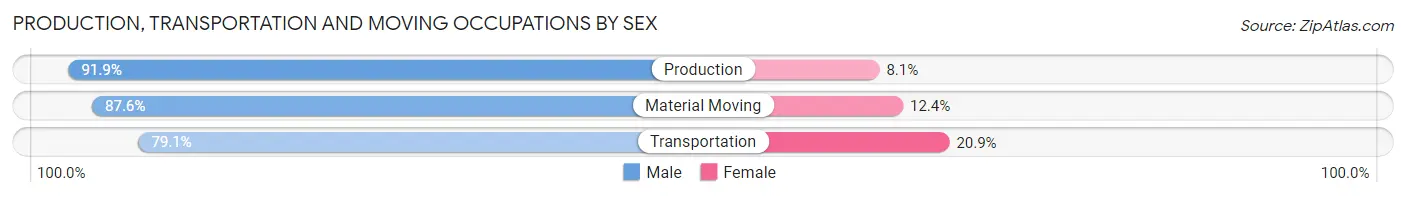
| Occupation | Male | Female |
| Production | 285 (91.9%) | 25 (8.1%) |
| Transportation | 159 (79.1%) | 42 (20.9%) |
| Material Moving | 198 (87.6%) | 28 (12.4%) |
| Total (Category) | 642 (87.1%) | 95 (12.9%) |
| Total (Overall) | 3,760 (55.2%) | 3,047 (44.8%) |
Employment Industries by Sex in Chesterton
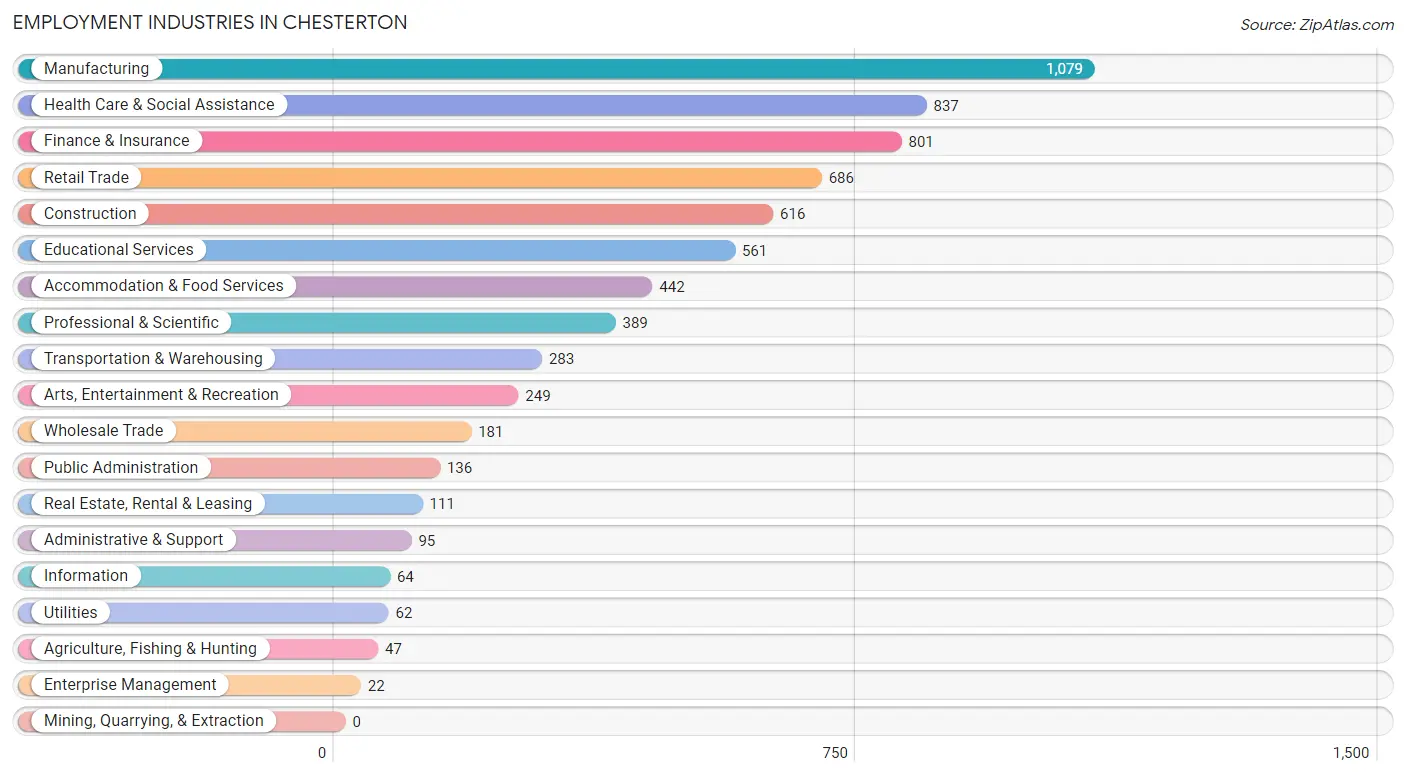
Employment Industries in Chesterton
The major employment industries in Chesterton include Manufacturing (1,079 | 15.9%), Health Care & Social Assistance (837 | 12.3%), Finance & Insurance (801 | 11.8%), Retail Trade (686 | 10.1%), and Construction (616 | 9.0%).
Employment Industries by Sex in Chesterton
The Chesterton industries that see more men than women are Agriculture, Fishing & Hunting (100.0%), Enterprise Management (100.0%), and Administrative & Support (97.9%), whereas the industries that tend to have a higher number of women are Information (81.2%), Public Administration (80.1%), and Educational Services (76.8%).
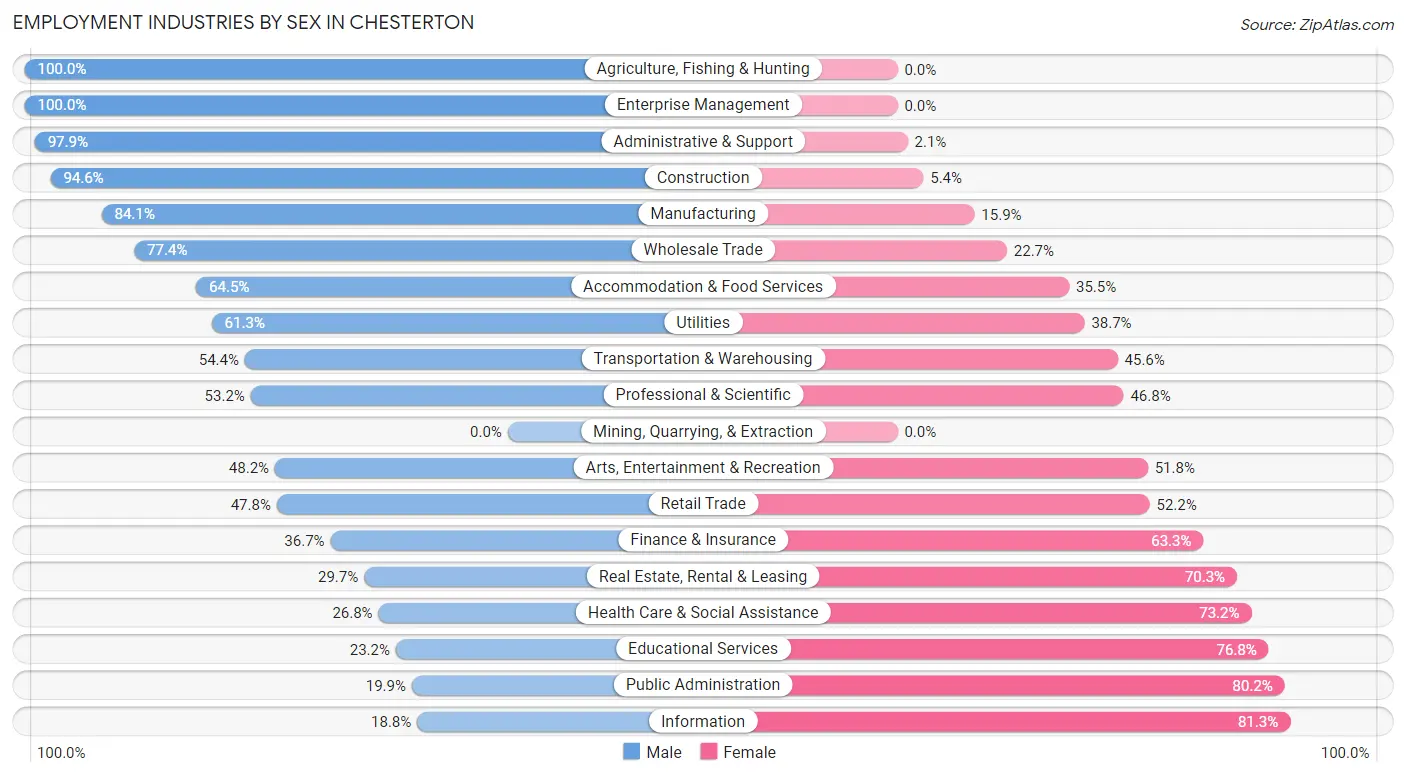
| Industry | Male | Female |
| Agriculture, Fishing & Hunting | 47 (100.0%) | 0 (0.0%) |
| Mining, Quarrying, & Extraction | 0 (0.0%) | 0 (0.0%) |
| Construction | 583 (94.6%) | 33 (5.4%) |
| Manufacturing | 907 (84.1%) | 172 (15.9%) |
| Wholesale Trade | 140 (77.3%) | 41 (22.7%) |
| Retail Trade | 328 (47.8%) | 358 (52.2%) |
| Transportation & Warehousing | 154 (54.4%) | 129 (45.6%) |
| Utilities | 38 (61.3%) | 24 (38.7%) |
| Information | 12 (18.8%) | 52 (81.2%) |
| Finance & Insurance | 294 (36.7%) | 507 (63.3%) |
| Real Estate, Rental & Leasing | 33 (29.7%) | 78 (70.3%) |
| Professional & Scientific | 207 (53.2%) | 182 (46.8%) |
| Enterprise Management | 22 (100.0%) | 0 (0.0%) |
| Administrative & Support | 93 (97.9%) | 2 (2.1%) |
| Educational Services | 130 (23.2%) | 431 (76.8%) |
| Health Care & Social Assistance | 224 (26.8%) | 613 (73.2%) |
| Arts, Entertainment & Recreation | 120 (48.2%) | 129 (51.8%) |
| Accommodation & Food Services | 285 (64.5%) | 157 (35.5%) |
| Public Administration | 27 (19.9%) | 109 (80.1%) |
| Total | 3,760 (55.2%) | 3,047 (44.8%) |
Education in Chesterton
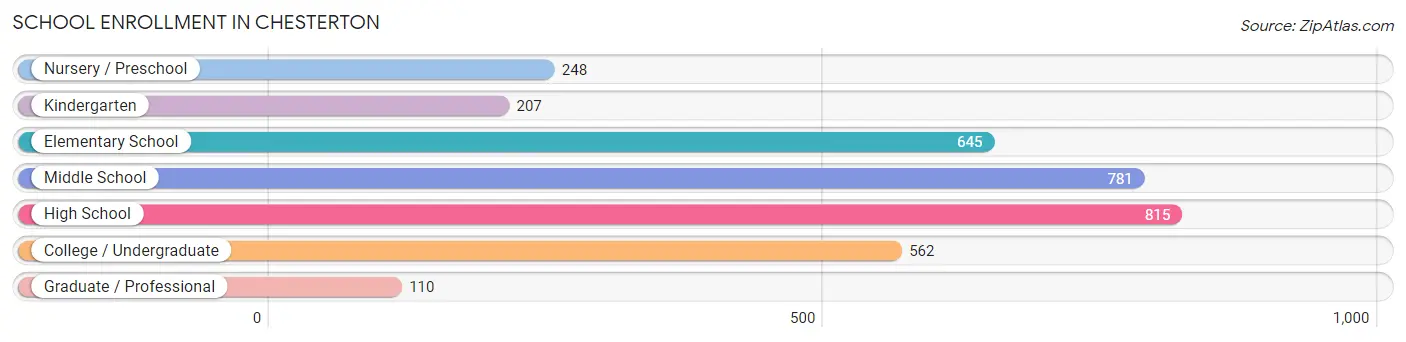
School Enrollment in Chesterton
The most common levels of schooling among the 3,368 students in Chesterton are high school (815 | 24.2%), middle school (781 | 23.2%), and elementary school (645 | 19.2%).
| School Level | # Students | % Students |
| Nursery / Preschool | 248 | 7.4% |
| Kindergarten | 207 | 6.1% |
| Elementary School | 645 | 19.2% |
| Middle School | 781 | 23.2% |
| High School | 815 | 24.2% |
| College / Undergraduate | 562 | 16.7% |
| Graduate / Professional | 110 | 3.3% |
| Total | 3,368 | 100.0% |
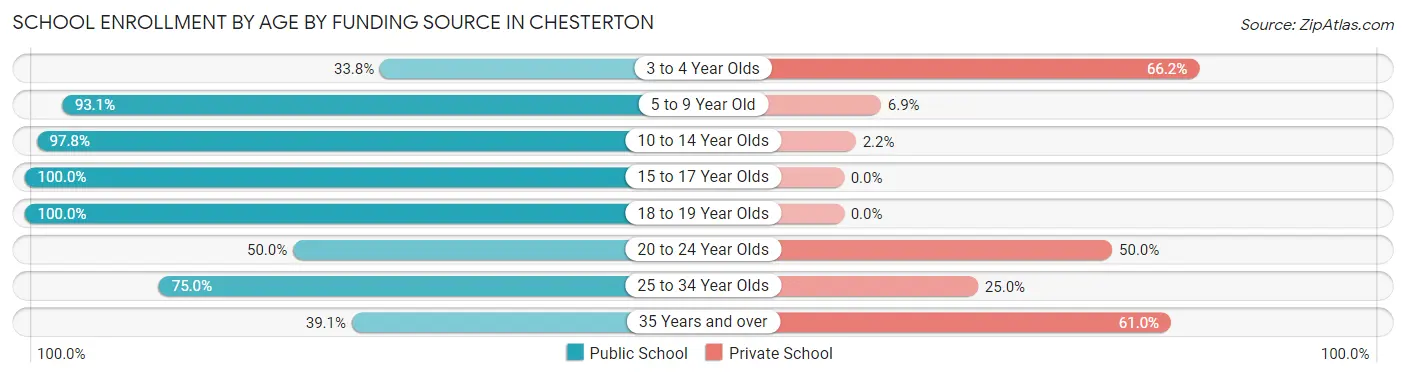
School Enrollment by Age by Funding Source in Chesterton
Out of a total of 3,368 students who are enrolled in schools in Chesterton, 573 (17.0%) attend a private institution, while the remaining 2,795 (83.0%) are enrolled in public schools. The age group of 3 to 4 year olds has the highest likelihood of being enrolled in private schools, with 141 (66.2% in the age bracket) enrolled. Conversely, the age group of 15 to 17 year olds has the lowest likelihood of being enrolled in a private school, with 583 (100.0% in the age bracket) attending a public institution.
| Age Bracket | Public School | Private School |
| 3 to 4 Year Olds | 72 (33.8%) | 141 (66.2%) |
| 5 to 9 Year Old | 672 (93.1%) | 50 (6.9%) |
| 10 to 14 Year Olds | 1,005 (97.8%) | 23 (2.2%) |
| 15 to 17 Year Olds | 583 (100.0%) | 0 (0.0%) |
| 18 to 19 Year Olds | 180 (100.0%) | 0 (0.0%) |
| 20 to 24 Year Olds | 47 (50.0%) | 47 (50.0%) |
| 25 to 34 Year Olds | 48 (75.0%) | 16 (25.0%) |
| 35 Years and over | 189 (39.1%) | 295 (61.0%) |
| Total | 2,795 (83.0%) | 573 (17.0%) |
Educational Attainment by Field of Study in Chesterton
Business (878 | 21.4%), education (610 | 14.9%), science & technology (443 | 10.8%), bio, nature & agricultural (324 | 7.9%), and engineering (276 | 6.7%) are the most common fields of study among 4,093 individuals in Chesterton who have obtained a bachelor's degree or higher.
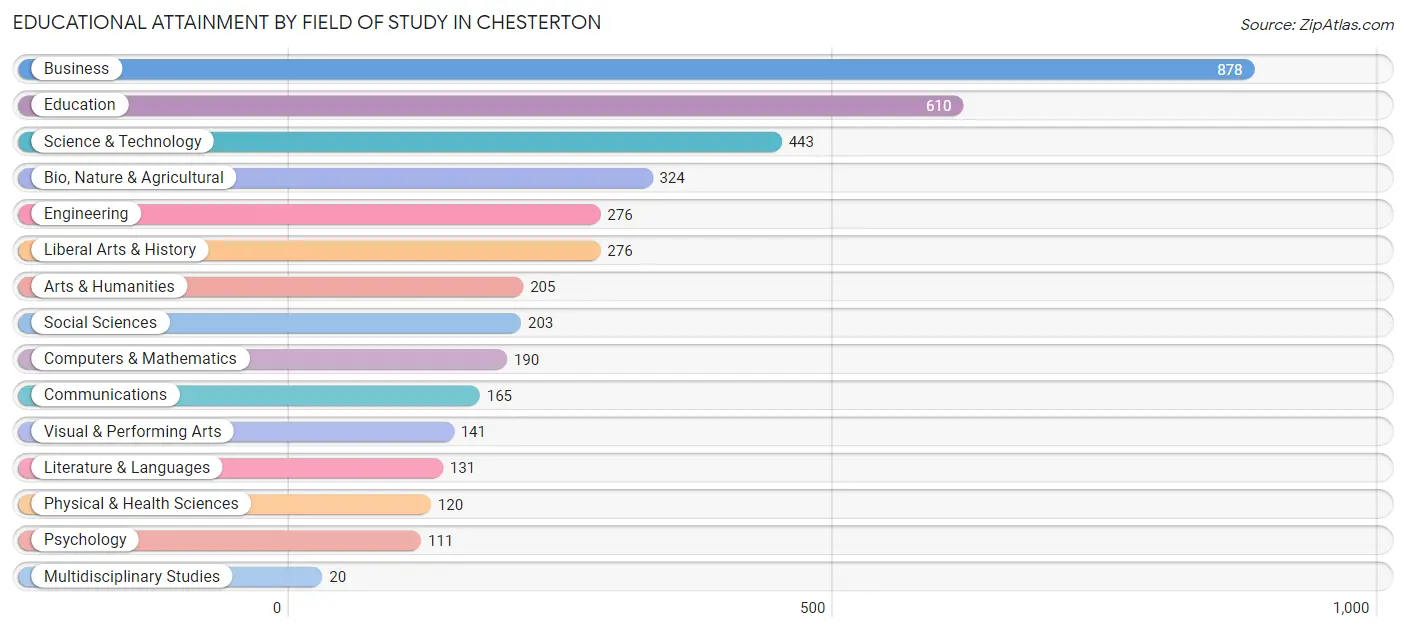
| Field of Study | # Graduates | % Graduates |
| Computers & Mathematics | 190 | 4.6% |
| Bio, Nature & Agricultural | 324 | 7.9% |
| Physical & Health Sciences | 120 | 2.9% |
| Psychology | 111 | 2.7% |
| Social Sciences | 203 | 5.0% |
| Engineering | 276 | 6.7% |
| Multidisciplinary Studies | 20 | 0.5% |
| Science & Technology | 443 | 10.8% |
| Business | 878 | 21.4% |
| Education | 610 | 14.9% |
| Literature & Languages | 131 | 3.2% |
| Liberal Arts & History | 276 | 6.7% |
| Visual & Performing Arts | 141 | 3.4% |
| Communications | 165 | 4.0% |
| Arts & Humanities | 205 | 5.0% |
| Total | 4,093 | 100.0% |
Transportation & Commute in Chesterton
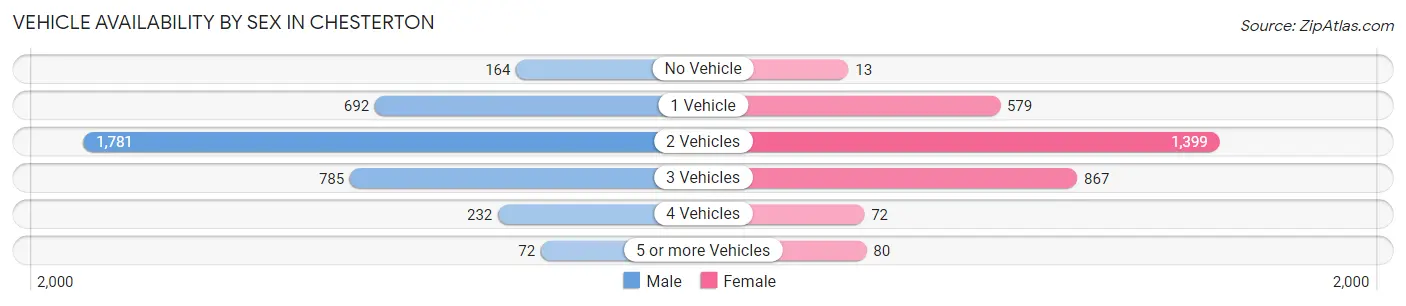
Vehicle Availability by Sex in Chesterton
The most prevalent vehicle ownership categories in Chesterton are males with 2 vehicles (1,781, accounting for 47.8%) and females with 2 vehicles (1,399, making up 59.2%).
| Vehicles Available | Male | Female |
| No Vehicle | 164 (4.4%) | 13 (0.4%) |
| 1 Vehicle | 692 (18.6%) | 579 (19.2%) |
| 2 Vehicles | 1,781 (47.8%) | 1,399 (46.5%) |
| 3 Vehicles | 785 (21.1%) | 867 (28.8%) |
| 4 Vehicles | 232 (6.2%) | 72 (2.4%) |
| 5 or more Vehicles | 72 (1.9%) | 80 (2.7%) |
| Total | 3,726 (100.0%) | 3,010 (100.0%) |
Commute Time in Chesterton
The most frequently occuring commute durations in Chesterton are 5 to 9 minutes (786 commuters, 14.4%), 15 to 19 minutes (778 commuters, 14.2%), and 20 to 24 minutes (692 commuters, 12.6%).
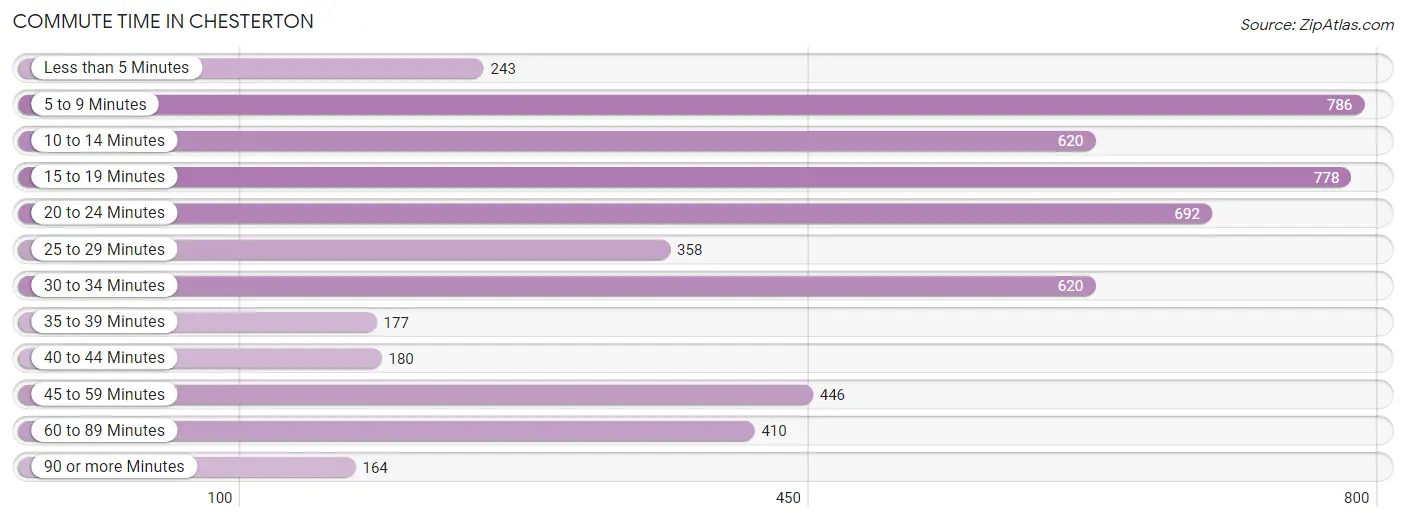
| Commute Time | # Commuters | % Commuters |
| Less than 5 Minutes | 243 | 4.4% |
| 5 to 9 Minutes | 786 | 14.4% |
| 10 to 14 Minutes | 620 | 11.3% |
| 15 to 19 Minutes | 778 | 14.2% |
| 20 to 24 Minutes | 692 | 12.6% |
| 25 to 29 Minutes | 358 | 6.5% |
| 30 to 34 Minutes | 620 | 11.3% |
| 35 to 39 Minutes | 177 | 3.2% |
| 40 to 44 Minutes | 180 | 3.3% |
| 45 to 59 Minutes | 446 | 8.2% |
| 60 to 89 Minutes | 410 | 7.5% |
| 90 or more Minutes | 164 | 3.0% |
Commute Time by Sex in Chesterton
The most common commute times in Chesterton are 15 to 19 minutes (510 commuters, 16.2%) for males and 5 to 9 minutes (449 commuters, 19.2%) for females.
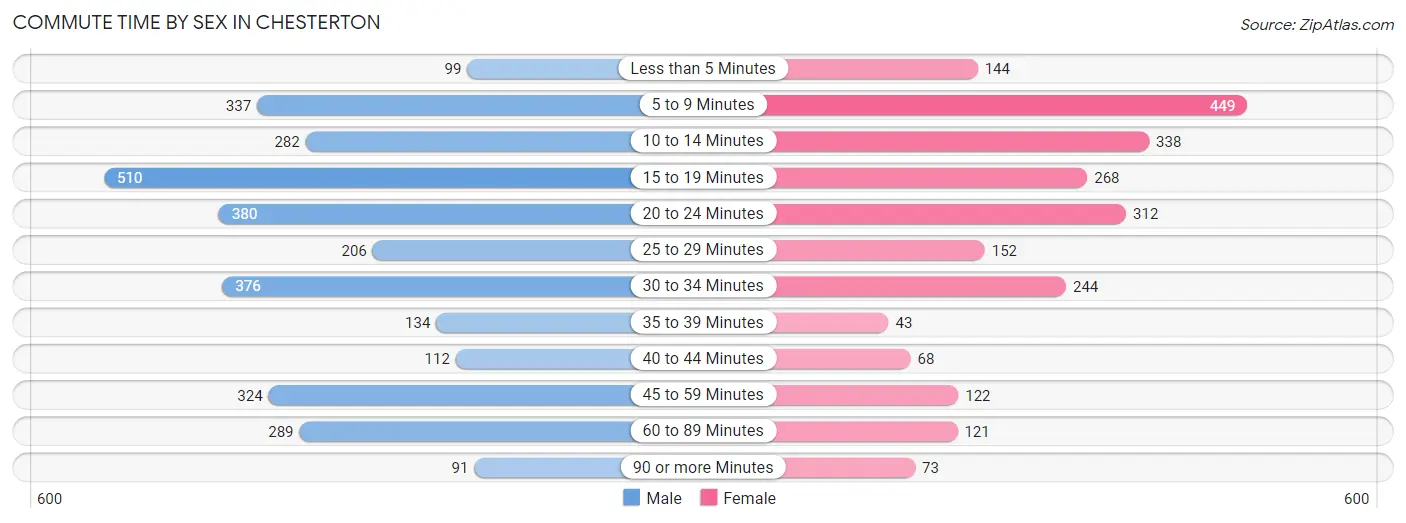
| Commute Time | Male | Female |
| Less than 5 Minutes | 99 (3.2%) | 144 (6.2%) |
| 5 to 9 Minutes | 337 (10.7%) | 449 (19.2%) |
| 10 to 14 Minutes | 282 (9.0%) | 338 (14.5%) |
| 15 to 19 Minutes | 510 (16.2%) | 268 (11.5%) |
| 20 to 24 Minutes | 380 (12.1%) | 312 (13.4%) |
| 25 to 29 Minutes | 206 (6.6%) | 152 (6.5%) |
| 30 to 34 Minutes | 376 (12.0%) | 244 (10.4%) |
| 35 to 39 Minutes | 134 (4.3%) | 43 (1.8%) |
| 40 to 44 Minutes | 112 (3.6%) | 68 (2.9%) |
| 45 to 59 Minutes | 324 (10.3%) | 122 (5.2%) |
| 60 to 89 Minutes | 289 (9.2%) | 121 (5.2%) |
| 90 or more Minutes | 91 (2.9%) | 73 (3.1%) |
Time of Departure to Work by Sex in Chesterton
The most frequent times of departure to work in Chesterton are 6:30 AM to 6:59 AM (441, 14.0%) for males and 7:00 AM to 7:29 AM (407, 17.4%) for females.
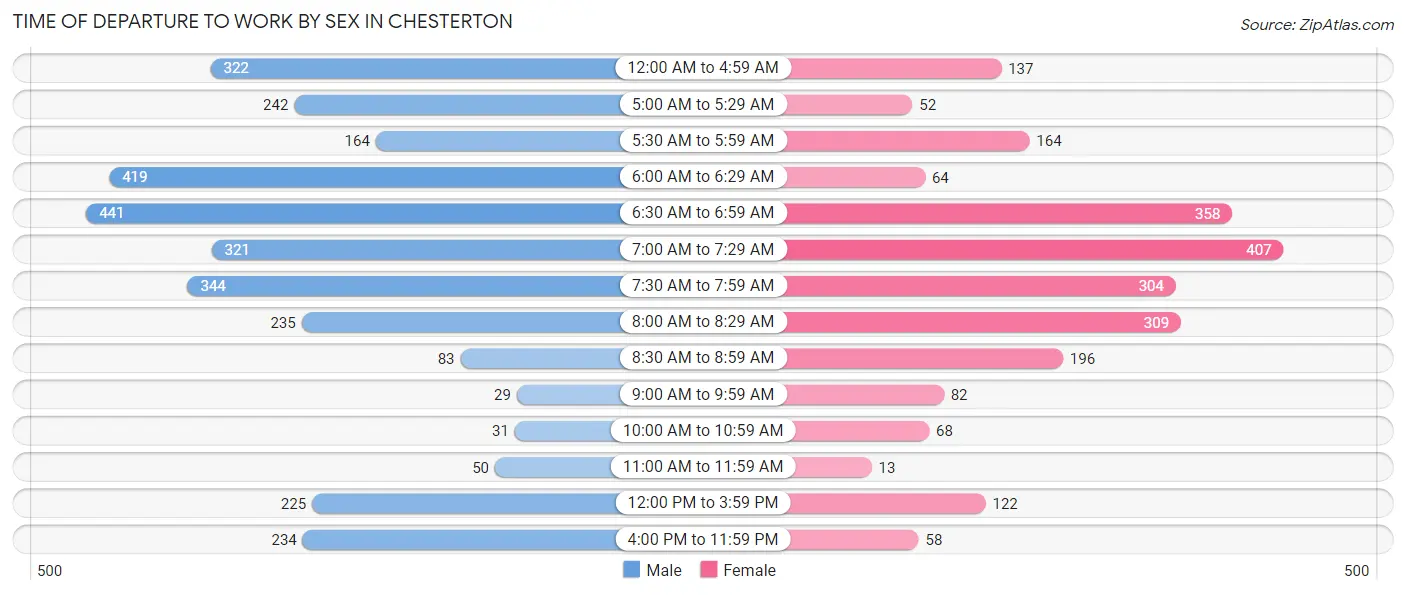
| Time of Departure | Male | Female |
| 12:00 AM to 4:59 AM | 322 (10.2%) | 137 (5.9%) |
| 5:00 AM to 5:29 AM | 242 (7.7%) | 52 (2.2%) |
| 5:30 AM to 5:59 AM | 164 (5.2%) | 164 (7.0%) |
| 6:00 AM to 6:29 AM | 419 (13.3%) | 64 (2.7%) |
| 6:30 AM to 6:59 AM | 441 (14.0%) | 358 (15.3%) |
| 7:00 AM to 7:29 AM | 321 (10.2%) | 407 (17.4%) |
| 7:30 AM to 7:59 AM | 344 (11.0%) | 304 (13.0%) |
| 8:00 AM to 8:29 AM | 235 (7.5%) | 309 (13.2%) |
| 8:30 AM to 8:59 AM | 83 (2.6%) | 196 (8.4%) |
| 9:00 AM to 9:59 AM | 29 (0.9%) | 82 (3.5%) |
| 10:00 AM to 10:59 AM | 31 (1.0%) | 68 (2.9%) |
| 11:00 AM to 11:59 AM | 50 (1.6%) | 13 (0.6%) |
| 12:00 PM to 3:59 PM | 225 (7.2%) | 122 (5.2%) |
| 4:00 PM to 11:59 PM | 234 (7.4%) | 58 (2.5%) |
| Total | 3,140 (100.0%) | 2,334 (100.0%) |
Housing Occupancy in Chesterton
Occupancy by Ownership in Chesterton
Of the total 5,727 dwellings in Chesterton, owner-occupied units account for 4,092 (71.5%), while renter-occupied units make up 1,635 (28.5%).
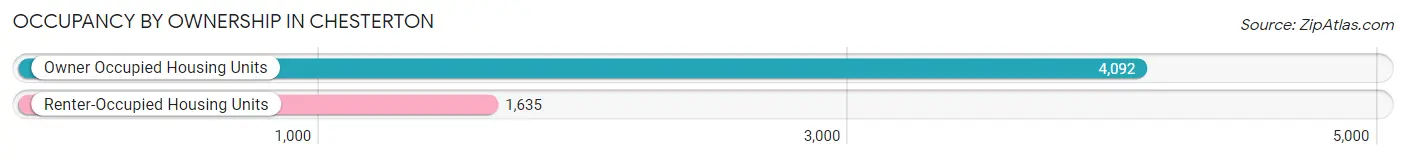
| Occupancy | # Housing Units | % Housing Units |
| Owner Occupied Housing Units | 4,092 | 71.5% |
| Renter-Occupied Housing Units | 1,635 | 28.5% |
| Total Occupied Housing Units | 5,727 | 100.0% |
Occupancy by Household Size in Chesterton
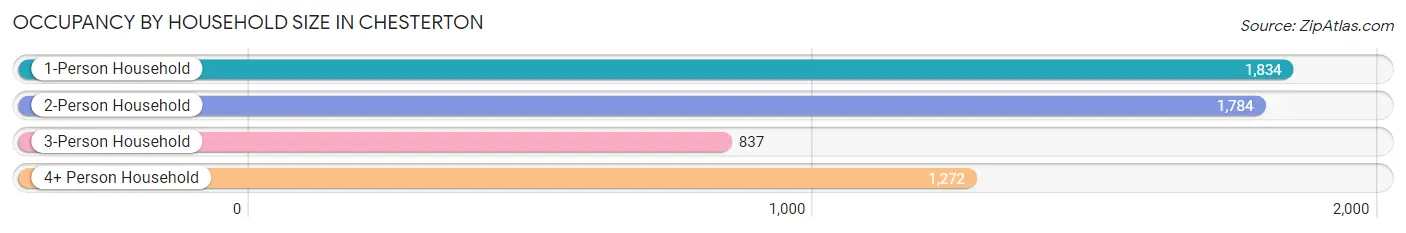
| Household Size | # Housing Units | % Housing Units |
| 1-Person Household | 1,834 | 32.0% |
| 2-Person Household | 1,784 | 31.1% |
| 3-Person Household | 837 | 14.6% |
| 4+ Person Household | 1,272 | 22.2% |
| Total Housing Units | 5,727 | 100.0% |
Occupancy by Ownership by Household Size in Chesterton
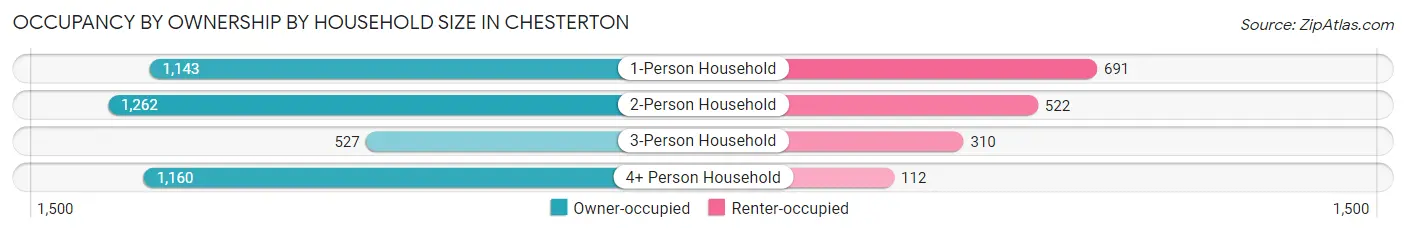
| Household Size | Owner-occupied | Renter-occupied |
| 1-Person Household | 1,143 (62.3%) | 691 (37.7%) |
| 2-Person Household | 1,262 (70.7%) | 522 (29.3%) |
| 3-Person Household | 527 (63.0%) | 310 (37.0%) |
| 4+ Person Household | 1,160 (91.2%) | 112 (8.8%) |
| Total Housing Units | 4,092 (71.5%) | 1,635 (28.5%) |
Occupancy by Educational Attainment in Chesterton
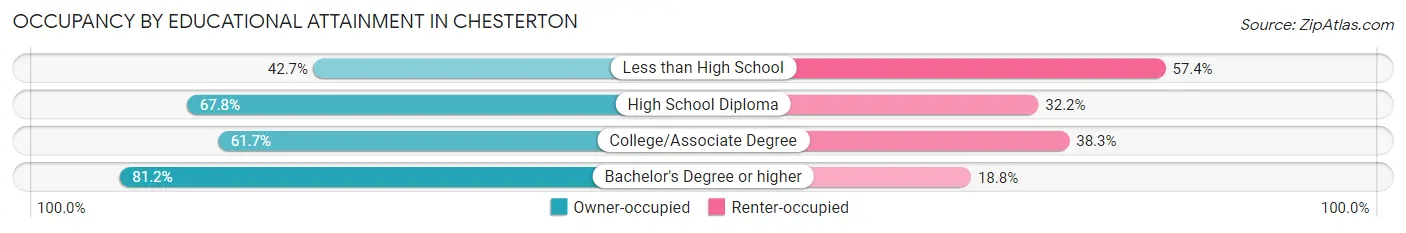
| Household Size | Owner-occupied | Renter-occupied |
| Less than High School | 29 (42.6%) | 39 (57.4%) |
| High School Diploma | 1,038 (67.8%) | 492 (32.2%) |
| College/Associate Degree | 1,038 (61.7%) | 644 (38.3%) |
| Bachelor's Degree or higher | 1,987 (81.2%) | 460 (18.8%) |
Occupancy by Age of Householder in Chesterton
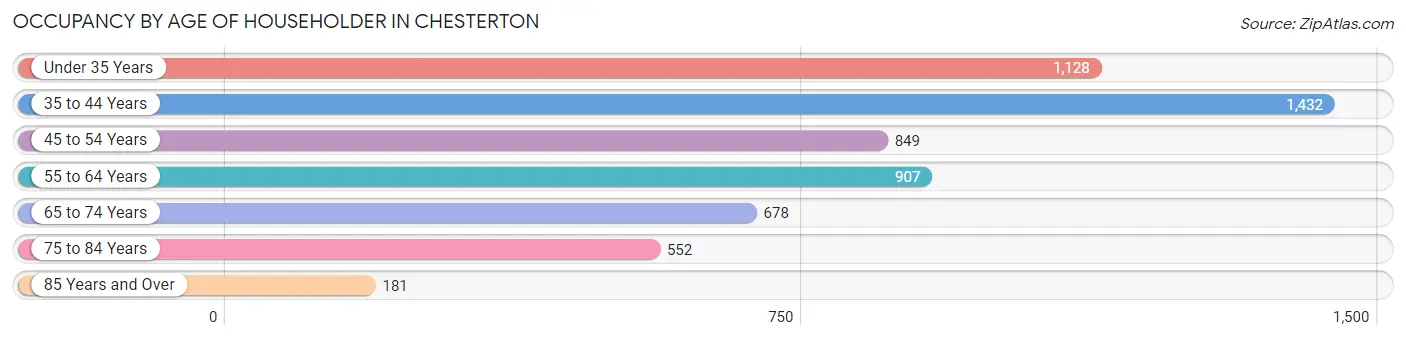
| Age Bracket | # Households | % Households |
| Under 35 Years | 1,128 | 19.7% |
| 35 to 44 Years | 1,432 | 25.0% |
| 45 to 54 Years | 849 | 14.8% |
| 55 to 64 Years | 907 | 15.8% |
| 65 to 74 Years | 678 | 11.8% |
| 75 to 84 Years | 552 | 9.6% |
| 85 Years and Over | 181 | 3.2% |
| Total | 5,727 | 100.0% |
Housing Finances in Chesterton
Median Income by Occupancy in Chesterton
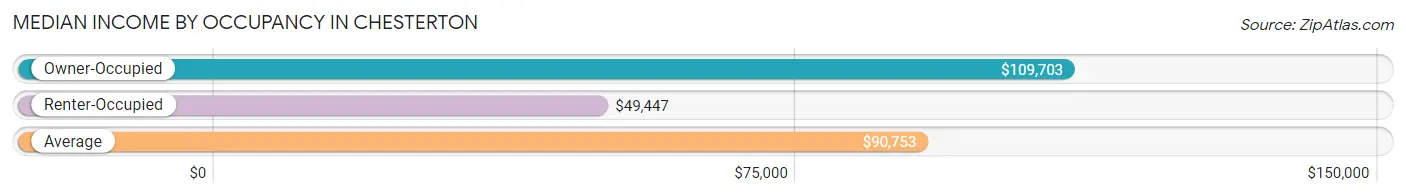
| Occupancy Type | # Households | Median Income |
| Owner-Occupied | 4,092 (71.5%) | $109,703 |
| Renter-Occupied | 1,635 (28.5%) | $49,447 |
| Average | 5,727 (100.0%) | $90,753 |
Occupancy by Householder Income Bracket in Chesterton
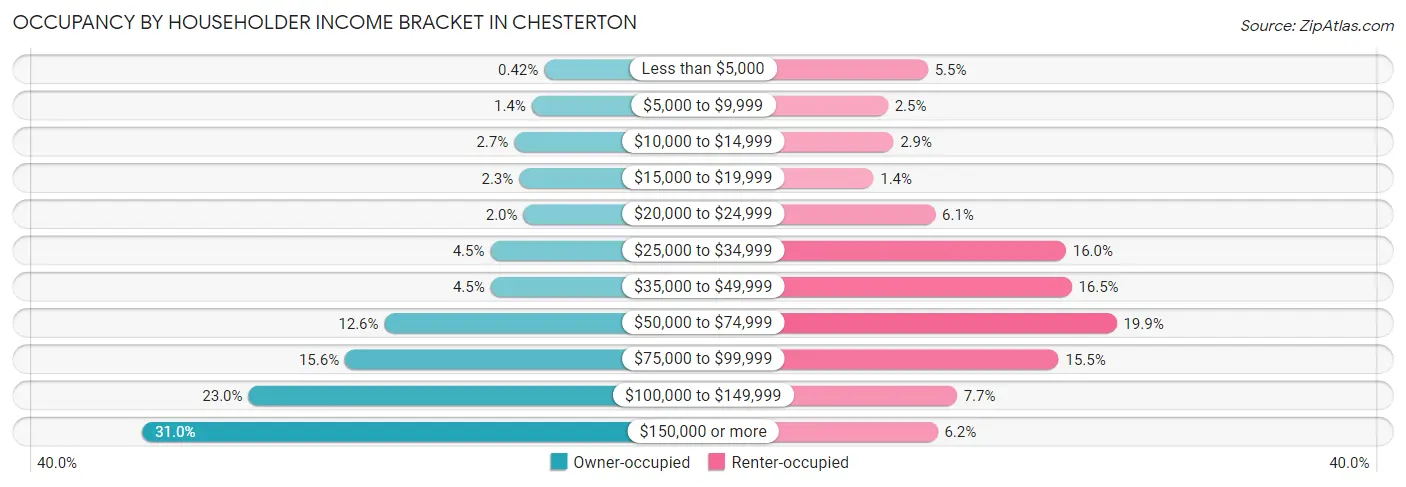
| Income Bracket | Owner-occupied | Renter-occupied |
| Less than $5,000 | 17 (0.4%) | 90 (5.5%) |
| $5,000 to $9,999 | 56 (1.4%) | 40 (2.5%) |
| $10,000 to $14,999 | 111 (2.7%) | 47 (2.9%) |
| $15,000 to $19,999 | 95 (2.3%) | 22 (1.3%) |
| $20,000 to $24,999 | 82 (2.0%) | 99 (6.1%) |
| $25,000 to $34,999 | 185 (4.5%) | 262 (16.0%) |
| $35,000 to $49,999 | 184 (4.5%) | 269 (16.5%) |
| $50,000 to $74,999 | 515 (12.6%) | 325 (19.9%) |
| $75,000 to $99,999 | 638 (15.6%) | 253 (15.5%) |
| $100,000 to $149,999 | 939 (23.0%) | 126 (7.7%) |
| $150,000 or more | 1,270 (31.0%) | 102 (6.2%) |
| Total | 4,092 (100.0%) | 1,635 (100.0%) |
Monthly Housing Cost Tiers in Chesterton
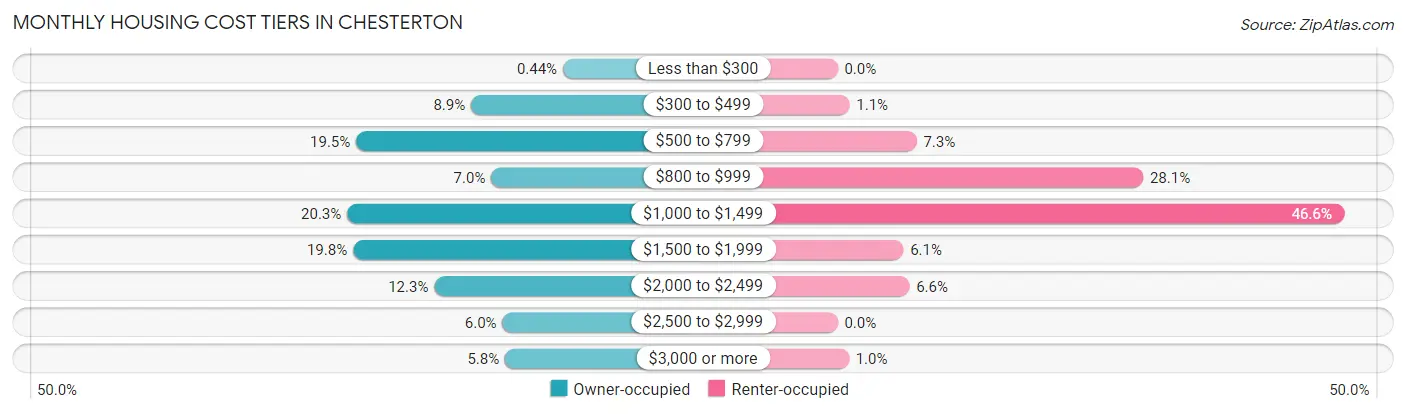
| Monthly Cost | Owner-occupied | Renter-occupied |
| Less than $300 | 18 (0.4%) | 0 (0.0%) |
| $300 to $499 | 364 (8.9%) | 18 (1.1%) |
| $500 to $799 | 797 (19.5%) | 119 (7.3%) |
| $800 to $999 | 288 (7.0%) | 460 (28.1%) |
| $1,000 to $1,499 | 831 (20.3%) | 762 (46.6%) |
| $1,500 to $1,999 | 809 (19.8%) | 99 (6.1%) |
| $2,000 to $2,499 | 503 (12.3%) | 108 (6.6%) |
| $2,500 to $2,999 | 246 (6.0%) | 0 (0.0%) |
| $3,000 or more | 236 (5.8%) | 17 (1.0%) |
| Total | 4,092 (100.0%) | 1,635 (100.0%) |
Physical Housing Characteristics in Chesterton
Housing Structures in Chesterton
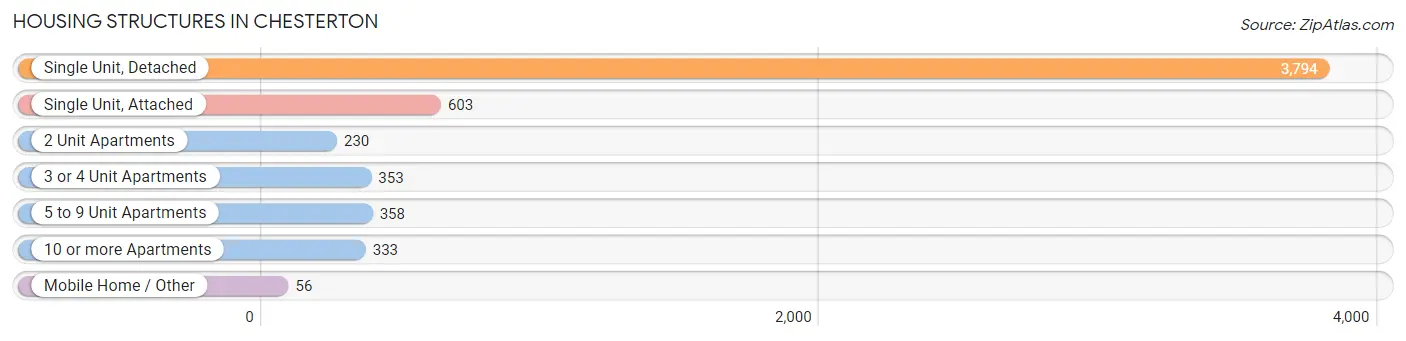
| Structure Type | # Housing Units | % Housing Units |
| Single Unit, Detached | 3,794 | 66.2% |
| Single Unit, Attached | 603 | 10.5% |
| 2 Unit Apartments | 230 | 4.0% |
| 3 or 4 Unit Apartments | 353 | 6.2% |
| 5 to 9 Unit Apartments | 358 | 6.2% |
| 10 or more Apartments | 333 | 5.8% |
| Mobile Home / Other | 56 | 1.0% |
| Total | 5,727 | 100.0% |
Housing Structures by Occupancy in Chesterton
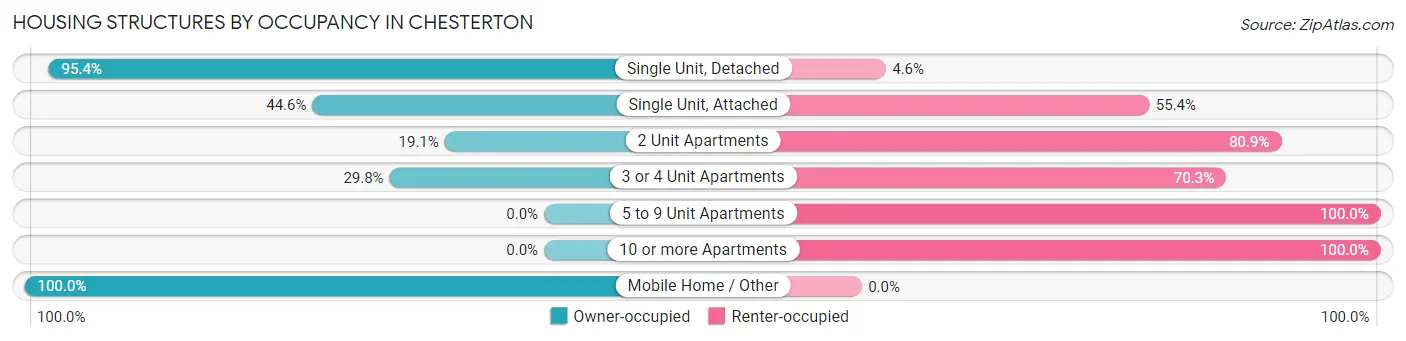
| Structure Type | Owner-occupied | Renter-occupied |
| Single Unit, Detached | 3,618 (95.4%) | 176 (4.6%) |
| Single Unit, Attached | 269 (44.6%) | 334 (55.4%) |
| 2 Unit Apartments | 44 (19.1%) | 186 (80.9%) |
| 3 or 4 Unit Apartments | 105 (29.7%) | 248 (70.3%) |
| 5 to 9 Unit Apartments | 0 (0.0%) | 358 (100.0%) |
| 10 or more Apartments | 0 (0.0%) | 333 (100.0%) |
| Mobile Home / Other | 56 (100.0%) | 0 (0.0%) |
| Total | 4,092 (71.5%) | 1,635 (28.5%) |
Housing Structures by Number of Rooms in Chesterton
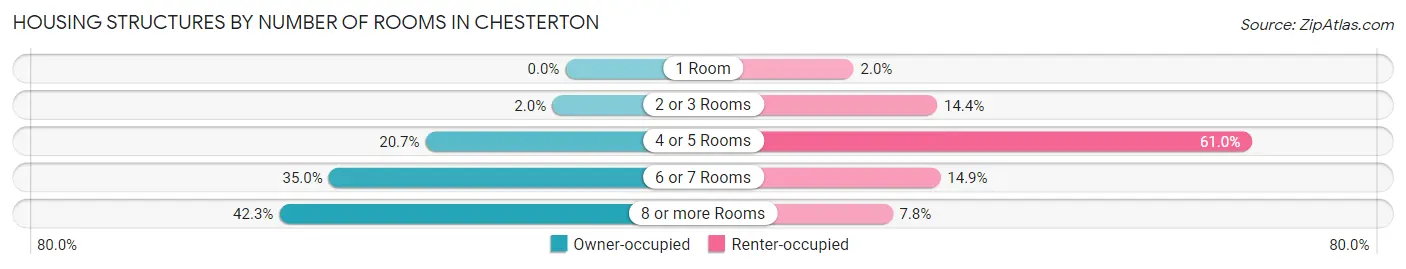
| Number of Rooms | Owner-occupied | Renter-occupied |
| 1 Room | 0 (0.0%) | 33 (2.0%) |
| 2 or 3 Rooms | 80 (2.0%) | 235 (14.4%) |
| 4 or 5 Rooms | 847 (20.7%) | 997 (61.0%) |
| 6 or 7 Rooms | 1,433 (35.0%) | 243 (14.9%) |
| 8 or more Rooms | 1,732 (42.3%) | 127 (7.8%) |
| Total | 4,092 (100.0%) | 1,635 (100.0%) |
Housing Structure by Heating Type in Chesterton
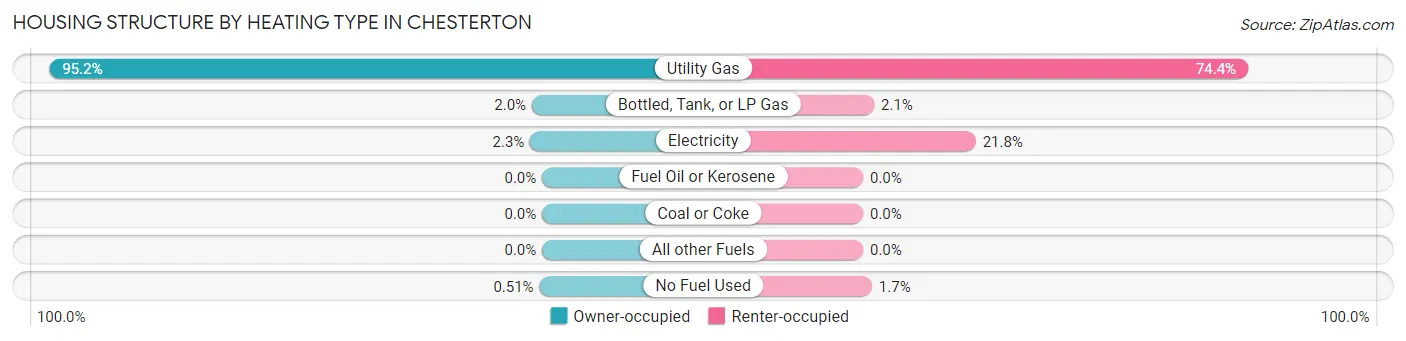
| Heating Type | Owner-occupied | Renter-occupied |
| Utility Gas | 3,897 (95.2%) | 1,216 (74.4%) |
| Bottled, Tank, or LP Gas | 80 (2.0%) | 35 (2.1%) |
| Electricity | 94 (2.3%) | 356 (21.8%) |
| Fuel Oil or Kerosene | 0 (0.0%) | 0 (0.0%) |
| Coal or Coke | 0 (0.0%) | 0 (0.0%) |
| All other Fuels | 0 (0.0%) | 0 (0.0%) |
| No Fuel Used | 21 (0.5%) | 28 (1.7%) |
| Total | 4,092 (100.0%) | 1,635 (100.0%) |
Household Vehicle Usage in Chesterton
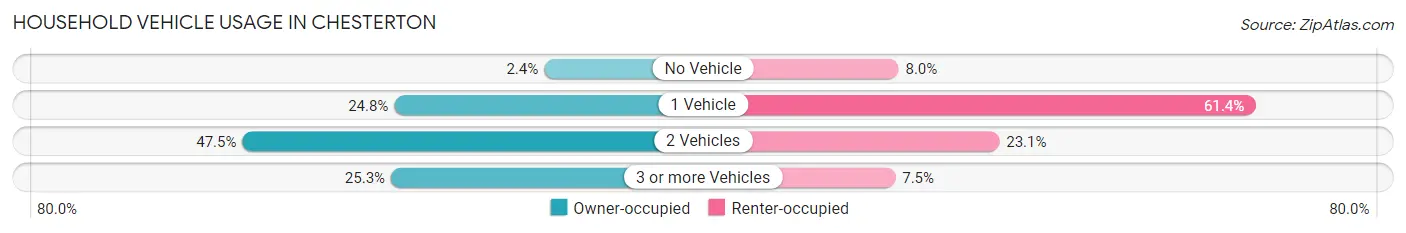
| Vehicles per Household | Owner-occupied | Renter-occupied |
| No Vehicle | 99 (2.4%) | 131 (8.0%) |
| 1 Vehicle | 1,015 (24.8%) | 1,004 (61.4%) |
| 2 Vehicles | 1,943 (47.5%) | 377 (23.1%) |
| 3 or more Vehicles | 1,035 (25.3%) | 123 (7.5%) |
| Total | 4,092 (100.0%) | 1,635 (100.0%) |
Real Estate & Mortgages in Chesterton
Real Estate and Mortgage Overview in Chesterton
| Characteristic | Without Mortgage | With Mortgage |
| Housing Units | 1,357 | 2,735 |
| Median Property Value | $237,600 | $275,800 |
| Median Household Income | $77,961 | $1,019 |
| Monthly Housing Costs | $595 | $236 |
| Real Estate Taxes | $2,107 | $0 |
Property Value by Mortgage Status in Chesterton
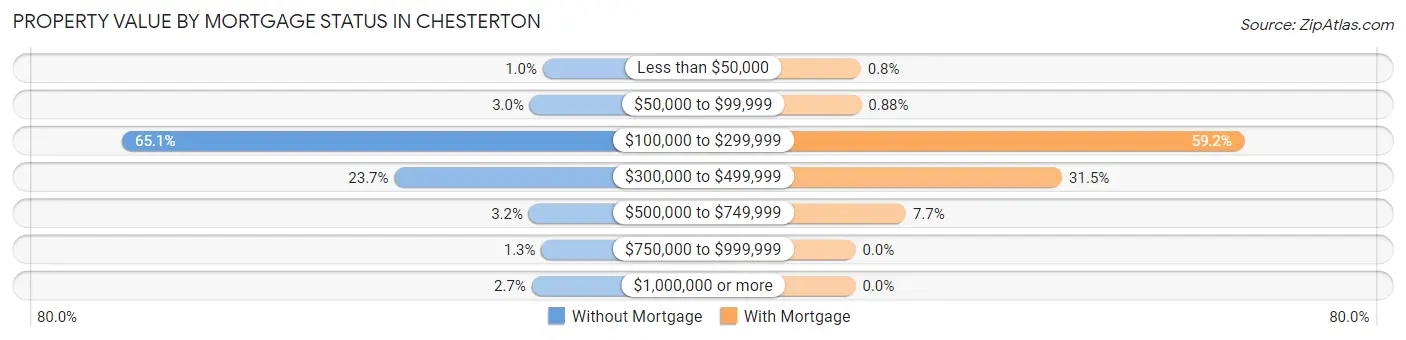
| Property Value | Without Mortgage | With Mortgage |
| Less than $50,000 | 14 (1.0%) | 22 (0.8%) |
| $50,000 to $99,999 | 41 (3.0%) | 24 (0.9%) |
| $100,000 to $299,999 | 884 (65.1%) | 1,618 (59.2%) |
| $300,000 to $499,999 | 321 (23.7%) | 861 (31.5%) |
| $500,000 to $749,999 | 43 (3.2%) | 210 (7.7%) |
| $750,000 to $999,999 | 17 (1.3%) | 0 (0.0%) |
| $1,000,000 or more | 37 (2.7%) | 0 (0.0%) |
| Total | 1,357 (100.0%) | 2,735 (100.0%) |
Household Income by Mortgage Status in Chesterton
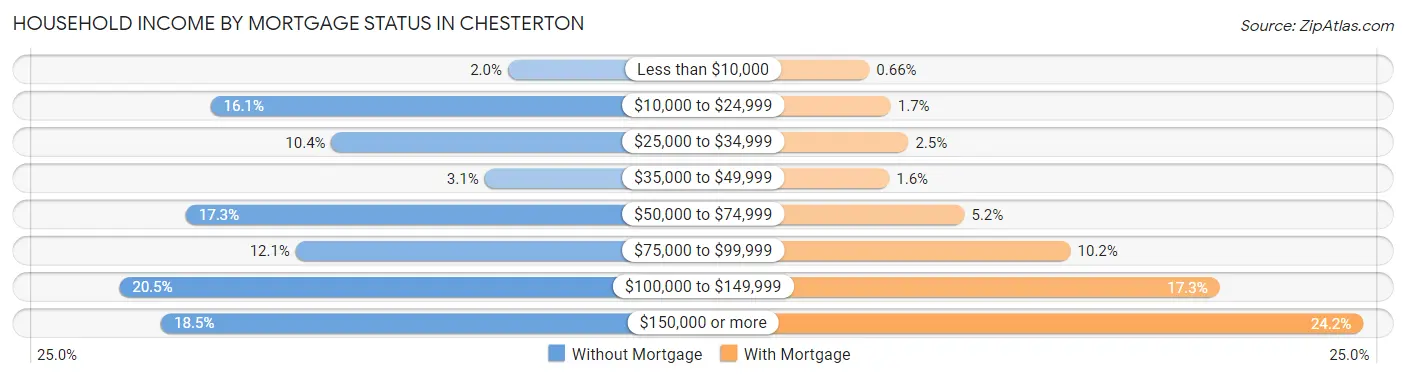
| Household Income | Without Mortgage | With Mortgage |
| Less than $10,000 | 27 (2.0%) | 18 (0.7%) |
| $10,000 to $24,999 | 219 (16.1%) | 46 (1.7%) |
| $25,000 to $34,999 | 141 (10.4%) | 69 (2.5%) |
| $35,000 to $49,999 | 42 (3.1%) | 44 (1.6%) |
| $50,000 to $74,999 | 235 (17.3%) | 142 (5.2%) |
| $75,000 to $99,999 | 164 (12.1%) | 280 (10.2%) |
| $100,000 to $149,999 | 278 (20.5%) | 474 (17.3%) |
| $150,000 or more | 251 (18.5%) | 661 (24.2%) |
| Total | 1,357 (100.0%) | 2,735 (100.0%) |
Property Value to Household Income Ratio in Chesterton
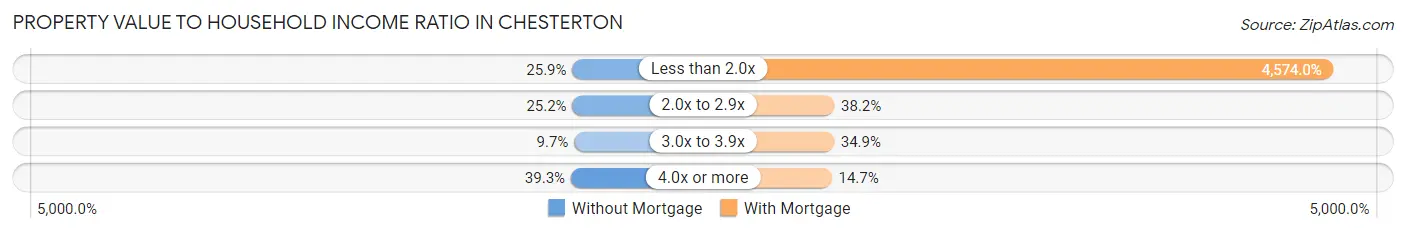
| Value-to-Income Ratio | Without Mortgage | With Mortgage |
| Less than 2.0x | 351 (25.9%) | 125,099 (4,574.0%) |
| 2.0x to 2.9x | 342 (25.2%) | 1,046 (38.2%) |
| 3.0x to 3.9x | 131 (9.7%) | 955 (34.9%) |
| 4.0x or more | 533 (39.3%) | 402 (14.7%) |
| Total | 1,357 (100.0%) | 2,735 (100.0%) |
Real Estate Taxes by Mortgage Status in Chesterton
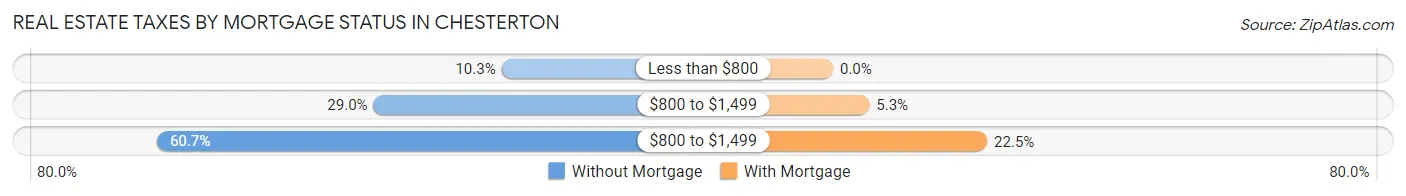
| Property Taxes | Without Mortgage | With Mortgage |
| Less than $800 | 140 (10.3%) | 0 (0.0%) |
| $800 to $1,499 | 394 (29.0%) | 145 (5.3%) |
| $800 to $1,499 | 823 (60.7%) | 616 (22.5%) |
| Total | 1,357 (100.0%) | 2,735 (100.0%) |
Health & Disability in Chesterton
Health Insurance Coverage by Age in Chesterton
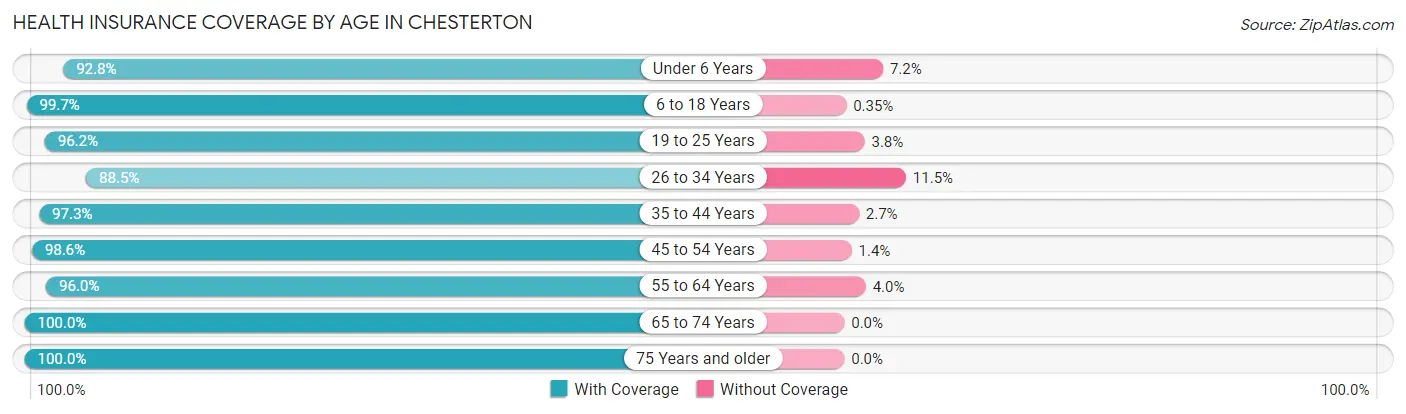
| Age Bracket | With Coverage | Without Coverage |
| Under 6 Years | 1,209 (92.8%) | 94 (7.2%) |
| 6 to 18 Years | 2,547 (99.7%) | 9 (0.4%) |
| 19 to 25 Years | 890 (96.2%) | 35 (3.8%) |
| 26 to 34 Years | 1,563 (88.5%) | 203 (11.5%) |
| 35 to 44 Years | 2,573 (97.3%) | 72 (2.7%) |
| 45 to 54 Years | 1,378 (98.6%) | 19 (1.4%) |
| 55 to 64 Years | 1,439 (96.0%) | 60 (4.0%) |
| 65 to 74 Years | 886 (100.0%) | 0 (0.0%) |
| 75 Years and older | 1,050 (100.0%) | 0 (0.0%) |
| Total | 13,535 (96.5%) | 492 (3.5%) |
Health Insurance Coverage by Citizenship Status in Chesterton
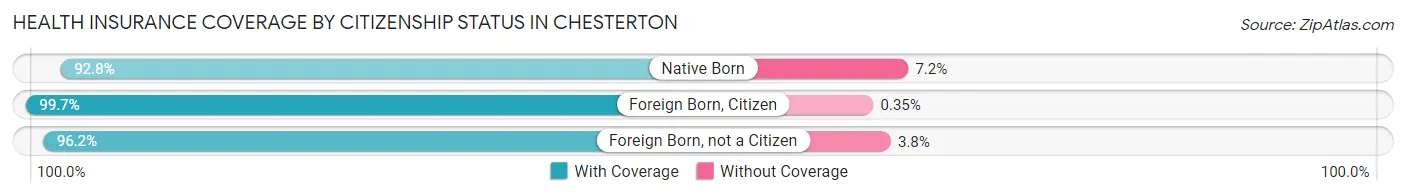
| Citizenship Status | With Coverage | Without Coverage |
| Native Born | 1,209 (92.8%) | 94 (7.2%) |
| Foreign Born, Citizen | 2,547 (99.7%) | 9 (0.4%) |
| Foreign Born, not a Citizen | 890 (96.2%) | 35 (3.8%) |
Health Insurance Coverage by Household Income in Chesterton
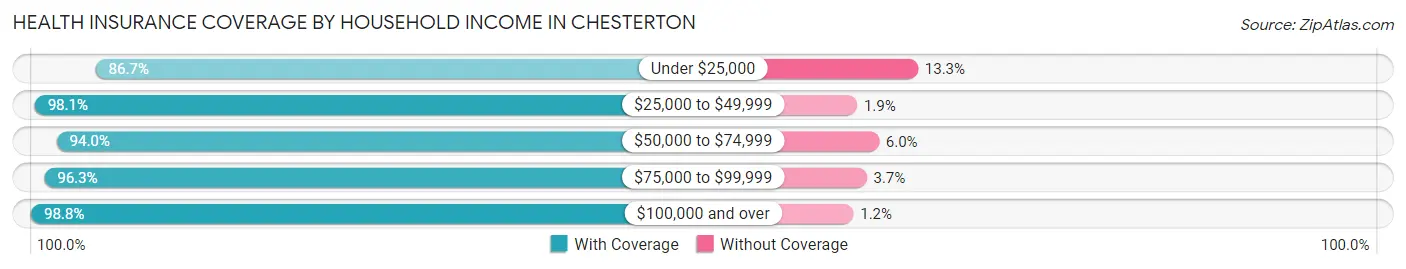
| Household Income | With Coverage | Without Coverage |
| Under $25,000 | 1,055 (86.7%) | 162 (13.3%) |
| $25,000 to $49,999 | 1,445 (98.1%) | 28 (1.9%) |
| $50,000 to $74,999 | 1,927 (94.0%) | 123 (6.0%) |
| $75,000 to $99,999 | 2,267 (96.3%) | 87 (3.7%) |
| $100,000 and over | 6,824 (98.8%) | 84 (1.2%) |
Public vs Private Health Insurance Coverage by Age in Chesterton
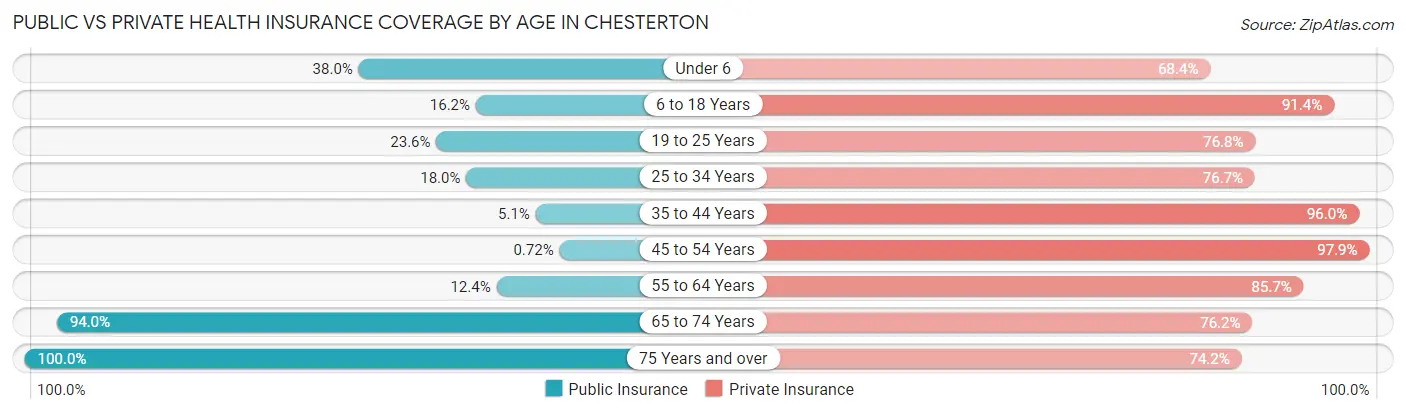
| Age Bracket | Public Insurance | Private Insurance |
| Under 6 | 495 (38.0%) | 891 (68.4%) |
| 6 to 18 Years | 415 (16.2%) | 2,335 (91.3%) |
| 19 to 25 Years | 218 (23.6%) | 710 (76.8%) |
| 25 to 34 Years | 318 (18.0%) | 1,354 (76.7%) |
| 35 to 44 Years | 136 (5.1%) | 2,539 (96.0%) |
| 45 to 54 Years | 10 (0.7%) | 1,368 (97.9%) |
| 55 to 64 Years | 186 (12.4%) | 1,285 (85.7%) |
| 65 to 74 Years | 833 (94.0%) | 675 (76.2%) |
| 75 Years and over | 1,050 (100.0%) | 779 (74.2%) |
| Total | 3,661 (26.1%) | 11,936 (85.1%) |
Disability Status by Sex by Age in Chesterton
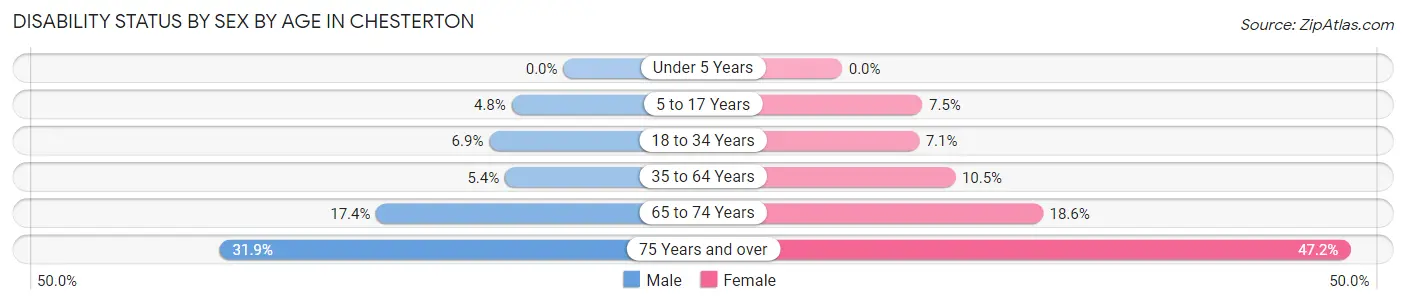
| Age Bracket | Male | Female |
| Under 5 Years | 0 (0.0%) | 0 (0.0%) |
| 5 to 17 Years | 61 (4.8%) | 99 (7.4%) |
| 18 to 34 Years | 95 (6.9%) | 103 (7.1%) |
| 35 to 64 Years | 154 (5.4%) | 283 (10.5%) |
| 65 to 74 Years | 83 (17.4%) | 76 (18.6%) |
| 75 Years and over | 126 (31.9%) | 309 (47.2%) |
Disability Class by Sex by Age in Chesterton
Disability Class: Hearing Difficulty
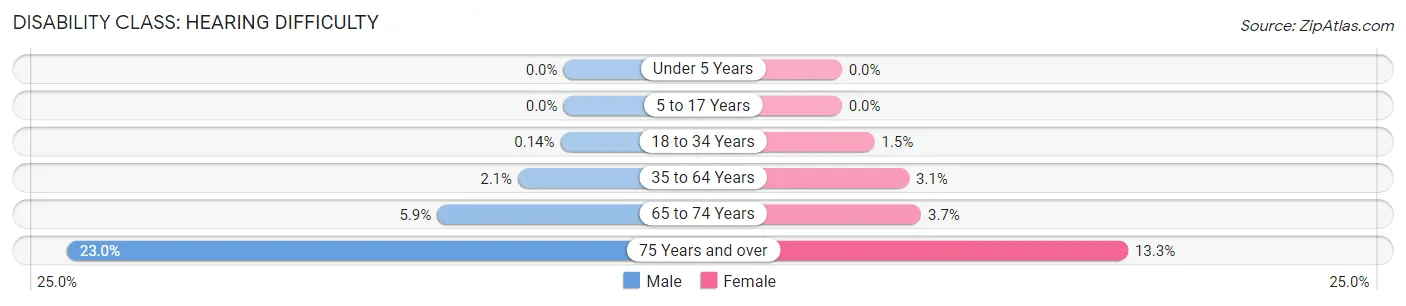
| Age Bracket | Male | Female |
| Under 5 Years | 0 (0.0%) | 0 (0.0%) |
| 5 to 17 Years | 0 (0.0%) | 0 (0.0%) |
| 18 to 34 Years | 2 (0.1%) | 22 (1.5%) |
| 35 to 64 Years | 60 (2.1%) | 84 (3.1%) |
| 65 to 74 Years | 28 (5.9%) | 15 (3.7%) |
| 75 Years and over | 91 (23.0%) | 87 (13.3%) |
Disability Class: Vision Difficulty
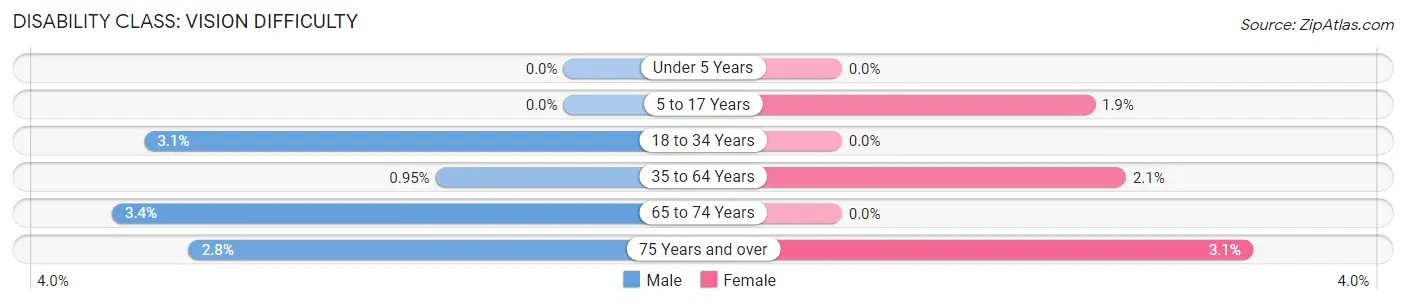
| Age Bracket | Male | Female |
| Under 5 Years | 0 (0.0%) | 0 (0.0%) |
| 5 to 17 Years | 0 (0.0%) | 25 (1.9%) |
| 18 to 34 Years | 43 (3.1%) | 0 (0.0%) |
| 35 to 64 Years | 27 (0.9%) | 57 (2.1%) |
| 65 to 74 Years | 16 (3.4%) | 0 (0.0%) |
| 75 Years and over | 11 (2.8%) | 20 (3.0%) |
Disability Class: Cognitive Difficulty
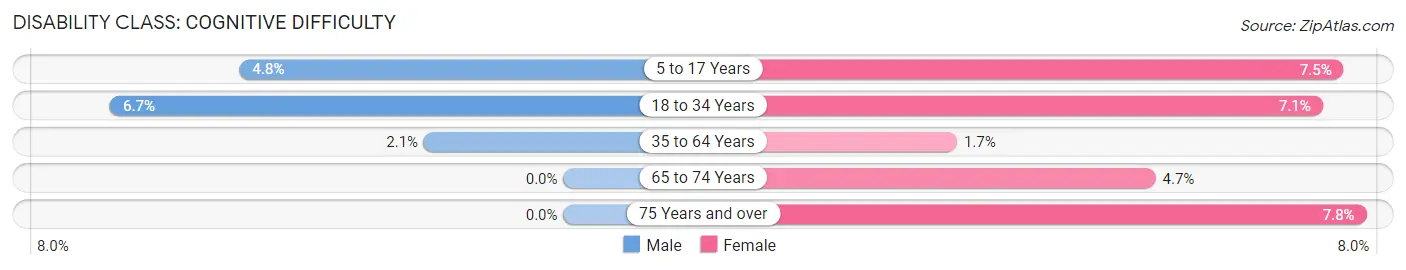
| Age Bracket | Male | Female |
| 5 to 17 Years | 61 (4.8%) | 99 (7.4%) |
| 18 to 34 Years | 93 (6.7%) | 103 (7.1%) |
| 35 to 64 Years | 59 (2.1%) | 46 (1.7%) |
| 65 to 74 Years | 0 (0.0%) | 19 (4.7%) |
| 75 Years and over | 0 (0.0%) | 51 (7.8%) |
Disability Class: Ambulatory Difficulty
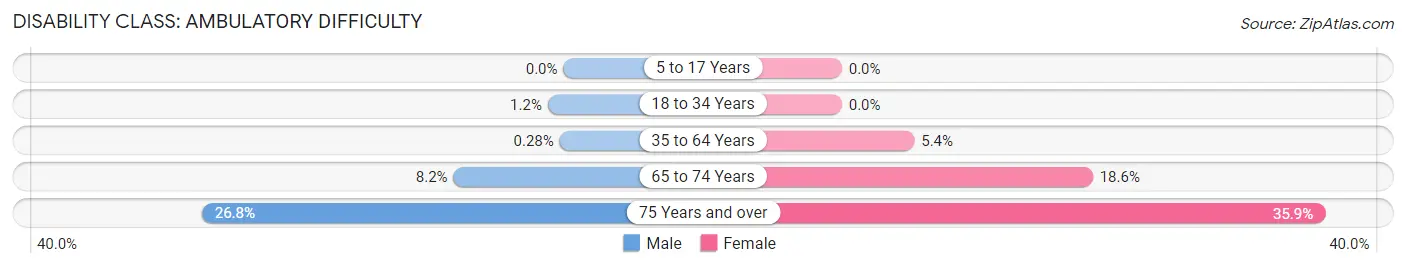
| Age Bracket | Male | Female |
| 5 to 17 Years | 0 (0.0%) | 0 (0.0%) |
| 18 to 34 Years | 16 (1.2%) | 0 (0.0%) |
| 35 to 64 Years | 8 (0.3%) | 145 (5.4%) |
| 65 to 74 Years | 39 (8.2%) | 76 (18.6%) |
| 75 Years and over | 106 (26.8%) | 235 (35.9%) |
Disability Class: Self-Care Difficulty
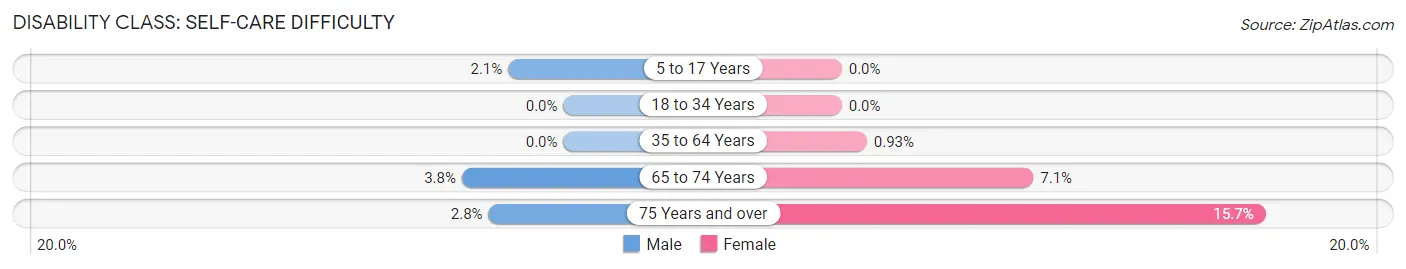
| Age Bracket | Male | Female |
| 5 to 17 Years | 26 (2.1%) | 0 (0.0%) |
| 18 to 34 Years | 0 (0.0%) | 0 (0.0%) |
| 35 to 64 Years | 0 (0.0%) | 25 (0.9%) |
| 65 to 74 Years | 18 (3.8%) | 29 (7.1%) |
| 75 Years and over | 11 (2.8%) | 103 (15.7%) |
Technology Access in Chesterton
Computing Device Access in Chesterton
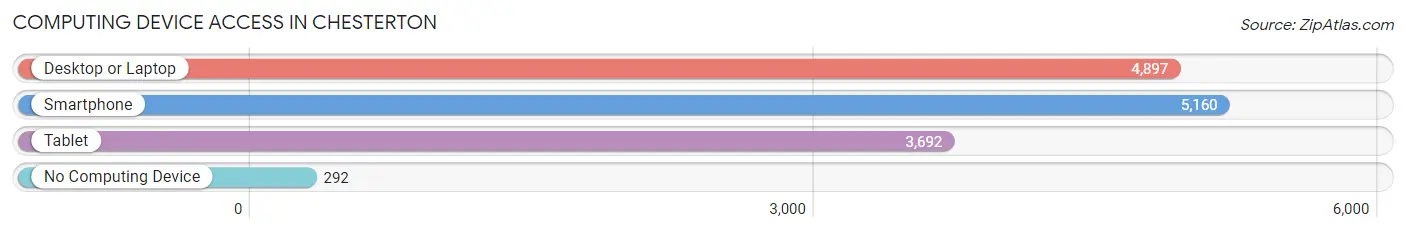
| Device Type | # Households | % Households |
| Desktop or Laptop | 4,897 | 85.5% |
| Smartphone | 5,160 | 90.1% |
| Tablet | 3,692 | 64.5% |
| No Computing Device | 292 | 5.1% |
| Total | 5,727 | 100.0% |
Internet Access in Chesterton
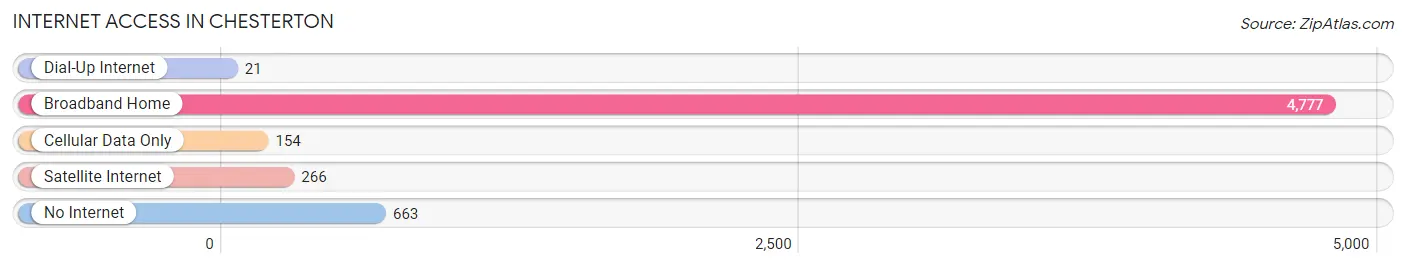
| Internet Type | # Households | % Households |
| Dial-Up Internet | 21 | 0.4% |
| Broadband Home | 4,777 | 83.4% |
| Cellular Data Only | 154 | 2.7% |
| Satellite Internet | 266 | 4.6% |
| No Internet | 663 | 11.6% |
| Total | 5,727 | 100.0% |
Chesterton Summary
Introduction
Located in the northwest corner of Indiana, the town of Chesterton is a small, vibrant community with a rich history and a bright future. With a population of 13,068 as of the 2010 census, Chesterton is the largest town in Porter County and the second largest in the state of Indiana. The town is situated on the southern shore of Lake Michigan and is part of the Chicago metropolitan area.
History
The area that is now Chesterton was first settled in 1834 by a group of settlers from New York. The town was originally known as Calumet, but was later renamed Chesterton in 1836 after the English author and philosopher G.K. Chesterton. The town was officially incorporated in 1887.
In the late 19th century, Chesterton was a major center for the production of bricks and tile. The town was also home to a number of factories, including a paper mill, a canning factory, and a furniture factory.
Geography
Chesterton is located in the northwest corner of Indiana, approximately 40 miles from Chicago. The town is situated on the southern shore of Lake Michigan and is part of the Chicago metropolitan area. The town is bordered by the towns of Porter, Burns Harbor, and Porter Beach.
The town has a total area of 8.3 square miles, of which 8.2 square miles is land and 0.1 square miles is water. The town is located in the Valparaiso Moraine, a region of rolling hills and glacial deposits.
Economy
Chesterton is home to a number of businesses and industries, including manufacturing, retail, and tourism. The town is also home to a number of corporate headquarters, including the headquarters of the Cintas Corporation, a uniform and linen supply company.
The town is also home to a number of educational institutions, including the University of Notre Dame, Valparaiso University, and Purdue University Northwest.
Demographics
As of the 2010 census, Chesterton had a population of 13,068. The racial makeup of the town was 94.3% White, 1.3% African American, 0.3% Native American, 1.2% Asian, 0.1% Pacific Islander, 1.2% from other races, and 1.6% from two or more races. Hispanic or Latino of any race were 4.2% of the population.
The median income for a household in the town was $54,945, and the median income for a family was $63,945. The per capita income for the town was $25,945.
Conclusion
Chesterton is a small, vibrant town with a rich history and a bright future. The town is home to a number of businesses and industries, as well as a number of educational institutions. The town has a diverse population and a median income that is higher than the national average. Chesterton is a great place to live, work, and play.
Common Questions
What is Per Capita Income in Chesterton?
Per Capita income in Chesterton is $47,273.
What is the Median Family Income in Chesterton?
Median Family Income in Chesterton is $105,451.
What is the Median Household income in Chesterton?
Median Household Income in Chesterton is $90,753.
What is Income or Wage Gap in Chesterton?
Income or Wage Gap in Chesterton is 36.9%.
Women in Chesterton earn 63.1 cents for every dollar earned by a man.
What is Family Income Deficit in Chesterton?
Family Income Deficit in Chesterton is $14,983.
Families that are below poverty line in Chesterton earn $14,983 less on average than the poverty threshold level.
What is Inequality or Gini Index in Chesterton?
Inequality or Gini Index in Chesterton is 0.44.
What is the Total Population of Chesterton?
Total Population of Chesterton is 14,191.
What is the Total Male Population of Chesterton?
Total Male Population of Chesterton is 7,104.
What is the Total Female Population of Chesterton?
Total Female Population of Chesterton is 7,087.
What is the Ratio of Males per 100 Females in Chesterton?
There are 100.24 Males per 100 Females in Chesterton.
What is the Ratio of Females per 100 Males in Chesterton?
There are 99.76 Females per 100 Males in Chesterton.
What is the Median Population Age in Chesterton?
Median Population Age in Chesterton is 36.9 Years.
What is the Average Family Size in Chesterton
Average Family Size in Chesterton is 3.2 People.
What is the Average Household Size in Chesterton
Average Household Size in Chesterton is 2.4 People.
How Large is the Labor Force in Chesterton?
There are 7,415 People in the Labor Forcein in Chesterton.
What is the Percentage of People in the Labor Force in Chesterton?
69.1% of People are in the Labor Force in Chesterton.
What is the Unemployment Rate in Chesterton?
Unemployment Rate in Chesterton is 8.2%.