Lakeville, IN Map & Demographics
Lakeville Map
Lakeville Overview
$24,353
PER CAPITA INCOME
$54,063
AVG FAMILY INCOME
$46,500
AVG HOUSEHOLD INCOME
29.8%
WAGE / INCOME GAP [ % ]
70.2¢/ $1
WAGE / INCOME GAP [ $ ]
0.40
INEQUALITY / GINI INDEX
690
TOTAL POPULATION
308
MALE POPULATION
382
FEMALE POPULATION
80.63
MALES / 100 FEMALES
124.03
FEMALES / 100 MALES
39.2
MEDIAN AGE
2.9
AVG FAMILY SIZE
2.3
AVG HOUSEHOLD SIZE
322
LABOR FORCE [ PEOPLE ]
58.1%
PERCENT IN LABOR FORCE
3.1%
UNEMPLOYMENT RATE
Lakeville Zip Codes
Lakeville Area Codes
Income in Lakeville
Income Overview in Lakeville
Per Capita Income in Lakeville is $24,353, while median incomes of families and households are $54,063 and $46,500 respectively.
| Characteristic | Number | Measure |
| Per Capita Income | 690 | $24,353 |
| Median Family Income | 172 | $54,063 |
| Mean Family Income | 172 | $67,441 |
| Median Household Income | 300 | $46,500 |
| Mean Household Income | 300 | $55,473 |
| Income Deficit | 172 | $0 |
| Wage / Income Gap (%) | 690 | 29.76% |
| Wage / Income Gap ($) | 690 | 70.24¢ per $1 |
| Gini / Inequality Index | 690 | 0.40 |
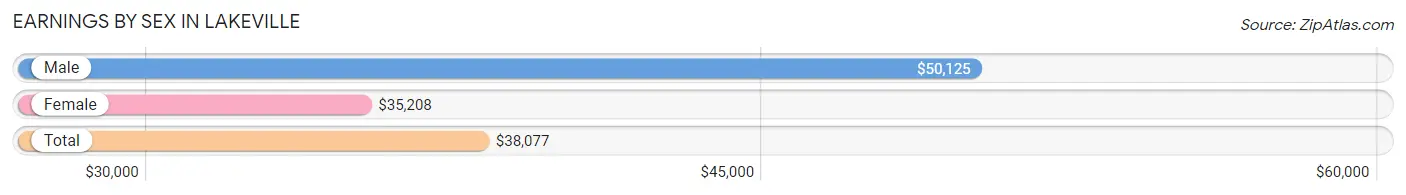
Earnings by Sex in Lakeville
Average Earnings in Lakeville are $38,077, $50,125 for men and $35,208 for women, a difference of 29.8%.
| Sex | Number | Average Earnings |
| Male | 153 (46.9%) | $50,125 |
| Female | 173 (53.1%) | $35,208 |
| Total | 326 (100.0%) | $38,077 |
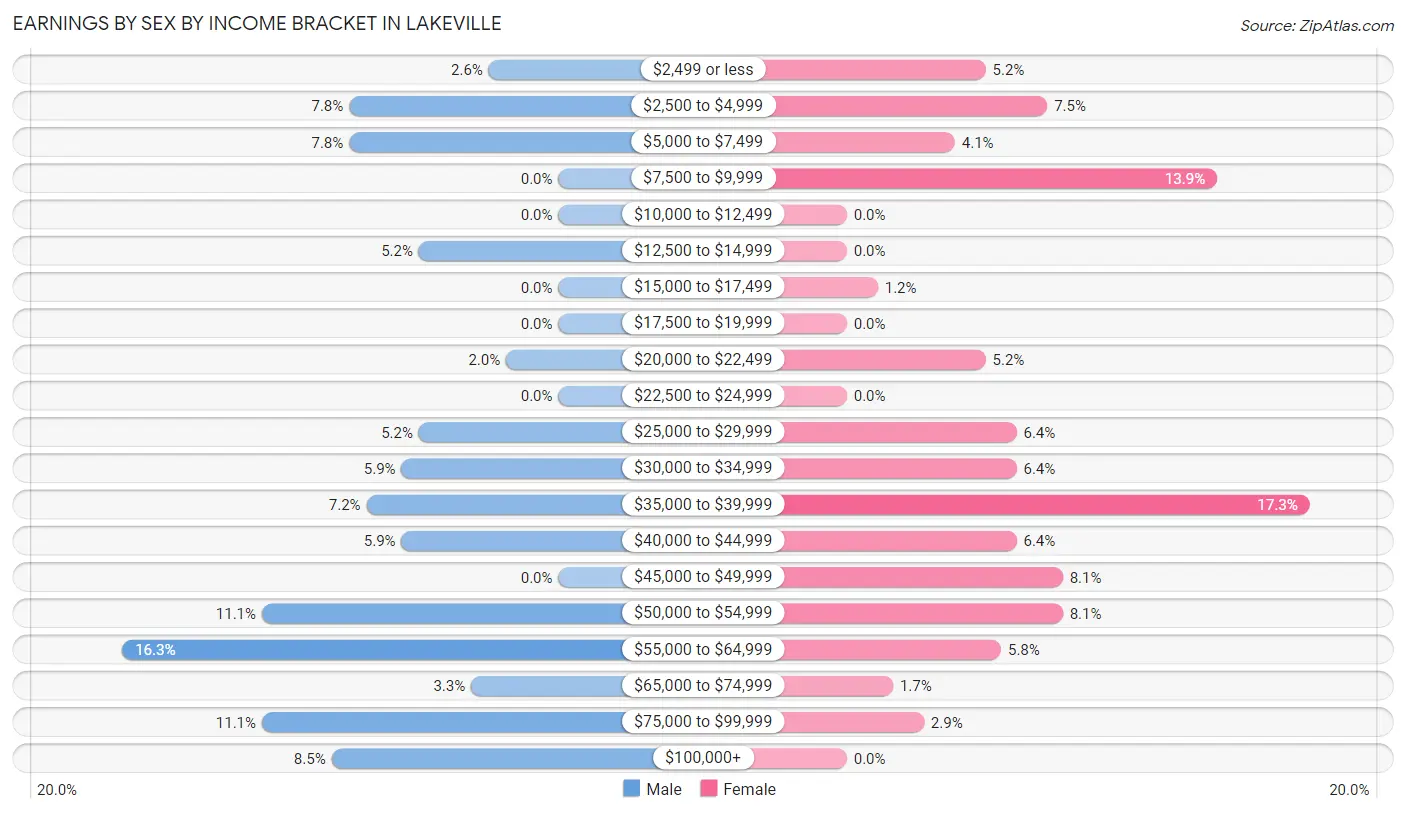
Earnings by Sex by Income Bracket in Lakeville
The most common earnings brackets in Lakeville are $55,000 to $64,999 for men (25 | 16.3%) and $35,000 to $39,999 for women (30 | 17.3%).
| Income | Male | Female |
| $2,499 or less | 4 (2.6%) | 9 (5.2%) |
| $2,500 to $4,999 | 12 (7.8%) | 13 (7.5%) |
| $5,000 to $7,499 | 12 (7.8%) | 7 (4.1%) |
| $7,500 to $9,999 | 0 (0.0%) | 24 (13.9%) |
| $10,000 to $12,499 | 0 (0.0%) | 0 (0.0%) |
| $12,500 to $14,999 | 8 (5.2%) | 0 (0.0%) |
| $15,000 to $17,499 | 0 (0.0%) | 2 (1.2%) |
| $17,500 to $19,999 | 0 (0.0%) | 0 (0.0%) |
| $20,000 to $22,499 | 3 (2.0%) | 9 (5.2%) |
| $22,500 to $24,999 | 0 (0.0%) | 0 (0.0%) |
| $25,000 to $29,999 | 8 (5.2%) | 11 (6.4%) |
| $30,000 to $34,999 | 9 (5.9%) | 11 (6.4%) |
| $35,000 to $39,999 | 11 (7.2%) | 30 (17.3%) |
| $40,000 to $44,999 | 9 (5.9%) | 11 (6.4%) |
| $45,000 to $49,999 | 0 (0.0%) | 14 (8.1%) |
| $50,000 to $54,999 | 17 (11.1%) | 14 (8.1%) |
| $55,000 to $64,999 | 25 (16.3%) | 10 (5.8%) |
| $65,000 to $74,999 | 5 (3.3%) | 3 (1.7%) |
| $75,000 to $99,999 | 17 (11.1%) | 5 (2.9%) |
| $100,000+ | 13 (8.5%) | 0 (0.0%) |
| Total | 153 (100.0%) | 173 (100.0%) |
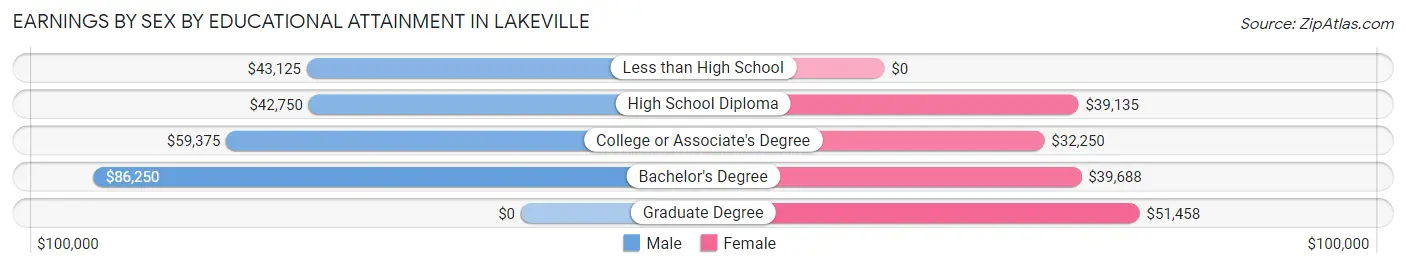
Earnings by Sex by Educational Attainment in Lakeville
Average earnings in Lakeville are $53,393 for men and $38,177 for women, a difference of 28.5%. Men with an educational attainment of bachelor's degree enjoy the highest average annual earnings of $86,250, while those with high school diploma education earn the least with $42,750. Women with an educational attainment of graduate degree earn the most with the average annual earnings of $51,458, while those with college or associate's degree education have the smallest earnings of $32,250.
| Educational Attainment | Male Income | Female Income |
| Less than High School | $43,125 | $0 |
| High School Diploma | $42,750 | $39,135 |
| College or Associate's Degree | $59,375 | $32,250 |
| Bachelor's Degree | $86,250 | $39,688 |
| Graduate Degree | - | - |
| Total | $53,393 | $38,177 |
Family Income in Lakeville
Family Income Brackets in Lakeville
According to the Lakeville family income data, there are 34 families falling into the $50,000 to $74,999 income range, which is the most common income bracket and makes up 19.8% of all families.
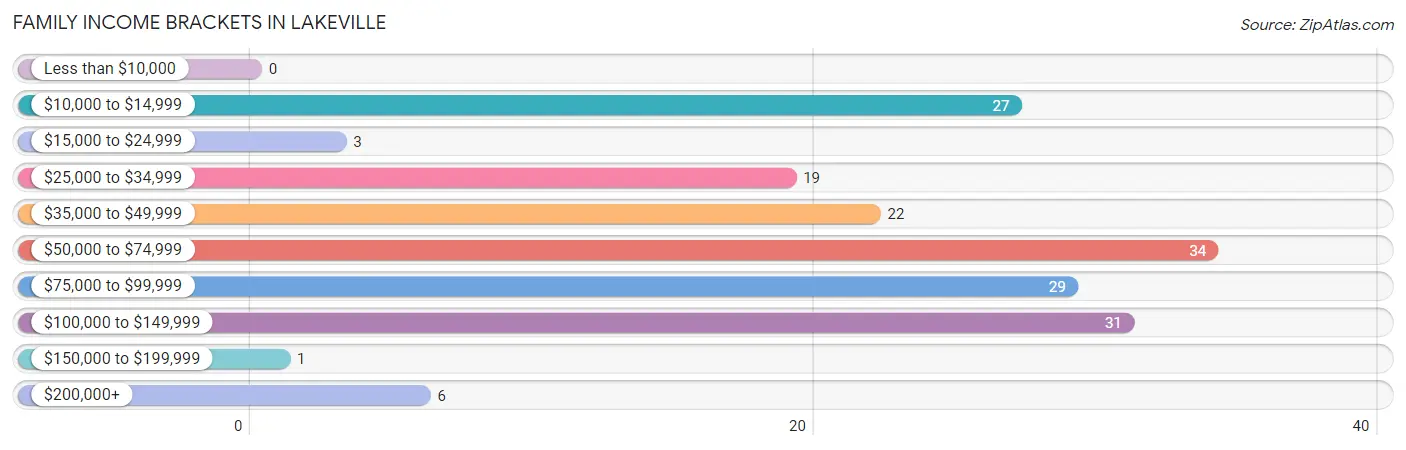
| Income Bracket | # Families | % Families |
| Less than $10,000 | 0 | 0.0% |
| $10,000 to $14,999 | 27 | 15.7% |
| $15,000 to $24,999 | 3 | 1.7% |
| $25,000 to $34,999 | 19 | 11.0% |
| $35,000 to $49,999 | 22 | 12.8% |
| $50,000 to $74,999 | 34 | 19.8% |
| $75,000 to $99,999 | 29 | 16.9% |
| $100,000 to $149,999 | 31 | 18.0% |
| $150,000 to $199,999 | 1 | 0.6% |
| $200,000+ | 6 | 3.5% |
Family Income by Famaliy Size in Lakeville
4-person families (15 | 8.7%) account for the highest median family income in Lakeville with $95,250 per family, while 2-person families (111 | 64.5%) have the highest median income of $24,610 per family member.
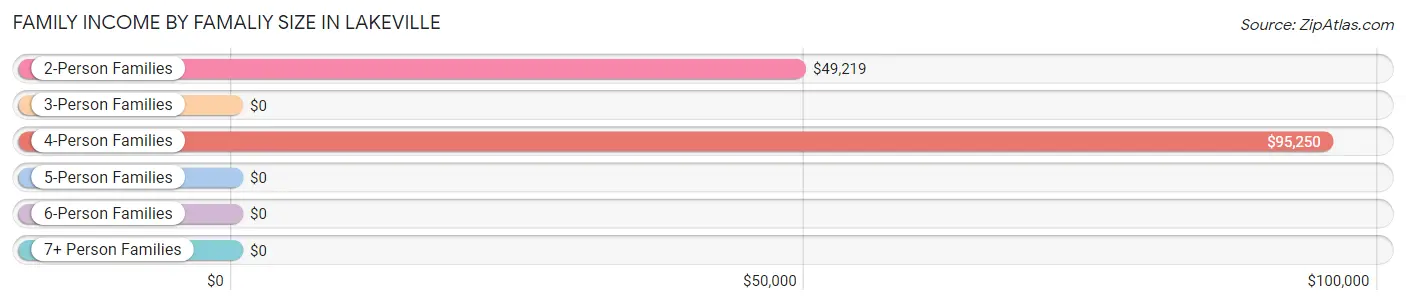
| Income Bracket | # Families | Median Income |
| 2-Person Families | 111 (64.5%) | $49,219 |
| 3-Person Families | 16 (9.3%) | $0 |
| 4-Person Families | 15 (8.7%) | $95,250 |
| 5-Person Families | 30 (17.4%) | $0 |
| 6-Person Families | 0 (0.0%) | $0 |
| 7+ Person Families | 0 (0.0%) | $0 |
| Total | 172 (100.0%) | $54,063 |
Family Income by Number of Earners in Lakeville
The median family income in Lakeville is $54,063, with families comprising 2 earners (60) having the highest median family income of $98,333, while families with no earners (38) have the lowest median family income of $33,214, accounting for 34.9% and 22.1% of families, respectively.
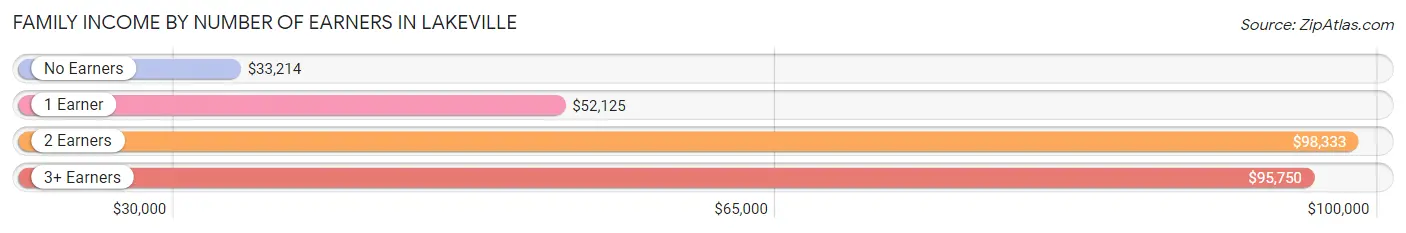
| Number of Earners | # Families | Median Income |
| No Earners | 38 (22.1%) | $33,214 |
| 1 Earner | 65 (37.8%) | $52,125 |
| 2 Earners | 60 (34.9%) | $98,333 |
| 3+ Earners | 9 (5.2%) | $95,750 |
| Total | 172 (100.0%) | $54,063 |
Household Income in Lakeville
Household Income Brackets in Lakeville
With 61 households falling in the category, the $50,000 to $74,999 income range is the most frequent in Lakeville, accounting for 20.3% of all households. In contrast, only 1 households (0.3%) fall into the $150,000 to $199,999 income bracket, making it the least populous group.
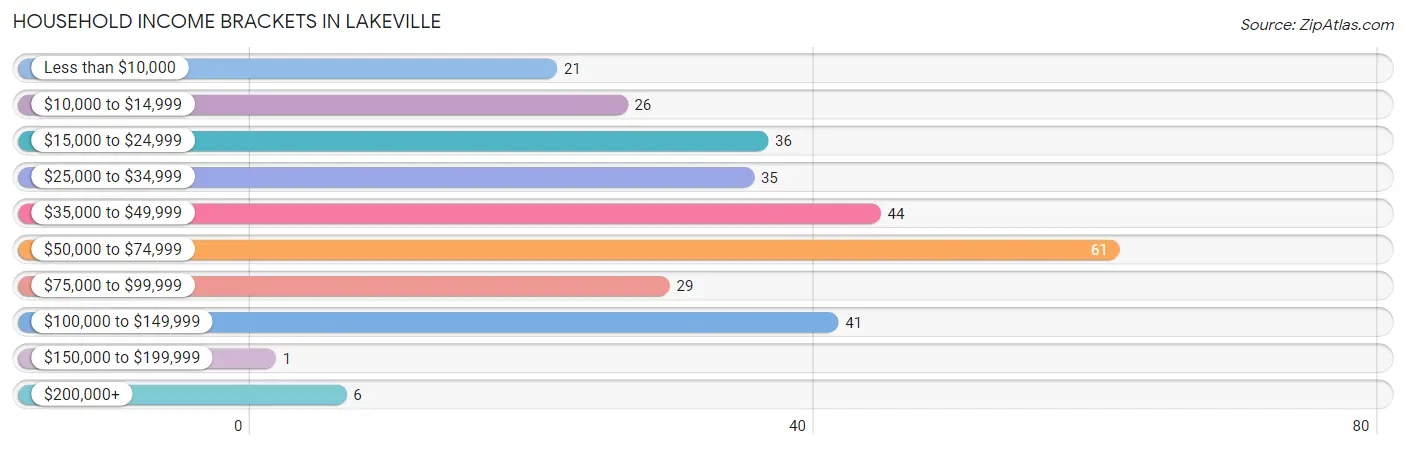
| Income Bracket | # Households | % Households |
| Less than $10,000 | 21 | 7.0% |
| $10,000 to $14,999 | 26 | 8.7% |
| $15,000 to $24,999 | 36 | 12.0% |
| $25,000 to $34,999 | 35 | 11.7% |
| $35,000 to $49,999 | 44 | 14.7% |
| $50,000 to $74,999 | 61 | 20.3% |
| $75,000 to $99,999 | 29 | 9.7% |
| $100,000 to $149,999 | 41 | 13.7% |
| $150,000 to $199,999 | 1 | 0.3% |
| $200,000+ | 6 | 2.0% |
Household Income by Householder Age in Lakeville
The median household income in Lakeville is $46,500, with the highest median household income of $67,000 found in the 25 to 44 years age bracket for the primary householder. A total of 84 households (28.0%) fall into this category. Meanwhile, the 65+ years age bracket for the primary householder has the lowest median household income of $21,250, with 74 households (24.7%) in this group.
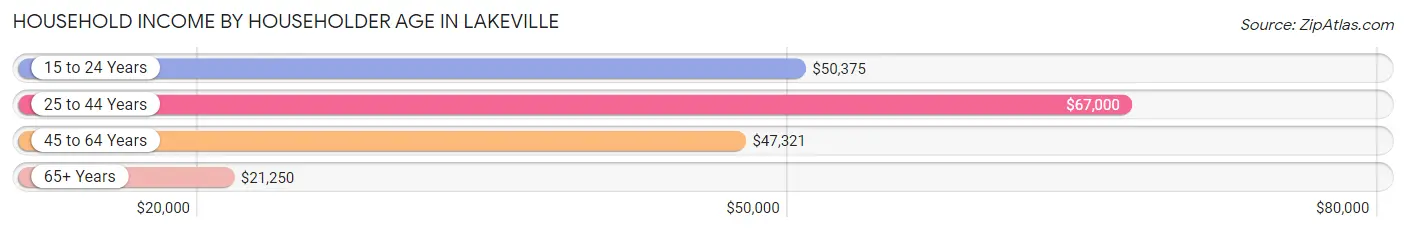
| Income Bracket | # Households | Median Income |
| 15 to 24 Years | 17 (5.7%) | $50,375 |
| 25 to 44 Years | 84 (28.0%) | $67,000 |
| 45 to 64 Years | 125 (41.7%) | $47,321 |
| 65+ Years | 74 (24.7%) | $21,250 |
| Total | 300 (100.0%) | $46,500 |
Poverty in Lakeville
Income Below Poverty by Sex and Age in Lakeville
With 26.6% poverty level for males and 21.7% for females among the residents of Lakeville, 45 to 54 year old males and 16 and 17 year old females are the most vulnerable to poverty, with 38 males (57.6%) and 7 females (50.0%) in their respective age groups living below the poverty level.
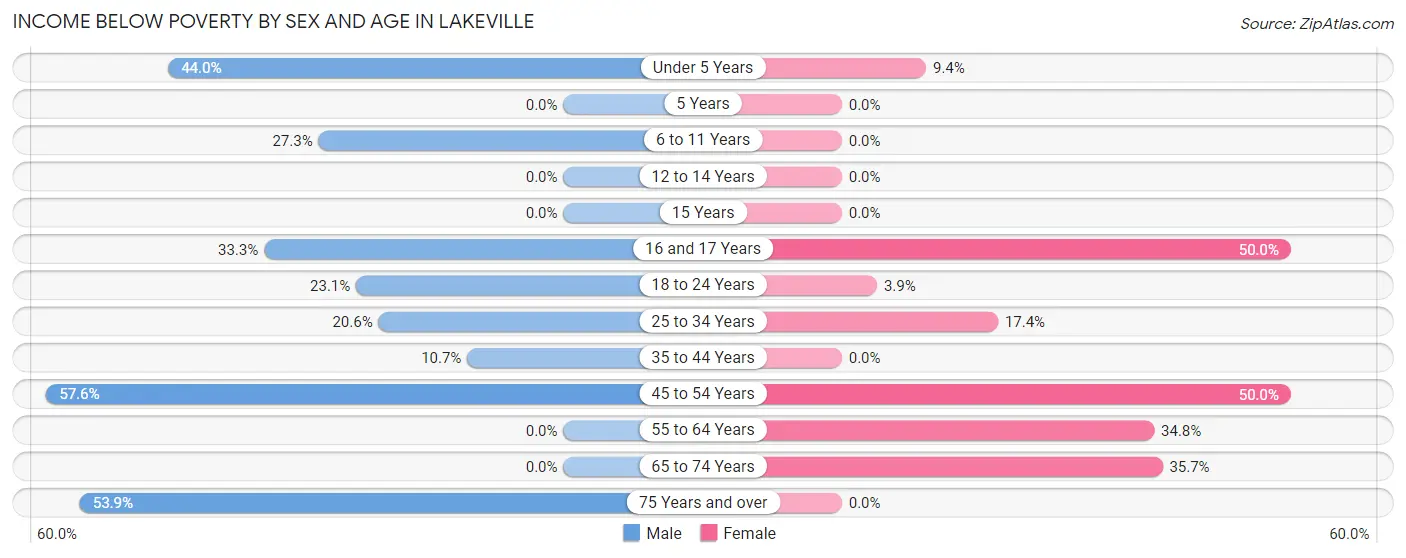
| Age Bracket | Male | Female |
| Under 5 Years | 11 (44.0%) | 3 (9.4%) |
| 5 Years | 0 (0.0%) | 0 (0.0%) |
| 6 to 11 Years | 6 (27.3%) | 0 (0.0%) |
| 12 to 14 Years | 0 (0.0%) | 0 (0.0%) |
| 15 Years | 0 (0.0%) | 0 (0.0%) |
| 16 and 17 Years | 4 (33.3%) | 7 (50.0%) |
| 18 to 24 Years | 6 (23.1%) | 2 (3.9%) |
| 25 to 34 Years | 7 (20.6%) | 8 (17.4%) |
| 35 to 44 Years | 3 (10.7%) | 0 (0.0%) |
| 45 to 54 Years | 38 (57.6%) | 32 (50.0%) |
| 55 to 64 Years | 0 (0.0%) | 16 (34.8%) |
| 65 to 74 Years | 0 (0.0%) | 15 (35.7%) |
| 75 Years and over | 7 (53.8%) | 0 (0.0%) |
| Total | 82 (26.6%) | 83 (21.7%) |
Income Above Poverty by Sex and Age in Lakeville
According to the poverty statistics in Lakeville, males aged 12 to 14 years and females aged 6 to 11 years are the age groups that are most secure financially, with 100.0% of males and 100.0% of females in these age groups living above the poverty line.
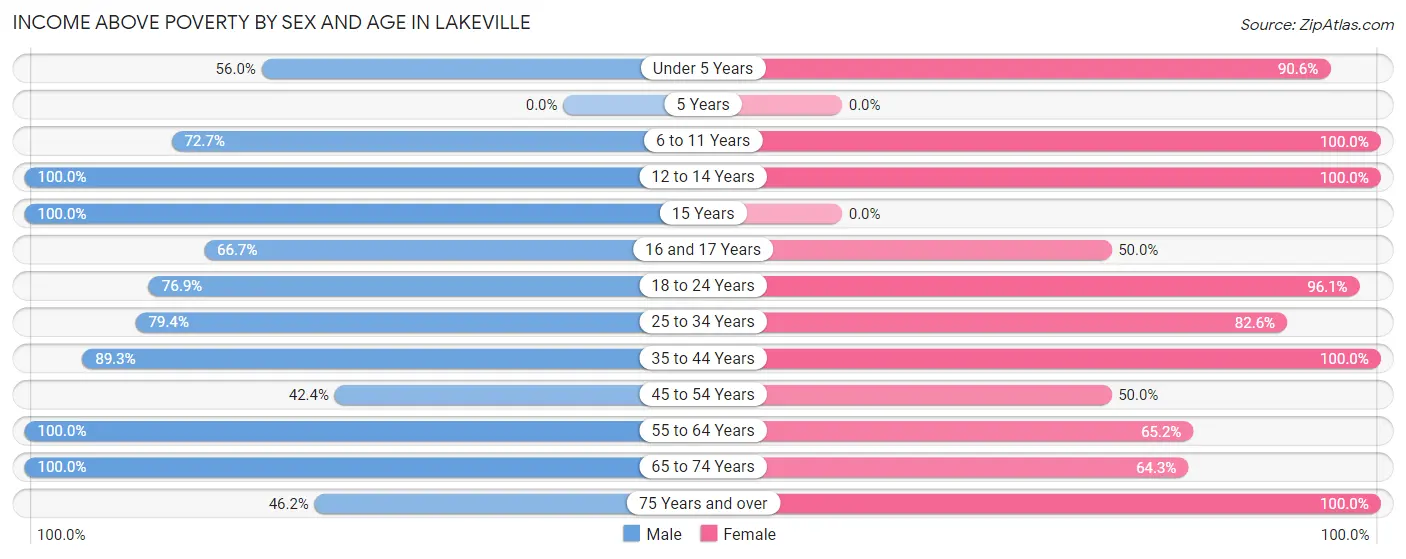
| Age Bracket | Male | Female |
| Under 5 Years | 14 (56.0%) | 29 (90.6%) |
| 5 Years | 0 (0.0%) | 0 (0.0%) |
| 6 to 11 Years | 16 (72.7%) | 24 (100.0%) |
| 12 to 14 Years | 11 (100.0%) | 17 (100.0%) |
| 15 Years | 5 (100.0%) | 0 (0.0%) |
| 16 and 17 Years | 8 (66.7%) | 7 (50.0%) |
| 18 to 24 Years | 20 (76.9%) | 49 (96.1%) |
| 25 to 34 Years | 27 (79.4%) | 38 (82.6%) |
| 35 to 44 Years | 25 (89.3%) | 36 (100.0%) |
| 45 to 54 Years | 28 (42.4%) | 32 (50.0%) |
| 55 to 64 Years | 25 (100.0%) | 30 (65.2%) |
| 65 to 74 Years | 41 (100.0%) | 27 (64.3%) |
| 75 Years and over | 6 (46.2%) | 10 (100.0%) |
| Total | 226 (73.4%) | 299 (78.3%) |
Income Below Poverty Among Married-Couple Families in Lakeville
The poverty statistics for married-couple families in Lakeville show that 16.2% or 17 of the total 105 families live below the poverty line. Families with 3 or 4 children have the highest poverty rate of 62.5%, comprising of 5 families. On the other hand, families with 1 or 2 children have the lowest poverty rate of 0.0%, which includes 0 families.
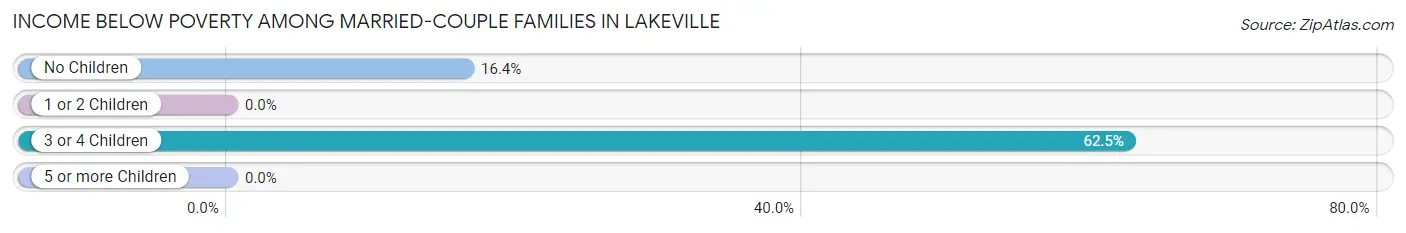
| Children | Above Poverty | Below Poverty |
| No Children | 61 (83.6%) | 12 (16.4%) |
| 1 or 2 Children | 24 (100.0%) | 0 (0.0%) |
| 3 or 4 Children | 3 (37.5%) | 5 (62.5%) |
| 5 or more Children | 0 (0.0%) | 0 (0.0%) |
| Total | 88 (83.8%) | 17 (16.2%) |
Income Below Poverty Among Single-Parent Households in Lakeville
According to the poverty data in Lakeville, 33.3% or 5 single-father households and 19.2% or 10 single-mother households are living below the poverty line. Among single-father households, those with 1 or 2 children have the highest poverty rate, with 5 households (100.0%) experiencing poverty. Likewise, among single-mother households, those with no children have the highest poverty rate, with 7 households (70.0%) falling below the poverty line.
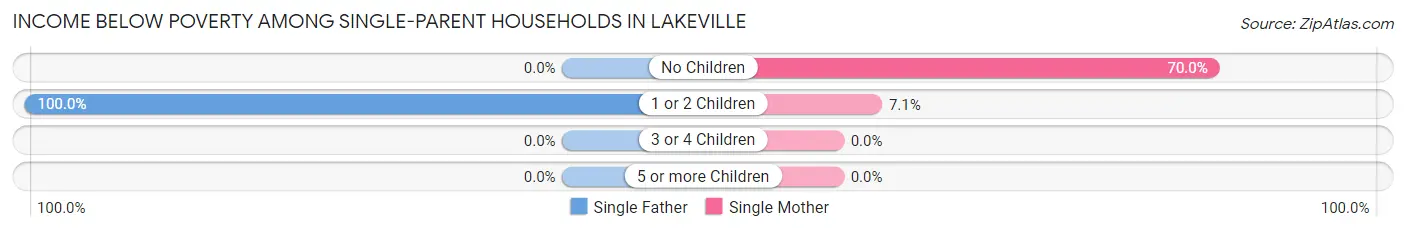
| Children | Single Father | Single Mother |
| No Children | 0 (0.0%) | 7 (70.0%) |
| 1 or 2 Children | 5 (100.0%) | 3 (7.1%) |
| 3 or 4 Children | 0 (0.0%) | 0 (0.0%) |
| 5 or more Children | 0 (0.0%) | 0 (0.0%) |
| Total | 5 (33.3%) | 10 (19.2%) |
Income Below Poverty Among Married-Couple vs Single-Parent Households in Lakeville
The poverty data for Lakeville shows that 17 of the married-couple family households (16.2%) and 15 of the single-parent households (22.4%) are living below the poverty level. Within the married-couple family households, those with 3 or 4 children have the highest poverty rate, with 5 households (62.5%) falling below the poverty line. Among the single-parent households, those with no children have the highest poverty rate, with 7 household (70.0%) living below poverty.
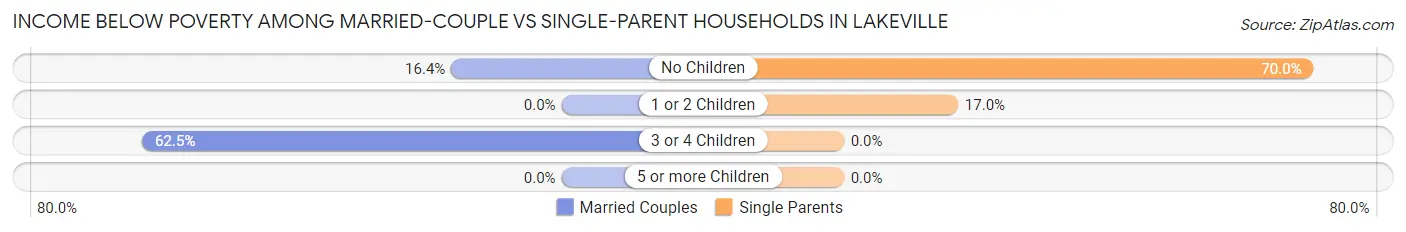
| Children | Married-Couple Families | Single-Parent Households |
| No Children | 12 (16.4%) | 7 (70.0%) |
| 1 or 2 Children | 0 (0.0%) | 8 (17.0%) |
| 3 or 4 Children | 5 (62.5%) | 0 (0.0%) |
| 5 or more Children | 0 (0.0%) | 0 (0.0%) |
| Total | 17 (16.2%) | 15 (22.4%) |
Race in Lakeville
The most populous races in Lakeville are White / Caucasian (661 | 95.8%), Hispanic or Latino (20 | 2.9%), and Two or more Races (20 | 2.9%).
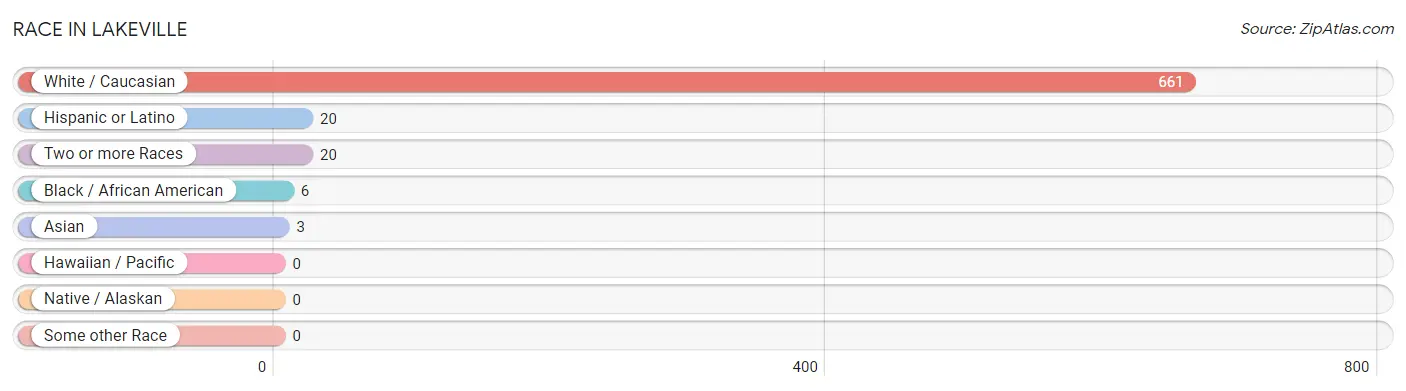
| Race | # Population | % Population |
| Asian | 3 | 0.4% |
| Black / African American | 6 | 0.9% |
| Hawaiian / Pacific | 0 | 0.0% |
| Hispanic or Latino | 20 | 2.9% |
| Native / Alaskan | 0 | 0.0% |
| White / Caucasian | 661 | 95.8% |
| Two or more Races | 20 | 2.9% |
| Some other Race | 0 | 0.0% |
| Total | 690 | 100.0% |
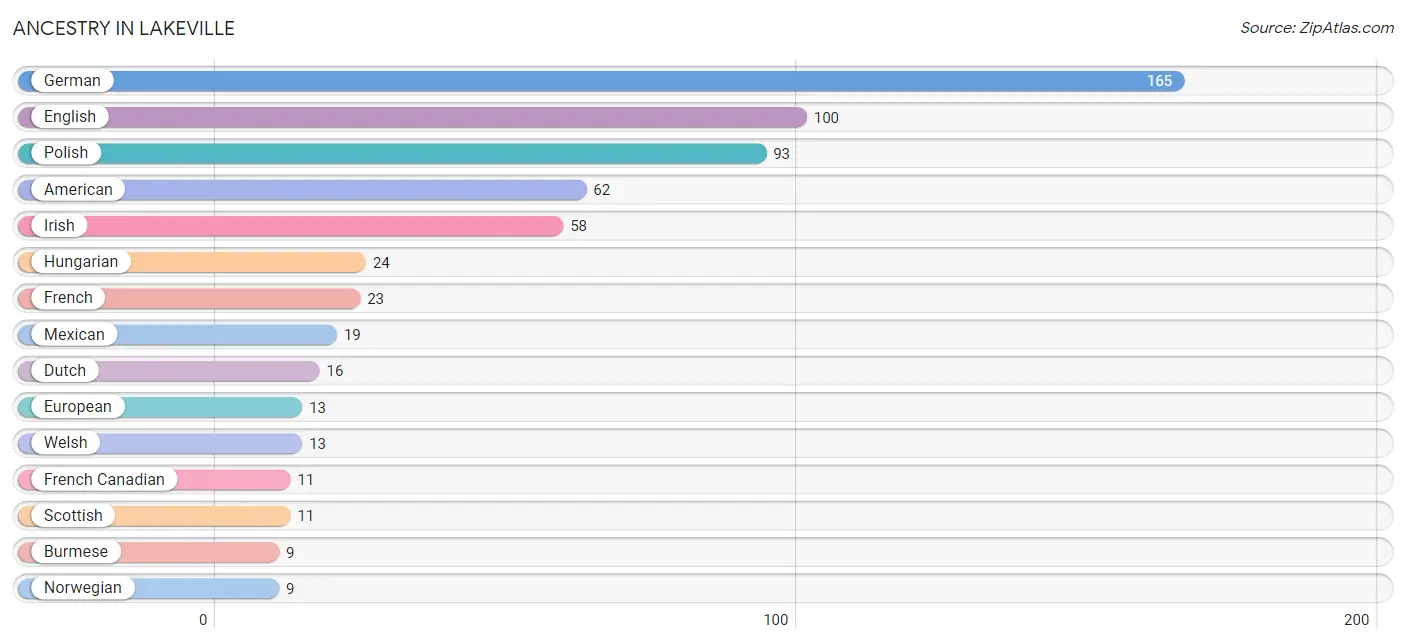
Ancestry in Lakeville
The most populous ancestries reported in Lakeville are German (165 | 23.9%), English (100 | 14.5%), Polish (93 | 13.5%), American (62 | 9.0%), and Irish (58 | 8.4%), together accounting for 69.3% of all Lakeville residents.
| Ancestry | # Population | % Population |
| American | 62 | 9.0% |
| British | 3 | 0.4% |
| Burmese | 9 | 1.3% |
| Canadian | 6 | 0.9% |
| Central American | 1 | 0.1% |
| Cherokee | 3 | 0.4% |
| Danish | 6 | 0.9% |
| Dutch | 16 | 2.3% |
| English | 100 | 14.5% |
| European | 13 | 1.9% |
| French | 23 | 3.3% |
| French Canadian | 11 | 1.6% |
| German | 165 | 23.9% |
| Hungarian | 24 | 3.5% |
| Irish | 58 | 8.4% |
| Italian | 6 | 0.9% |
| Mexican | 19 | 2.8% |
| Norwegian | 9 | 1.3% |
| Pennsylvania German | 3 | 0.4% |
| Polish | 93 | 13.5% |
| Salvadoran | 1 | 0.1% |
| Scotch-Irish | 2 | 0.3% |
| Scottish | 11 | 1.6% |
| Swedish | 8 | 1.2% |
| Swiss | 7 | 1.0% |
| Welsh | 13 | 1.9% | View All 26 Rows |
Immigrants in Lakeville
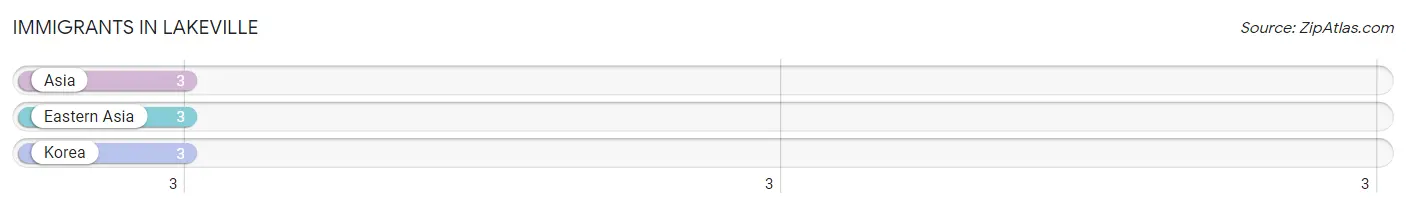
The most numerous immigrant groups reported in Lakeville came from Asia (3 | 0.4%), Eastern Asia (3 | 0.4%), and Korea (3 | 0.4%), together accounting for 1.3% of all Lakeville residents.
| Immigration Origin | # Population | % Population |
| Asia | 3 | 0.4% |
| Eastern Asia | 3 | 0.4% |
| Korea | 3 | 0.4% | View All 3 Rows |
Sex and Age in Lakeville
Sex and Age in Lakeville
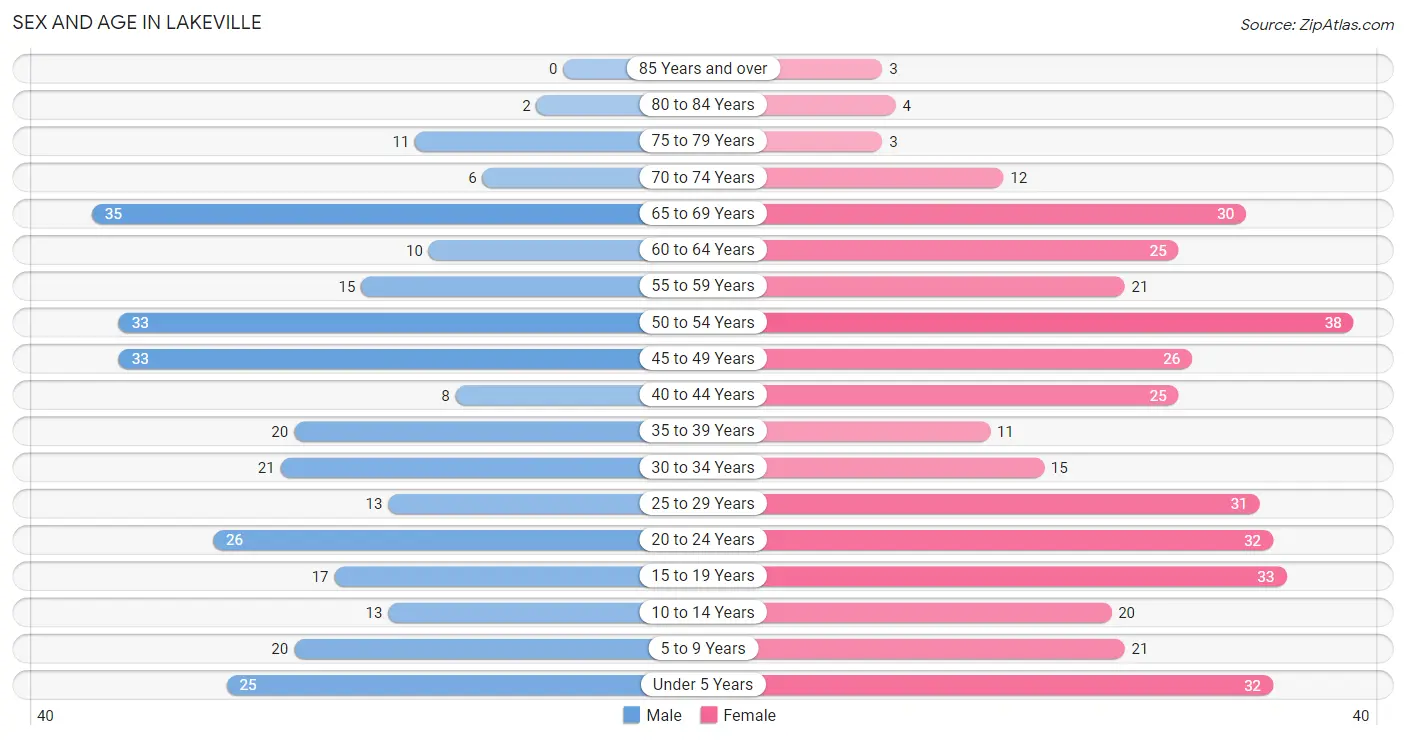
The most populous age groups in Lakeville are 65 to 69 Years (35 | 11.4%) for men and 50 to 54 Years (38 | 10.0%) for women.
| Age Bracket | Male | Female |
| Under 5 Years | 25 (8.1%) | 32 (8.4%) |
| 5 to 9 Years | 20 (6.5%) | 21 (5.5%) |
| 10 to 14 Years | 13 (4.2%) | 20 (5.2%) |
| 15 to 19 Years | 17 (5.5%) | 33 (8.6%) |
| 20 to 24 Years | 26 (8.4%) | 32 (8.4%) |
| 25 to 29 Years | 13 (4.2%) | 31 (8.1%) |
| 30 to 34 Years | 21 (6.8%) | 15 (3.9%) |
| 35 to 39 Years | 20 (6.5%) | 11 (2.9%) |
| 40 to 44 Years | 8 (2.6%) | 25 (6.5%) |
| 45 to 49 Years | 33 (10.7%) | 26 (6.8%) |
| 50 to 54 Years | 33 (10.7%) | 38 (10.0%) |
| 55 to 59 Years | 15 (4.9%) | 21 (5.5%) |
| 60 to 64 Years | 10 (3.3%) | 25 (6.5%) |
| 65 to 69 Years | 35 (11.4%) | 30 (7.9%) |
| 70 to 74 Years | 6 (1.9%) | 12 (3.1%) |
| 75 to 79 Years | 11 (3.6%) | 3 (0.8%) |
| 80 to 84 Years | 2 (0.6%) | 4 (1.1%) |
| 85 Years and over | 0 (0.0%) | 3 (0.8%) |
| Total | 308 (100.0%) | 382 (100.0%) |
Families and Households in Lakeville
Median Family Size in Lakeville
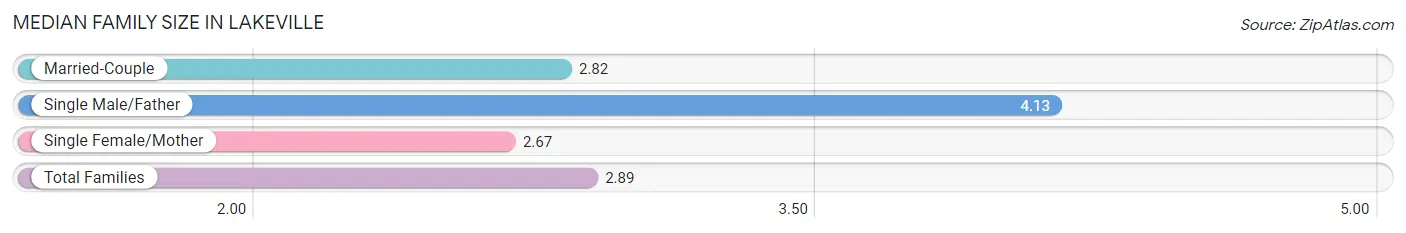
The median family size in Lakeville is 2.89 persons per family, with single male/father families (15 | 8.7%) accounting for the largest median family size of 4.13 persons per family. On the other hand, single female/mother families (52 | 30.2%) represent the smallest median family size with 2.67 persons per family.
| Family Type | # Families | Family Size |
| Married-Couple | 105 (61.1%) | 2.82 |
| Single Male/Father | 15 (8.7%) | 4.13 |
| Single Female/Mother | 52 (30.2%) | 2.67 |
| Total Families | 172 (100.0%) | 2.89 |
Median Household Size in Lakeville
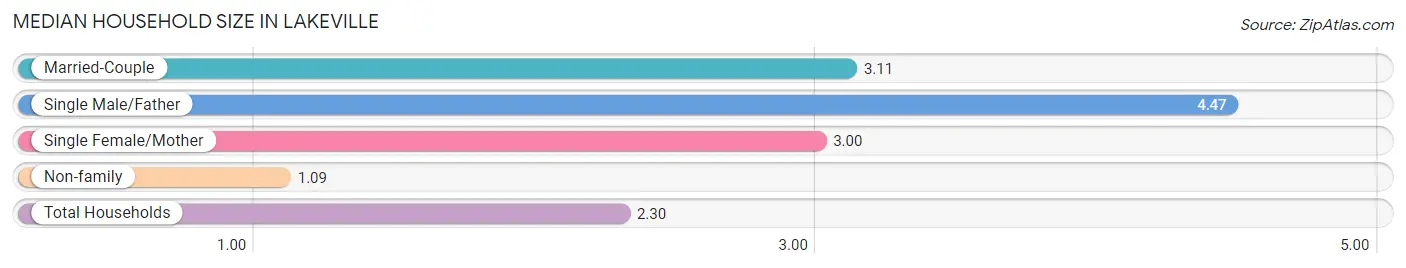
The median household size in Lakeville is 2.30 persons per household, with single male/father households (15 | 5.0%) accounting for the largest median household size of 4.47 persons per household. non-family households (128 | 42.7%) represent the smallest median household size with 1.09 persons per household.
| Household Type | # Households | Household Size |
| Married-Couple | 105 (35.0%) | 3.11 |
| Single Male/Father | 15 (5.0%) | 4.47 |
| Single Female/Mother | 52 (17.3%) | 3.00 |
| Non-family | 128 (42.7%) | 1.09 |
| Total Households | 300 (100.0%) | 2.30 |
Household Size by Marriage Status in Lakeville
Out of a total of 300 households in Lakeville, 172 (57.3%) are family households, while 128 (42.7%) are nonfamily households. The most numerous type of family households are 2-person households, comprising 87, and the most common type of nonfamily households are 1-person households, comprising 117.
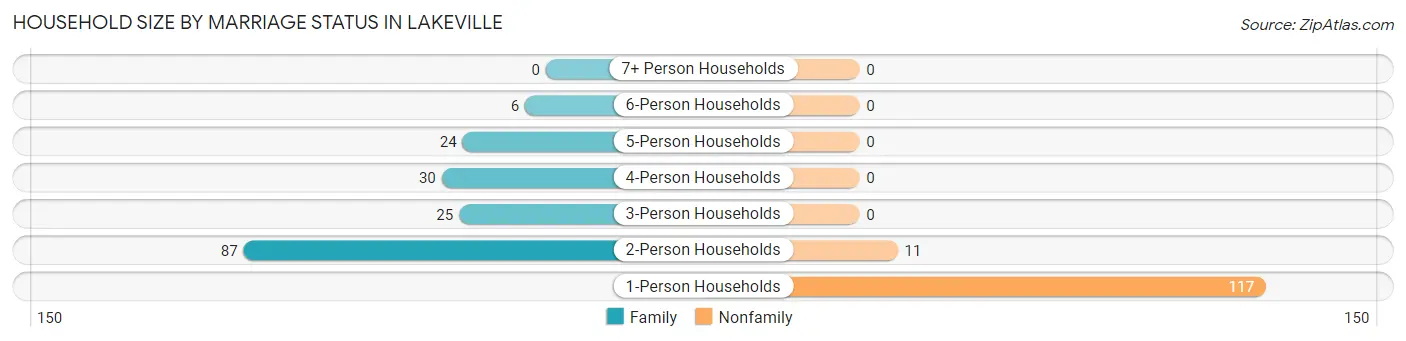
| Household Size | Family Households | Nonfamily Households |
| 1-Person Households | - | 117 (39.0%) |
| 2-Person Households | 87 (29.0%) | 11 (3.7%) |
| 3-Person Households | 25 (8.3%) | 0 (0.0%) |
| 4-Person Households | 30 (10.0%) | 0 (0.0%) |
| 5-Person Households | 24 (8.0%) | 0 (0.0%) |
| 6-Person Households | 6 (2.0%) | 0 (0.0%) |
| 7+ Person Households | 0 (0.0%) | 0 (0.0%) |
| Total | 172 (57.3%) | 128 (42.7%) |
Female Fertility in Lakeville
Fertility by Age in Lakeville
Average fertility rate in Lakeville is 70.0 births per 1,000 women. Women in the age bracket of 20 to 34 years have the highest fertility rate with 179.0 births per 1,000 women. Women in the age bracket of 20 to 34 years acount for 100.0% of all women with births.
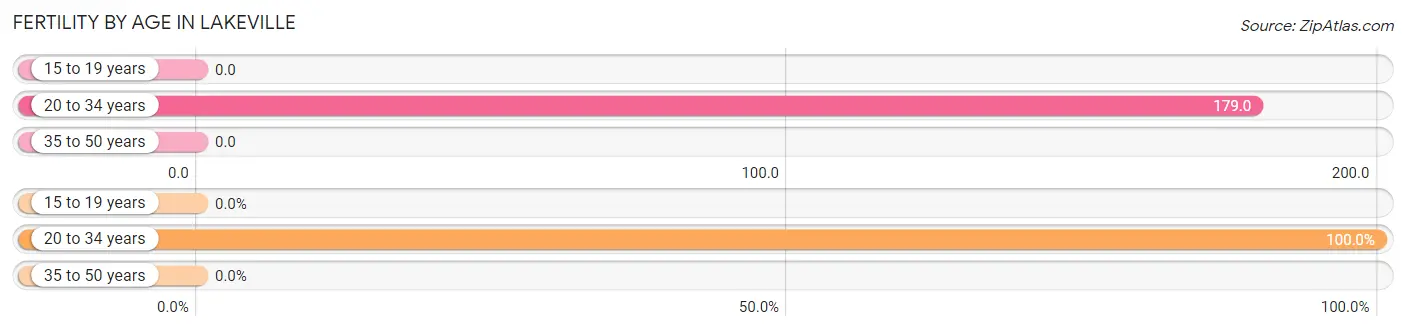
| Age Bracket | Women with Births | Births / 1,000 Women |
| 15 to 19 years | 0 (0.0%) | 0.0 |
| 20 to 34 years | 14 (100.0%) | 179.0 |
| 35 to 50 years | 0 (0.0%) | 0.0 |
| Total | 14 (100.0%) | 70.0 |
Fertility by Age by Marriage Status in Lakeville
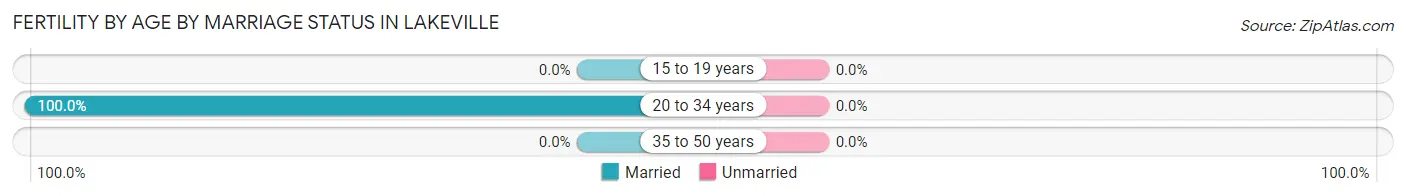
| Age Bracket | Married | Unmarried |
| 15 to 19 years | 0 (0.0%) | 0 (0.0%) |
| 20 to 34 years | 14 (100.0%) | 0 (0.0%) |
| 35 to 50 years | 0 (0.0%) | 0 (0.0%) |
| Total | 14 (100.0%) | 0 (0.0%) |
Fertility by Education in Lakeville
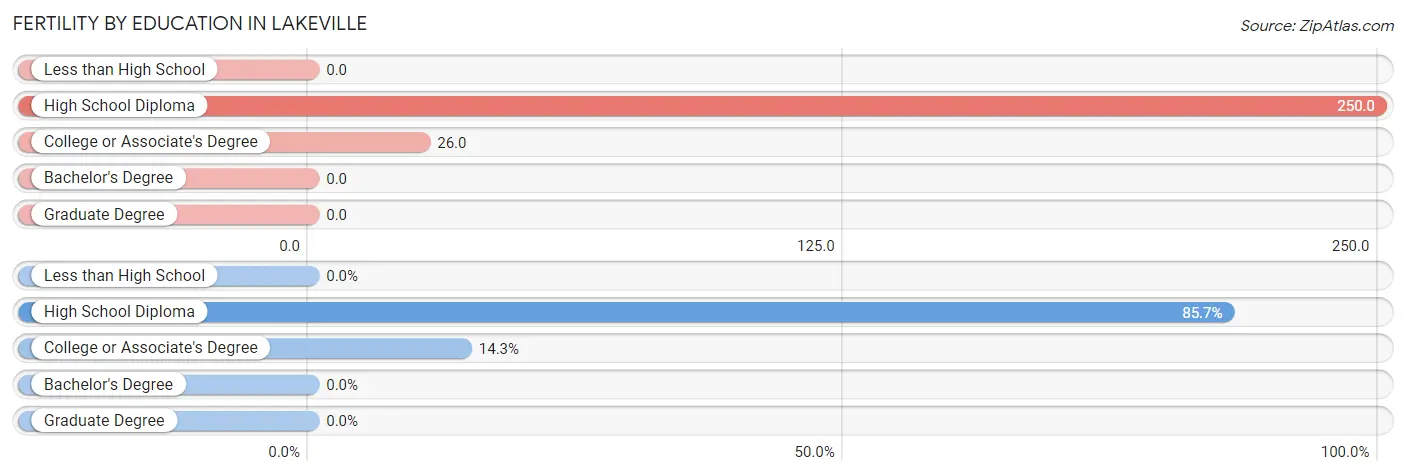
| Educational Attainment | Women with Births | Births / 1,000 Women |
| Less than High School | 0 (0.0%) | 0.0 |
| High School Diploma | 12 (85.7%) | 250.0 |
| College or Associate's Degree | 2 (14.3%) | 26.0 |
| Bachelor's Degree | 0 (0.0%) | 0.0 |
| Graduate Degree | 0 (0.0%) | 0.0 |
| Total | 14 (100.0%) | 70.0 |
Fertility by Education by Marriage Status in Lakeville
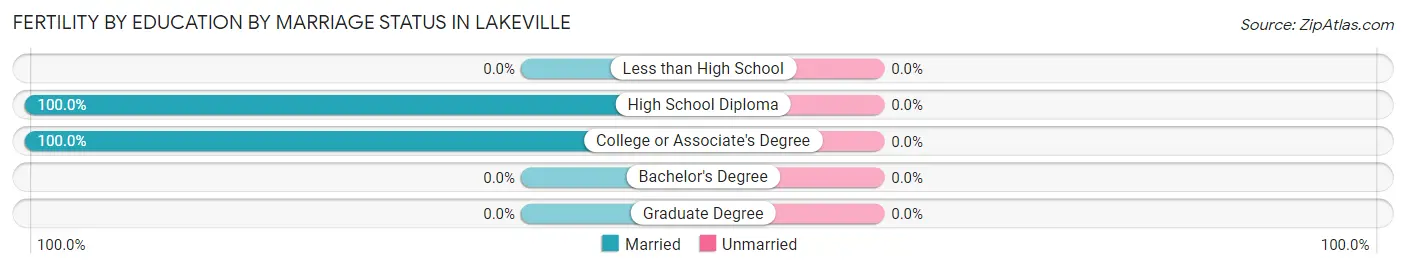
| Educational Attainment | Married | Unmarried |
| Less than High School | 0 (0.0%) | 0 (0.0%) |
| High School Diploma | 12 (100.0%) | 0 (0.0%) |
| College or Associate's Degree | 2 (100.0%) | 0 (0.0%) |
| Bachelor's Degree | 0 (0.0%) | 0 (0.0%) |
| Graduate Degree | 0 (0.0%) | 0 (0.0%) |
| Total | 14 (100.0%) | 0 (0.0%) |
Employment Characteristics in Lakeville
Employment by Class of Employer in Lakeville
Among the 312 employed individuals in Lakeville, private company employees (240 | 76.9%), not-for-profit organizations (40 | 12.8%), and local government employees (21 | 6.7%) make up the most common classes of employment.
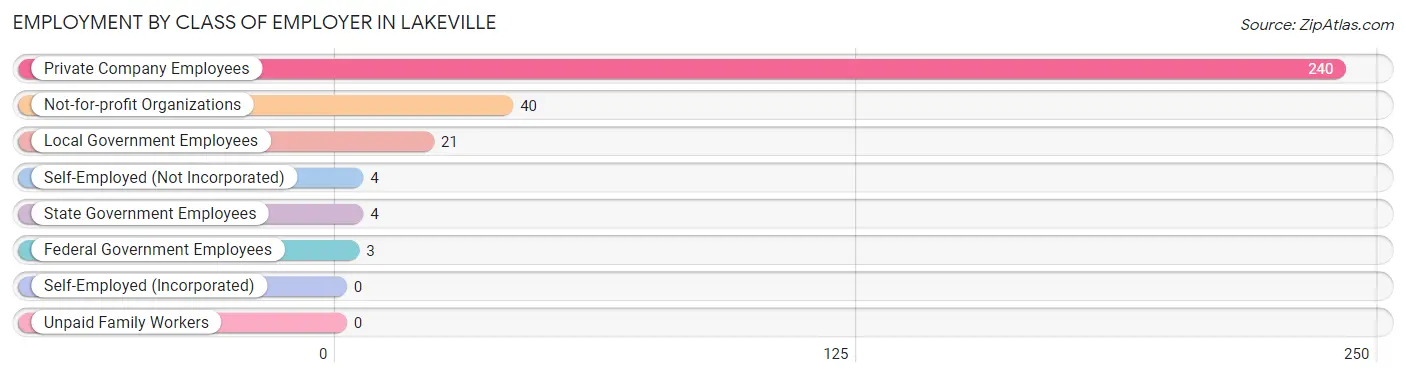
| Employer Class | # Employees | % Employees |
| Private Company Employees | 240 | 76.9% |
| Self-Employed (Incorporated) | 0 | 0.0% |
| Self-Employed (Not Incorporated) | 4 | 1.3% |
| Not-for-profit Organizations | 40 | 12.8% |
| Local Government Employees | 21 | 6.7% |
| State Government Employees | 4 | 1.3% |
| Federal Government Employees | 3 | 1.0% |
| Unpaid Family Workers | 0 | 0.0% |
| Total | 312 | 100.0% |
Employment Status by Age in Lakeville
According to the labor force statistics for Lakeville, out of the total population over 16 years of age (554), 58.1% or 322 individuals are in the labor force, with 3.1% or 10 of them unemployed. The age group with the highest labor force participation rate is 25 to 29 years, with 100.0% or 44 individuals in the labor force. Within the labor force, the 16 to 19 years age range has the highest percentage of unemployed individuals, with 33.3% or 7 of them being unemployed.
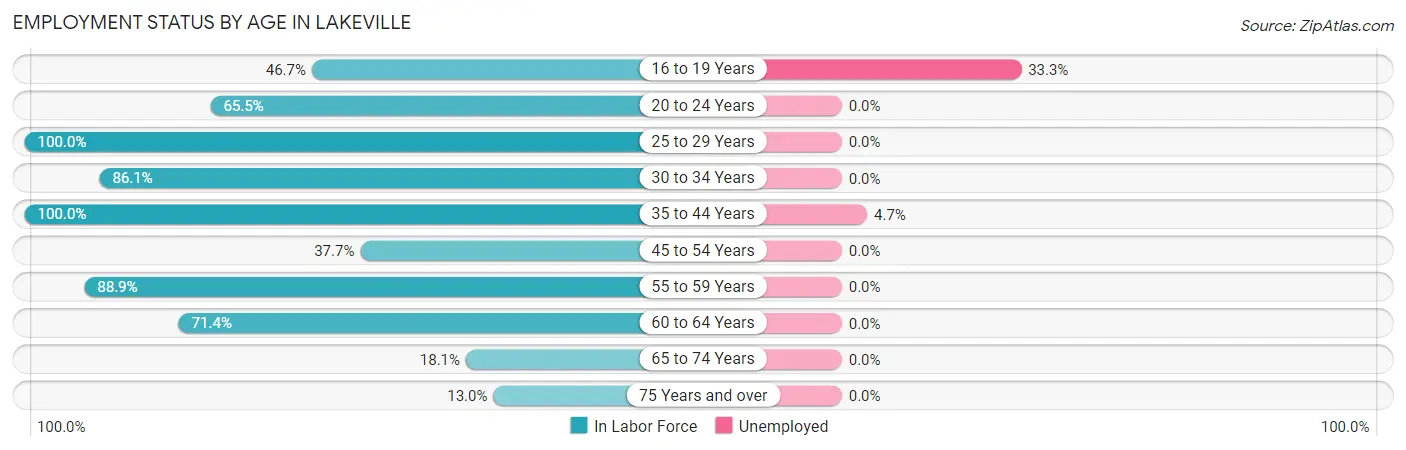
| Age Bracket | In Labor Force | Unemployed |
| 16 to 19 Years | 21 (46.7%) | 7 (33.3%) |
| 20 to 24 Years | 38 (65.5%) | 0 (0.0%) |
| 25 to 29 Years | 44 (100.0%) | 0 (0.0%) |
| 30 to 34 Years | 31 (86.1%) | 0 (0.0%) |
| 35 to 44 Years | 64 (100.0%) | 3 (4.7%) |
| 45 to 54 Years | 49 (37.7%) | 0 (0.0%) |
| 55 to 59 Years | 32 (88.9%) | 0 (0.0%) |
| 60 to 64 Years | 25 (71.4%) | 0 (0.0%) |
| 65 to 74 Years | 15 (18.1%) | 0 (0.0%) |
| 75 Years and over | 3 (13.0%) | 0 (0.0%) |
| Total | 322 (58.1%) | 10 (3.1%) |
Employment Status by Educational Attainment in Lakeville
According to labor force statistics for Lakeville, 71.0% of individuals (245) out of the total population between 25 and 64 years of age (345) are in the labor force, with 1.2% or 3 of them being unemployed. The group with the highest labor force participation rate are those with the educational attainment of high school diploma, with 83.5% or 96 individuals in the labor force. Within the labor force, individuals with college / associate degree education have the highest percentage of unemployment, with 3.9% or 3 of them being unemployed.
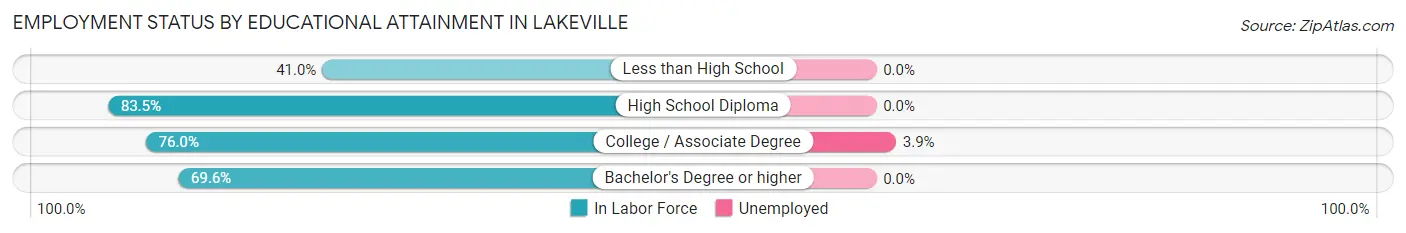
| Educational Attainment | In Labor Force | Unemployed |
| Less than High School | 25 (41.0%) | 0 (0.0%) |
| High School Diploma | 96 (83.5%) | 0 (0.0%) |
| College / Associate Degree | 76 (76.0%) | 4 (3.9%) |
| Bachelor's Degree or higher | 48 (69.6%) | 0 (0.0%) |
| Total | 245 (71.0%) | 4 (1.2%) |
Employment Occupations by Sex in Lakeville
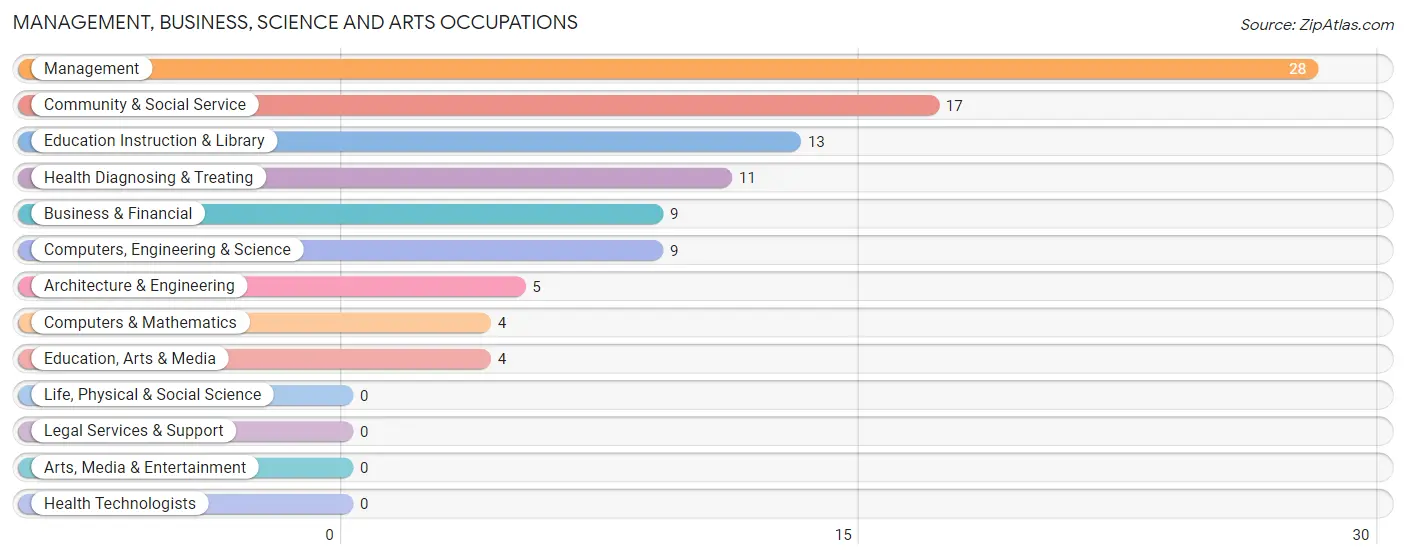
Management, Business, Science and Arts Occupations
The most common Management, Business, Science and Arts occupations in Lakeville are Management (28 | 9.0%), Community & Social Service (17 | 5.4%), Education Instruction & Library (13 | 4.2%), Health Diagnosing & Treating (11 | 3.5%), and Business & Financial (9 | 2.9%).
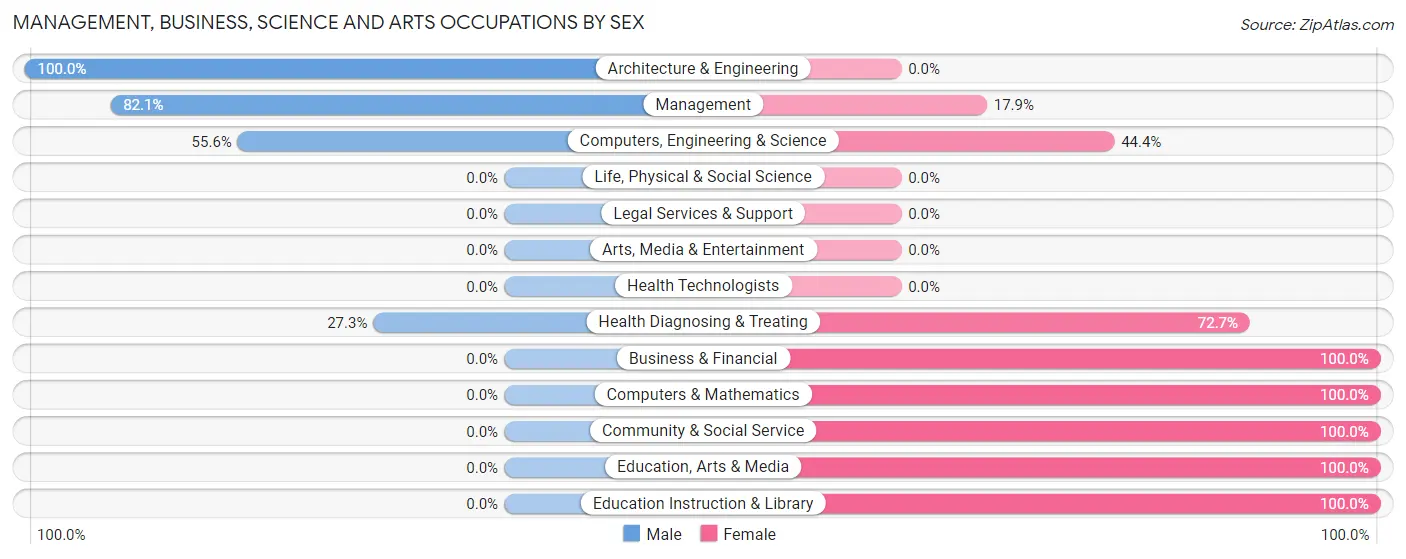
Management, Business, Science and Arts Occupations by Sex
Within the Management, Business, Science and Arts occupations in Lakeville, the most male-oriented occupations are Architecture & Engineering (100.0%), Management (82.1%), and Computers, Engineering & Science (55.6%), while the most female-oriented occupations are Business & Financial (100.0%), Computers & Mathematics (100.0%), and Community & Social Service (100.0%).
| Occupation | Male | Female |
| Management | 23 (82.1%) | 5 (17.9%) |
| Business & Financial | 0 (0.0%) | 9 (100.0%) |
| Computers, Engineering & Science | 5 (55.6%) | 4 (44.4%) |
| Computers & Mathematics | 0 (0.0%) | 4 (100.0%) |
| Architecture & Engineering | 5 (100.0%) | 0 (0.0%) |
| Life, Physical & Social Science | 0 (0.0%) | 0 (0.0%) |
| Community & Social Service | 0 (0.0%) | 17 (100.0%) |
| Education, Arts & Media | 0 (0.0%) | 4 (100.0%) |
| Legal Services & Support | 0 (0.0%) | 0 (0.0%) |
| Education Instruction & Library | 0 (0.0%) | 13 (100.0%) |
| Arts, Media & Entertainment | 0 (0.0%) | 0 (0.0%) |
| Health Diagnosing & Treating | 3 (27.3%) | 8 (72.7%) |
| Health Technologists | 0 (0.0%) | 0 (0.0%) |
| Total (Category) | 31 (41.9%) | 43 (58.1%) |
| Total (Overall) | 147 (47.1%) | 165 (52.9%) |
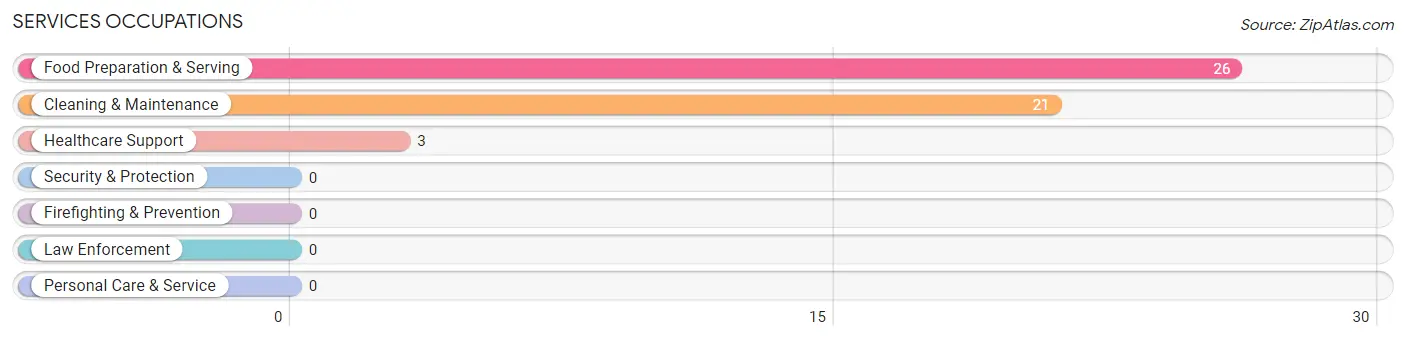
Services Occupations
The most common Services occupations in Lakeville are Food Preparation & Serving (26 | 8.3%), Cleaning & Maintenance (21 | 6.7%), and Healthcare Support (3 | 1.0%).
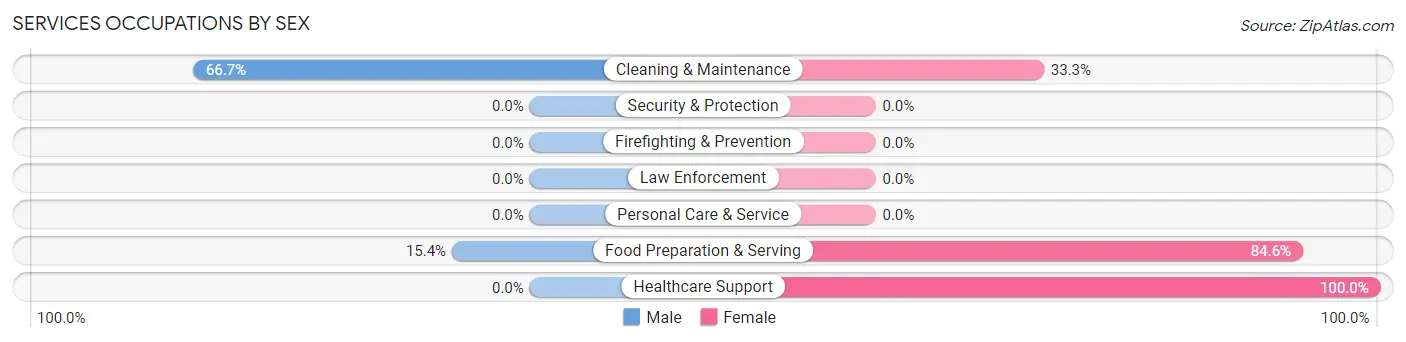
Services Occupations by Sex
Within the Services occupations in Lakeville, the most male-oriented occupations are Cleaning & Maintenance (66.7%), and Food Preparation & Serving (15.4%), while the most female-oriented occupations are Healthcare Support (100.0%), Food Preparation & Serving (84.6%), and Cleaning & Maintenance (33.3%).
| Occupation | Male | Female |
| Healthcare Support | 0 (0.0%) | 3 (100.0%) |
| Security & Protection | 0 (0.0%) | 0 (0.0%) |
| Firefighting & Prevention | 0 (0.0%) | 0 (0.0%) |
| Law Enforcement | 0 (0.0%) | 0 (0.0%) |
| Food Preparation & Serving | 4 (15.4%) | 22 (84.6%) |
| Cleaning & Maintenance | 14 (66.7%) | 7 (33.3%) |
| Personal Care & Service | 0 (0.0%) | 0 (0.0%) |
| Total (Category) | 18 (36.0%) | 32 (64.0%) |
| Total (Overall) | 147 (47.1%) | 165 (52.9%) |
Sales and Office Occupations
The most common Sales and Office occupations in Lakeville are Sales & Related (50 | 16.0%), and Office & Administration (50 | 16.0%).

Sales and Office Occupations by Sex

| Occupation | Male | Female |
| Sales & Related | 19 (38.0%) | 31 (62.0%) |
| Office & Administration | 6 (12.0%) | 44 (88.0%) |
| Total (Category) | 25 (25.0%) | 75 (75.0%) |
| Total (Overall) | 147 (47.1%) | 165 (52.9%) |
Natural Resources, Construction and Maintenance Occupations
The most common Natural Resources, Construction and Maintenance occupations in Lakeville are Construction & Extraction (23 | 7.4%), and Installation, Maintenance & Repair (14 | 4.5%).
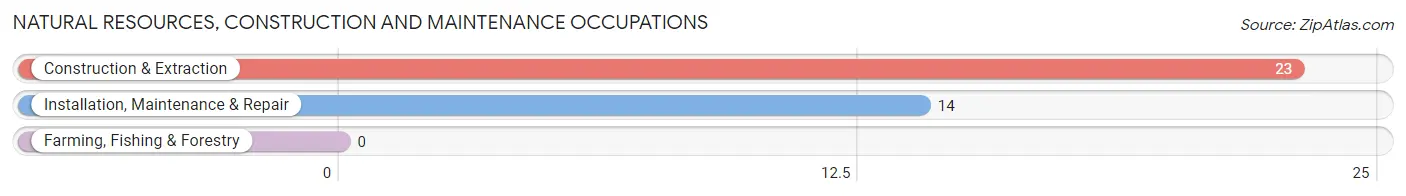
Natural Resources, Construction and Maintenance Occupations by Sex

| Occupation | Male | Female |
| Farming, Fishing & Forestry | 0 (0.0%) | 0 (0.0%) |
| Construction & Extraction | 23 (100.0%) | 0 (0.0%) |
| Installation, Maintenance & Repair | 14 (100.0%) | 0 (0.0%) |
| Total (Category) | 37 (100.0%) | 0 (0.0%) |
| Total (Overall) | 147 (47.1%) | 165 (52.9%) |
Production, Transportation and Moving Occupations
The most common Production, Transportation and Moving occupations in Lakeville are Production (31 | 9.9%), Material Moving (12 | 3.8%), and Transportation (8 | 2.6%).
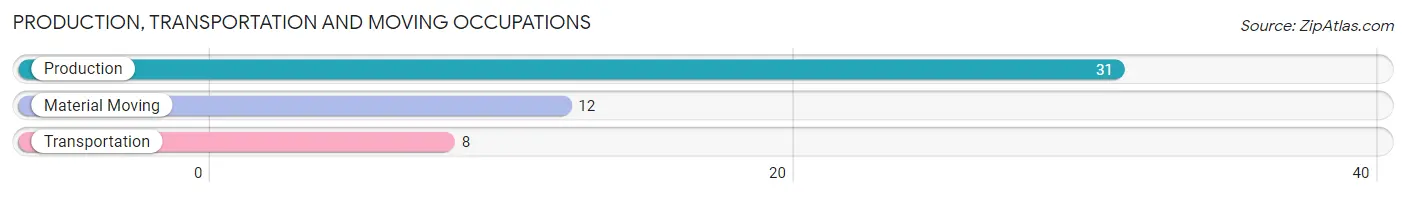
Production, Transportation and Moving Occupations by Sex
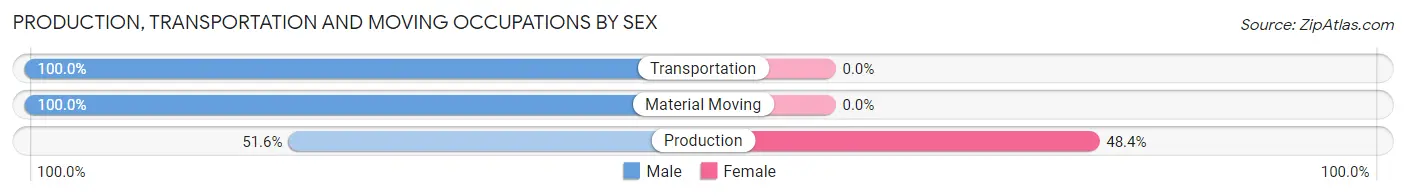
| Occupation | Male | Female |
| Production | 16 (51.6%) | 15 (48.4%) |
| Transportation | 8 (100.0%) | 0 (0.0%) |
| Material Moving | 12 (100.0%) | 0 (0.0%) |
| Total (Category) | 36 (70.6%) | 15 (29.4%) |
| Total (Overall) | 147 (47.1%) | 165 (52.9%) |
Employment Industries by Sex in Lakeville
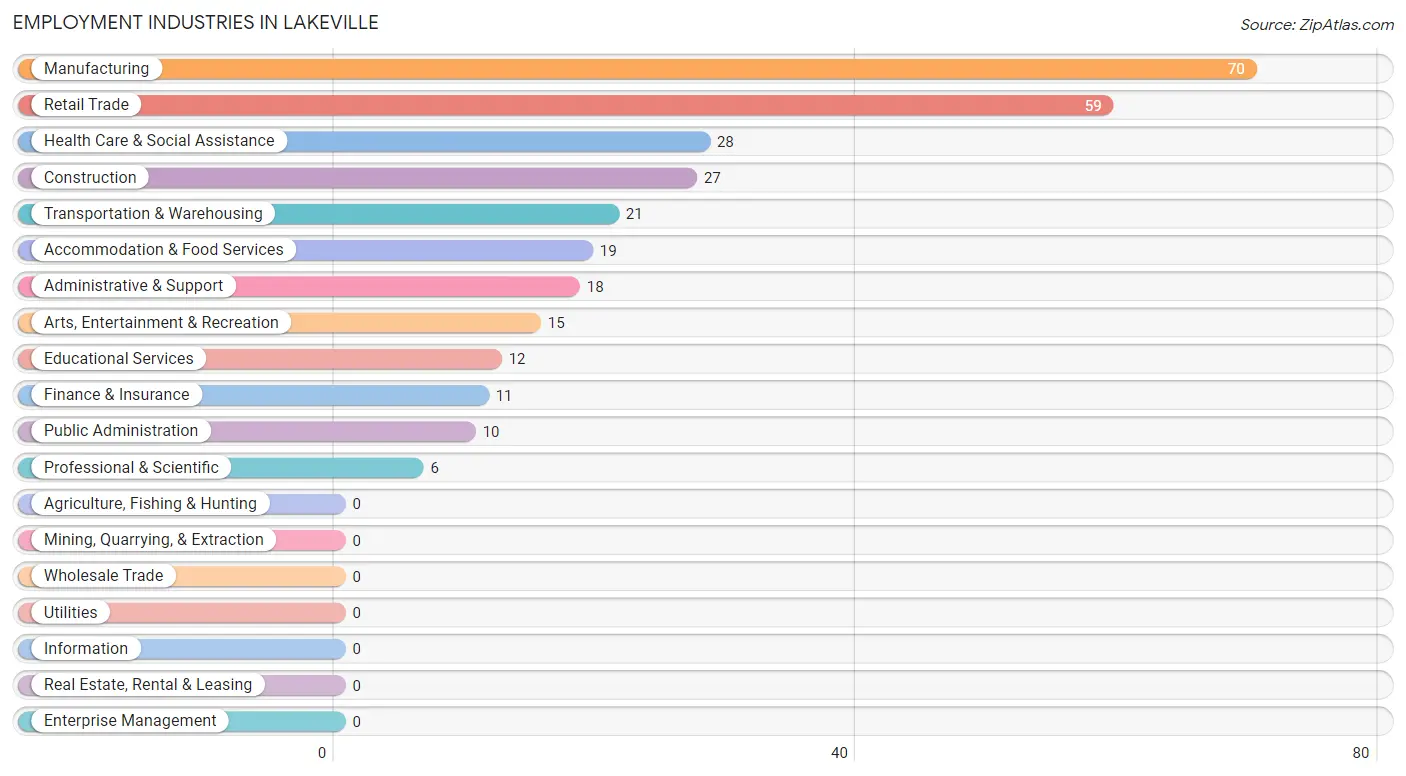
Employment Industries in Lakeville
The major employment industries in Lakeville include Manufacturing (70 | 22.4%), Retail Trade (59 | 18.9%), Health Care & Social Assistance (28 | 9.0%), Construction (27 | 8.6%), and Transportation & Warehousing (21 | 6.7%).
Employment Industries by Sex in Lakeville
The Lakeville industries that see more men than women are Transportation & Warehousing (85.7%), Construction (74.1%), and Accommodation & Food Services (73.7%), whereas the industries that tend to have a higher number of women are Finance & Insurance (100.0%), Professional & Scientific (100.0%), and Educational Services (100.0%).
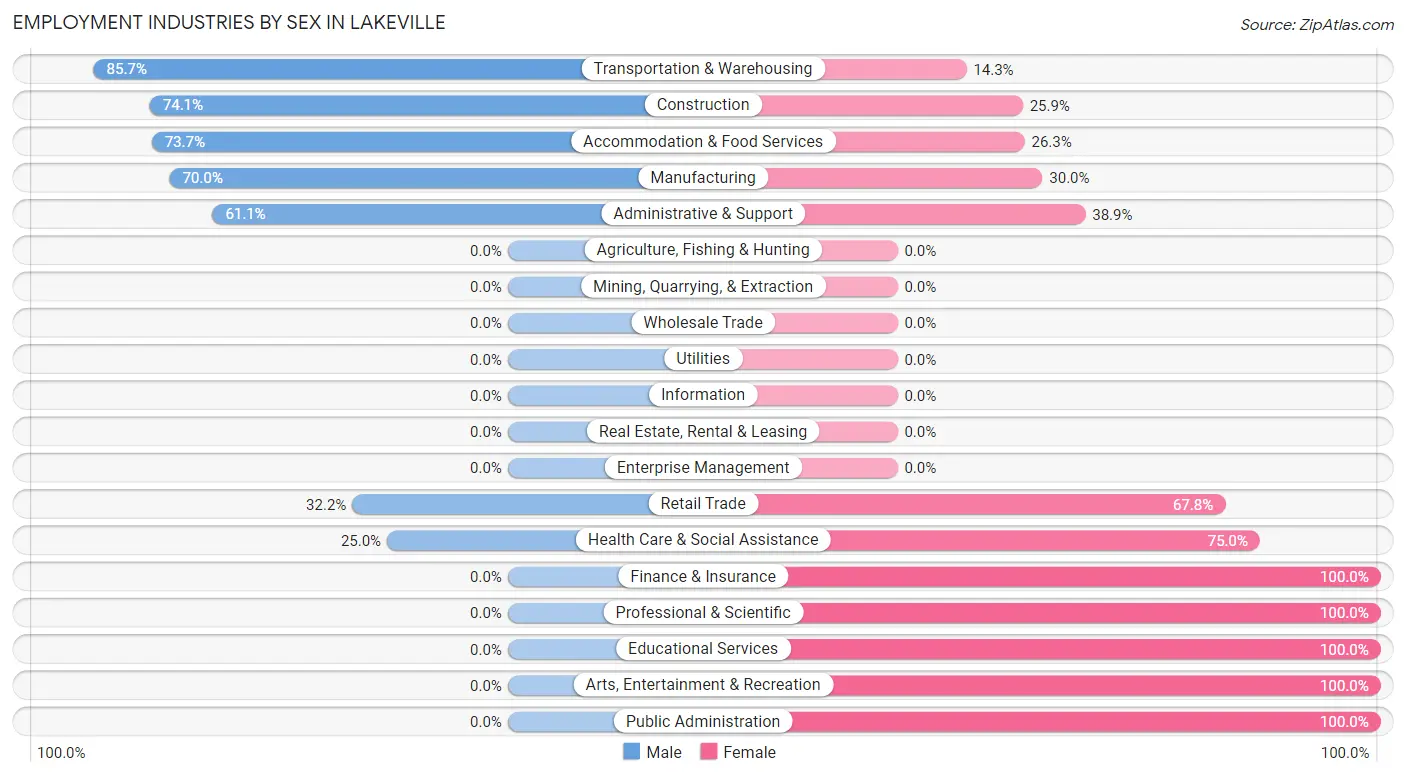
| Industry | Male | Female |
| Agriculture, Fishing & Hunting | 0 (0.0%) | 0 (0.0%) |
| Mining, Quarrying, & Extraction | 0 (0.0%) | 0 (0.0%) |
| Construction | 20 (74.1%) | 7 (25.9%) |
| Manufacturing | 49 (70.0%) | 21 (30.0%) |
| Wholesale Trade | 0 (0.0%) | 0 (0.0%) |
| Retail Trade | 19 (32.2%) | 40 (67.8%) |
| Transportation & Warehousing | 18 (85.7%) | 3 (14.3%) |
| Utilities | 0 (0.0%) | 0 (0.0%) |
| Information | 0 (0.0%) | 0 (0.0%) |
| Finance & Insurance | 0 (0.0%) | 11 (100.0%) |
| Real Estate, Rental & Leasing | 0 (0.0%) | 0 (0.0%) |
| Professional & Scientific | 0 (0.0%) | 6 (100.0%) |
| Enterprise Management | 0 (0.0%) | 0 (0.0%) |
| Administrative & Support | 11 (61.1%) | 7 (38.9%) |
| Educational Services | 0 (0.0%) | 12 (100.0%) |
| Health Care & Social Assistance | 7 (25.0%) | 21 (75.0%) |
| Arts, Entertainment & Recreation | 0 (0.0%) | 15 (100.0%) |
| Accommodation & Food Services | 14 (73.7%) | 5 (26.3%) |
| Public Administration | 0 (0.0%) | 10 (100.0%) |
| Total | 147 (47.1%) | 165 (52.9%) |
Education in Lakeville
School Enrollment in Lakeville
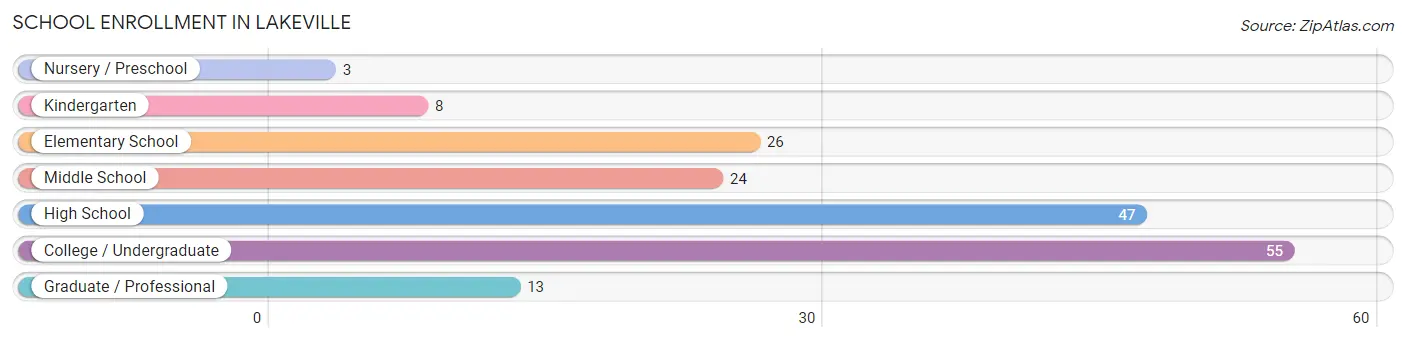
The most common levels of schooling among the 176 students in Lakeville are college / undergraduate (55 | 31.2%), high school (47 | 26.7%), and elementary school (26 | 14.8%).
| School Level | # Students | % Students |
| Nursery / Preschool | 3 | 1.7% |
| Kindergarten | 8 | 4.5% |
| Elementary School | 26 | 14.8% |
| Middle School | 24 | 13.6% |
| High School | 47 | 26.7% |
| College / Undergraduate | 55 | 31.2% |
| Graduate / Professional | 13 | 7.4% |
| Total | 176 | 100.0% |
School Enrollment by Age by Funding Source in Lakeville
Out of a total of 176 students who are enrolled in schools in Lakeville, 29 (16.5%) attend a private institution, while the remaining 147 (83.5%) are enrolled in public schools. The age group of 25 to 34 year olds has the highest likelihood of being enrolled in private schools, with 6 (60.0% in the age bracket) enrolled. Conversely, the age group of 5 to 9 year old has the lowest likelihood of being enrolled in a private school, with 29 (100.0% in the age bracket) attending a public institution.
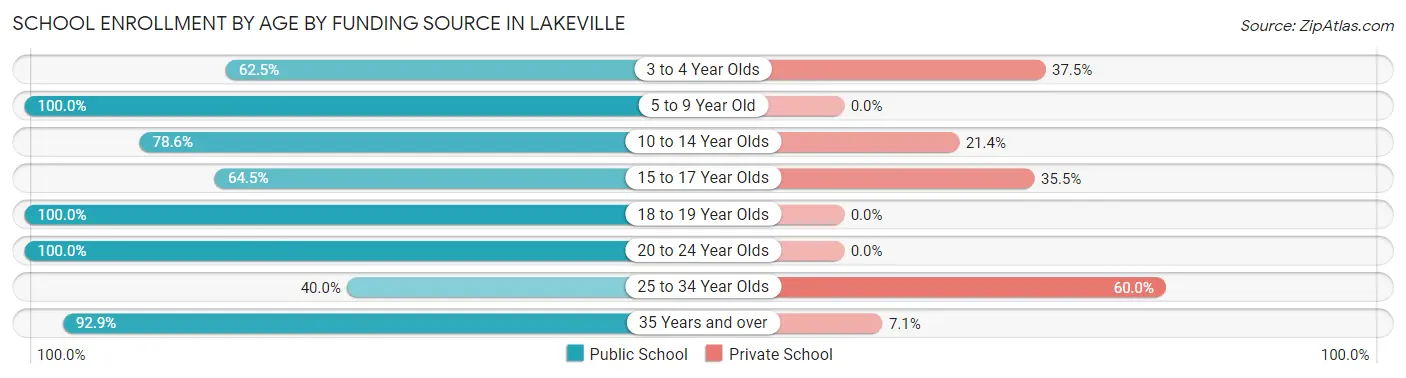
| Age Bracket | Public School | Private School |
| 3 to 4 Year Olds | 5 (62.5%) | 3 (37.5%) |
| 5 to 9 Year Old | 29 (100.0%) | 0 (0.0%) |
| 10 to 14 Year Olds | 22 (78.6%) | 6 (21.4%) |
| 15 to 17 Year Olds | 20 (64.5%) | 11 (35.5%) |
| 18 to 19 Year Olds | 19 (100.0%) | 0 (0.0%) |
| 20 to 24 Year Olds | 9 (100.0%) | 0 (0.0%) |
| 25 to 34 Year Olds | 4 (40.0%) | 6 (60.0%) |
| 35 Years and over | 39 (92.9%) | 3 (7.1%) |
| Total | 147 (83.5%) | 29 (16.5%) |
Educational Attainment by Field of Study in Lakeville
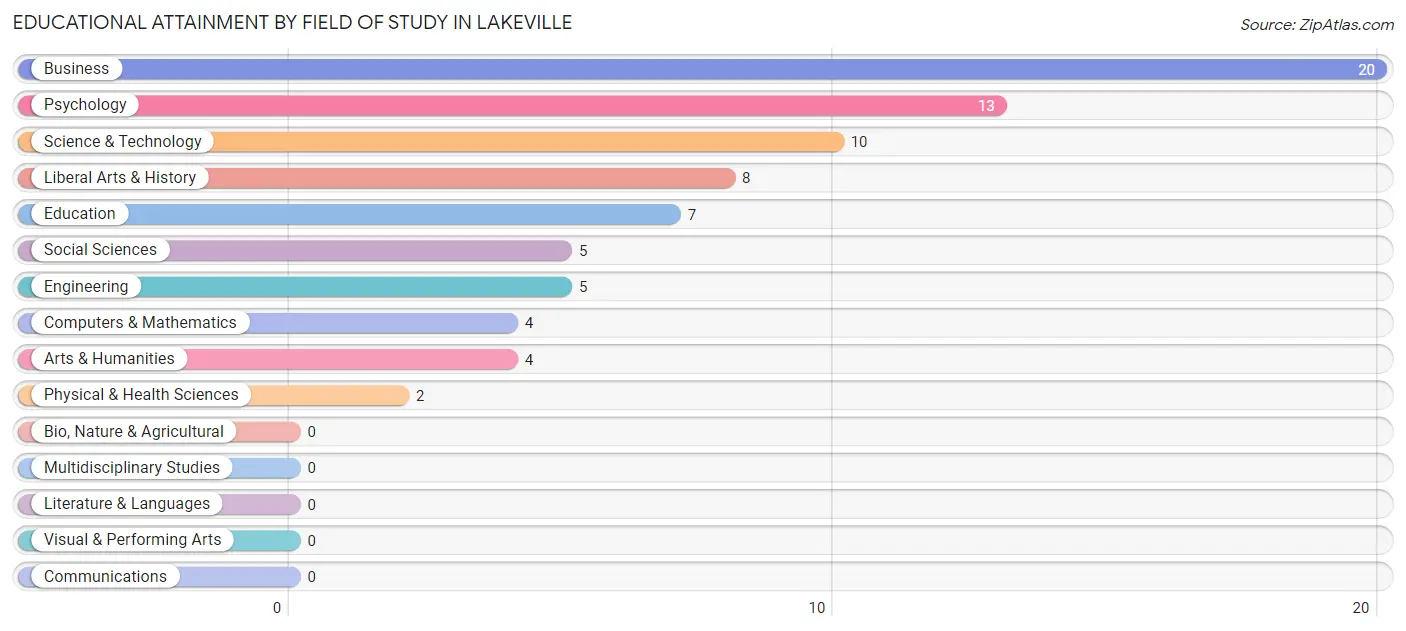
Business (20 | 25.6%), psychology (13 | 16.7%), science & technology (10 | 12.8%), liberal arts & history (8 | 10.3%), and education (7 | 9.0%) are the most common fields of study among 78 individuals in Lakeville who have obtained a bachelor's degree or higher.
| Field of Study | # Graduates | % Graduates |
| Computers & Mathematics | 4 | 5.1% |
| Bio, Nature & Agricultural | 0 | 0.0% |
| Physical & Health Sciences | 2 | 2.6% |
| Psychology | 13 | 16.7% |
| Social Sciences | 5 | 6.4% |
| Engineering | 5 | 6.4% |
| Multidisciplinary Studies | 0 | 0.0% |
| Science & Technology | 10 | 12.8% |
| Business | 20 | 25.6% |
| Education | 7 | 9.0% |
| Literature & Languages | 0 | 0.0% |
| Liberal Arts & History | 8 | 10.3% |
| Visual & Performing Arts | 0 | 0.0% |
| Communications | 0 | 0.0% |
| Arts & Humanities | 4 | 5.1% |
| Total | 78 | 100.0% |
Transportation & Commute in Lakeville
Vehicle Availability by Sex in Lakeville
The most prevalent vehicle ownership categories in Lakeville are males with 2 vehicles (57, accounting for 38.8%) and females with 2 vehicles (57, making up 34.5%).
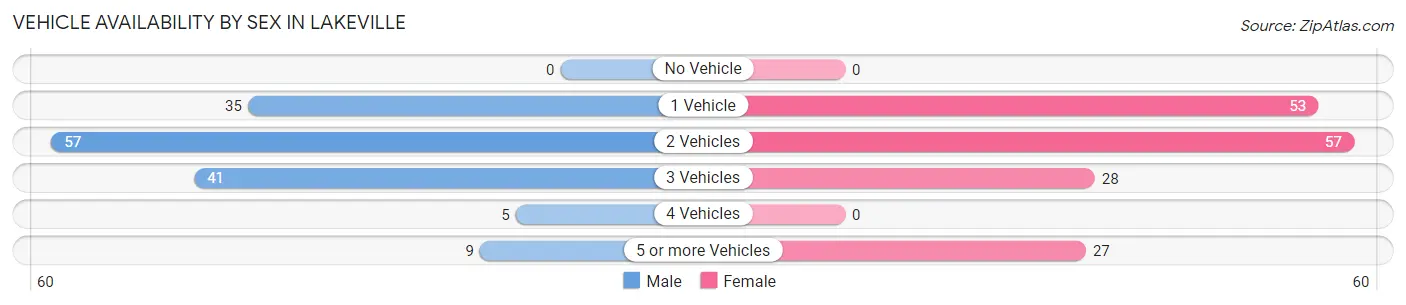
| Vehicles Available | Male | Female |
| No Vehicle | 0 (0.0%) | 0 (0.0%) |
| 1 Vehicle | 35 (23.8%) | 53 (32.1%) |
| 2 Vehicles | 57 (38.8%) | 57 (34.5%) |
| 3 Vehicles | 41 (27.9%) | 28 (17.0%) |
| 4 Vehicles | 5 (3.4%) | 0 (0.0%) |
| 5 or more Vehicles | 9 (6.1%) | 27 (16.4%) |
| Total | 147 (100.0%) | 165 (100.0%) |
Commute Time in Lakeville
The most frequently occuring commute durations in Lakeville are 20 to 24 minutes (62 commuters, 20.4%), 30 to 34 minutes (59 commuters, 19.4%), and 15 to 19 minutes (43 commuters, 14.1%).
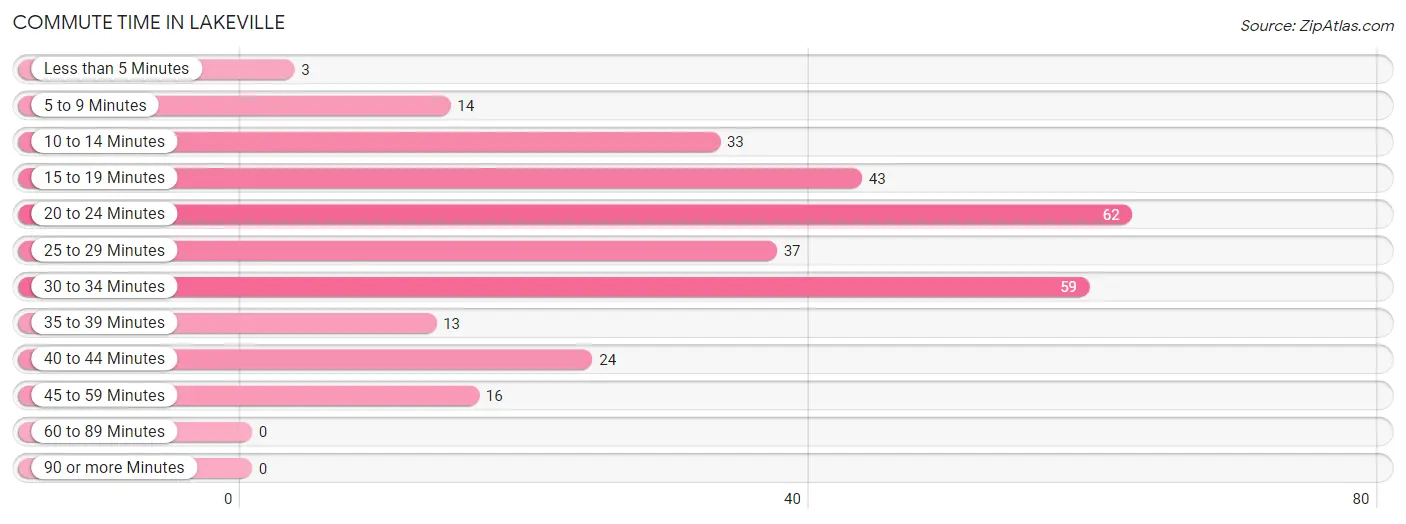
| Commute Time | # Commuters | % Commuters |
| Less than 5 Minutes | 3 | 1.0% |
| 5 to 9 Minutes | 14 | 4.6% |
| 10 to 14 Minutes | 33 | 10.9% |
| 15 to 19 Minutes | 43 | 14.1% |
| 20 to 24 Minutes | 62 | 20.4% |
| 25 to 29 Minutes | 37 | 12.2% |
| 30 to 34 Minutes | 59 | 19.4% |
| 35 to 39 Minutes | 13 | 4.3% |
| 40 to 44 Minutes | 24 | 7.9% |
| 45 to 59 Minutes | 16 | 5.3% |
| 60 to 89 Minutes | 0 | 0.0% |
| 90 or more Minutes | 0 | 0.0% |
Commute Time by Sex in Lakeville
The most common commute times in Lakeville are 30 to 34 minutes (47 commuters, 32.0%) for males and 25 to 29 minutes (30 commuters, 19.1%) for females.
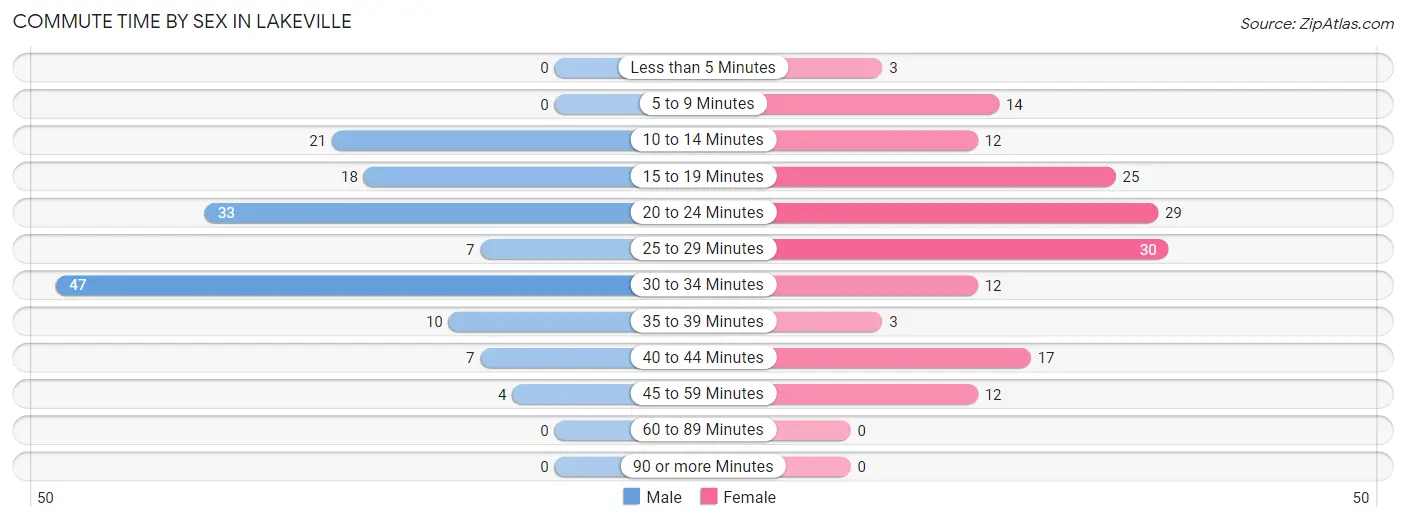
| Commute Time | Male | Female |
| Less than 5 Minutes | 0 (0.0%) | 3 (1.9%) |
| 5 to 9 Minutes | 0 (0.0%) | 14 (8.9%) |
| 10 to 14 Minutes | 21 (14.3%) | 12 (7.6%) |
| 15 to 19 Minutes | 18 (12.2%) | 25 (15.9%) |
| 20 to 24 Minutes | 33 (22.5%) | 29 (18.5%) |
| 25 to 29 Minutes | 7 (4.8%) | 30 (19.1%) |
| 30 to 34 Minutes | 47 (32.0%) | 12 (7.6%) |
| 35 to 39 Minutes | 10 (6.8%) | 3 (1.9%) |
| 40 to 44 Minutes | 7 (4.8%) | 17 (10.8%) |
| 45 to 59 Minutes | 4 (2.7%) | 12 (7.6%) |
| 60 to 89 Minutes | 0 (0.0%) | 0 (0.0%) |
| 90 or more Minutes | 0 (0.0%) | 0 (0.0%) |
Time of Departure to Work by Sex in Lakeville
The most frequent times of departure to work in Lakeville are 12:00 AM to 4:59 AM (32, 21.8%) for males and 7:00 AM to 7:29 AM (37, 23.6%) for females.
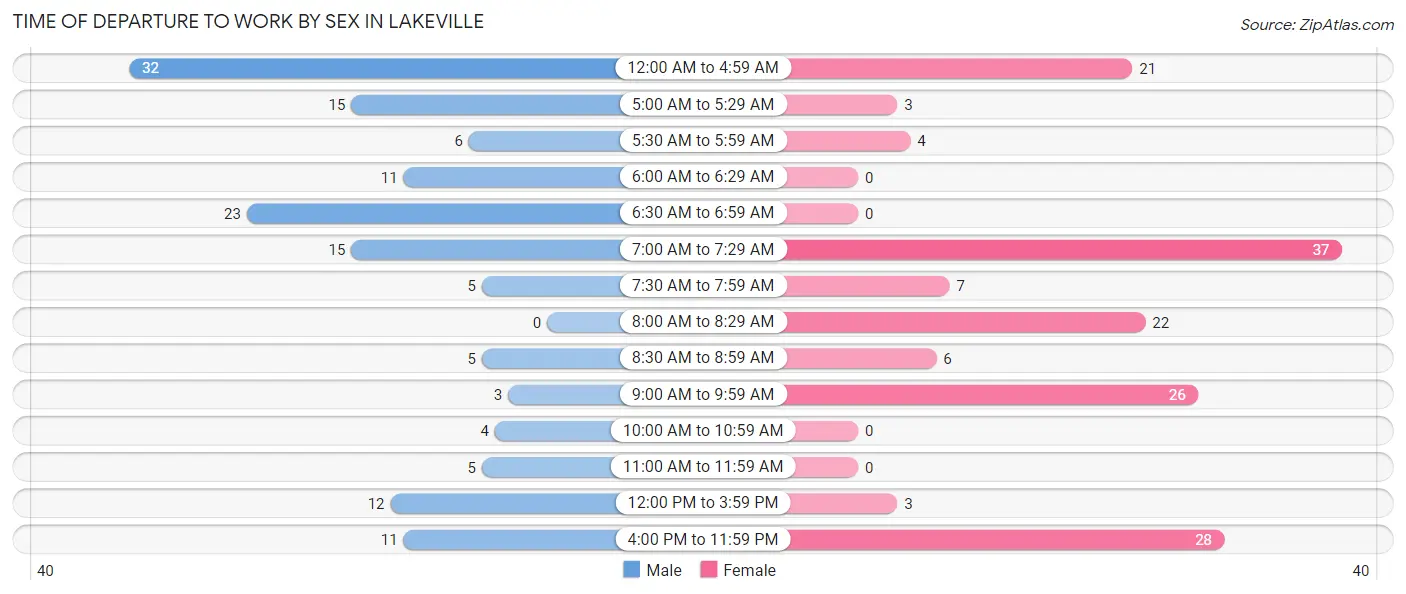
| Time of Departure | Male | Female |
| 12:00 AM to 4:59 AM | 32 (21.8%) | 21 (13.4%) |
| 5:00 AM to 5:29 AM | 15 (10.2%) | 3 (1.9%) |
| 5:30 AM to 5:59 AM | 6 (4.1%) | 4 (2.5%) |
| 6:00 AM to 6:29 AM | 11 (7.5%) | 0 (0.0%) |
| 6:30 AM to 6:59 AM | 23 (15.7%) | 0 (0.0%) |
| 7:00 AM to 7:29 AM | 15 (10.2%) | 37 (23.6%) |
| 7:30 AM to 7:59 AM | 5 (3.4%) | 7 (4.5%) |
| 8:00 AM to 8:29 AM | 0 (0.0%) | 22 (14.0%) |
| 8:30 AM to 8:59 AM | 5 (3.4%) | 6 (3.8%) |
| 9:00 AM to 9:59 AM | 3 (2.0%) | 26 (16.6%) |
| 10:00 AM to 10:59 AM | 4 (2.7%) | 0 (0.0%) |
| 11:00 AM to 11:59 AM | 5 (3.4%) | 0 (0.0%) |
| 12:00 PM to 3:59 PM | 12 (8.2%) | 3 (1.9%) |
| 4:00 PM to 11:59 PM | 11 (7.5%) | 28 (17.8%) |
| Total | 147 (100.0%) | 157 (100.0%) |
Housing Occupancy in Lakeville
Occupancy by Ownership in Lakeville
Of the total 300 dwellings in Lakeville, owner-occupied units account for 129 (43.0%), while renter-occupied units make up 171 (57.0%).
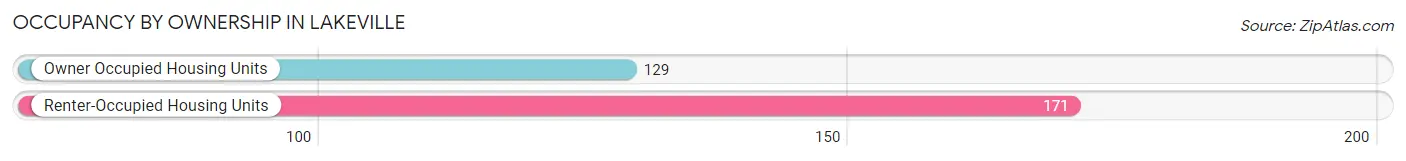
| Occupancy | # Housing Units | % Housing Units |
| Owner Occupied Housing Units | 129 | 43.0% |
| Renter-Occupied Housing Units | 171 | 57.0% |
| Total Occupied Housing Units | 300 | 100.0% |
Occupancy by Household Size in Lakeville
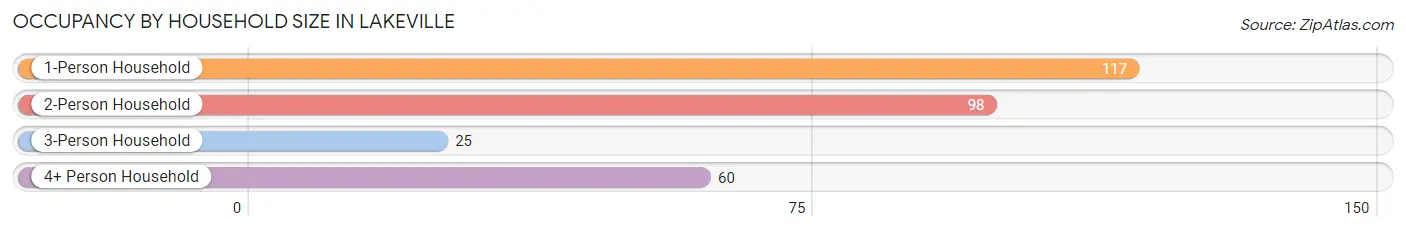
| Household Size | # Housing Units | % Housing Units |
| 1-Person Household | 117 | 39.0% |
| 2-Person Household | 98 | 32.7% |
| 3-Person Household | 25 | 8.3% |
| 4+ Person Household | 60 | 20.0% |
| Total Housing Units | 300 | 100.0% |
Occupancy by Ownership by Household Size in Lakeville
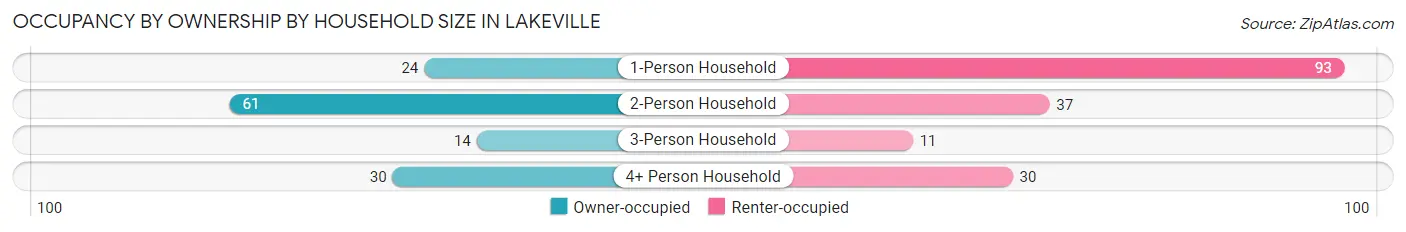
| Household Size | Owner-occupied | Renter-occupied |
| 1-Person Household | 24 (20.5%) | 93 (79.5%) |
| 2-Person Household | 61 (62.2%) | 37 (37.8%) |
| 3-Person Household | 14 (56.0%) | 11 (44.0%) |
| 4+ Person Household | 30 (50.0%) | 30 (50.0%) |
| Total Housing Units | 129 (43.0%) | 171 (57.0%) |
Occupancy by Educational Attainment in Lakeville
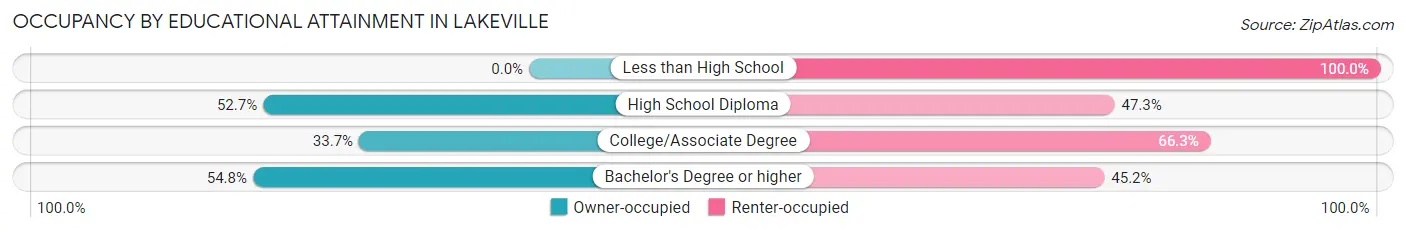
| Household Size | Owner-occupied | Renter-occupied |
| Less than High School | 0 (0.0%) | 26 (100.0%) |
| High School Diploma | 77 (52.7%) | 69 (47.3%) |
| College/Associate Degree | 29 (33.7%) | 57 (66.3%) |
| Bachelor's Degree or higher | 23 (54.8%) | 19 (45.2%) |
Occupancy by Age of Householder in Lakeville
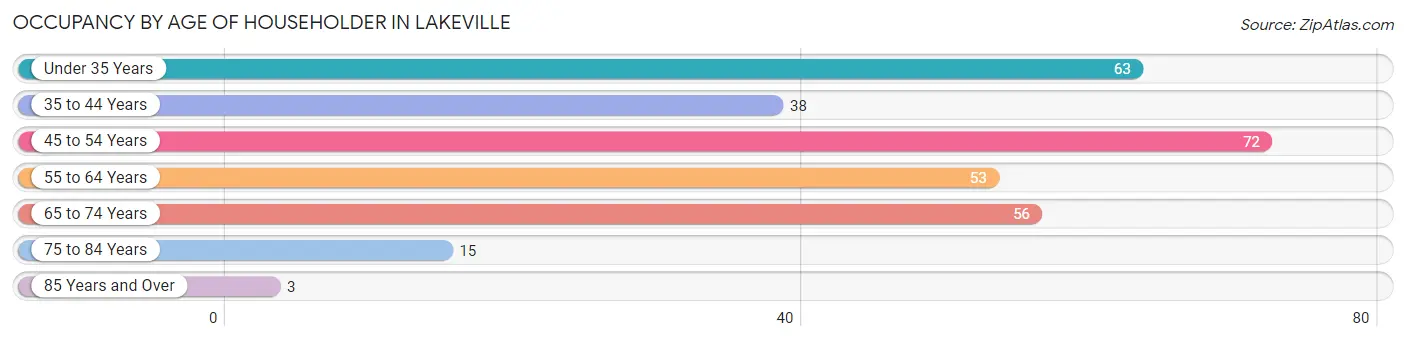
| Age Bracket | # Households | % Households |
| Under 35 Years | 63 | 21.0% |
| 35 to 44 Years | 38 | 12.7% |
| 45 to 54 Years | 72 | 24.0% |
| 55 to 64 Years | 53 | 17.7% |
| 65 to 74 Years | 56 | 18.7% |
| 75 to 84 Years | 15 | 5.0% |
| 85 Years and Over | 3 | 1.0% |
| Total | 300 | 100.0% |
Housing Finances in Lakeville
Median Income by Occupancy in Lakeville
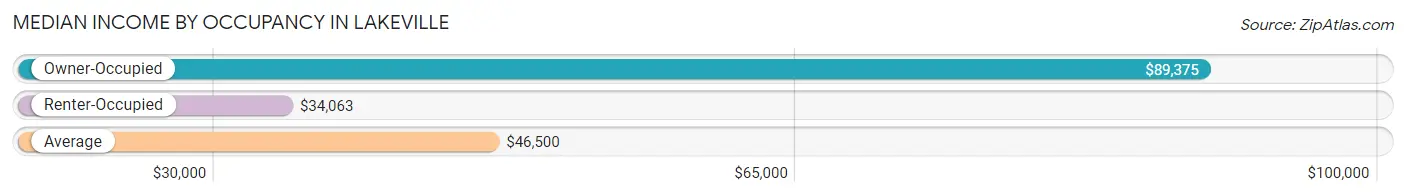
| Occupancy Type | # Households | Median Income |
| Owner-Occupied | 129 (43.0%) | $89,375 |
| Renter-Occupied | 171 (57.0%) | $34,063 |
| Average | 300 (100.0%) | $46,500 |
Occupancy by Householder Income Bracket in Lakeville
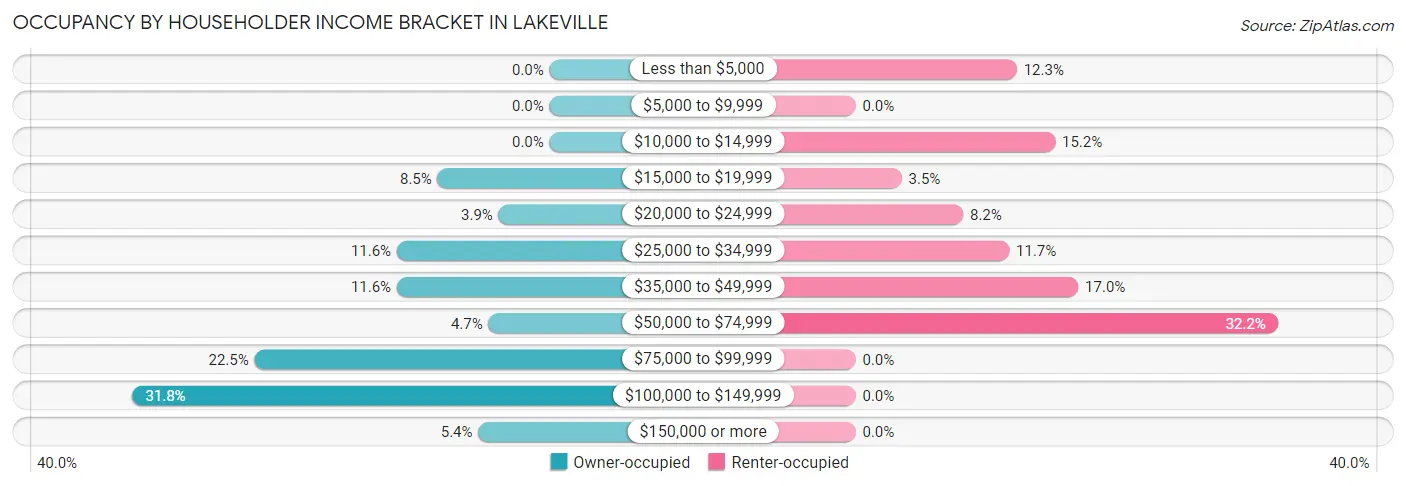
| Income Bracket | Owner-occupied | Renter-occupied |
| Less than $5,000 | 0 (0.0%) | 21 (12.3%) |
| $5,000 to $9,999 | 0 (0.0%) | 0 (0.0%) |
| $10,000 to $14,999 | 0 (0.0%) | 26 (15.2%) |
| $15,000 to $19,999 | 11 (8.5%) | 6 (3.5%) |
| $20,000 to $24,999 | 5 (3.9%) | 14 (8.2%) |
| $25,000 to $34,999 | 15 (11.6%) | 20 (11.7%) |
| $35,000 to $49,999 | 15 (11.6%) | 29 (17.0%) |
| $50,000 to $74,999 | 6 (4.6%) | 55 (32.2%) |
| $75,000 to $99,999 | 29 (22.5%) | 0 (0.0%) |
| $100,000 to $149,999 | 41 (31.8%) | 0 (0.0%) |
| $150,000 or more | 7 (5.4%) | 0 (0.0%) |
| Total | 129 (100.0%) | 171 (100.0%) |
Monthly Housing Cost Tiers in Lakeville
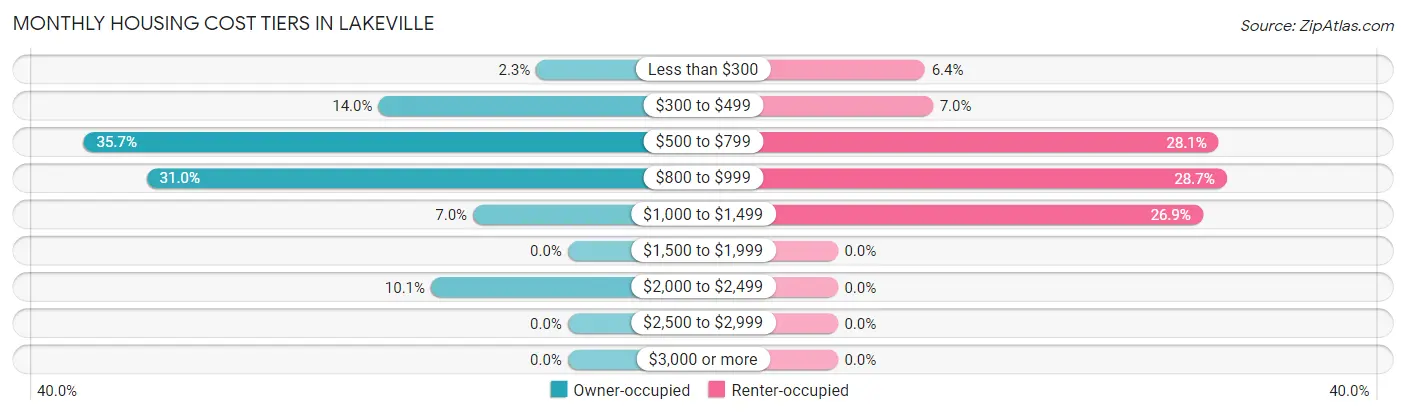
| Monthly Cost | Owner-occupied | Renter-occupied |
| Less than $300 | 3 (2.3%) | 11 (6.4%) |
| $300 to $499 | 18 (14.0%) | 12 (7.0%) |
| $500 to $799 | 46 (35.7%) | 48 (28.1%) |
| $800 to $999 | 40 (31.0%) | 49 (28.6%) |
| $1,000 to $1,499 | 9 (7.0%) | 46 (26.9%) |
| $1,500 to $1,999 | 0 (0.0%) | 0 (0.0%) |
| $2,000 to $2,499 | 13 (10.1%) | 0 (0.0%) |
| $2,500 to $2,999 | 0 (0.0%) | 0 (0.0%) |
| $3,000 or more | 0 (0.0%) | 0 (0.0%) |
| Total | 129 (100.0%) | 171 (100.0%) |
Physical Housing Characteristics in Lakeville
Housing Structures in Lakeville
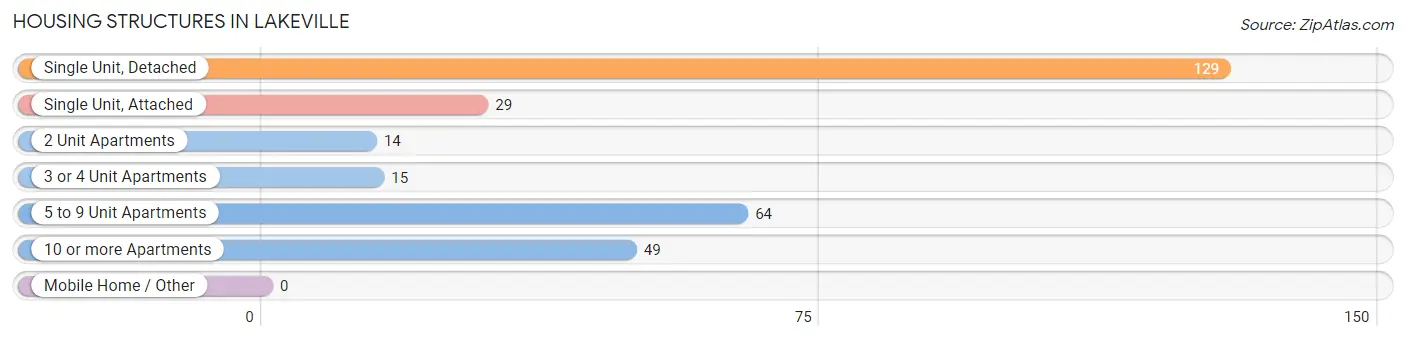
| Structure Type | # Housing Units | % Housing Units |
| Single Unit, Detached | 129 | 43.0% |
| Single Unit, Attached | 29 | 9.7% |
| 2 Unit Apartments | 14 | 4.7% |
| 3 or 4 Unit Apartments | 15 | 5.0% |
| 5 to 9 Unit Apartments | 64 | 21.3% |
| 10 or more Apartments | 49 | 16.3% |
| Mobile Home / Other | 0 | 0.0% |
| Total | 300 | 100.0% |
Housing Structures by Occupancy in Lakeville
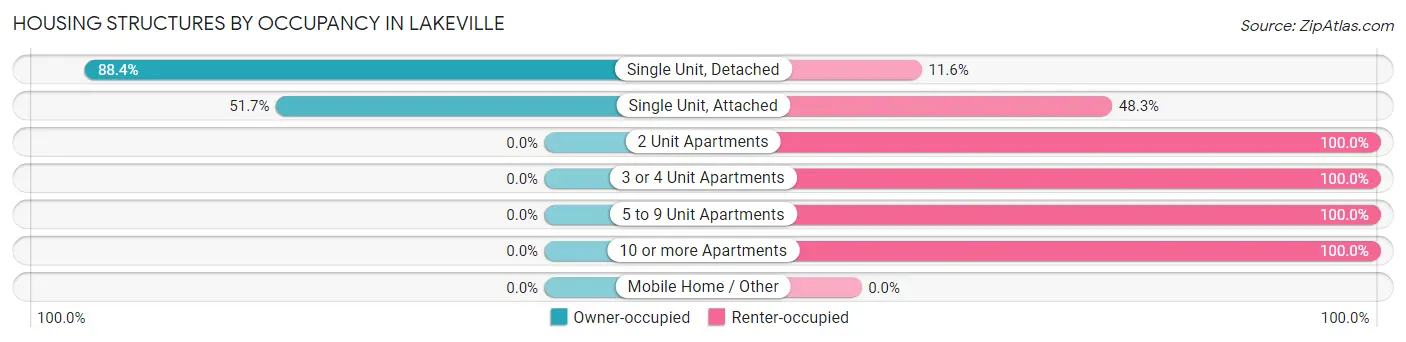
| Structure Type | Owner-occupied | Renter-occupied |
| Single Unit, Detached | 114 (88.4%) | 15 (11.6%) |
| Single Unit, Attached | 15 (51.7%) | 14 (48.3%) |
| 2 Unit Apartments | 0 (0.0%) | 14 (100.0%) |
| 3 or 4 Unit Apartments | 0 (0.0%) | 15 (100.0%) |
| 5 to 9 Unit Apartments | 0 (0.0%) | 64 (100.0%) |
| 10 or more Apartments | 0 (0.0%) | 49 (100.0%) |
| Mobile Home / Other | 0 (0.0%) | 0 (0.0%) |
| Total | 129 (43.0%) | 171 (57.0%) |
Housing Structures by Number of Rooms in Lakeville
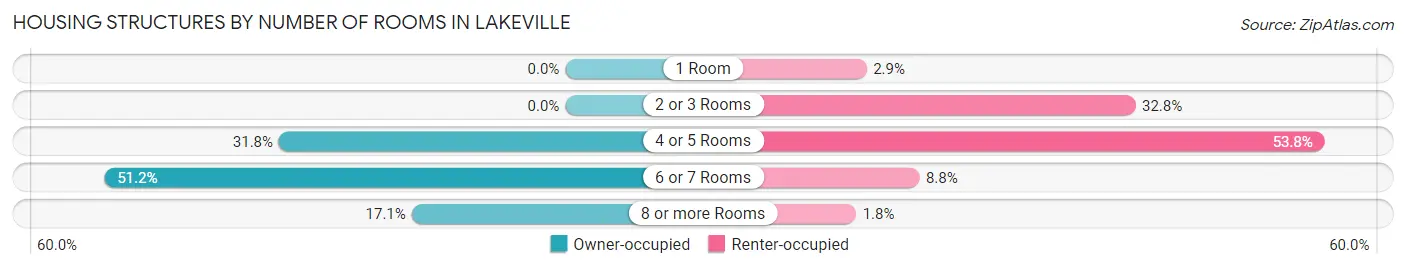
| Number of Rooms | Owner-occupied | Renter-occupied |
| 1 Room | 0 (0.0%) | 5 (2.9%) |
| 2 or 3 Rooms | 0 (0.0%) | 56 (32.8%) |
| 4 or 5 Rooms | 41 (31.8%) | 92 (53.8%) |
| 6 or 7 Rooms | 66 (51.2%) | 15 (8.8%) |
| 8 or more Rooms | 22 (17.1%) | 3 (1.8%) |
| Total | 129 (100.0%) | 171 (100.0%) |
Housing Structure by Heating Type in Lakeville
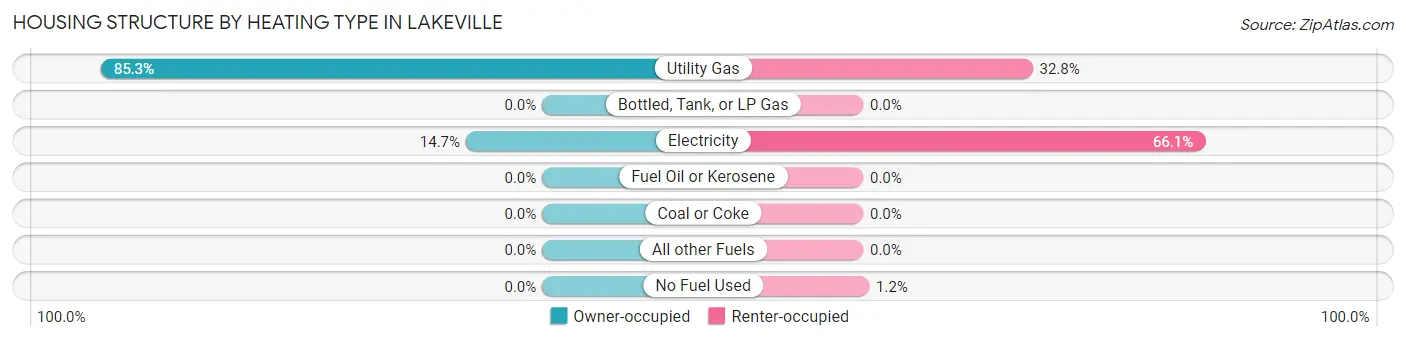
| Heating Type | Owner-occupied | Renter-occupied |
| Utility Gas | 110 (85.3%) | 56 (32.8%) |
| Bottled, Tank, or LP Gas | 0 (0.0%) | 0 (0.0%) |
| Electricity | 19 (14.7%) | 113 (66.1%) |
| Fuel Oil or Kerosene | 0 (0.0%) | 0 (0.0%) |
| Coal or Coke | 0 (0.0%) | 0 (0.0%) |
| All other Fuels | 0 (0.0%) | 0 (0.0%) |
| No Fuel Used | 0 (0.0%) | 2 (1.2%) |
| Total | 129 (100.0%) | 171 (100.0%) |
Household Vehicle Usage in Lakeville
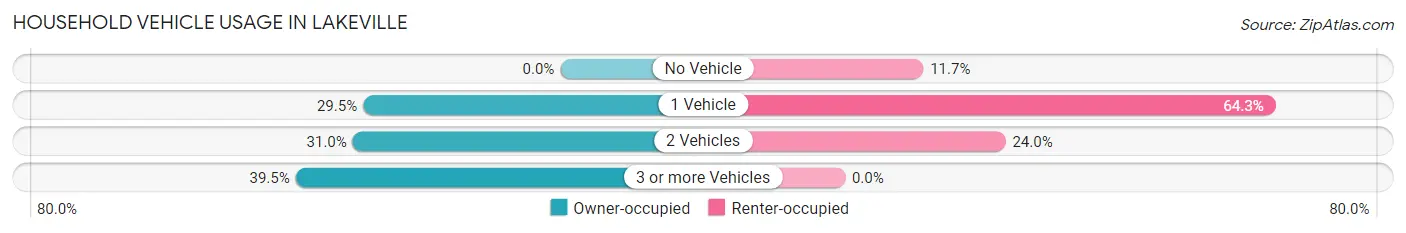
| Vehicles per Household | Owner-occupied | Renter-occupied |
| No Vehicle | 0 (0.0%) | 20 (11.7%) |
| 1 Vehicle | 38 (29.5%) | 110 (64.3%) |
| 2 Vehicles | 40 (31.0%) | 41 (24.0%) |
| 3 or more Vehicles | 51 (39.5%) | 0 (0.0%) |
| Total | 129 (100.0%) | 171 (100.0%) |
Real Estate & Mortgages in Lakeville
Real Estate and Mortgage Overview in Lakeville
| Characteristic | Without Mortgage | With Mortgage |
| Housing Units | 36 | 93 |
| Median Property Value | $125,000 | $107,100 |
| Median Household Income | $83,750 | $7 |
| Monthly Housing Costs | $500 | $0 |
| Real Estate Taxes | $1,700 | $0 |
Property Value by Mortgage Status in Lakeville
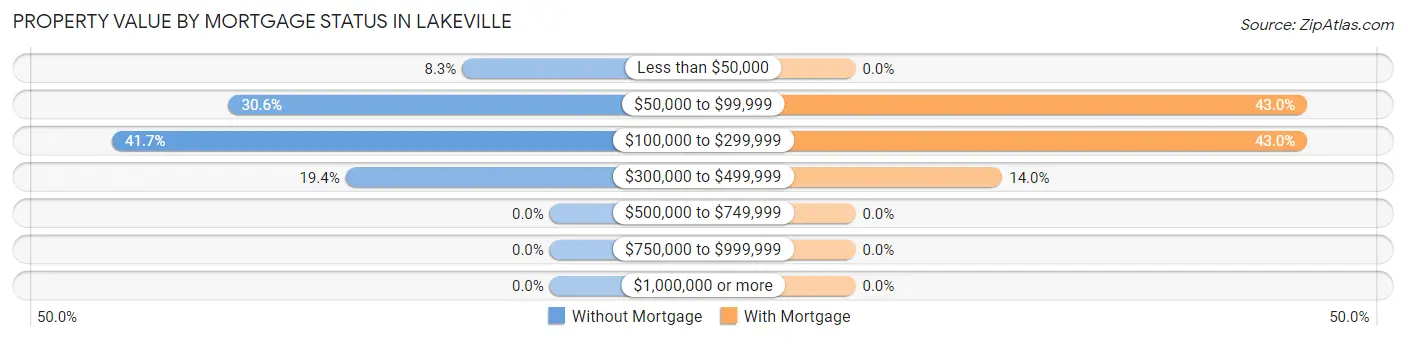
| Property Value | Without Mortgage | With Mortgage |
| Less than $50,000 | 3 (8.3%) | 0 (0.0%) |
| $50,000 to $99,999 | 11 (30.6%) | 40 (43.0%) |
| $100,000 to $299,999 | 15 (41.7%) | 40 (43.0%) |
| $300,000 to $499,999 | 7 (19.4%) | 13 (14.0%) |
| $500,000 to $749,999 | 0 (0.0%) | 0 (0.0%) |
| $750,000 to $999,999 | 0 (0.0%) | 0 (0.0%) |
| $1,000,000 or more | 0 (0.0%) | 0 (0.0%) |
| Total | 36 (100.0%) | 93 (100.0%) |
Household Income by Mortgage Status in Lakeville
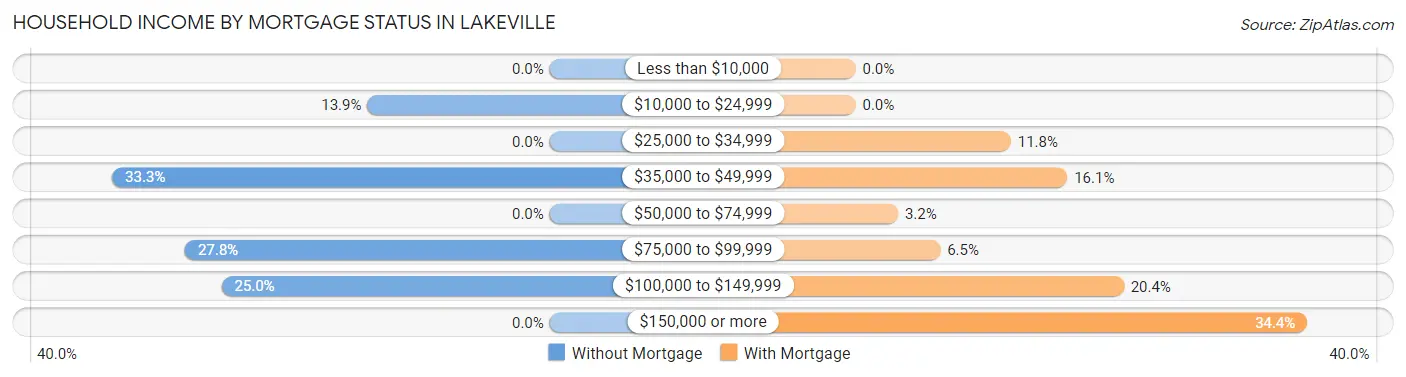
| Household Income | Without Mortgage | With Mortgage |
| Less than $10,000 | 0 (0.0%) | 0 (0.0%) |
| $10,000 to $24,999 | 5 (13.9%) | 0 (0.0%) |
| $25,000 to $34,999 | 0 (0.0%) | 11 (11.8%) |
| $35,000 to $49,999 | 12 (33.3%) | 15 (16.1%) |
| $50,000 to $74,999 | 0 (0.0%) | 3 (3.2%) |
| $75,000 to $99,999 | 10 (27.8%) | 6 (6.5%) |
| $100,000 to $149,999 | 9 (25.0%) | 19 (20.4%) |
| $150,000 or more | 0 (0.0%) | 32 (34.4%) |
| Total | 36 (100.0%) | 93 (100.0%) |
Property Value to Household Income Ratio in Lakeville
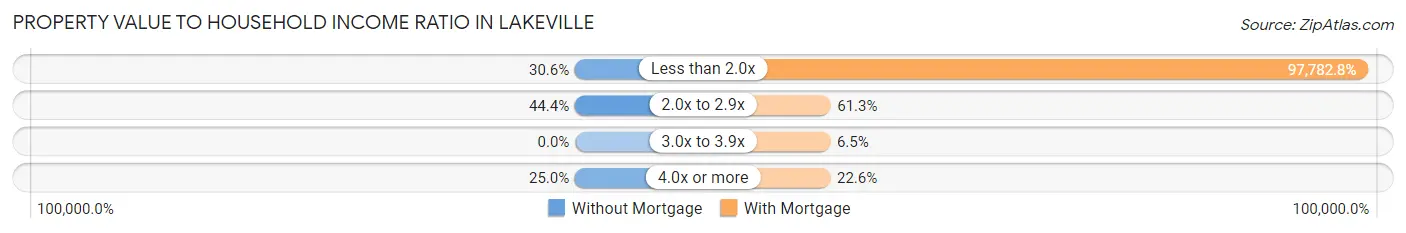
| Value-to-Income Ratio | Without Mortgage | With Mortgage |
| Less than 2.0x | 11 (30.6%) | 90,938 (97,782.8%) |
| 2.0x to 2.9x | 16 (44.4%) | 57 (61.3%) |
| 3.0x to 3.9x | 0 (0.0%) | 6 (6.5%) |
| 4.0x or more | 9 (25.0%) | 21 (22.6%) |
| Total | 36 (100.0%) | 93 (100.0%) |
Real Estate Taxes by Mortgage Status in Lakeville
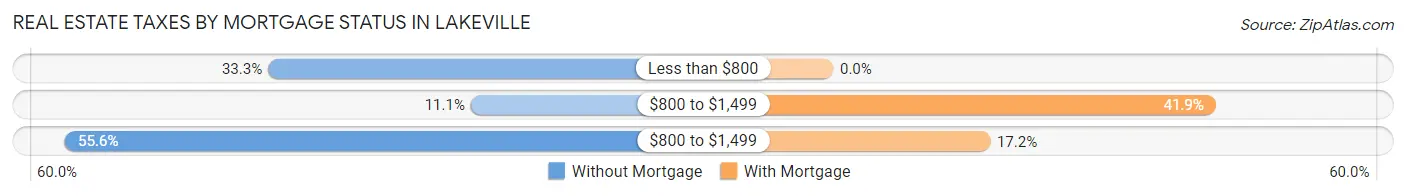
| Property Taxes | Without Mortgage | With Mortgage |
| Less than $800 | 12 (33.3%) | 0 (0.0%) |
| $800 to $1,499 | 4 (11.1%) | 39 (41.9%) |
| $800 to $1,499 | 20 (55.6%) | 16 (17.2%) |
| Total | 36 (100.0%) | 93 (100.0%) |
Health & Disability in Lakeville
Health Insurance Coverage by Age in Lakeville
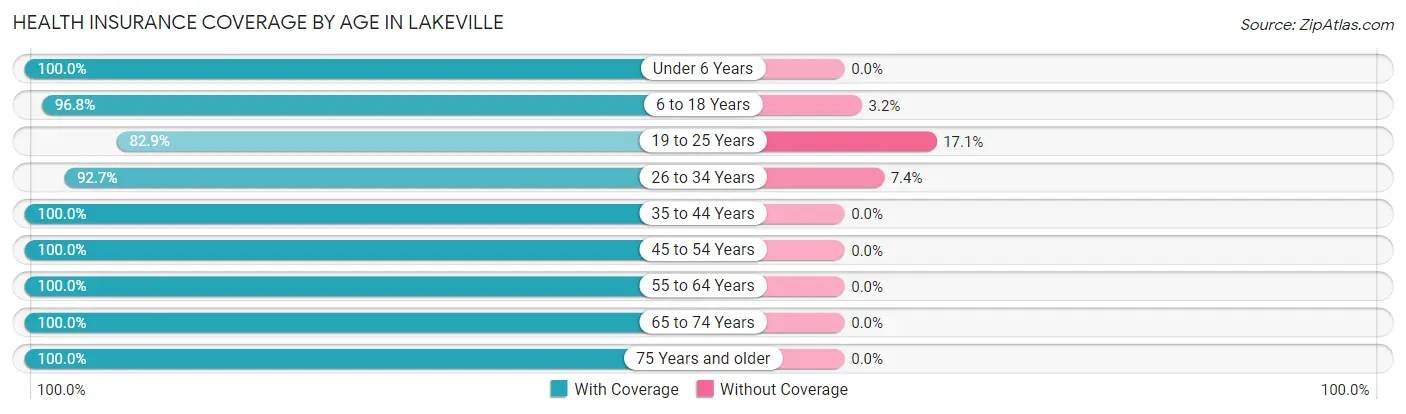
| Age Bracket | With Coverage | Without Coverage |
| Under 6 Years | 57 (100.0%) | 0 (0.0%) |
| 6 to 18 Years | 120 (96.8%) | 4 (3.2%) |
| 19 to 25 Years | 58 (82.9%) | 12 (17.1%) |
| 26 to 34 Years | 63 (92.6%) | 5 (7.3%) |
| 35 to 44 Years | 64 (100.0%) | 0 (0.0%) |
| 45 to 54 Years | 130 (100.0%) | 0 (0.0%) |
| 55 to 64 Years | 71 (100.0%) | 0 (0.0%) |
| 65 to 74 Years | 83 (100.0%) | 0 (0.0%) |
| 75 Years and older | 23 (100.0%) | 0 (0.0%) |
| Total | 669 (97.0%) | 21 (3.0%) |
Health Insurance Coverage by Citizenship Status in Lakeville

| Citizenship Status | With Coverage | Without Coverage |
| Native Born | 57 (100.0%) | 0 (0.0%) |
| Foreign Born, Citizen | 120 (96.8%) | 4 (3.2%) |
| Foreign Born, not a Citizen | 58 (82.9%) | 12 (17.1%) |
Health Insurance Coverage by Household Income in Lakeville
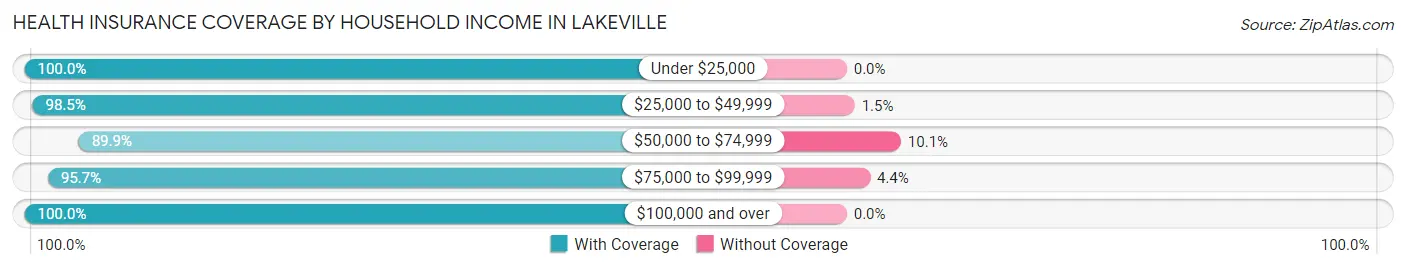
| Household Income | With Coverage | Without Coverage |
| Under $25,000 | 148 (100.0%) | 0 (0.0%) |
| $25,000 to $49,999 | 132 (98.5%) | 2 (1.5%) |
| $50,000 to $74,999 | 133 (89.9%) | 15 (10.1%) |
| $75,000 to $99,999 | 88 (95.7%) | 4 (4.3%) |
| $100,000 and over | 168 (100.0%) | 0 (0.0%) |
Public vs Private Health Insurance Coverage by Age in Lakeville
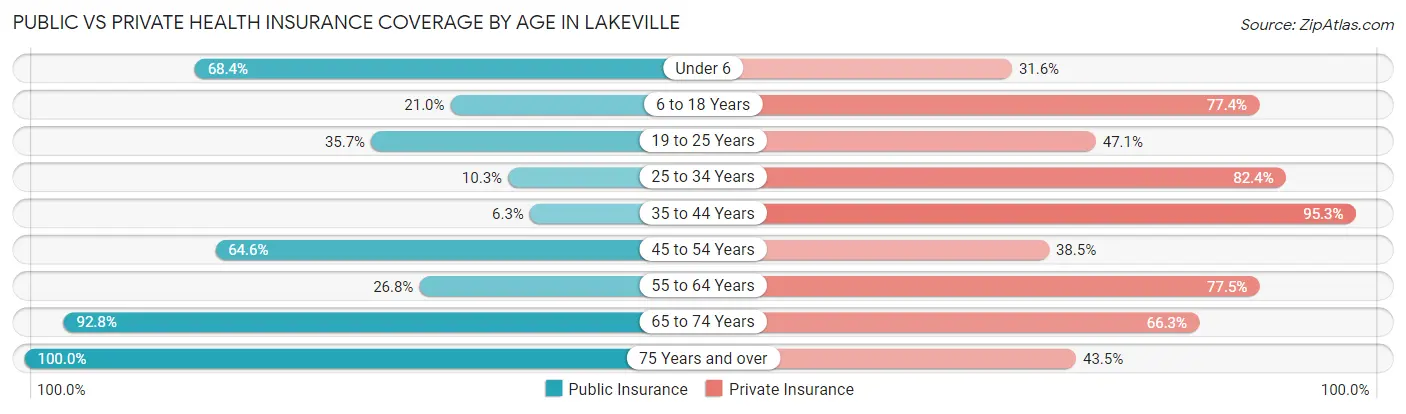
| Age Bracket | Public Insurance | Private Insurance |
| Under 6 | 39 (68.4%) | 18 (31.6%) |
| 6 to 18 Years | 26 (21.0%) | 96 (77.4%) |
| 19 to 25 Years | 25 (35.7%) | 33 (47.1%) |
| 25 to 34 Years | 7 (10.3%) | 56 (82.4%) |
| 35 to 44 Years | 4 (6.2%) | 61 (95.3%) |
| 45 to 54 Years | 84 (64.6%) | 50 (38.5%) |
| 55 to 64 Years | 19 (26.8%) | 55 (77.5%) |
| 65 to 74 Years | 77 (92.8%) | 55 (66.3%) |
| 75 Years and over | 23 (100.0%) | 10 (43.5%) |
| Total | 304 (44.1%) | 434 (62.9%) |
Disability Status by Sex by Age in Lakeville
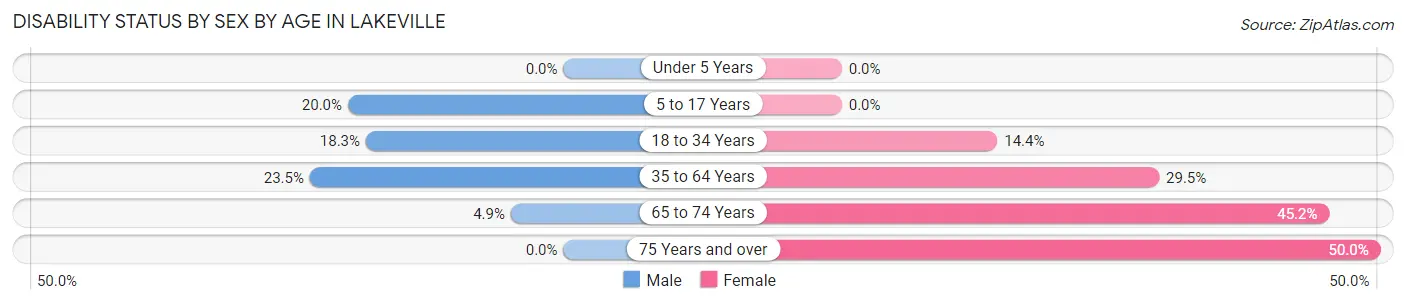
| Age Bracket | Male | Female |
| Under 5 Years | 0 (0.0%) | 0 (0.0%) |
| 5 to 17 Years | 10 (20.0%) | 0 (0.0%) |
| 18 to 34 Years | 11 (18.3%) | 14 (14.4%) |
| 35 to 64 Years | 28 (23.5%) | 43 (29.4%) |
| 65 to 74 Years | 2 (4.9%) | 19 (45.2%) |
| 75 Years and over | 0 (0.0%) | 5 (50.0%) |
Disability Class by Sex by Age in Lakeville
Disability Class: Hearing Difficulty
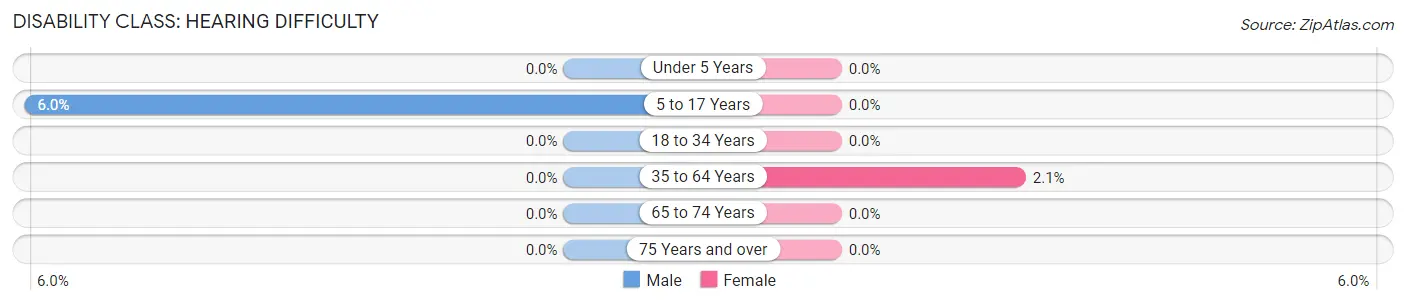
| Age Bracket | Male | Female |
| Under 5 Years | 0 (0.0%) | 0 (0.0%) |
| 5 to 17 Years | 3 (6.0%) | 0 (0.0%) |
| 18 to 34 Years | 0 (0.0%) | 0 (0.0%) |
| 35 to 64 Years | 0 (0.0%) | 3 (2.1%) |
| 65 to 74 Years | 0 (0.0%) | 0 (0.0%) |
| 75 Years and over | 0 (0.0%) | 0 (0.0%) |
Disability Class: Vision Difficulty
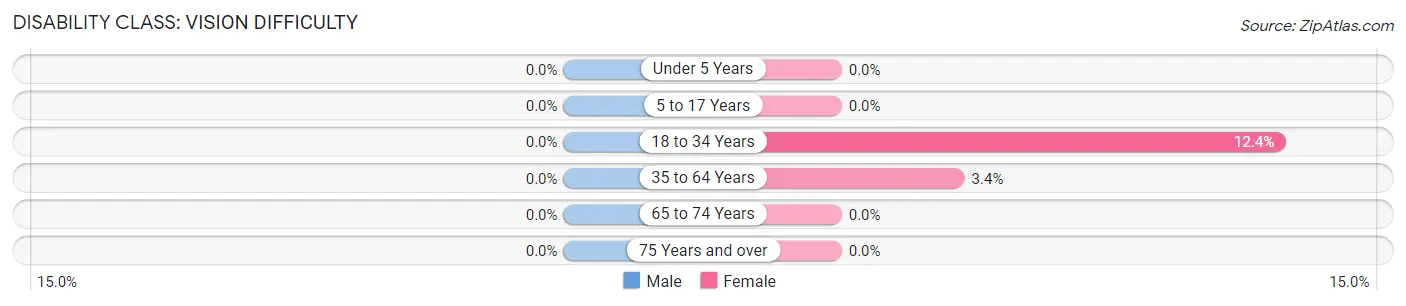
| Age Bracket | Male | Female |
| Under 5 Years | 0 (0.0%) | 0 (0.0%) |
| 5 to 17 Years | 0 (0.0%) | 0 (0.0%) |
| 18 to 34 Years | 0 (0.0%) | 12 (12.4%) |
| 35 to 64 Years | 0 (0.0%) | 5 (3.4%) |
| 65 to 74 Years | 0 (0.0%) | 0 (0.0%) |
| 75 Years and over | 0 (0.0%) | 0 (0.0%) |
Disability Class: Cognitive Difficulty
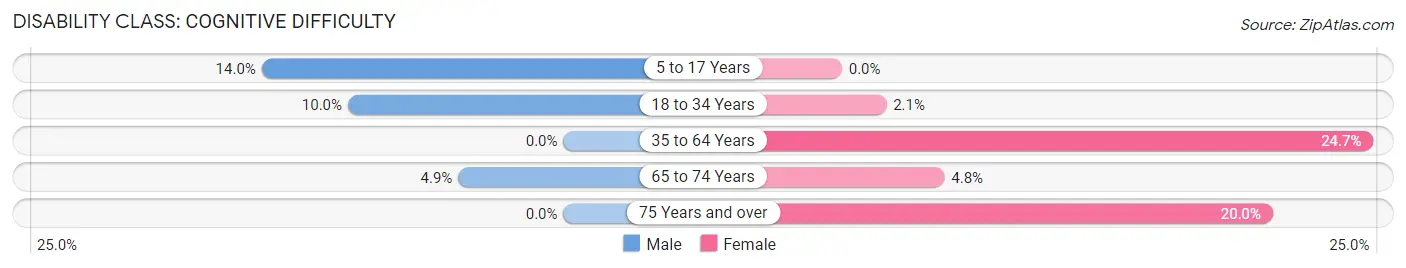
| Age Bracket | Male | Female |
| 5 to 17 Years | 7 (14.0%) | 0 (0.0%) |
| 18 to 34 Years | 6 (10.0%) | 2 (2.1%) |
| 35 to 64 Years | 0 (0.0%) | 36 (24.7%) |
| 65 to 74 Years | 2 (4.9%) | 2 (4.8%) |
| 75 Years and over | 0 (0.0%) | 2 (20.0%) |
Disability Class: Ambulatory Difficulty
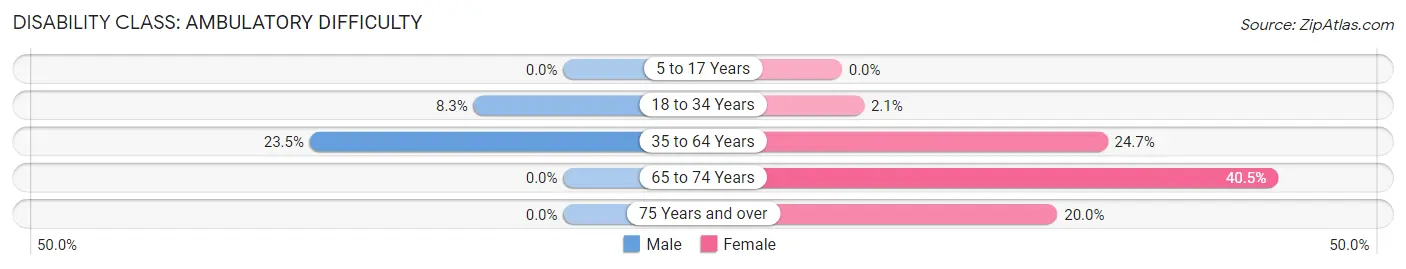
| Age Bracket | Male | Female |
| 5 to 17 Years | 0 (0.0%) | 0 (0.0%) |
| 18 to 34 Years | 5 (8.3%) | 2 (2.1%) |
| 35 to 64 Years | 28 (23.5%) | 36 (24.7%) |
| 65 to 74 Years | 0 (0.0%) | 17 (40.5%) |
| 75 Years and over | 0 (0.0%) | 2 (20.0%) |
Disability Class: Self-Care Difficulty
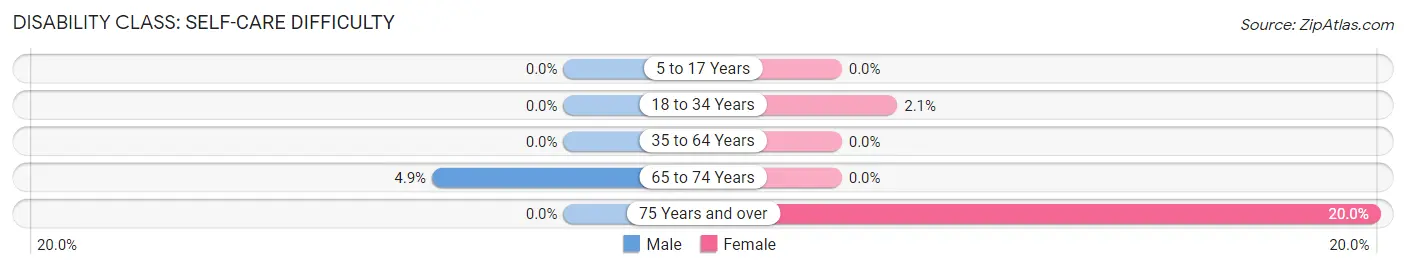
| Age Bracket | Male | Female |
| 5 to 17 Years | 0 (0.0%) | 0 (0.0%) |
| 18 to 34 Years | 0 (0.0%) | 2 (2.1%) |
| 35 to 64 Years | 0 (0.0%) | 0 (0.0%) |
| 65 to 74 Years | 2 (4.9%) | 0 (0.0%) |
| 75 Years and over | 0 (0.0%) | 2 (20.0%) |
Technology Access in Lakeville
Computing Device Access in Lakeville
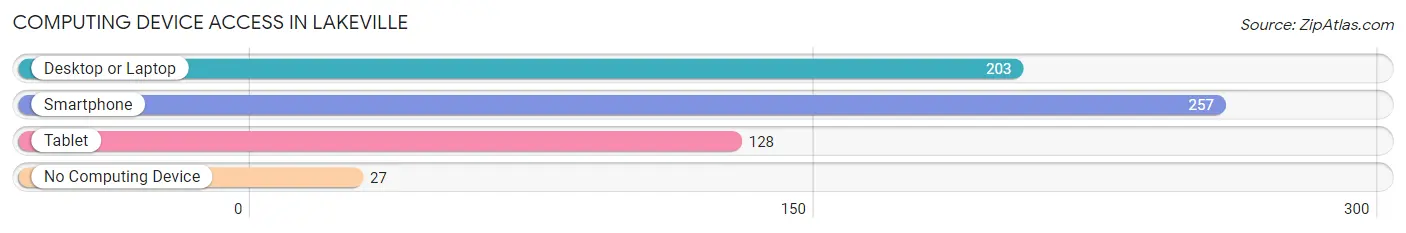
| Device Type | # Households | % Households |
| Desktop or Laptop | 203 | 67.7% |
| Smartphone | 257 | 85.7% |
| Tablet | 128 | 42.7% |
| No Computing Device | 27 | 9.0% |
| Total | 300 | 100.0% |
Internet Access in Lakeville
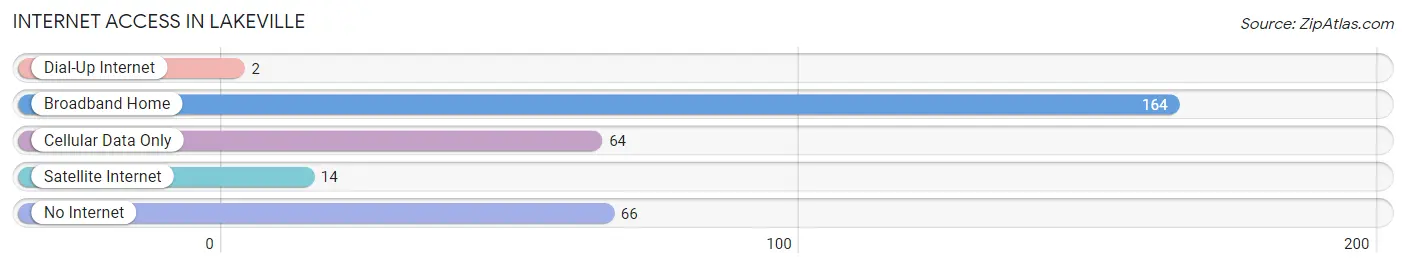
| Internet Type | # Households | % Households |
| Dial-Up Internet | 2 | 0.7% |
| Broadband Home | 164 | 54.7% |
| Cellular Data Only | 64 | 21.3% |
| Satellite Internet | 14 | 4.7% |
| No Internet | 66 | 22.0% |
| Total | 300 | 100.0% |
Lakeville Summary
Introduction
Located in the northern part of Indiana, Lakeville is a small town with a population of just over 1,000 people. It is situated in St. Joseph County, and is part of the South Bend-Mishawaka metropolitan area. The town is known for its rural charm and its close proximity to the larger cities of South Bend and Mishawaka. Lakeville is a great place to live, work, and play, and has a rich history, diverse geography, and a strong economy.
History
The area that is now Lakeville was first settled in the early 1800s by a group of German immigrants. The town was originally known as “German Town” and was later renamed “Lakeville” in 1837. The town was officially incorporated in 1867.
Lakeville was a farming community for many years, and the town’s economy was largely based on agriculture. In the late 1800s, the town began to grow and develop, and several businesses were established. The town also became a popular tourist destination, as it was located near several lakes and rivers.
In the early 1900s, Lakeville experienced a period of growth and development. Several new businesses were established, and the town’s population began to grow. The town also became a popular destination for outdoor recreation, as it was located near several lakes and rivers.
Geography
Lakeville is located in the northern part of Indiana, in St. Joseph County. The town is situated in the St. Joseph River Valley, and is part of the South Bend-Mishawaka metropolitan area. The town is surrounded by rolling hills and farmland, and is located near several lakes and rivers.
The town is located approximately 10 miles south of South Bend and 15 miles north of Mishawaka. The town is also located near several other small towns, including New Carlisle, North Liberty, and Walkerton.
Economy
The economy of Lakeville is largely based on agriculture and tourism. The town is home to several farms, and the surrounding area is known for its production of corn, soybeans, and wheat. The town is also home to several small businesses, including restaurants, retail stores, and service providers.
The town is also a popular destination for outdoor recreation, as it is located near several lakes and rivers. The town is home to several parks, including Lakeville Park, which offers swimming, fishing, and boating. The town is also home to several golf courses, and is a popular destination for golfers.
Demographics
As of the 2010 census, the population of Lakeville was 1,072. The town has a population density of 1,072 people per square mile. The median age of the population is 43.7 years, and the median household income is $50,972.
The town is predominantly white, with 92.3% of the population identifying as white. The town also has a small Hispanic population, with 4.3% of the population identifying as Hispanic or Latino. The town also has a small African American population, with 1.2% of the population identifying as African American.
Conclusion
Lakeville is a small town located in the northern part of Indiana. The town has a rich history, diverse geography, and a strong economy. The town is predominantly white, with a small Hispanic and African American population. The town is known for its rural charm and its close proximity to the larger cities of South Bend and Mishawaka. Lakeville is a great place to live, work, and play, and is a popular destination for outdoor recreation.
Common Questions
What is Per Capita Income in Lakeville?
Per Capita income in Lakeville is $24,353.
What is the Median Family Income in Lakeville?
Median Family Income in Lakeville is $54,063.
What is the Median Household income in Lakeville?
Median Household Income in Lakeville is $46,500.
What is Income or Wage Gap in Lakeville?
Income or Wage Gap in Lakeville is 29.8%.
Women in Lakeville earn 70.2 cents for every dollar earned by a man.
What is Inequality or Gini Index in Lakeville?
Inequality or Gini Index in Lakeville is 0.40.
What is the Total Population of Lakeville?
Total Population of Lakeville is 690.
What is the Total Male Population of Lakeville?
Total Male Population of Lakeville is 308.
What is the Total Female Population of Lakeville?
Total Female Population of Lakeville is 382.
What is the Ratio of Males per 100 Females in Lakeville?
There are 80.63 Males per 100 Females in Lakeville.
What is the Ratio of Females per 100 Males in Lakeville?
There are 124.03 Females per 100 Males in Lakeville.
What is the Median Population Age in Lakeville?
Median Population Age in Lakeville is 39.2 Years.
What is the Average Family Size in Lakeville
Average Family Size in Lakeville is 2.9 People.
What is the Average Household Size in Lakeville
Average Household Size in Lakeville is 2.3 People.
How Large is the Labor Force in Lakeville?
There are 322 People in the Labor Forcein in Lakeville.
What is the Percentage of People in the Labor Force in Lakeville?
58.1% of People are in the Labor Force in Lakeville.
What is the Unemployment Rate in Lakeville?
Unemployment Rate in Lakeville is 3.1%.