Knightstown, IN Map & Demographics
Knightstown Map
Knightstown Overview
$28,443
PER CAPITA INCOME
$78,287
AVG FAMILY INCOME
$53,375
AVG HOUSEHOLD INCOME
21.6%
WAGE / INCOME GAP [ % ]
78.4¢/ $1
WAGE / INCOME GAP [ $ ]
0.44
INEQUALITY / GINI INDEX
2,175
TOTAL POPULATION
1,156
MALE POPULATION
1,019
FEMALE POPULATION
113.44
MALES / 100 FEMALES
88.15
FEMALES / 100 MALES
35.8
MEDIAN AGE
3.0
AVG FAMILY SIZE
2.5
AVG HOUSEHOLD SIZE
1,074
LABOR FORCE [ PEOPLE ]
63.3%
PERCENT IN LABOR FORCE
7.1%
UNEMPLOYMENT RATE
Knightstown Zip Codes
Income in Knightstown
Income Overview in Knightstown
Per Capita Income in Knightstown is $28,443, while median incomes of families and households are $78,287 and $53,375 respectively.
| Characteristic | Number | Measure |
| Per Capita Income | 2,175 | $28,443 |
| Median Family Income | 559 | $78,287 |
| Mean Family Income | 559 | $73,075 |
| Median Household Income | 867 | $53,375 |
| Mean Household Income | 867 | $69,158 |
| Income Deficit | 559 | $0 |
| Wage / Income Gap (%) | 2,175 | 21.59% |
| Wage / Income Gap ($) | 2,175 | 78.41¢ per $1 |
| Gini / Inequality Index | 2,175 | 0.44 |
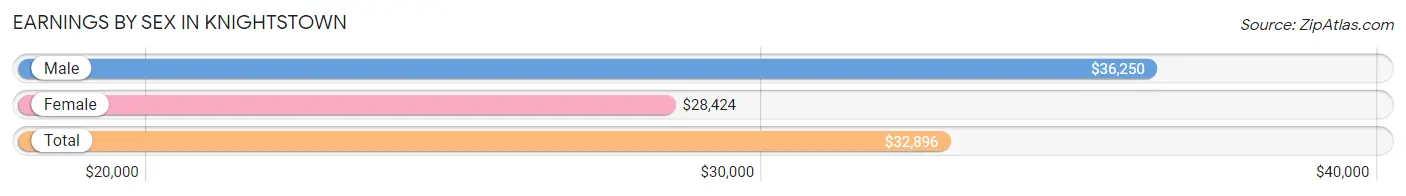
Earnings by Sex in Knightstown
Average Earnings in Knightstown are $32,896, $36,250 for men and $28,424 for women, a difference of 21.6%.
| Sex | Number | Average Earnings |
| Male | 577 (53.3%) | $36,250 |
| Female | 506 (46.7%) | $28,424 |
| Total | 1,083 (100.0%) | $32,896 |
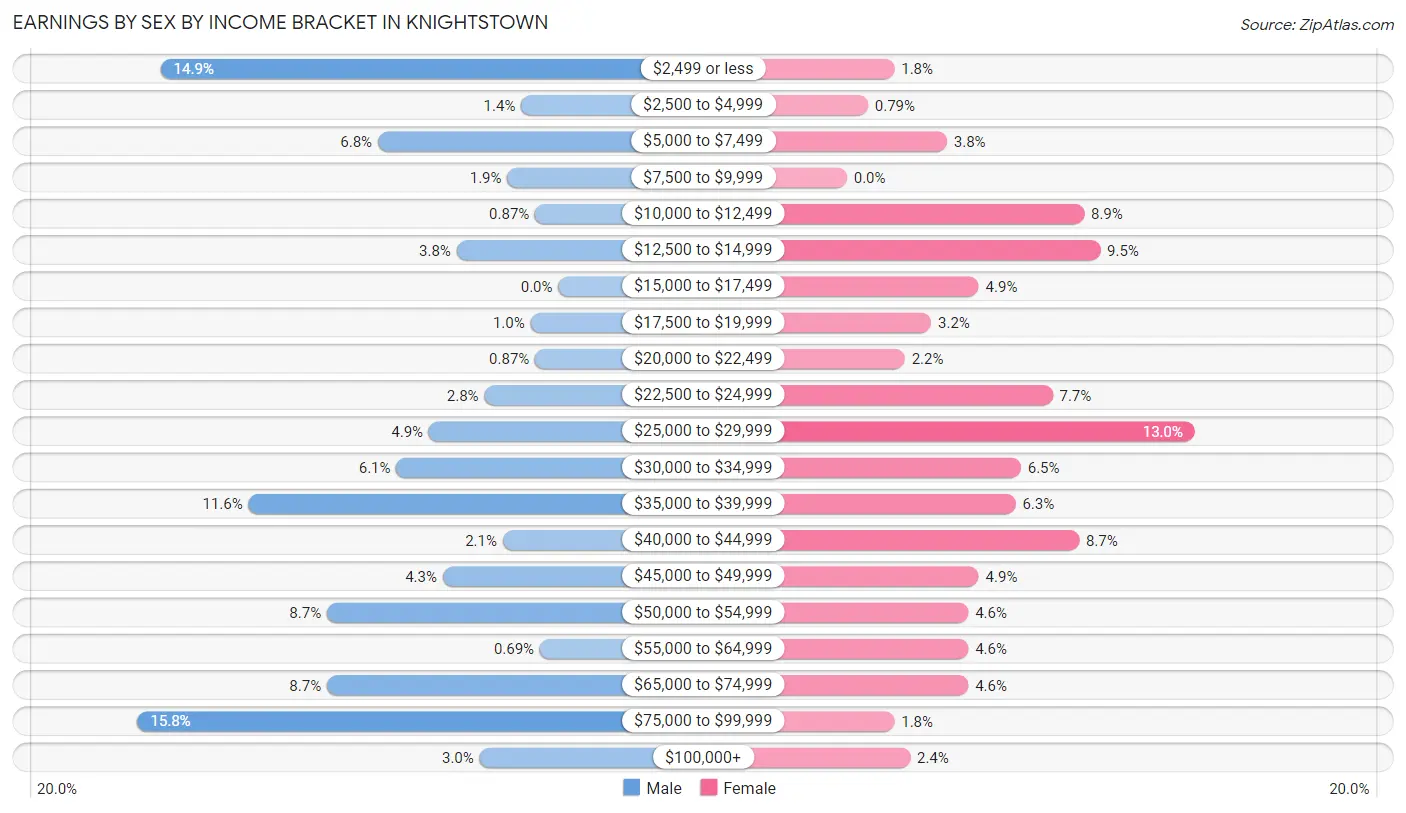
Earnings by Sex by Income Bracket in Knightstown
The most common earnings brackets in Knightstown are $75,000 to $99,999 for men (91 | 15.8%) and $25,000 to $29,999 for women (66 | 13.0%).
| Income | Male | Female |
| $2,499 or less | 86 (14.9%) | 9 (1.8%) |
| $2,500 to $4,999 | 8 (1.4%) | 4 (0.8%) |
| $5,000 to $7,499 | 39 (6.8%) | 19 (3.7%) |
| $7,500 to $9,999 | 11 (1.9%) | 0 (0.0%) |
| $10,000 to $12,499 | 5 (0.9%) | 45 (8.9%) |
| $12,500 to $14,999 | 22 (3.8%) | 48 (9.5%) |
| $15,000 to $17,499 | 0 (0.0%) | 25 (4.9%) |
| $17,500 to $19,999 | 6 (1.0%) | 16 (3.2%) |
| $20,000 to $22,499 | 5 (0.9%) | 11 (2.2%) |
| $22,500 to $24,999 | 16 (2.8%) | 39 (7.7%) |
| $25,000 to $29,999 | 28 (4.9%) | 66 (13.0%) |
| $30,000 to $34,999 | 35 (6.1%) | 33 (6.5%) |
| $35,000 to $39,999 | 67 (11.6%) | 32 (6.3%) |
| $40,000 to $44,999 | 12 (2.1%) | 44 (8.7%) |
| $45,000 to $49,999 | 25 (4.3%) | 25 (4.9%) |
| $50,000 to $54,999 | 50 (8.7%) | 23 (4.5%) |
| $55,000 to $64,999 | 4 (0.7%) | 23 (4.5%) |
| $65,000 to $74,999 | 50 (8.7%) | 23 (4.5%) |
| $75,000 to $99,999 | 91 (15.8%) | 9 (1.8%) |
| $100,000+ | 17 (2.9%) | 12 (2.4%) |
| Total | 577 (100.0%) | 506 (100.0%) |
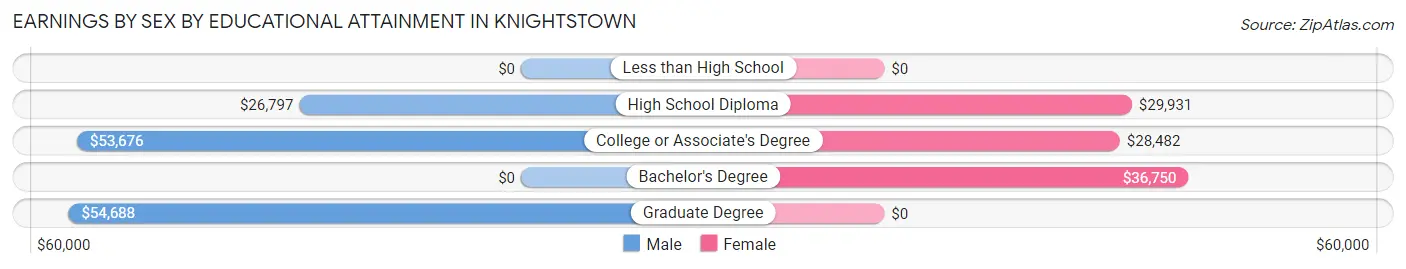
Earnings by Sex by Educational Attainment in Knightstown
Average earnings in Knightstown are $45,192 for men and $29,158 for women, a difference of 35.5%. Men with an educational attainment of graduate degree enjoy the highest average annual earnings of $54,688, while those with high school diploma education earn the least with $26,797. Women with an educational attainment of bachelor's degree earn the most with the average annual earnings of $36,750, while those with college or associate's degree education have the smallest earnings of $28,482.
| Educational Attainment | Male Income | Female Income |
| Less than High School | - | - |
| High School Diploma | $26,797 | $29,931 |
| College or Associate's Degree | $53,676 | $28,482 |
| Bachelor's Degree | - | - |
| Graduate Degree | $54,688 | $0 |
| Total | $45,192 | $29,158 |
Family Income in Knightstown
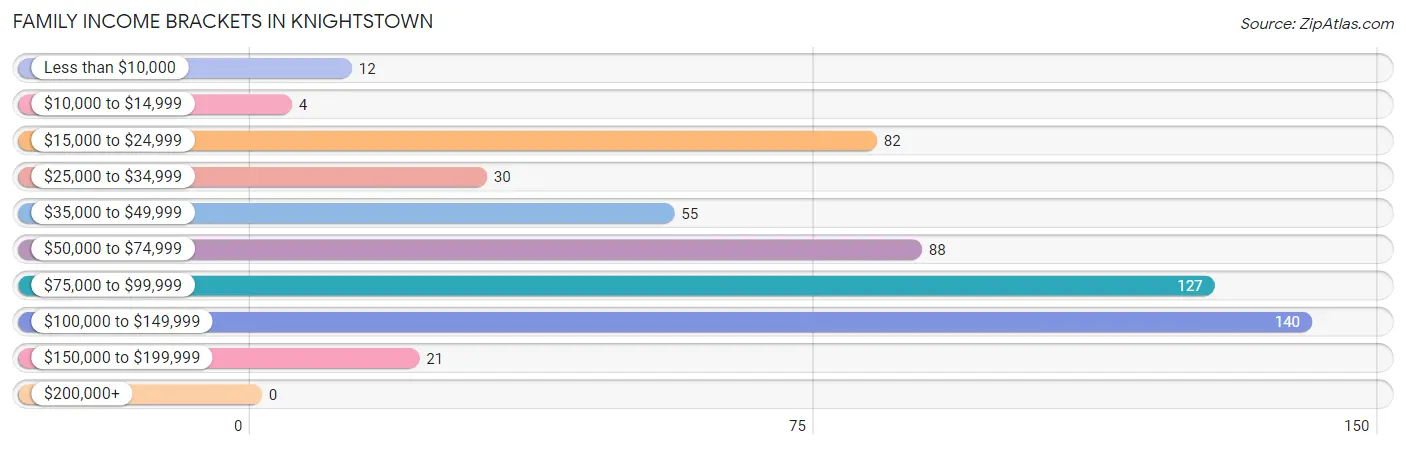
Family Income Brackets in Knightstown
According to the Knightstown family income data, there are 140 families falling into the $100,000 to $149,999 income range, which is the most common income bracket and makes up 25.0% of all families.
| Income Bracket | # Families | % Families |
| Less than $10,000 | 12 | 2.1% |
| $10,000 to $14,999 | 4 | 0.7% |
| $15,000 to $24,999 | 82 | 14.7% |
| $25,000 to $34,999 | 30 | 5.4% |
| $35,000 to $49,999 | 55 | 9.8% |
| $50,000 to $74,999 | 88 | 15.7% |
| $75,000 to $99,999 | 127 | 22.7% |
| $100,000 to $149,999 | 140 | 25.0% |
| $150,000 to $199,999 | 21 | 3.8% |
| $200,000+ | 0 | 0.0% |
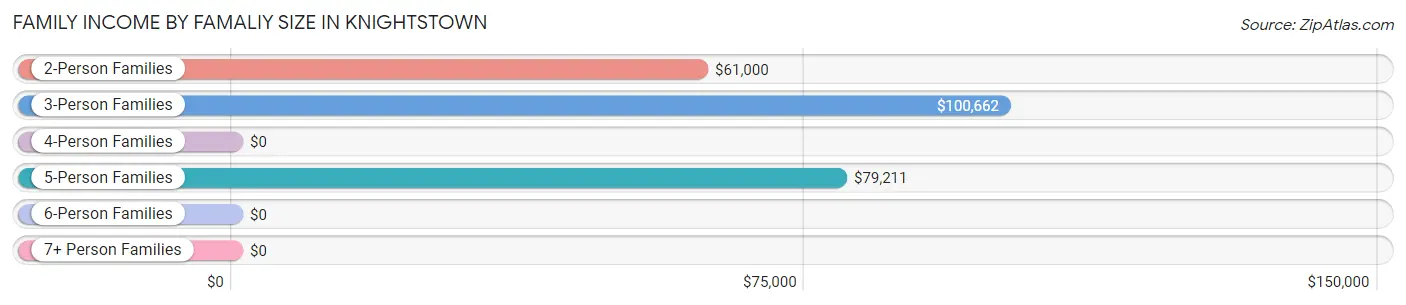
Family Income by Famaliy Size in Knightstown
3-person families (124 | 22.2%) account for the highest median family income in Knightstown with $100,662 per family, while 3-person families (124 | 22.2%) have the highest median income of $33,554 per family member.
| Income Bracket | # Families | Median Income |
| 2-Person Families | 282 (50.4%) | $61,000 |
| 3-Person Families | 124 (22.2%) | $100,662 |
| 4-Person Families | 79 (14.1%) | $0 |
| 5-Person Families | 46 (8.2%) | $79,211 |
| 6-Person Families | 28 (5.0%) | $0 |
| 7+ Person Families | 0 (0.0%) | $0 |
| Total | 559 (100.0%) | $78,287 |
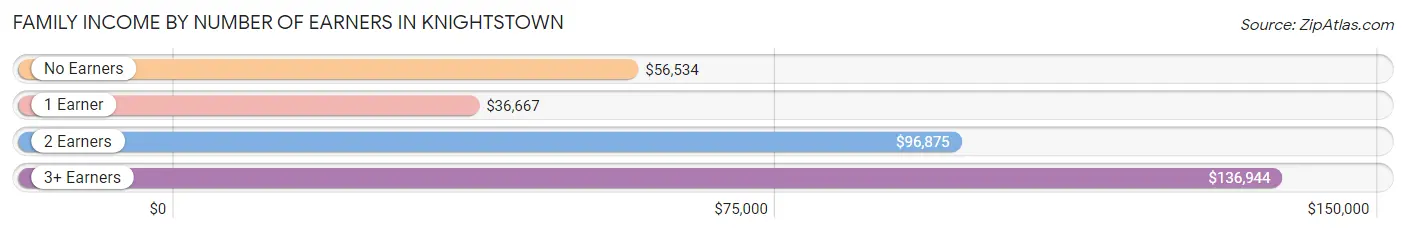
Family Income by Number of Earners in Knightstown
The median family income in Knightstown is $78,287, with families comprising 3+ earners (40) having the highest median family income of $136,944, while families with 1 earner (246) have the lowest median family income of $36,667, accounting for 7.2% and 44.0% of families, respectively.
| Number of Earners | # Families | Median Income |
| No Earners | 87 (15.6%) | $56,534 |
| 1 Earner | 246 (44.0%) | $36,667 |
| 2 Earners | 186 (33.3%) | $96,875 |
| 3+ Earners | 40 (7.2%) | $136,944 |
| Total | 559 (100.0%) | $78,287 |
Household Income in Knightstown
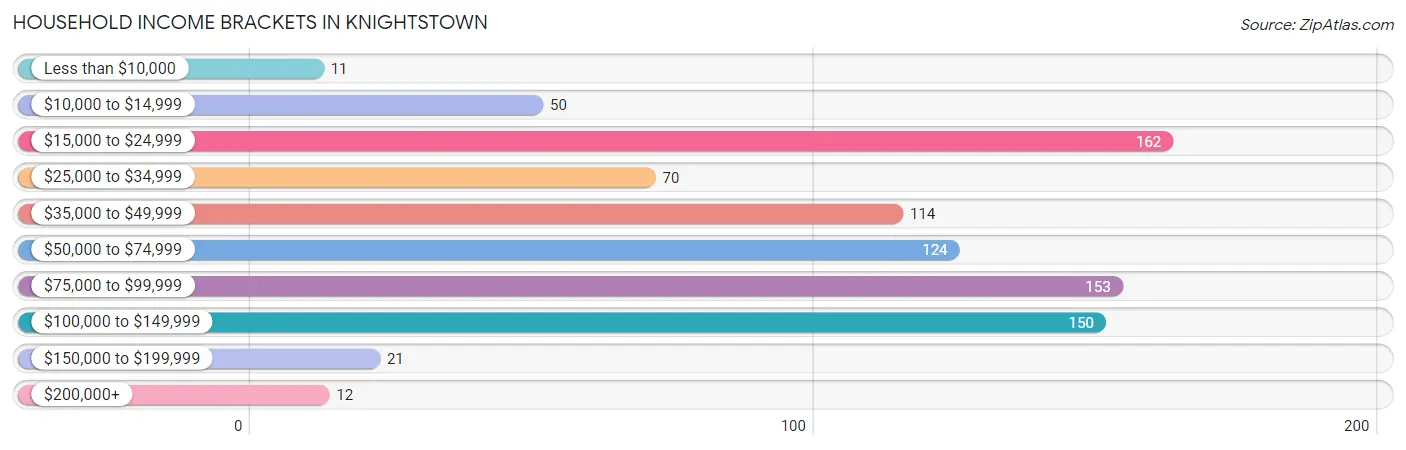
Household Income Brackets in Knightstown
With 162 households falling in the category, the $15,000 to $24,999 income range is the most frequent in Knightstown, accounting for 18.7% of all households. In contrast, only 11 households (1.3%) fall into the less than $10,000 income bracket, making it the least populous group.
| Income Bracket | # Households | % Households |
| Less than $10,000 | 11 | 1.3% |
| $10,000 to $14,999 | 50 | 5.8% |
| $15,000 to $24,999 | 162 | 18.7% |
| $25,000 to $34,999 | 70 | 8.1% |
| $35,000 to $49,999 | 114 | 13.1% |
| $50,000 to $74,999 | 124 | 14.3% |
| $75,000 to $99,999 | 153 | 17.6% |
| $100,000 to $149,999 | 150 | 17.3% |
| $150,000 to $199,999 | 21 | 2.4% |
| $200,000+ | 12 | 1.4% |
Household Income by Householder Age in Knightstown
The median household income in Knightstown is $53,375, with the highest median household income of $80,694 found in the 25 to 44 years age bracket for the primary householder. A total of 241 households (27.8%) fall into this category. Meanwhile, the 15 to 24 years age bracket for the primary householder has the lowest median household income of $35,750, with 67 households (7.7%) in this group.
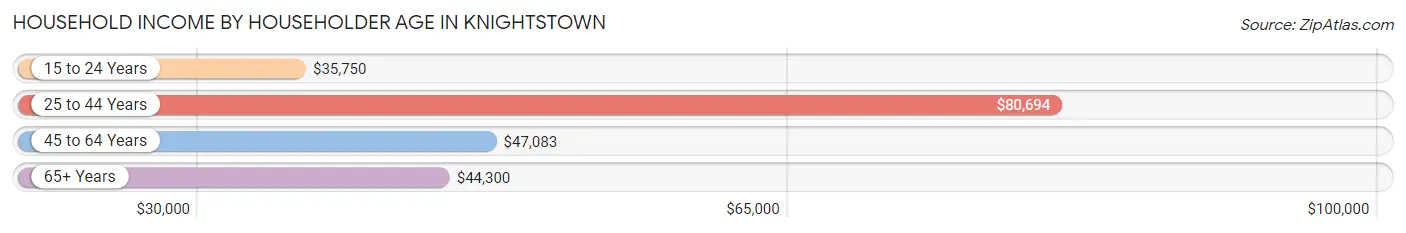
| Income Bracket | # Households | Median Income |
| 15 to 24 Years | 67 (7.7%) | $35,750 |
| 25 to 44 Years | 241 (27.8%) | $80,694 |
| 45 to 64 Years | 293 (33.8%) | $47,083 |
| 65+ Years | 266 (30.7%) | $44,300 |
| Total | 867 (100.0%) | $53,375 |
Poverty in Knightstown
Income Below Poverty by Sex and Age in Knightstown
With 20.2% poverty level for males and 15.8% for females among the residents of Knightstown, 15 year old males and 25 to 34 year old females are the most vulnerable to poverty, with 13 males (100.0%) and 43 females (33.9%) in their respective age groups living below the poverty level.
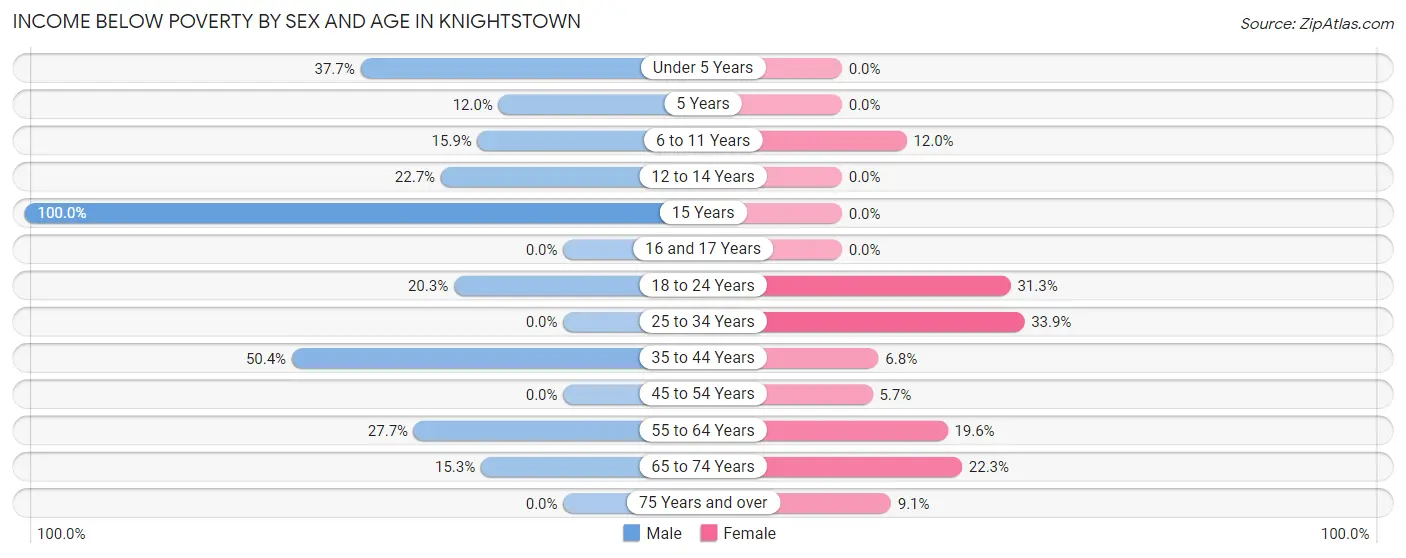
| Age Bracket | Male | Female |
| Under 5 Years | 32 (37.7%) | 0 (0.0%) |
| 5 Years | 3 (12.0%) | 0 (0.0%) |
| 6 to 11 Years | 7 (15.9%) | 3 (12.0%) |
| 12 to 14 Years | 25 (22.7%) | 0 (0.0%) |
| 15 Years | 13 (100.0%) | 0 (0.0%) |
| 16 and 17 Years | 0 (0.0%) | 0 (0.0%) |
| 18 to 24 Years | 27 (20.3%) | 31 (31.3%) |
| 25 to 34 Years | 0 (0.0%) | 43 (33.9%) |
| 35 to 44 Years | 66 (50.4%) | 10 (6.8%) |
| 45 to 54 Years | 0 (0.0%) | 7 (5.7%) |
| 55 to 64 Years | 43 (27.7%) | 20 (19.6%) |
| 65 to 74 Years | 11 (15.3%) | 39 (22.3%) |
| 75 Years and over | 0 (0.0%) | 7 (9.1%) |
| Total | 227 (20.2%) | 160 (15.8%) |
Income Above Poverty by Sex and Age in Knightstown
According to the poverty statistics in Knightstown, males aged 16 and 17 years and females aged under 5 years are the age groups that are most secure financially, with 100.0% of males and 100.0% of females in these age groups living above the poverty line.
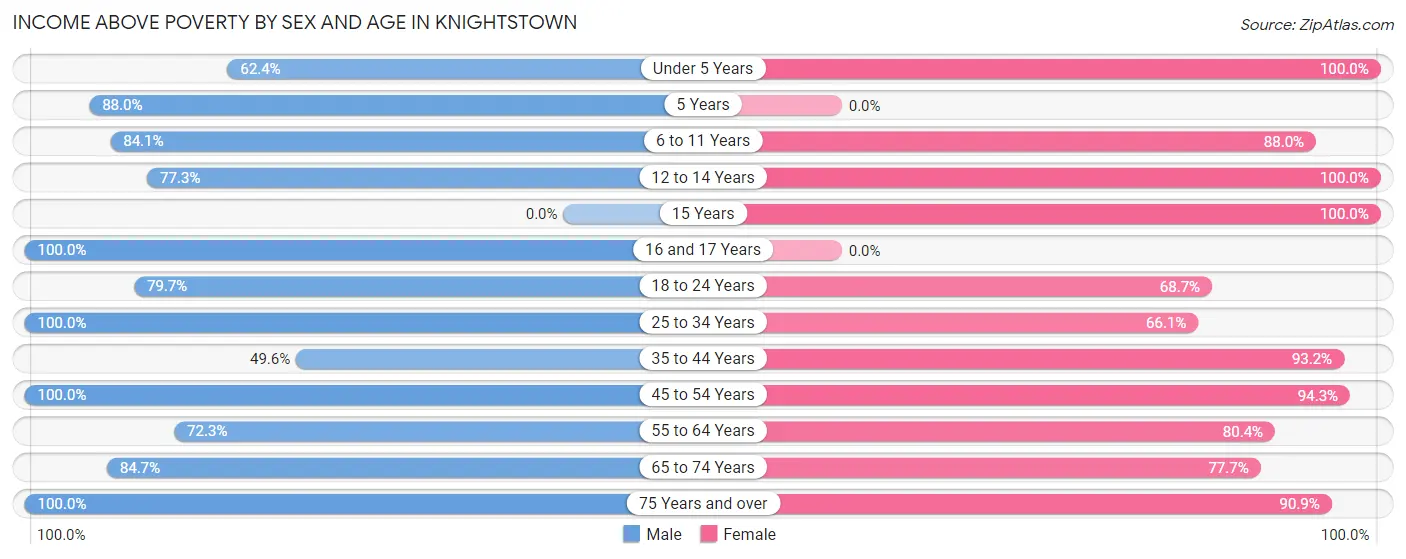
| Age Bracket | Male | Female |
| Under 5 Years | 53 (62.4%) | 80 (100.0%) |
| 5 Years | 22 (88.0%) | 0 (0.0%) |
| 6 to 11 Years | 37 (84.1%) | 22 (88.0%) |
| 12 to 14 Years | 85 (77.3%) | 10 (100.0%) |
| 15 Years | 0 (0.0%) | 48 (100.0%) |
| 16 and 17 Years | 62 (100.0%) | 0 (0.0%) |
| 18 to 24 Years | 106 (79.7%) | 68 (68.7%) |
| 25 to 34 Years | 157 (100.0%) | 84 (66.1%) |
| 35 to 44 Years | 65 (49.6%) | 137 (93.2%) |
| 45 to 54 Years | 92 (100.0%) | 116 (94.3%) |
| 55 to 64 Years | 112 (72.3%) | 82 (80.4%) |
| 65 to 74 Years | 61 (84.7%) | 136 (77.7%) |
| 75 Years and over | 45 (100.0%) | 70 (90.9%) |
| Total | 897 (79.8%) | 853 (84.2%) |
Income Below Poverty Among Married-Couple Families in Knightstown
The poverty statistics for married-couple families in Knightstown show that 5.4% or 21 of the total 388 families live below the poverty line. Families with no children have the highest poverty rate of 7.5%, comprising of 17 families. On the other hand, families with 3 or 4 children have the lowest poverty rate of 0.0%, which includes 0 families.
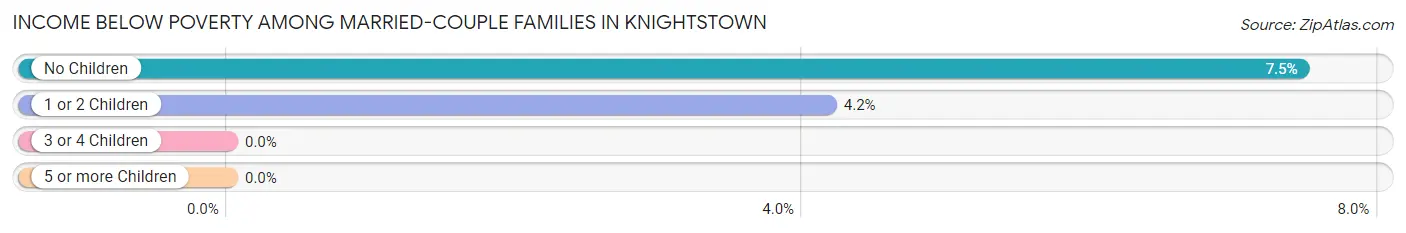
| Children | Above Poverty | Below Poverty |
| No Children | 211 (92.5%) | 17 (7.5%) |
| 1 or 2 Children | 92 (95.8%) | 4 (4.2%) |
| 3 or 4 Children | 64 (100.0%) | 0 (0.0%) |
| 5 or more Children | 0 (0.0%) | 0 (0.0%) |
| Total | 367 (94.6%) | 21 (5.4%) |
Income Below Poverty Among Single-Parent Households in Knightstown
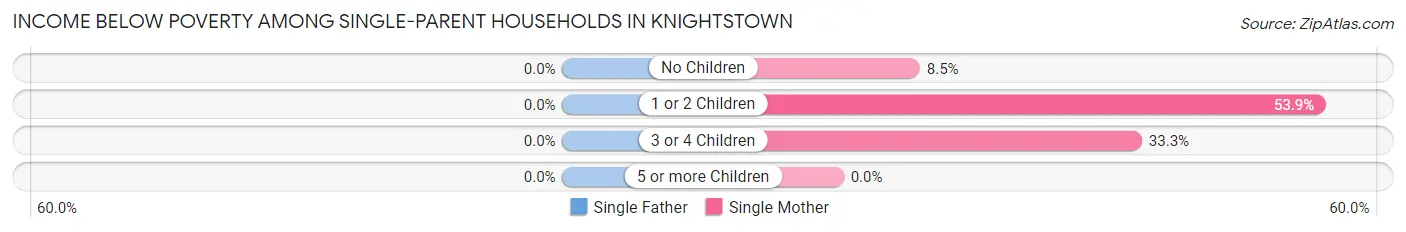
| Children | Single Father | Single Mother |
| No Children | 0 (0.0%) | 4 (8.5%) |
| 1 or 2 Children | 0 (0.0%) | 62 (53.9%) |
| 3 or 4 Children | 0 (0.0%) | 3 (33.3%) |
| 5 or more Children | 0 (0.0%) | 0 (0.0%) |
| Total | 0 (0.0%) | 69 (40.4%) |
Income Below Poverty Among Married-Couple vs Single-Parent Households in Knightstown
The poverty data for Knightstown shows that 21 of the married-couple family households (5.4%) and 69 of the single-parent households (40.4%) are living below the poverty level. Within the married-couple family households, those with no children have the highest poverty rate, with 17 households (7.5%) falling below the poverty line. Among the single-parent households, those with 1 or 2 children have the highest poverty rate, with 62 household (53.9%) living below poverty.
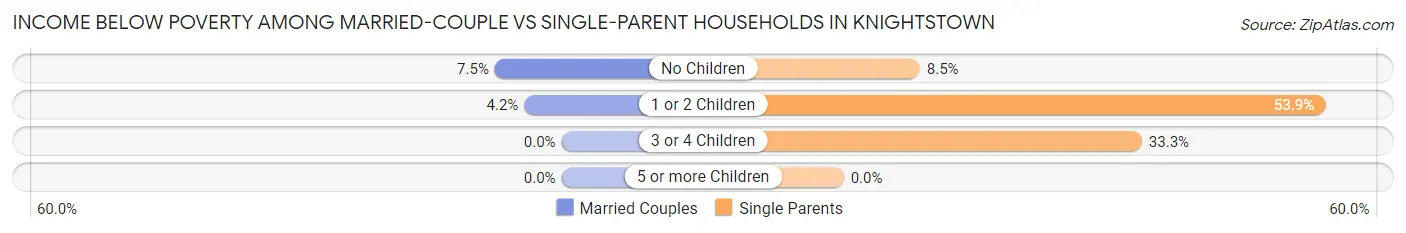
| Children | Married-Couple Families | Single-Parent Households |
| No Children | 17 (7.5%) | 4 (8.5%) |
| 1 or 2 Children | 4 (4.2%) | 62 (53.9%) |
| 3 or 4 Children | 0 (0.0%) | 3 (33.3%) |
| 5 or more Children | 0 (0.0%) | 0 (0.0%) |
| Total | 21 (5.4%) | 69 (40.4%) |
Race in Knightstown
The most populous races in Knightstown are White / Caucasian (2,118 | 97.4%), Hispanic or Latino (34 | 1.6%), and Two or more Races (26 | 1.2%).
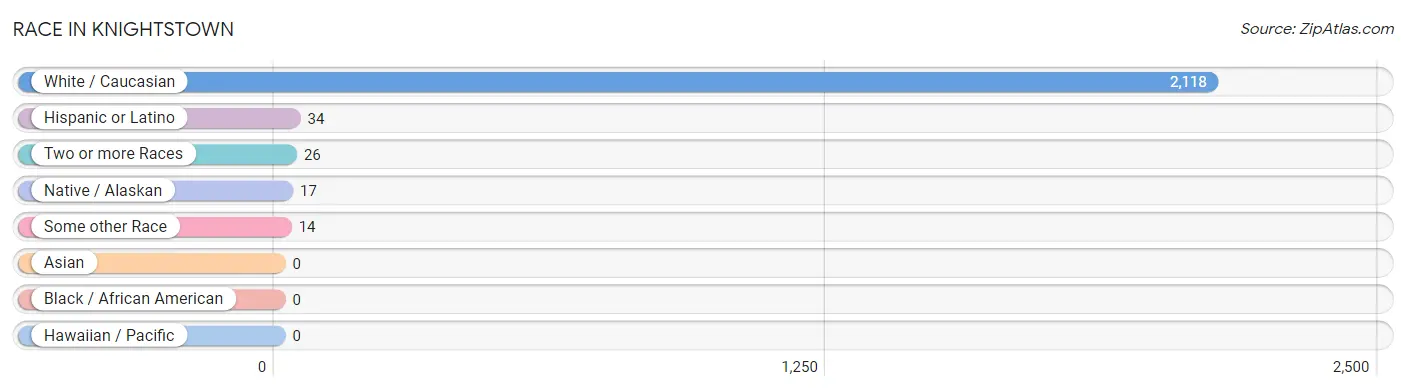
| Race | # Population | % Population |
| Asian | 0 | 0.0% |
| Black / African American | 0 | 0.0% |
| Hawaiian / Pacific | 0 | 0.0% |
| Hispanic or Latino | 34 | 1.6% |
| Native / Alaskan | 17 | 0.8% |
| White / Caucasian | 2,118 | 97.4% |
| Two or more Races | 26 | 1.2% |
| Some other Race | 14 | 0.6% |
| Total | 2,175 | 100.0% |
Ancestry in Knightstown
The most populous ancestries reported in Knightstown are German (434 | 20.0%), American (345 | 15.9%), English (288 | 13.2%), Irish (274 | 12.6%), and Scottish (53 | 2.4%), together accounting for 64.1% of all Knightstown residents.
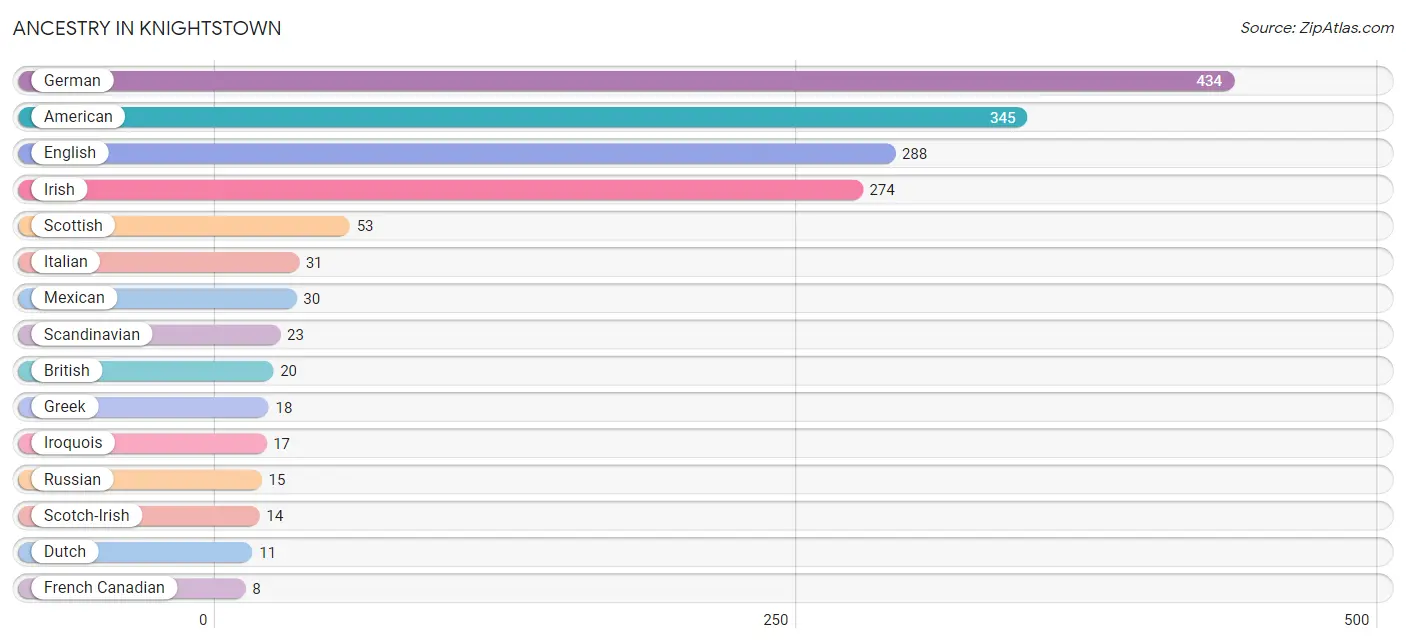
| Ancestry | # Population | % Population |
| American | 345 | 15.9% |
| Blackfeet | 3 | 0.1% |
| British | 20 | 0.9% |
| Central American | 4 | 0.2% |
| Dutch | 11 | 0.5% |
| English | 288 | 13.2% |
| European | 7 | 0.3% |
| French Canadian | 8 | 0.4% |
| German | 434 | 20.0% |
| Greek | 18 | 0.8% |
| Guatemalan | 4 | 0.2% |
| Haitian | 6 | 0.3% |
| Irish | 274 | 12.6% |
| Iroquois | 17 | 0.8% |
| Italian | 31 | 1.4% |
| Mexican | 30 | 1.4% |
| Norwegian | 3 | 0.1% |
| Polish | 4 | 0.2% |
| Russian | 15 | 0.7% |
| Scandinavian | 23 | 1.1% |
| Scotch-Irish | 14 | 0.6% |
| Scottish | 53 | 2.4% |
| Swedish | 8 | 0.4% |
| Welsh | 6 | 0.3% | View All 24 Rows |
Immigrants in Knightstown
The most numerous immigrant groups reported in Knightstown came from Central America (14 | 0.6%), Latin America (14 | 0.6%), Mexico (10 | 0.5%), and Guatemala (4 | 0.2%), together accounting for 1.9% of all Knightstown residents.
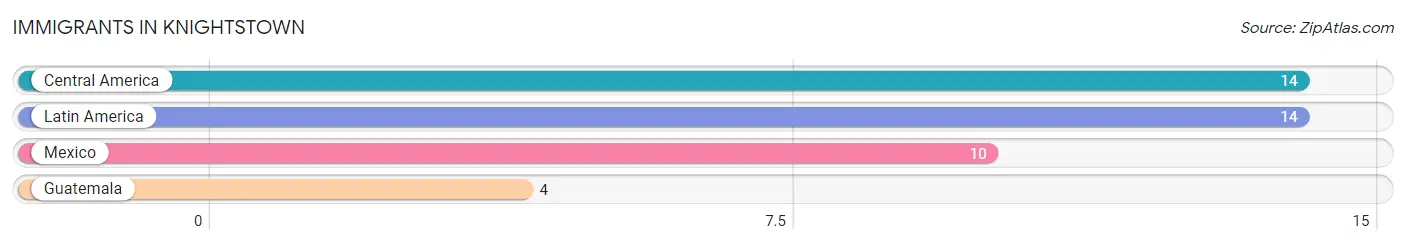
| Immigration Origin | # Population | % Population |
| Central America | 14 | 0.6% |
| Guatemala | 4 | 0.2% |
| Latin America | 14 | 0.6% |
| Mexico | 10 | 0.5% | View All 4 Rows |
Sex and Age in Knightstown
Sex and Age in Knightstown
The most populous age groups in Knightstown are 10 to 14 Years (132 | 11.4%) for men and 65 to 69 Years (110 | 10.8%) for women.
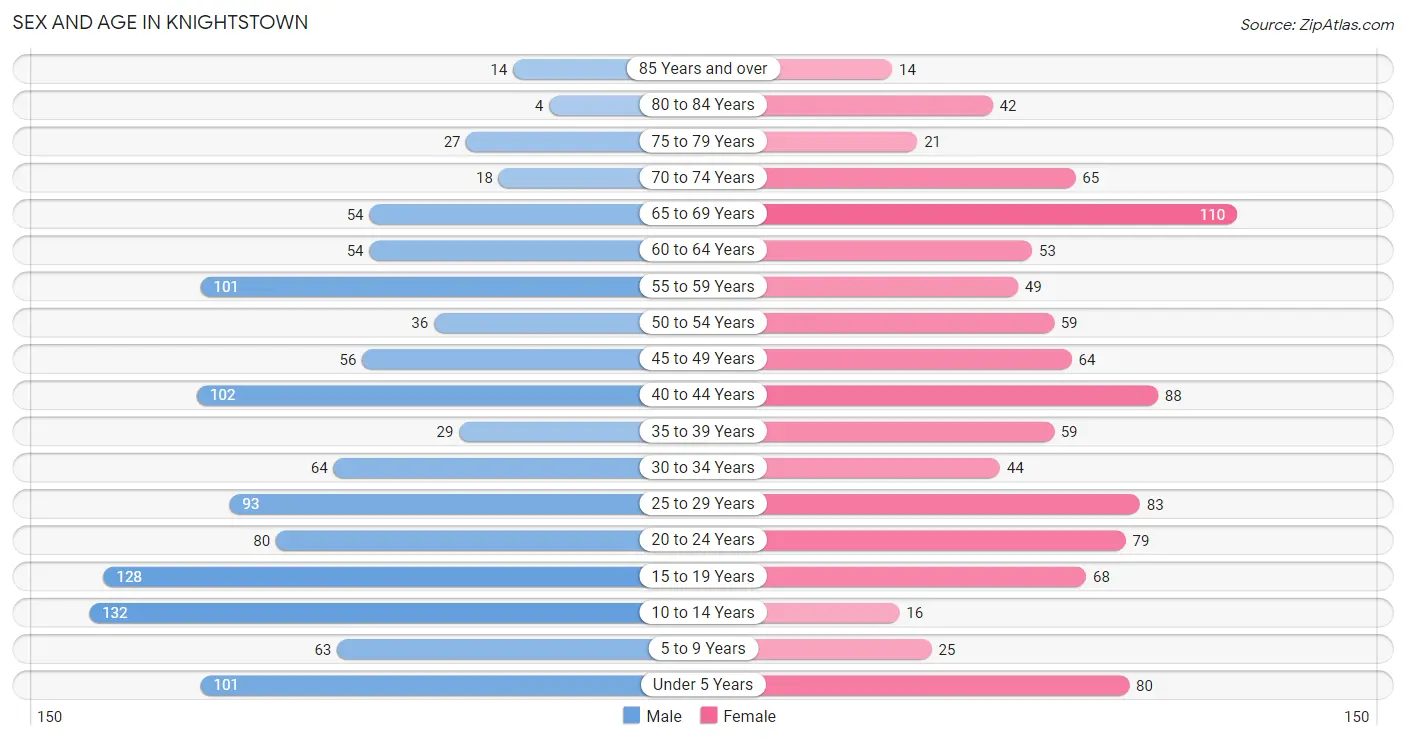
| Age Bracket | Male | Female |
| Under 5 Years | 101 (8.7%) | 80 (7.9%) |
| 5 to 9 Years | 63 (5.4%) | 25 (2.5%) |
| 10 to 14 Years | 132 (11.4%) | 16 (1.6%) |
| 15 to 19 Years | 128 (11.1%) | 68 (6.7%) |
| 20 to 24 Years | 80 (6.9%) | 79 (7.7%) |
| 25 to 29 Years | 93 (8.0%) | 83 (8.2%) |
| 30 to 34 Years | 64 (5.5%) | 44 (4.3%) |
| 35 to 39 Years | 29 (2.5%) | 59 (5.8%) |
| 40 to 44 Years | 102 (8.8%) | 88 (8.6%) |
| 45 to 49 Years | 56 (4.8%) | 64 (6.3%) |
| 50 to 54 Years | 36 (3.1%) | 59 (5.8%) |
| 55 to 59 Years | 101 (8.7%) | 49 (4.8%) |
| 60 to 64 Years | 54 (4.7%) | 53 (5.2%) |
| 65 to 69 Years | 54 (4.7%) | 110 (10.8%) |
| 70 to 74 Years | 18 (1.6%) | 65 (6.4%) |
| 75 to 79 Years | 27 (2.3%) | 21 (2.1%) |
| 80 to 84 Years | 4 (0.4%) | 42 (4.1%) |
| 85 Years and over | 14 (1.2%) | 14 (1.4%) |
| Total | 1,156 (100.0%) | 1,019 (100.0%) |
Families and Households in Knightstown
Median Family Size in Knightstown
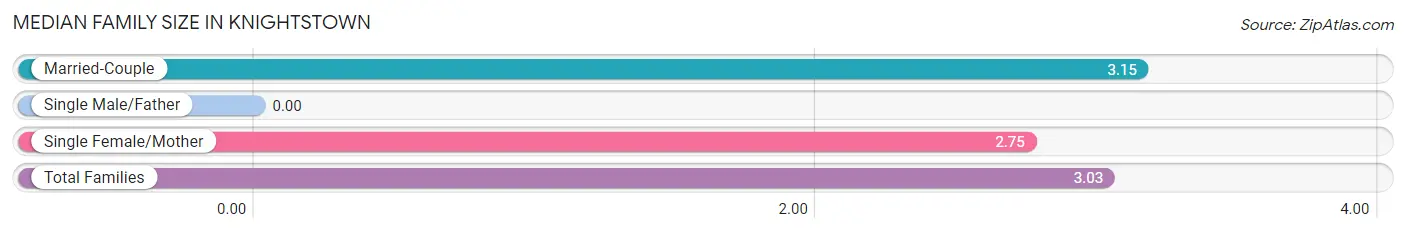
| Family Type | # Families | Family Size |
| Married-Couple | 388 (69.4%) | 3.15 |
| Single Male/Father | 0 (0.0%) | - |
| Single Female/Mother | 171 (30.6%) | 2.75 |
| Total Families | 559 (100.0%) | 3.03 |
Median Household Size in Knightstown
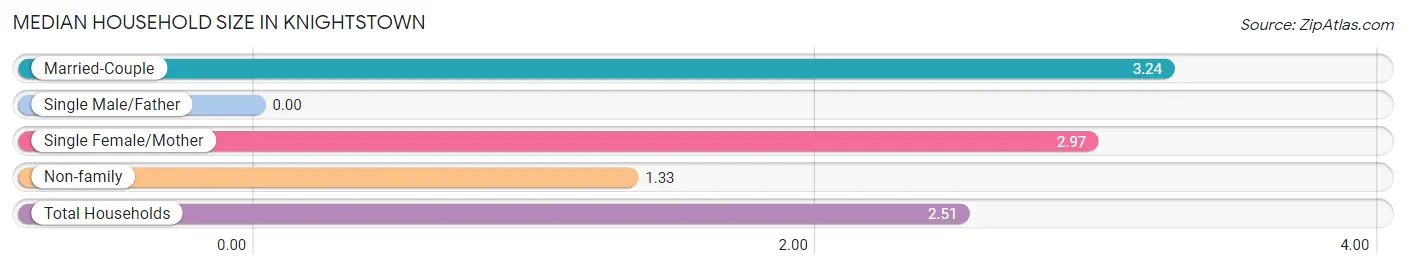
| Household Type | # Households | Household Size |
| Married-Couple | 388 (44.8%) | 3.24 |
| Single Male/Father | 0 (0.0%) | - |
| Single Female/Mother | 171 (19.7%) | 2.97 |
| Non-family | 308 (35.5%) | 1.33 |
| Total Households | 867 (100.0%) | 2.51 |
Household Size by Marriage Status in Knightstown
Out of a total of 867 households in Knightstown, 559 (64.5%) are family households, while 308 (35.5%) are nonfamily households. The most numerous type of family households are 2-person households, comprising 264, and the most common type of nonfamily households are 1-person households, comprising 233.
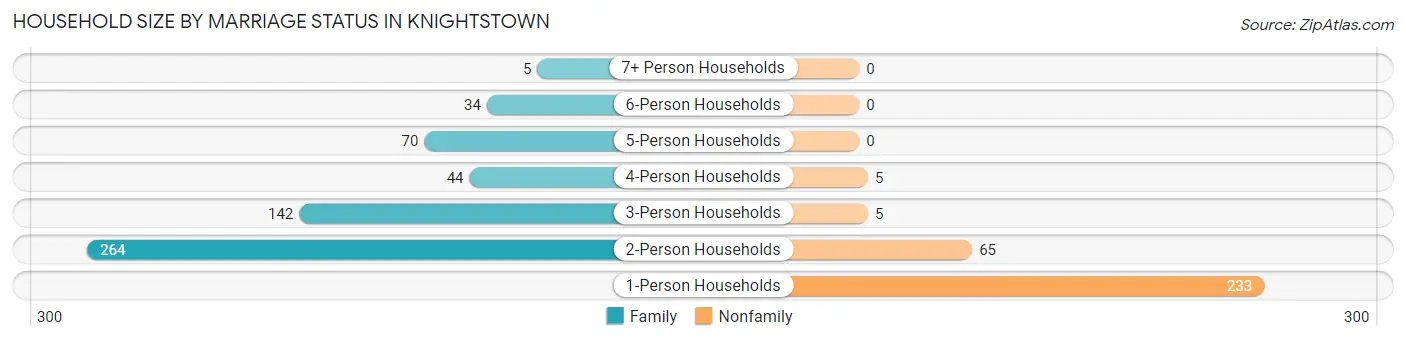
| Household Size | Family Households | Nonfamily Households |
| 1-Person Households | - | 233 (26.9%) |
| 2-Person Households | 264 (30.4%) | 65 (7.5%) |
| 3-Person Households | 142 (16.4%) | 5 (0.6%) |
| 4-Person Households | 44 (5.1%) | 5 (0.6%) |
| 5-Person Households | 70 (8.1%) | 0 (0.0%) |
| 6-Person Households | 34 (3.9%) | 0 (0.0%) |
| 7+ Person Households | 5 (0.6%) | 0 (0.0%) |
| Total | 559 (64.5%) | 308 (35.5%) |
Female Fertility in Knightstown
Fertility by Age in Knightstown
Average fertility rate in Knightstown is 10.0 births per 1,000 women. Women in the age bracket of 15 to 19 years have the highest fertility rate with 74.0 births per 1,000 women. Women in the age bracket of 15 to 19 years acount for 100.0% of all women with births.
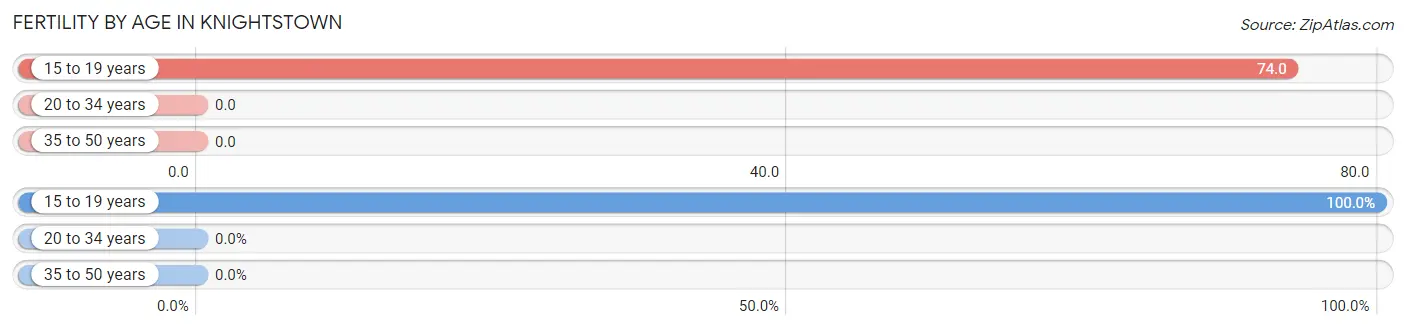
| Age Bracket | Women with Births | Births / 1,000 Women |
| 15 to 19 years | 5 (100.0%) | 74.0 |
| 20 to 34 years | 0 (0.0%) | 0.0 |
| 35 to 50 years | 0 (0.0%) | 0.0 |
| Total | 5 (100.0%) | 10.0 |
Fertility by Age by Marriage Status in Knightstown
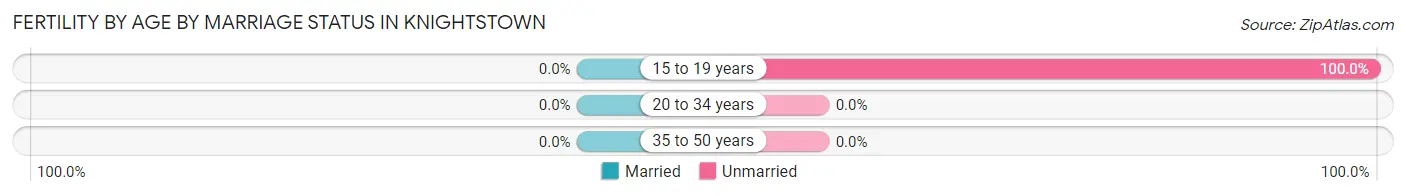
| Age Bracket | Married | Unmarried |
| 15 to 19 years | 0 (0.0%) | 5 (100.0%) |
| 20 to 34 years | 0 (0.0%) | 0 (0.0%) |
| 35 to 50 years | 0 (0.0%) | 0 (0.0%) |
| Total | 0 (0.0%) | 5 (100.0%) |
Fertility by Education in Knightstown
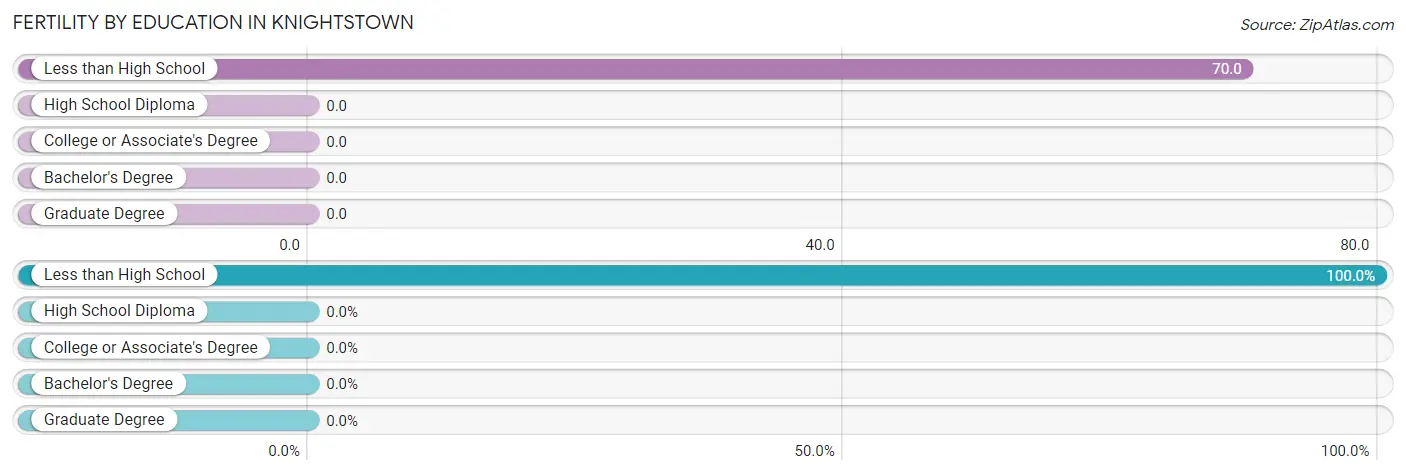
| Educational Attainment | Women with Births | Births / 1,000 Women |
| Less than High School | 5 (100.0%) | 70.0 |
| High School Diploma | 0 (0.0%) | 0.0 |
| College or Associate's Degree | 0 (0.0%) | 0.0 |
| Bachelor's Degree | 0 (0.0%) | 0.0 |
| Graduate Degree | 0 (0.0%) | 0.0 |
| Total | 5 (100.0%) | 10.0 |
Fertility by Education by Marriage Status in Knightstown
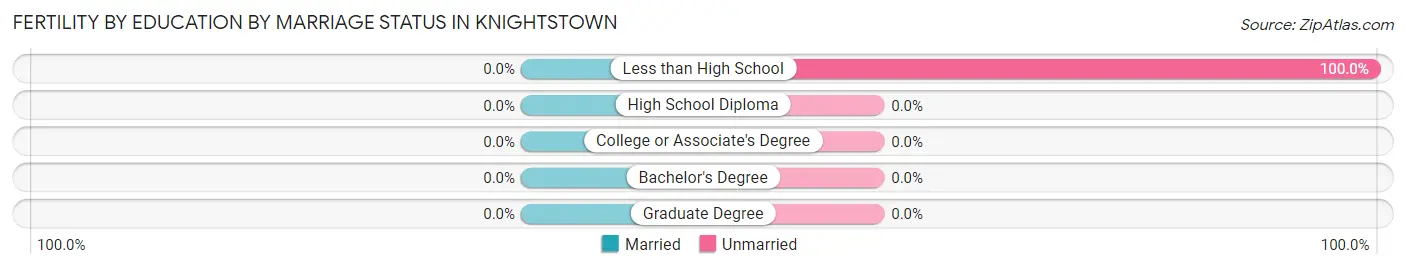
| Educational Attainment | Married | Unmarried |
| Less than High School | 0 (0.0%) | 5 (100.0%) |
| High School Diploma | 0 (0.0%) | 0 (0.0%) |
| College or Associate's Degree | 0 (0.0%) | 0 (0.0%) |
| Bachelor's Degree | 0 (0.0%) | 0 (0.0%) |
| Graduate Degree | 0 (0.0%) | 0 (0.0%) |
| Total | 0 (0.0%) | 5 (100.0%) |
Employment Characteristics in Knightstown
Employment by Class of Employer in Knightstown
Among the 987 employed individuals in Knightstown, private company employees (682 | 69.1%), not-for-profit organizations (91 | 9.2%), and local government employees (78 | 7.9%) make up the most common classes of employment.
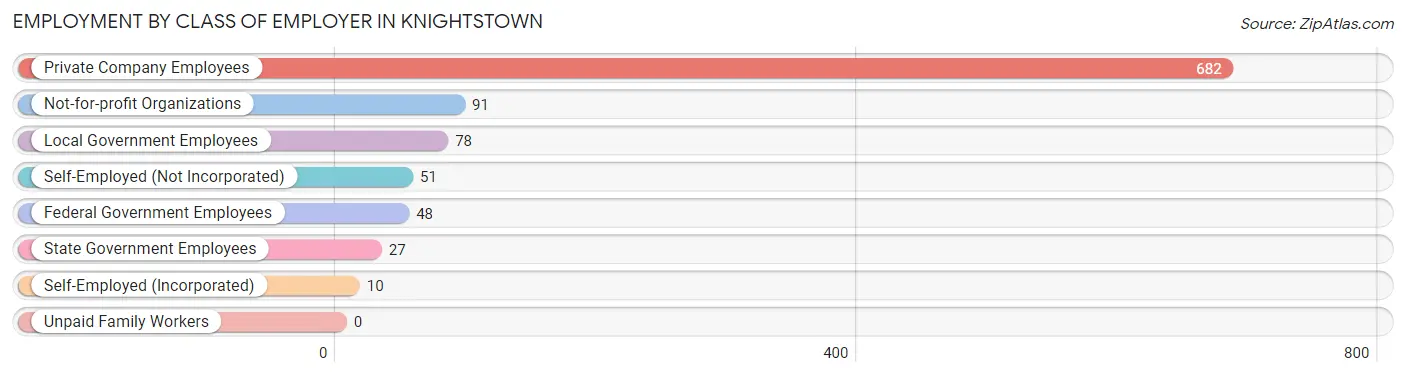
| Employer Class | # Employees | % Employees |
| Private Company Employees | 682 | 69.1% |
| Self-Employed (Incorporated) | 10 | 1.0% |
| Self-Employed (Not Incorporated) | 51 | 5.2% |
| Not-for-profit Organizations | 91 | 9.2% |
| Local Government Employees | 78 | 7.9% |
| State Government Employees | 27 | 2.7% |
| Federal Government Employees | 48 | 4.9% |
| Unpaid Family Workers | 0 | 0.0% |
| Total | 987 | 100.0% |
Employment Status by Age in Knightstown
According to the labor force statistics for Knightstown, out of the total population over 16 years of age (1,697), 63.3% or 1,074 individuals are in the labor force, with 7.1% or 76 of them unemployed. The age group with the highest labor force participation rate is 20 to 24 years, with 92.5% or 147 individuals in the labor force. Within the labor force, the 16 to 19 years age range has the highest percentage of unemployed individuals, with 55.6% or 25 of them being unemployed.
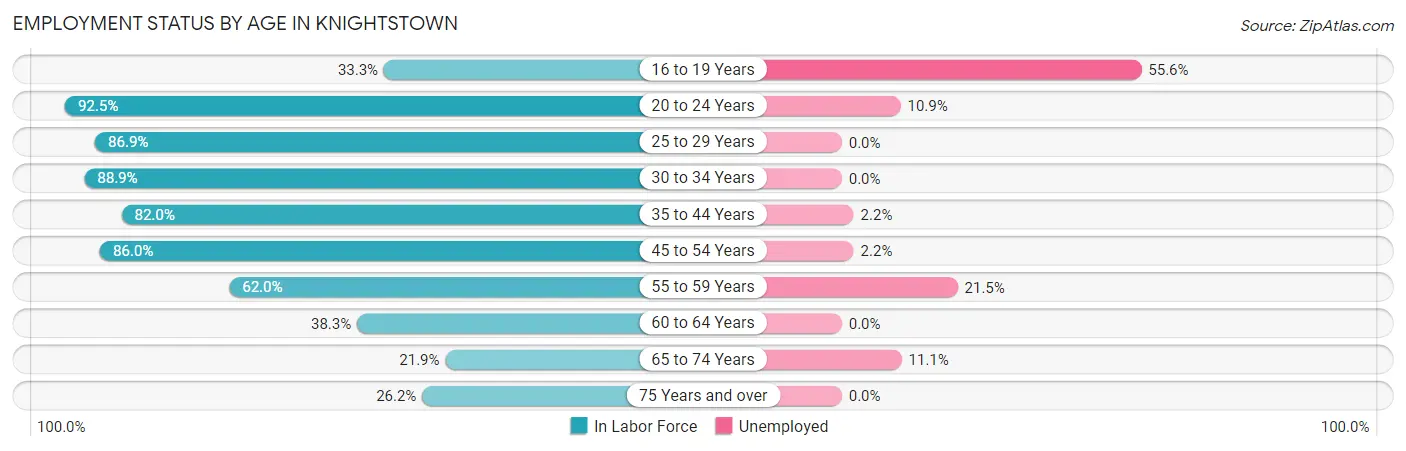
| Age Bracket | In Labor Force | Unemployed |
| 16 to 19 Years | 45 (33.3%) | 25 (55.6%) |
| 20 to 24 Years | 147 (92.5%) | 16 (10.9%) |
| 25 to 29 Years | 153 (86.9%) | 0 (0.0%) |
| 30 to 34 Years | 96 (88.9%) | 0 (0.0%) |
| 35 to 44 Years | 228 (82.0%) | 5 (2.2%) |
| 45 to 54 Years | 185 (86.0%) | 4 (2.2%) |
| 55 to 59 Years | 93 (62.0%) | 20 (21.5%) |
| 60 to 64 Years | 41 (38.3%) | 0 (0.0%) |
| 65 to 74 Years | 54 (21.9%) | 6 (11.1%) |
| 75 Years and over | 32 (26.2%) | 0 (0.0%) |
| Total | 1,074 (63.3%) | 76 (7.1%) |
Employment Status by Educational Attainment in Knightstown
According to labor force statistics for Knightstown, 77.0% of individuals (796) out of the total population between 25 and 64 years of age (1,034) are in the labor force, with 3.6% or 29 of them being unemployed. The group with the highest labor force participation rate are those with the educational attainment of bachelor's degree or higher, with 93.9% or 108 individuals in the labor force. Within the labor force, individuals with high school diploma education have the highest percentage of unemployment, with 5.9% or 20 of them being unemployed.
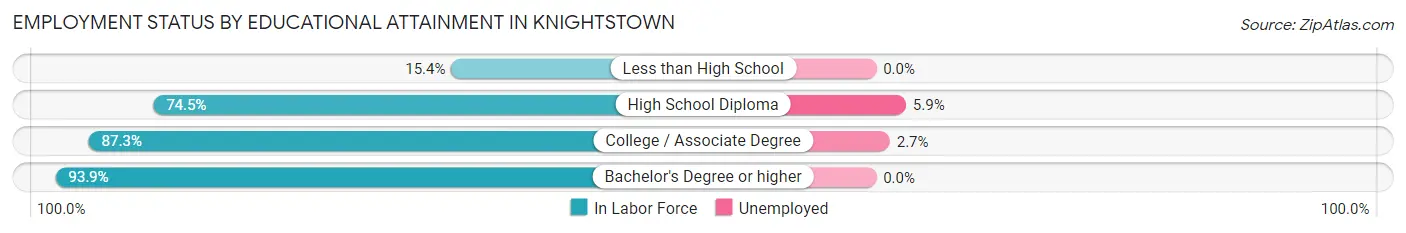
| Educational Attainment | In Labor Force | Unemployed |
| Less than High School | 12 (15.4%) | 0 (0.0%) |
| High School Diploma | 339 (74.5%) | 27 (5.9%) |
| College / Associate Degree | 337 (87.3%) | 10 (2.7%) |
| Bachelor's Degree or higher | 108 (93.9%) | 0 (0.0%) |
| Total | 796 (77.0%) | 37 (3.6%) |
Employment Occupations by Sex in Knightstown
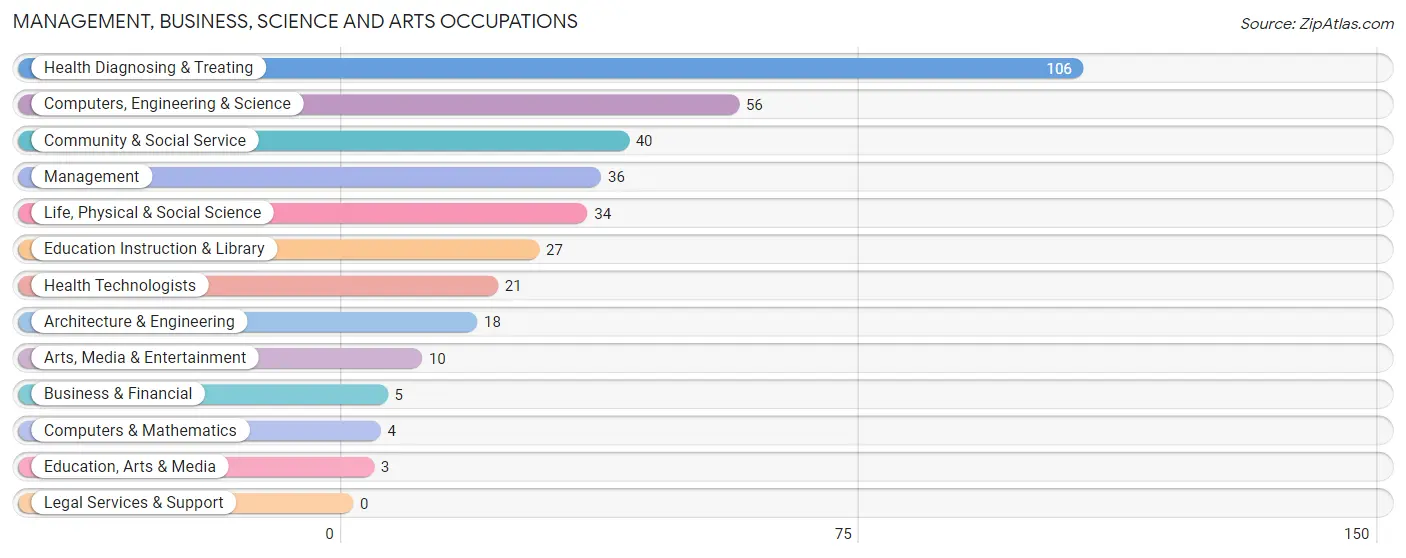
Management, Business, Science and Arts Occupations
The most common Management, Business, Science and Arts occupations in Knightstown are Health Diagnosing & Treating (106 | 10.6%), Computers, Engineering & Science (56 | 5.6%), Community & Social Service (40 | 4.0%), Management (36 | 3.6%), and Life, Physical & Social Science (34 | 3.4%).
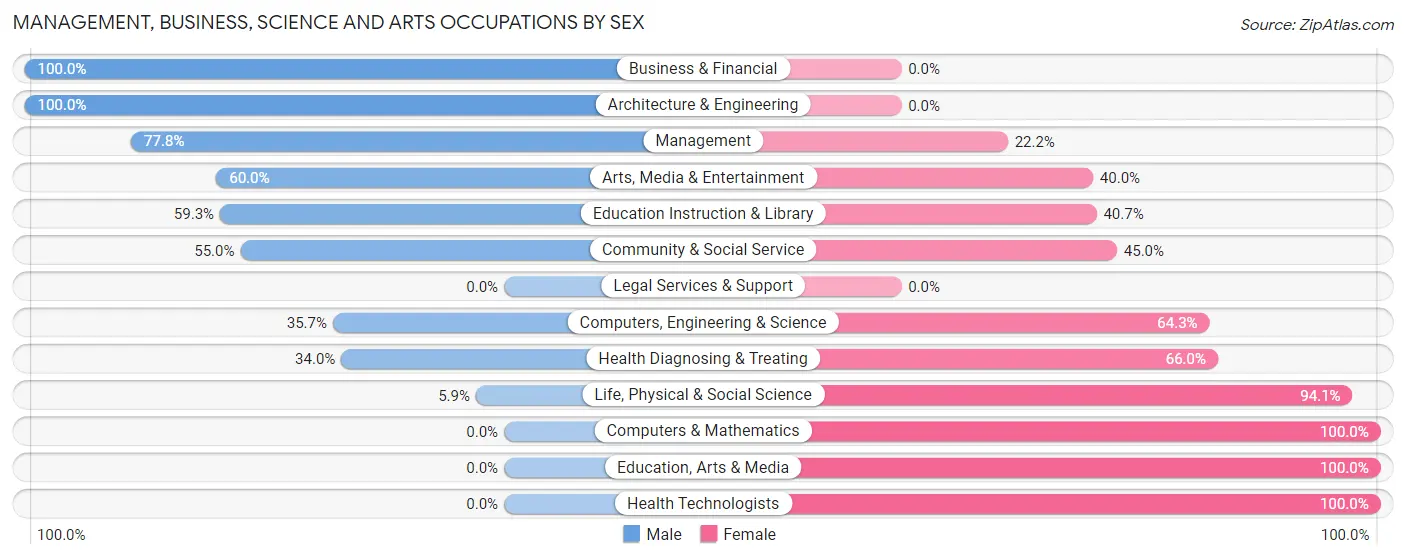
Management, Business, Science and Arts Occupations by Sex
Within the Management, Business, Science and Arts occupations in Knightstown, the most male-oriented occupations are Business & Financial (100.0%), Architecture & Engineering (100.0%), and Management (77.8%), while the most female-oriented occupations are Computers & Mathematics (100.0%), Education, Arts & Media (100.0%), and Health Technologists (100.0%).
| Occupation | Male | Female |
| Management | 28 (77.8%) | 8 (22.2%) |
| Business & Financial | 5 (100.0%) | 0 (0.0%) |
| Computers, Engineering & Science | 20 (35.7%) | 36 (64.3%) |
| Computers & Mathematics | 0 (0.0%) | 4 (100.0%) |
| Architecture & Engineering | 18 (100.0%) | 0 (0.0%) |
| Life, Physical & Social Science | 2 (5.9%) | 32 (94.1%) |
| Community & Social Service | 22 (55.0%) | 18 (45.0%) |
| Education, Arts & Media | 0 (0.0%) | 3 (100.0%) |
| Legal Services & Support | 0 (0.0%) | 0 (0.0%) |
| Education Instruction & Library | 16 (59.3%) | 11 (40.7%) |
| Arts, Media & Entertainment | 6 (60.0%) | 4 (40.0%) |
| Health Diagnosing & Treating | 36 (34.0%) | 70 (66.0%) |
| Health Technologists | 0 (0.0%) | 21 (100.0%) |
| Total (Category) | 111 (45.7%) | 132 (54.3%) |
| Total (Overall) | 516 (51.7%) | 482 (48.3%) |
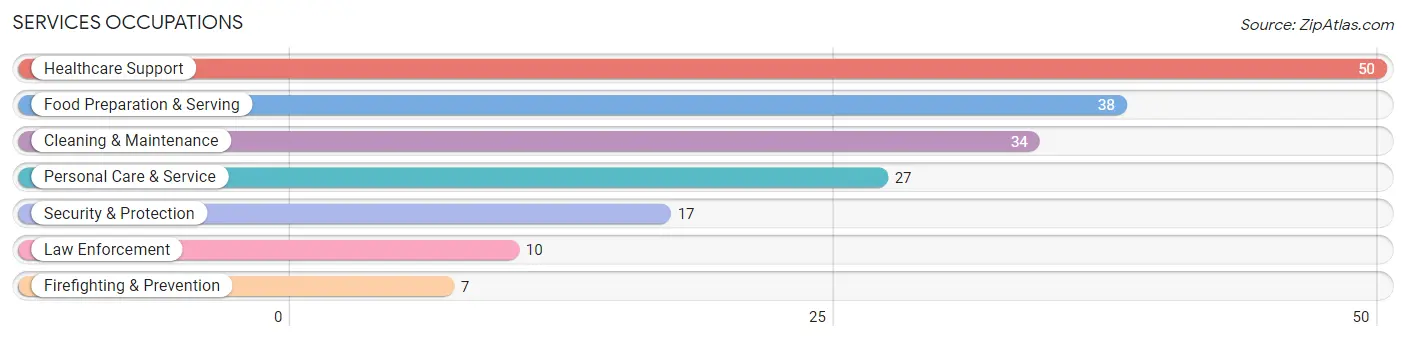
Services Occupations
The most common Services occupations in Knightstown are Healthcare Support (50 | 5.0%), Food Preparation & Serving (38 | 3.8%), Cleaning & Maintenance (34 | 3.4%), Personal Care & Service (27 | 2.7%), and Security & Protection (17 | 1.7%).
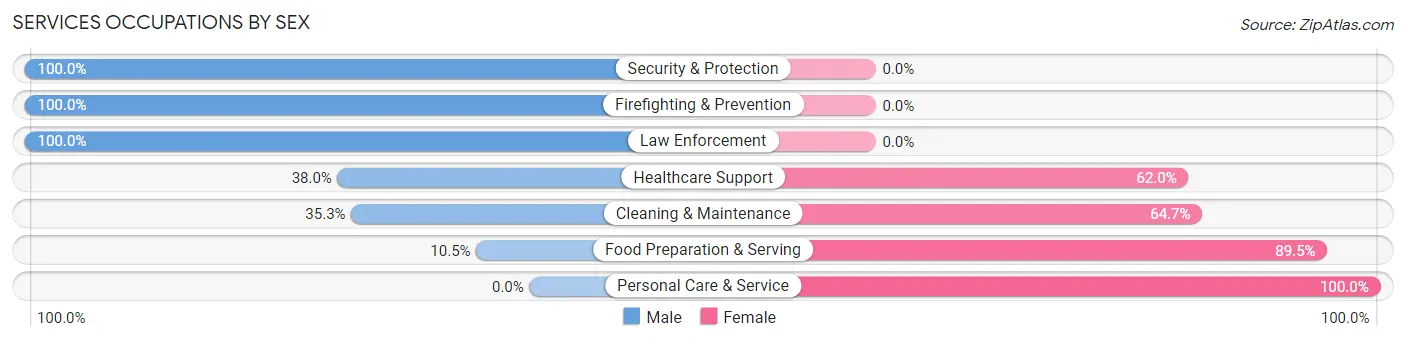
Services Occupations by Sex
Within the Services occupations in Knightstown, the most male-oriented occupations are Security & Protection (100.0%), Firefighting & Prevention (100.0%), and Law Enforcement (100.0%), while the most female-oriented occupations are Personal Care & Service (100.0%), Food Preparation & Serving (89.5%), and Cleaning & Maintenance (64.7%).
| Occupation | Male | Female |
| Healthcare Support | 19 (38.0%) | 31 (62.0%) |
| Security & Protection | 17 (100.0%) | 0 (0.0%) |
| Firefighting & Prevention | 7 (100.0%) | 0 (0.0%) |
| Law Enforcement | 10 (100.0%) | 0 (0.0%) |
| Food Preparation & Serving | 4 (10.5%) | 34 (89.5%) |
| Cleaning & Maintenance | 12 (35.3%) | 22 (64.7%) |
| Personal Care & Service | 0 (0.0%) | 27 (100.0%) |
| Total (Category) | 52 (31.3%) | 114 (68.7%) |
| Total (Overall) | 516 (51.7%) | 482 (48.3%) |
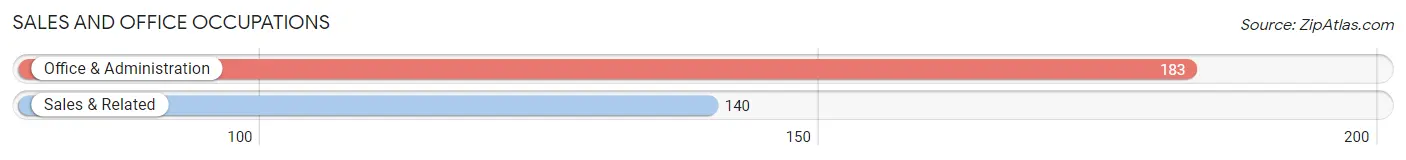
Sales and Office Occupations
The most common Sales and Office occupations in Knightstown are Office & Administration (183 | 18.3%), and Sales & Related (140 | 14.0%).
Sales and Office Occupations by Sex
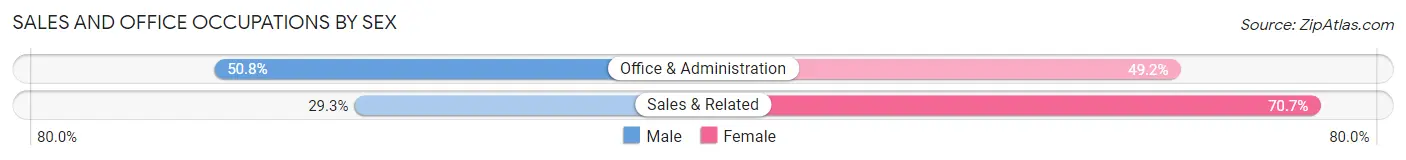
| Occupation | Male | Female |
| Sales & Related | 41 (29.3%) | 99 (70.7%) |
| Office & Administration | 93 (50.8%) | 90 (49.2%) |
| Total (Category) | 134 (41.5%) | 189 (58.5%) |
| Total (Overall) | 516 (51.7%) | 482 (48.3%) |
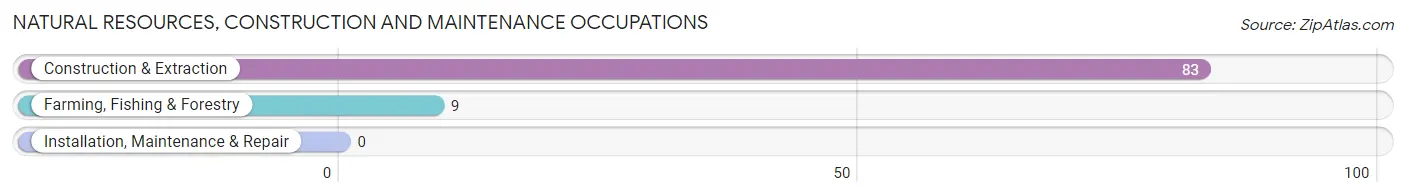
Natural Resources, Construction and Maintenance Occupations
The most common Natural Resources, Construction and Maintenance occupations in Knightstown are Construction & Extraction (83 | 8.3%), and Farming, Fishing & Forestry (9 | 0.9%).
Natural Resources, Construction and Maintenance Occupations by Sex
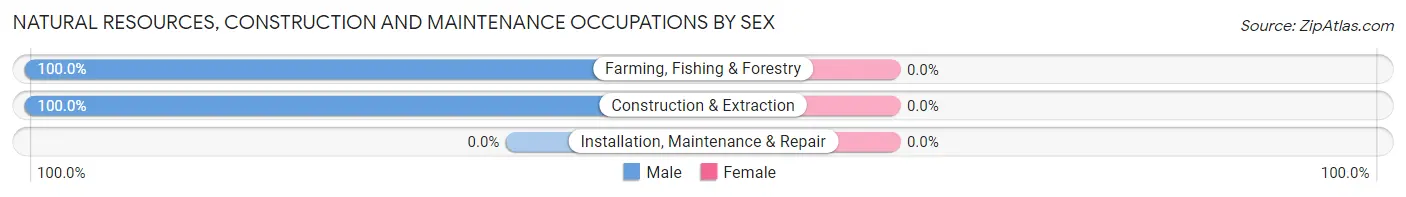
| Occupation | Male | Female |
| Farming, Fishing & Forestry | 9 (100.0%) | 0 (0.0%) |
| Construction & Extraction | 83 (100.0%) | 0 (0.0%) |
| Installation, Maintenance & Repair | 0 (0.0%) | 0 (0.0%) |
| Total (Category) | 92 (100.0%) | 0 (0.0%) |
| Total (Overall) | 516 (51.7%) | 482 (48.3%) |
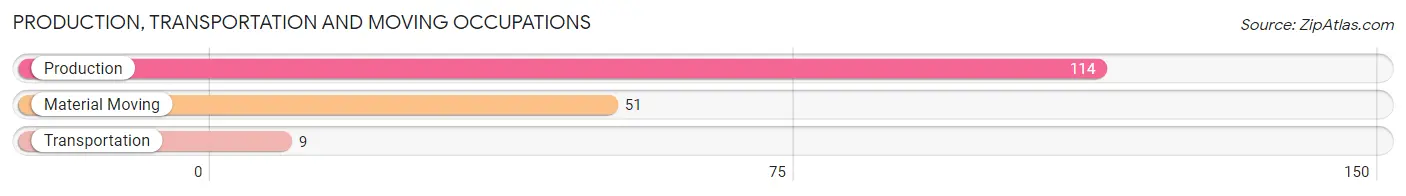
Production, Transportation and Moving Occupations
The most common Production, Transportation and Moving occupations in Knightstown are Production (114 | 11.4%), Material Moving (51 | 5.1%), and Transportation (9 | 0.9%).
Production, Transportation and Moving Occupations by Sex
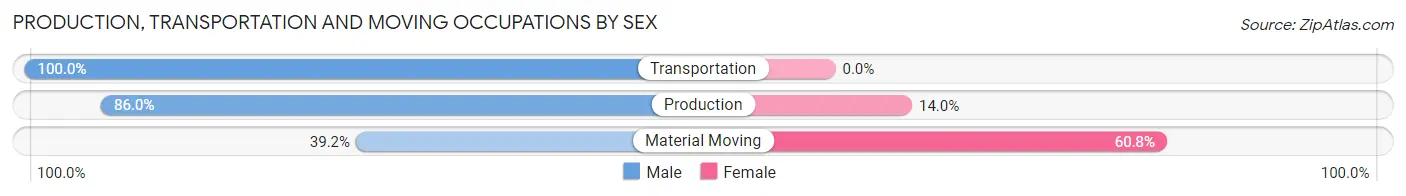
| Occupation | Male | Female |
| Production | 98 (86.0%) | 16 (14.0%) |
| Transportation | 9 (100.0%) | 0 (0.0%) |
| Material Moving | 20 (39.2%) | 31 (60.8%) |
| Total (Category) | 127 (73.0%) | 47 (27.0%) |
| Total (Overall) | 516 (51.7%) | 482 (48.3%) |
Employment Industries by Sex in Knightstown
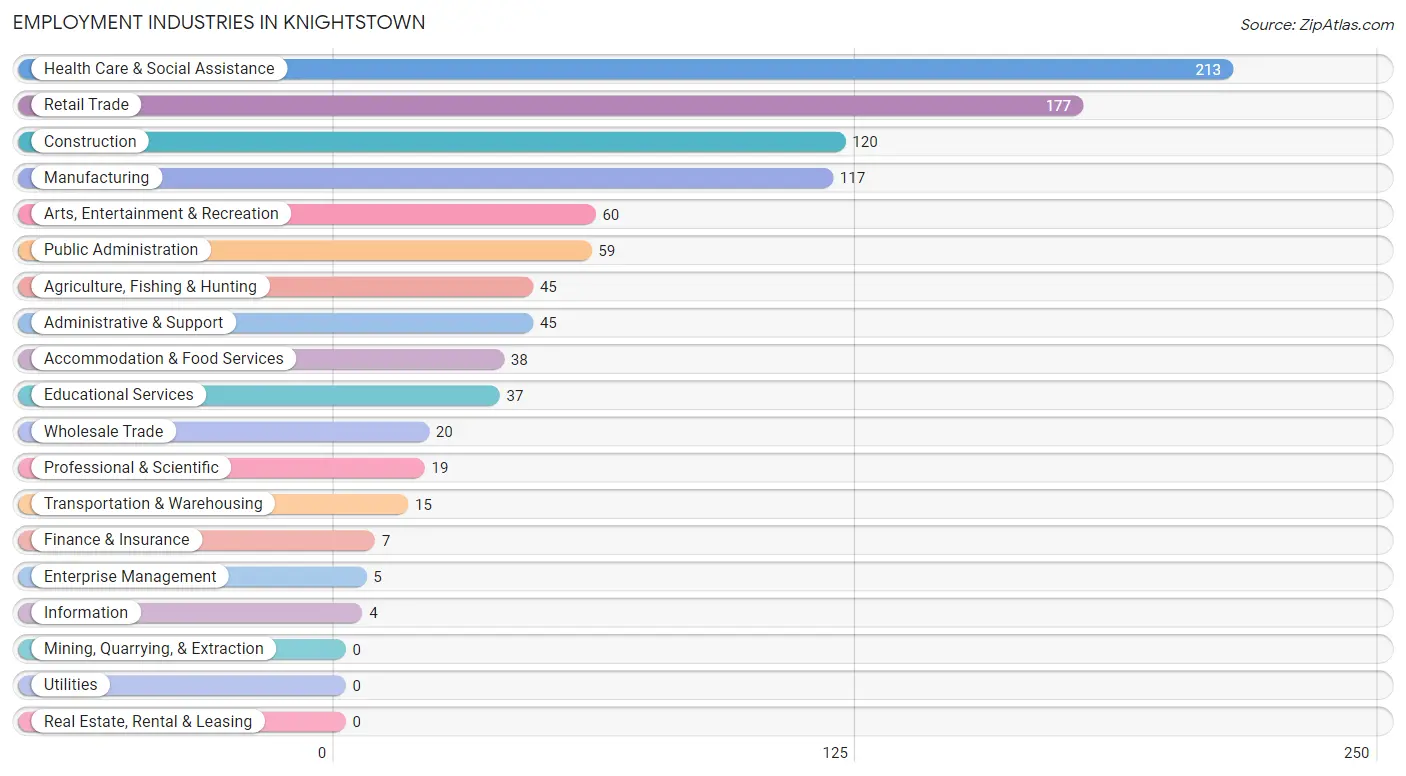
Employment Industries in Knightstown
The major employment industries in Knightstown include Health Care & Social Assistance (213 | 21.3%), Retail Trade (177 | 17.7%), Construction (120 | 12.0%), Manufacturing (117 | 11.7%), and Arts, Entertainment & Recreation (60 | 6.0%).
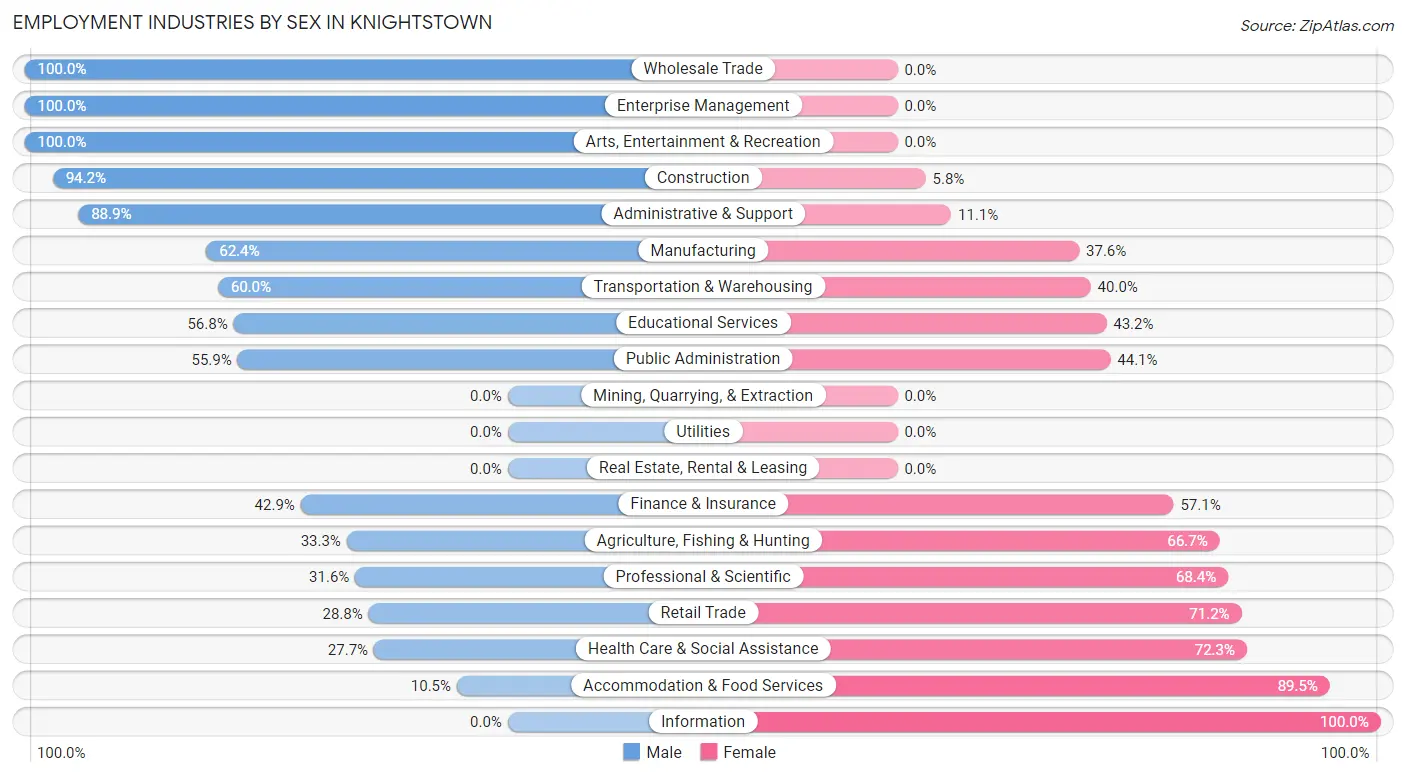
Employment Industries by Sex in Knightstown
The Knightstown industries that see more men than women are Wholesale Trade (100.0%), Enterprise Management (100.0%), and Arts, Entertainment & Recreation (100.0%), whereas the industries that tend to have a higher number of women are Information (100.0%), Accommodation & Food Services (89.5%), and Health Care & Social Assistance (72.3%).
| Industry | Male | Female |
| Agriculture, Fishing & Hunting | 15 (33.3%) | 30 (66.7%) |
| Mining, Quarrying, & Extraction | 0 (0.0%) | 0 (0.0%) |
| Construction | 113 (94.2%) | 7 (5.8%) |
| Manufacturing | 73 (62.4%) | 44 (37.6%) |
| Wholesale Trade | 20 (100.0%) | 0 (0.0%) |
| Retail Trade | 51 (28.8%) | 126 (71.2%) |
| Transportation & Warehousing | 9 (60.0%) | 6 (40.0%) |
| Utilities | 0 (0.0%) | 0 (0.0%) |
| Information | 0 (0.0%) | 4 (100.0%) |
| Finance & Insurance | 3 (42.9%) | 4 (57.1%) |
| Real Estate, Rental & Leasing | 0 (0.0%) | 0 (0.0%) |
| Professional & Scientific | 6 (31.6%) | 13 (68.4%) |
| Enterprise Management | 5 (100.0%) | 0 (0.0%) |
| Administrative & Support | 40 (88.9%) | 5 (11.1%) |
| Educational Services | 21 (56.8%) | 16 (43.2%) |
| Health Care & Social Assistance | 59 (27.7%) | 154 (72.3%) |
| Arts, Entertainment & Recreation | 60 (100.0%) | 0 (0.0%) |
| Accommodation & Food Services | 4 (10.5%) | 34 (89.5%) |
| Public Administration | 33 (55.9%) | 26 (44.1%) |
| Total | 516 (51.7%) | 482 (48.3%) |
Education in Knightstown
School Enrollment in Knightstown
The most common levels of schooling among the 524 students in Knightstown are high school (159 | 30.3%), college / undergraduate (110 | 21.0%), and middle school (103 | 19.7%).
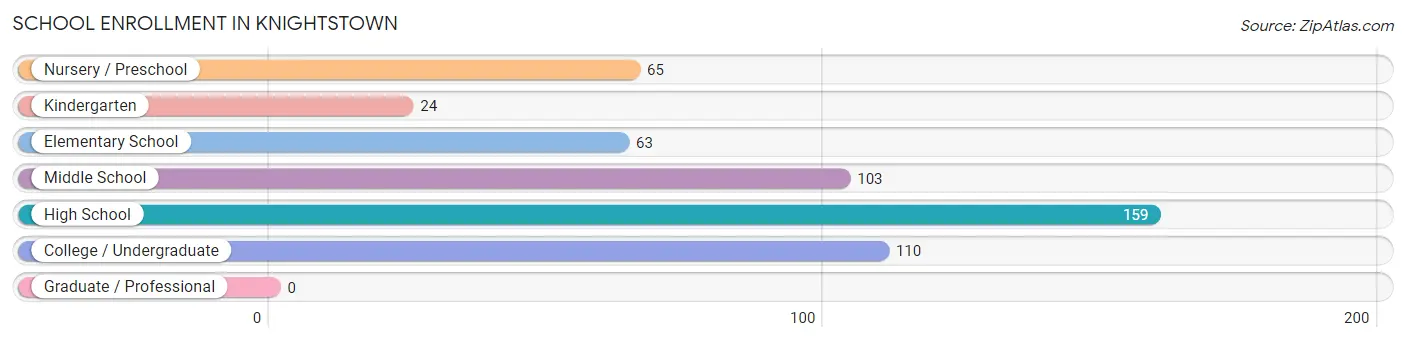
| School Level | # Students | % Students |
| Nursery / Preschool | 65 | 12.4% |
| Kindergarten | 24 | 4.6% |
| Elementary School | 63 | 12.0% |
| Middle School | 103 | 19.7% |
| High School | 159 | 30.3% |
| College / Undergraduate | 110 | 21.0% |
| Graduate / Professional | 0 | 0.0% |
| Total | 524 | 100.0% |
School Enrollment by Age by Funding Source in Knightstown
Out of a total of 524 students who are enrolled in schools in Knightstown, 65 (12.4%) attend a private institution, while the remaining 459 (87.6%) are enrolled in public schools. The age group of 35 years and over has the highest likelihood of being enrolled in private schools, with 9 (100.0% in the age bracket) enrolled. Conversely, the age group of 15 to 17 year olds has the lowest likelihood of being enrolled in a private school, with 123 (100.0% in the age bracket) attending a public institution.
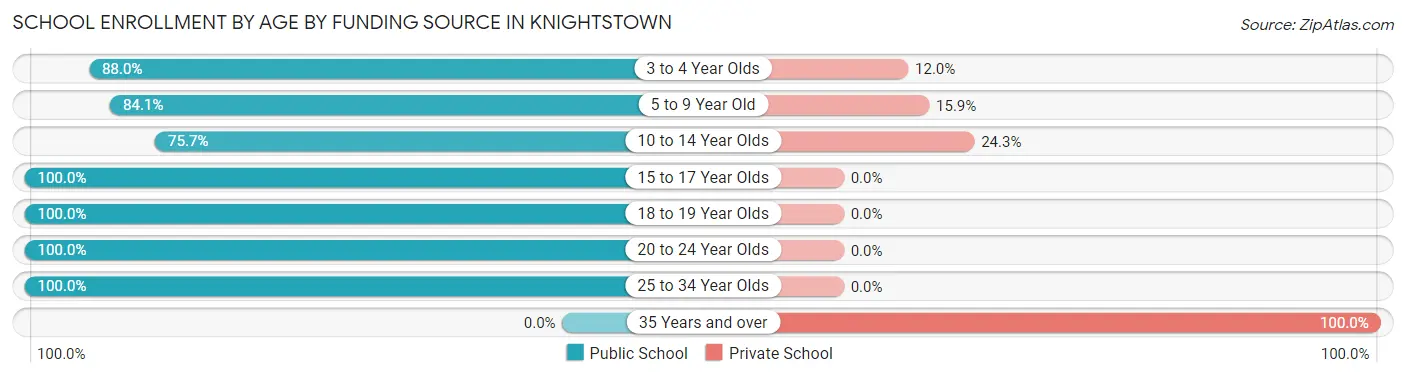
| Age Bracket | Public School | Private School |
| 3 to 4 Year Olds | 44 (88.0%) | 6 (12.0%) |
| 5 to 9 Year Old | 74 (84.1%) | 14 (15.9%) |
| 10 to 14 Year Olds | 112 (75.7%) | 36 (24.3%) |
| 15 to 17 Year Olds | 123 (100.0%) | 0 (0.0%) |
| 18 to 19 Year Olds | 32 (100.0%) | 0 (0.0%) |
| 20 to 24 Year Olds | 36 (100.0%) | 0 (0.0%) |
| 25 to 34 Year Olds | 38 (100.0%) | 0 (0.0%) |
| 35 Years and over | 0 (0.0%) | 9 (100.0%) |
| Total | 459 (87.6%) | 65 (12.4%) |
Educational Attainment by Field of Study in Knightstown
Education (50 | 28.9%), business (28 | 16.2%), science & technology (18 | 10.4%), engineering (15 | 8.7%), and physical & health sciences (14 | 8.1%) are the most common fields of study among 173 individuals in Knightstown who have obtained a bachelor's degree or higher.
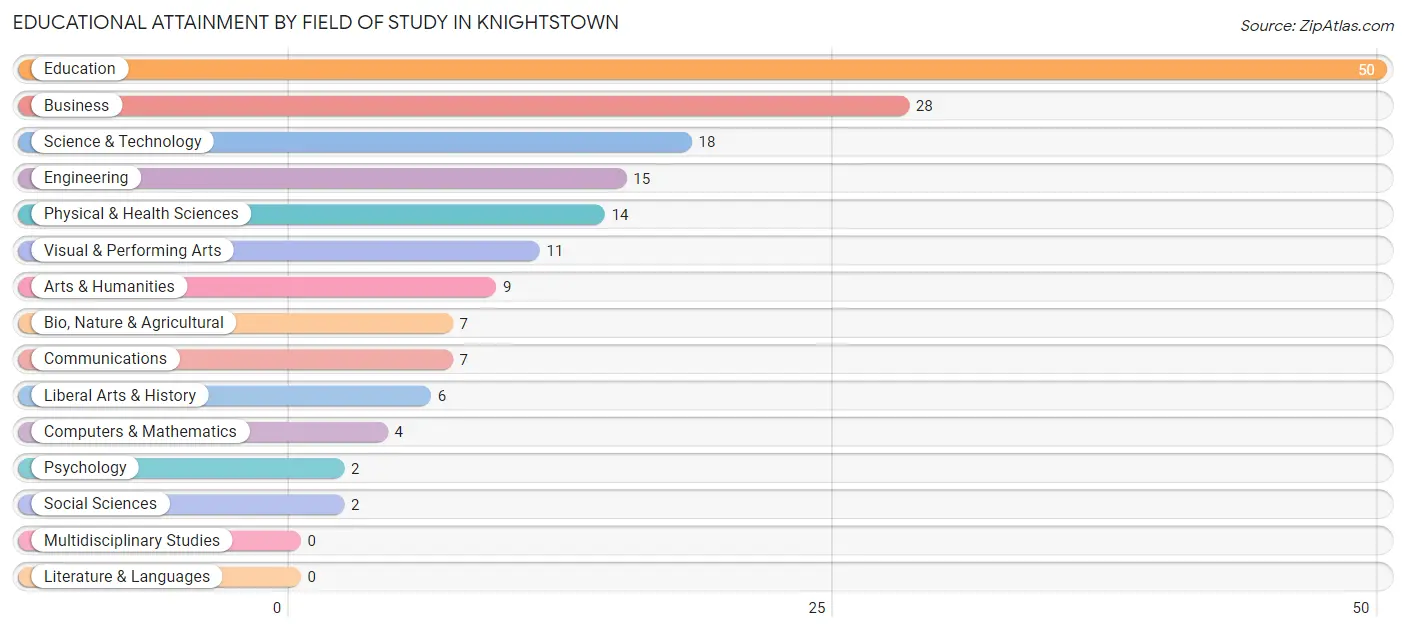
| Field of Study | # Graduates | % Graduates |
| Computers & Mathematics | 4 | 2.3% |
| Bio, Nature & Agricultural | 7 | 4.1% |
| Physical & Health Sciences | 14 | 8.1% |
| Psychology | 2 | 1.2% |
| Social Sciences | 2 | 1.2% |
| Engineering | 15 | 8.7% |
| Multidisciplinary Studies | 0 | 0.0% |
| Science & Technology | 18 | 10.4% |
| Business | 28 | 16.2% |
| Education | 50 | 28.9% |
| Literature & Languages | 0 | 0.0% |
| Liberal Arts & History | 6 | 3.5% |
| Visual & Performing Arts | 11 | 6.4% |
| Communications | 7 | 4.1% |
| Arts & Humanities | 9 | 5.2% |
| Total | 173 | 100.0% |
Transportation & Commute in Knightstown
Vehicle Availability by Sex in Knightstown
The most prevalent vehicle ownership categories in Knightstown are males with 2 vehicles (256, accounting for 50.1%) and females with 2 vehicles (128, making up 53.8%).
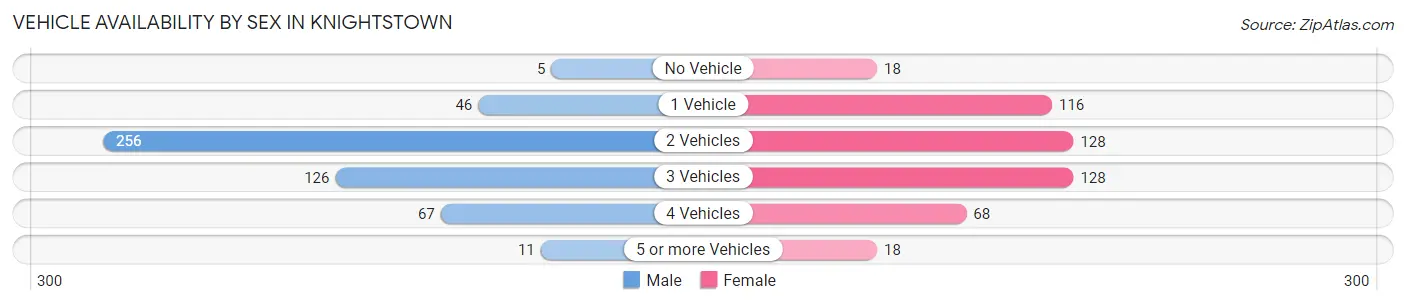
| Vehicles Available | Male | Female |
| No Vehicle | 5 (1.0%) | 18 (3.8%) |
| 1 Vehicle | 46 (9.0%) | 116 (24.4%) |
| 2 Vehicles | 256 (50.1%) | 128 (26.9%) |
| 3 Vehicles | 126 (24.7%) | 128 (26.9%) |
| 4 Vehicles | 67 (13.1%) | 68 (14.3%) |
| 5 or more Vehicles | 11 (2.1%) | 18 (3.8%) |
| Total | 511 (100.0%) | 476 (100.0%) |
Commute Time in Knightstown
The most frequently occuring commute durations in Knightstown are 20 to 24 minutes (161 commuters, 17.0%), 25 to 29 minutes (144 commuters, 15.2%), and 45 to 59 minutes (138 commuters, 14.6%).
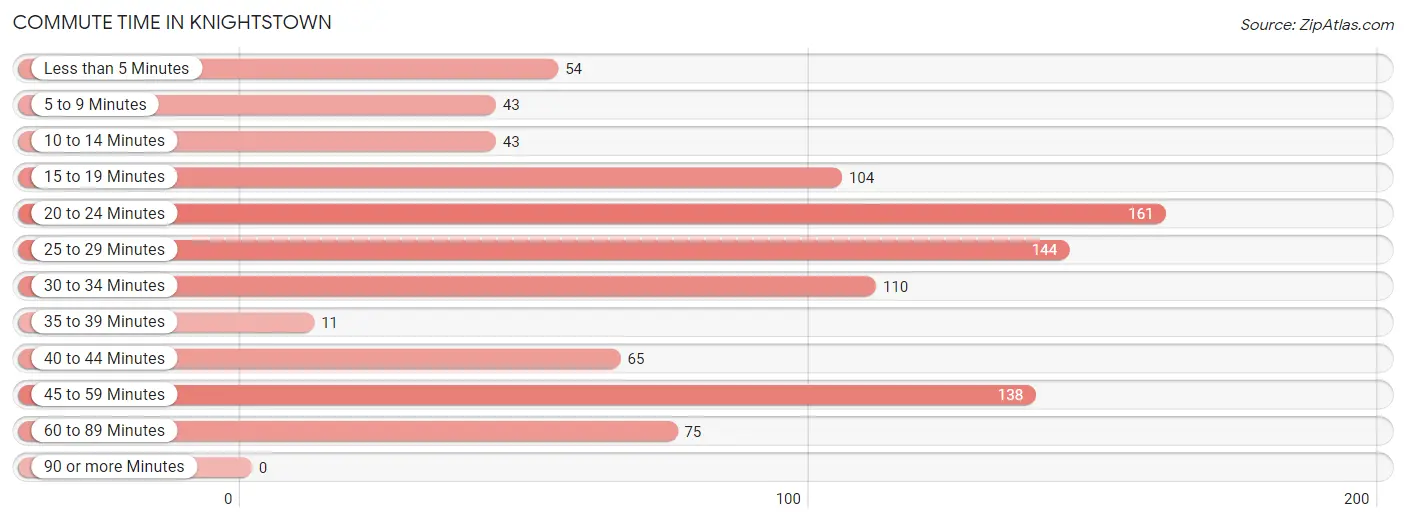
| Commute Time | # Commuters | % Commuters |
| Less than 5 Minutes | 54 | 5.7% |
| 5 to 9 Minutes | 43 | 4.5% |
| 10 to 14 Minutes | 43 | 4.5% |
| 15 to 19 Minutes | 104 | 11.0% |
| 20 to 24 Minutes | 161 | 17.0% |
| 25 to 29 Minutes | 144 | 15.2% |
| 30 to 34 Minutes | 110 | 11.6% |
| 35 to 39 Minutes | 11 | 1.2% |
| 40 to 44 Minutes | 65 | 6.9% |
| 45 to 59 Minutes | 138 | 14.6% |
| 60 to 89 Minutes | 75 | 7.9% |
| 90 or more Minutes | 0 | 0.0% |
Commute Time by Sex in Knightstown
The most common commute times in Knightstown are 45 to 59 minutes (99 commuters, 20.3%) for males and 20 to 24 minutes (107 commuters, 23.3%) for females.
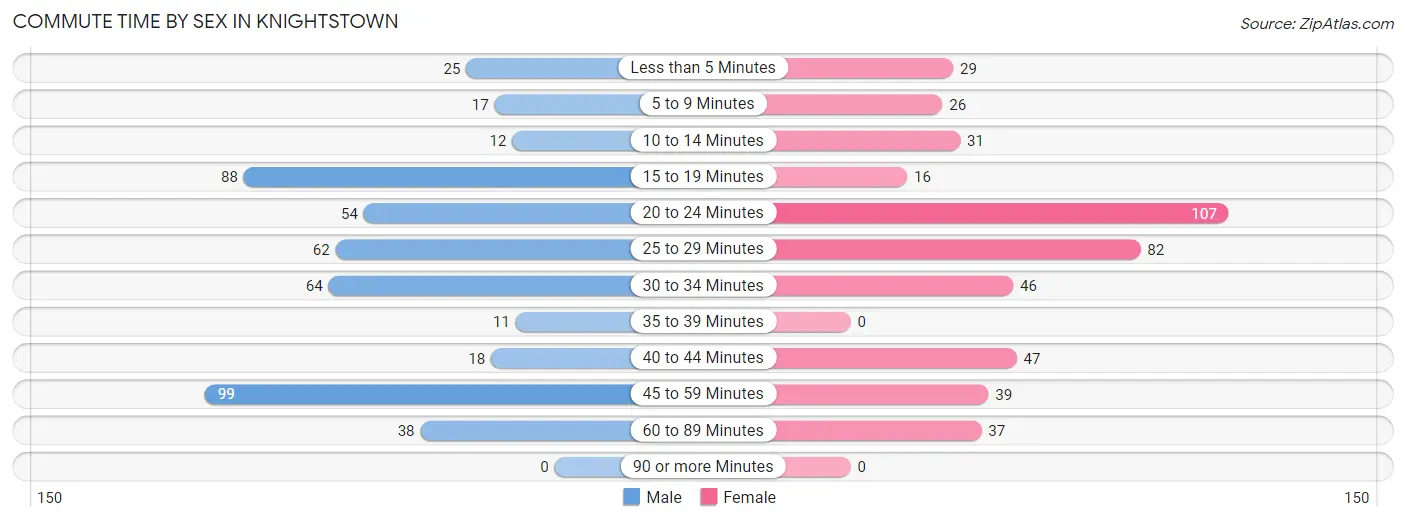
| Commute Time | Male | Female |
| Less than 5 Minutes | 25 (5.1%) | 29 (6.3%) |
| 5 to 9 Minutes | 17 (3.5%) | 26 (5.7%) |
| 10 to 14 Minutes | 12 (2.5%) | 31 (6.7%) |
| 15 to 19 Minutes | 88 (18.0%) | 16 (3.5%) |
| 20 to 24 Minutes | 54 (11.1%) | 107 (23.3%) |
| 25 to 29 Minutes | 62 (12.7%) | 82 (17.8%) |
| 30 to 34 Minutes | 64 (13.1%) | 46 (10.0%) |
| 35 to 39 Minutes | 11 (2.2%) | 0 (0.0%) |
| 40 to 44 Minutes | 18 (3.7%) | 47 (10.2%) |
| 45 to 59 Minutes | 99 (20.3%) | 39 (8.5%) |
| 60 to 89 Minutes | 38 (7.8%) | 37 (8.0%) |
| 90 or more Minutes | 0 (0.0%) | 0 (0.0%) |
Time of Departure to Work by Sex in Knightstown
The most frequent times of departure to work in Knightstown are 7:30 AM to 7:59 AM (110, 22.5%) for males and 7:30 AM to 7:59 AM (89, 19.4%) for females.
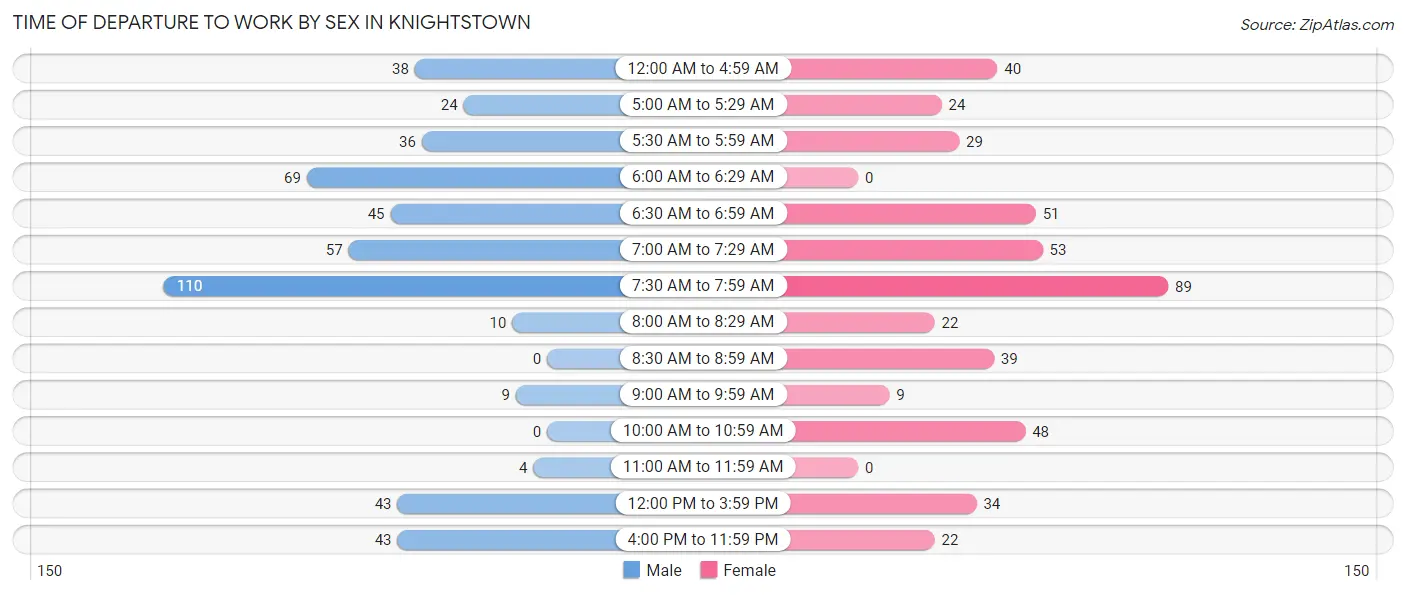
| Time of Departure | Male | Female |
| 12:00 AM to 4:59 AM | 38 (7.8%) | 40 (8.7%) |
| 5:00 AM to 5:29 AM | 24 (4.9%) | 24 (5.2%) |
| 5:30 AM to 5:59 AM | 36 (7.4%) | 29 (6.3%) |
| 6:00 AM to 6:29 AM | 69 (14.1%) | 0 (0.0%) |
| 6:30 AM to 6:59 AM | 45 (9.2%) | 51 (11.1%) |
| 7:00 AM to 7:29 AM | 57 (11.7%) | 53 (11.5%) |
| 7:30 AM to 7:59 AM | 110 (22.5%) | 89 (19.4%) |
| 8:00 AM to 8:29 AM | 10 (2.1%) | 22 (4.8%) |
| 8:30 AM to 8:59 AM | 0 (0.0%) | 39 (8.5%) |
| 9:00 AM to 9:59 AM | 9 (1.8%) | 9 (2.0%) |
| 10:00 AM to 10:59 AM | 0 (0.0%) | 48 (10.4%) |
| 11:00 AM to 11:59 AM | 4 (0.8%) | 0 (0.0%) |
| 12:00 PM to 3:59 PM | 43 (8.8%) | 34 (7.4%) |
| 4:00 PM to 11:59 PM | 43 (8.8%) | 22 (4.8%) |
| Total | 488 (100.0%) | 460 (100.0%) |
Housing Occupancy in Knightstown
Occupancy by Ownership in Knightstown
Of the total 867 dwellings in Knightstown, owner-occupied units account for 551 (63.5%), while renter-occupied units make up 316 (36.4%).
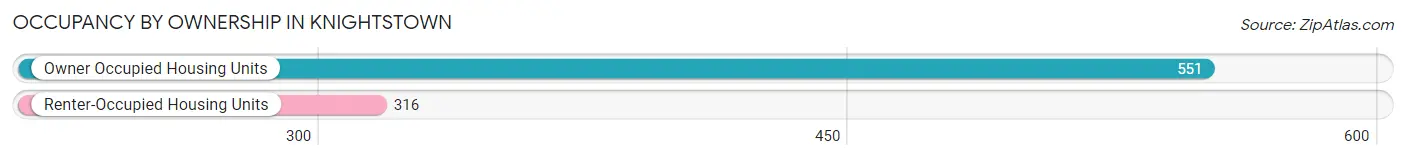
| Occupancy | # Housing Units | % Housing Units |
| Owner Occupied Housing Units | 551 | 63.5% |
| Renter-Occupied Housing Units | 316 | 36.4% |
| Total Occupied Housing Units | 867 | 100.0% |
Occupancy by Household Size in Knightstown
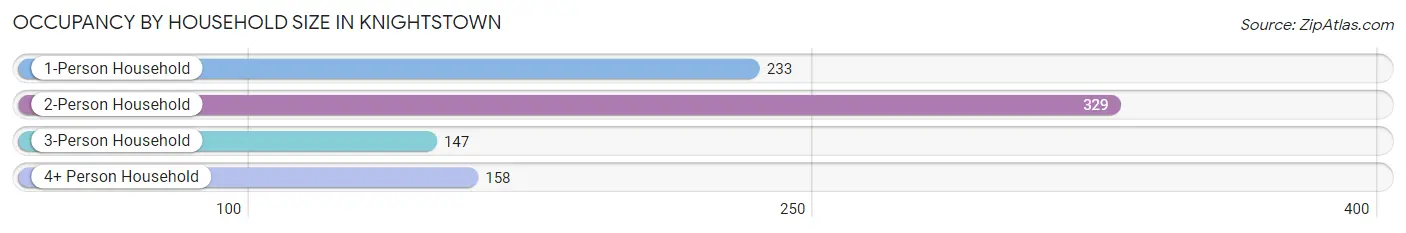
| Household Size | # Housing Units | % Housing Units |
| 1-Person Household | 233 | 26.9% |
| 2-Person Household | 329 | 38.0% |
| 3-Person Household | 147 | 17.0% |
| 4+ Person Household | 158 | 18.2% |
| Total Housing Units | 867 | 100.0% |
Occupancy by Ownership by Household Size in Knightstown
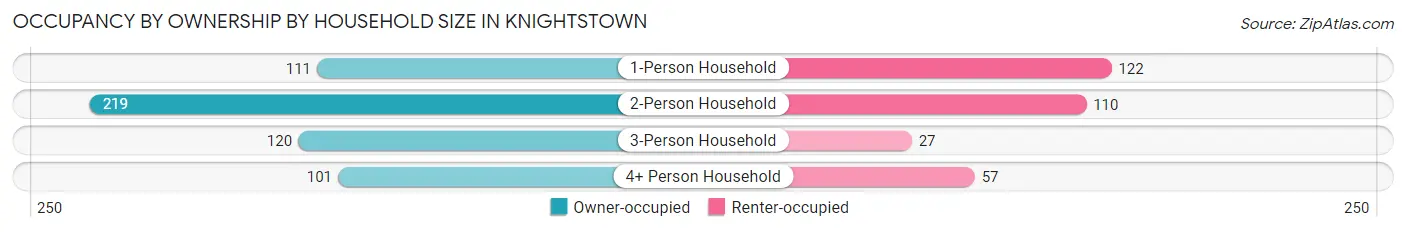
| Household Size | Owner-occupied | Renter-occupied |
| 1-Person Household | 111 (47.6%) | 122 (52.4%) |
| 2-Person Household | 219 (66.6%) | 110 (33.4%) |
| 3-Person Household | 120 (81.6%) | 27 (18.4%) |
| 4+ Person Household | 101 (63.9%) | 57 (36.1%) |
| Total Housing Units | 551 (63.5%) | 316 (36.4%) |
Occupancy by Educational Attainment in Knightstown
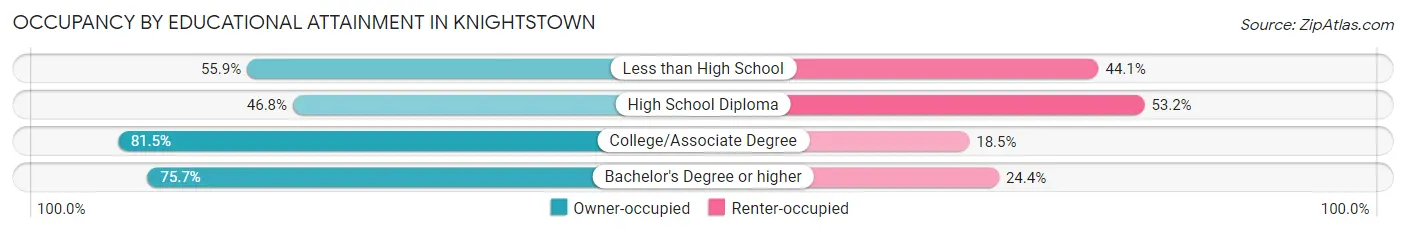
| Household Size | Owner-occupied | Renter-occupied |
| Less than High School | 52 (55.9%) | 41 (44.1%) |
| High School Diploma | 169 (46.8%) | 192 (53.2%) |
| College/Associate Degree | 243 (81.5%) | 55 (18.5%) |
| Bachelor's Degree or higher | 87 (75.6%) | 28 (24.3%) |
Occupancy by Age of Householder in Knightstown
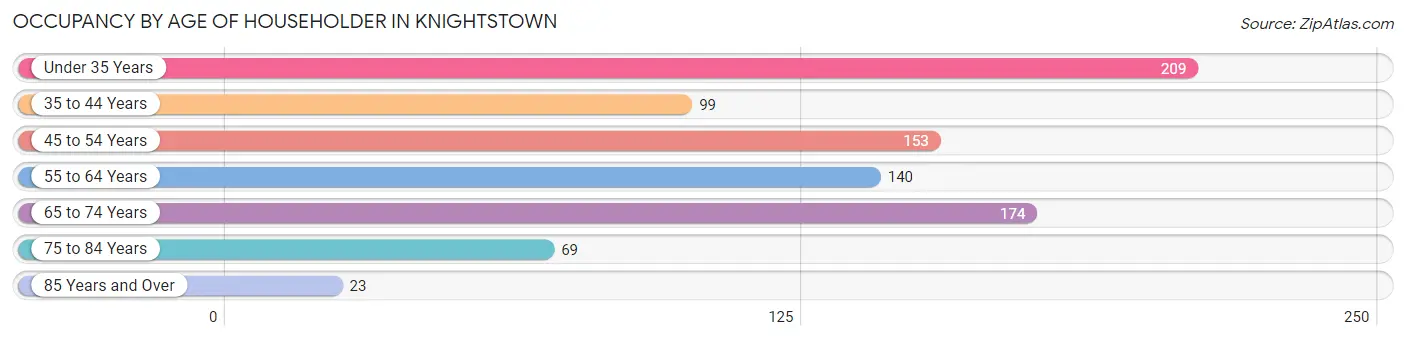
| Age Bracket | # Households | % Households |
| Under 35 Years | 209 | 24.1% |
| 35 to 44 Years | 99 | 11.4% |
| 45 to 54 Years | 153 | 17.6% |
| 55 to 64 Years | 140 | 16.2% |
| 65 to 74 Years | 174 | 20.1% |
| 75 to 84 Years | 69 | 8.0% |
| 85 Years and Over | 23 | 2.6% |
| Total | 867 | 100.0% |
Housing Finances in Knightstown
Median Income by Occupancy in Knightstown
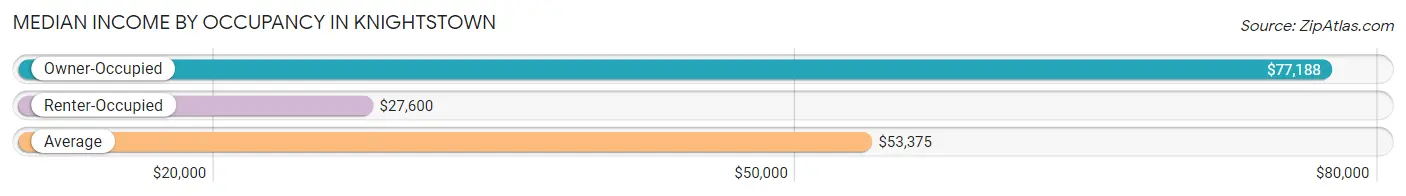
| Occupancy Type | # Households | Median Income |
| Owner-Occupied | 551 (63.5%) | $77,188 |
| Renter-Occupied | 316 (36.4%) | $27,600 |
| Average | 867 (100.0%) | $53,375 |
Occupancy by Householder Income Bracket in Knightstown
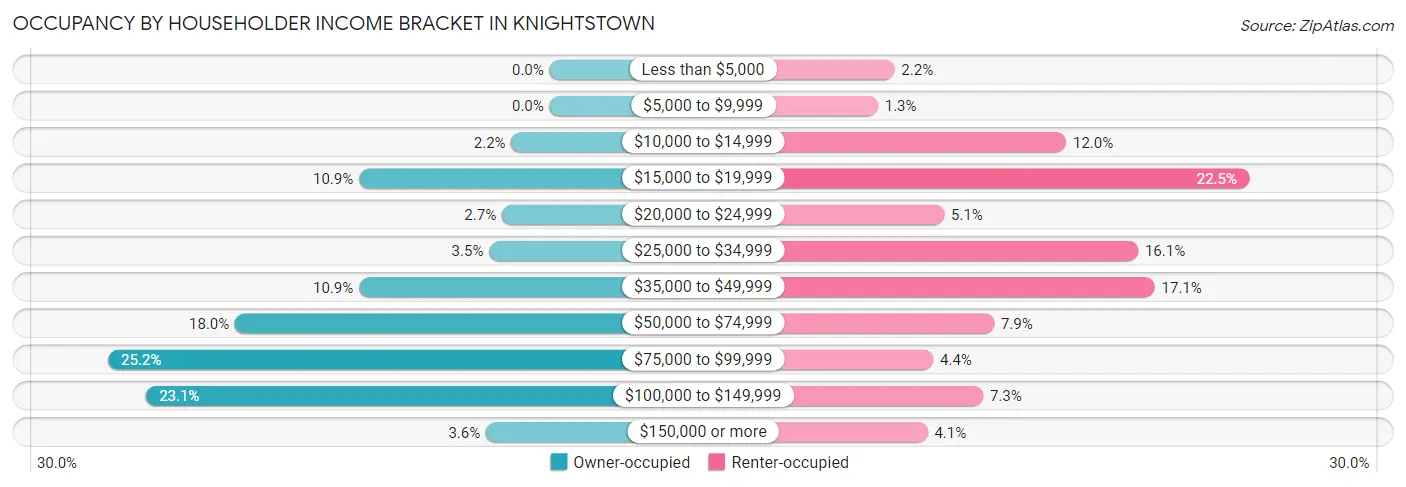
| Income Bracket | Owner-occupied | Renter-occupied |
| Less than $5,000 | 0 (0.0%) | 7 (2.2%) |
| $5,000 to $9,999 | 0 (0.0%) | 4 (1.3%) |
| $10,000 to $14,999 | 12 (2.2%) | 38 (12.0%) |
| $15,000 to $19,999 | 60 (10.9%) | 71 (22.5%) |
| $20,000 to $24,999 | 15 (2.7%) | 16 (5.1%) |
| $25,000 to $34,999 | 19 (3.5%) | 51 (16.1%) |
| $35,000 to $49,999 | 60 (10.9%) | 54 (17.1%) |
| $50,000 to $74,999 | 99 (18.0%) | 25 (7.9%) |
| $75,000 to $99,999 | 139 (25.2%) | 14 (4.4%) |
| $100,000 to $149,999 | 127 (23.1%) | 23 (7.3%) |
| $150,000 or more | 20 (3.6%) | 13 (4.1%) |
| Total | 551 (100.0%) | 316 (100.0%) |
Monthly Housing Cost Tiers in Knightstown
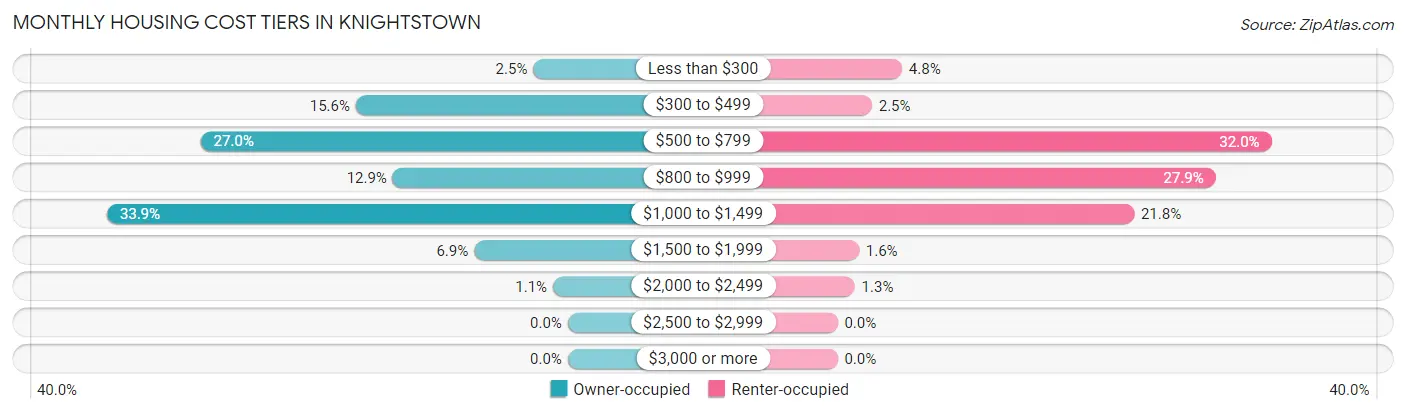
| Monthly Cost | Owner-occupied | Renter-occupied |
| Less than $300 | 14 (2.5%) | 15 (4.8%) |
| $300 to $499 | 86 (15.6%) | 8 (2.5%) |
| $500 to $799 | 149 (27.0%) | 101 (32.0%) |
| $800 to $999 | 71 (12.9%) | 88 (27.9%) |
| $1,000 to $1,499 | 187 (33.9%) | 69 (21.8%) |
| $1,500 to $1,999 | 38 (6.9%) | 5 (1.6%) |
| $2,000 to $2,499 | 6 (1.1%) | 4 (1.3%) |
| $2,500 to $2,999 | 0 (0.0%) | 0 (0.0%) |
| $3,000 or more | 0 (0.0%) | 0 (0.0%) |
| Total | 551 (100.0%) | 316 (100.0%) |
Physical Housing Characteristics in Knightstown
Housing Structures in Knightstown
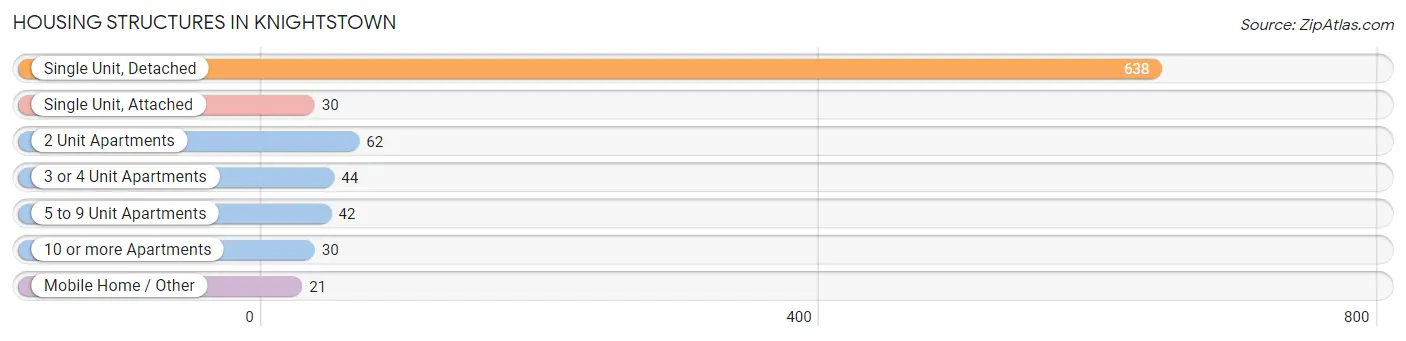
| Structure Type | # Housing Units | % Housing Units |
| Single Unit, Detached | 638 | 73.6% |
| Single Unit, Attached | 30 | 3.5% |
| 2 Unit Apartments | 62 | 7.1% |
| 3 or 4 Unit Apartments | 44 | 5.1% |
| 5 to 9 Unit Apartments | 42 | 4.8% |
| 10 or more Apartments | 30 | 3.5% |
| Mobile Home / Other | 21 | 2.4% |
| Total | 867 | 100.0% |
Housing Structures by Occupancy in Knightstown
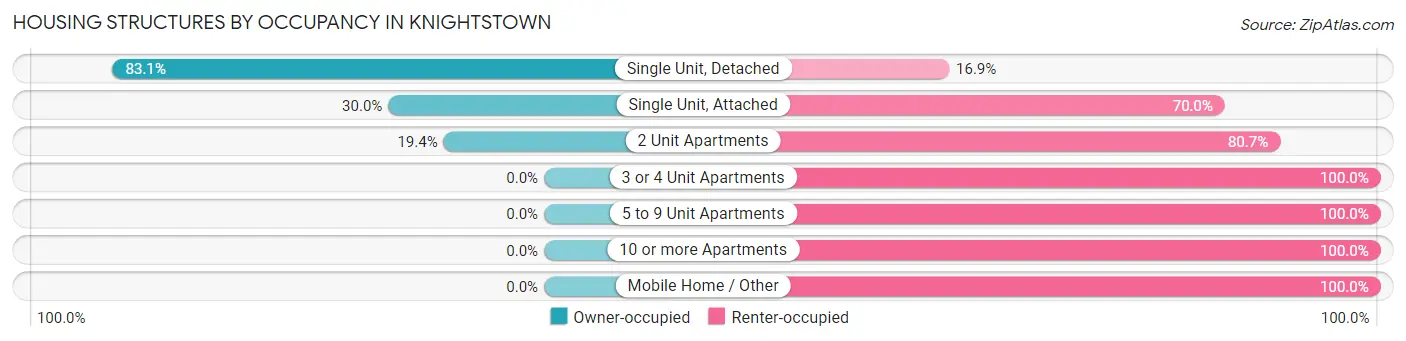
| Structure Type | Owner-occupied | Renter-occupied |
| Single Unit, Detached | 530 (83.1%) | 108 (16.9%) |
| Single Unit, Attached | 9 (30.0%) | 21 (70.0%) |
| 2 Unit Apartments | 12 (19.4%) | 50 (80.6%) |
| 3 or 4 Unit Apartments | 0 (0.0%) | 44 (100.0%) |
| 5 to 9 Unit Apartments | 0 (0.0%) | 42 (100.0%) |
| 10 or more Apartments | 0 (0.0%) | 30 (100.0%) |
| Mobile Home / Other | 0 (0.0%) | 21 (100.0%) |
| Total | 551 (63.5%) | 316 (36.4%) |
Housing Structures by Number of Rooms in Knightstown
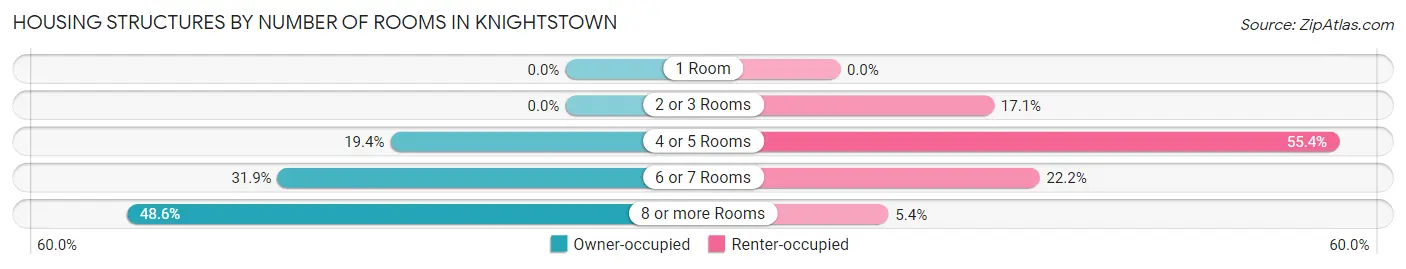
| Number of Rooms | Owner-occupied | Renter-occupied |
| 1 Room | 0 (0.0%) | 0 (0.0%) |
| 2 or 3 Rooms | 0 (0.0%) | 54 (17.1%) |
| 4 or 5 Rooms | 107 (19.4%) | 175 (55.4%) |
| 6 or 7 Rooms | 176 (31.9%) | 70 (22.2%) |
| 8 or more Rooms | 268 (48.6%) | 17 (5.4%) |
| Total | 551 (100.0%) | 316 (100.0%) |
Housing Structure by Heating Type in Knightstown
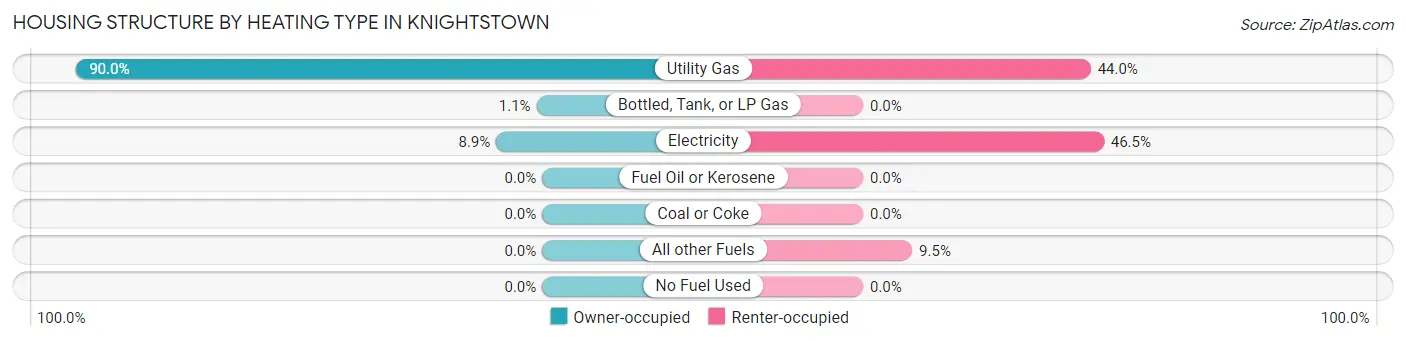
| Heating Type | Owner-occupied | Renter-occupied |
| Utility Gas | 496 (90.0%) | 139 (44.0%) |
| Bottled, Tank, or LP Gas | 6 (1.1%) | 0 (0.0%) |
| Electricity | 49 (8.9%) | 147 (46.5%) |
| Fuel Oil or Kerosene | 0 (0.0%) | 0 (0.0%) |
| Coal or Coke | 0 (0.0%) | 0 (0.0%) |
| All other Fuels | 0 (0.0%) | 30 (9.5%) |
| No Fuel Used | 0 (0.0%) | 0 (0.0%) |
| Total | 551 (100.0%) | 316 (100.0%) |
Household Vehicle Usage in Knightstown
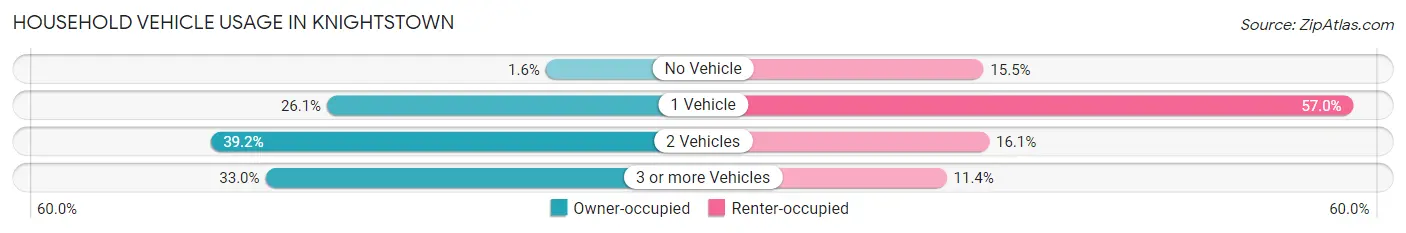
| Vehicles per Household | Owner-occupied | Renter-occupied |
| No Vehicle | 9 (1.6%) | 49 (15.5%) |
| 1 Vehicle | 144 (26.1%) | 180 (57.0%) |
| 2 Vehicles | 216 (39.2%) | 51 (16.1%) |
| 3 or more Vehicles | 182 (33.0%) | 36 (11.4%) |
| Total | 551 (100.0%) | 316 (100.0%) |
Real Estate & Mortgages in Knightstown
Real Estate and Mortgage Overview in Knightstown
| Characteristic | Without Mortgage | With Mortgage |
| Housing Units | 183 | 368 |
| Median Property Value | $104,900 | $110,100 |
| Median Household Income | $56,250 | $16 |
| Monthly Housing Costs | $512 | $0 |
| Real Estate Taxes | $1,063 | $0 |
Property Value by Mortgage Status in Knightstown
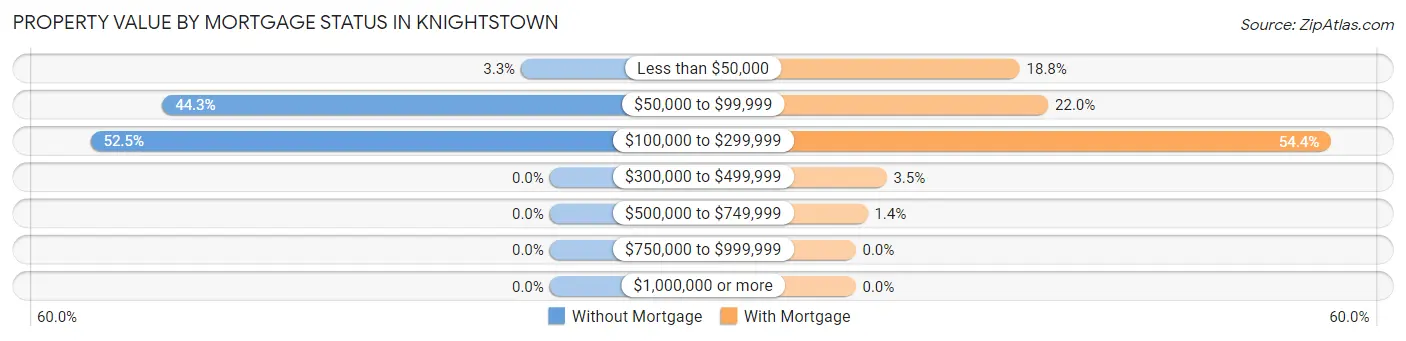
| Property Value | Without Mortgage | With Mortgage |
| Less than $50,000 | 6 (3.3%) | 69 (18.8%) |
| $50,000 to $99,999 | 81 (44.3%) | 81 (22.0%) |
| $100,000 to $299,999 | 96 (52.5%) | 200 (54.3%) |
| $300,000 to $499,999 | 0 (0.0%) | 13 (3.5%) |
| $500,000 to $749,999 | 0 (0.0%) | 5 (1.4%) |
| $750,000 to $999,999 | 0 (0.0%) | 0 (0.0%) |
| $1,000,000 or more | 0 (0.0%) | 0 (0.0%) |
| Total | 183 (100.0%) | 368 (100.0%) |
Household Income by Mortgage Status in Knightstown
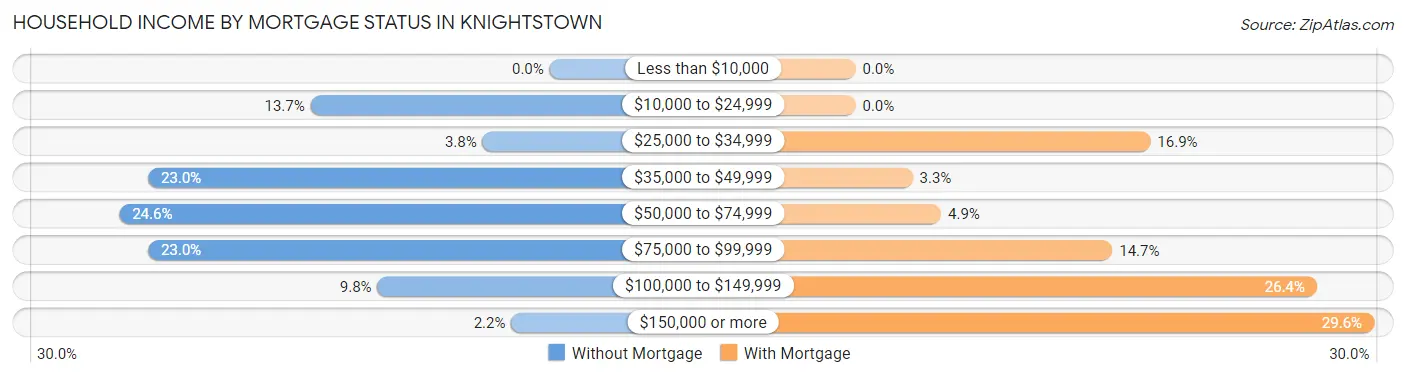
| Household Income | Without Mortgage | With Mortgage |
| Less than $10,000 | 0 (0.0%) | 0 (0.0%) |
| $10,000 to $24,999 | 25 (13.7%) | 0 (0.0%) |
| $25,000 to $34,999 | 7 (3.8%) | 62 (16.9%) |
| $35,000 to $49,999 | 42 (23.0%) | 12 (3.3%) |
| $50,000 to $74,999 | 45 (24.6%) | 18 (4.9%) |
| $75,000 to $99,999 | 42 (23.0%) | 54 (14.7%) |
| $100,000 to $149,999 | 18 (9.8%) | 97 (26.4%) |
| $150,000 or more | 4 (2.2%) | 109 (29.6%) |
| Total | 183 (100.0%) | 368 (100.0%) |
Property Value to Household Income Ratio in Knightstown
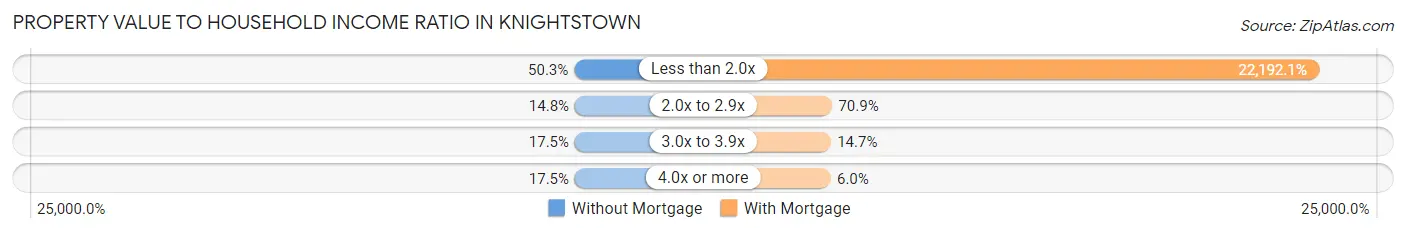
| Value-to-Income Ratio | Without Mortgage | With Mortgage |
| Less than 2.0x | 92 (50.3%) | 81,667 (22,192.1%) |
| 2.0x to 2.9x | 27 (14.7%) | 261 (70.9%) |
| 3.0x to 3.9x | 32 (17.5%) | 54 (14.7%) |
| 4.0x or more | 32 (17.5%) | 22 (6.0%) |
| Total | 183 (100.0%) | 368 (100.0%) |
Real Estate Taxes by Mortgage Status in Knightstown
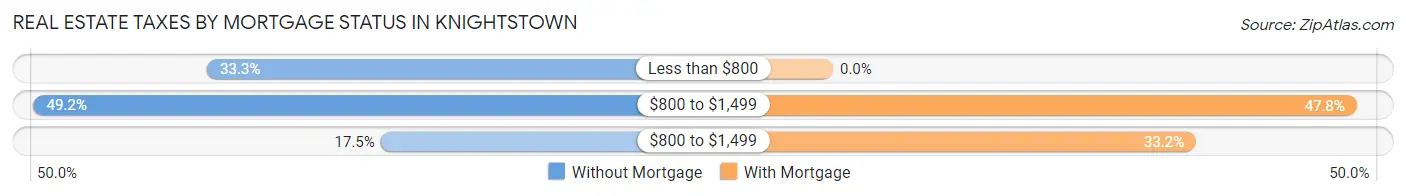
| Property Taxes | Without Mortgage | With Mortgage |
| Less than $800 | 61 (33.3%) | 0 (0.0%) |
| $800 to $1,499 | 90 (49.2%) | 176 (47.8%) |
| $800 to $1,499 | 32 (17.5%) | 122 (33.2%) |
| Total | 183 (100.0%) | 368 (100.0%) |
Health & Disability in Knightstown
Health Insurance Coverage by Age in Knightstown
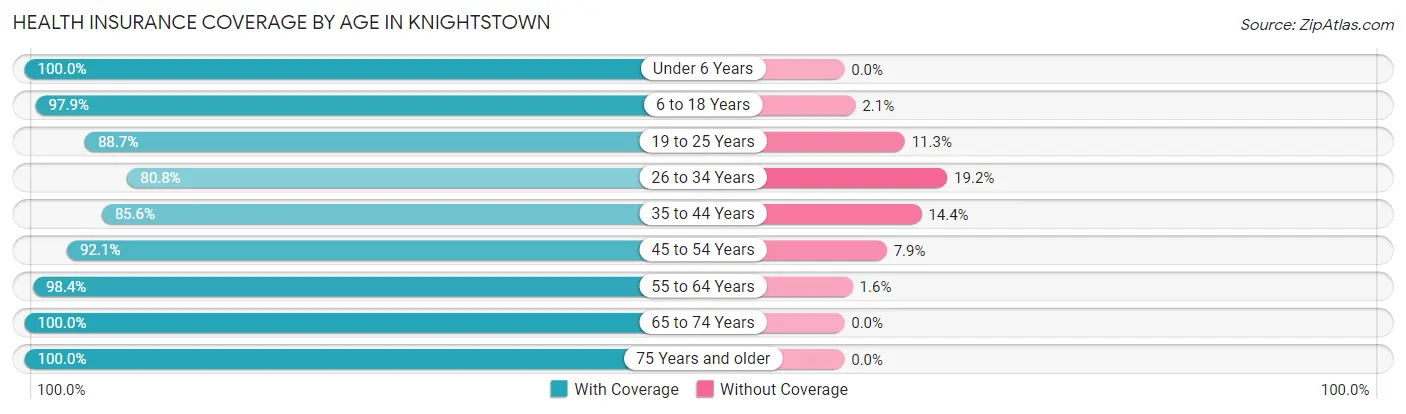
| Age Bracket | With Coverage | Without Coverage |
| Under 6 Years | 211 (100.0%) | 0 (0.0%) |
| 6 to 18 Years | 379 (97.9%) | 8 (2.1%) |
| 19 to 25 Years | 189 (88.7%) | 24 (11.3%) |
| 26 to 34 Years | 198 (80.8%) | 47 (19.2%) |
| 35 to 44 Years | 238 (85.6%) | 40 (14.4%) |
| 45 to 54 Years | 198 (92.1%) | 17 (7.9%) |
| 55 to 64 Years | 253 (98.4%) | 4 (1.6%) |
| 65 to 74 Years | 247 (100.0%) | 0 (0.0%) |
| 75 Years and older | 122 (100.0%) | 0 (0.0%) |
| Total | 2,035 (93.6%) | 140 (6.4%) |
Health Insurance Coverage by Citizenship Status in Knightstown
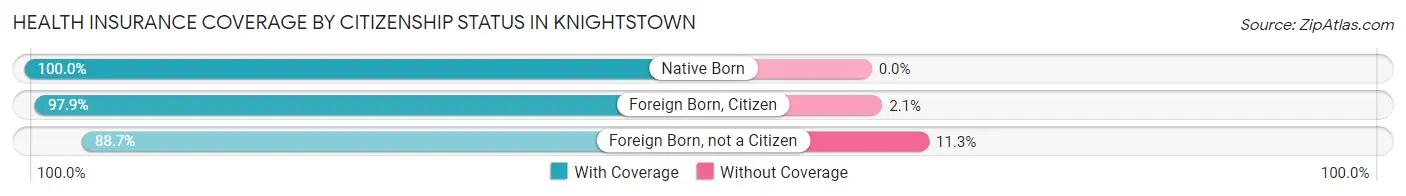
| Citizenship Status | With Coverage | Without Coverage |
| Native Born | 211 (100.0%) | 0 (0.0%) |
| Foreign Born, Citizen | 379 (97.9%) | 8 (2.1%) |
| Foreign Born, not a Citizen | 189 (88.7%) | 24 (11.3%) |
Health Insurance Coverage by Household Income in Knightstown
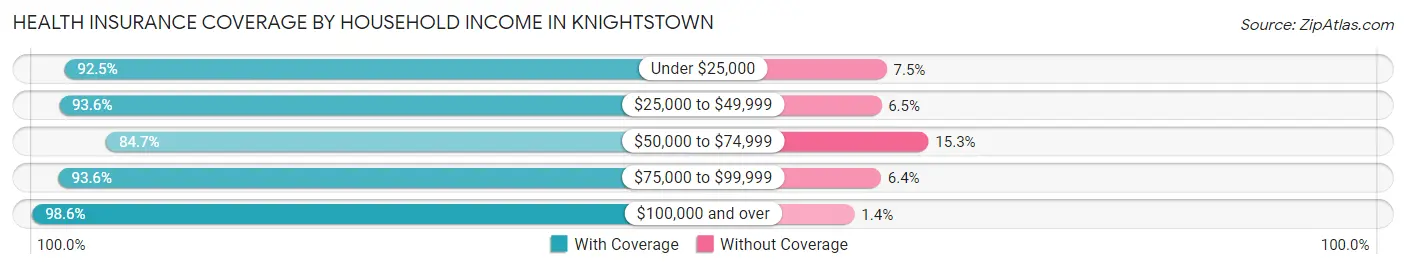
| Household Income | With Coverage | Without Coverage |
| Under $25,000 | 360 (92.5%) | 29 (7.5%) |
| $25,000 to $49,999 | 348 (93.5%) | 24 (6.5%) |
| $50,000 to $74,999 | 266 (84.7%) | 48 (15.3%) |
| $75,000 to $99,999 | 440 (93.6%) | 30 (6.4%) |
| $100,000 and over | 621 (98.6%) | 9 (1.4%) |
Public vs Private Health Insurance Coverage by Age in Knightstown
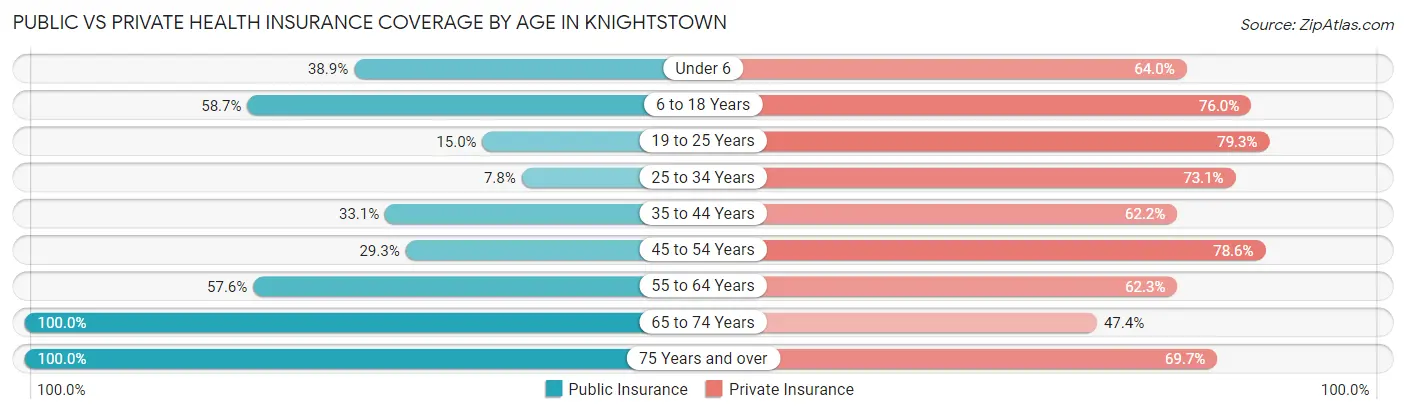
| Age Bracket | Public Insurance | Private Insurance |
| Under 6 | 82 (38.9%) | 135 (64.0%) |
| 6 to 18 Years | 227 (58.7%) | 294 (76.0%) |
| 19 to 25 Years | 32 (15.0%) | 169 (79.3%) |
| 25 to 34 Years | 19 (7.8%) | 179 (73.1%) |
| 35 to 44 Years | 92 (33.1%) | 173 (62.2%) |
| 45 to 54 Years | 63 (29.3%) | 169 (78.6%) |
| 55 to 64 Years | 148 (57.6%) | 160 (62.3%) |
| 65 to 74 Years | 247 (100.0%) | 117 (47.4%) |
| 75 Years and over | 122 (100.0%) | 85 (69.7%) |
| Total | 1,032 (47.4%) | 1,481 (68.1%) |
Disability Status by Sex by Age in Knightstown
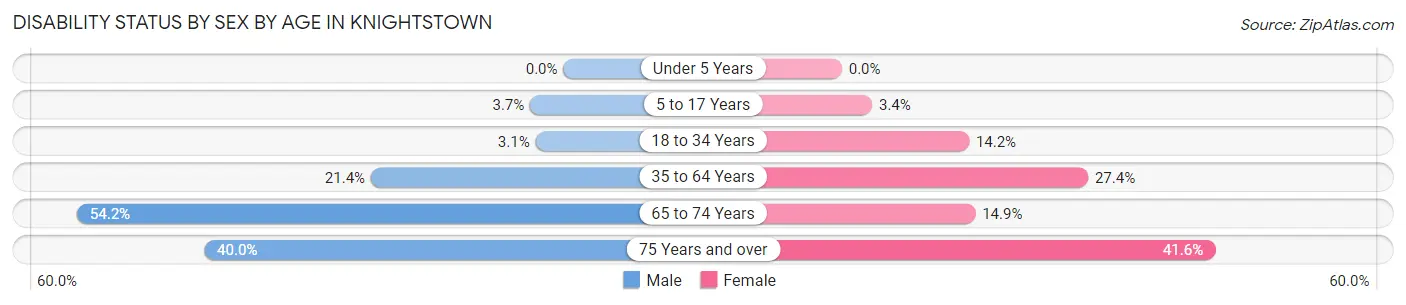
| Age Bracket | Male | Female |
| Under 5 Years | 0 (0.0%) | 0 (0.0%) |
| 5 to 17 Years | 10 (3.7%) | 3 (3.4%) |
| 18 to 34 Years | 9 (3.1%) | 32 (14.2%) |
| 35 to 64 Years | 81 (21.4%) | 102 (27.4%) |
| 65 to 74 Years | 39 (54.2%) | 26 (14.9%) |
| 75 Years and over | 18 (40.0%) | 32 (41.6%) |
Disability Class by Sex by Age in Knightstown
Disability Class: Hearing Difficulty
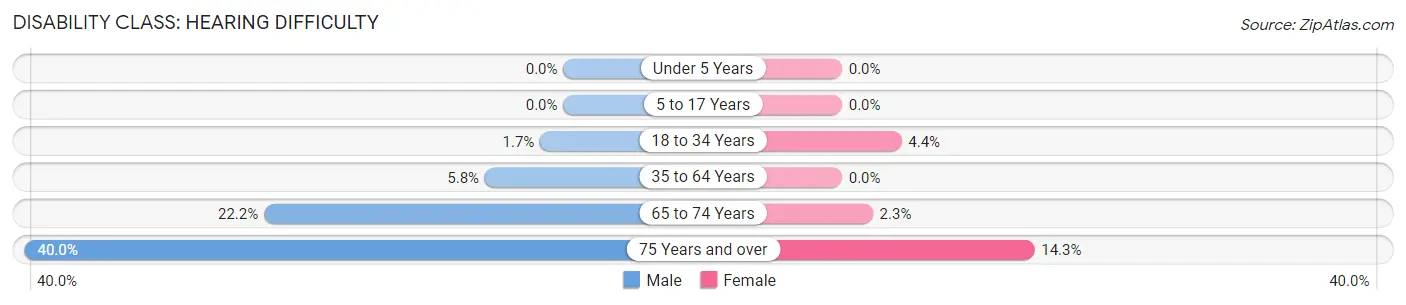
| Age Bracket | Male | Female |
| Under 5 Years | 0 (0.0%) | 0 (0.0%) |
| 5 to 17 Years | 0 (0.0%) | 0 (0.0%) |
| 18 to 34 Years | 5 (1.7%) | 10 (4.4%) |
| 35 to 64 Years | 22 (5.8%) | 0 (0.0%) |
| 65 to 74 Years | 16 (22.2%) | 4 (2.3%) |
| 75 Years and over | 18 (40.0%) | 11 (14.3%) |
Disability Class: Vision Difficulty
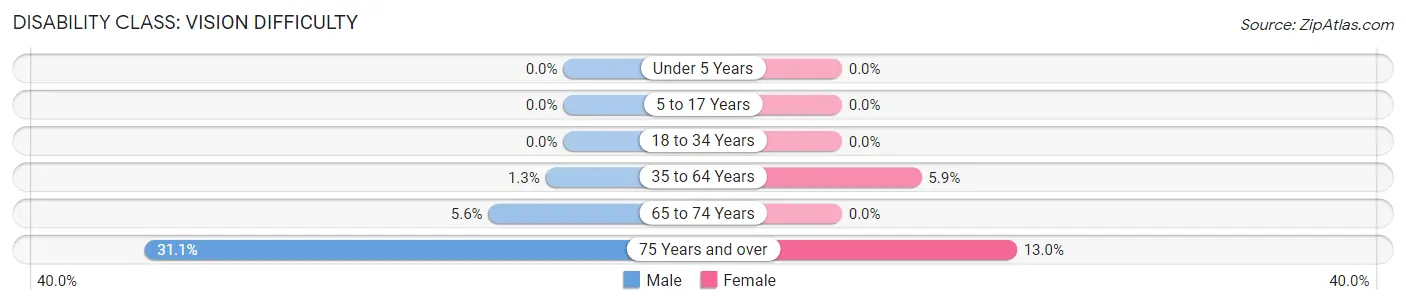
| Age Bracket | Male | Female |
| Under 5 Years | 0 (0.0%) | 0 (0.0%) |
| 5 to 17 Years | 0 (0.0%) | 0 (0.0%) |
| 18 to 34 Years | 0 (0.0%) | 0 (0.0%) |
| 35 to 64 Years | 5 (1.3%) | 22 (5.9%) |
| 65 to 74 Years | 4 (5.6%) | 0 (0.0%) |
| 75 Years and over | 14 (31.1%) | 10 (13.0%) |
Disability Class: Cognitive Difficulty
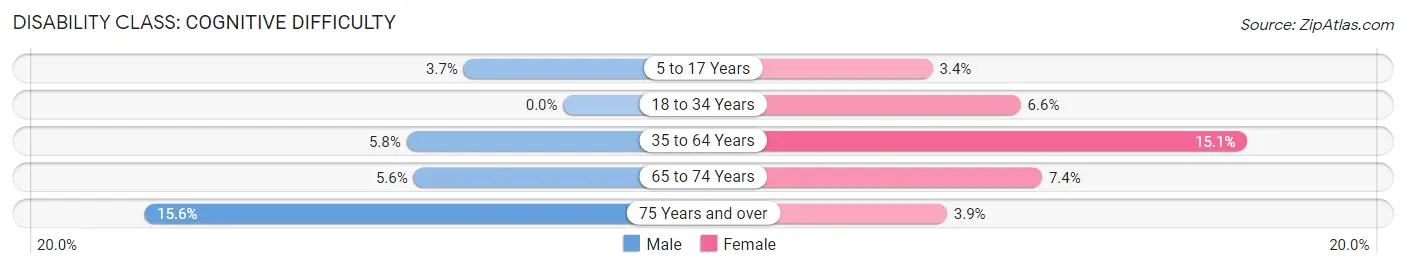
| Age Bracket | Male | Female |
| 5 to 17 Years | 10 (3.7%) | 3 (3.4%) |
| 18 to 34 Years | 0 (0.0%) | 15 (6.6%) |
| 35 to 64 Years | 22 (5.8%) | 56 (15.0%) |
| 65 to 74 Years | 4 (5.6%) | 13 (7.4%) |
| 75 Years and over | 7 (15.6%) | 3 (3.9%) |
Disability Class: Ambulatory Difficulty
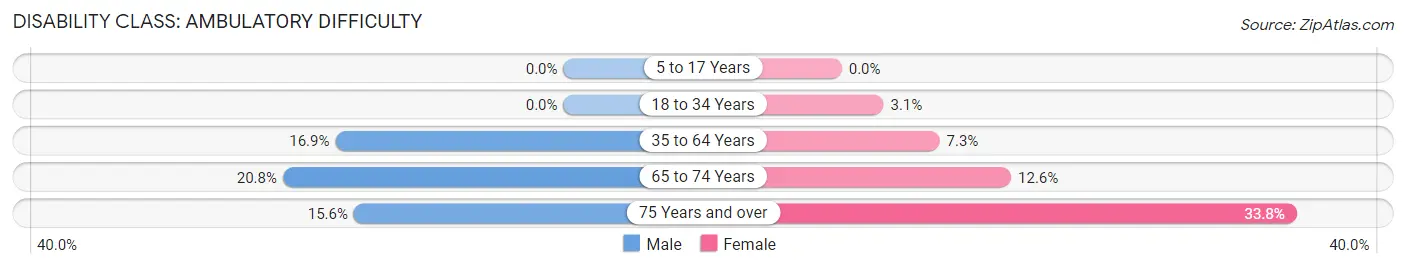
| Age Bracket | Male | Female |
| 5 to 17 Years | 0 (0.0%) | 0 (0.0%) |
| 18 to 34 Years | 0 (0.0%) | 7 (3.1%) |
| 35 to 64 Years | 64 (16.9%) | 27 (7.3%) |
| 65 to 74 Years | 15 (20.8%) | 22 (12.6%) |
| 75 Years and over | 7 (15.6%) | 26 (33.8%) |
Disability Class: Self-Care Difficulty
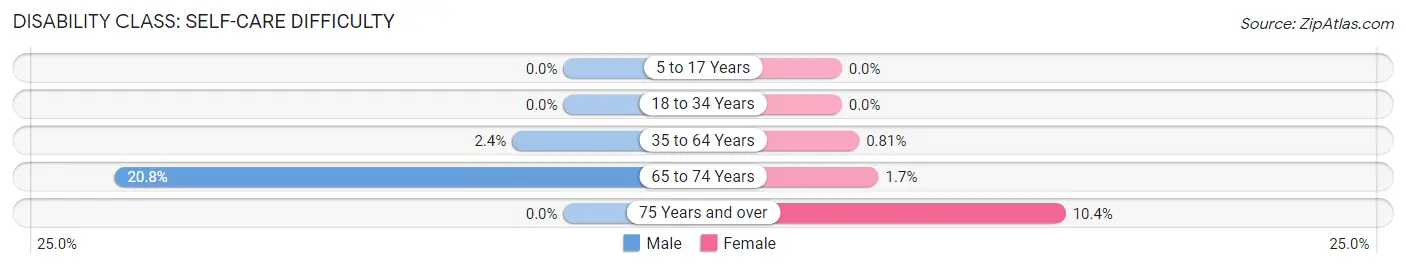
| Age Bracket | Male | Female |
| 5 to 17 Years | 0 (0.0%) | 0 (0.0%) |
| 18 to 34 Years | 0 (0.0%) | 0 (0.0%) |
| 35 to 64 Years | 9 (2.4%) | 3 (0.8%) |
| 65 to 74 Years | 15 (20.8%) | 3 (1.7%) |
| 75 Years and over | 0 (0.0%) | 8 (10.4%) |
Technology Access in Knightstown
Computing Device Access in Knightstown
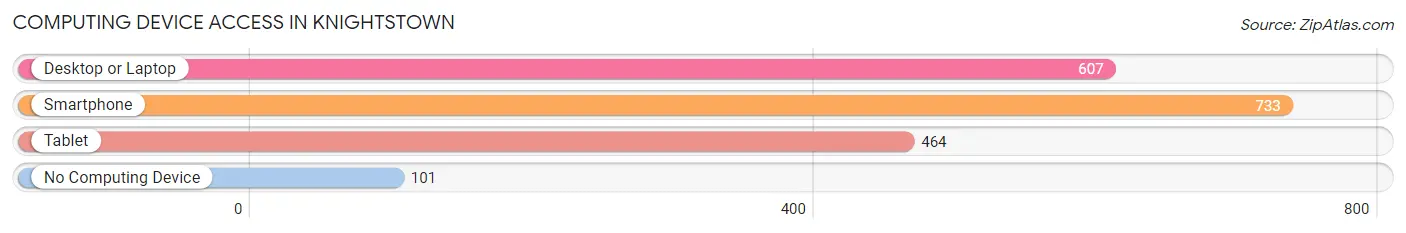
| Device Type | # Households | % Households |
| Desktop or Laptop | 607 | 70.0% |
| Smartphone | 733 | 84.5% |
| Tablet | 464 | 53.5% |
| No Computing Device | 101 | 11.7% |
| Total | 867 | 100.0% |
Internet Access in Knightstown
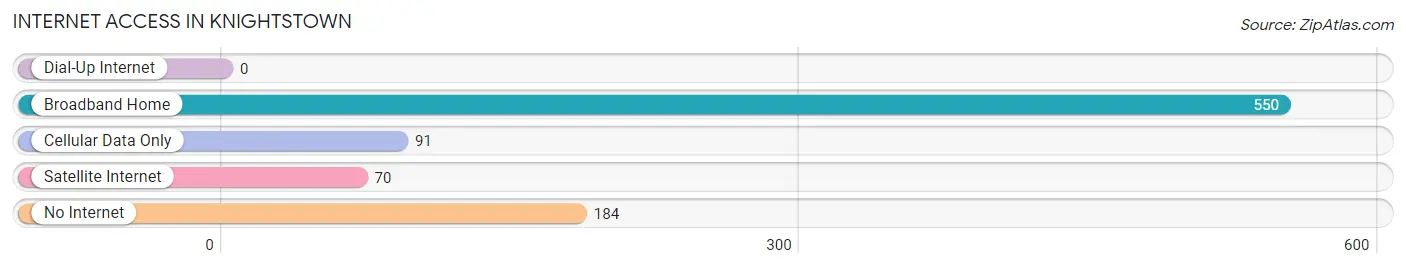
| Internet Type | # Households | % Households |
| Dial-Up Internet | 0 | 0.0% |
| Broadband Home | 550 | 63.4% |
| Cellular Data Only | 91 | 10.5% |
| Satellite Internet | 70 | 8.1% |
| No Internet | 184 | 21.2% |
| Total | 867 | 100.0% |
Knightstown Summary
Knightstown, Indiana is a small town located in Henry County, Indiana. It is situated in the east central part of the state, about 25 miles east of Indianapolis. The town was founded in 1836 and was named after William Knight, a local landowner. As of the 2010 census, the population of Knightstown was 2,080.
History
The area that is now Knightstown was first settled in the early 1800s by a group of Quakers from North Carolina. The town was officially founded in 1836 and was named after William Knight, a local landowner. The town was incorporated in 1845 and was the first town in Henry County to be incorporated.
In the late 1800s, Knightstown was a thriving agricultural community. The town was home to several mills, including a flour mill, a saw mill, and a woolen mill. The town also had a number of stores, including a general store, a drug store, and a hardware store.
In the early 1900s, Knightstown began to experience a decline in population as many of its residents moved to larger cities in search of better job opportunities. The town was also affected by the Great Depression, which caused many businesses to close.
In the 1950s, Knightstown experienced a resurgence in population as many people moved back to the town in search of a quieter lifestyle. The town was also home to a number of manufacturing plants, including a furniture factory and a canning factory.
Geography
Knightstown is located in east central Indiana, about 25 miles east of Indianapolis. The town is situated in the Blue River Valley, which is part of the Central Till Plains region of Indiana. The town is surrounded by rolling hills and farmland.
The climate in Knightstown is typical of the Midwest, with hot summers and cold winters. The average temperature in the summer is around 80 degrees Fahrenheit, while the average temperature in the winter is around 30 degrees Fahrenheit.
Economy
The economy of Knightstown is largely based on agriculture and manufacturing. The town is home to several farms, which produce a variety of crops, including corn, soybeans, and wheat. The town is also home to a number of manufacturing plants, including a furniture factory and a canning factory.
The town is also home to a number of small businesses, including restaurants, shops, and service providers. The town is also home to a number of antique stores, which attract visitors from all over the state.
Demographics
As of the 2010 census, the population of Knightstown was 2,080. The racial makeup of the town was 97.3% White, 0.7% African American, 0.2% Native American, 0.2% Asian, 0.2% from other races, and 1.6% from two or more races. Hispanic or Latino of any race were 0.7% of the population.
The median household income in Knightstown was $41,250, and the median family income was $50,000. The per capita income in the town was $20,845. About 11.2% of the population was below the poverty line.
Conclusion
Knightstown, Indiana is a small town located in Henry County, Indiana. It is situated in the east central part of the state, about 25 miles east of Indianapolis. The town was founded in 1836 and was named after William Knight, a local landowner. As of the 2010 census, the population of Knightstown was 2,080. The economy of Knightstown is largely based on agriculture and manufacturing, and the town is home to a number of small businesses. The racial makeup of the town was 97.3% White, 0.7% African American, 0.2% Native American, 0.2% Asian, 0.2% from other races, and 1.6% from two or more races. The median household income in Knightstown was $41,250, and the median family income was $50,000.
Common Questions
What is Per Capita Income in Knightstown?
Per Capita income in Knightstown is $28,443.
What is the Median Family Income in Knightstown?
Median Family Income in Knightstown is $78,287.
What is the Median Household income in Knightstown?
Median Household Income in Knightstown is $53,375.
What is Income or Wage Gap in Knightstown?
Income or Wage Gap in Knightstown is 21.6%.
Women in Knightstown earn 78.4 cents for every dollar earned by a man.
What is Inequality or Gini Index in Knightstown?
Inequality or Gini Index in Knightstown is 0.44.
What is the Total Population of Knightstown?
Total Population of Knightstown is 2,175.
What is the Total Male Population of Knightstown?
Total Male Population of Knightstown is 1,156.
What is the Total Female Population of Knightstown?
Total Female Population of Knightstown is 1,019.
What is the Ratio of Males per 100 Females in Knightstown?
There are 113.44 Males per 100 Females in Knightstown.
What is the Ratio of Females per 100 Males in Knightstown?
There are 88.15 Females per 100 Males in Knightstown.
What is the Median Population Age in Knightstown?
Median Population Age in Knightstown is 35.8 Years.
What is the Average Family Size in Knightstown
Average Family Size in Knightstown is 3.0 People.
What is the Average Household Size in Knightstown
Average Household Size in Knightstown is 2.5 People.
How Large is the Labor Force in Knightstown?
There are 1,074 People in the Labor Forcein in Knightstown.
What is the Percentage of People in the Labor Force in Knightstown?
63.3% of People are in the Labor Force in Knightstown.
What is the Unemployment Rate in Knightstown?
Unemployment Rate in Knightstown is 7.1%.