Cicero, IN Map & Demographics
Cicero Map
Cicero Overview
$40,385
PER CAPITA INCOME
$70,444
AVG FAMILY INCOME
$63,288
AVG HOUSEHOLD INCOME
47.9%
WAGE / INCOME GAP [ % ]
52.1¢/ $1
WAGE / INCOME GAP [ $ ]
0.49
INEQUALITY / GINI INDEX
5,356
TOTAL POPULATION
2,741
MALE POPULATION
2,615
FEMALE POPULATION
104.82
MALES / 100 FEMALES
95.40
FEMALES / 100 MALES
43.7
MEDIAN AGE
2.6
AVG FAMILY SIZE
2.3
AVG HOUSEHOLD SIZE
2,698
LABOR FORCE [ PEOPLE ]
63.7%
PERCENT IN LABOR FORCE
0.9%
UNEMPLOYMENT RATE
Cicero Zip Codes
Cicero Area Codes
Income in Cicero
Income Overview in Cicero
Per Capita Income in Cicero is $40,385, while median incomes of families and households are $70,444 and $63,288 respectively.
| Characteristic | Number | Measure |
| Per Capita Income | 5,356 | $40,385 |
| Median Family Income | 1,738 | $70,444 |
| Mean Family Income | 1,738 | $97,590 |
| Median Household Income | 2,313 | $63,288 |
| Mean Household Income | 2,313 | $93,082 |
| Income Deficit | 1,738 | $0 |
| Wage / Income Gap (%) | 5,356 | 47.87% |
| Wage / Income Gap ($) | 5,356 | 52.13¢ per $1 |
| Gini / Inequality Index | 5,356 | 0.49 |
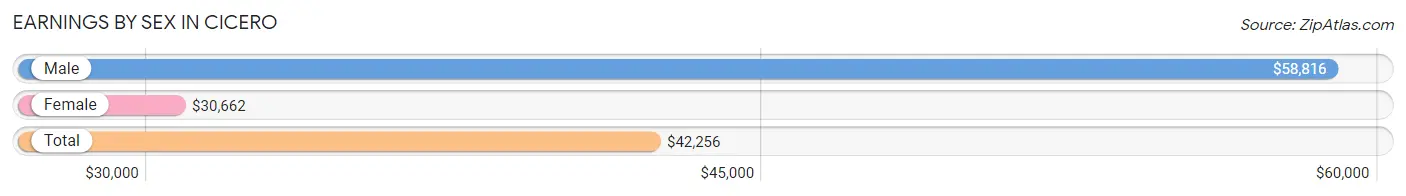
Earnings by Sex in Cicero
Average Earnings in Cicero are $42,256, $58,816 for men and $30,662 for women, a difference of 47.9%.
| Sex | Number | Average Earnings |
| Male | 1,351 (46.0%) | $58,816 |
| Female | 1,586 (54.0%) | $30,662 |
| Total | 2,937 (100.0%) | $42,256 |
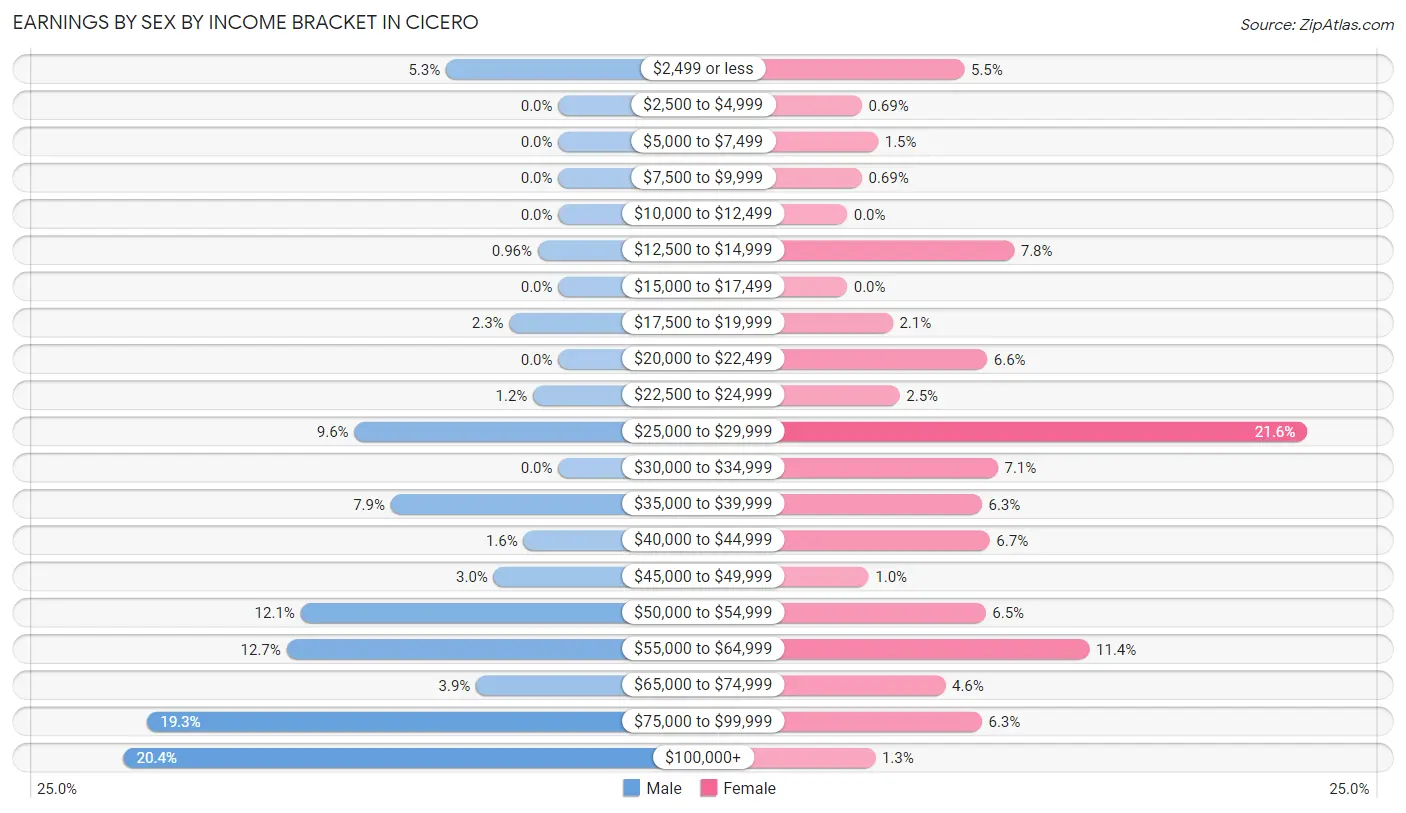
Earnings by Sex by Income Bracket in Cicero
The most common earnings brackets in Cicero are $100,000+ for men (275 | 20.4%) and $25,000 to $29,999 for women (342 | 21.6%).
| Income | Male | Female |
| $2,499 or less | 71 (5.3%) | 87 (5.5%) |
| $2,500 to $4,999 | 0 (0.0%) | 11 (0.7%) |
| $5,000 to $7,499 | 0 (0.0%) | 23 (1.5%) |
| $7,500 to $9,999 | 0 (0.0%) | 11 (0.7%) |
| $10,000 to $12,499 | 0 (0.0%) | 0 (0.0%) |
| $12,500 to $14,999 | 13 (1.0%) | 124 (7.8%) |
| $15,000 to $17,499 | 0 (0.0%) | 0 (0.0%) |
| $17,500 to $19,999 | 31 (2.3%) | 34 (2.1%) |
| $20,000 to $22,499 | 0 (0.0%) | 104 (6.6%) |
| $22,500 to $24,999 | 16 (1.2%) | 39 (2.5%) |
| $25,000 to $29,999 | 129 (9.6%) | 342 (21.6%) |
| $30,000 to $34,999 | 0 (0.0%) | 112 (7.1%) |
| $35,000 to $39,999 | 106 (7.9%) | 100 (6.3%) |
| $40,000 to $44,999 | 22 (1.6%) | 106 (6.7%) |
| $45,000 to $49,999 | 41 (3.0%) | 16 (1.0%) |
| $50,000 to $54,999 | 163 (12.1%) | 103 (6.5%) |
| $55,000 to $64,999 | 172 (12.7%) | 180 (11.4%) |
| $65,000 to $74,999 | 52 (3.8%) | 73 (4.6%) |
| $75,000 to $99,999 | 260 (19.3%) | 100 (6.3%) |
| $100,000+ | 275 (20.4%) | 21 (1.3%) |
| Total | 1,351 (100.0%) | 1,586 (100.0%) |
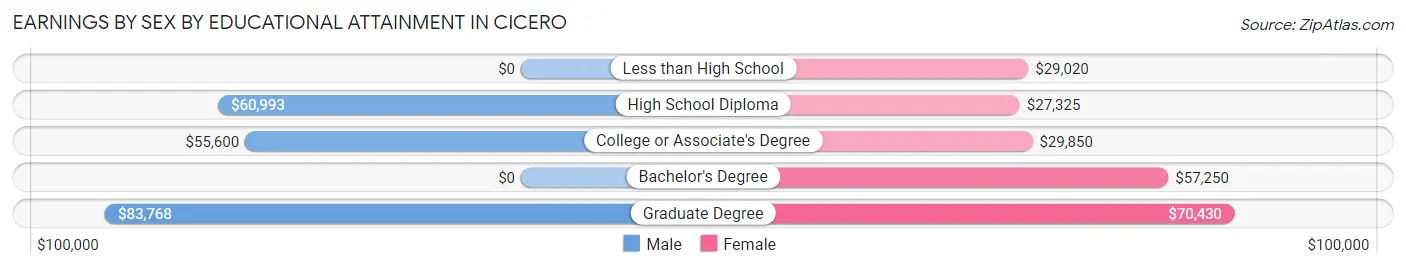
Earnings by Sex by Educational Attainment in Cicero
Average earnings in Cicero are $59,654 for men and $33,040 for women, a difference of 44.6%. Men with an educational attainment of graduate degree enjoy the highest average annual earnings of $83,768, while those with college or associate's degree education earn the least with $55,600. Women with an educational attainment of graduate degree earn the most with the average annual earnings of $70,430, while those with high school diploma education have the smallest earnings of $27,325.
| Educational Attainment | Male Income | Female Income |
| Less than High School | - | - |
| High School Diploma | $60,993 | $27,325 |
| College or Associate's Degree | $55,600 | $29,850 |
| Bachelor's Degree | - | - |
| Graduate Degree | $83,768 | $70,430 |
| Total | $59,654 | $33,040 |
Family Income in Cicero
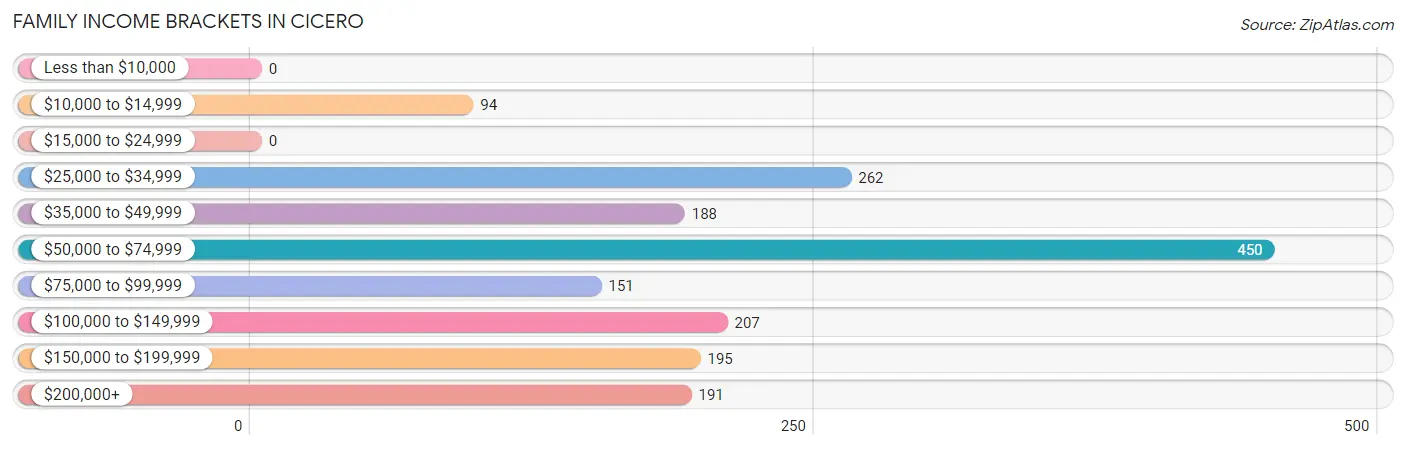
Family Income Brackets in Cicero
According to the Cicero family income data, there are 450 families falling into the $50,000 to $74,999 income range, which is the most common income bracket and makes up 25.9% of all families.
| Income Bracket | # Families | % Families |
| Less than $10,000 | 0 | 0.0% |
| $10,000 to $14,999 | 94 | 5.4% |
| $15,000 to $24,999 | 0 | 0.0% |
| $25,000 to $34,999 | 262 | 15.1% |
| $35,000 to $49,999 | 188 | 10.8% |
| $50,000 to $74,999 | 450 | 25.9% |
| $75,000 to $99,999 | 151 | 8.7% |
| $100,000 to $149,999 | 207 | 11.9% |
| $150,000 to $199,999 | 195 | 11.2% |
| $200,000+ | 191 | 11.0% |
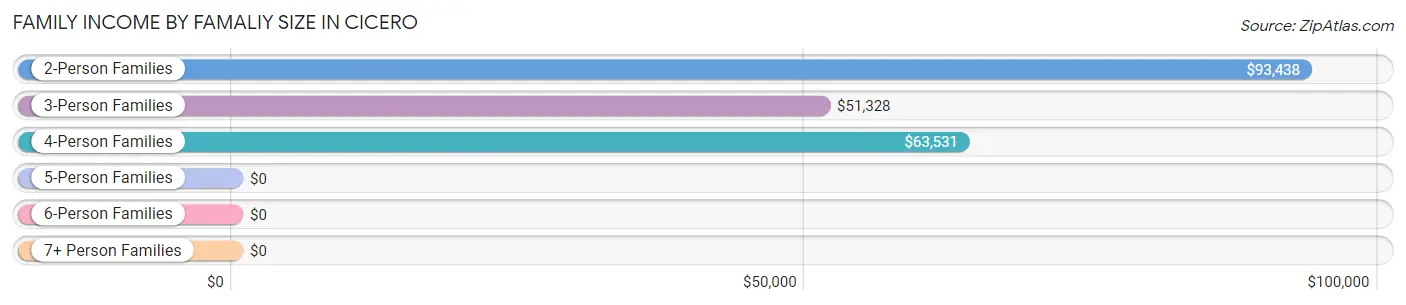
Family Income by Famaliy Size in Cicero
2-person families (914 | 52.6%) account for the highest median family income in Cicero with $93,438 per family, while 2-person families (914 | 52.6%) have the highest median income of $46,719 per family member.
| Income Bracket | # Families | Median Income |
| 2-Person Families | 914 (52.6%) | $93,438 |
| 3-Person Families | 577 (33.2%) | $51,328 |
| 4-Person Families | 161 (9.3%) | $63,531 |
| 5-Person Families | 86 (5.0%) | $0 |
| 6-Person Families | 0 (0.0%) | $0 |
| 7+ Person Families | 0 (0.0%) | $0 |
| Total | 1,738 (100.0%) | $70,444 |
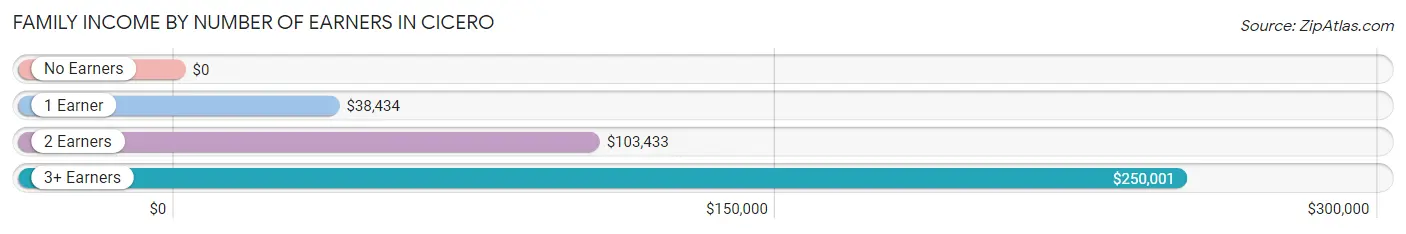
Family Income by Number of Earners in Cicero
| Number of Earners | # Families | Median Income |
| No Earners | 194 (11.2%) | $0 |
| 1 Earner | 677 (39.0%) | $38,434 |
| 2 Earners | 793 (45.6%) | $103,433 |
| 3+ Earners | 74 (4.3%) | $250,001 |
| Total | 1,738 (100.0%) | $70,444 |
Household Income in Cicero
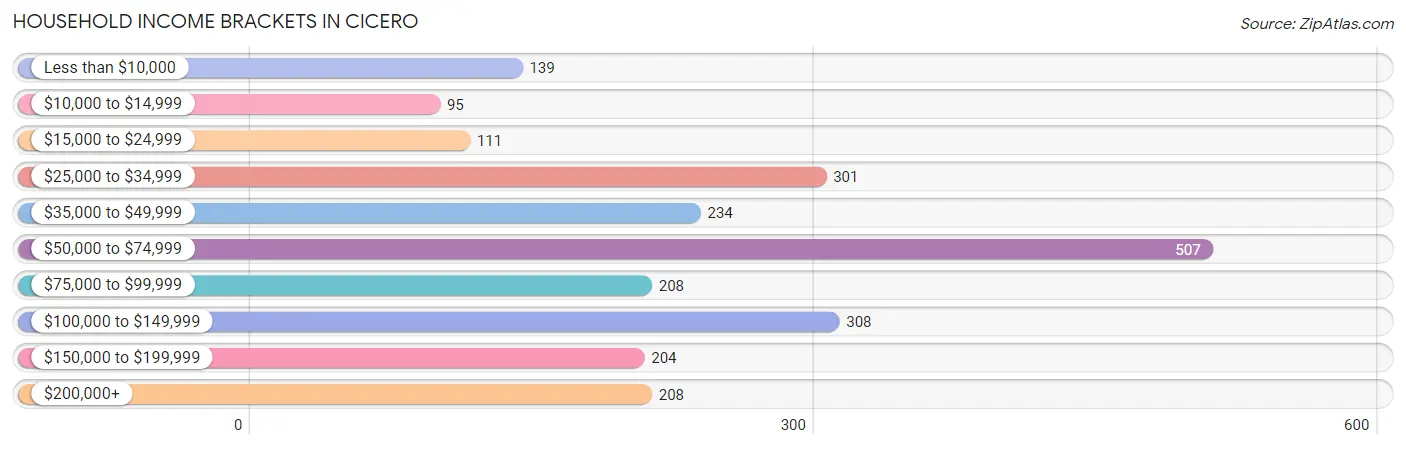
Household Income Brackets in Cicero
With 507 households falling in the category, the $50,000 to $74,999 income range is the most frequent in Cicero, accounting for 21.9% of all households. In contrast, only 95 households (4.1%) fall into the $10,000 to $14,999 income bracket, making it the least populous group.
| Income Bracket | # Households | % Households |
| Less than $10,000 | 139 | 6.0% |
| $10,000 to $14,999 | 95 | 4.1% |
| $15,000 to $24,999 | 111 | 4.8% |
| $25,000 to $34,999 | 301 | 13.0% |
| $35,000 to $49,999 | 234 | 10.1% |
| $50,000 to $74,999 | 507 | 21.9% |
| $75,000 to $99,999 | 208 | 9.0% |
| $100,000 to $149,999 | 308 | 13.3% |
| $150,000 to $199,999 | 204 | 8.8% |
| $200,000+ | 208 | 9.0% |
Household Income by Householder Age in Cicero
The median household income in Cicero is $63,288, with the highest median household income of $68,846 found in the 45 to 64 years age bracket for the primary householder. A total of 1,118 households (48.3%) fall into this category. Meanwhile, the 15 to 24 years age bracket for the primary householder has the lowest median household income of $0, with 98 households (4.2%) in this group.
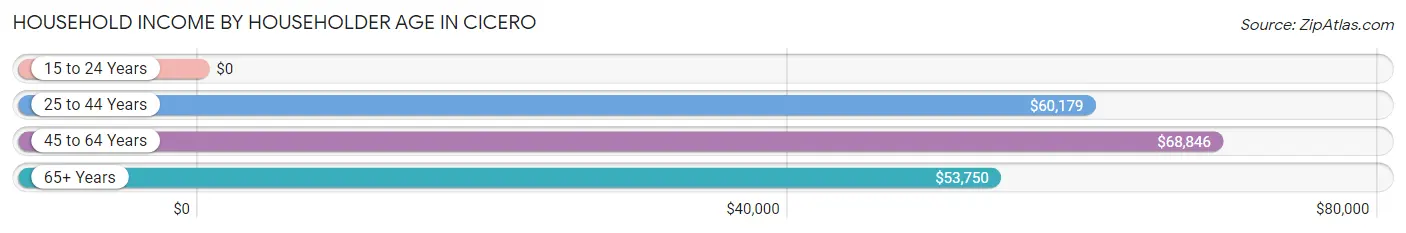
| Income Bracket | # Households | Median Income |
| 15 to 24 Years | 98 (4.2%) | $0 |
| 25 to 44 Years | 603 (26.1%) | $60,179 |
| 45 to 64 Years | 1,118 (48.3%) | $68,846 |
| 65+ Years | 494 (21.4%) | $53,750 |
| Total | 2,313 (100.0%) | $63,288 |
Poverty in Cicero
Income Below Poverty by Sex and Age in Cicero
With 9.3% poverty level for males and 11.4% for females among the residents of Cicero, 75 year old and over males and 18 to 24 year old females are the most vulnerable to poverty, with 55 males (41.7%) and 78 females (63.9%) in their respective age groups living below the poverty level.
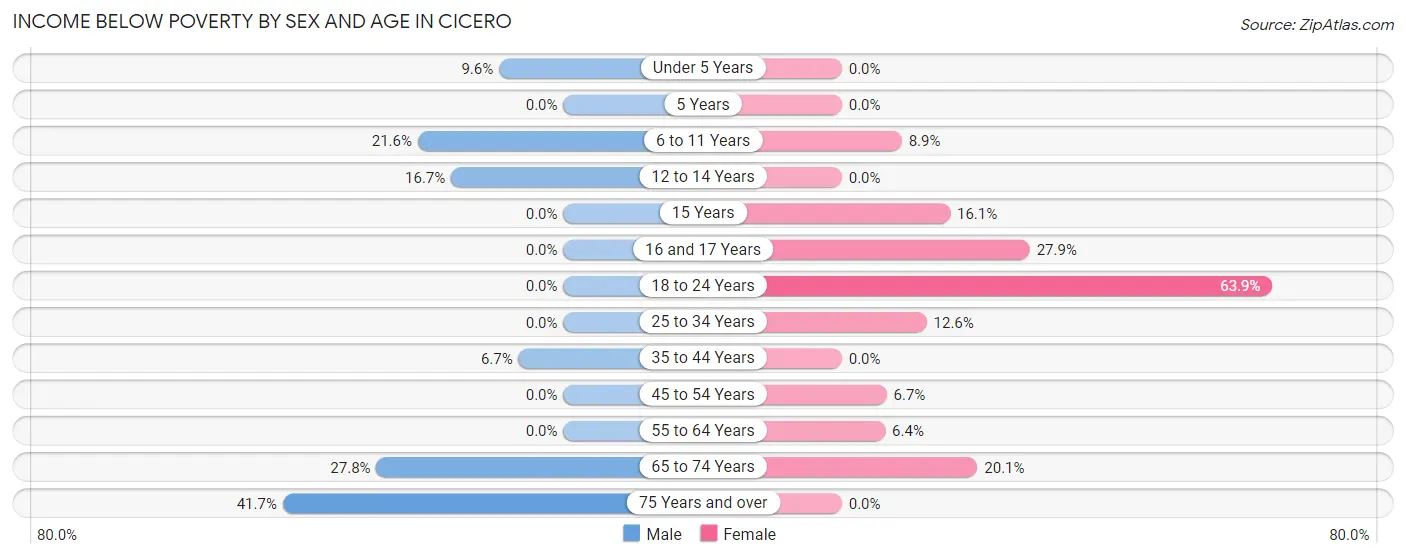
| Age Bracket | Male | Female |
| Under 5 Years | 17 (9.6%) | 0 (0.0%) |
| 5 Years | 0 (0.0%) | 0 (0.0%) |
| 6 to 11 Years | 43 (21.6%) | 13 (8.9%) |
| 12 to 14 Years | 33 (16.7%) | 0 (0.0%) |
| 15 Years | 0 (0.0%) | 9 (16.1%) |
| 16 and 17 Years | 0 (0.0%) | 36 (27.9%) |
| 18 to 24 Years | 0 (0.0%) | 78 (63.9%) |
| 25 to 34 Years | 0 (0.0%) | 34 (12.6%) |
| 35 to 44 Years | 25 (6.7%) | 0 (0.0%) |
| 45 to 54 Years | 0 (0.0%) | 31 (6.7%) |
| 55 to 64 Years | 0 (0.0%) | 25 (6.4%) |
| 65 to 74 Years | 78 (27.8%) | 63 (20.1%) |
| 75 Years and over | 55 (41.7%) | 0 (0.0%) |
| Total | 251 (9.3%) | 289 (11.4%) |
Income Above Poverty by Sex and Age in Cicero
According to the poverty statistics in Cicero, males aged 15 years and females aged under 5 years are the age groups that are most secure financially, with 100.0% of males and 100.0% of females in these age groups living above the poverty line.
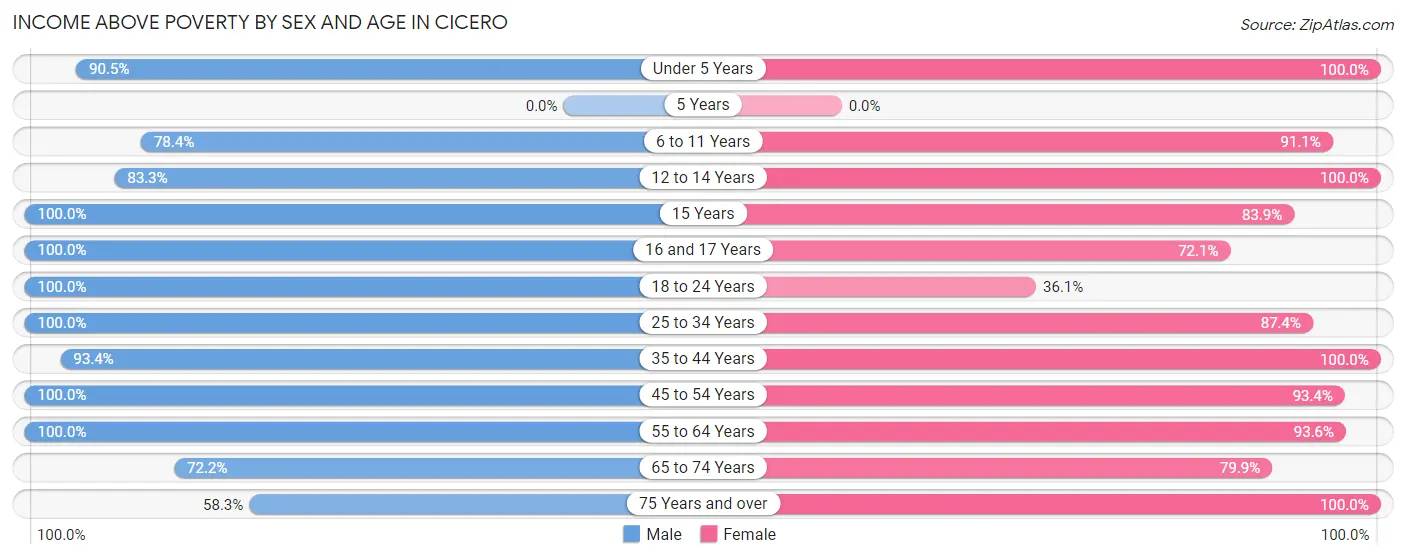
| Age Bracket | Male | Female |
| Under 5 Years | 161 (90.4%) | 122 (100.0%) |
| 5 Years | 0 (0.0%) | 0 (0.0%) |
| 6 to 11 Years | 156 (78.4%) | 133 (91.1%) |
| 12 to 14 Years | 165 (83.3%) | 67 (100.0%) |
| 15 Years | 26 (100.0%) | 47 (83.9%) |
| 16 and 17 Years | 36 (100.0%) | 93 (72.1%) |
| 18 to 24 Years | 104 (100.0%) | 44 (36.1%) |
| 25 to 34 Years | 196 (100.0%) | 236 (87.4%) |
| 35 to 44 Years | 351 (93.3%) | 425 (100.0%) |
| 45 to 54 Years | 378 (100.0%) | 435 (93.3%) |
| 55 to 64 Years | 585 (100.0%) | 363 (93.6%) |
| 65 to 74 Years | 203 (72.2%) | 250 (79.9%) |
| 75 Years and over | 77 (58.3%) | 35 (100.0%) |
| Total | 2,438 (90.7%) | 2,250 (88.6%) |
Income Below Poverty Among Married-Couple Families in Cicero
The poverty statistics for married-couple families in Cicero show that 4.6% or 63 of the total 1,366 families live below the poverty line. Families with no children have the highest poverty rate of 7.2%, comprising of 63 families. On the other hand, families with 1 or 2 children have the lowest poverty rate of 0.0%, which includes 0 families.
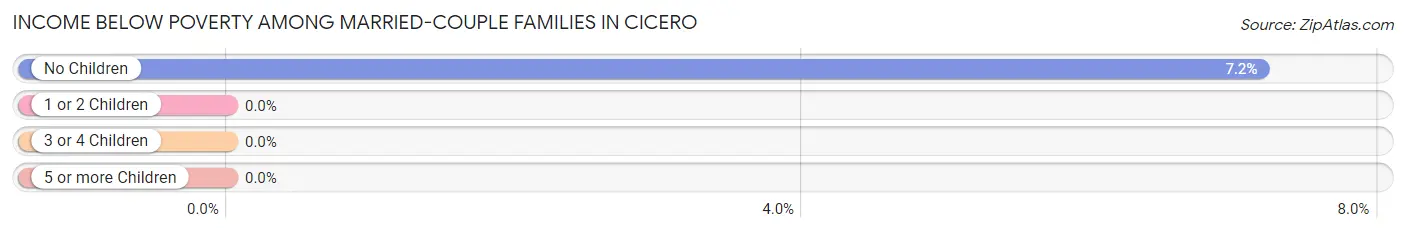
| Children | Above Poverty | Below Poverty |
| No Children | 814 (92.8%) | 63 (7.2%) |
| 1 or 2 Children | 489 (100.0%) | 0 (0.0%) |
| 3 or 4 Children | 0 (0.0%) | 0 (0.0%) |
| 5 or more Children | 0 (0.0%) | 0 (0.0%) |
| Total | 1,303 (95.4%) | 63 (4.6%) |
Income Below Poverty Among Single-Parent Households in Cicero
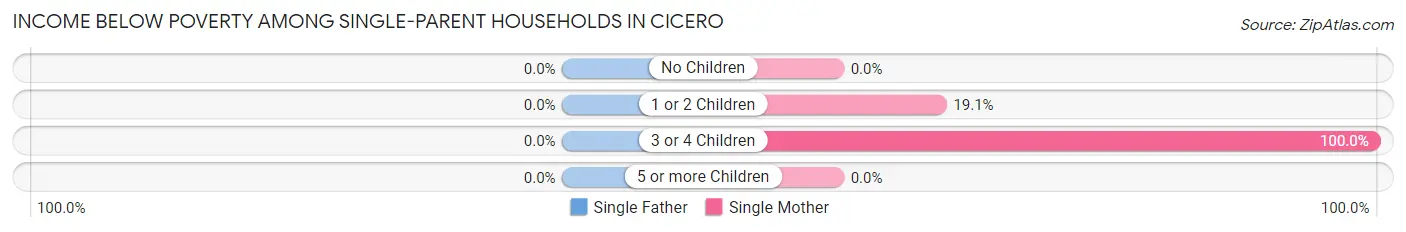
| Children | Single Father | Single Mother |
| No Children | 0 (0.0%) | 0 (0.0%) |
| 1 or 2 Children | 0 (0.0%) | 31 (19.1%) |
| 3 or 4 Children | 0 (0.0%) | 34 (100.0%) |
| 5 or more Children | 0 (0.0%) | 0 (0.0%) |
| Total | 0 (0.0%) | 65 (28.0%) |
Income Below Poverty Among Married-Couple vs Single-Parent Households in Cicero
The poverty data for Cicero shows that 63 of the married-couple family households (4.6%) and 65 of the single-parent households (17.5%) are living below the poverty level. Within the married-couple family households, those with no children have the highest poverty rate, with 63 households (7.2%) falling below the poverty line. Among the single-parent households, those with 3 or 4 children have the highest poverty rate, with 34 household (100.0%) living below poverty.
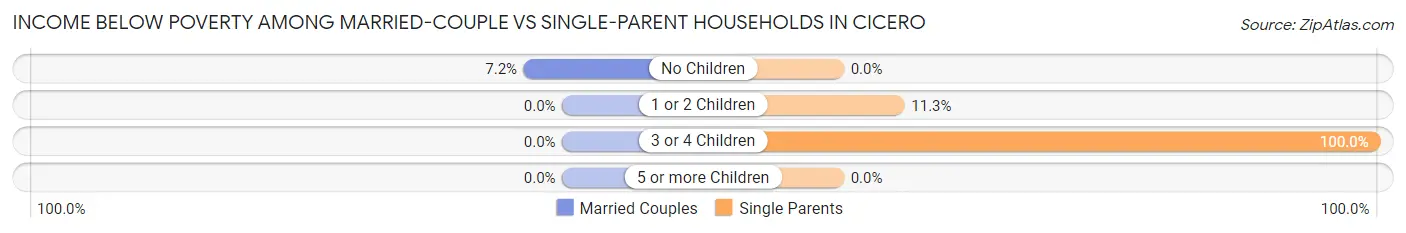
| Children | Married-Couple Families | Single-Parent Households |
| No Children | 63 (7.2%) | 0 (0.0%) |
| 1 or 2 Children | 0 (0.0%) | 31 (11.3%) |
| 3 or 4 Children | 0 (0.0%) | 34 (100.0%) |
| 5 or more Children | 0 (0.0%) | 0 (0.0%) |
| Total | 63 (4.6%) | 65 (17.5%) |
Race in Cicero
The most populous races in Cicero are White / Caucasian (5,274 | 98.5%), and Two or more Races (82 | 1.5%).
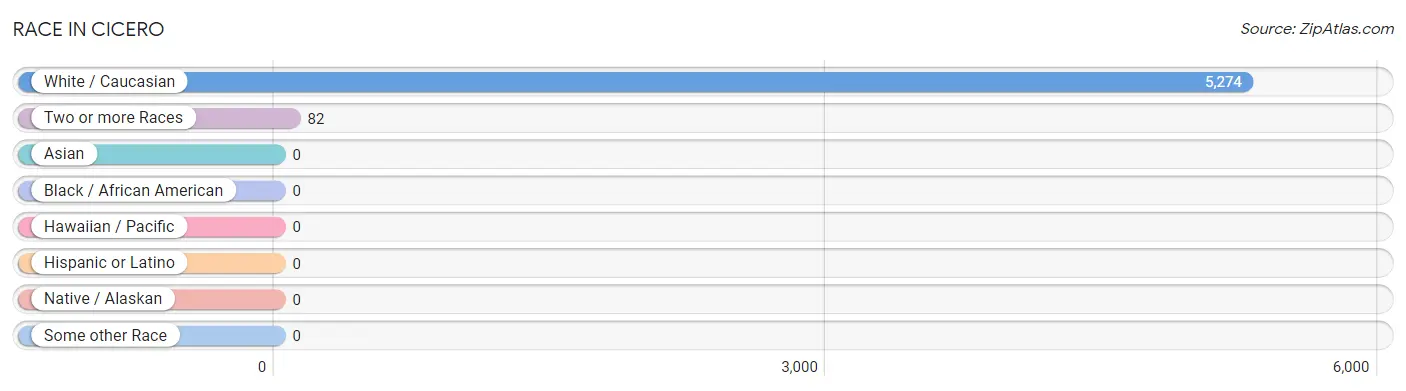
| Race | # Population | % Population |
| Asian | 0 | 0.0% |
| Black / African American | 0 | 0.0% |
| Hawaiian / Pacific | 0 | 0.0% |
| Hispanic or Latino | 0 | 0.0% |
| Native / Alaskan | 0 | 0.0% |
| White / Caucasian | 5,274 | 98.5% |
| Two or more Races | 82 | 1.5% |
| Some other Race | 0 | 0.0% |
| Total | 5,356 | 100.0% |
Ancestry in Cicero
The most populous ancestries reported in Cicero are German (1,487 | 27.8%), English (1,024 | 19.1%), Irish (592 | 11.1%), American (304 | 5.7%), and Eastern European (145 | 2.7%), together accounting for 66.3% of all Cicero residents.
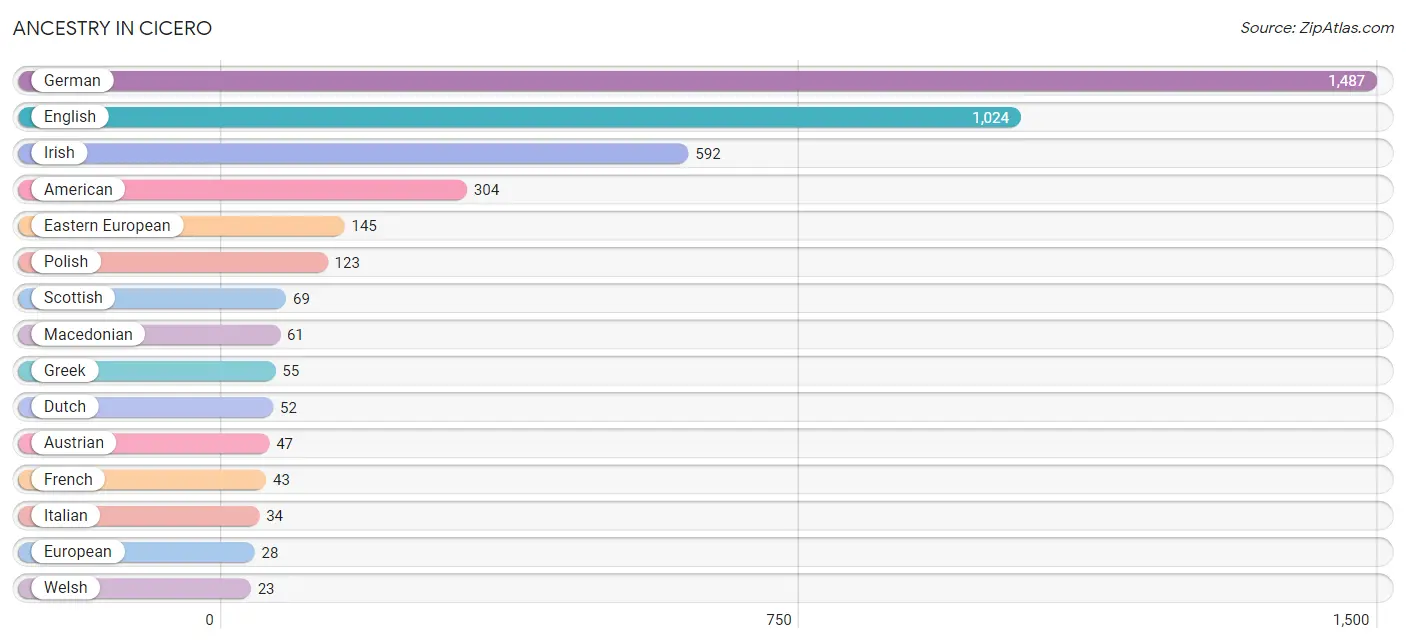
| Ancestry | # Population | % Population |
| American | 304 | 5.7% |
| Arab | 9 | 0.2% |
| Austrian | 47 | 0.9% |
| British | 16 | 0.3% |
| Croatian | 4 | 0.1% |
| Dutch | 52 | 1.0% |
| Eastern European | 145 | 2.7% |
| Egyptian | 9 | 0.2% |
| English | 1,024 | 19.1% |
| European | 28 | 0.5% |
| French | 43 | 0.8% |
| German | 1,487 | 27.8% |
| Greek | 55 | 1.0% |
| Iranian | 15 | 0.3% |
| Irish | 592 | 11.1% |
| Italian | 34 | 0.6% |
| Macedonian | 61 | 1.1% |
| Northern European | 20 | 0.4% |
| Norwegian | 11 | 0.2% |
| Polish | 123 | 2.3% |
| Scotch-Irish | 18 | 0.3% |
| Scottish | 69 | 1.3% |
| Swedish | 18 | 0.3% |
| Ukrainian | 19 | 0.4% |
| Welsh | 23 | 0.4% | View All 25 Rows |
Immigrants in Cicero
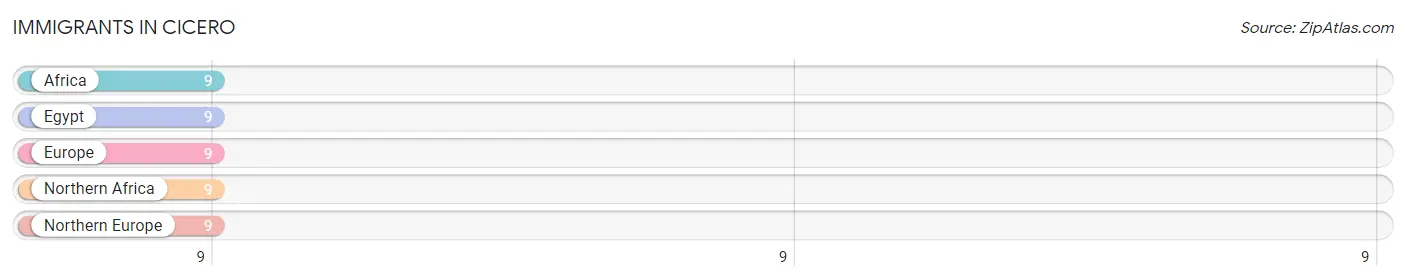
The most numerous immigrant groups reported in Cicero came from Africa (9 | 0.2%), Egypt (9 | 0.2%), Europe (9 | 0.2%), Northern Africa (9 | 0.2%), and Northern Europe (9 | 0.2%), together accounting for 0.8% of all Cicero residents.
| Immigration Origin | # Population | % Population |
| Africa | 9 | 0.2% |
| Egypt | 9 | 0.2% |
| Europe | 9 | 0.2% |
| Northern Africa | 9 | 0.2% |
| Northern Europe | 9 | 0.2% | View All 5 Rows |
Sex and Age in Cicero
Sex and Age in Cicero
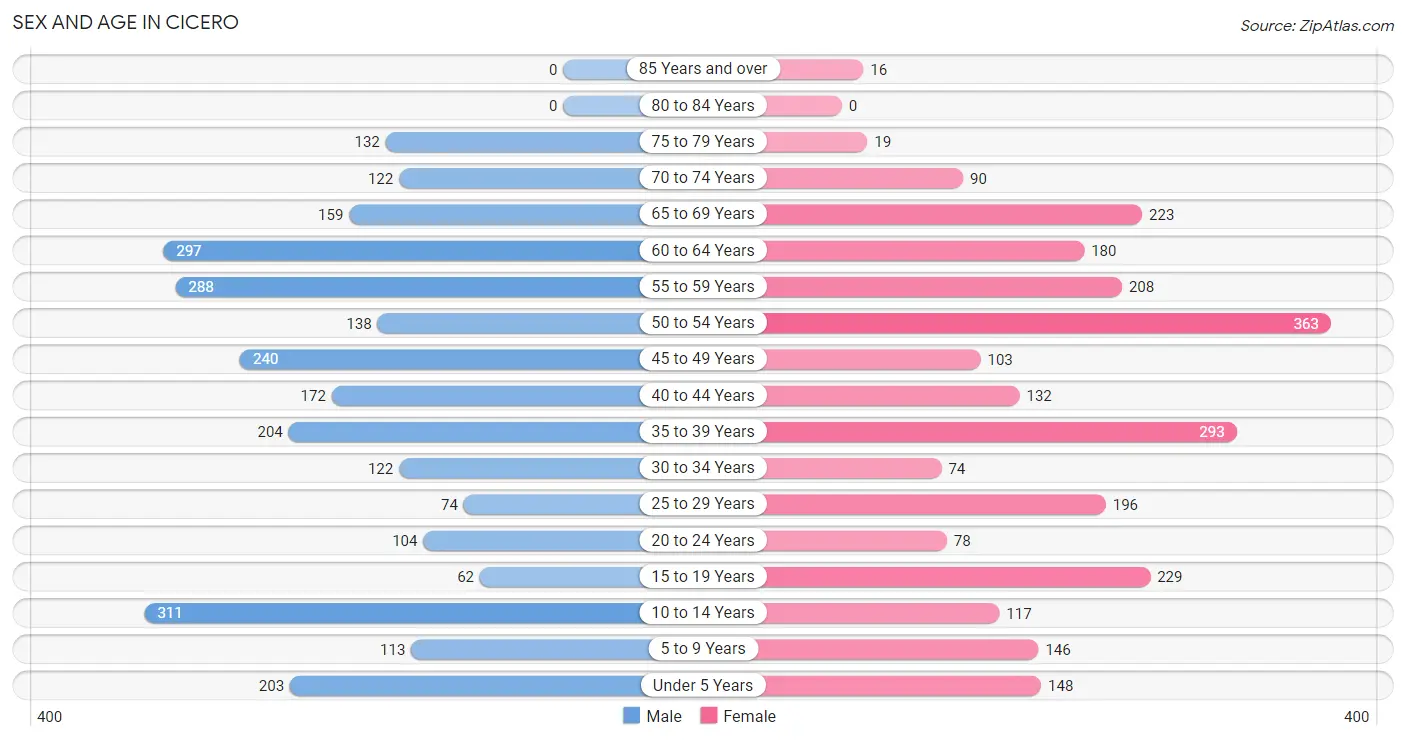
The most populous age groups in Cicero are 10 to 14 Years (311 | 11.4%) for men and 50 to 54 Years (363 | 13.9%) for women.
| Age Bracket | Male | Female |
| Under 5 Years | 203 (7.4%) | 148 (5.7%) |
| 5 to 9 Years | 113 (4.1%) | 146 (5.6%) |
| 10 to 14 Years | 311 (11.4%) | 117 (4.5%) |
| 15 to 19 Years | 62 (2.3%) | 229 (8.8%) |
| 20 to 24 Years | 104 (3.8%) | 78 (3.0%) |
| 25 to 29 Years | 74 (2.7%) | 196 (7.5%) |
| 30 to 34 Years | 122 (4.4%) | 74 (2.8%) |
| 35 to 39 Years | 204 (7.4%) | 293 (11.2%) |
| 40 to 44 Years | 172 (6.3%) | 132 (5.1%) |
| 45 to 49 Years | 240 (8.8%) | 103 (3.9%) |
| 50 to 54 Years | 138 (5.0%) | 363 (13.9%) |
| 55 to 59 Years | 288 (10.5%) | 208 (8.0%) |
| 60 to 64 Years | 297 (10.8%) | 180 (6.9%) |
| 65 to 69 Years | 159 (5.8%) | 223 (8.5%) |
| 70 to 74 Years | 122 (4.4%) | 90 (3.4%) |
| 75 to 79 Years | 132 (4.8%) | 19 (0.7%) |
| 80 to 84 Years | 0 (0.0%) | 0 (0.0%) |
| 85 Years and over | 0 (0.0%) | 16 (0.6%) |
| Total | 2,741 (100.0%) | 2,615 (100.0%) |
Families and Households in Cicero
Median Family Size in Cicero
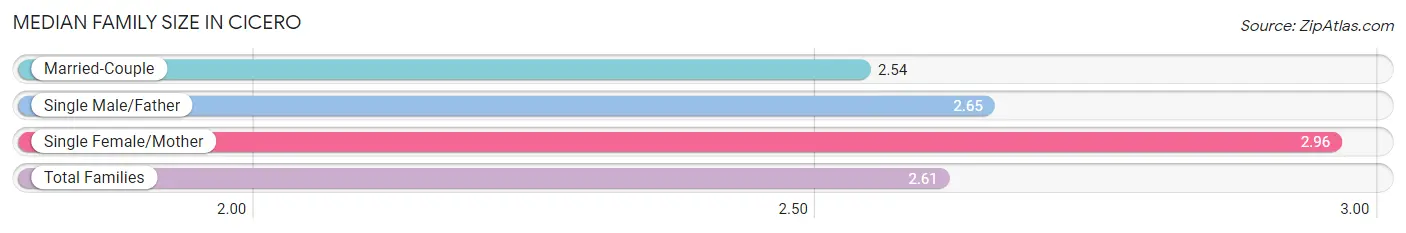
The median family size in Cicero is 2.61 persons per family, with single female/mother families (232 | 13.4%) accounting for the largest median family size of 2.96 persons per family. On the other hand, married-couple families (1,366 | 78.6%) represent the smallest median family size with 2.54 persons per family.
| Family Type | # Families | Family Size |
| Married-Couple | 1,366 (78.6%) | 2.54 |
| Single Male/Father | 140 (8.1%) | 2.65 |
| Single Female/Mother | 232 (13.4%) | 2.96 |
| Total Families | 1,738 (100.0%) | 2.61 |
Median Household Size in Cicero
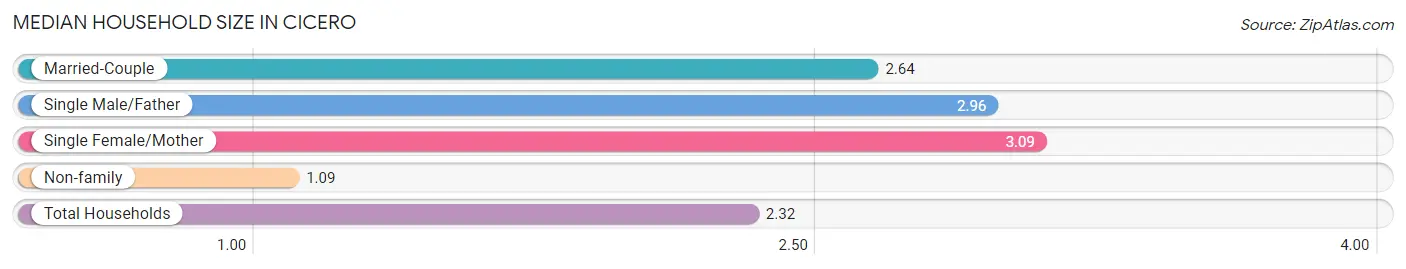
The median household size in Cicero is 2.32 persons per household, with single female/mother households (232 | 10.0%) accounting for the largest median household size of 3.09 persons per household. non-family households (575 | 24.9%) represent the smallest median household size with 1.09 persons per household.
| Household Type | # Households | Household Size |
| Married-Couple | 1,366 (59.1%) | 2.64 |
| Single Male/Father | 140 (6.0%) | 2.96 |
| Single Female/Mother | 232 (10.0%) | 3.09 |
| Non-family | 575 (24.9%) | 1.09 |
| Total Households | 2,313 (100.0%) | 2.32 |
Household Size by Marriage Status in Cicero
Out of a total of 2,313 households in Cicero, 1,738 (75.1%) are family households, while 575 (24.9%) are nonfamily households. The most numerous type of family households are 2-person households, comprising 888, and the most common type of nonfamily households are 1-person households, comprising 540.
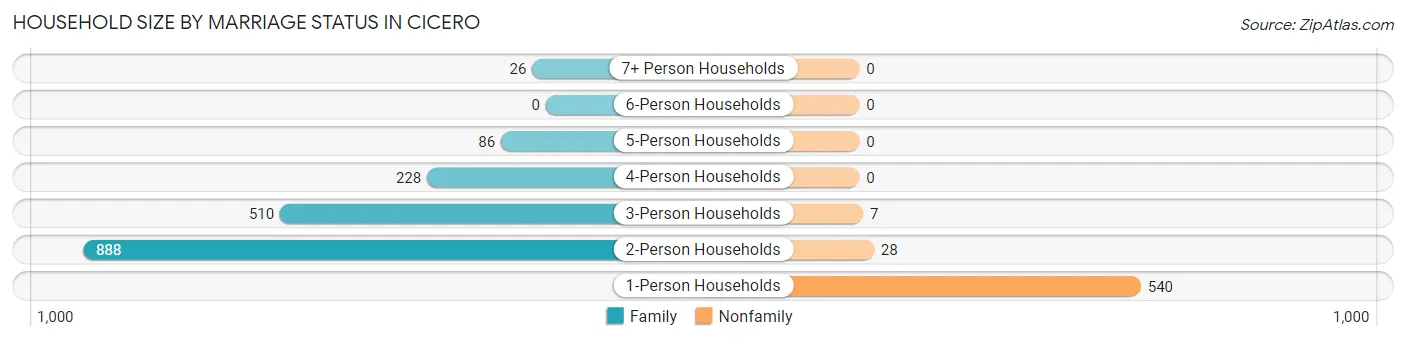
| Household Size | Family Households | Nonfamily Households |
| 1-Person Households | - | 540 (23.4%) |
| 2-Person Households | 888 (38.4%) | 28 (1.2%) |
| 3-Person Households | 510 (22.1%) | 7 (0.3%) |
| 4-Person Households | 228 (9.9%) | 0 (0.0%) |
| 5-Person Households | 86 (3.7%) | 0 (0.0%) |
| 6-Person Households | 0 (0.0%) | 0 (0.0%) |
| 7+ Person Households | 26 (1.1%) | 0 (0.0%) |
| Total | 1,738 (75.1%) | 575 (24.9%) |
Female Fertility in Cicero
Fertility by Age in Cicero
Average fertility rate in Cicero is 85.0 births per 1,000 women. Women in the age bracket of 20 to 34 years have the highest fertility rate with 296.0 births per 1,000 women. Women in the age bracket of 20 to 34 years acount for 100.0% of all women with births.
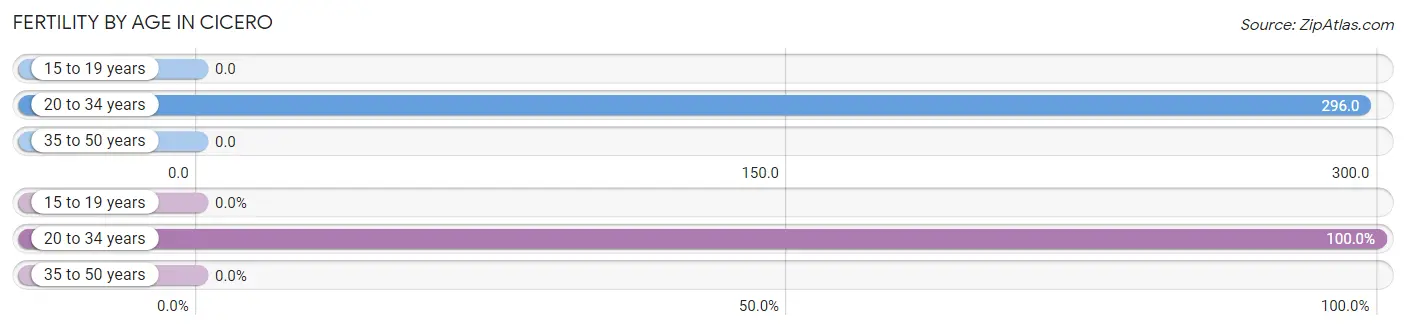
| Age Bracket | Women with Births | Births / 1,000 Women |
| 15 to 19 years | 0 (0.0%) | 0.0 |
| 20 to 34 years | 103 (100.0%) | 296.0 |
| 35 to 50 years | 0 (0.0%) | 0.0 |
| Total | 103 (100.0%) | 85.0 |
Fertility by Age by Marriage Status in Cicero
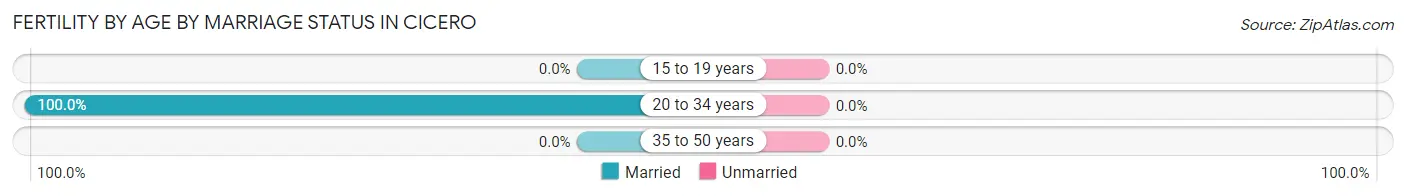
| Age Bracket | Married | Unmarried |
| 15 to 19 years | 0 (0.0%) | 0 (0.0%) |
| 20 to 34 years | 103 (100.0%) | 0 (0.0%) |
| 35 to 50 years | 0 (0.0%) | 0 (0.0%) |
| Total | 103 (100.0%) | 0 (0.0%) |
Fertility by Education in Cicero
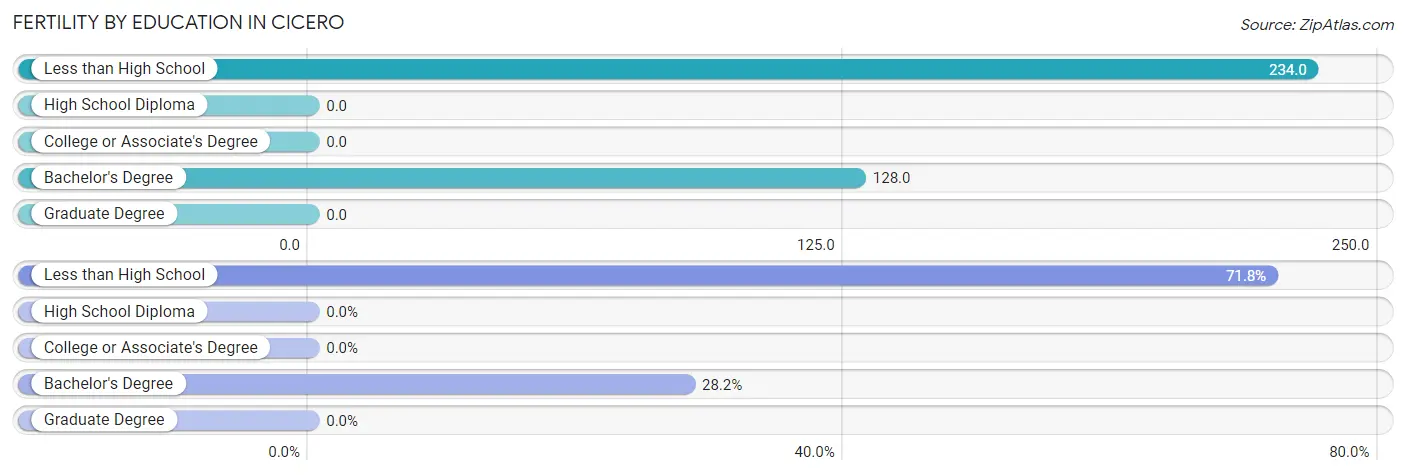
| Educational Attainment | Women with Births | Births / 1,000 Women |
| Less than High School | 74 (71.8%) | 234.0 |
| High School Diploma | 0 (0.0%) | 0.0 |
| College or Associate's Degree | 0 (0.0%) | 0.0 |
| Bachelor's Degree | 29 (28.2%) | 128.0 |
| Graduate Degree | 0 (0.0%) | 0.0 |
| Total | 103 (100.0%) | 85.0 |
Fertility by Education by Marriage Status in Cicero
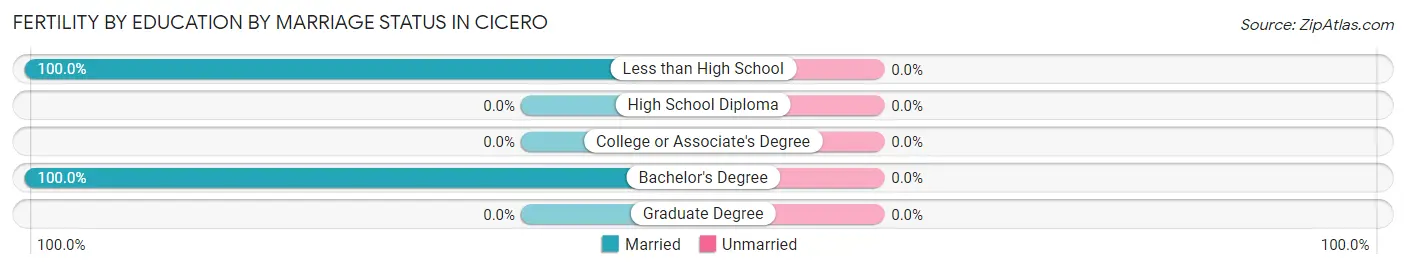
| Educational Attainment | Married | Unmarried |
| Less than High School | 74 (100.0%) | 0 (0.0%) |
| High School Diploma | 0 (0.0%) | 0 (0.0%) |
| College or Associate's Degree | 0 (0.0%) | 0 (0.0%) |
| Bachelor's Degree | 29 (100.0%) | 0 (0.0%) |
| Graduate Degree | 0 (0.0%) | 0 (0.0%) |
| Total | 103 (100.0%) | 0 (0.0%) |
Employment Characteristics in Cicero
Employment by Class of Employer in Cicero
Among the 2,576 employed individuals in Cicero, private company employees (2,026 | 78.6%), self-employed (incorporated) (144 | 5.6%), and local government employees (134 | 5.2%) make up the most common classes of employment.
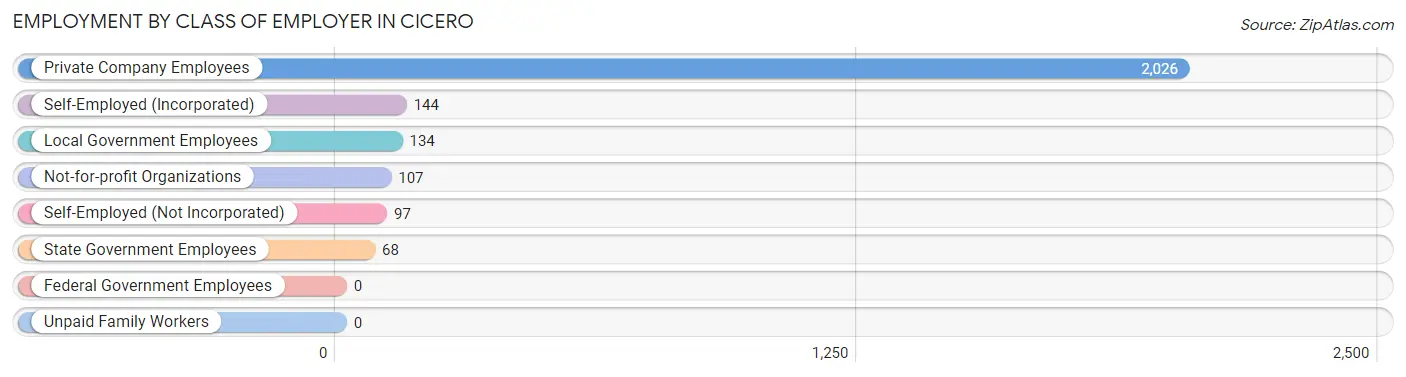
| Employer Class | # Employees | % Employees |
| Private Company Employees | 2,026 | 78.6% |
| Self-Employed (Incorporated) | 144 | 5.6% |
| Self-Employed (Not Incorporated) | 97 | 3.8% |
| Not-for-profit Organizations | 107 | 4.2% |
| Local Government Employees | 134 | 5.2% |
| State Government Employees | 68 | 2.6% |
| Federal Government Employees | 0 | 0.0% |
| Unpaid Family Workers | 0 | 0.0% |
| Total | 2,576 | 100.0% |
Employment Status by Age in Cicero
According to the labor force statistics for Cicero, out of the total population over 16 years of age (4,236), 63.7% or 2,698 individuals are in the labor force, with 0.9% or 24 of them unemployed. The age group with the highest labor force participation rate is 30 to 34 years, with 100.0% or 196 individuals in the labor force. Within the labor force, the 55 to 59 years age range has the highest percentage of unemployed individuals, with 7.6% or 24 of them being unemployed.
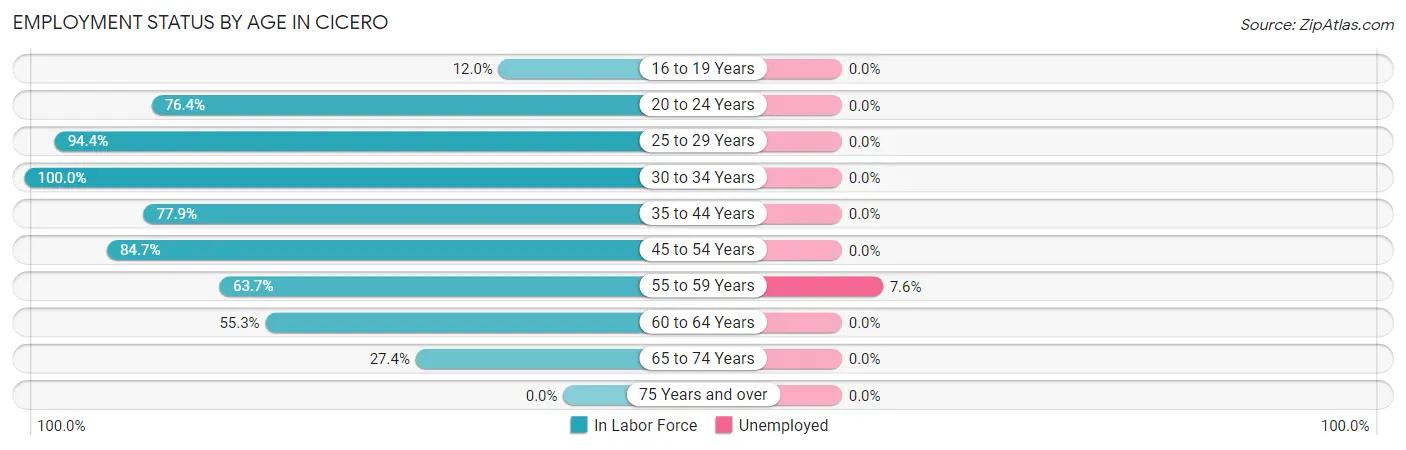
| Age Bracket | In Labor Force | Unemployed |
| 16 to 19 Years | 25 (12.0%) | 0 (0.0%) |
| 20 to 24 Years | 139 (76.4%) | 0 (0.0%) |
| 25 to 29 Years | 255 (94.4%) | 0 (0.0%) |
| 30 to 34 Years | 196 (100.0%) | 0 (0.0%) |
| 35 to 44 Years | 624 (77.9%) | 0 (0.0%) |
| 45 to 54 Years | 715 (84.7%) | 0 (0.0%) |
| 55 to 59 Years | 316 (63.7%) | 24 (7.6%) |
| 60 to 64 Years | 264 (55.3%) | 0 (0.0%) |
| 65 to 74 Years | 163 (27.4%) | 0 (0.0%) |
| 75 Years and over | 0 (0.0%) | 0 (0.0%) |
| Total | 2,698 (63.7%) | 24 (0.9%) |
Employment Status by Educational Attainment in Cicero
According to labor force statistics for Cicero, 76.8% of individuals (2,369) out of the total population between 25 and 64 years of age (3,084) are in the labor force, with 1.0% or 24 of them being unemployed. The group with the highest labor force participation rate are those with the educational attainment of bachelor's degree or higher, with 82.0% or 863 individuals in the labor force. Within the labor force, individuals with college / associate degree education have the highest percentage of unemployment, with 3.0% or 24 of them being unemployed.
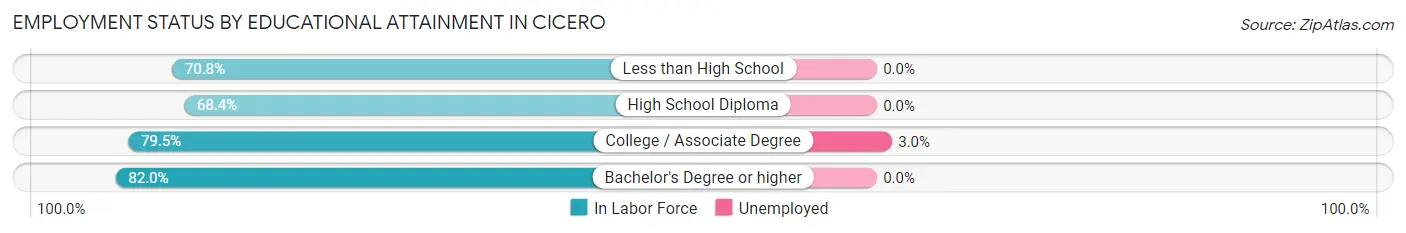
| Educational Attainment | In Labor Force | Unemployed |
| Less than High School | 131 (70.8%) | 0 (0.0%) |
| High School Diploma | 566 (68.4%) | 0 (0.0%) |
| College / Associate Degree | 810 (79.5%) | 31 (3.0%) |
| Bachelor's Degree or higher | 863 (82.0%) | 0 (0.0%) |
| Total | 2,369 (76.8%) | 31 (1.0%) |
Employment Occupations by Sex in Cicero
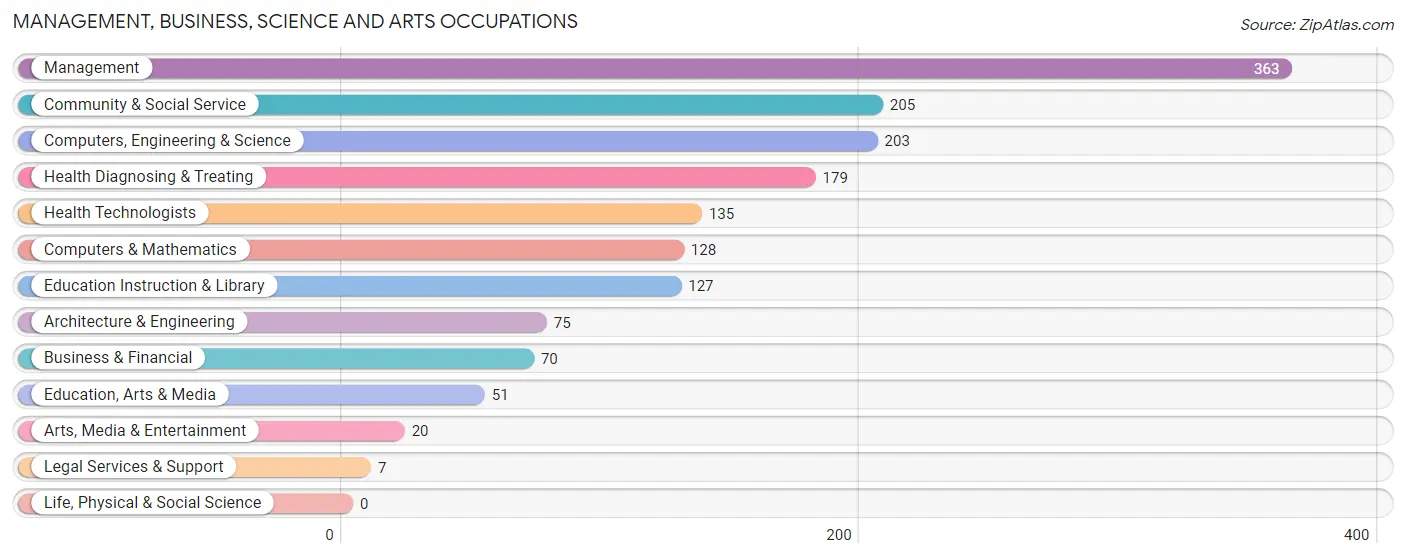
Management, Business, Science and Arts Occupations
The most common Management, Business, Science and Arts occupations in Cicero are Management (363 | 13.6%), Community & Social Service (205 | 7.7%), Computers, Engineering & Science (203 | 7.6%), Health Diagnosing & Treating (179 | 6.7%), and Health Technologists (135 | 5.1%).
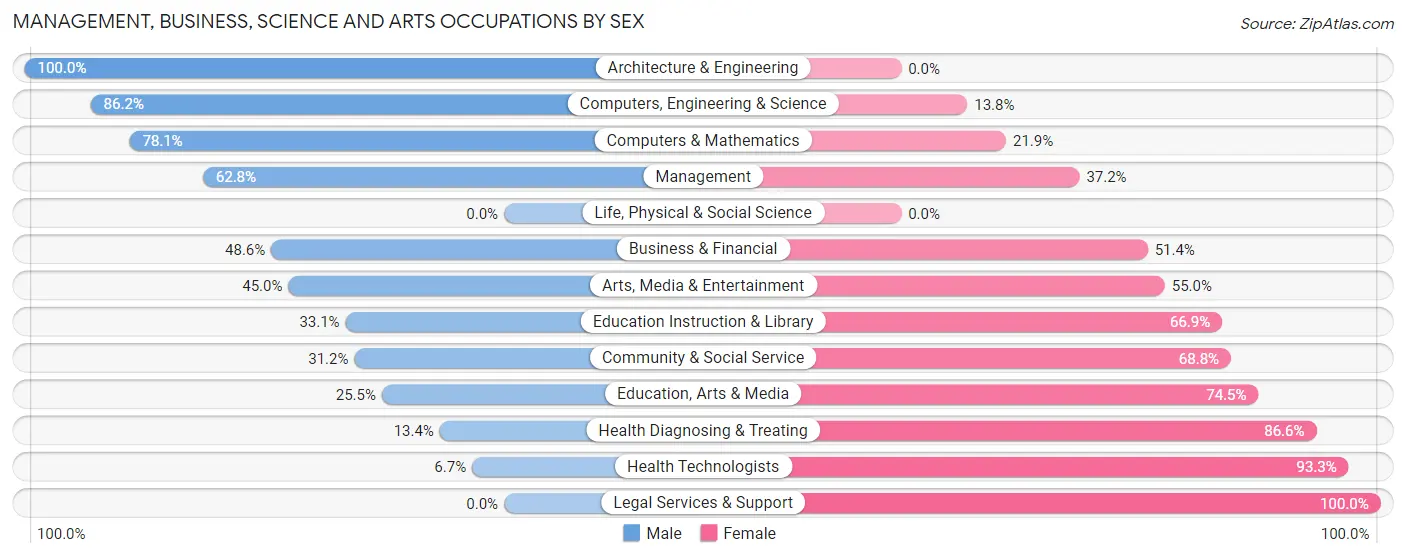
Management, Business, Science and Arts Occupations by Sex
Within the Management, Business, Science and Arts occupations in Cicero, the most male-oriented occupations are Architecture & Engineering (100.0%), Computers, Engineering & Science (86.2%), and Computers & Mathematics (78.1%), while the most female-oriented occupations are Legal Services & Support (100.0%), Health Technologists (93.3%), and Health Diagnosing & Treating (86.6%).
| Occupation | Male | Female |
| Management | 228 (62.8%) | 135 (37.2%) |
| Business & Financial | 34 (48.6%) | 36 (51.4%) |
| Computers, Engineering & Science | 175 (86.2%) | 28 (13.8%) |
| Computers & Mathematics | 100 (78.1%) | 28 (21.9%) |
| Architecture & Engineering | 75 (100.0%) | 0 (0.0%) |
| Life, Physical & Social Science | 0 (0.0%) | 0 (0.0%) |
| Community & Social Service | 64 (31.2%) | 141 (68.8%) |
| Education, Arts & Media | 13 (25.5%) | 38 (74.5%) |
| Legal Services & Support | 0 (0.0%) | 7 (100.0%) |
| Education Instruction & Library | 42 (33.1%) | 85 (66.9%) |
| Arts, Media & Entertainment | 9 (45.0%) | 11 (55.0%) |
| Health Diagnosing & Treating | 24 (13.4%) | 155 (86.6%) |
| Health Technologists | 9 (6.7%) | 126 (93.3%) |
| Total (Category) | 525 (51.5%) | 495 (48.5%) |
| Total (Overall) | 1,320 (49.4%) | 1,353 (50.6%) |
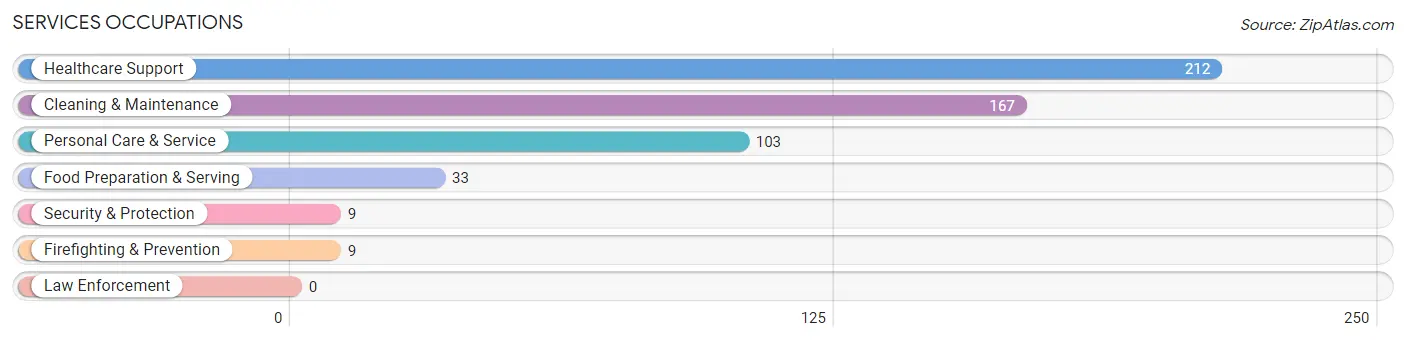
Services Occupations
The most common Services occupations in Cicero are Healthcare Support (212 | 7.9%), Cleaning & Maintenance (167 | 6.2%), Personal Care & Service (103 | 3.8%), Food Preparation & Serving (33 | 1.2%), and Security & Protection (9 | 0.3%).
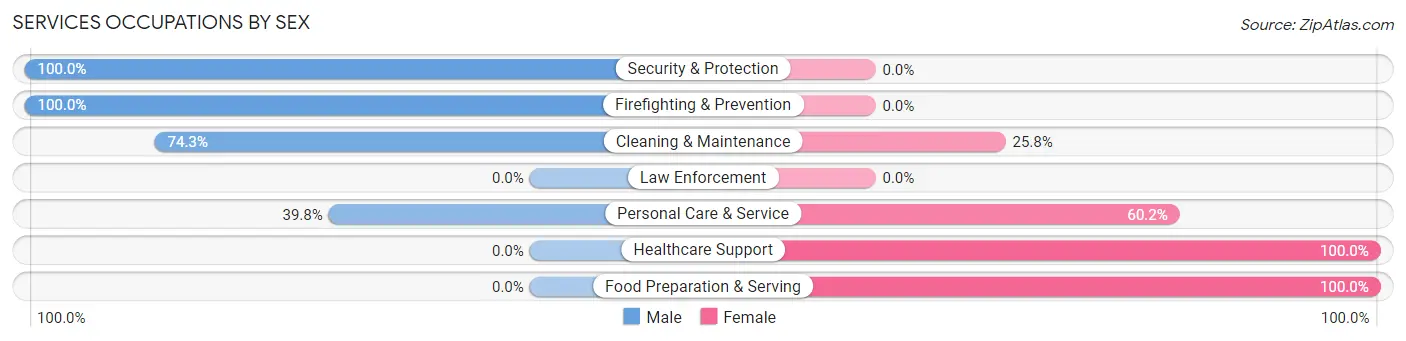
Services Occupations by Sex
Within the Services occupations in Cicero, the most male-oriented occupations are Security & Protection (100.0%), Firefighting & Prevention (100.0%), and Cleaning & Maintenance (74.3%), while the most female-oriented occupations are Healthcare Support (100.0%), Food Preparation & Serving (100.0%), and Personal Care & Service (60.2%).
| Occupation | Male | Female |
| Healthcare Support | 0 (0.0%) | 212 (100.0%) |
| Security & Protection | 9 (100.0%) | 0 (0.0%) |
| Firefighting & Prevention | 9 (100.0%) | 0 (0.0%) |
| Law Enforcement | 0 (0.0%) | 0 (0.0%) |
| Food Preparation & Serving | 0 (0.0%) | 33 (100.0%) |
| Cleaning & Maintenance | 124 (74.3%) | 43 (25.8%) |
| Personal Care & Service | 41 (39.8%) | 62 (60.2%) |
| Total (Category) | 174 (33.2%) | 350 (66.8%) |
| Total (Overall) | 1,320 (49.4%) | 1,353 (50.6%) |
Sales and Office Occupations
The most common Sales and Office occupations in Cicero are Office & Administration (287 | 10.7%), and Sales & Related (237 | 8.9%).

Sales and Office Occupations by Sex
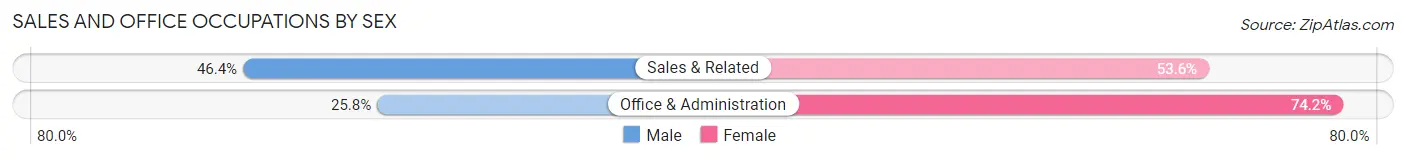
| Occupation | Male | Female |
| Sales & Related | 110 (46.4%) | 127 (53.6%) |
| Office & Administration | 74 (25.8%) | 213 (74.2%) |
| Total (Category) | 184 (35.1%) | 340 (64.9%) |
| Total (Overall) | 1,320 (49.4%) | 1,353 (50.6%) |
Natural Resources, Construction and Maintenance Occupations
The most common Natural Resources, Construction and Maintenance occupations in Cicero are Construction & Extraction (134 | 5.0%), and Installation, Maintenance & Repair (90 | 3.4%).
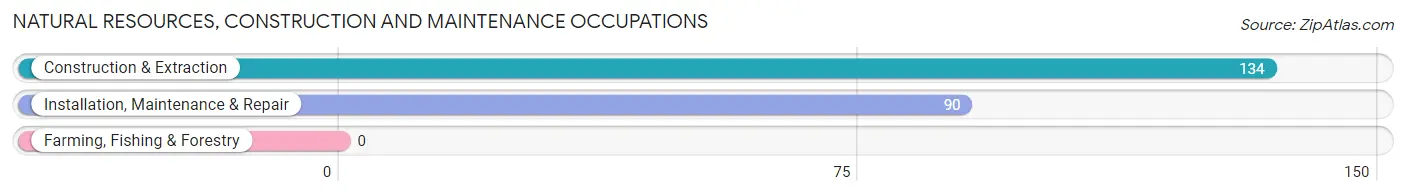
Natural Resources, Construction and Maintenance Occupations by Sex

| Occupation | Male | Female |
| Farming, Fishing & Forestry | 0 (0.0%) | 0 (0.0%) |
| Construction & Extraction | 134 (100.0%) | 0 (0.0%) |
| Installation, Maintenance & Repair | 90 (100.0%) | 0 (0.0%) |
| Total (Category) | 224 (100.0%) | 0 (0.0%) |
| Total (Overall) | 1,320 (49.4%) | 1,353 (50.6%) |
Production, Transportation and Moving Occupations
The most common Production, Transportation and Moving occupations in Cicero are Material Moving (253 | 9.5%), Production (90 | 3.4%), and Transportation (38 | 1.4%).
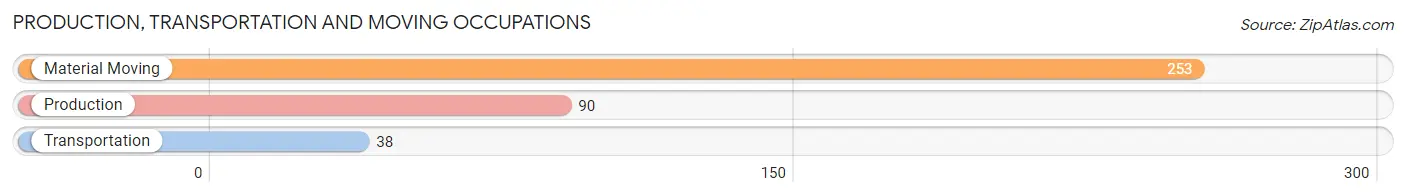
Production, Transportation and Moving Occupations by Sex
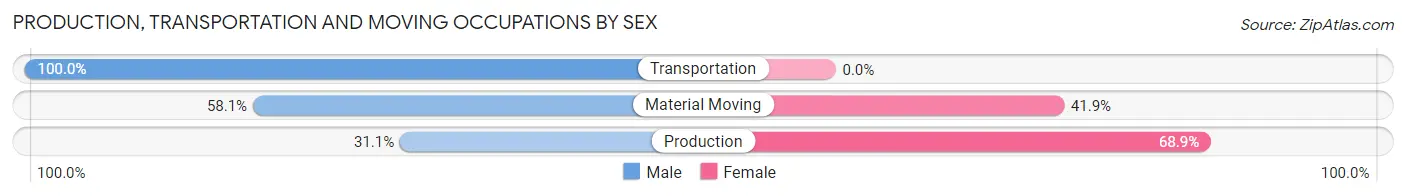
| Occupation | Male | Female |
| Production | 28 (31.1%) | 62 (68.9%) |
| Transportation | 38 (100.0%) | 0 (0.0%) |
| Material Moving | 147 (58.1%) | 106 (41.9%) |
| Total (Category) | 213 (55.9%) | 168 (44.1%) |
| Total (Overall) | 1,320 (49.4%) | 1,353 (50.6%) |
Employment Industries by Sex in Cicero
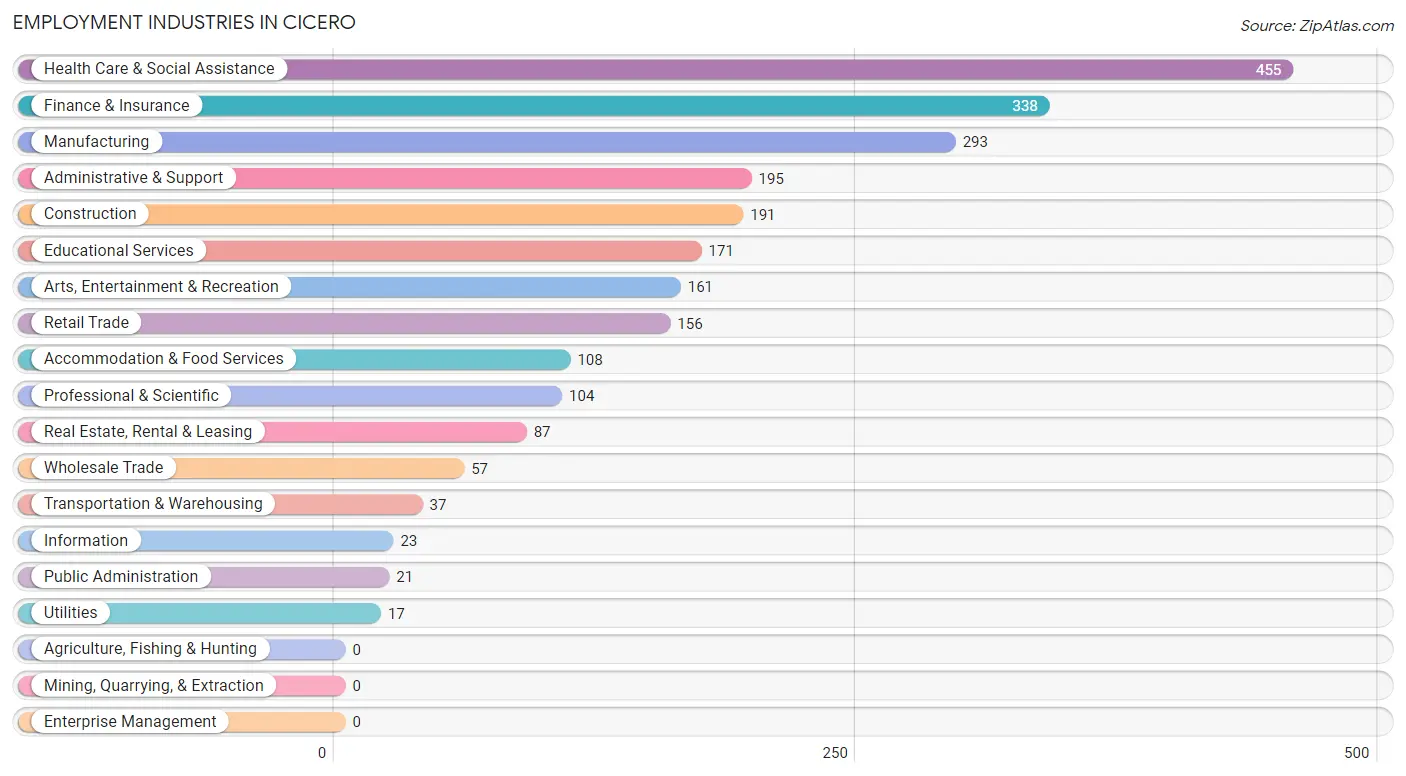
Employment Industries in Cicero
The major employment industries in Cicero include Health Care & Social Assistance (455 | 17.0%), Finance & Insurance (338 | 12.6%), Manufacturing (293 | 11.0%), Administrative & Support (195 | 7.3%), and Construction (191 | 7.1%).
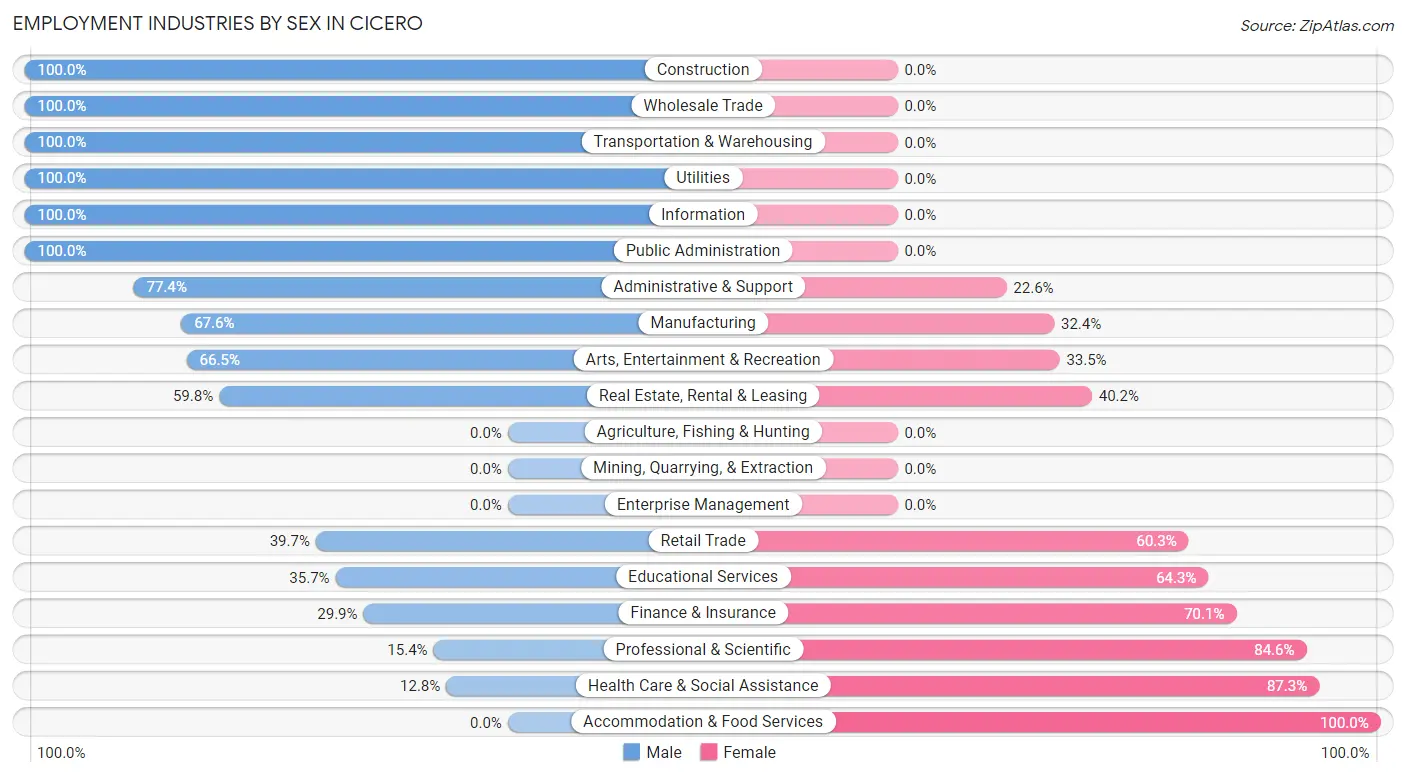
Employment Industries by Sex in Cicero
The Cicero industries that see more men than women are Construction (100.0%), Wholesale Trade (100.0%), and Transportation & Warehousing (100.0%), whereas the industries that tend to have a higher number of women are Accommodation & Food Services (100.0%), Health Care & Social Assistance (87.3%), and Professional & Scientific (84.6%).
| Industry | Male | Female |
| Agriculture, Fishing & Hunting | 0 (0.0%) | 0 (0.0%) |
| Mining, Quarrying, & Extraction | 0 (0.0%) | 0 (0.0%) |
| Construction | 191 (100.0%) | 0 (0.0%) |
| Manufacturing | 198 (67.6%) | 95 (32.4%) |
| Wholesale Trade | 57 (100.0%) | 0 (0.0%) |
| Retail Trade | 62 (39.7%) | 94 (60.3%) |
| Transportation & Warehousing | 37 (100.0%) | 0 (0.0%) |
| Utilities | 17 (100.0%) | 0 (0.0%) |
| Information | 23 (100.0%) | 0 (0.0%) |
| Finance & Insurance | 101 (29.9%) | 237 (70.1%) |
| Real Estate, Rental & Leasing | 52 (59.8%) | 35 (40.2%) |
| Professional & Scientific | 16 (15.4%) | 88 (84.6%) |
| Enterprise Management | 0 (0.0%) | 0 (0.0%) |
| Administrative & Support | 151 (77.4%) | 44 (22.6%) |
| Educational Services | 61 (35.7%) | 110 (64.3%) |
| Health Care & Social Assistance | 58 (12.8%) | 397 (87.3%) |
| Arts, Entertainment & Recreation | 107 (66.5%) | 54 (33.5%) |
| Accommodation & Food Services | 0 (0.0%) | 108 (100.0%) |
| Public Administration | 21 (100.0%) | 0 (0.0%) |
| Total | 1,320 (49.4%) | 1,353 (50.6%) |
Education in Cicero
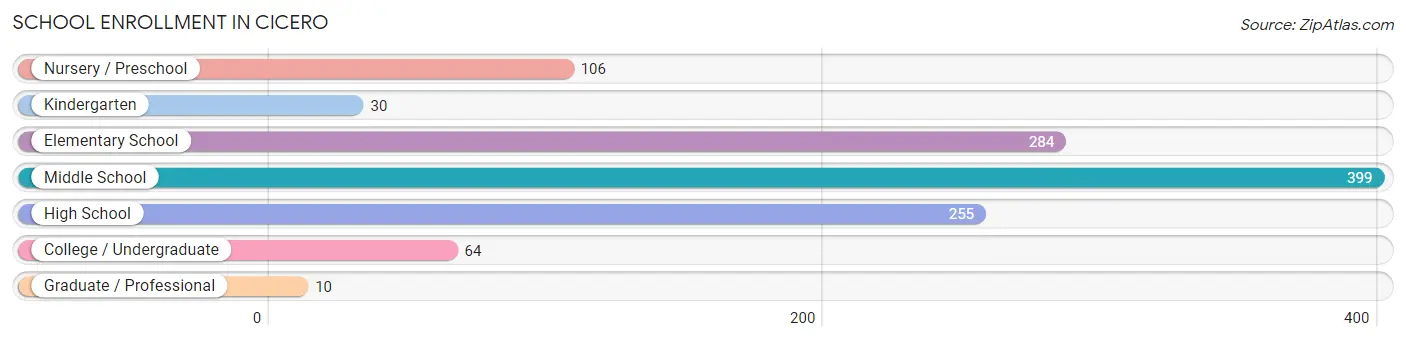
School Enrollment in Cicero
The most common levels of schooling among the 1,148 students in Cicero are middle school (399 | 34.8%), elementary school (284 | 24.7%), and high school (255 | 22.2%).
| School Level | # Students | % Students |
| Nursery / Preschool | 106 | 9.2% |
| Kindergarten | 30 | 2.6% |
| Elementary School | 284 | 24.7% |
| Middle School | 399 | 34.8% |
| High School | 255 | 22.2% |
| College / Undergraduate | 64 | 5.6% |
| Graduate / Professional | 10 | 0.9% |
| Total | 1,148 | 100.0% |
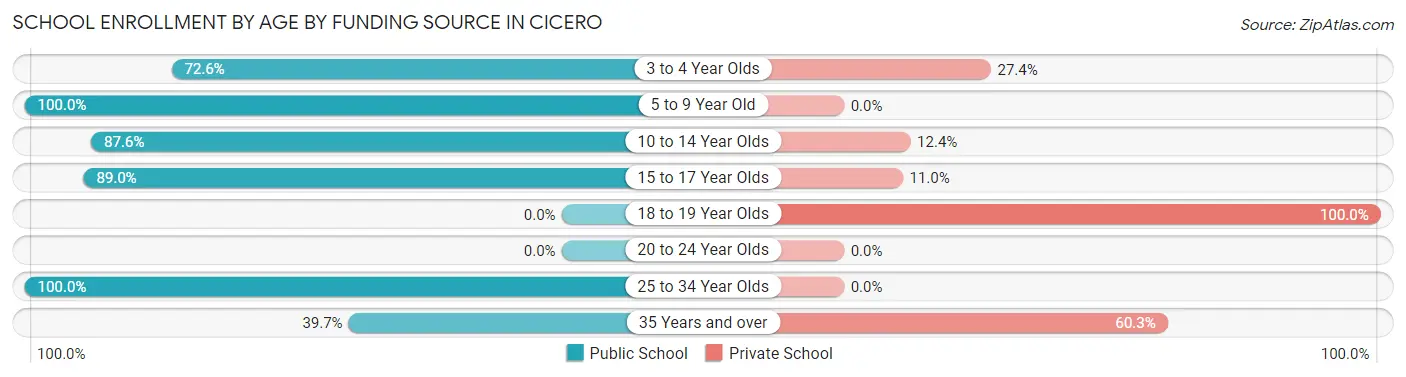
School Enrollment by Age by Funding Source in Cicero
Out of a total of 1,148 students who are enrolled in schools in Cicero, 191 (16.6%) attend a private institution, while the remaining 957 (83.4%) are enrolled in public schools. The age group of 18 to 19 year olds has the highest likelihood of being enrolled in private schools, with 44 (100.0% in the age bracket) enrolled. Conversely, the age group of 5 to 9 year old has the lowest likelihood of being enrolled in a private school, with 259 (100.0% in the age bracket) attending a public institution.
| Age Bracket | Public School | Private School |
| 3 to 4 Year Olds | 77 (72.6%) | 29 (27.4%) |
| 5 to 9 Year Old | 259 (100.0%) | 0 (0.0%) |
| 10 to 14 Year Olds | 375 (87.6%) | 53 (12.4%) |
| 15 to 17 Year Olds | 211 (89.0%) | 26 (11.0%) |
| 18 to 19 Year Olds | 0 (0.0%) | 44 (100.0%) |
| 20 to 24 Year Olds | 0 (0.0%) | 0 (0.0%) |
| 25 to 34 Year Olds | 11 (100.0%) | 0 (0.0%) |
| 35 Years and over | 25 (39.7%) | 38 (60.3%) |
| Total | 957 (83.4%) | 191 (16.6%) |
Educational Attainment by Field of Study in Cicero
Business (305 | 23.3%), education (234 | 17.9%), social sciences (158 | 12.1%), science & technology (118 | 9.0%), and physical & health sciences (100 | 7.6%) are the most common fields of study among 1,308 individuals in Cicero who have obtained a bachelor's degree or higher.
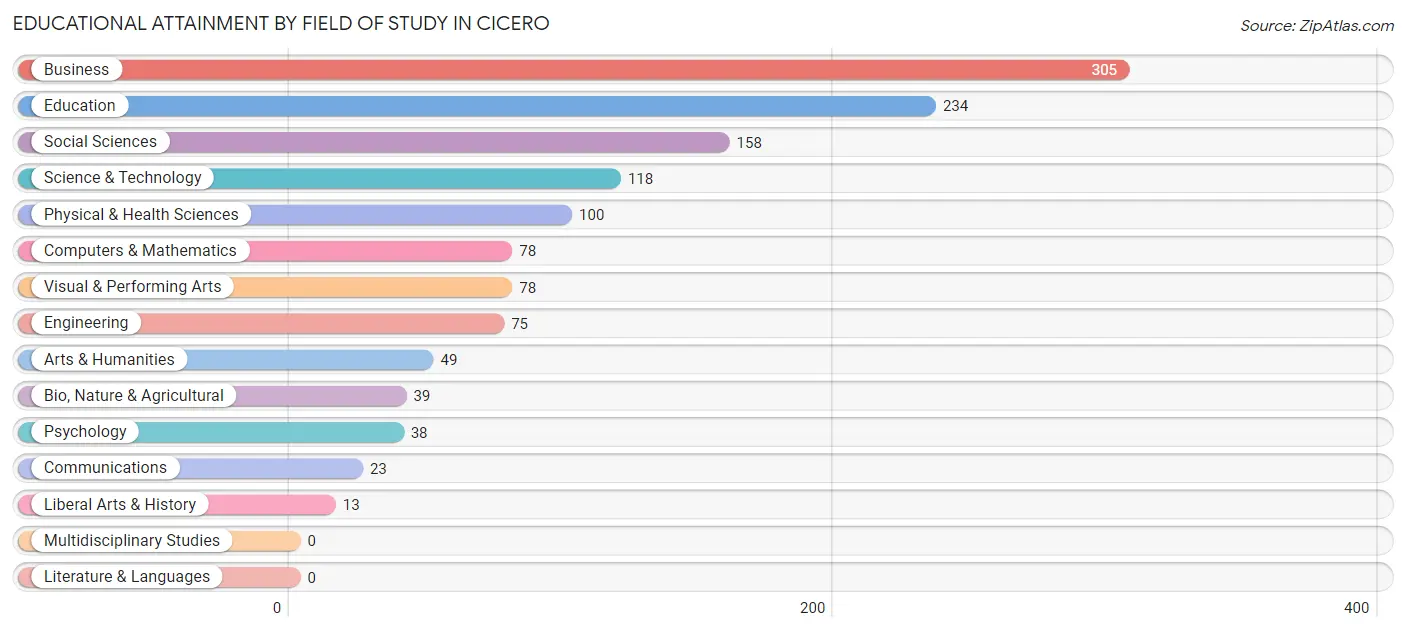
| Field of Study | # Graduates | % Graduates |
| Computers & Mathematics | 78 | 6.0% |
| Bio, Nature & Agricultural | 39 | 3.0% |
| Physical & Health Sciences | 100 | 7.6% |
| Psychology | 38 | 2.9% |
| Social Sciences | 158 | 12.1% |
| Engineering | 75 | 5.7% |
| Multidisciplinary Studies | 0 | 0.0% |
| Science & Technology | 118 | 9.0% |
| Business | 305 | 23.3% |
| Education | 234 | 17.9% |
| Literature & Languages | 0 | 0.0% |
| Liberal Arts & History | 13 | 1.0% |
| Visual & Performing Arts | 78 | 6.0% |
| Communications | 23 | 1.8% |
| Arts & Humanities | 49 | 3.7% |
| Total | 1,308 | 100.0% |
Transportation & Commute in Cicero
Vehicle Availability by Sex in Cicero
The most prevalent vehicle ownership categories in Cicero are males with 2 vehicles (614, accounting for 48.3%) and females with 2 vehicles (621, making up 47.0%).
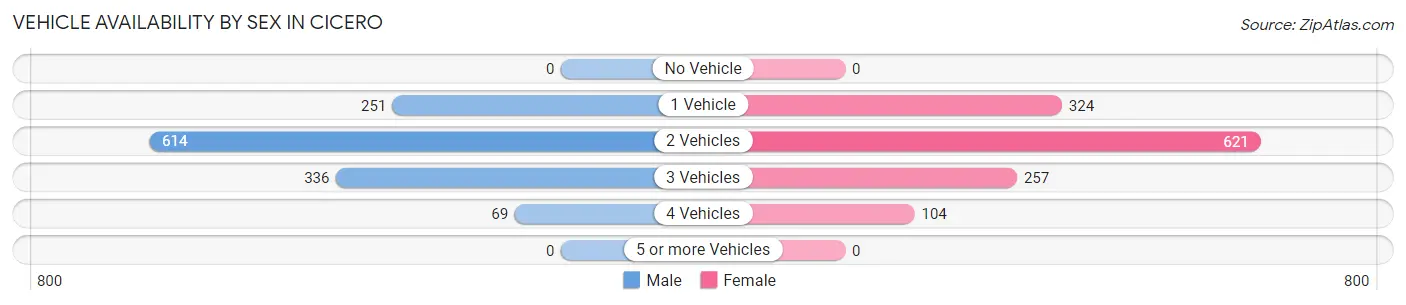
| Vehicles Available | Male | Female |
| No Vehicle | 0 (0.0%) | 0 (0.0%) |
| 1 Vehicle | 251 (19.8%) | 324 (24.8%) |
| 2 Vehicles | 614 (48.3%) | 621 (47.5%) |
| 3 Vehicles | 336 (26.5%) | 257 (19.7%) |
| 4 Vehicles | 69 (5.4%) | 104 (8.0%) |
| 5 or more Vehicles | 0 (0.0%) | 0 (0.0%) |
| Total | 1,270 (100.0%) | 1,306 (100.0%) |
Commute Time in Cicero
The most frequently occuring commute durations in Cicero are 30 to 34 minutes (593 commuters, 26.4%), 45 to 59 minutes (372 commuters, 16.6%), and 15 to 19 minutes (264 commuters, 11.8%).
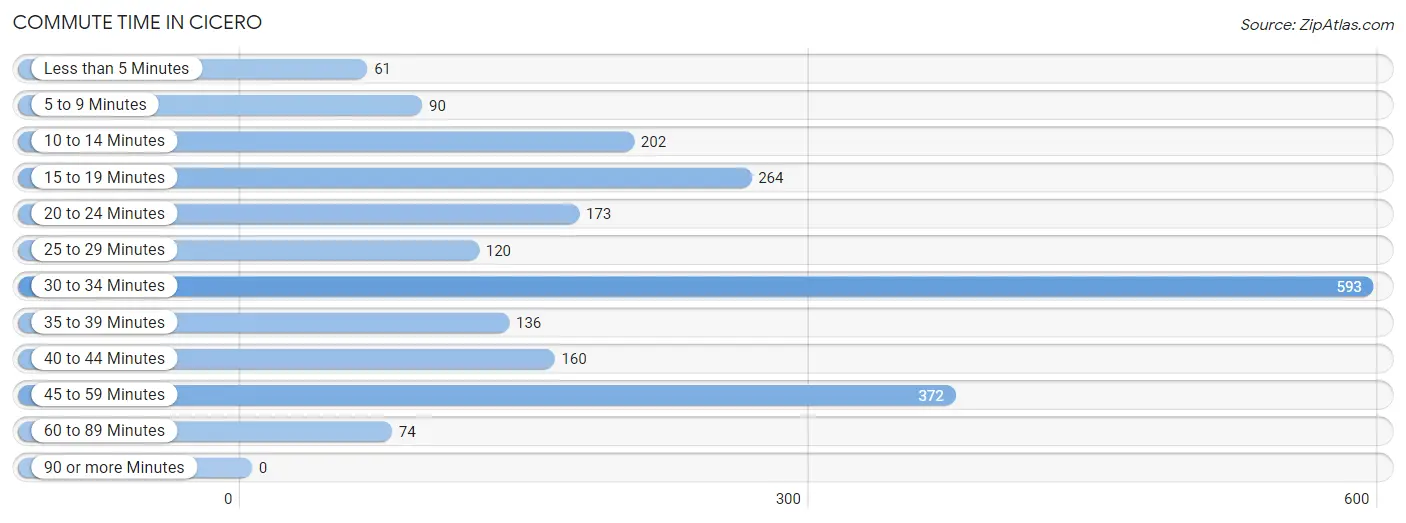
| Commute Time | # Commuters | % Commuters |
| Less than 5 Minutes | 61 | 2.7% |
| 5 to 9 Minutes | 90 | 4.0% |
| 10 to 14 Minutes | 202 | 9.0% |
| 15 to 19 Minutes | 264 | 11.8% |
| 20 to 24 Minutes | 173 | 7.7% |
| 25 to 29 Minutes | 120 | 5.3% |
| 30 to 34 Minutes | 593 | 26.4% |
| 35 to 39 Minutes | 136 | 6.1% |
| 40 to 44 Minutes | 160 | 7.1% |
| 45 to 59 Minutes | 372 | 16.6% |
| 60 to 89 Minutes | 74 | 3.3% |
| 90 or more Minutes | 0 | 0.0% |
Commute Time by Sex in Cicero
The most common commute times in Cicero are 30 to 34 minutes (314 commuters, 27.1%) for males and 30 to 34 minutes (279 commuters, 25.6%) for females.
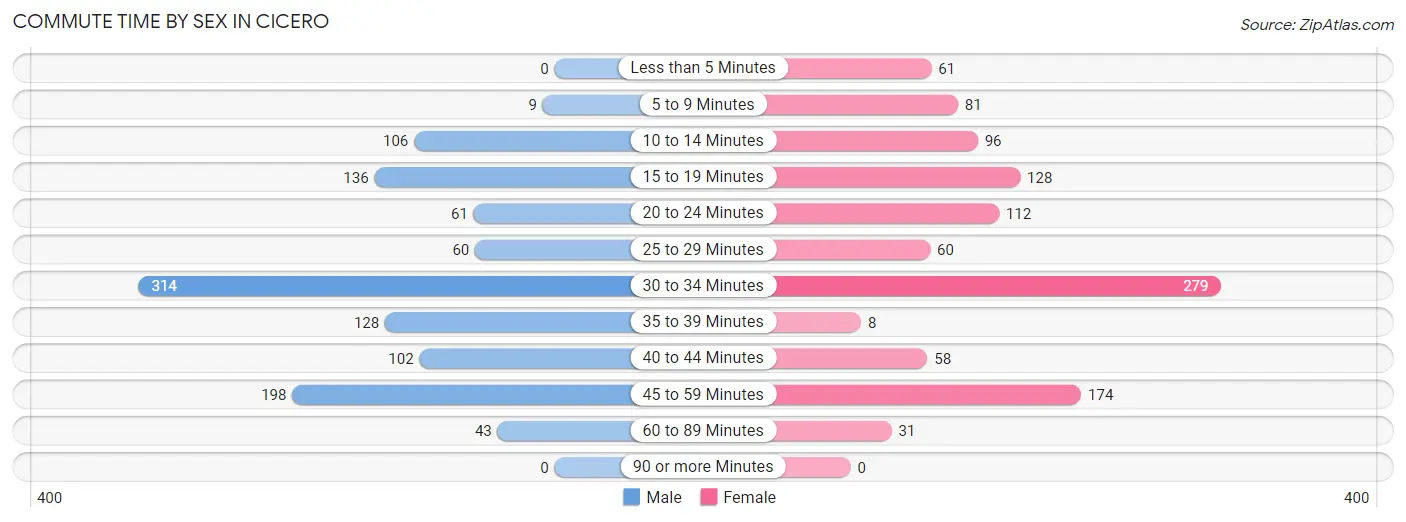
| Commute Time | Male | Female |
| Less than 5 Minutes | 0 (0.0%) | 61 (5.6%) |
| 5 to 9 Minutes | 9 (0.8%) | 81 (7.4%) |
| 10 to 14 Minutes | 106 (9.2%) | 96 (8.8%) |
| 15 to 19 Minutes | 136 (11.7%) | 128 (11.8%) |
| 20 to 24 Minutes | 61 (5.3%) | 112 (10.3%) |
| 25 to 29 Minutes | 60 (5.2%) | 60 (5.5%) |
| 30 to 34 Minutes | 314 (27.1%) | 279 (25.6%) |
| 35 to 39 Minutes | 128 (11.1%) | 8 (0.7%) |
| 40 to 44 Minutes | 102 (8.8%) | 58 (5.3%) |
| 45 to 59 Minutes | 198 (17.1%) | 174 (16.0%) |
| 60 to 89 Minutes | 43 (3.7%) | 31 (2.9%) |
| 90 or more Minutes | 0 (0.0%) | 0 (0.0%) |
Time of Departure to Work by Sex in Cicero
The most frequent times of departure to work in Cicero are 7:00 AM to 7:29 AM (270, 23.3%) for males and 7:00 AM to 7:29 AM (173, 15.9%) for females.
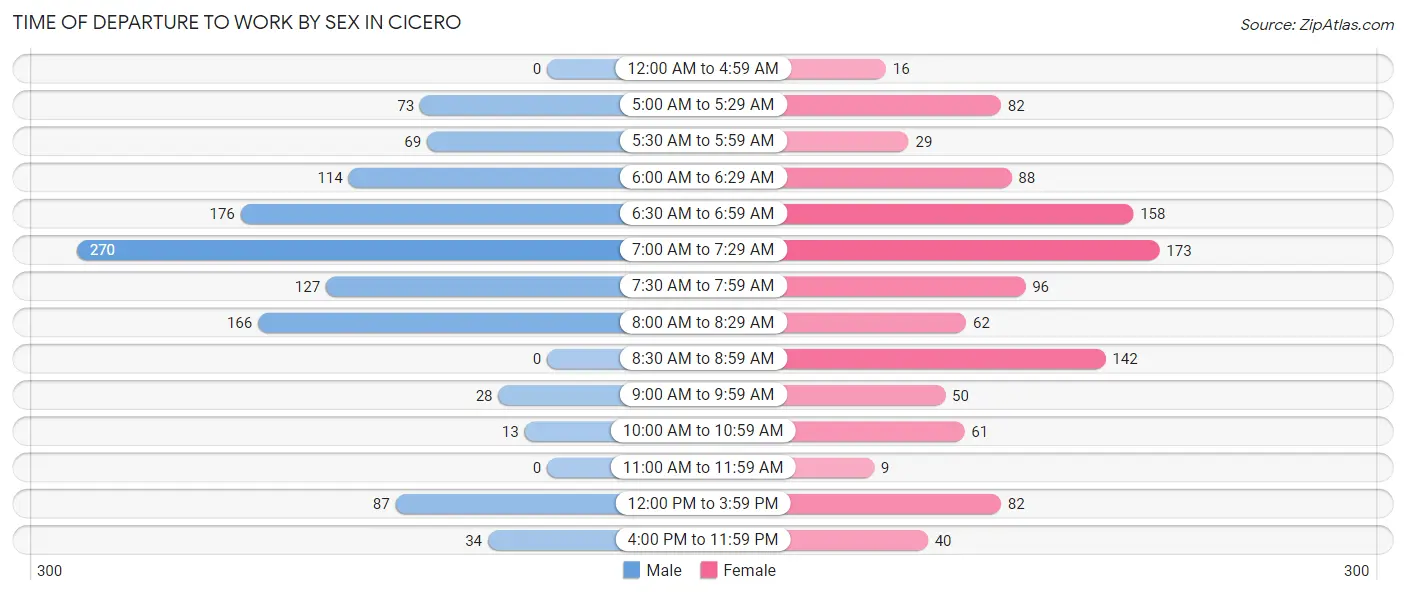
| Time of Departure | Male | Female |
| 12:00 AM to 4:59 AM | 0 (0.0%) | 16 (1.5%) |
| 5:00 AM to 5:29 AM | 73 (6.3%) | 82 (7.5%) |
| 5:30 AM to 5:59 AM | 69 (6.0%) | 29 (2.7%) |
| 6:00 AM to 6:29 AM | 114 (9.9%) | 88 (8.1%) |
| 6:30 AM to 6:59 AM | 176 (15.2%) | 158 (14.5%) |
| 7:00 AM to 7:29 AM | 270 (23.3%) | 173 (15.9%) |
| 7:30 AM to 7:59 AM | 127 (11.0%) | 96 (8.8%) |
| 8:00 AM to 8:29 AM | 166 (14.3%) | 62 (5.7%) |
| 8:30 AM to 8:59 AM | 0 (0.0%) | 142 (13.1%) |
| 9:00 AM to 9:59 AM | 28 (2.4%) | 50 (4.6%) |
| 10:00 AM to 10:59 AM | 13 (1.1%) | 61 (5.6%) |
| 11:00 AM to 11:59 AM | 0 (0.0%) | 9 (0.8%) |
| 12:00 PM to 3:59 PM | 87 (7.5%) | 82 (7.5%) |
| 4:00 PM to 11:59 PM | 34 (2.9%) | 40 (3.7%) |
| Total | 1,157 (100.0%) | 1,088 (100.0%) |
Housing Occupancy in Cicero
Occupancy by Ownership in Cicero
Of the total 2,313 dwellings in Cicero, owner-occupied units account for 1,895 (81.9%), while renter-occupied units make up 418 (18.1%).
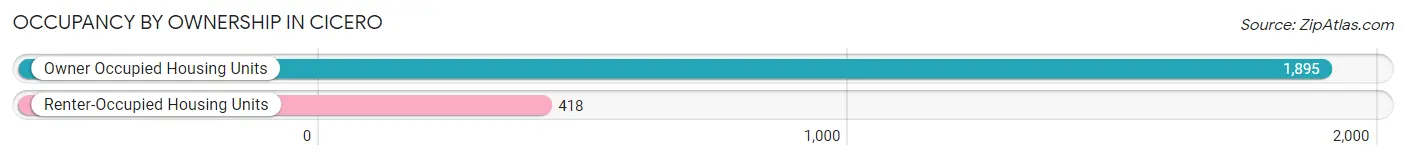
| Occupancy | # Housing Units | % Housing Units |
| Owner Occupied Housing Units | 1,895 | 81.9% |
| Renter-Occupied Housing Units | 418 | 18.1% |
| Total Occupied Housing Units | 2,313 | 100.0% |
Occupancy by Household Size in Cicero
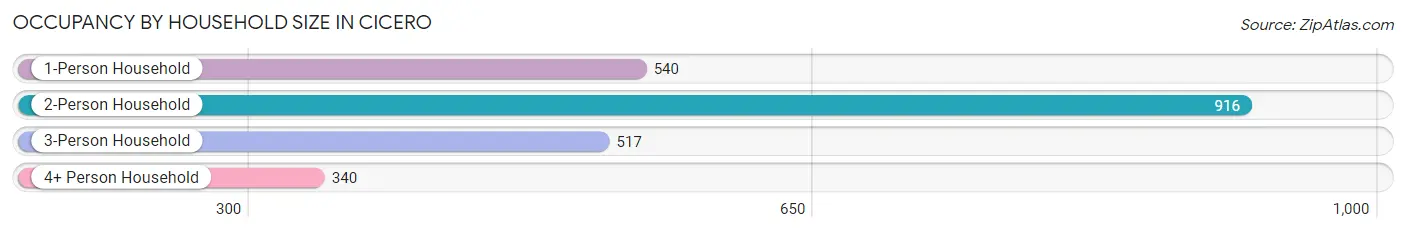
| Household Size | # Housing Units | % Housing Units |
| 1-Person Household | 540 | 23.4% |
| 2-Person Household | 916 | 39.6% |
| 3-Person Household | 517 | 22.4% |
| 4+ Person Household | 340 | 14.7% |
| Total Housing Units | 2,313 | 100.0% |
Occupancy by Ownership by Household Size in Cicero
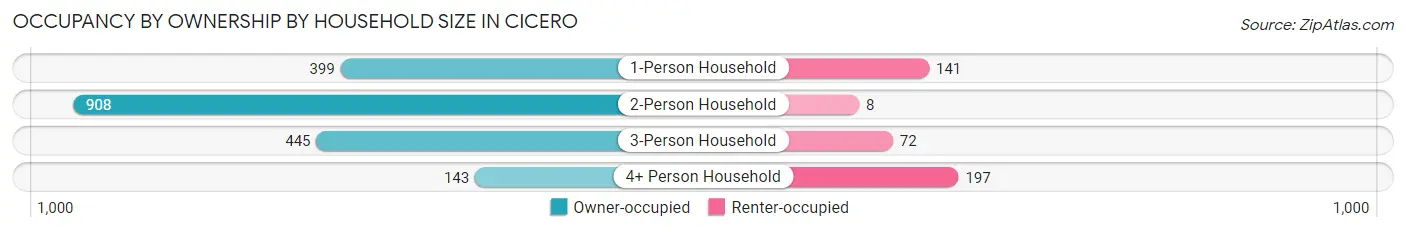
| Household Size | Owner-occupied | Renter-occupied |
| 1-Person Household | 399 (73.9%) | 141 (26.1%) |
| 2-Person Household | 908 (99.1%) | 8 (0.9%) |
| 3-Person Household | 445 (86.1%) | 72 (13.9%) |
| 4+ Person Household | 143 (42.1%) | 197 (57.9%) |
| Total Housing Units | 1,895 (81.9%) | 418 (18.1%) |
Occupancy by Educational Attainment in Cicero
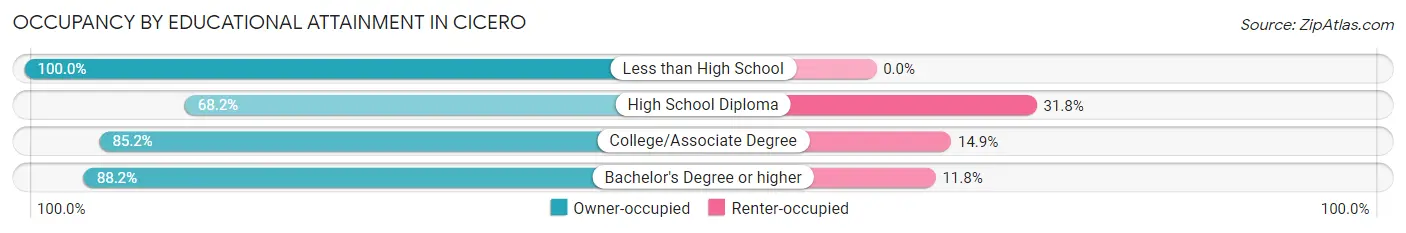
| Household Size | Owner-occupied | Renter-occupied |
| Less than High School | 33 (100.0%) | 0 (0.0%) |
| High School Diploma | 412 (68.2%) | 192 (31.8%) |
| College/Associate Degree | 797 (85.2%) | 139 (14.8%) |
| Bachelor's Degree or higher | 653 (88.2%) | 87 (11.8%) |
Occupancy by Age of Householder in Cicero
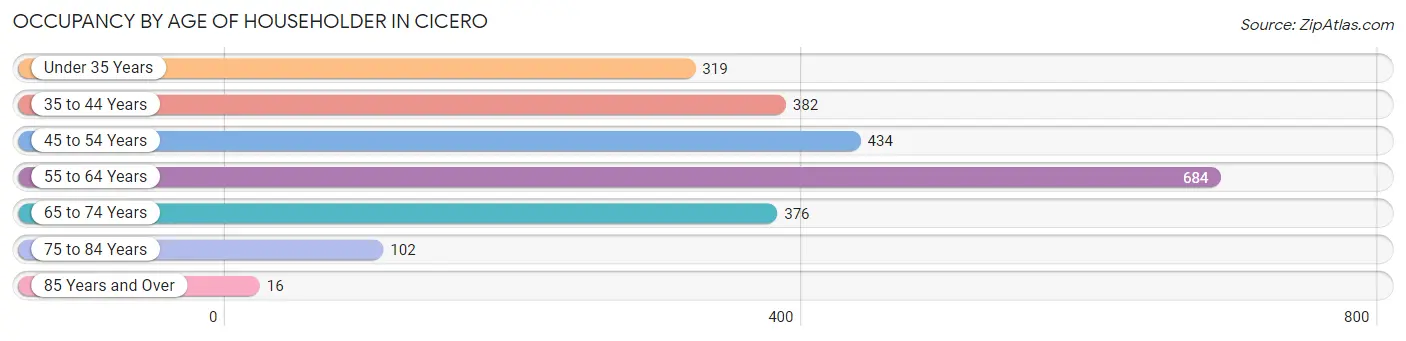
| Age Bracket | # Households | % Households |
| Under 35 Years | 319 | 13.8% |
| 35 to 44 Years | 382 | 16.5% |
| 45 to 54 Years | 434 | 18.8% |
| 55 to 64 Years | 684 | 29.6% |
| 65 to 74 Years | 376 | 16.3% |
| 75 to 84 Years | 102 | 4.4% |
| 85 Years and Over | 16 | 0.7% |
| Total | 2,313 | 100.0% |
Housing Finances in Cicero
Median Income by Occupancy in Cicero
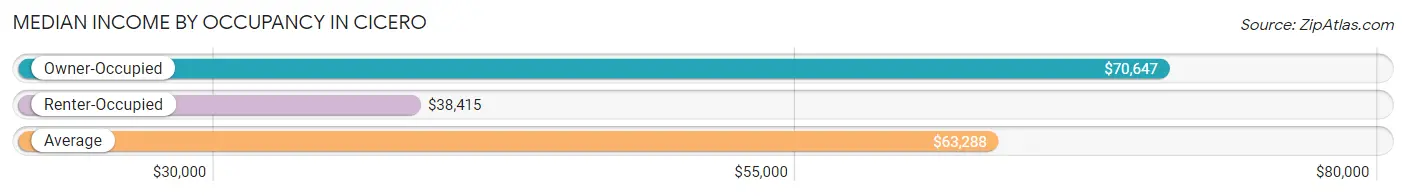
| Occupancy Type | # Households | Median Income |
| Owner-Occupied | 1,895 (81.9%) | $70,647 |
| Renter-Occupied | 418 (18.1%) | $38,415 |
| Average | 2,313 (100.0%) | $63,288 |
Occupancy by Householder Income Bracket in Cicero
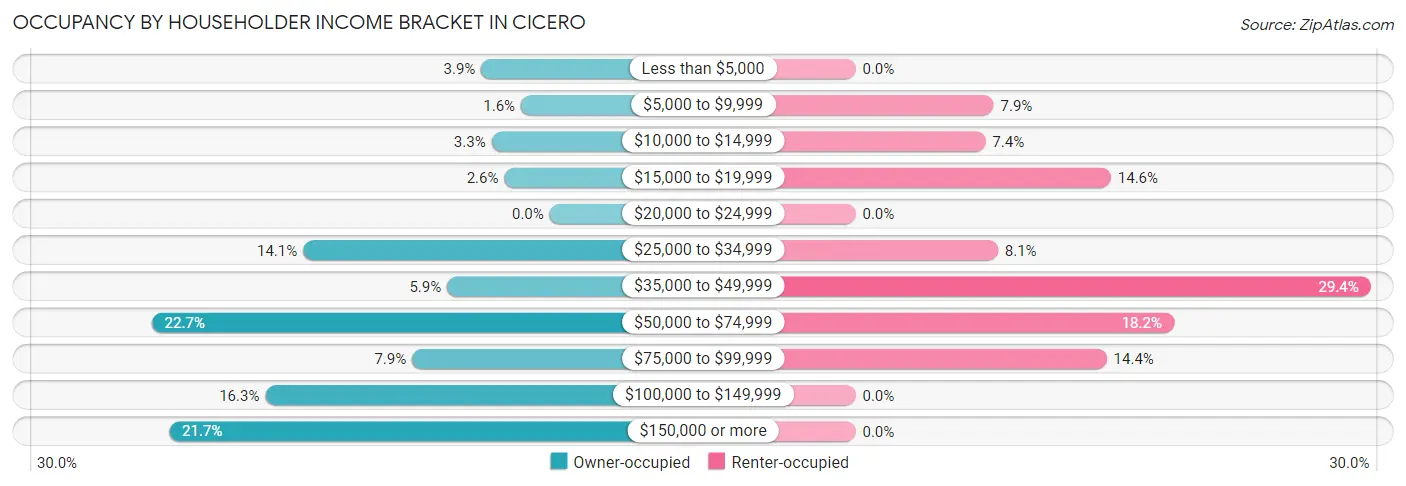
| Income Bracket | Owner-occupied | Renter-occupied |
| Less than $5,000 | 74 (3.9%) | 0 (0.0%) |
| $5,000 to $9,999 | 31 (1.6%) | 33 (7.9%) |
| $10,000 to $14,999 | 63 (3.3%) | 31 (7.4%) |
| $15,000 to $19,999 | 49 (2.6%) | 61 (14.6%) |
| $20,000 to $24,999 | 0 (0.0%) | 0 (0.0%) |
| $25,000 to $34,999 | 267 (14.1%) | 34 (8.1%) |
| $35,000 to $49,999 | 111 (5.9%) | 123 (29.4%) |
| $50,000 to $74,999 | 431 (22.7%) | 76 (18.2%) |
| $75,000 to $99,999 | 149 (7.9%) | 60 (14.3%) |
| $100,000 to $149,999 | 308 (16.3%) | 0 (0.0%) |
| $150,000 or more | 412 (21.7%) | 0 (0.0%) |
| Total | 1,895 (100.0%) | 418 (100.0%) |
Monthly Housing Cost Tiers in Cicero
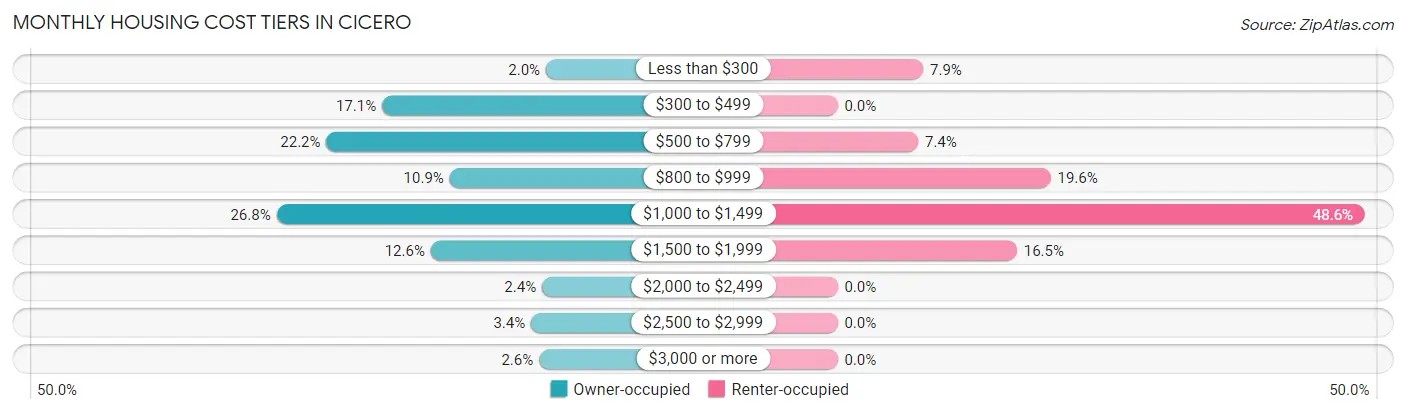
| Monthly Cost | Owner-occupied | Renter-occupied |
| Less than $300 | 38 (2.0%) | 33 (7.9%) |
| $300 to $499 | 324 (17.1%) | 0 (0.0%) |
| $500 to $799 | 421 (22.2%) | 31 (7.4%) |
| $800 to $999 | 206 (10.9%) | 82 (19.6%) |
| $1,000 to $1,499 | 508 (26.8%) | 203 (48.6%) |
| $1,500 to $1,999 | 239 (12.6%) | 69 (16.5%) |
| $2,000 to $2,499 | 45 (2.4%) | 0 (0.0%) |
| $2,500 to $2,999 | 64 (3.4%) | 0 (0.0%) |
| $3,000 or more | 50 (2.6%) | 0 (0.0%) |
| Total | 1,895 (100.0%) | 418 (100.0%) |
Physical Housing Characteristics in Cicero
Housing Structures in Cicero
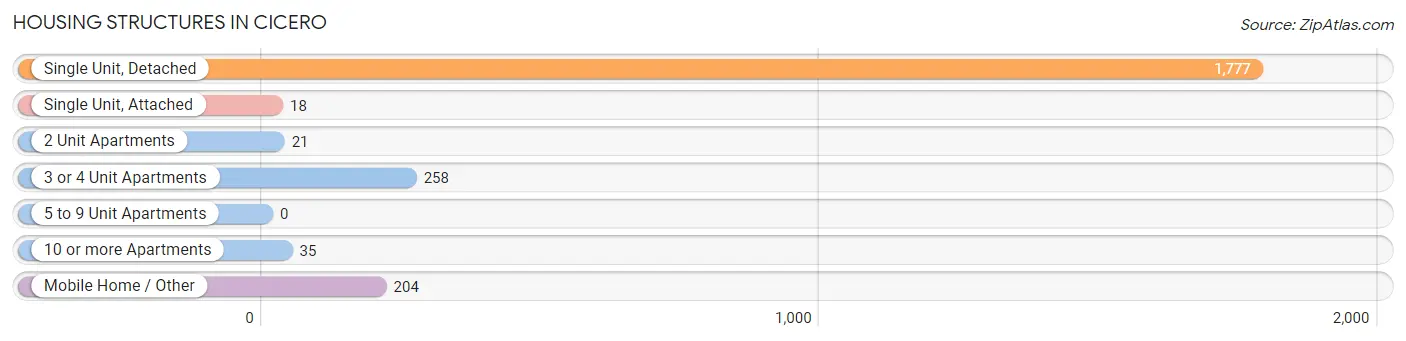
| Structure Type | # Housing Units | % Housing Units |
| Single Unit, Detached | 1,777 | 76.8% |
| Single Unit, Attached | 18 | 0.8% |
| 2 Unit Apartments | 21 | 0.9% |
| 3 or 4 Unit Apartments | 258 | 11.2% |
| 5 to 9 Unit Apartments | 0 | 0.0% |
| 10 or more Apartments | 35 | 1.5% |
| Mobile Home / Other | 204 | 8.8% |
| Total | 2,313 | 100.0% |
Housing Structures by Occupancy in Cicero
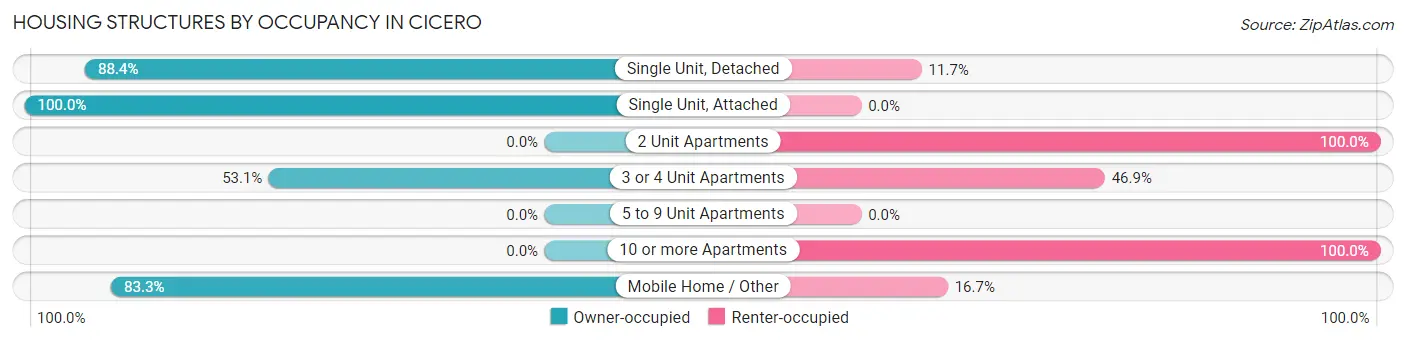
| Structure Type | Owner-occupied | Renter-occupied |
| Single Unit, Detached | 1,570 (88.3%) | 207 (11.7%) |
| Single Unit, Attached | 18 (100.0%) | 0 (0.0%) |
| 2 Unit Apartments | 0 (0.0%) | 21 (100.0%) |
| 3 or 4 Unit Apartments | 137 (53.1%) | 121 (46.9%) |
| 5 to 9 Unit Apartments | 0 (0.0%) | 0 (0.0%) |
| 10 or more Apartments | 0 (0.0%) | 35 (100.0%) |
| Mobile Home / Other | 170 (83.3%) | 34 (16.7%) |
| Total | 1,895 (81.9%) | 418 (18.1%) |
Housing Structures by Number of Rooms in Cicero
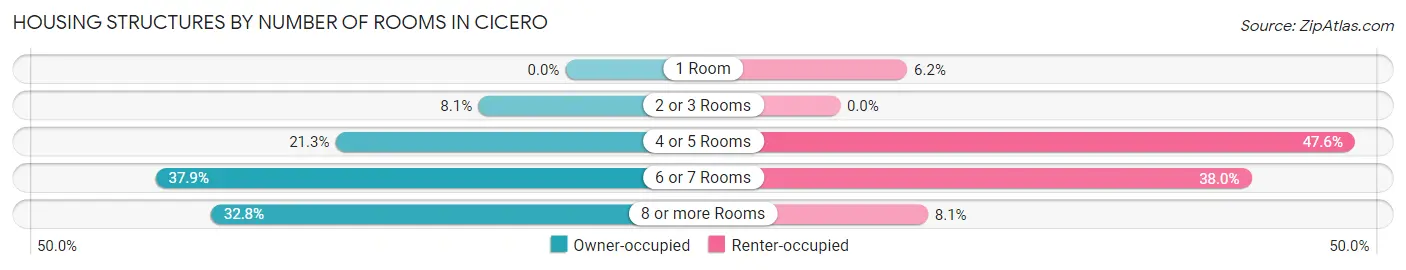
| Number of Rooms | Owner-occupied | Renter-occupied |
| 1 Room | 0 (0.0%) | 26 (6.2%) |
| 2 or 3 Rooms | 153 (8.1%) | 0 (0.0%) |
| 4 or 5 Rooms | 403 (21.3%) | 199 (47.6%) |
| 6 or 7 Rooms | 718 (37.9%) | 159 (38.0%) |
| 8 or more Rooms | 621 (32.8%) | 34 (8.1%) |
| Total | 1,895 (100.0%) | 418 (100.0%) |
Housing Structure by Heating Type in Cicero
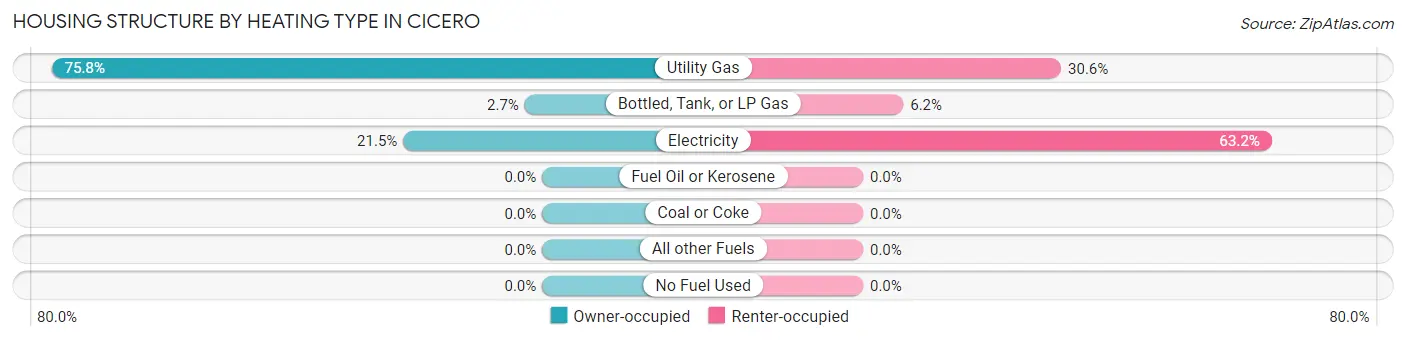
| Heating Type | Owner-occupied | Renter-occupied |
| Utility Gas | 1,437 (75.8%) | 128 (30.6%) |
| Bottled, Tank, or LP Gas | 51 (2.7%) | 26 (6.2%) |
| Electricity | 407 (21.5%) | 264 (63.2%) |
| Fuel Oil or Kerosene | 0 (0.0%) | 0 (0.0%) |
| Coal or Coke | 0 (0.0%) | 0 (0.0%) |
| All other Fuels | 0 (0.0%) | 0 (0.0%) |
| No Fuel Used | 0 (0.0%) | 0 (0.0%) |
| Total | 1,895 (100.0%) | 418 (100.0%) |
Household Vehicle Usage in Cicero
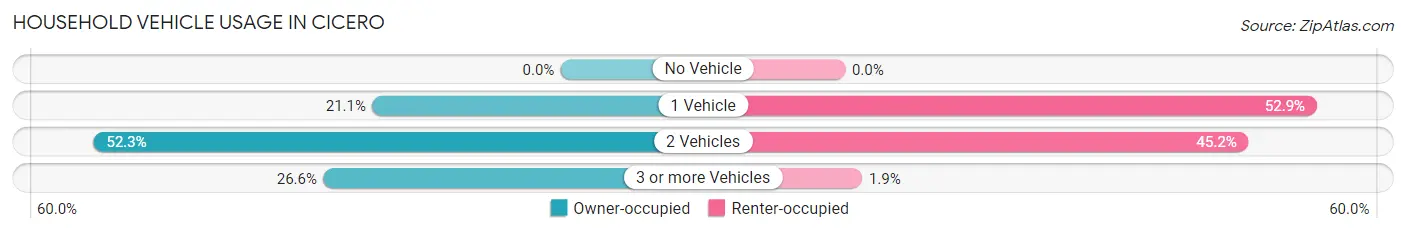
| Vehicles per Household | Owner-occupied | Renter-occupied |
| No Vehicle | 0 (0.0%) | 0 (0.0%) |
| 1 Vehicle | 400 (21.1%) | 221 (52.9%) |
| 2 Vehicles | 991 (52.3%) | 189 (45.2%) |
| 3 or more Vehicles | 504 (26.6%) | 8 (1.9%) |
| Total | 1,895 (100.0%) | 418 (100.0%) |
Real Estate & Mortgages in Cicero
Real Estate and Mortgage Overview in Cicero
| Characteristic | Without Mortgage | With Mortgage |
| Housing Units | 909 | 986 |
| Median Property Value | $263,400 | $225,700 |
| Median Household Income | $58,170 | $321 |
| Monthly Housing Costs | $611 | $50 |
| Real Estate Taxes | $2,174 | $0 |
Property Value by Mortgage Status in Cicero
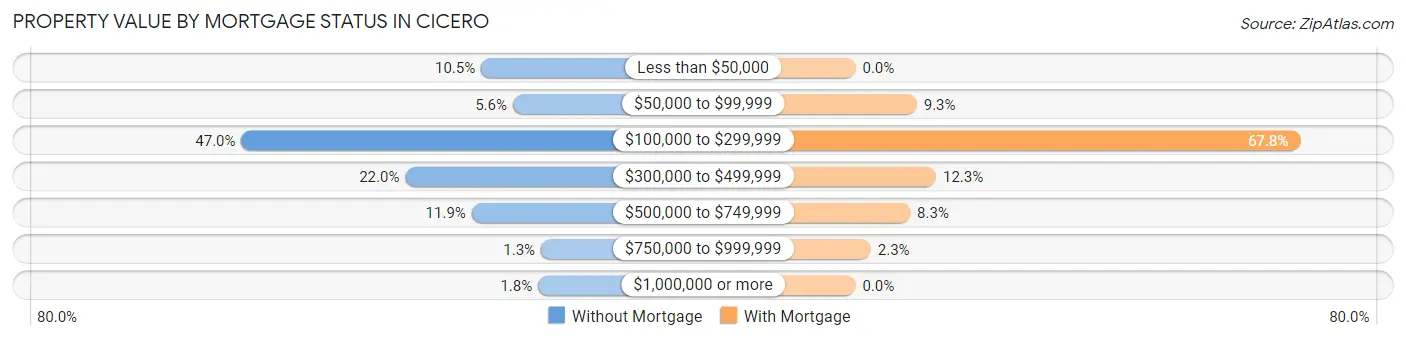
| Property Value | Without Mortgage | With Mortgage |
| Less than $50,000 | 95 (10.4%) | 0 (0.0%) |
| $50,000 to $99,999 | 51 (5.6%) | 92 (9.3%) |
| $100,000 to $299,999 | 427 (47.0%) | 668 (67.7%) |
| $300,000 to $499,999 | 200 (22.0%) | 121 (12.3%) |
| $500,000 to $749,999 | 108 (11.9%) | 82 (8.3%) |
| $750,000 to $999,999 | 12 (1.3%) | 23 (2.3%) |
| $1,000,000 or more | 16 (1.8%) | 0 (0.0%) |
| Total | 909 (100.0%) | 986 (100.0%) |
Household Income by Mortgage Status in Cicero
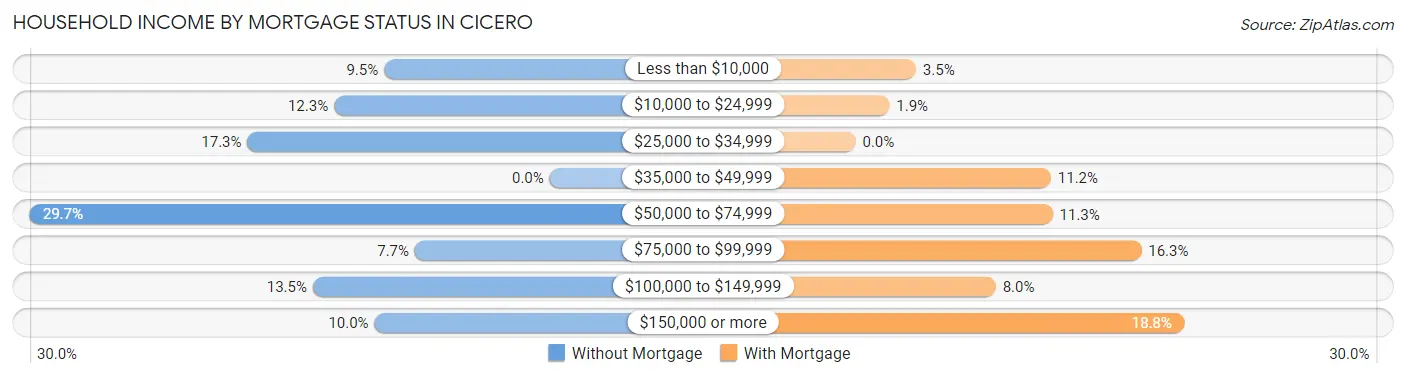
| Household Income | Without Mortgage | With Mortgage |
| Less than $10,000 | 86 (9.5%) | 34 (3.5%) |
| $10,000 to $24,999 | 112 (12.3%) | 19 (1.9%) |
| $25,000 to $34,999 | 157 (17.3%) | 0 (0.0%) |
| $35,000 to $49,999 | 0 (0.0%) | 110 (11.2%) |
| $50,000 to $74,999 | 270 (29.7%) | 111 (11.3%) |
| $75,000 to $99,999 | 70 (7.7%) | 161 (16.3%) |
| $100,000 to $149,999 | 123 (13.5%) | 79 (8.0%) |
| $150,000 or more | 91 (10.0%) | 185 (18.8%) |
| Total | 909 (100.0%) | 986 (100.0%) |
Property Value to Household Income Ratio in Cicero
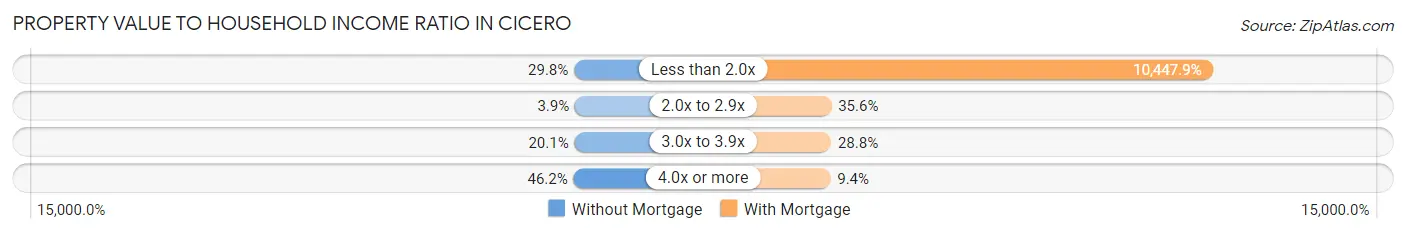
| Value-to-Income Ratio | Without Mortgage | With Mortgage |
| Less than 2.0x | 271 (29.8%) | 103,016 (10,447.9%) |
| 2.0x to 2.9x | 35 (3.8%) | 351 (35.6%) |
| 3.0x to 3.9x | 183 (20.1%) | 284 (28.8%) |
| 4.0x or more | 420 (46.2%) | 93 (9.4%) |
| Total | 909 (100.0%) | 986 (100.0%) |
Real Estate Taxes by Mortgage Status in Cicero
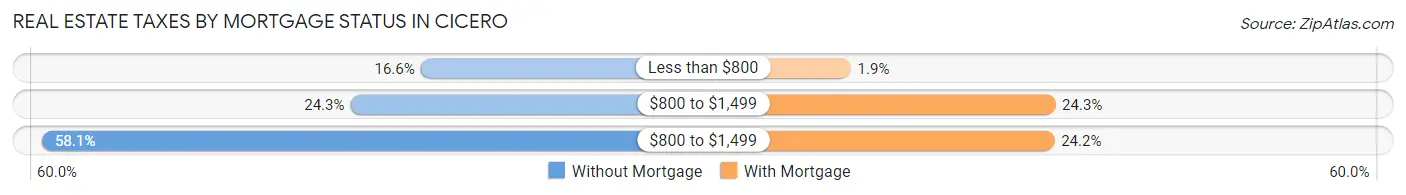
| Property Taxes | Without Mortgage | With Mortgage |
| Less than $800 | 151 (16.6%) | 19 (1.9%) |
| $800 to $1,499 | 221 (24.3%) | 240 (24.3%) |
| $800 to $1,499 | 528 (58.1%) | 239 (24.2%) |
| Total | 909 (100.0%) | 986 (100.0%) |
Health & Disability in Cicero
Health Insurance Coverage by Age in Cicero
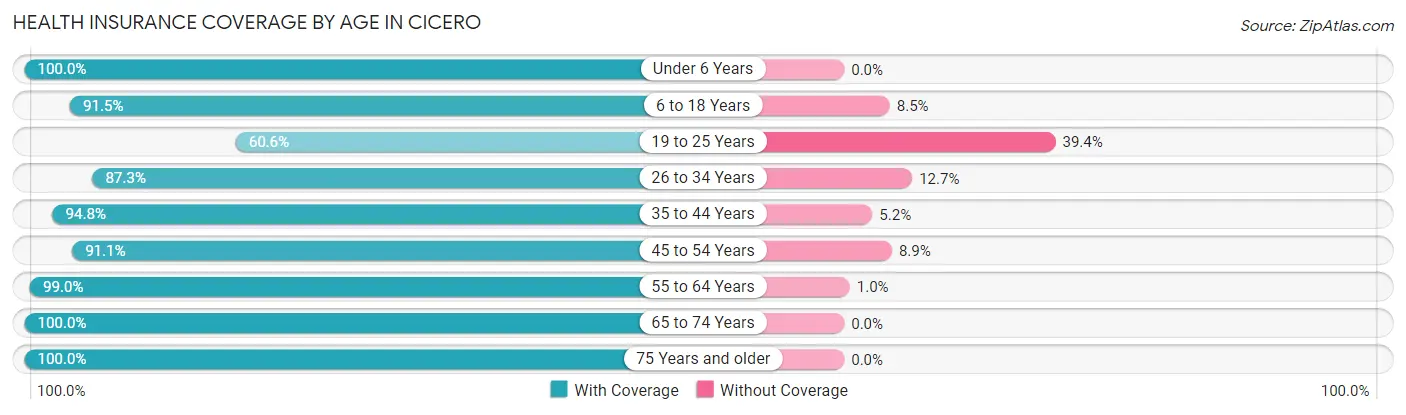
| Age Bracket | With Coverage | Without Coverage |
| Under 6 Years | 351 (100.0%) | 0 (0.0%) |
| 6 to 18 Years | 895 (91.5%) | 83 (8.5%) |
| 19 to 25 Years | 120 (60.6%) | 78 (39.4%) |
| 26 to 34 Years | 393 (87.3%) | 57 (12.7%) |
| 35 to 44 Years | 759 (94.8%) | 42 (5.2%) |
| 45 to 54 Years | 769 (91.1%) | 75 (8.9%) |
| 55 to 64 Years | 963 (99.0%) | 10 (1.0%) |
| 65 to 74 Years | 594 (100.0%) | 0 (0.0%) |
| 75 Years and older | 167 (100.0%) | 0 (0.0%) |
| Total | 5,011 (93.6%) | 345 (6.4%) |
Health Insurance Coverage by Citizenship Status in Cicero
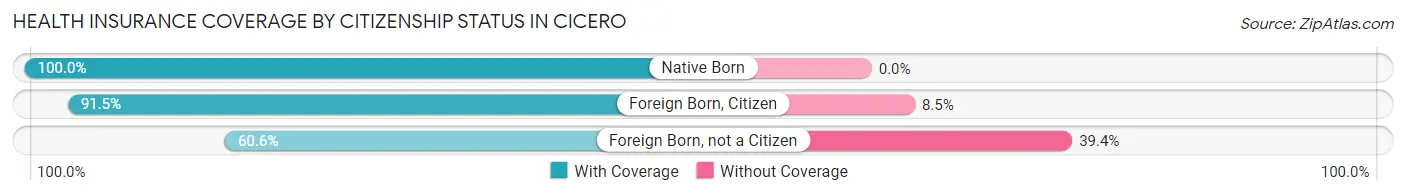
| Citizenship Status | With Coverage | Without Coverage |
| Native Born | 351 (100.0%) | 0 (0.0%) |
| Foreign Born, Citizen | 895 (91.5%) | 83 (8.5%) |
| Foreign Born, not a Citizen | 120 (60.6%) | 78 (39.4%) |
Health Insurance Coverage by Household Income in Cicero
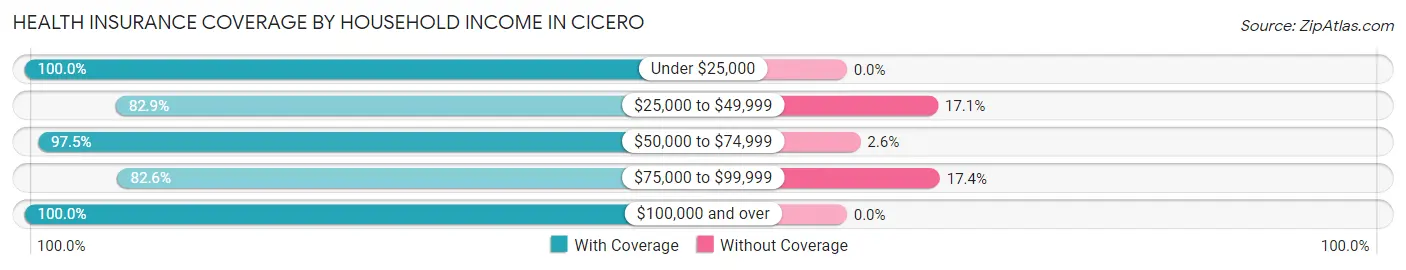
| Household Income | With Coverage | Without Coverage |
| Under $25,000 | 491 (100.0%) | 0 (0.0%) |
| $25,000 to $49,999 | 1,072 (82.9%) | 221 (17.1%) |
| $50,000 to $74,999 | 1,260 (97.5%) | 33 (2.5%) |
| $75,000 to $99,999 | 431 (82.6%) | 91 (17.4%) |
| $100,000 and over | 1,757 (100.0%) | 0 (0.0%) |
Public vs Private Health Insurance Coverage by Age in Cicero
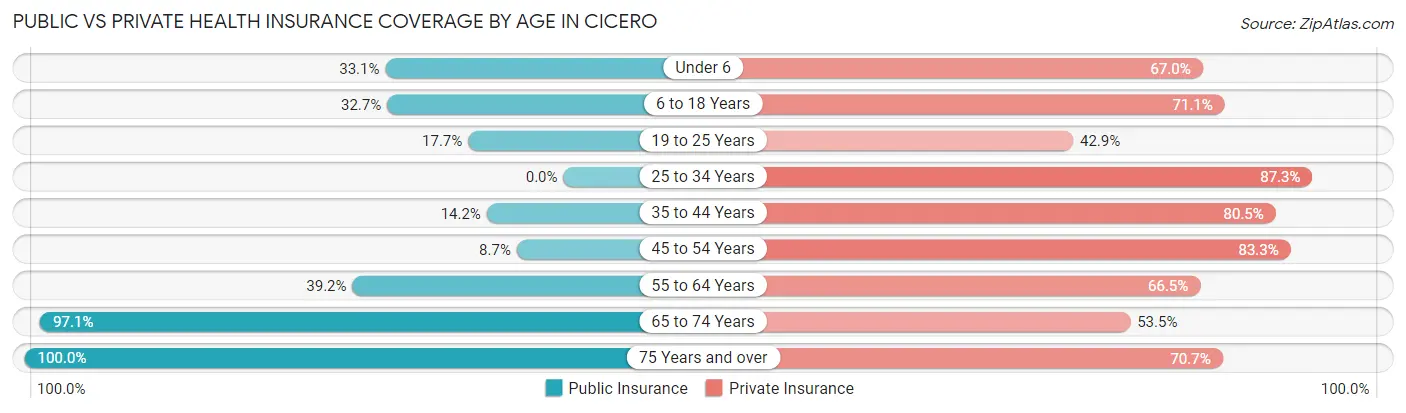
| Age Bracket | Public Insurance | Private Insurance |
| Under 6 | 116 (33.1%) | 235 (66.9%) |
| 6 to 18 Years | 320 (32.7%) | 695 (71.1%) |
| 19 to 25 Years | 35 (17.7%) | 85 (42.9%) |
| 25 to 34 Years | 0 (0.0%) | 393 (87.3%) |
| 35 to 44 Years | 114 (14.2%) | 645 (80.5%) |
| 45 to 54 Years | 73 (8.6%) | 703 (83.3%) |
| 55 to 64 Years | 381 (39.2%) | 647 (66.5%) |
| 65 to 74 Years | 577 (97.1%) | 318 (53.5%) |
| 75 Years and over | 167 (100.0%) | 118 (70.7%) |
| Total | 1,783 (33.3%) | 3,839 (71.7%) |
Disability Status by Sex by Age in Cicero
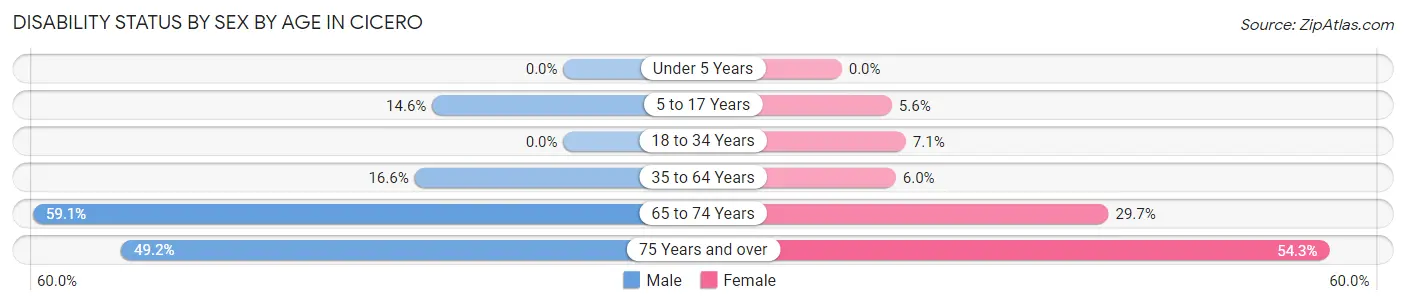
| Age Bracket | Male | Female |
| Under 5 Years | 0 (0.0%) | 0 (0.0%) |
| 5 to 17 Years | 71 (14.6%) | 25 (5.6%) |
| 18 to 34 Years | 0 (0.0%) | 28 (7.1%) |
| 35 to 64 Years | 222 (16.6%) | 77 (6.0%) |
| 65 to 74 Years | 166 (59.1%) | 93 (29.7%) |
| 75 Years and over | 65 (49.2%) | 19 (54.3%) |
Disability Class by Sex by Age in Cicero
Disability Class: Hearing Difficulty
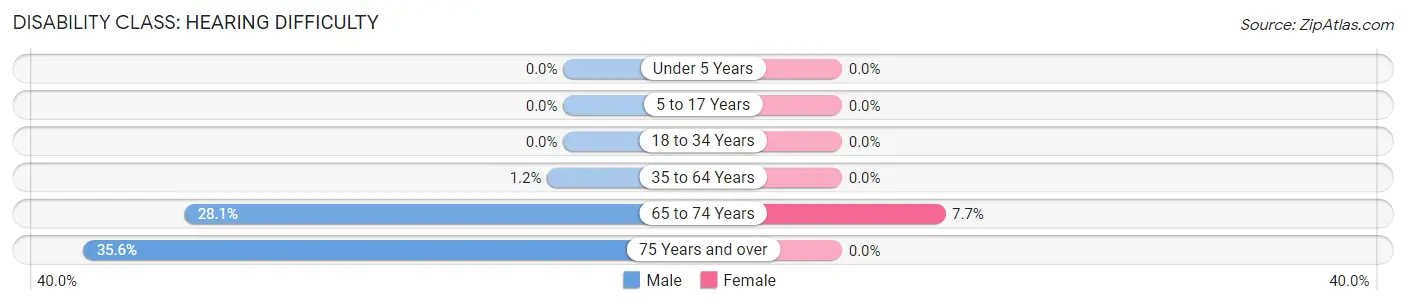
| Age Bracket | Male | Female |
| Under 5 Years | 0 (0.0%) | 0 (0.0%) |
| 5 to 17 Years | 0 (0.0%) | 0 (0.0%) |
| 18 to 34 Years | 0 (0.0%) | 0 (0.0%) |
| 35 to 64 Years | 16 (1.2%) | 0 (0.0%) |
| 65 to 74 Years | 79 (28.1%) | 24 (7.7%) |
| 75 Years and over | 47 (35.6%) | 0 (0.0%) |
Disability Class: Vision Difficulty
| Age Bracket | Male | Female |
| Under 5 Years | 0 (0.0%) | 0 (0.0%) |
| 5 to 17 Years | 0 (0.0%) | 0 (0.0%) |
| 18 to 34 Years | 0 (0.0%) | 0 (0.0%) |
| 35 to 64 Years | 0 (0.0%) | 0 (0.0%) |
| 65 to 74 Years | 0 (0.0%) | 0 (0.0%) |
| 75 Years and over | 0 (0.0%) | 0 (0.0%) |
Disability Class: Cognitive Difficulty
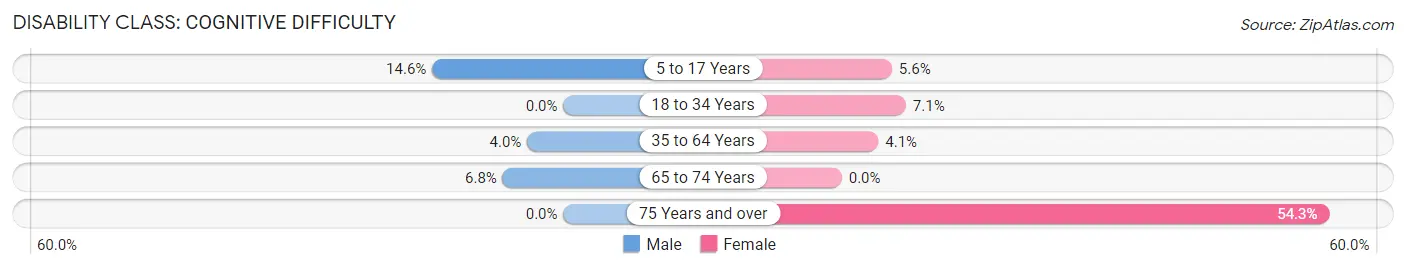
| Age Bracket | Male | Female |
| 5 to 17 Years | 71 (14.6%) | 25 (5.6%) |
| 18 to 34 Years | 0 (0.0%) | 28 (7.1%) |
| 35 to 64 Years | 54 (4.0%) | 52 (4.1%) |
| 65 to 74 Years | 19 (6.8%) | 0 (0.0%) |
| 75 Years and over | 0 (0.0%) | 19 (54.3%) |
Disability Class: Ambulatory Difficulty
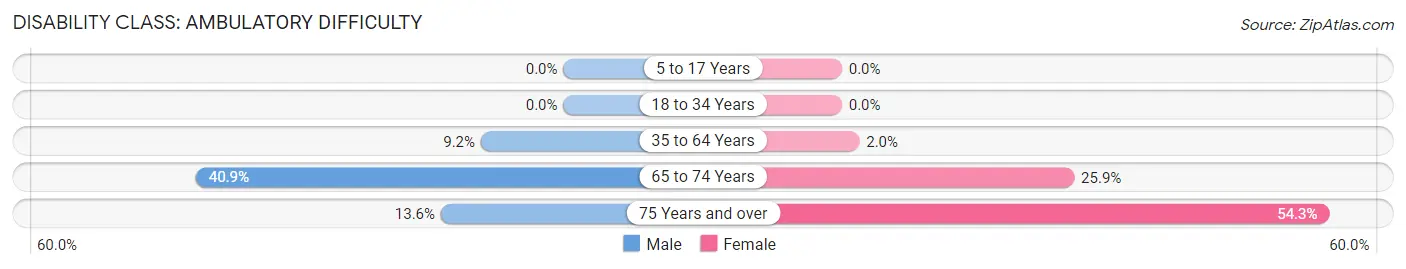
| Age Bracket | Male | Female |
| 5 to 17 Years | 0 (0.0%) | 0 (0.0%) |
| 18 to 34 Years | 0 (0.0%) | 0 (0.0%) |
| 35 to 64 Years | 123 (9.2%) | 25 (1.9%) |
| 65 to 74 Years | 115 (40.9%) | 81 (25.9%) |
| 75 Years and over | 18 (13.6%) | 19 (54.3%) |
Disability Class: Self-Care Difficulty
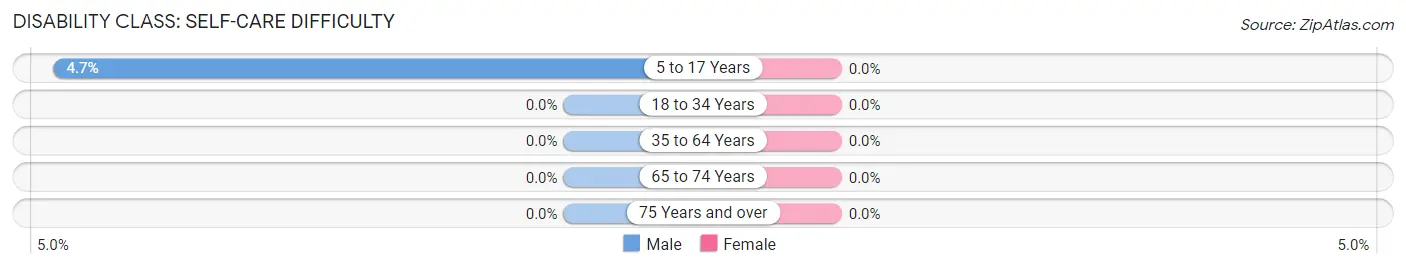
| Age Bracket | Male | Female |
| 5 to 17 Years | 23 (4.7%) | 0 (0.0%) |
| 18 to 34 Years | 0 (0.0%) | 0 (0.0%) |
| 35 to 64 Years | 0 (0.0%) | 0 (0.0%) |
| 65 to 74 Years | 0 (0.0%) | 0 (0.0%) |
| 75 Years and over | 0 (0.0%) | 0 (0.0%) |
Technology Access in Cicero
Computing Device Access in Cicero
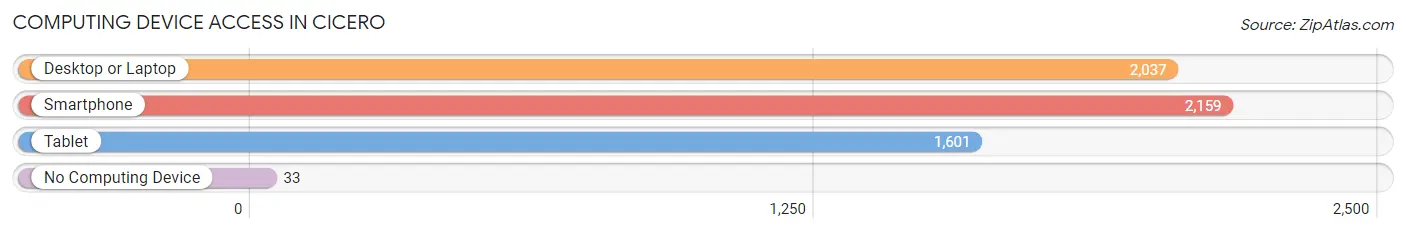
| Device Type | # Households | % Households |
| Desktop or Laptop | 2,037 | 88.1% |
| Smartphone | 2,159 | 93.3% |
| Tablet | 1,601 | 69.2% |
| No Computing Device | 33 | 1.4% |
| Total | 2,313 | 100.0% |
Internet Access in Cicero
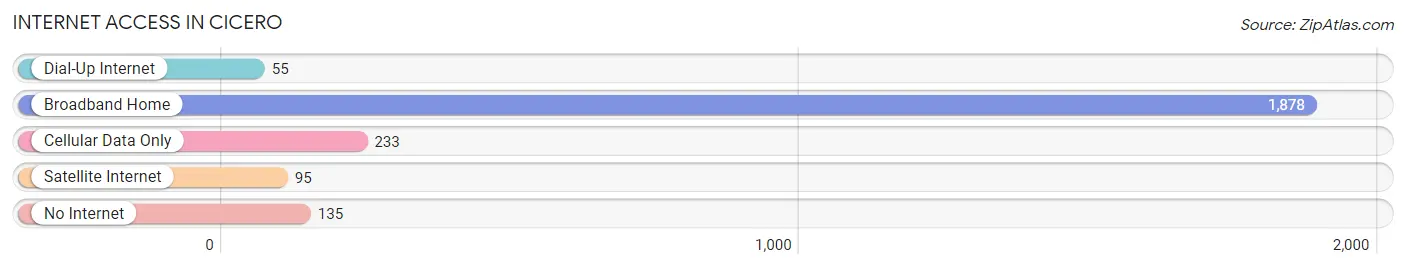
| Internet Type | # Households | % Households |
| Dial-Up Internet | 55 | 2.4% |
| Broadband Home | 1,878 | 81.2% |
| Cellular Data Only | 233 | 10.1% |
| Satellite Internet | 95 | 4.1% |
| No Internet | 135 | 5.8% |
| Total | 2,313 | 100.0% |
Cicero Summary
Cicero, Indiana is a small town located in Hamilton County, Indiana, about 25 miles north of Indianapolis. The town was founded in 1834 and has a population of about 6,000 people. The town is known for its small-town charm and its proximity to Indianapolis.
Geography
Cicero is located in the northern part of Hamilton County, Indiana, about 25 miles north of Indianapolis. The town is situated on the banks of the White River, which flows through the town. The town is surrounded by farmland and is bordered by the towns of Arcadia, Noblesville, and Fishers. The town is located in the Central Till Plains region of Indiana, which is characterized by flat terrain and rolling hills.
Economy
Cicero’s economy is largely based on agriculture and manufacturing. The town is home to several large agricultural operations, including a large dairy farm and a large hog farm. The town is also home to several manufacturing companies, including a plastics manufacturer and a metal fabrication company. The town is also home to several small businesses, including restaurants, retail stores, and service providers.
Demographics
As of the 2010 census, the population of Cicero was 6,000 people. The town is predominantly white, with about 90% of the population being white. The town also has a small Hispanic population, with about 5% of the population being Hispanic. The median household income in Cicero is $50,000, and the median home value is $150,000.
History
Cicero was founded in 1834 by a group of settlers from Ohio. The town was named after the Roman statesman Cicero, and the town’s motto is “Cicero, the Town of Opportunity.” The town was originally a farming community, and the town’s economy was largely based on agriculture. In the late 19th century, the town began to industrialize, and several manufacturing companies were established in the town. The town continued to grow throughout the 20th century, and today it is a small but thriving community.
Cicero is a small town with a rich history and a bright future. The town is known for its small-town charm and its proximity to Indianapolis. The town is home to several large agricultural operations and manufacturing companies, and it is also home to several small businesses. The town has a diverse population and a median household income of $50,000. Cicero is a great place to live and work, and it is a great place to raise a family.
Common Questions
What is Per Capita Income in Cicero?
Per Capita income in Cicero is $40,385.
What is the Median Family Income in Cicero?
Median Family Income in Cicero is $70,444.
What is the Median Household income in Cicero?
Median Household Income in Cicero is $63,288.
What is Income or Wage Gap in Cicero?
Income or Wage Gap in Cicero is 47.9%.
Women in Cicero earn 52.1 cents for every dollar earned by a man.
What is Inequality or Gini Index in Cicero?
Inequality or Gini Index in Cicero is 0.49.
What is the Total Population of Cicero?
Total Population of Cicero is 5,356.
What is the Total Male Population of Cicero?
Total Male Population of Cicero is 2,741.
What is the Total Female Population of Cicero?
Total Female Population of Cicero is 2,615.
What is the Ratio of Males per 100 Females in Cicero?
There are 104.82 Males per 100 Females in Cicero.
What is the Ratio of Females per 100 Males in Cicero?
There are 95.40 Females per 100 Males in Cicero.
What is the Median Population Age in Cicero?
Median Population Age in Cicero is 43.7 Years.
What is the Average Family Size in Cicero
Average Family Size in Cicero is 2.6 People.
What is the Average Household Size in Cicero
Average Household Size in Cicero is 2.3 People.
How Large is the Labor Force in Cicero?
There are 2,698 People in the Labor Forcein in Cicero.
What is the Percentage of People in the Labor Force in Cicero?
63.7% of People are in the Labor Force in Cicero.
What is the Unemployment Rate in Cicero?
Unemployment Rate in Cicero is 0.9%.