Troy, IN Map & Demographics
Troy Map
Troy Overview
$20,999
PER CAPITA INCOME
$55,741
AVG FAMILY INCOME
$55,290
AVG HOUSEHOLD INCOME
40.5%
WAGE / INCOME GAP [ % ]
59.5¢/ $1
WAGE / INCOME GAP [ $ ]
$17,383
FAMILY INCOME DEFICIT
0.27
INEQUALITY / GINI INDEX
579
TOTAL POPULATION
253
MALE POPULATION
326
FEMALE POPULATION
77.61
MALES / 100 FEMALES
128.85
FEMALES / 100 MALES
32.9
MEDIAN AGE
3.4
AVG FAMILY SIZE
2.7
AVG HOUSEHOLD SIZE
203
LABOR FORCE [ PEOPLE ]
54.6%
PERCENT IN LABOR FORCE
2.0%
UNEMPLOYMENT RATE
Troy Zip Codes
Troy Area Codes
Income in Troy
Income Overview in Troy
Per Capita Income in Troy is $20,999, while median incomes of families and households are $55,741 and $55,290 respectively.
| Characteristic | Number | Measure |
| Per Capita Income | 579 | $20,999 |
| Median Family Income | 148 | $55,741 |
| Mean Family Income | 148 | $60,382 |
| Median Household Income | 215 | $55,290 |
| Mean Household Income | 215 | $56,257 |
| Income Deficit | 148 | $17,383 |
| Wage / Income Gap (%) | 579 | 40.49% |
| Wage / Income Gap ($) | 579 | 59.51¢ per $1 |
| Gini / Inequality Index | 579 | 0.27 |
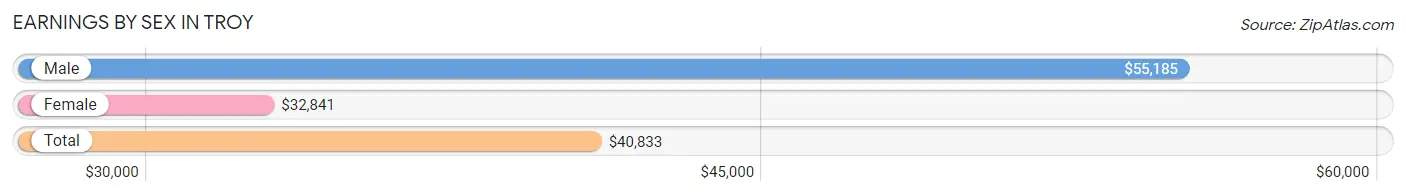
Earnings by Sex in Troy
Average Earnings in Troy are $40,833, $55,185 for men and $32,841 for women, a difference of 40.5%.
| Sex | Number | Average Earnings |
| Male | 144 (62.6%) | $55,185 |
| Female | 86 (37.4%) | $32,841 |
| Total | 230 (100.0%) | $40,833 |
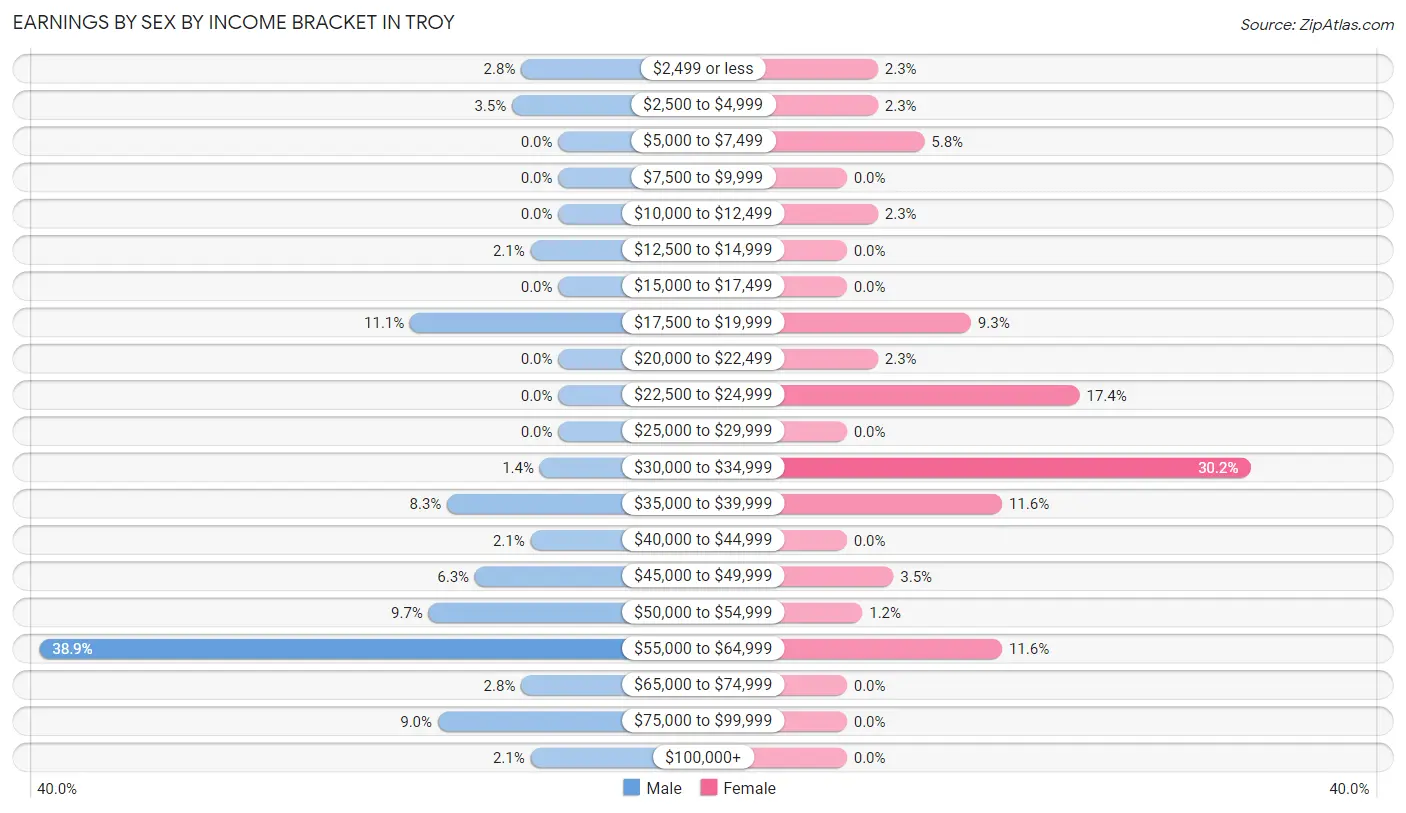
Earnings by Sex by Income Bracket in Troy
The most common earnings brackets in Troy are $55,000 to $64,999 for men (56 | 38.9%) and $30,000 to $34,999 for women (26 | 30.2%).
| Income | Male | Female |
| $2,499 or less | 4 (2.8%) | 2 (2.3%) |
| $2,500 to $4,999 | 5 (3.5%) | 2 (2.3%) |
| $5,000 to $7,499 | 0 (0.0%) | 5 (5.8%) |
| $7,500 to $9,999 | 0 (0.0%) | 0 (0.0%) |
| $10,000 to $12,499 | 0 (0.0%) | 2 (2.3%) |
| $12,500 to $14,999 | 3 (2.1%) | 0 (0.0%) |
| $15,000 to $17,499 | 0 (0.0%) | 0 (0.0%) |
| $17,500 to $19,999 | 16 (11.1%) | 8 (9.3%) |
| $20,000 to $22,499 | 0 (0.0%) | 2 (2.3%) |
| $22,500 to $24,999 | 0 (0.0%) | 15 (17.4%) |
| $25,000 to $29,999 | 0 (0.0%) | 0 (0.0%) |
| $30,000 to $34,999 | 2 (1.4%) | 26 (30.2%) |
| $35,000 to $39,999 | 12 (8.3%) | 10 (11.6%) |
| $40,000 to $44,999 | 3 (2.1%) | 0 (0.0%) |
| $45,000 to $49,999 | 9 (6.2%) | 3 (3.5%) |
| $50,000 to $54,999 | 14 (9.7%) | 1 (1.2%) |
| $55,000 to $64,999 | 56 (38.9%) | 10 (11.6%) |
| $65,000 to $74,999 | 4 (2.8%) | 0 (0.0%) |
| $75,000 to $99,999 | 13 (9.0%) | 0 (0.0%) |
| $100,000+ | 3 (2.1%) | 0 (0.0%) |
| Total | 144 (100.0%) | 86 (100.0%) |
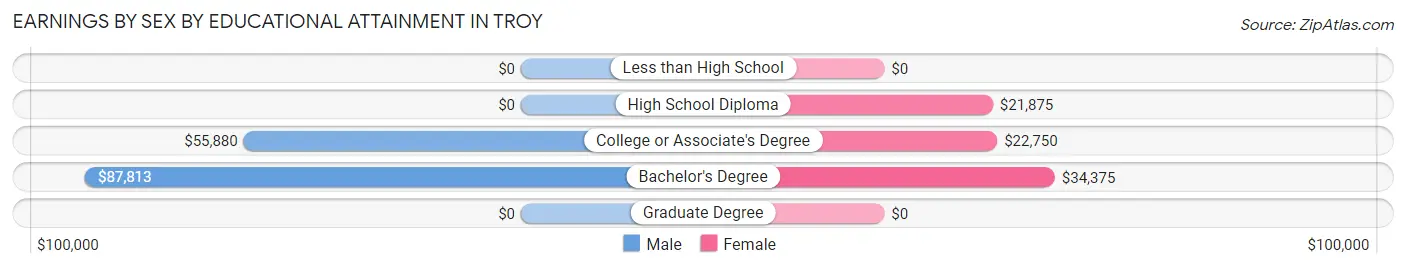
Earnings by Sex by Educational Attainment in Troy
Average earnings in Troy are $55,417 for men and $32,841 for women, a difference of 40.7%. Men with an educational attainment of bachelor's degree enjoy the highest average annual earnings of $87,813, while those with college or associate's degree education earn the least with $55,880. Women with an educational attainment of bachelor's degree earn the most with the average annual earnings of $34,375, while those with high school diploma education have the smallest earnings of $21,875.
| Educational Attainment | Male Income | Female Income |
| Less than High School | - | - |
| High School Diploma | - | - |
| College or Associate's Degree | $55,880 | $22,750 |
| Bachelor's Degree | $87,813 | $34,375 |
| Graduate Degree | - | - |
| Total | $55,417 | $32,841 |
Family Income in Troy
Family Income Brackets in Troy
According to the Troy family income data, there are 68 families falling into the $50,000 to $74,999 income range, which is the most common income bracket and makes up 46.0% of all families.
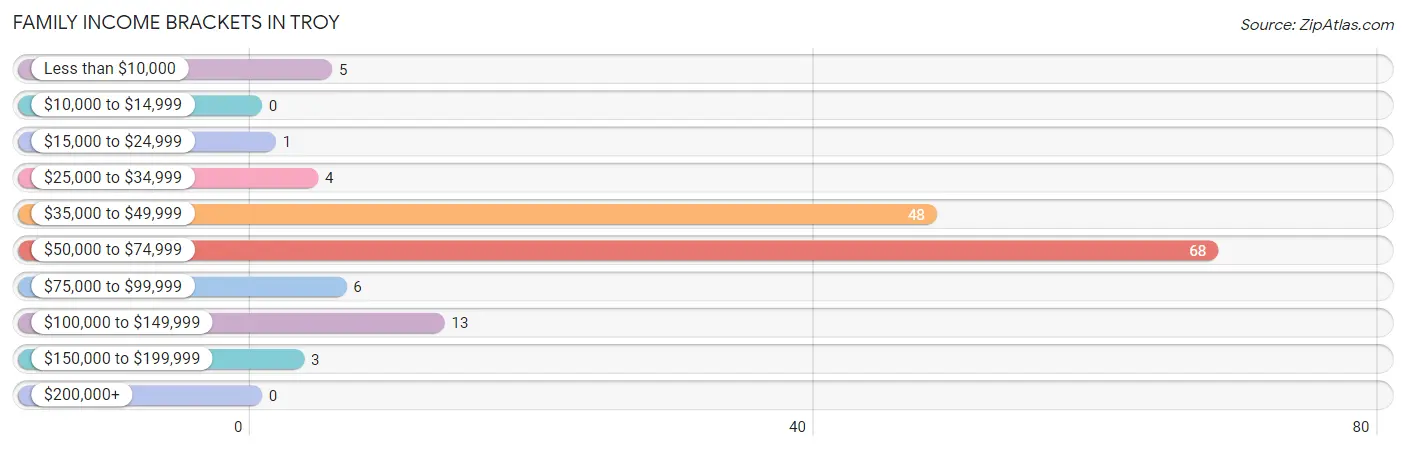
| Income Bracket | # Families | % Families |
| Less than $10,000 | 5 | 3.4% |
| $10,000 to $14,999 | 0 | 0.0% |
| $15,000 to $24,999 | 1 | 0.7% |
| $25,000 to $34,999 | 4 | 2.7% |
| $35,000 to $49,999 | 48 | 32.4% |
| $50,000 to $74,999 | 68 | 45.9% |
| $75,000 to $99,999 | 6 | 4.1% |
| $100,000 to $149,999 | 13 | 8.8% |
| $150,000 to $199,999 | 3 | 2.0% |
| $200,000+ | 0 | 0.0% |
Family Income by Famaliy Size in Troy
3-person families (76 | 51.3%) account for the highest median family income in Troy with $56,157 per family, while 2-person families (44 | 29.7%) have the highest median income of $22,084 per family member.
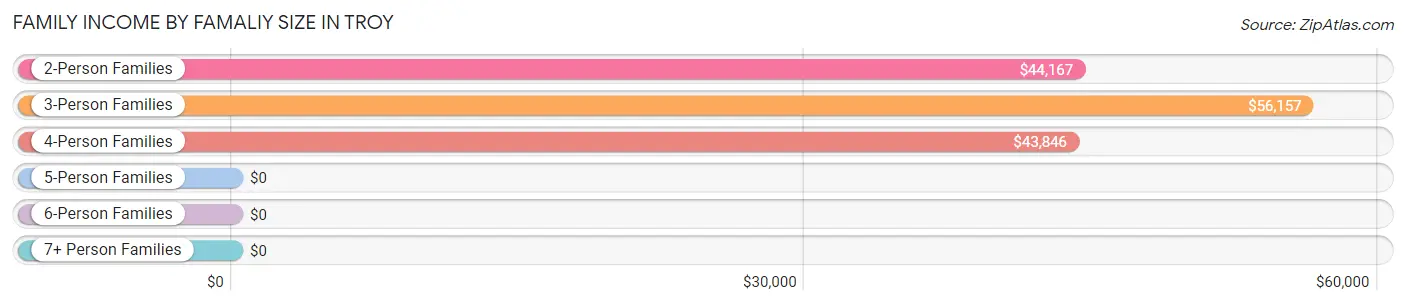
| Income Bracket | # Families | Median Income |
| 2-Person Families | 44 (29.7%) | $44,167 |
| 3-Person Families | 76 (51.3%) | $56,157 |
| 4-Person Families | 16 (10.8%) | $43,846 |
| 5-Person Families | 8 (5.4%) | $0 |
| 6-Person Families | 2 (1.3%) | $0 |
| 7+ Person Families | 2 (1.3%) | $0 |
| Total | 148 (100.0%) | $55,741 |
Family Income by Number of Earners in Troy
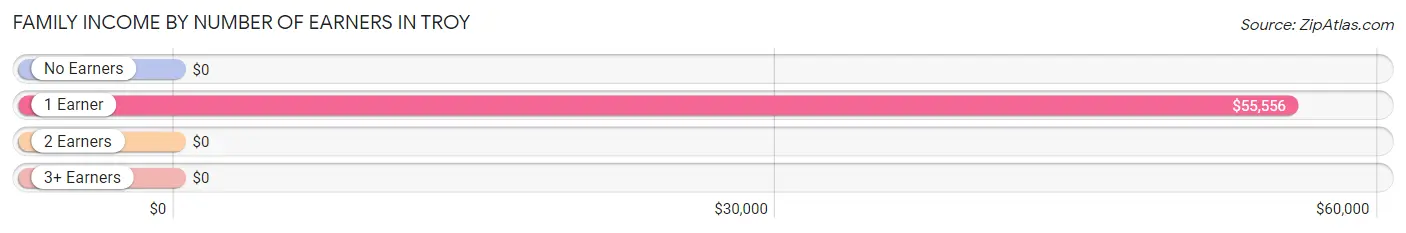
| Number of Earners | # Families | Median Income |
| No Earners | 19 (12.8%) | $0 |
| 1 Earner | 94 (63.5%) | $55,556 |
| 2 Earners | 30 (20.3%) | $0 |
| 3+ Earners | 5 (3.4%) | $0 |
| Total | 148 (100.0%) | $55,741 |
Household Income in Troy
Household Income Brackets in Troy
With 81 households falling in the category, the $50,000 to $74,999 income range is the most frequent in Troy, accounting for 37.7% of all households.
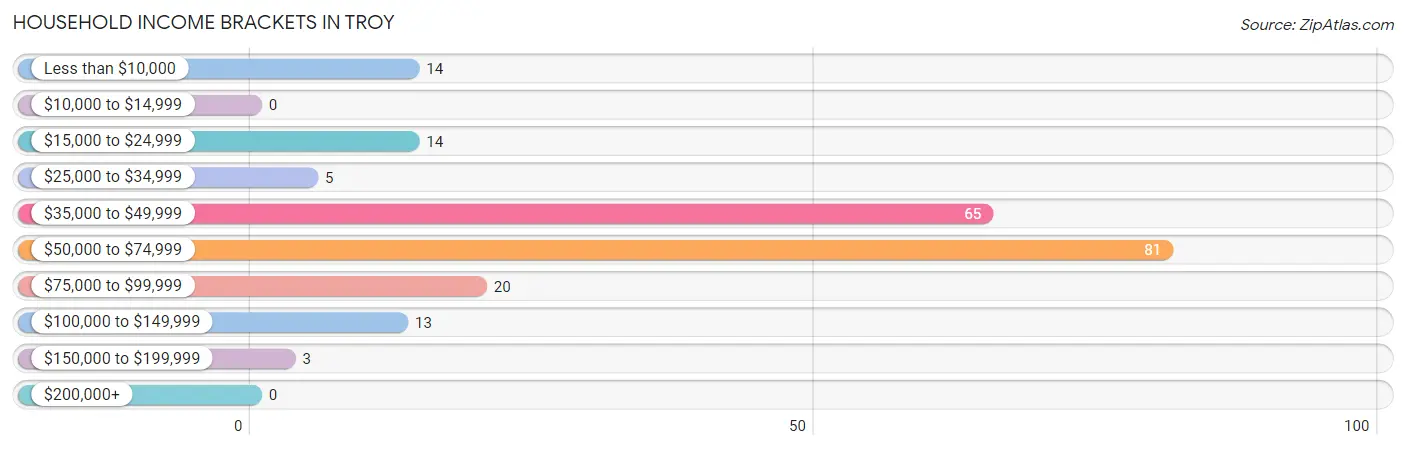
| Income Bracket | # Households | % Households |
| Less than $10,000 | 14 | 6.5% |
| $10,000 to $14,999 | 0 | 0.0% |
| $15,000 to $24,999 | 14 | 6.5% |
| $25,000 to $34,999 | 5 | 2.3% |
| $35,000 to $49,999 | 65 | 30.2% |
| $50,000 to $74,999 | 81 | 37.7% |
| $75,000 to $99,999 | 20 | 9.3% |
| $100,000 to $149,999 | 13 | 6.0% |
| $150,000 to $199,999 | 3 | 1.4% |
| $200,000+ | 0 | 0.0% |
Household Income by Householder Age in Troy
The median household income in Troy is $55,290, with the highest median household income of $56,389 found in the 25 to 44 years age bracket for the primary householder. A total of 100 households (46.5%) fall into this category. Meanwhile, the 15 to 24 years age bracket for the primary householder has the lowest median household income of $0, with 1 households (0.5%) in this group.
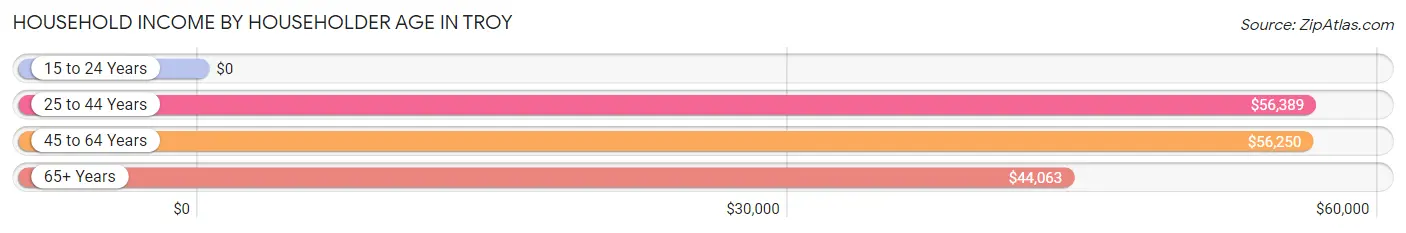
| Income Bracket | # Households | Median Income |
| 15 to 24 Years | 1 (0.5%) | $0 |
| 25 to 44 Years | 100 (46.5%) | $56,389 |
| 45 to 64 Years | 34 (15.8%) | $56,250 |
| 65+ Years | 80 (37.2%) | $44,063 |
| Total | 215 (100.0%) | $55,290 |
Poverty in Troy
Income Below Poverty by Sex and Age in Troy
With 6.7% poverty level for males and 4.3% for females among the residents of Troy, under 5 year old males and 12 to 14 year old females are the most vulnerable to poverty, with 3 males (23.1%) and 1 females (100.0%) in their respective age groups living below the poverty level.
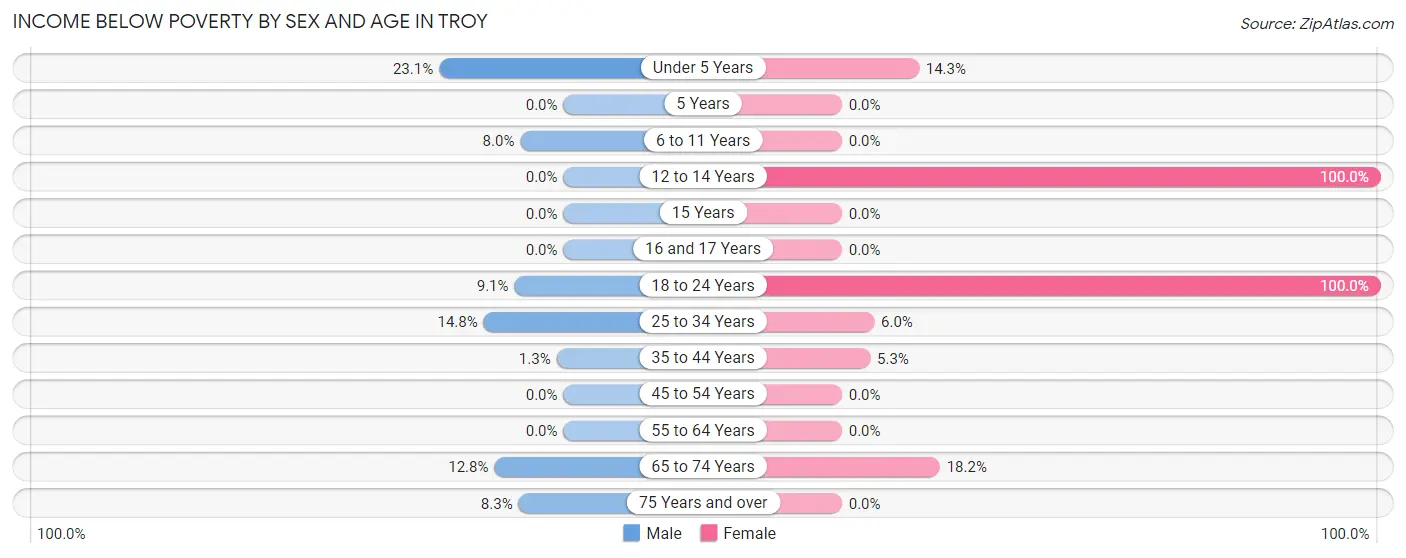
| Age Bracket | Male | Female |
| Under 5 Years | 3 (23.1%) | 2 (14.3%) |
| 5 Years | 0 (0.0%) | 0 (0.0%) |
| 6 to 11 Years | 2 (8.0%) | 0 (0.0%) |
| 12 to 14 Years | 0 (0.0%) | 1 (100.0%) |
| 15 Years | 0 (0.0%) | 0 (0.0%) |
| 16 and 17 Years | 0 (0.0%) | 0 (0.0%) |
| 18 to 24 Years | 1 (9.1%) | 1 (100.0%) |
| 25 to 34 Years | 4 (14.8%) | 3 (6.0%) |
| 35 to 44 Years | 1 (1.3%) | 1 (5.3%) |
| 45 to 54 Years | 0 (0.0%) | 0 (0.0%) |
| 55 to 64 Years | 0 (0.0%) | 0 (0.0%) |
| 65 to 74 Years | 5 (12.8%) | 6 (18.2%) |
| 75 Years and over | 1 (8.3%) | 0 (0.0%) |
| Total | 17 (6.7%) | 14 (4.3%) |
Income Above Poverty by Sex and Age in Troy
According to the poverty statistics in Troy, males aged 12 to 14 years and females aged 6 to 11 years are the age groups that are most secure financially, with 100.0% of males and 100.0% of females in these age groups living above the poverty line.
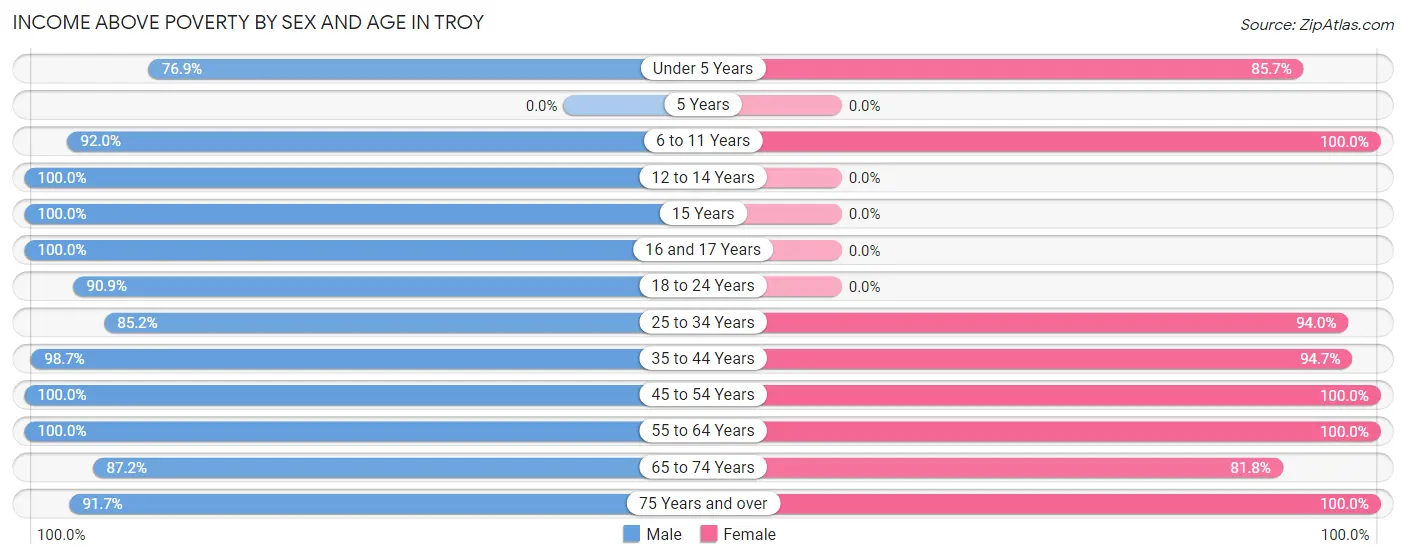
| Age Bracket | Male | Female |
| Under 5 Years | 10 (76.9%) | 12 (85.7%) |
| 5 Years | 0 (0.0%) | 0 (0.0%) |
| 6 to 11 Years | 23 (92.0%) | 142 (100.0%) |
| 12 to 14 Years | 9 (100.0%) | 0 (0.0%) |
| 15 Years | 3 (100.0%) | 0 (0.0%) |
| 16 and 17 Years | 3 (100.0%) | 0 (0.0%) |
| 18 to 24 Years | 10 (90.9%) | 0 (0.0%) |
| 25 to 34 Years | 23 (85.2%) | 47 (94.0%) |
| 35 to 44 Years | 78 (98.7%) | 18 (94.7%) |
| 45 to 54 Years | 26 (100.0%) | 37 (100.0%) |
| 55 to 64 Years | 6 (100.0%) | 7 (100.0%) |
| 65 to 74 Years | 34 (87.2%) | 27 (81.8%) |
| 75 Years and over | 11 (91.7%) | 22 (100.0%) |
| Total | 236 (93.3%) | 312 (95.7%) |
Income Below Poverty Among Married-Couple Families in Troy
The poverty statistics for married-couple families in Troy show that 4.9% or 6 of the total 123 families live below the poverty line. Families with no children have the highest poverty rate of 9.3%, comprising of 4 families. On the other hand, families with 1 or 2 children have the lowest poverty rate of 1.5%, which includes 1 families.
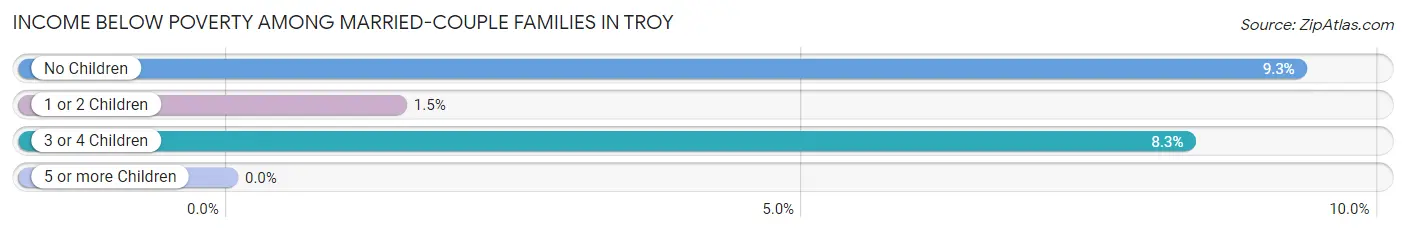
| Children | Above Poverty | Below Poverty |
| No Children | 39 (90.7%) | 4 (9.3%) |
| 1 or 2 Children | 67 (98.5%) | 1 (1.5%) |
| 3 or 4 Children | 11 (91.7%) | 1 (8.3%) |
| 5 or more Children | 0 (0.0%) | 0 (0.0%) |
| Total | 117 (95.1%) | 6 (4.9%) |
Income Below Poverty Among Single-Parent Households in Troy
| Children | Single Father | Single Mother |
| No Children | 0 (0.0%) | 0 (0.0%) |
| 1 or 2 Children | 0 (0.0%) | 0 (0.0%) |
| 3 or 4 Children | 0 (0.0%) | 0 (0.0%) |
| 5 or more Children | 0 (0.0%) | 0 (0.0%) |
| Total | 0 (0.0%) | 0 (0.0%) |
Income Below Poverty Among Married-Couple vs Single-Parent Households in Troy
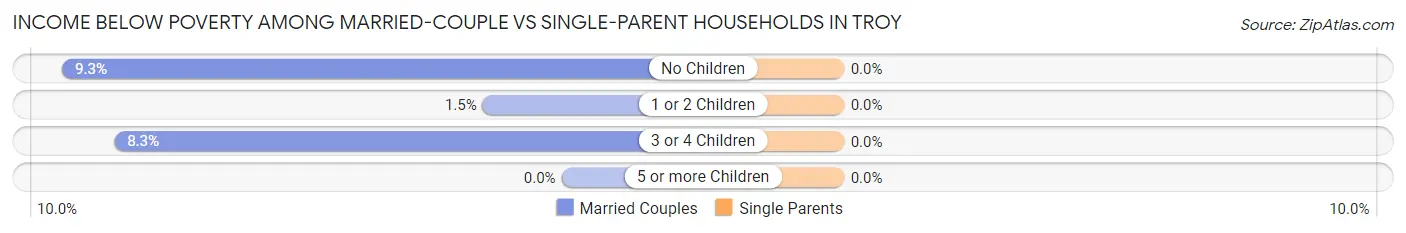
| Children | Married-Couple Families | Single-Parent Households |
| No Children | 4 (9.3%) | 0 (0.0%) |
| 1 or 2 Children | 1 (1.5%) | 0 (0.0%) |
| 3 or 4 Children | 1 (8.3%) | 0 (0.0%) |
| 5 or more Children | 0 (0.0%) | 0 (0.0%) |
| Total | 6 (4.9%) | 0 (0.0%) |
Race in Troy
The most populous races in Troy are White / Caucasian (561 | 96.9%), Two or more Races (18 | 3.1%), and Hispanic or Latino (9 | 1.5%).
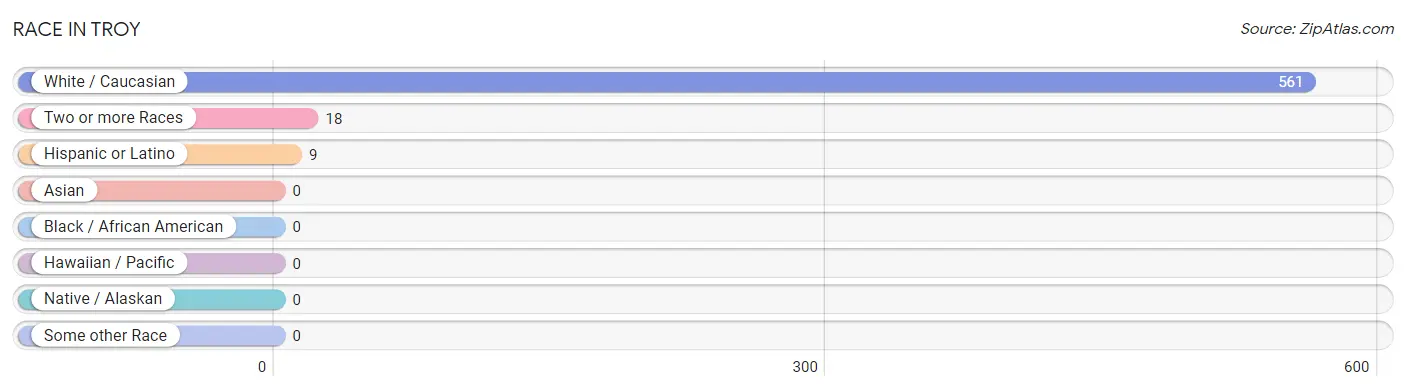
| Race | # Population | % Population |
| Asian | 0 | 0.0% |
| Black / African American | 0 | 0.0% |
| Hawaiian / Pacific | 0 | 0.0% |
| Hispanic or Latino | 9 | 1.5% |
| Native / Alaskan | 0 | 0.0% |
| White / Caucasian | 561 | 96.9% |
| Two or more Races | 18 | 3.1% |
| Some other Race | 0 | 0.0% |
| Total | 579 | 100.0% |
Ancestry in Troy
The most populous ancestries reported in Troy are German (302 | 52.2%), Irish (193 | 33.3%), English (60 | 10.4%), Swedish (41 | 7.1%), and American (38 | 6.6%), together accounting for 109.5% of all Troy residents.

| Ancestry | # Population | % Population |
| American | 38 | 6.6% |
| Belgian | 2 | 0.4% |
| English | 60 | 10.4% |
| European | 10 | 1.7% |
| French | 19 | 3.3% |
| German | 302 | 52.2% |
| Greek | 10 | 1.7% |
| Irish | 193 | 33.3% |
| Italian | 18 | 3.1% |
| Mexican | 9 | 1.5% |
| Scottish | 3 | 0.5% |
| Swedish | 41 | 7.1% |
| Swiss | 2 | 0.4% |
| Welsh | 3 | 0.5% | View All 14 Rows |
Immigrants in Troy

| Immigration Origin | # Population | % Population | View All 0 Rows |
Sex and Age in Troy
Sex and Age in Troy
The most populous age groups in Troy are 35 to 39 Years (70 | 27.7%) for men and 10 to 14 Years (133 | 40.8%) for women.
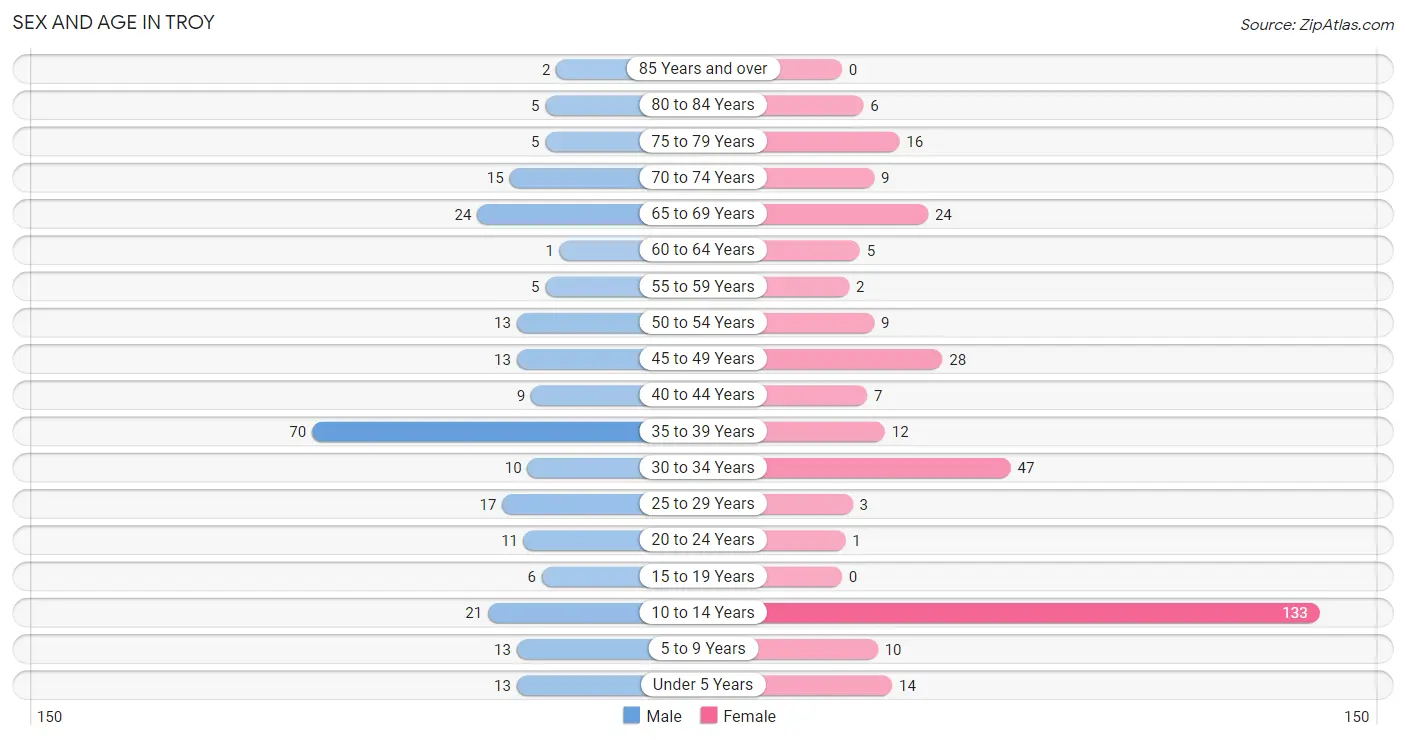
| Age Bracket | Male | Female |
| Under 5 Years | 13 (5.1%) | 14 (4.3%) |
| 5 to 9 Years | 13 (5.1%) | 10 (3.1%) |
| 10 to 14 Years | 21 (8.3%) | 133 (40.8%) |
| 15 to 19 Years | 6 (2.4%) | 0 (0.0%) |
| 20 to 24 Years | 11 (4.3%) | 1 (0.3%) |
| 25 to 29 Years | 17 (6.7%) | 3 (0.9%) |
| 30 to 34 Years | 10 (4.0%) | 47 (14.4%) |
| 35 to 39 Years | 70 (27.7%) | 12 (3.7%) |
| 40 to 44 Years | 9 (3.6%) | 7 (2.1%) |
| 45 to 49 Years | 13 (5.1%) | 28 (8.6%) |
| 50 to 54 Years | 13 (5.1%) | 9 (2.8%) |
| 55 to 59 Years | 5 (2.0%) | 2 (0.6%) |
| 60 to 64 Years | 1 (0.4%) | 5 (1.5%) |
| 65 to 69 Years | 24 (9.5%) | 24 (7.4%) |
| 70 to 74 Years | 15 (5.9%) | 9 (2.8%) |
| 75 to 79 Years | 5 (2.0%) | 16 (4.9%) |
| 80 to 84 Years | 5 (2.0%) | 6 (1.8%) |
| 85 Years and over | 2 (0.8%) | 0 (0.0%) |
| Total | 253 (100.0%) | 326 (100.0%) |
Families and Households in Troy
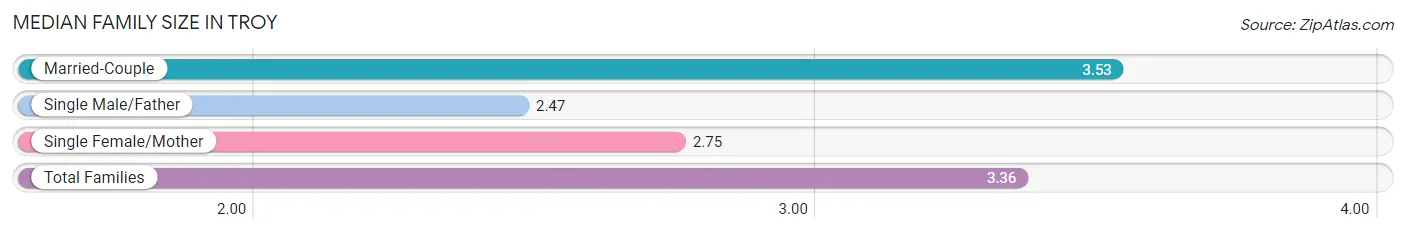
Median Family Size in Troy
The median family size in Troy is 3.36 persons per family, with married-couple families (123 | 83.1%) accounting for the largest median family size of 3.53 persons per family. On the other hand, single male/father families (17 | 11.5%) represent the smallest median family size with 2.47 persons per family.
| Family Type | # Families | Family Size |
| Married-Couple | 123 (83.1%) | 3.53 |
| Single Male/Father | 17 (11.5%) | 2.47 |
| Single Female/Mother | 8 (5.4%) | 2.75 |
| Total Families | 148 (100.0%) | 3.36 |
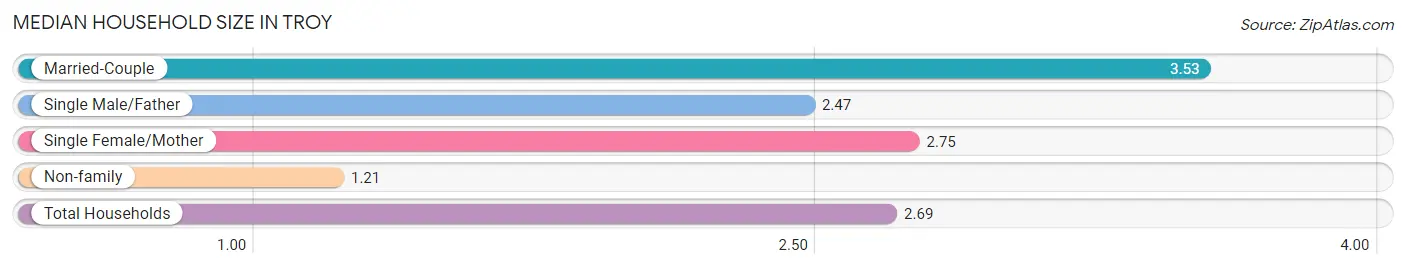
Median Household Size in Troy
The median household size in Troy is 2.69 persons per household, with married-couple households (123 | 57.2%) accounting for the largest median household size of 3.53 persons per household. non-family households (67 | 31.2%) represent the smallest median household size with 1.21 persons per household.
| Household Type | # Households | Household Size |
| Married-Couple | 123 (57.2%) | 3.53 |
| Single Male/Father | 17 (7.9%) | 2.47 |
| Single Female/Mother | 8 (3.7%) | 2.75 |
| Non-family | 67 (31.2%) | 1.21 |
| Total Households | 215 (100.0%) | 2.69 |
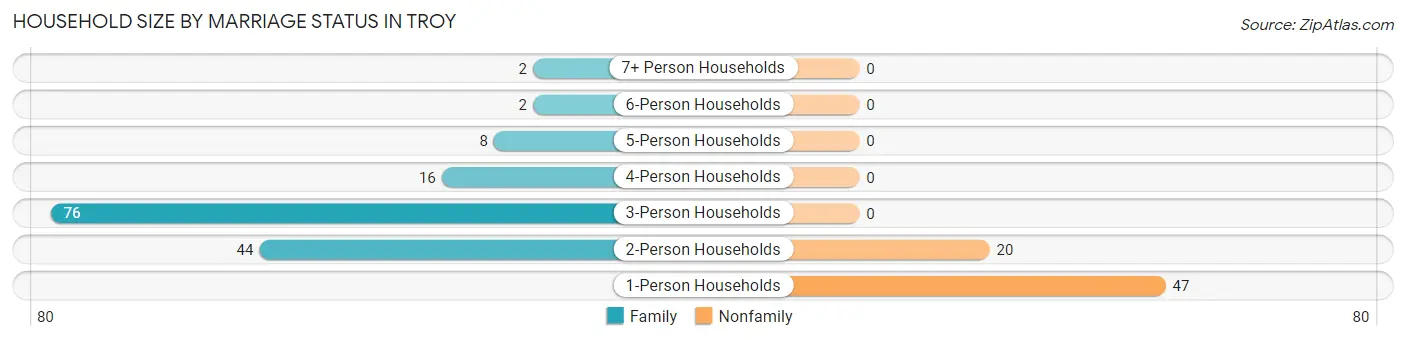
Household Size by Marriage Status in Troy
Out of a total of 215 households in Troy, 148 (68.8%) are family households, while 67 (31.2%) are nonfamily households. The most numerous type of family households are 3-person households, comprising 76, and the most common type of nonfamily households are 1-person households, comprising 47.
| Household Size | Family Households | Nonfamily Households |
| 1-Person Households | - | 47 (21.9%) |
| 2-Person Households | 44 (20.5%) | 20 (9.3%) |
| 3-Person Households | 76 (35.3%) | 0 (0.0%) |
| 4-Person Households | 16 (7.4%) | 0 (0.0%) |
| 5-Person Households | 8 (3.7%) | 0 (0.0%) |
| 6-Person Households | 2 (0.9%) | 0 (0.0%) |
| 7+ Person Households | 2 (0.9%) | 0 (0.0%) |
| Total | 148 (68.8%) | 67 (31.2%) |
Female Fertility in Troy
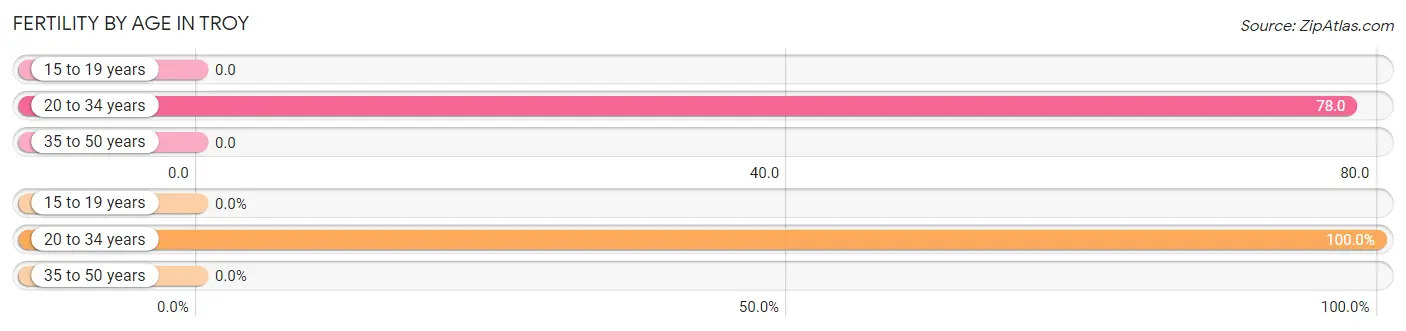
Fertility by Age in Troy
Average fertility rate in Troy is 40.0 births per 1,000 women. Women in the age bracket of 20 to 34 years have the highest fertility rate with 78.0 births per 1,000 women. Women in the age bracket of 20 to 34 years acount for 100.0% of all women with births.
| Age Bracket | Women with Births | Births / 1,000 Women |
| 15 to 19 years | 0 (0.0%) | 0.0 |
| 20 to 34 years | 4 (100.0%) | 78.0 |
| 35 to 50 years | 0 (0.0%) | 0.0 |
| Total | 4 (100.0%) | 40.0 |
Fertility by Age by Marriage Status in Troy
25.0% of women with births (4) in Troy are married. The highest percentage of unmarried women with births falls into 20 to 34 years age bracket with 75.0% of them unmarried at the time of birth, while the lowest percentage of unmarried women with births belong to 20 to 34 years age bracket with 75.0% of them unmarried.
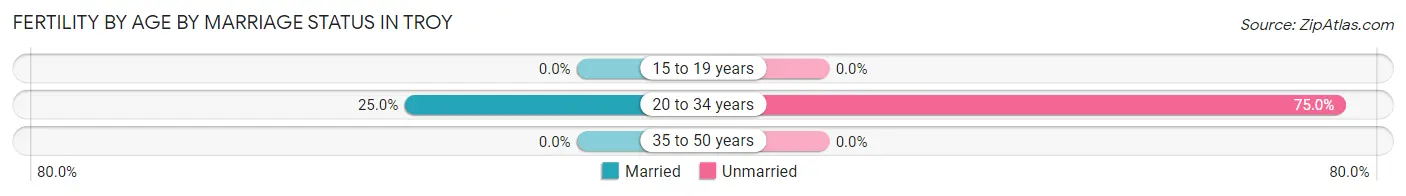
| Age Bracket | Married | Unmarried |
| 15 to 19 years | 0 (0.0%) | 0 (0.0%) |
| 20 to 34 years | 1 (25.0%) | 3 (75.0%) |
| 35 to 50 years | 0 (0.0%) | 0 (0.0%) |
| Total | 1 (25.0%) | 3 (75.0%) |
Fertility by Education in Troy
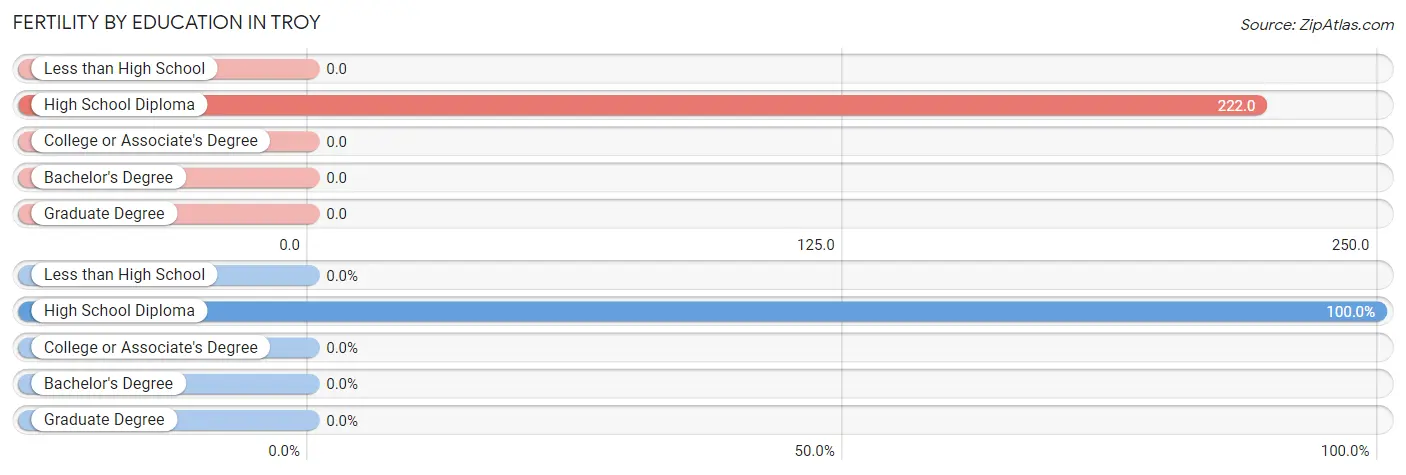
| Educational Attainment | Women with Births | Births / 1,000 Women |
| Less than High School | 0 (0.0%) | 0.0 |
| High School Diploma | 4 (100.0%) | 222.0 |
| College or Associate's Degree | 0 (0.0%) | 0.0 |
| Bachelor's Degree | 0 (0.0%) | 0.0 |
| Graduate Degree | 0 (0.0%) | 0.0 |
| Total | 4 (100.0%) | 40.0 |
Fertility by Education by Marriage Status in Troy
75.0% of women with births in Troy are unmarried. Women with the educational attainment of high school diploma are most likely to be married with 25.0% of them married at childbirth, while women with the educational attainment of high school diploma are least likely to be married with 75.0% of them unmarried at childbirth.
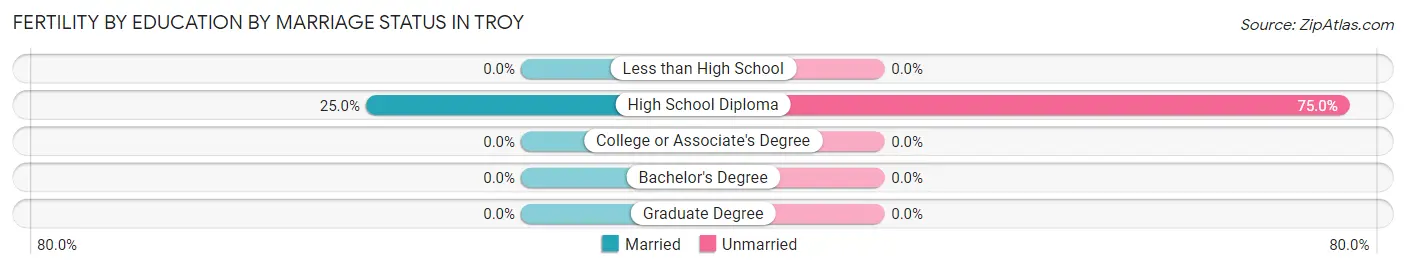
| Educational Attainment | Married | Unmarried |
| Less than High School | 0 (0.0%) | 0 (0.0%) |
| High School Diploma | 1 (25.0%) | 3 (75.0%) |
| College or Associate's Degree | 0 (0.0%) | 0 (0.0%) |
| Bachelor's Degree | 0 (0.0%) | 0 (0.0%) |
| Graduate Degree | 0 (0.0%) | 0 (0.0%) |
| Total | 1 (25.0%) | 3 (75.0%) |
Employment Characteristics in Troy
Employment by Class of Employer in Troy
Among the 199 employed individuals in Troy, private company employees (166 | 83.4%), not-for-profit organizations (13 | 6.5%), and state government employees (13 | 6.5%) make up the most common classes of employment.
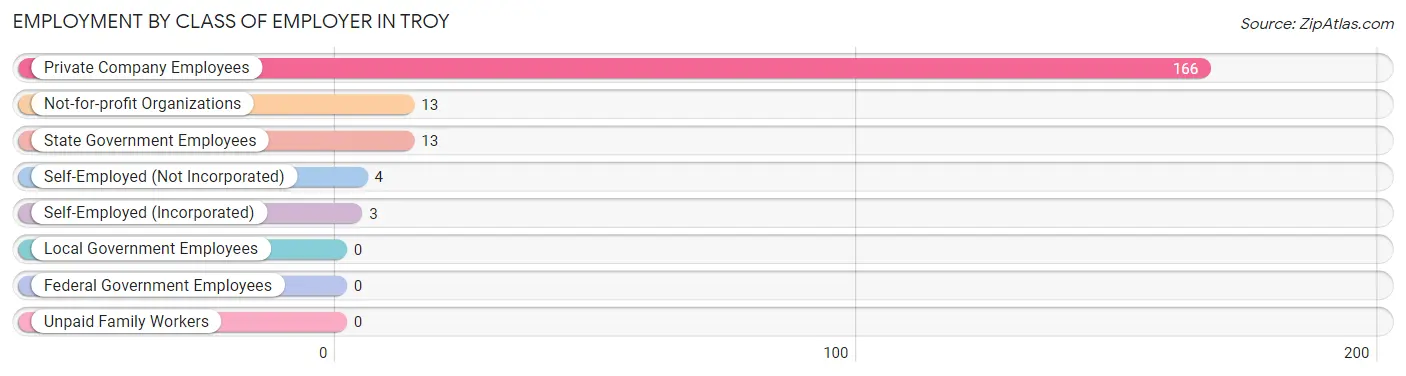
| Employer Class | # Employees | % Employees |
| Private Company Employees | 166 | 83.4% |
| Self-Employed (Incorporated) | 3 | 1.5% |
| Self-Employed (Not Incorporated) | 4 | 2.0% |
| Not-for-profit Organizations | 13 | 6.5% |
| Local Government Employees | 0 | 0.0% |
| State Government Employees | 13 | 6.5% |
| Federal Government Employees | 0 | 0.0% |
| Unpaid Family Workers | 0 | 0.0% |
| Total | 199 | 100.0% |
Employment Status by Age in Troy
According to the labor force statistics for Troy, out of the total population over 16 years of age (372), 54.6% or 203 individuals are in the labor force, with 2.0% or 4 of them unemployed. The age group with the highest labor force participation rate is 55 to 59 years, with 100.0% or 7 individuals in the labor force. Within the labor force, the 20 to 24 years age range has the highest percentage of unemployed individuals, with 11.1% or 1 of them being unemployed.
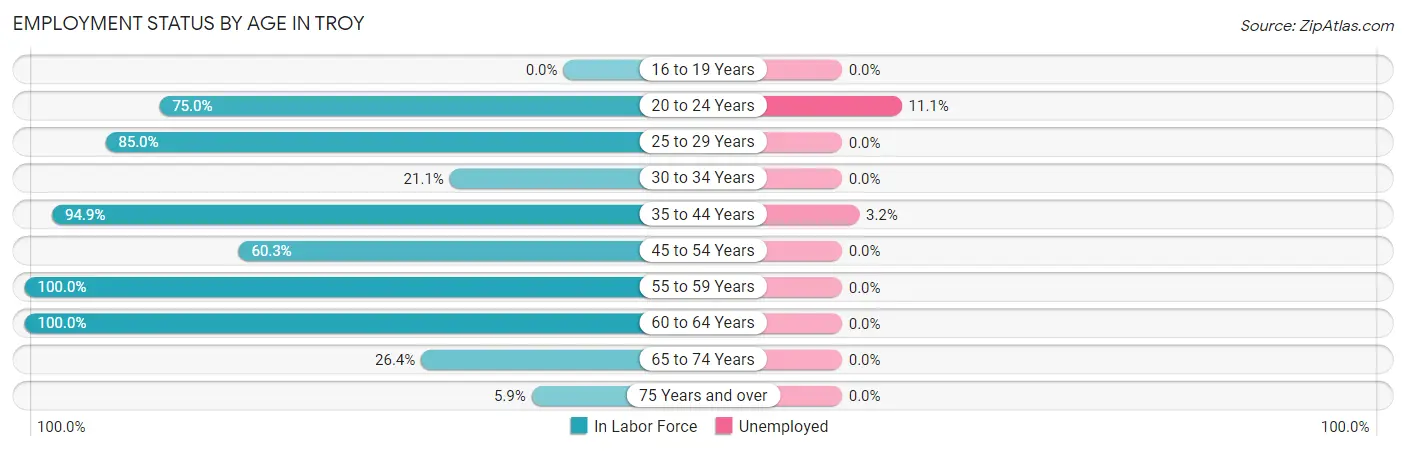
| Age Bracket | In Labor Force | Unemployed |
| 16 to 19 Years | 0 (0.0%) | 0 (0.0%) |
| 20 to 24 Years | 9 (75.0%) | 1 (11.1%) |
| 25 to 29 Years | 17 (85.0%) | 0 (0.0%) |
| 30 to 34 Years | 12 (21.1%) | 0 (0.0%) |
| 35 to 44 Years | 93 (94.9%) | 3 (3.2%) |
| 45 to 54 Years | 38 (60.3%) | 0 (0.0%) |
| 55 to 59 Years | 7 (100.0%) | 0 (0.0%) |
| 60 to 64 Years | 6 (100.0%) | 0 (0.0%) |
| 65 to 74 Years | 19 (26.4%) | 0 (0.0%) |
| 75 Years and over | 2 (5.9%) | 0 (0.0%) |
| Total | 203 (54.6%) | 4 (2.0%) |
Employment Status by Educational Attainment in Troy
According to labor force statistics for Troy, 68.9% of individuals (173) out of the total population between 25 and 64 years of age (251) are in the labor force, with 1.7% or 3 of them being unemployed. The group with the highest labor force participation rate are those with the educational attainment of high school diploma, with 90.5% or 57 individuals in the labor force. Within the labor force, individuals with high school diploma education have the highest percentage of unemployment, with 5.3% or 3 of them being unemployed.
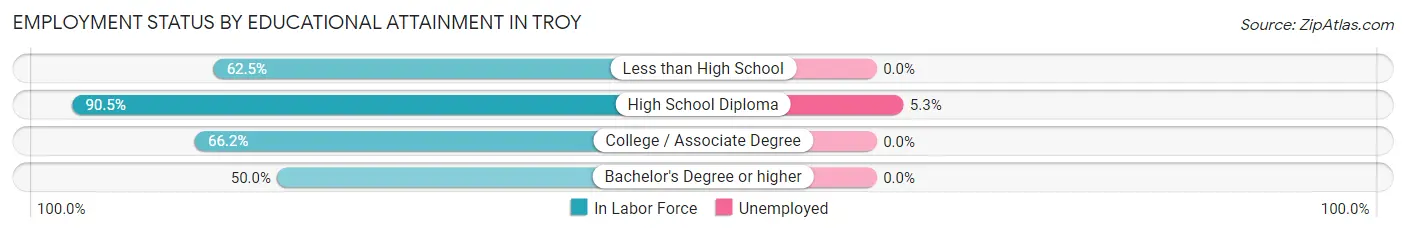
| Educational Attainment | In Labor Force | Unemployed |
| Less than High School | 5 (62.5%) | 0 (0.0%) |
| High School Diploma | 57 (90.5%) | 3 (5.3%) |
| College / Associate Degree | 86 (66.2%) | 0 (0.0%) |
| Bachelor's Degree or higher | 25 (50.0%) | 0 (0.0%) |
| Total | 173 (68.9%) | 4 (1.7%) |
Employment Occupations by Sex in Troy
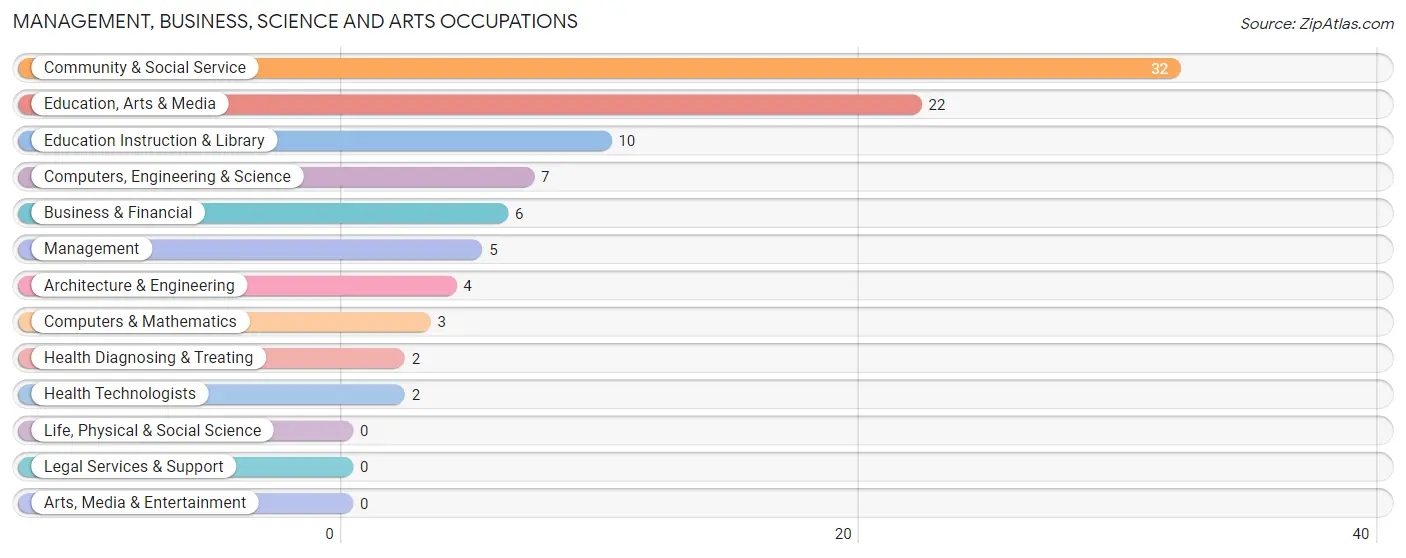
Management, Business, Science and Arts Occupations
The most common Management, Business, Science and Arts occupations in Troy are Community & Social Service (32 | 16.1%), Education, Arts & Media (22 | 11.1%), Education Instruction & Library (10 | 5.0%), Computers, Engineering & Science (7 | 3.5%), and Business & Financial (6 | 3.0%).
Management, Business, Science and Arts Occupations by Sex
Within the Management, Business, Science and Arts occupations in Troy, the most male-oriented occupations are Management (100.0%), Business & Financial (100.0%), and Computers, Engineering & Science (100.0%), while the most female-oriented occupations are Education Instruction & Library (100.0%), Health Diagnosing & Treating (100.0%), and Health Technologists (100.0%).
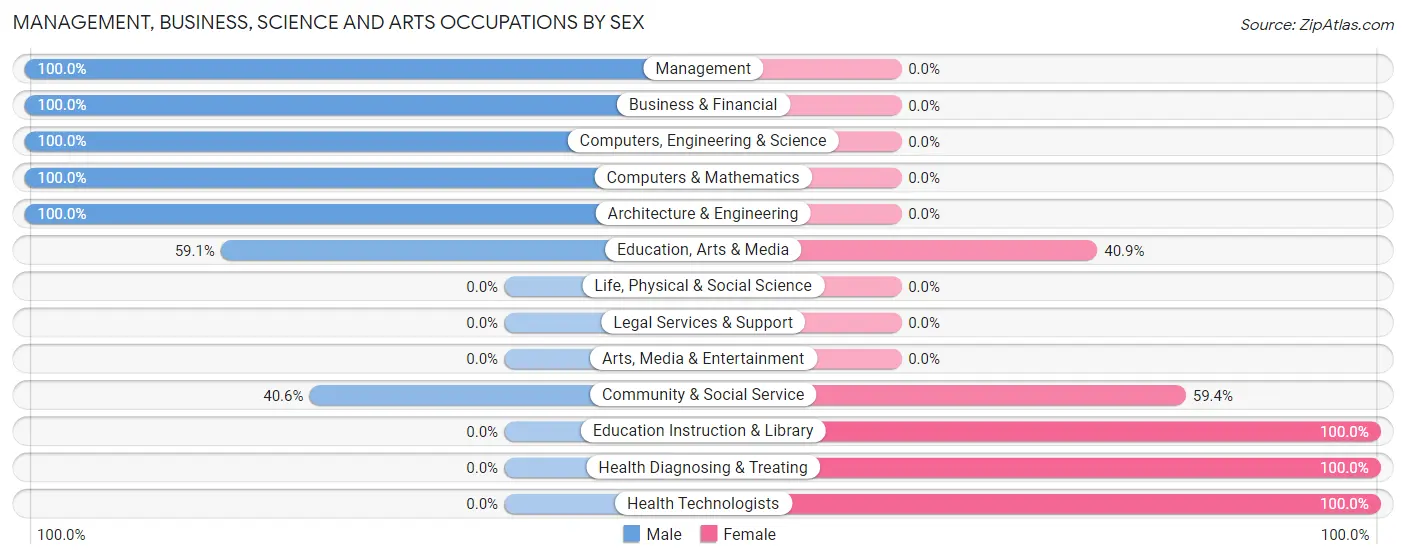
| Occupation | Male | Female |
| Management | 5 (100.0%) | 0 (0.0%) |
| Business & Financial | 6 (100.0%) | 0 (0.0%) |
| Computers, Engineering & Science | 7 (100.0%) | 0 (0.0%) |
| Computers & Mathematics | 3 (100.0%) | 0 (0.0%) |
| Architecture & Engineering | 4 (100.0%) | 0 (0.0%) |
| Life, Physical & Social Science | 0 (0.0%) | 0 (0.0%) |
| Community & Social Service | 13 (40.6%) | 19 (59.4%) |
| Education, Arts & Media | 13 (59.1%) | 9 (40.9%) |
| Legal Services & Support | 0 (0.0%) | 0 (0.0%) |
| Education Instruction & Library | 0 (0.0%) | 10 (100.0%) |
| Arts, Media & Entertainment | 0 (0.0%) | 0 (0.0%) |
| Health Diagnosing & Treating | 0 (0.0%) | 2 (100.0%) |
| Health Technologists | 0 (0.0%) | 2 (100.0%) |
| Total (Category) | 31 (59.6%) | 21 (40.4%) |
| Total (Overall) | 142 (71.4%) | 57 (28.6%) |
Services Occupations
The most common Services occupations in Troy are Healthcare Support (11 | 5.5%), and Food Preparation & Serving (6 | 3.0%).
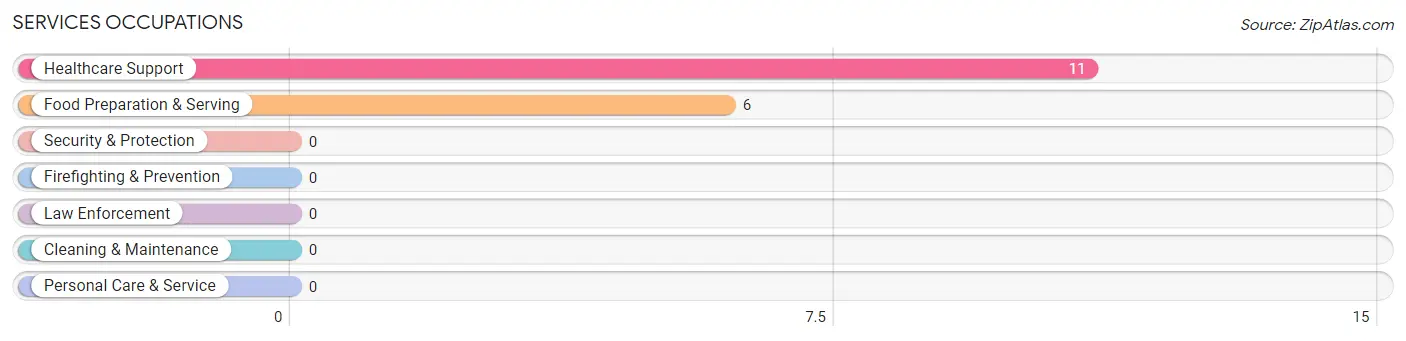
Services Occupations by Sex
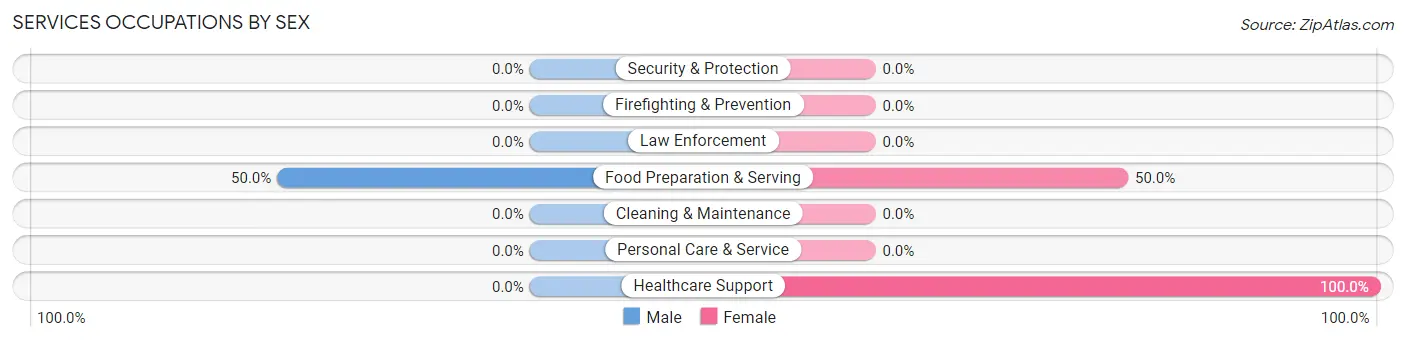
| Occupation | Male | Female |
| Healthcare Support | 0 (0.0%) | 11 (100.0%) |
| Security & Protection | 0 (0.0%) | 0 (0.0%) |
| Firefighting & Prevention | 0 (0.0%) | 0 (0.0%) |
| Law Enforcement | 0 (0.0%) | 0 (0.0%) |
| Food Preparation & Serving | 3 (50.0%) | 3 (50.0%) |
| Cleaning & Maintenance | 0 (0.0%) | 0 (0.0%) |
| Personal Care & Service | 0 (0.0%) | 0 (0.0%) |
| Total (Category) | 3 (17.6%) | 14 (82.4%) |
| Total (Overall) | 142 (71.4%) | 57 (28.6%) |
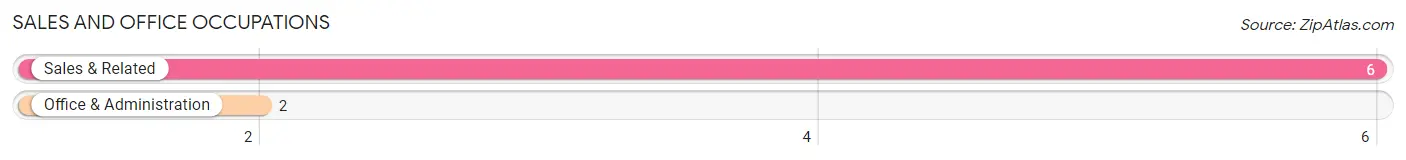
Sales and Office Occupations
The most common Sales and Office occupations in Troy are Sales & Related (6 | 3.0%), and Office & Administration (2 | 1.0%).
Sales and Office Occupations by Sex

| Occupation | Male | Female |
| Sales & Related | 0 (0.0%) | 6 (100.0%) |
| Office & Administration | 0 (0.0%) | 2 (100.0%) |
| Total (Category) | 0 (0.0%) | 8 (100.0%) |
| Total (Overall) | 142 (71.4%) | 57 (28.6%) |
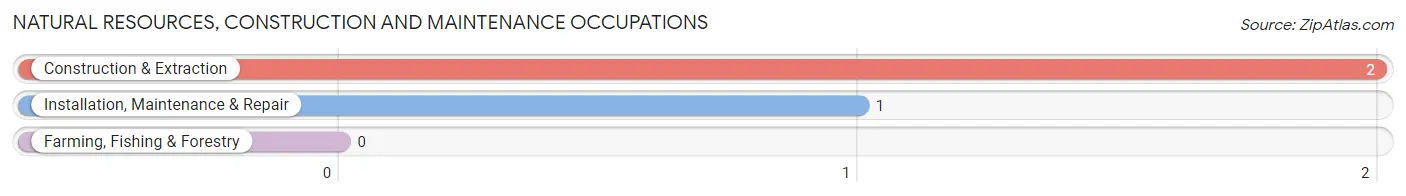
Natural Resources, Construction and Maintenance Occupations
The most common Natural Resources, Construction and Maintenance occupations in Troy are Construction & Extraction (2 | 1.0%), and Installation, Maintenance & Repair (1 | 0.5%).
Natural Resources, Construction and Maintenance Occupations by Sex

| Occupation | Male | Female |
| Farming, Fishing & Forestry | 0 (0.0%) | 0 (0.0%) |
| Construction & Extraction | 2 (100.0%) | 0 (0.0%) |
| Installation, Maintenance & Repair | 1 (100.0%) | 0 (0.0%) |
| Total (Category) | 3 (100.0%) | 0 (0.0%) |
| Total (Overall) | 142 (71.4%) | 57 (28.6%) |
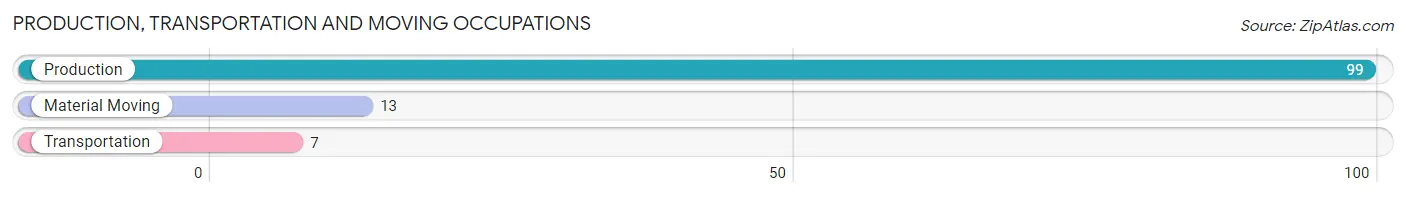
Production, Transportation and Moving Occupations
The most common Production, Transportation and Moving occupations in Troy are Production (99 | 49.7%), Material Moving (13 | 6.5%), and Transportation (7 | 3.5%).
Production, Transportation and Moving Occupations by Sex
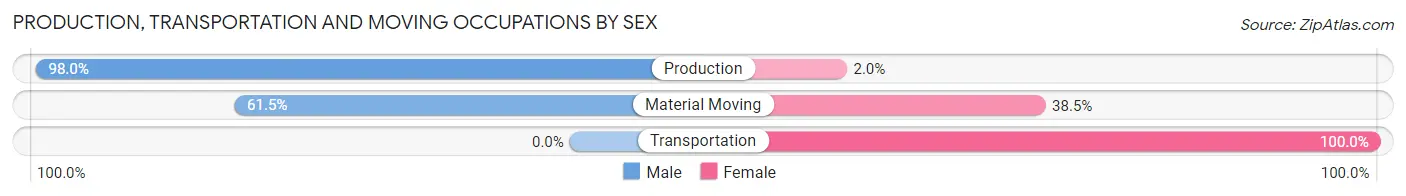
| Occupation | Male | Female |
| Production | 97 (98.0%) | 2 (2.0%) |
| Transportation | 0 (0.0%) | 7 (100.0%) |
| Material Moving | 8 (61.5%) | 5 (38.5%) |
| Total (Category) | 105 (88.2%) | 14 (11.8%) |
| Total (Overall) | 142 (71.4%) | 57 (28.6%) |
Employment Industries by Sex in Troy
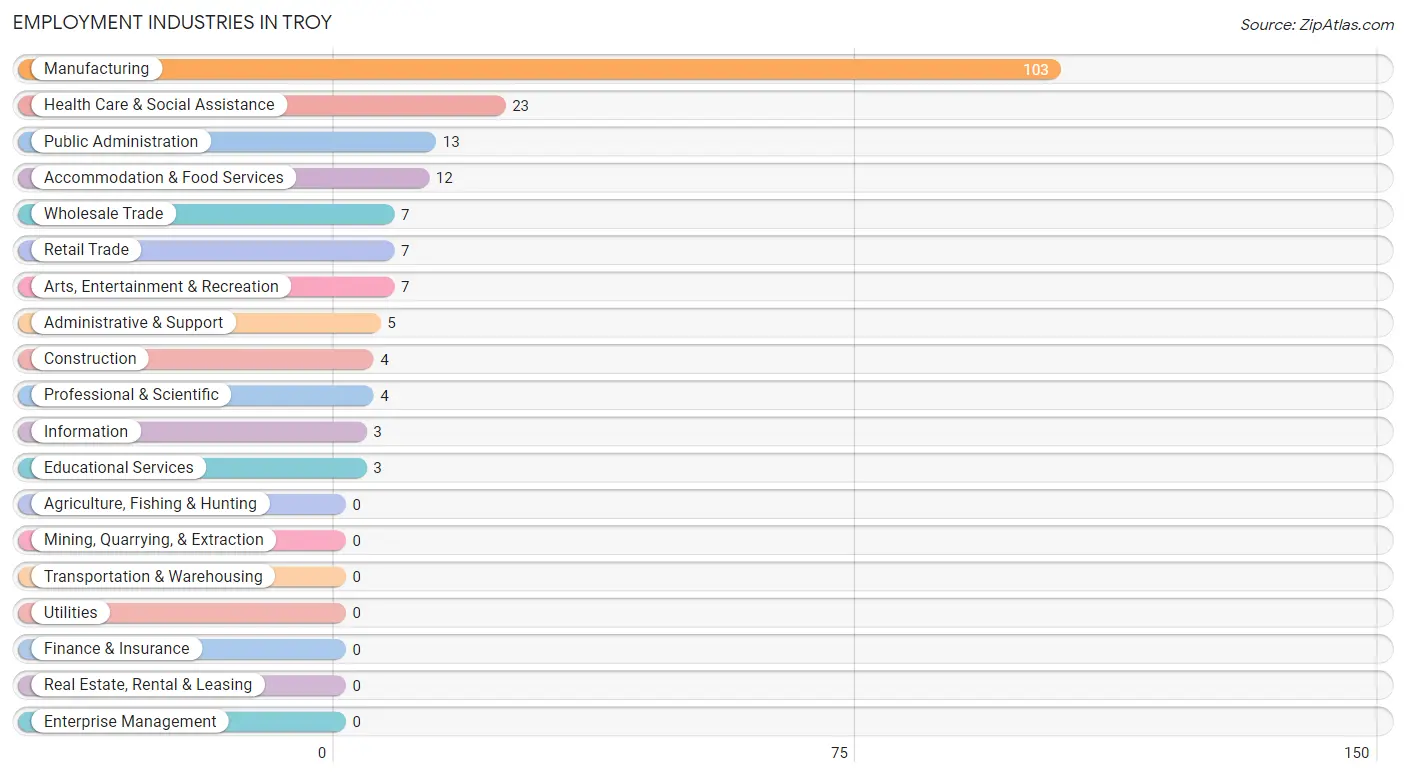
Employment Industries in Troy
The major employment industries in Troy include Manufacturing (103 | 51.8%), Health Care & Social Assistance (23 | 11.6%), Public Administration (13 | 6.5%), Accommodation & Food Services (12 | 6.0%), and Wholesale Trade (7 | 3.5%).
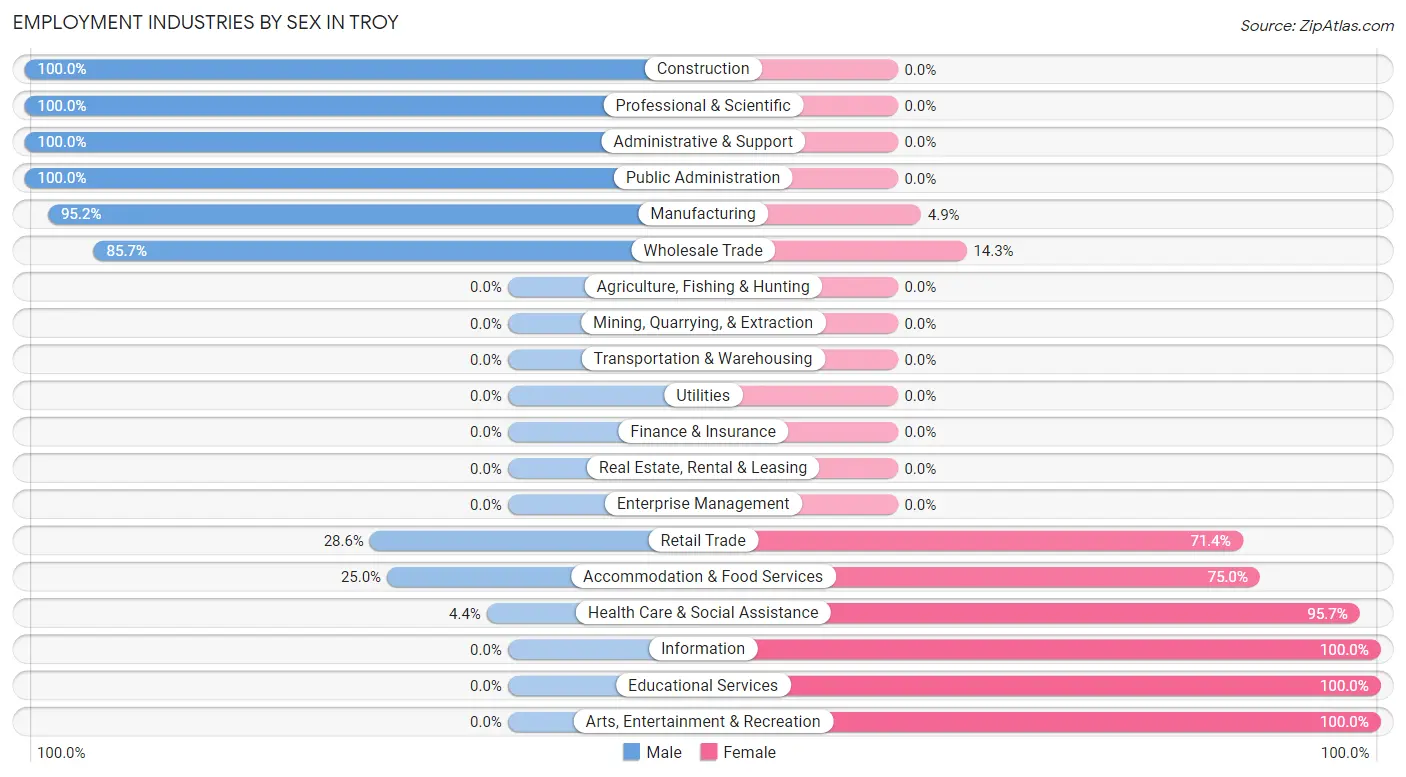
Employment Industries by Sex in Troy
The Troy industries that see more men than women are Construction (100.0%), Professional & Scientific (100.0%), and Administrative & Support (100.0%), whereas the industries that tend to have a higher number of women are Information (100.0%), Educational Services (100.0%), and Arts, Entertainment & Recreation (100.0%).
| Industry | Male | Female |
| Agriculture, Fishing & Hunting | 0 (0.0%) | 0 (0.0%) |
| Mining, Quarrying, & Extraction | 0 (0.0%) | 0 (0.0%) |
| Construction | 4 (100.0%) | 0 (0.0%) |
| Manufacturing | 98 (95.2%) | 5 (4.9%) |
| Wholesale Trade | 6 (85.7%) | 1 (14.3%) |
| Retail Trade | 2 (28.6%) | 5 (71.4%) |
| Transportation & Warehousing | 0 (0.0%) | 0 (0.0%) |
| Utilities | 0 (0.0%) | 0 (0.0%) |
| Information | 0 (0.0%) | 3 (100.0%) |
| Finance & Insurance | 0 (0.0%) | 0 (0.0%) |
| Real Estate, Rental & Leasing | 0 (0.0%) | 0 (0.0%) |
| Professional & Scientific | 4 (100.0%) | 0 (0.0%) |
| Enterprise Management | 0 (0.0%) | 0 (0.0%) |
| Administrative & Support | 5 (100.0%) | 0 (0.0%) |
| Educational Services | 0 (0.0%) | 3 (100.0%) |
| Health Care & Social Assistance | 1 (4.3%) | 22 (95.7%) |
| Arts, Entertainment & Recreation | 0 (0.0%) | 7 (100.0%) |
| Accommodation & Food Services | 3 (25.0%) | 9 (75.0%) |
| Public Administration | 13 (100.0%) | 0 (0.0%) |
| Total | 142 (71.4%) | 57 (28.6%) |
Education in Troy
School Enrollment in Troy
The most common levels of schooling among the 185 students in Troy are middle school (147 | 79.5%), elementary school (23 | 12.4%), and high school (13 | 7.0%).
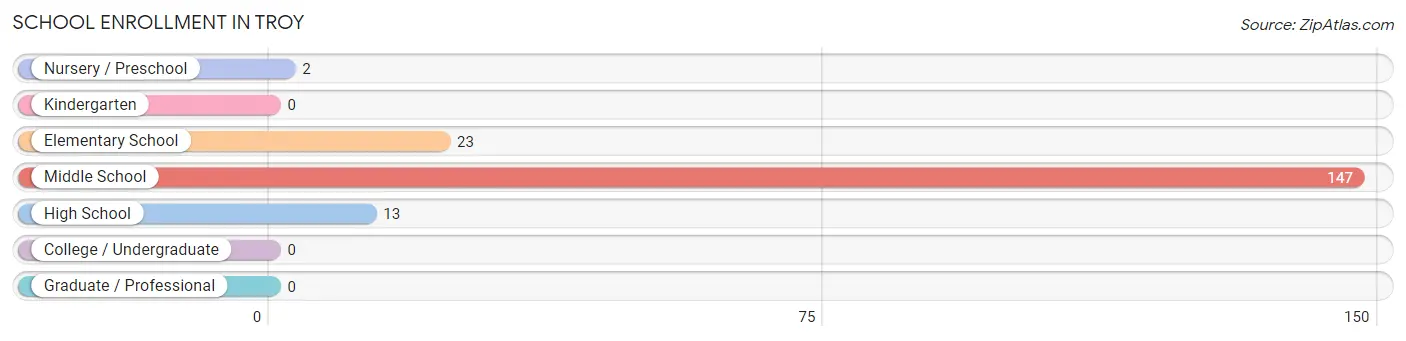
| School Level | # Students | % Students |
| Nursery / Preschool | 2 | 1.1% |
| Kindergarten | 0 | 0.0% |
| Elementary School | 23 | 12.4% |
| Middle School | 147 | 79.5% |
| High School | 13 | 7.0% |
| College / Undergraduate | 0 | 0.0% |
| Graduate / Professional | 0 | 0.0% |
| Total | 185 | 100.0% |
School Enrollment by Age by Funding Source in Troy
Out of a total of 185 students who are enrolled in schools in Troy, 6 (3.2%) attend a private institution, while the remaining 179 (96.8%) are enrolled in public schools. The age group of 10 to 14 year olds has the highest likelihood of being enrolled in private schools, with 6 (3.9% in the age bracket) enrolled. Conversely, the age group of 3 to 4 year olds has the lowest likelihood of being enrolled in a private school, with 2 (100.0% in the age bracket) attending a public institution.
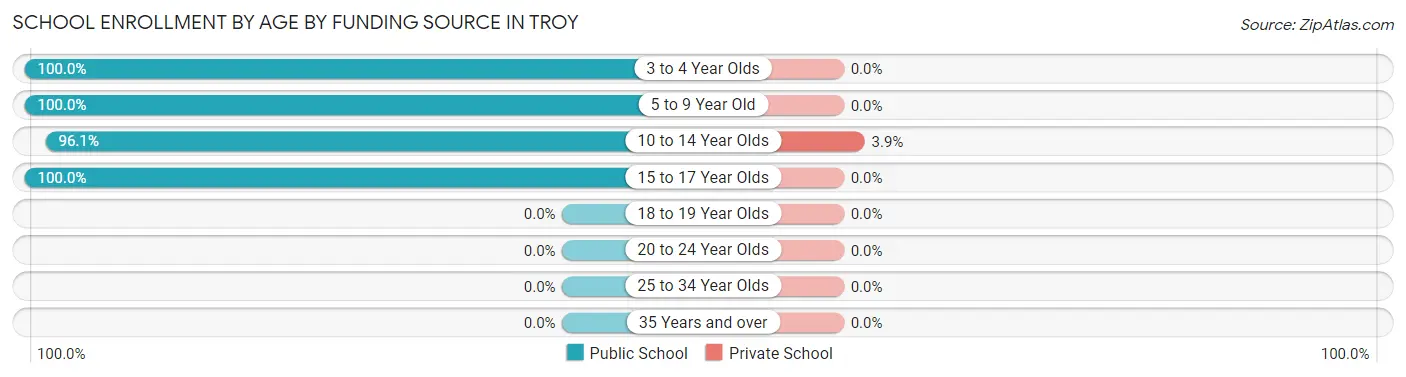
| Age Bracket | Public School | Private School |
| 3 to 4 Year Olds | 2 (100.0%) | 0 (0.0%) |
| 5 to 9 Year Old | 23 (100.0%) | 0 (0.0%) |
| 10 to 14 Year Olds | 148 (96.1%) | 6 (3.9%) |
| 15 to 17 Year Olds | 6 (100.0%) | 0 (0.0%) |
| 18 to 19 Year Olds | 0 (0.0%) | 0 (0.0%) |
| 20 to 24 Year Olds | 0 (0.0%) | 0 (0.0%) |
| 25 to 34 Year Olds | 0 (0.0%) | 0 (0.0%) |
| 35 Years and over | 0 (0.0%) | 0 (0.0%) |
| Total | 179 (96.8%) | 6 (3.2%) |
Educational Attainment by Field of Study in Troy
Psychology (22 | 34.4%), education (15 | 23.4%), literature & languages (9 | 14.1%), computers & mathematics (6 | 9.4%), and social sciences (4 | 6.2%) are the most common fields of study among 64 individuals in Troy who have obtained a bachelor's degree or higher.
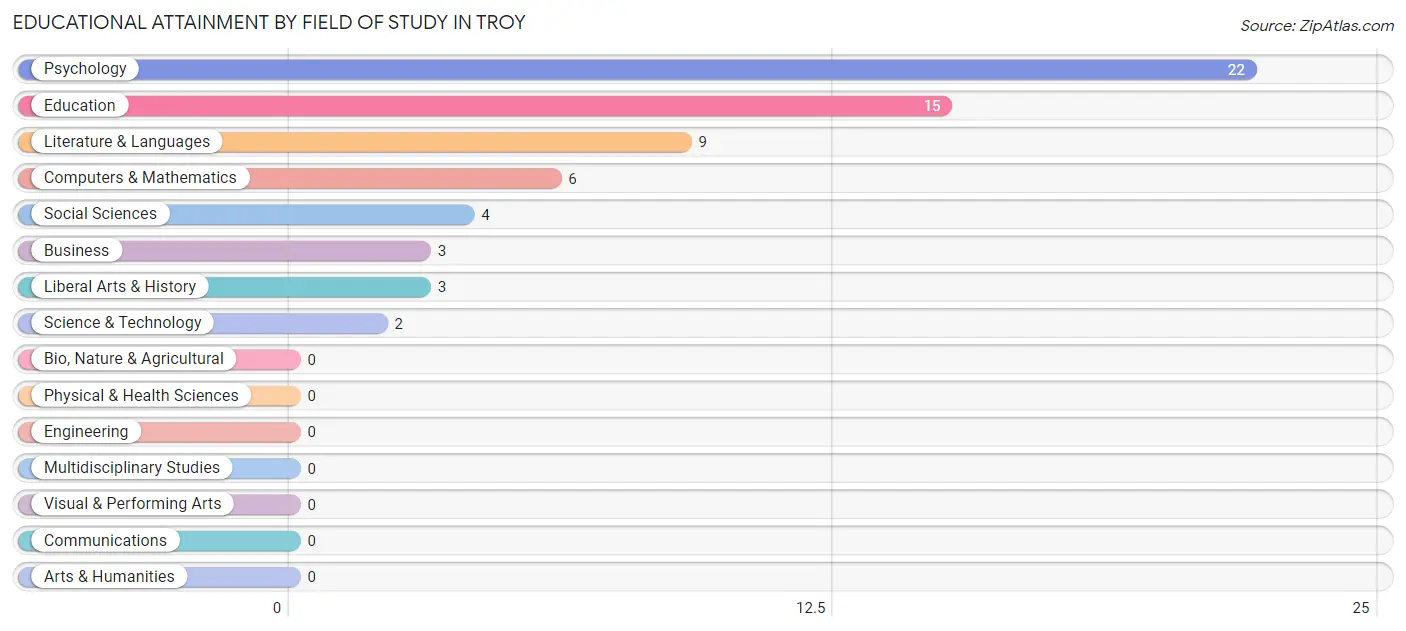
| Field of Study | # Graduates | % Graduates |
| Computers & Mathematics | 6 | 9.4% |
| Bio, Nature & Agricultural | 0 | 0.0% |
| Physical & Health Sciences | 0 | 0.0% |
| Psychology | 22 | 34.4% |
| Social Sciences | 4 | 6.2% |
| Engineering | 0 | 0.0% |
| Multidisciplinary Studies | 0 | 0.0% |
| Science & Technology | 2 | 3.1% |
| Business | 3 | 4.7% |
| Education | 15 | 23.4% |
| Literature & Languages | 9 | 14.1% |
| Liberal Arts & History | 3 | 4.7% |
| Visual & Performing Arts | 0 | 0.0% |
| Communications | 0 | 0.0% |
| Arts & Humanities | 0 | 0.0% |
| Total | 64 | 100.0% |
Transportation & Commute in Troy
Vehicle Availability by Sex in Troy
The most prevalent vehicle ownership categories in Troy are males with 3 vehicles (65, accounting for 45.8%) and females with 3 vehicles (6, making up 114.0%).
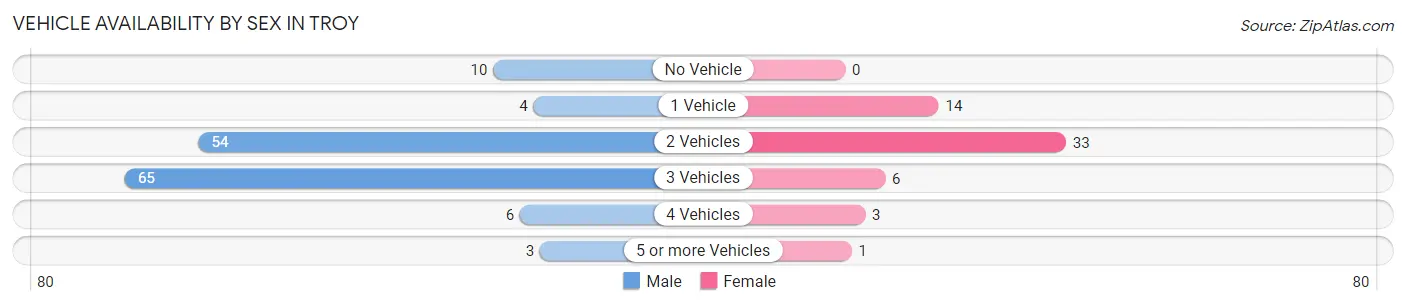
| Vehicles Available | Male | Female |
| No Vehicle | 10 (7.0%) | 0 (0.0%) |
| 1 Vehicle | 4 (2.8%) | 14 (24.6%) |
| 2 Vehicles | 54 (38.0%) | 33 (57.9%) |
| 3 Vehicles | 65 (45.8%) | 6 (10.5%) |
| 4 Vehicles | 6 (4.2%) | 3 (5.3%) |
| 5 or more Vehicles | 3 (2.1%) | 1 (1.8%) |
| Total | 142 (100.0%) | 57 (100.0%) |
Commute Time in Troy
The most frequently occuring commute durations in Troy are 10 to 14 minutes (82 commuters, 43.2%), 25 to 29 minutes (32 commuters, 16.8%), and 15 to 19 minutes (27 commuters, 14.2%).
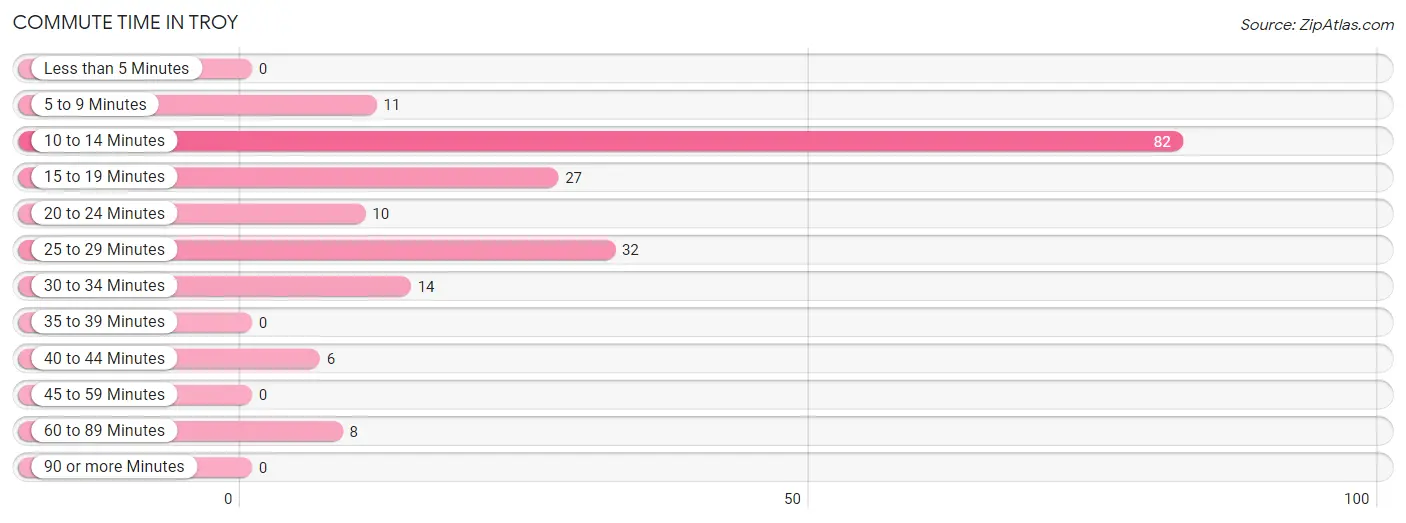
| Commute Time | # Commuters | % Commuters |
| Less than 5 Minutes | 0 | 0.0% |
| 5 to 9 Minutes | 11 | 5.8% |
| 10 to 14 Minutes | 82 | 43.2% |
| 15 to 19 Minutes | 27 | 14.2% |
| 20 to 24 Minutes | 10 | 5.3% |
| 25 to 29 Minutes | 32 | 16.8% |
| 30 to 34 Minutes | 14 | 7.4% |
| 35 to 39 Minutes | 0 | 0.0% |
| 40 to 44 Minutes | 6 | 3.2% |
| 45 to 59 Minutes | 0 | 0.0% |
| 60 to 89 Minutes | 8 | 4.2% |
| 90 or more Minutes | 0 | 0.0% |
Commute Time by Sex in Troy
The most common commute times in Troy are 10 to 14 minutes (68 commuters, 50.0%) for males and 15 to 19 minutes (21 commuters, 38.9%) for females.
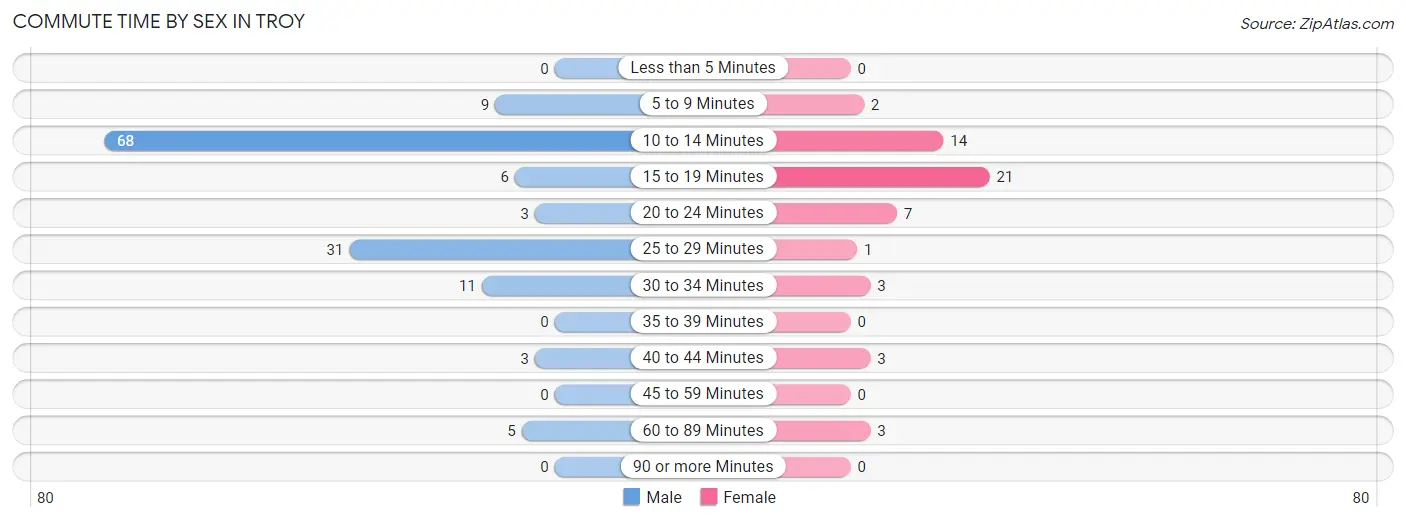
| Commute Time | Male | Female |
| Less than 5 Minutes | 0 (0.0%) | 0 (0.0%) |
| 5 to 9 Minutes | 9 (6.6%) | 2 (3.7%) |
| 10 to 14 Minutes | 68 (50.0%) | 14 (25.9%) |
| 15 to 19 Minutes | 6 (4.4%) | 21 (38.9%) |
| 20 to 24 Minutes | 3 (2.2%) | 7 (13.0%) |
| 25 to 29 Minutes | 31 (22.8%) | 1 (1.8%) |
| 30 to 34 Minutes | 11 (8.1%) | 3 (5.6%) |
| 35 to 39 Minutes | 0 (0.0%) | 0 (0.0%) |
| 40 to 44 Minutes | 3 (2.2%) | 3 (5.6%) |
| 45 to 59 Minutes | 0 (0.0%) | 0 (0.0%) |
| 60 to 89 Minutes | 5 (3.7%) | 3 (5.6%) |
| 90 or more Minutes | 0 (0.0%) | 0 (0.0%) |
Time of Departure to Work by Sex in Troy
The most frequent times of departure to work in Troy are 7:00 AM to 7:29 AM (69, 50.7%) for males and 8:00 AM to 8:29 AM (12, 22.2%) for females.
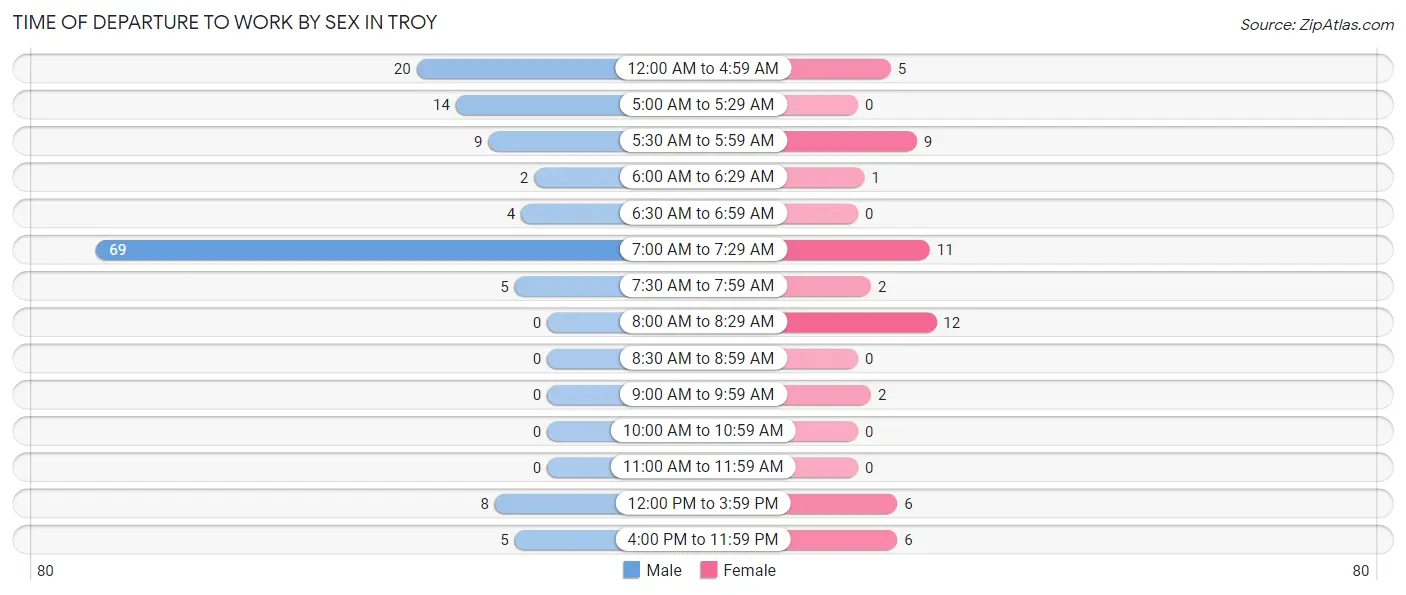
| Time of Departure | Male | Female |
| 12:00 AM to 4:59 AM | 20 (14.7%) | 5 (9.3%) |
| 5:00 AM to 5:29 AM | 14 (10.3%) | 0 (0.0%) |
| 5:30 AM to 5:59 AM | 9 (6.6%) | 9 (16.7%) |
| 6:00 AM to 6:29 AM | 2 (1.5%) | 1 (1.8%) |
| 6:30 AM to 6:59 AM | 4 (2.9%) | 0 (0.0%) |
| 7:00 AM to 7:29 AM | 69 (50.7%) | 11 (20.4%) |
| 7:30 AM to 7:59 AM | 5 (3.7%) | 2 (3.7%) |
| 8:00 AM to 8:29 AM | 0 (0.0%) | 12 (22.2%) |
| 8:30 AM to 8:59 AM | 0 (0.0%) | 0 (0.0%) |
| 9:00 AM to 9:59 AM | 0 (0.0%) | 2 (3.7%) |
| 10:00 AM to 10:59 AM | 0 (0.0%) | 0 (0.0%) |
| 11:00 AM to 11:59 AM | 0 (0.0%) | 0 (0.0%) |
| 12:00 PM to 3:59 PM | 8 (5.9%) | 6 (11.1%) |
| 4:00 PM to 11:59 PM | 5 (3.7%) | 6 (11.1%) |
| Total | 136 (100.0%) | 54 (100.0%) |
Housing Occupancy in Troy
Occupancy by Ownership in Troy
Of the total 215 dwellings in Troy, owner-occupied units account for 176 (81.9%), while renter-occupied units make up 39 (18.1%).
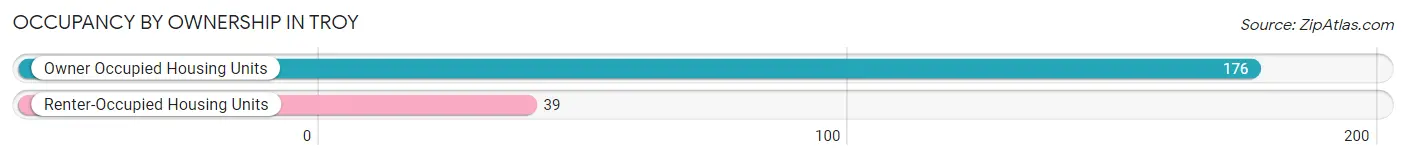
| Occupancy | # Housing Units | % Housing Units |
| Owner Occupied Housing Units | 176 | 81.9% |
| Renter-Occupied Housing Units | 39 | 18.1% |
| Total Occupied Housing Units | 215 | 100.0% |
Occupancy by Household Size in Troy
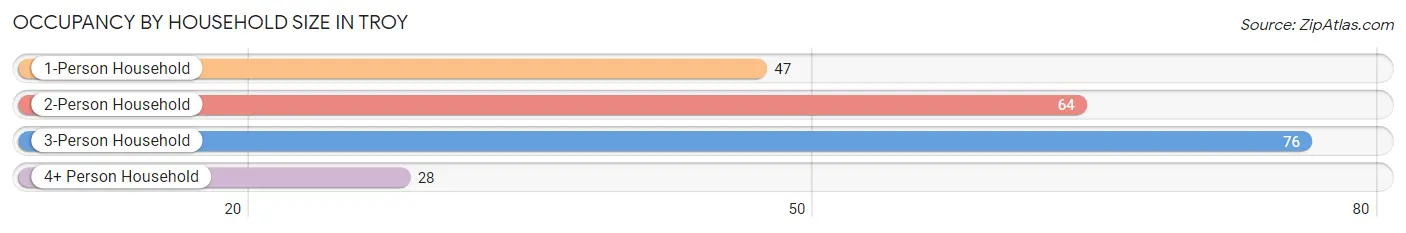
| Household Size | # Housing Units | % Housing Units |
| 1-Person Household | 47 | 21.9% |
| 2-Person Household | 64 | 29.8% |
| 3-Person Household | 76 | 35.3% |
| 4+ Person Household | 28 | 13.0% |
| Total Housing Units | 215 | 100.0% |
Occupancy by Ownership by Household Size in Troy
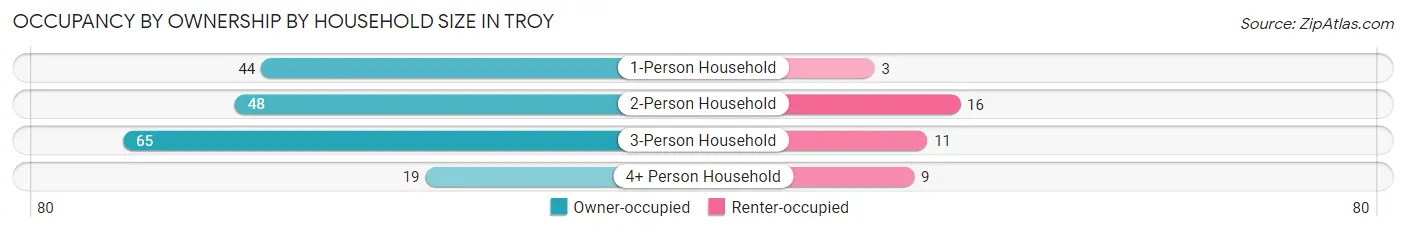
| Household Size | Owner-occupied | Renter-occupied |
| 1-Person Household | 44 (93.6%) | 3 (6.4%) |
| 2-Person Household | 48 (75.0%) | 16 (25.0%) |
| 3-Person Household | 65 (85.5%) | 11 (14.5%) |
| 4+ Person Household | 19 (67.9%) | 9 (32.1%) |
| Total Housing Units | 176 (81.9%) | 39 (18.1%) |
Occupancy by Educational Attainment in Troy
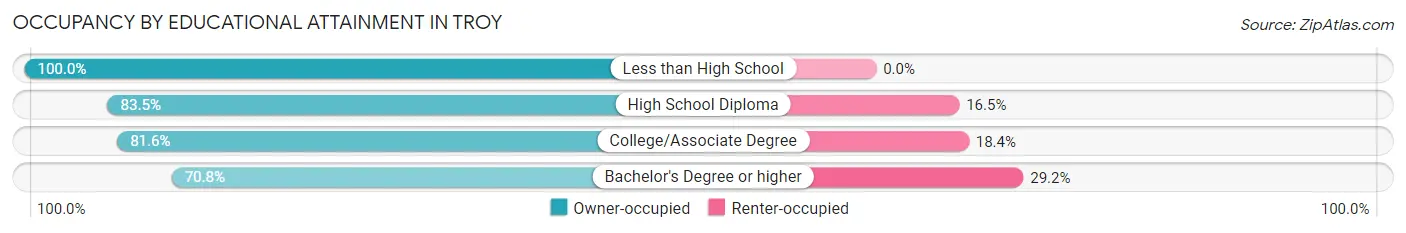
| Household Size | Owner-occupied | Renter-occupied |
| Less than High School | 8 (100.0%) | 0 (0.0%) |
| High School Diploma | 71 (83.5%) | 14 (16.5%) |
| College/Associate Degree | 80 (81.6%) | 18 (18.4%) |
| Bachelor's Degree or higher | 17 (70.8%) | 7 (29.2%) |
Occupancy by Age of Householder in Troy
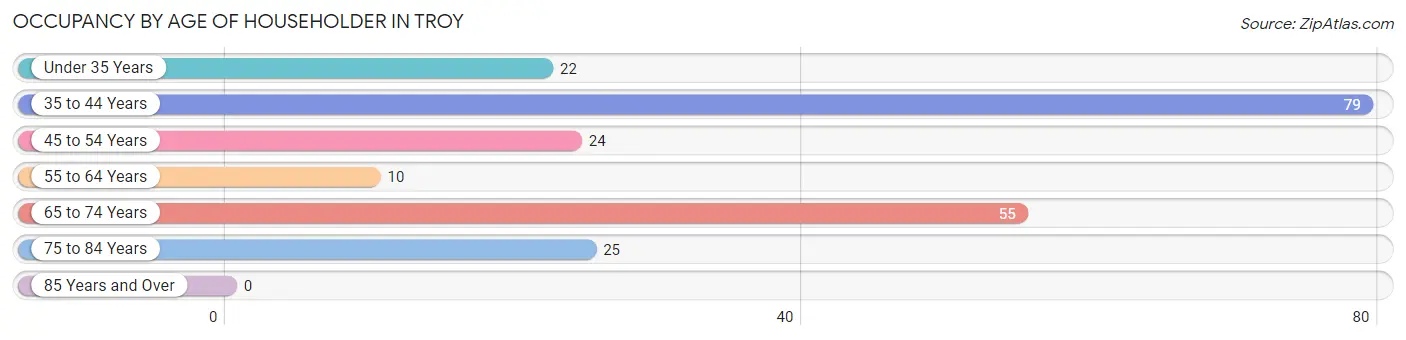
| Age Bracket | # Households | % Households |
| Under 35 Years | 22 | 10.2% |
| 35 to 44 Years | 79 | 36.7% |
| 45 to 54 Years | 24 | 11.2% |
| 55 to 64 Years | 10 | 4.6% |
| 65 to 74 Years | 55 | 25.6% |
| 75 to 84 Years | 25 | 11.6% |
| 85 Years and Over | 0 | 0.0% |
| Total | 215 | 100.0% |
Housing Finances in Troy
Median Income by Occupancy in Troy
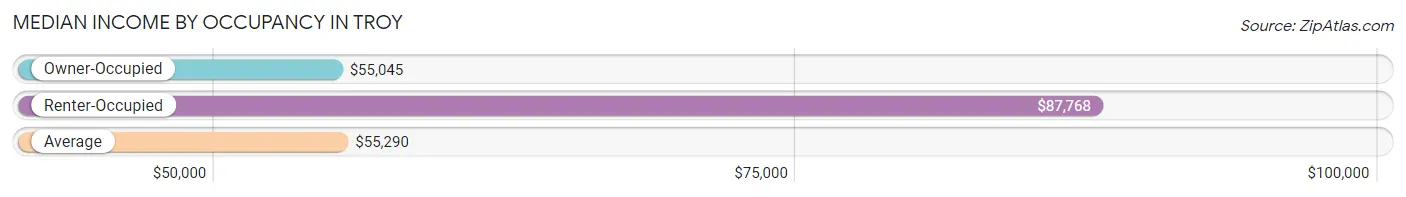
| Occupancy Type | # Households | Median Income |
| Owner-Occupied | 176 (81.9%) | $55,045 |
| Renter-Occupied | 39 (18.1%) | $87,768 |
| Average | 215 (100.0%) | $55,290 |
Occupancy by Householder Income Bracket in Troy
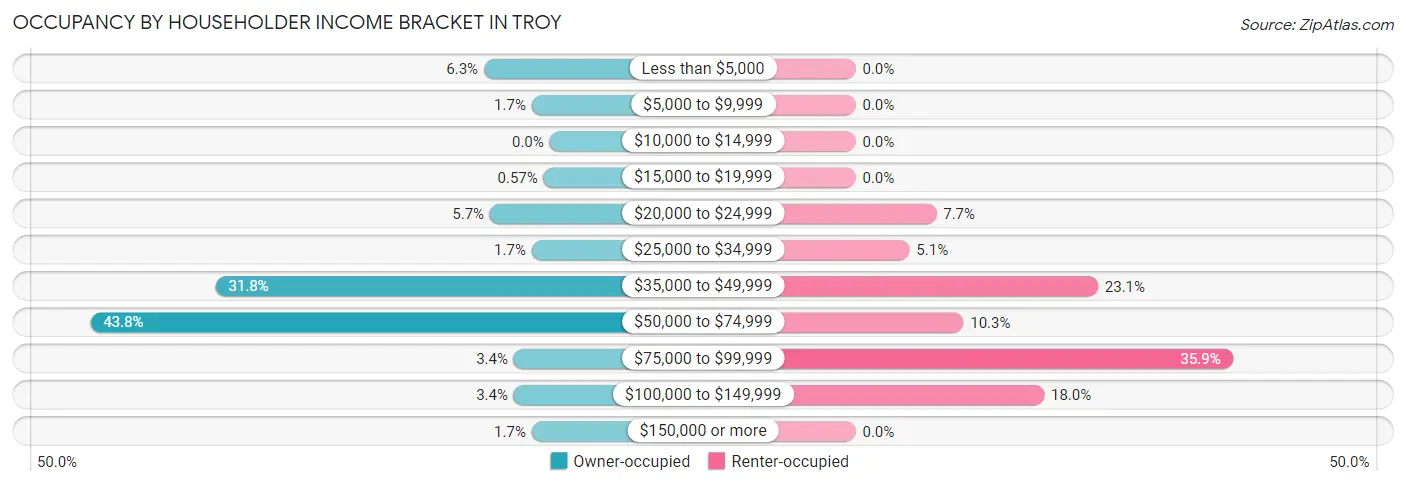
| Income Bracket | Owner-occupied | Renter-occupied |
| Less than $5,000 | 11 (6.2%) | 0 (0.0%) |
| $5,000 to $9,999 | 3 (1.7%) | 0 (0.0%) |
| $10,000 to $14,999 | 0 (0.0%) | 0 (0.0%) |
| $15,000 to $19,999 | 1 (0.6%) | 0 (0.0%) |
| $20,000 to $24,999 | 10 (5.7%) | 3 (7.7%) |
| $25,000 to $34,999 | 3 (1.7%) | 2 (5.1%) |
| $35,000 to $49,999 | 56 (31.8%) | 9 (23.1%) |
| $50,000 to $74,999 | 77 (43.8%) | 4 (10.3%) |
| $75,000 to $99,999 | 6 (3.4%) | 14 (35.9%) |
| $100,000 to $149,999 | 6 (3.4%) | 7 (17.9%) |
| $150,000 or more | 3 (1.7%) | 0 (0.0%) |
| Total | 176 (100.0%) | 39 (100.0%) |
Monthly Housing Cost Tiers in Troy
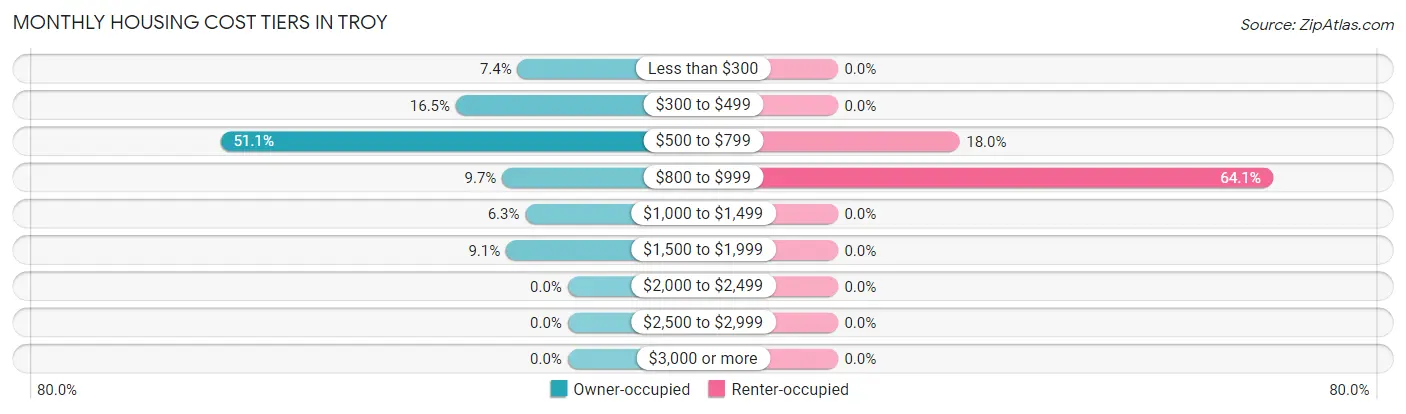
| Monthly Cost | Owner-occupied | Renter-occupied |
| Less than $300 | 13 (7.4%) | 0 (0.0%) |
| $300 to $499 | 29 (16.5%) | 0 (0.0%) |
| $500 to $799 | 90 (51.1%) | 7 (17.9%) |
| $800 to $999 | 17 (9.7%) | 25 (64.1%) |
| $1,000 to $1,499 | 11 (6.2%) | 0 (0.0%) |
| $1,500 to $1,999 | 16 (9.1%) | 0 (0.0%) |
| $2,000 to $2,499 | 0 (0.0%) | 0 (0.0%) |
| $2,500 to $2,999 | 0 (0.0%) | 0 (0.0%) |
| $3,000 or more | 0 (0.0%) | 0 (0.0%) |
| Total | 176 (100.0%) | 39 (100.0%) |
Physical Housing Characteristics in Troy
Housing Structures in Troy
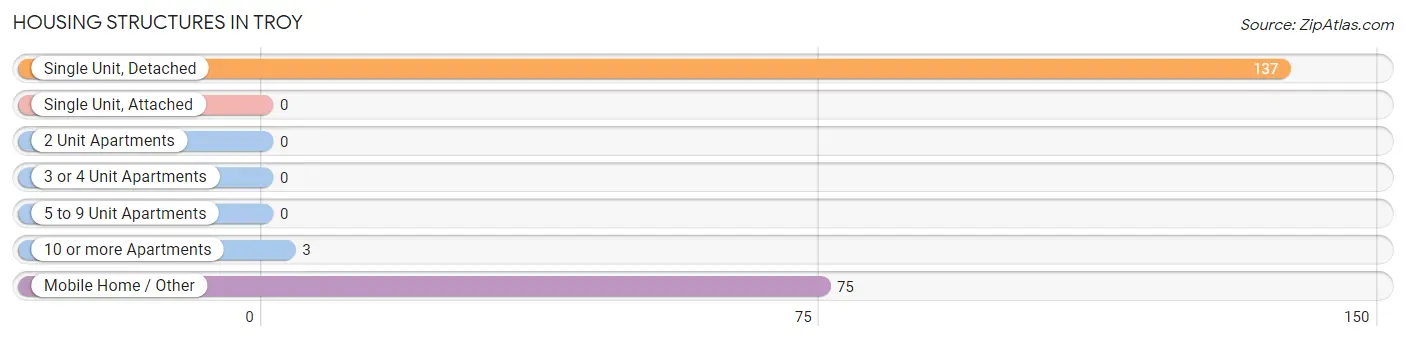
| Structure Type | # Housing Units | % Housing Units |
| Single Unit, Detached | 137 | 63.7% |
| Single Unit, Attached | 0 | 0.0% |
| 2 Unit Apartments | 0 | 0.0% |
| 3 or 4 Unit Apartments | 0 | 0.0% |
| 5 to 9 Unit Apartments | 0 | 0.0% |
| 10 or more Apartments | 3 | 1.4% |
| Mobile Home / Other | 75 | 34.9% |
| Total | 215 | 100.0% |
Housing Structures by Occupancy in Troy
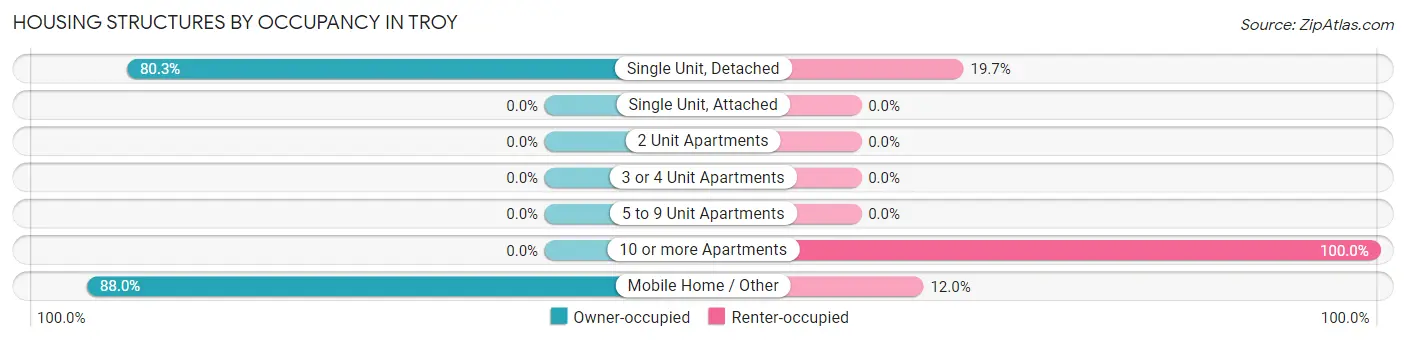
| Structure Type | Owner-occupied | Renter-occupied |
| Single Unit, Detached | 110 (80.3%) | 27 (19.7%) |
| Single Unit, Attached | 0 (0.0%) | 0 (0.0%) |
| 2 Unit Apartments | 0 (0.0%) | 0 (0.0%) |
| 3 or 4 Unit Apartments | 0 (0.0%) | 0 (0.0%) |
| 5 to 9 Unit Apartments | 0 (0.0%) | 0 (0.0%) |
| 10 or more Apartments | 0 (0.0%) | 3 (100.0%) |
| Mobile Home / Other | 66 (88.0%) | 9 (12.0%) |
| Total | 176 (81.9%) | 39 (18.1%) |
Housing Structures by Number of Rooms in Troy
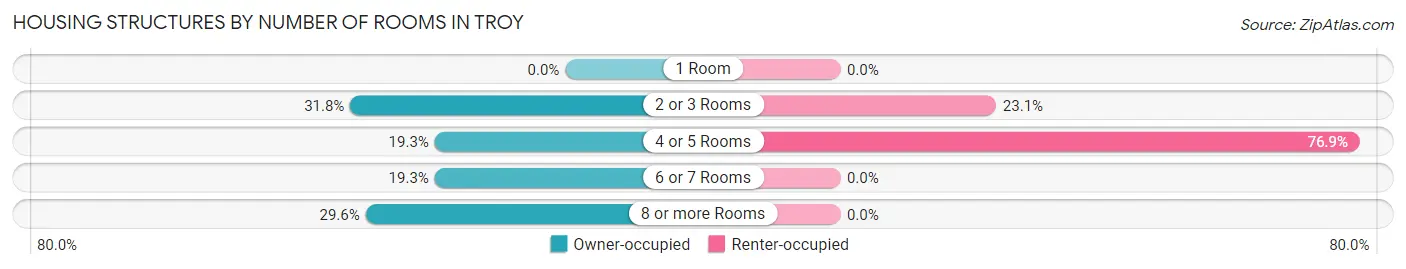
| Number of Rooms | Owner-occupied | Renter-occupied |
| 1 Room | 0 (0.0%) | 0 (0.0%) |
| 2 or 3 Rooms | 56 (31.8%) | 9 (23.1%) |
| 4 or 5 Rooms | 34 (19.3%) | 30 (76.9%) |
| 6 or 7 Rooms | 34 (19.3%) | 0 (0.0%) |
| 8 or more Rooms | 52 (29.5%) | 0 (0.0%) |
| Total | 176 (100.0%) | 39 (100.0%) |
Housing Structure by Heating Type in Troy
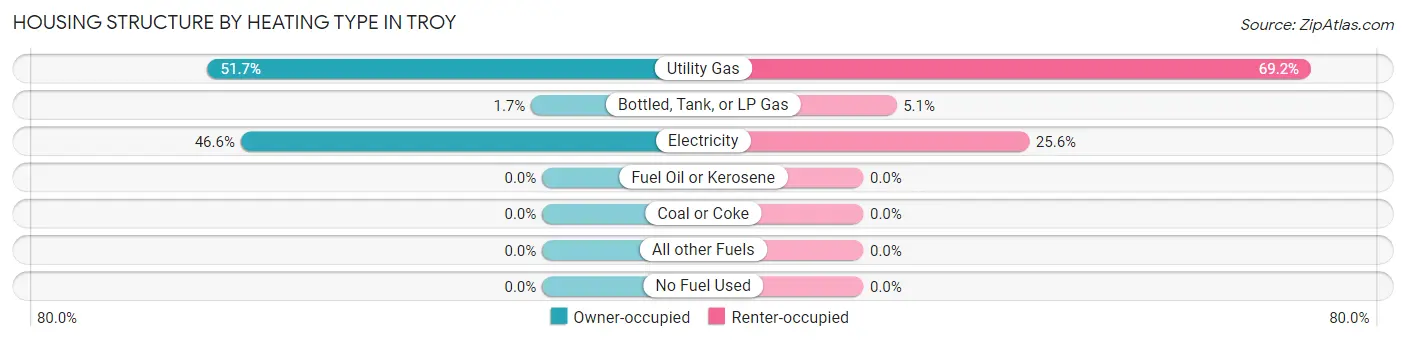
| Heating Type | Owner-occupied | Renter-occupied |
| Utility Gas | 91 (51.7%) | 27 (69.2%) |
| Bottled, Tank, or LP Gas | 3 (1.7%) | 2 (5.1%) |
| Electricity | 82 (46.6%) | 10 (25.6%) |
| Fuel Oil or Kerosene | 0 (0.0%) | 0 (0.0%) |
| Coal or Coke | 0 (0.0%) | 0 (0.0%) |
| All other Fuels | 0 (0.0%) | 0 (0.0%) |
| No Fuel Used | 0 (0.0%) | 0 (0.0%) |
| Total | 176 (100.0%) | 39 (100.0%) |
Household Vehicle Usage in Troy
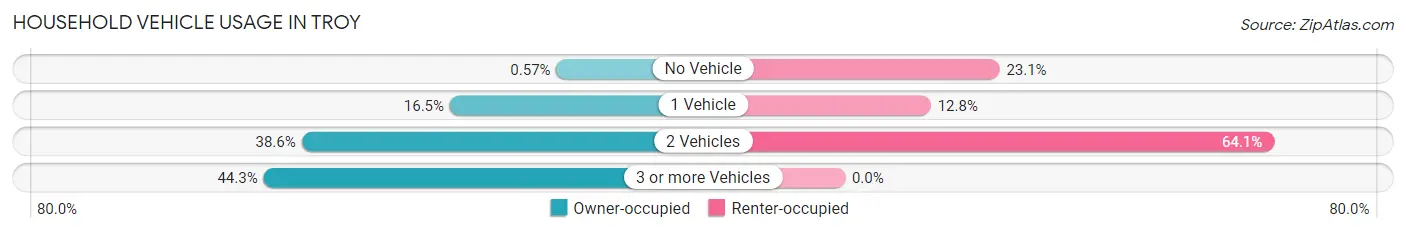
| Vehicles per Household | Owner-occupied | Renter-occupied |
| No Vehicle | 1 (0.6%) | 9 (23.1%) |
| 1 Vehicle | 29 (16.5%) | 5 (12.8%) |
| 2 Vehicles | 68 (38.6%) | 25 (64.1%) |
| 3 or more Vehicles | 78 (44.3%) | 0 (0.0%) |
| Total | 176 (100.0%) | 39 (100.0%) |
Real Estate & Mortgages in Troy
Real Estate and Mortgage Overview in Troy
| Characteristic | Without Mortgage | With Mortgage |
| Housing Units | 118 | 58 |
| Median Property Value | $9,999 | $116,300 |
| Median Household Income | $55,625 | $3 |
| Monthly Housing Costs | $528 | $0 |
| Real Estate Taxes | - | - |
Property Value by Mortgage Status in Troy
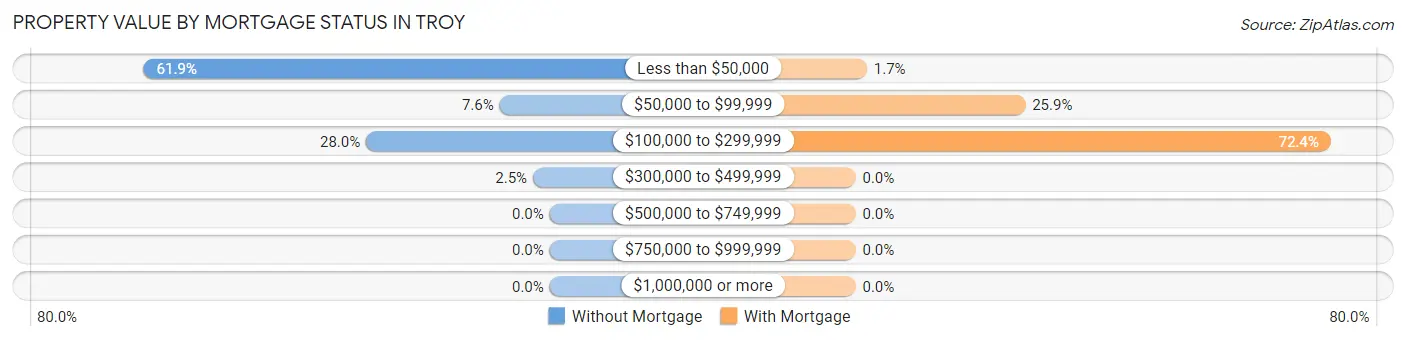
| Property Value | Without Mortgage | With Mortgage |
| Less than $50,000 | 73 (61.9%) | 1 (1.7%) |
| $50,000 to $99,999 | 9 (7.6%) | 15 (25.9%) |
| $100,000 to $299,999 | 33 (28.0%) | 42 (72.4%) |
| $300,000 to $499,999 | 3 (2.5%) | 0 (0.0%) |
| $500,000 to $749,999 | 0 (0.0%) | 0 (0.0%) |
| $750,000 to $999,999 | 0 (0.0%) | 0 (0.0%) |
| $1,000,000 or more | 0 (0.0%) | 0 (0.0%) |
| Total | 118 (100.0%) | 58 (100.0%) |
Household Income by Mortgage Status in Troy
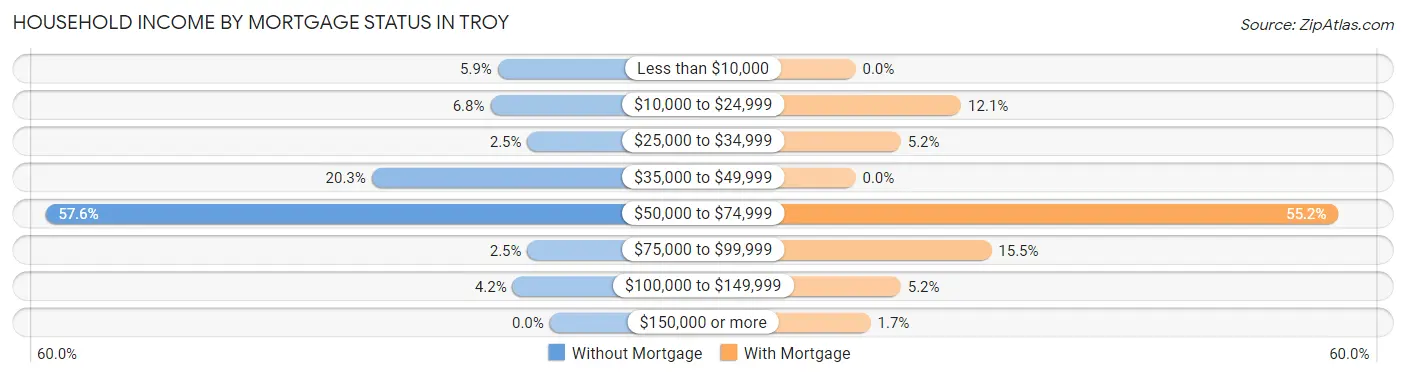
| Household Income | Without Mortgage | With Mortgage |
| Less than $10,000 | 7 (5.9%) | 0 (0.0%) |
| $10,000 to $24,999 | 8 (6.8%) | 7 (12.1%) |
| $25,000 to $34,999 | 3 (2.5%) | 3 (5.2%) |
| $35,000 to $49,999 | 24 (20.3%) | 0 (0.0%) |
| $50,000 to $74,999 | 68 (57.6%) | 32 (55.2%) |
| $75,000 to $99,999 | 3 (2.5%) | 9 (15.5%) |
| $100,000 to $149,999 | 5 (4.2%) | 3 (5.2%) |
| $150,000 or more | 0 (0.0%) | 1 (1.7%) |
| Total | 118 (100.0%) | 58 (100.0%) |
Property Value to Household Income Ratio in Troy
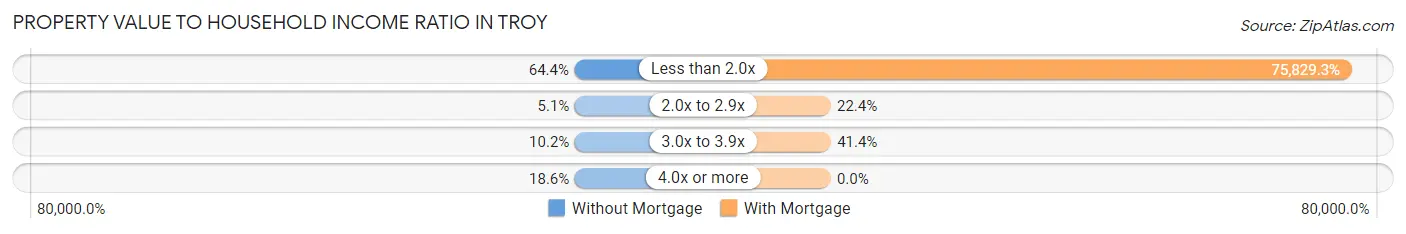
| Value-to-Income Ratio | Without Mortgage | With Mortgage |
| Less than 2.0x | 76 (64.4%) | 43,981 (75,829.3%) |
| 2.0x to 2.9x | 6 (5.1%) | 13 (22.4%) |
| 3.0x to 3.9x | 12 (10.2%) | 24 (41.4%) |
| 4.0x or more | 22 (18.6%) | 0 (0.0%) |
| Total | 118 (100.0%) | 58 (100.0%) |
Real Estate Taxes by Mortgage Status in Troy
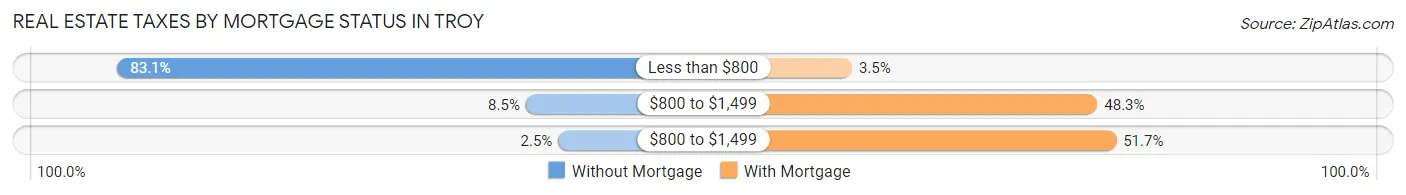
| Property Taxes | Without Mortgage | With Mortgage |
| Less than $800 | 98 (83.1%) | 2 (3.5%) |
| $800 to $1,499 | 10 (8.5%) | 28 (48.3%) |
| $800 to $1,499 | 3 (2.5%) | 30 (51.7%) |
| Total | 118 (100.0%) | 58 (100.0%) |
Health & Disability in Troy
Health Insurance Coverage by Age in Troy
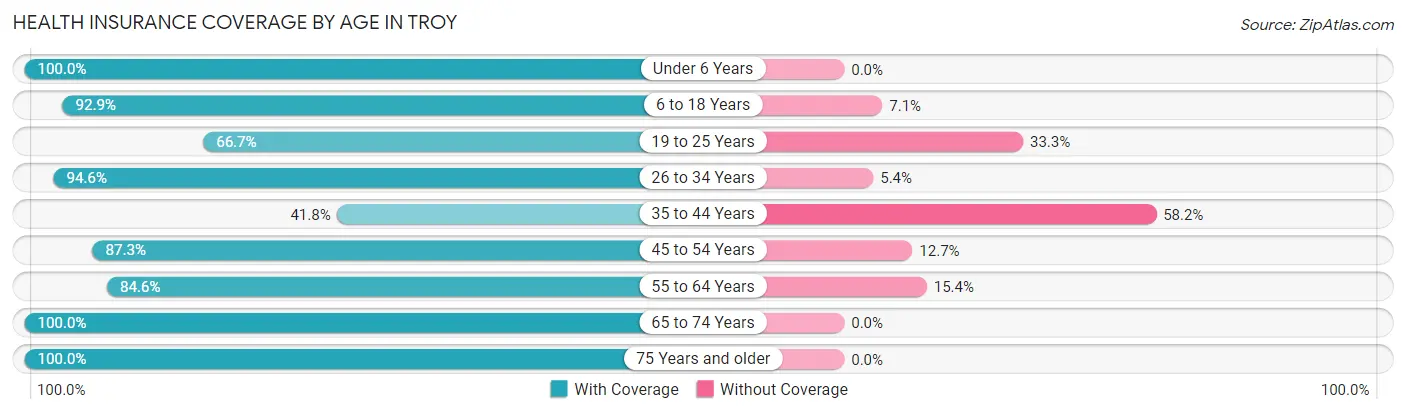
| Age Bracket | With Coverage | Without Coverage |
| Under 6 Years | 27 (100.0%) | 0 (0.0%) |
| 6 to 18 Years | 170 (92.9%) | 13 (7.1%) |
| 19 to 25 Years | 10 (66.7%) | 5 (33.3%) |
| 26 to 34 Years | 70 (94.6%) | 4 (5.4%) |
| 35 to 44 Years | 41 (41.8%) | 57 (58.2%) |
| 45 to 54 Years | 55 (87.3%) | 8 (12.7%) |
| 55 to 64 Years | 11 (84.6%) | 2 (15.4%) |
| 65 to 74 Years | 72 (100.0%) | 0 (0.0%) |
| 75 Years and older | 34 (100.0%) | 0 (0.0%) |
| Total | 490 (84.6%) | 89 (15.4%) |
Health Insurance Coverage by Citizenship Status in Troy
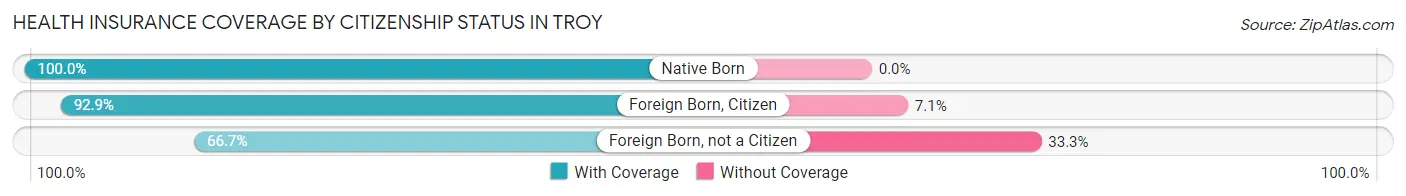
| Citizenship Status | With Coverage | Without Coverage |
| Native Born | 27 (100.0%) | 0 (0.0%) |
| Foreign Born, Citizen | 170 (92.9%) | 13 (7.1%) |
| Foreign Born, not a Citizen | 10 (66.7%) | 5 (33.3%) |
Health Insurance Coverage by Household Income in Troy
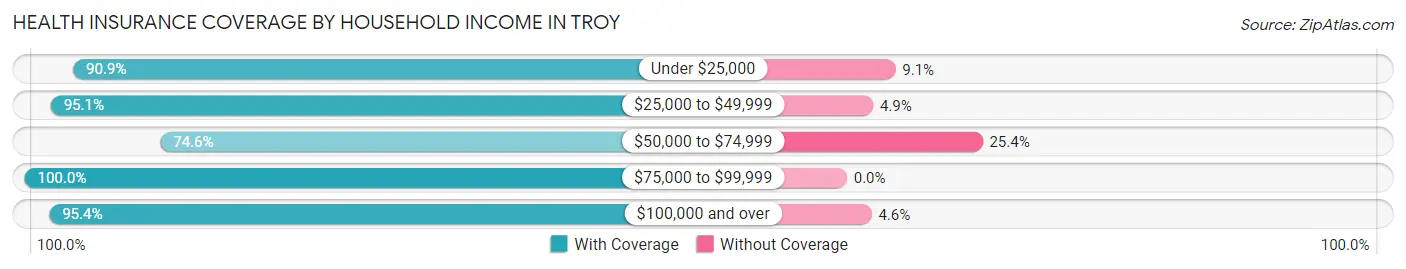
| Household Income | With Coverage | Without Coverage |
| Under $25,000 | 40 (90.9%) | 4 (9.1%) |
| $25,000 to $49,999 | 136 (95.1%) | 7 (4.9%) |
| $50,000 to $74,999 | 220 (74.6%) | 75 (25.4%) |
| $75,000 to $99,999 | 32 (100.0%) | 0 (0.0%) |
| $100,000 and over | 62 (95.4%) | 3 (4.6%) |
Public vs Private Health Insurance Coverage by Age in Troy
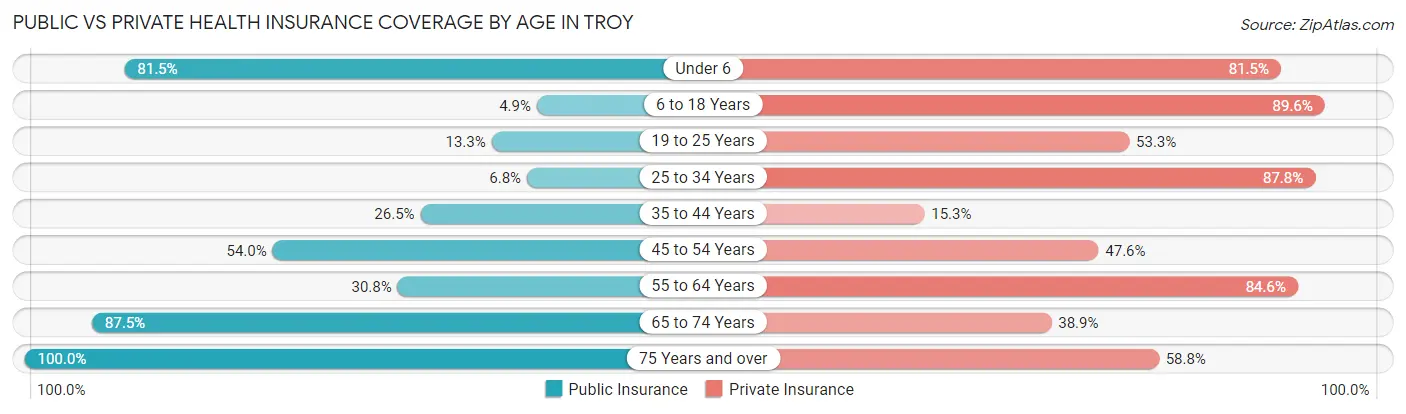
| Age Bracket | Public Insurance | Private Insurance |
| Under 6 | 22 (81.5%) | 22 (81.5%) |
| 6 to 18 Years | 9 (4.9%) | 164 (89.6%) |
| 19 to 25 Years | 2 (13.3%) | 8 (53.3%) |
| 25 to 34 Years | 5 (6.8%) | 65 (87.8%) |
| 35 to 44 Years | 26 (26.5%) | 15 (15.3%) |
| 45 to 54 Years | 34 (54.0%) | 30 (47.6%) |
| 55 to 64 Years | 4 (30.8%) | 11 (84.6%) |
| 65 to 74 Years | 63 (87.5%) | 28 (38.9%) |
| 75 Years and over | 34 (100.0%) | 20 (58.8%) |
| Total | 199 (34.4%) | 363 (62.7%) |
Disability Status by Sex by Age in Troy
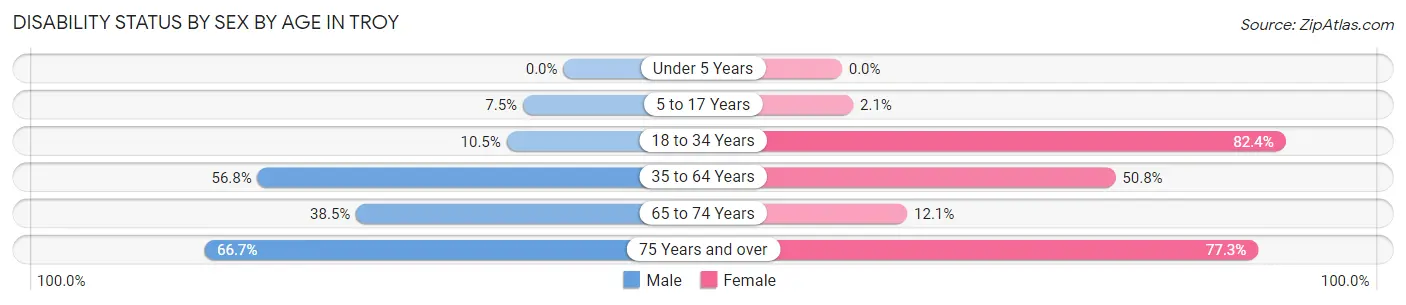
| Age Bracket | Male | Female |
| Under 5 Years | 0 (0.0%) | 0 (0.0%) |
| 5 to 17 Years | 3 (7.5%) | 3 (2.1%) |
| 18 to 34 Years | 4 (10.5%) | 42 (82.4%) |
| 35 to 64 Years | 63 (56.8%) | 32 (50.8%) |
| 65 to 74 Years | 15 (38.5%) | 4 (12.1%) |
| 75 Years and over | 8 (66.7%) | 17 (77.3%) |
Disability Class by Sex by Age in Troy
Disability Class: Hearing Difficulty
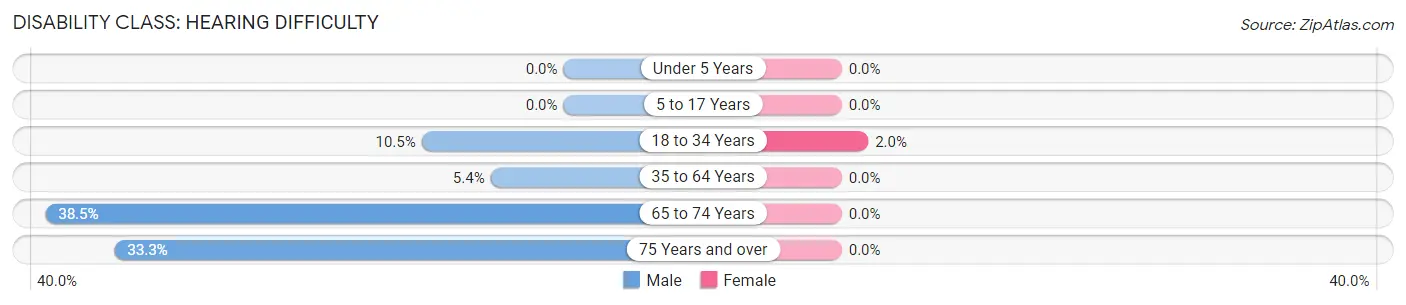
| Age Bracket | Male | Female |
| Under 5 Years | 0 (0.0%) | 0 (0.0%) |
| 5 to 17 Years | 0 (0.0%) | 0 (0.0%) |
| 18 to 34 Years | 4 (10.5%) | 1 (2.0%) |
| 35 to 64 Years | 6 (5.4%) | 0 (0.0%) |
| 65 to 74 Years | 15 (38.5%) | 0 (0.0%) |
| 75 Years and over | 4 (33.3%) | 0 (0.0%) |
Disability Class: Vision Difficulty
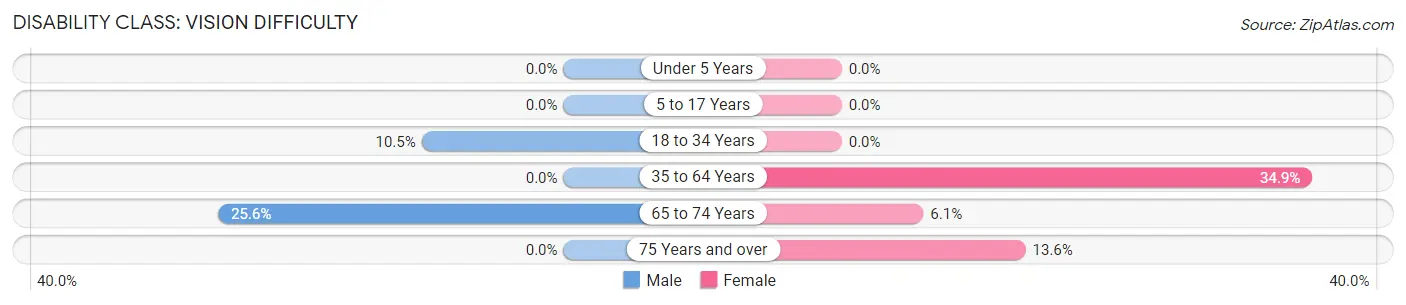
| Age Bracket | Male | Female |
| Under 5 Years | 0 (0.0%) | 0 (0.0%) |
| 5 to 17 Years | 0 (0.0%) | 0 (0.0%) |
| 18 to 34 Years | 4 (10.5%) | 0 (0.0%) |
| 35 to 64 Years | 0 (0.0%) | 22 (34.9%) |
| 65 to 74 Years | 10 (25.6%) | 2 (6.1%) |
| 75 Years and over | 0 (0.0%) | 3 (13.6%) |
Disability Class: Cognitive Difficulty
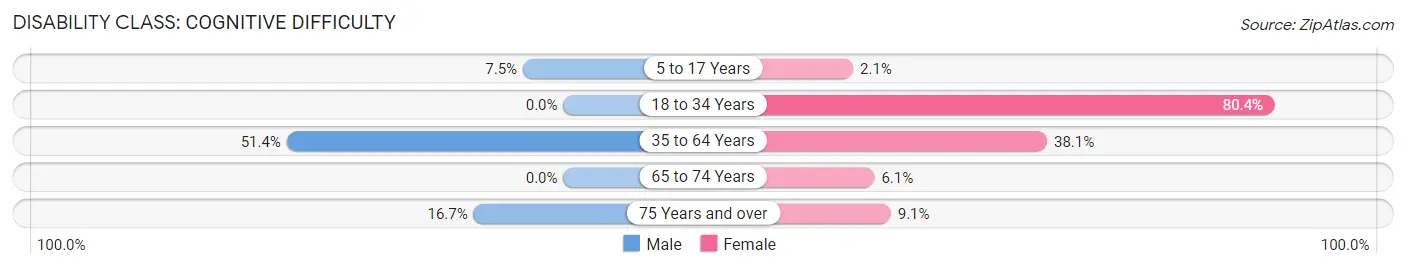
| Age Bracket | Male | Female |
| 5 to 17 Years | 3 (7.5%) | 3 (2.1%) |
| 18 to 34 Years | 0 (0.0%) | 41 (80.4%) |
| 35 to 64 Years | 57 (51.3%) | 24 (38.1%) |
| 65 to 74 Years | 0 (0.0%) | 2 (6.1%) |
| 75 Years and over | 2 (16.7%) | 2 (9.1%) |
Disability Class: Ambulatory Difficulty
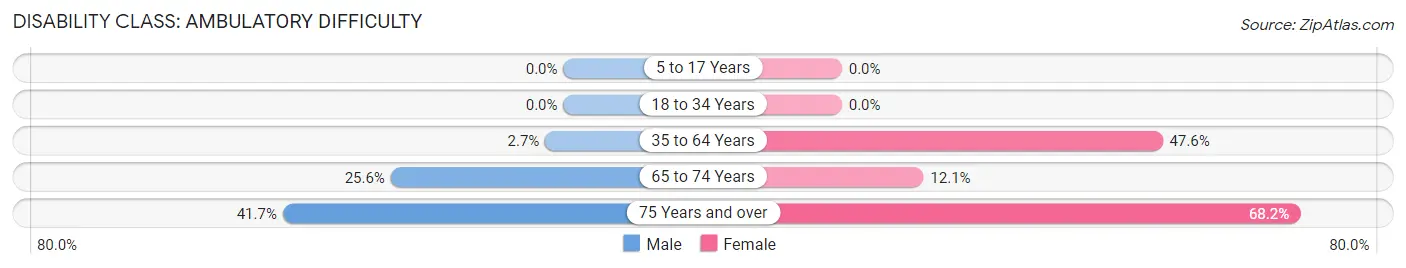
| Age Bracket | Male | Female |
| 5 to 17 Years | 0 (0.0%) | 0 (0.0%) |
| 18 to 34 Years | 0 (0.0%) | 0 (0.0%) |
| 35 to 64 Years | 3 (2.7%) | 30 (47.6%) |
| 65 to 74 Years | 10 (25.6%) | 4 (12.1%) |
| 75 Years and over | 5 (41.7%) | 15 (68.2%) |
Disability Class: Self-Care Difficulty
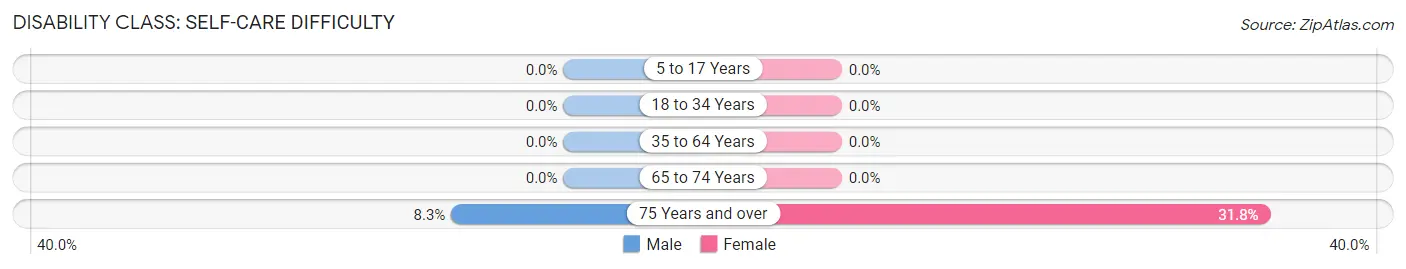
| Age Bracket | Male | Female |
| 5 to 17 Years | 0 (0.0%) | 0 (0.0%) |
| 18 to 34 Years | 0 (0.0%) | 0 (0.0%) |
| 35 to 64 Years | 0 (0.0%) | 0 (0.0%) |
| 65 to 74 Years | 0 (0.0%) | 0 (0.0%) |
| 75 Years and over | 1 (8.3%) | 7 (31.8%) |
Technology Access in Troy
Computing Device Access in Troy
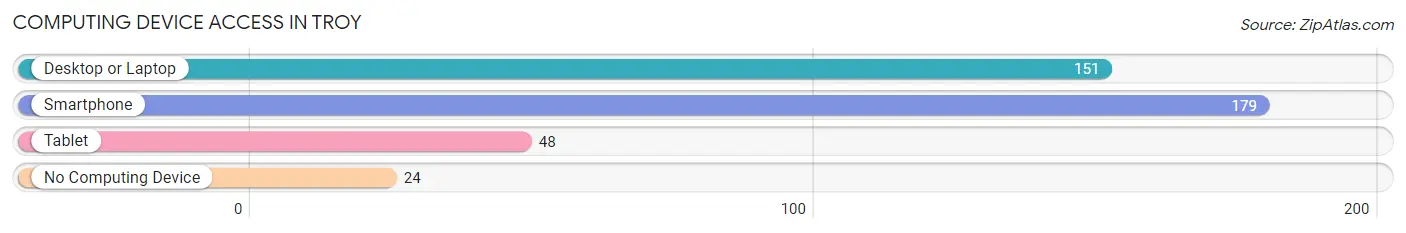
| Device Type | # Households | % Households |
| Desktop or Laptop | 151 | 70.2% |
| Smartphone | 179 | 83.3% |
| Tablet | 48 | 22.3% |
| No Computing Device | 24 | 11.2% |
| Total | 215 | 100.0% |
Internet Access in Troy
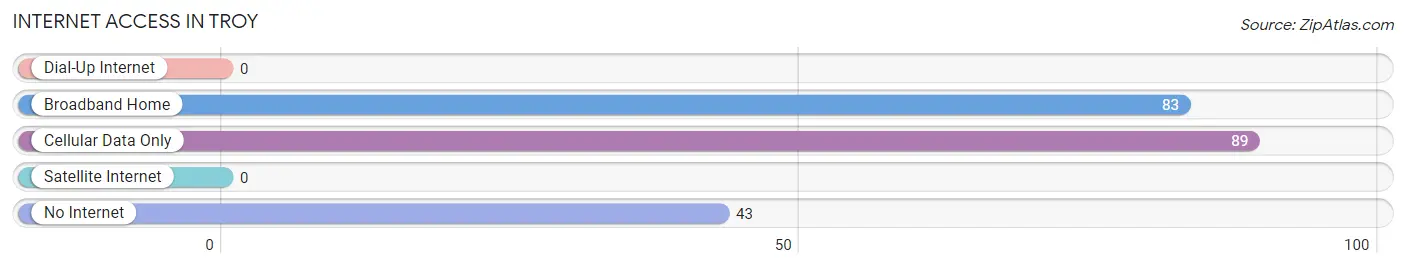
| Internet Type | # Households | % Households |
| Dial-Up Internet | 0 | 0.0% |
| Broadband Home | 83 | 38.6% |
| Cellular Data Only | 89 | 41.4% |
| Satellite Internet | 0 | 0.0% |
| No Internet | 43 | 20.0% |
| Total | 215 | 100.0% |
Troy Summary
Troy is a small town located in Miami County, Indiana, United States. It is situated along the Wabash River, approximately 25 miles north of Indianapolis. The population of Troy was estimated to be 8,845 in 2019.
History
Troy was founded in 1825 by William and Mary Miller, who were among the first settlers in the area. The town was named after the ancient city of Troy in Greece. The Millers built a log cabin and a grist mill, which became the center of the town.
In 1832, the town was incorporated and the first post office was established. The town grew rapidly and by 1837, it had a population of over 500.
In 1851, the Wabash and Erie Canal was completed, connecting Troy to the Ohio River. This allowed for increased trade and commerce, and the town continued to grow.
In 1871, the first railroad line was built, connecting Troy to Indianapolis. This allowed for increased transportation of goods and people, and the town continued to grow.
In 1887, the first telephone line was installed in Troy. This allowed for increased communication and the town continued to grow.
In the early 20th century, Troy experienced a period of growth and prosperity. The town was home to several factories, including a glass factory, a furniture factory, and a canning factory.
Geography
Troy is located in the Wabash Valley region of Indiana. It is situated along the Wabash River, approximately 25 miles north of Indianapolis. The town is surrounded by rolling hills and farmland.
The climate in Troy is humid continental, with hot summers and cold winters. The average annual temperature is around 50 degrees Fahrenheit.
Economy
Troy’s economy is largely based on agriculture and manufacturing. The town is home to several factories, including a glass factory, a furniture factory, and a canning factory.
The town is also home to several small businesses including restaurants shops and services
Demographics
As of 2019, the population of Troy was estimated to be 8,845. The racial makeup of the town is 94.3% White, 1.2% African American, 0.3% Native American, 0.7% Asian, and 3.5% from other races.
The median household income in Troy is $45,945, and the median home value is $117,400. The town has a poverty rate of 16.2%.
Conclusion
Troy is a small town located in Miami County, Indiana, United States. It is situated along the Wabash River, approximately 25 miles north of Indianapolis. The town was founded in 1825 and has a population of 8,845 as of 2019. The economy of Troy is largely based on agriculture and manufacturing, and the town is home to several small businesses. The racial makeup of the town is 94.3% White, 1.2% African American, 0.3% Native American, 0.7% Asian, and 3.5% from other races. The median household income in Troy is $45,945, and the median home value is $117,400.
Common Questions
What is Per Capita Income in Troy?
Per Capita income in Troy is $20,999.
What is the Median Family Income in Troy?
Median Family Income in Troy is $55,741.
What is the Median Household income in Troy?
Median Household Income in Troy is $55,290.
What is Income or Wage Gap in Troy?
Income or Wage Gap in Troy is 40.5%.
Women in Troy earn 59.5 cents for every dollar earned by a man.
What is Family Income Deficit in Troy?
Family Income Deficit in Troy is $17,383.
Families that are below poverty line in Troy earn $17,383 less on average than the poverty threshold level.
What is Inequality or Gini Index in Troy?
Inequality or Gini Index in Troy is 0.27.
What is the Total Population of Troy?
Total Population of Troy is 579.
What is the Total Male Population of Troy?
Total Male Population of Troy is 253.
What is the Total Female Population of Troy?
Total Female Population of Troy is 326.
What is the Ratio of Males per 100 Females in Troy?
There are 77.61 Males per 100 Females in Troy.
What is the Ratio of Females per 100 Males in Troy?
There are 128.85 Females per 100 Males in Troy.
What is the Median Population Age in Troy?
Median Population Age in Troy is 32.9 Years.
What is the Average Family Size in Troy
Average Family Size in Troy is 3.4 People.
What is the Average Household Size in Troy
Average Household Size in Troy is 2.7 People.
How Large is the Labor Force in Troy?
There are 203 People in the Labor Forcein in Troy.
What is the Percentage of People in the Labor Force in Troy?
54.6% of People are in the Labor Force in Troy.
What is the Unemployment Rate in Troy?
Unemployment Rate in Troy is 2.0%.