Kewanna, IN Map & Demographics
Kewanna Map
Kewanna Overview
$27,021
PER CAPITA INCOME
$70,298
AVG FAMILY INCOME
$52,143
AVG HOUSEHOLD INCOME
37.6%
WAGE / INCOME GAP [ % ]
62.4¢/ $1
WAGE / INCOME GAP [ $ ]
$9,618
FAMILY INCOME DEFICIT
0.43
INEQUALITY / GINI INDEX
587
TOTAL POPULATION
318
MALE POPULATION
269
FEMALE POPULATION
118.22
MALES / 100 FEMALES
84.59
FEMALES / 100 MALES
41.3
MEDIAN AGE
3.0
AVG FAMILY SIZE
2.6
AVG HOUSEHOLD SIZE
301
LABOR FORCE [ PEOPLE ]
62.8%
PERCENT IN LABOR FORCE
5.0%
UNEMPLOYMENT RATE
Kewanna Zip Codes
Kewanna Area Codes
Income in Kewanna
Income Overview in Kewanna
Per Capita Income in Kewanna is $27,021, while median incomes of families and households are $70,298 and $52,143 respectively.
| Characteristic | Number | Measure |
| Per Capita Income | 587 | $27,021 |
| Median Family Income | 149 | $70,298 |
| Mean Family Income | 149 | $72,238 |
| Median Household Income | 222 | $52,143 |
| Mean Household Income | 222 | $64,139 |
| Income Deficit | 149 | $9,618 |
| Wage / Income Gap (%) | 587 | 37.56% |
| Wage / Income Gap ($) | 587 | 62.44¢ per $1 |
| Gini / Inequality Index | 587 | 0.43 |
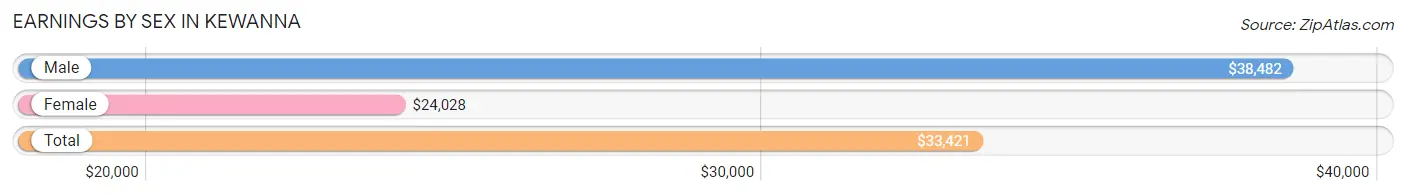
Earnings by Sex in Kewanna
Average Earnings in Kewanna are $33,421, $38,482 for men and $24,028 for women, a difference of 37.6%.
| Sex | Number | Average Earnings |
| Male | 183 (56.1%) | $38,482 |
| Female | 143 (43.9%) | $24,028 |
| Total | 326 (100.0%) | $33,421 |
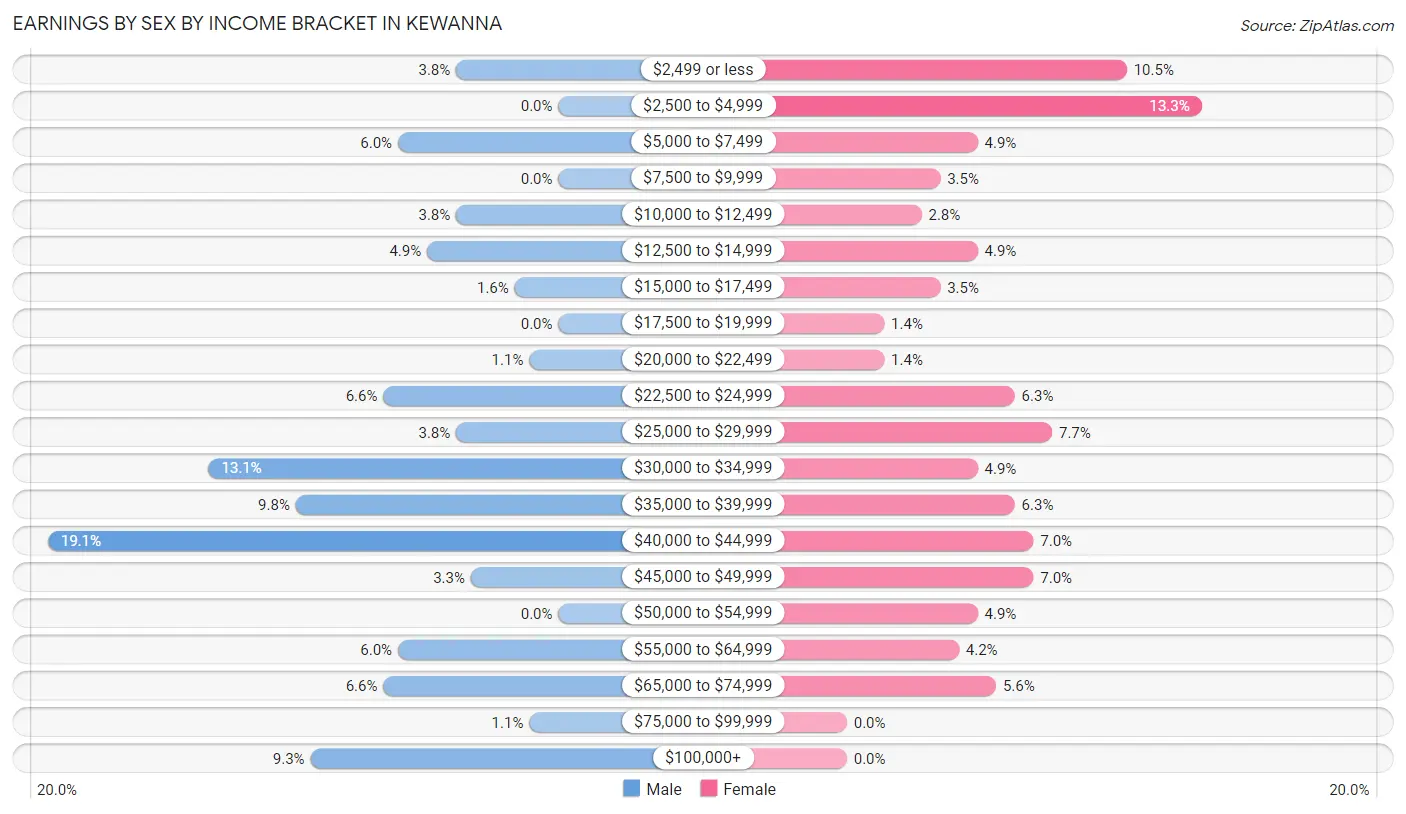
Earnings by Sex by Income Bracket in Kewanna
The most common earnings brackets in Kewanna are $40,000 to $44,999 for men (35 | 19.1%) and $2,500 to $4,999 for women (19 | 13.3%).
| Income | Male | Female |
| $2,499 or less | 7 (3.8%) | 15 (10.5%) |
| $2,500 to $4,999 | 0 (0.0%) | 19 (13.3%) |
| $5,000 to $7,499 | 11 (6.0%) | 7 (4.9%) |
| $7,500 to $9,999 | 0 (0.0%) | 5 (3.5%) |
| $10,000 to $12,499 | 7 (3.8%) | 4 (2.8%) |
| $12,500 to $14,999 | 9 (4.9%) | 7 (4.9%) |
| $15,000 to $17,499 | 3 (1.6%) | 5 (3.5%) |
| $17,500 to $19,999 | 0 (0.0%) | 2 (1.4%) |
| $20,000 to $22,499 | 2 (1.1%) | 2 (1.4%) |
| $22,500 to $24,999 | 12 (6.6%) | 9 (6.3%) |
| $25,000 to $29,999 | 7 (3.8%) | 11 (7.7%) |
| $30,000 to $34,999 | 24 (13.1%) | 7 (4.9%) |
| $35,000 to $39,999 | 18 (9.8%) | 9 (6.3%) |
| $40,000 to $44,999 | 35 (19.1%) | 10 (7.0%) |
| $45,000 to $49,999 | 6 (3.3%) | 10 (7.0%) |
| $50,000 to $54,999 | 0 (0.0%) | 7 (4.9%) |
| $55,000 to $64,999 | 11 (6.0%) | 6 (4.2%) |
| $65,000 to $74,999 | 12 (6.6%) | 8 (5.6%) |
| $75,000 to $99,999 | 2 (1.1%) | 0 (0.0%) |
| $100,000+ | 17 (9.3%) | 0 (0.0%) |
| Total | 183 (100.0%) | 143 (100.0%) |
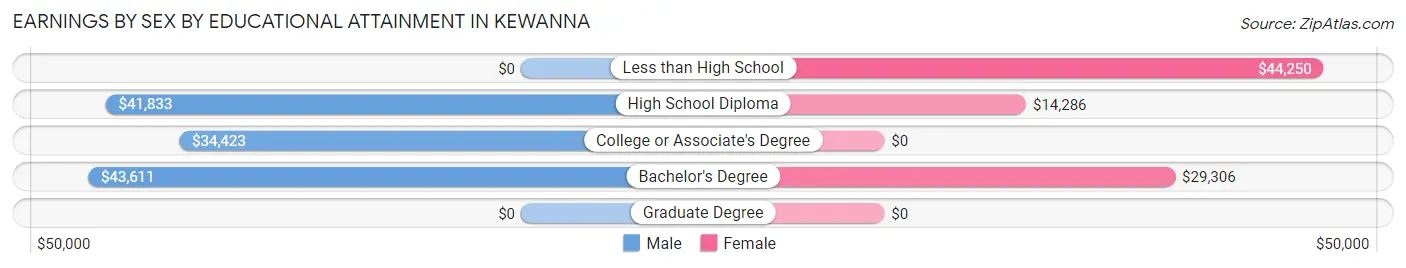
Earnings by Sex by Educational Attainment in Kewanna
Average earnings in Kewanna are $41,313 for men and $29,722 for women, a difference of 28.1%. Men with an educational attainment of bachelor's degree enjoy the highest average annual earnings of $43,611, while those with college or associate's degree education earn the least with $34,423. Women with an educational attainment of less than high school earn the most with the average annual earnings of $44,250, while those with high school diploma education have the smallest earnings of $14,286.
| Educational Attainment | Male Income | Female Income |
| Less than High School | - | - |
| High School Diploma | $41,833 | $14,286 |
| College or Associate's Degree | $34,423 | $0 |
| Bachelor's Degree | $43,611 | $29,306 |
| Graduate Degree | - | - |
| Total | $41,313 | $29,722 |
Family Income in Kewanna
Family Income Brackets in Kewanna
According to the Kewanna family income data, there are 53 families falling into the $50,000 to $74,999 income range, which is the most common income bracket and makes up 35.6% of all families. Conversely, the $200,000+ income bracket is the least frequent group with only 1 families (0.7%) belonging to this category.
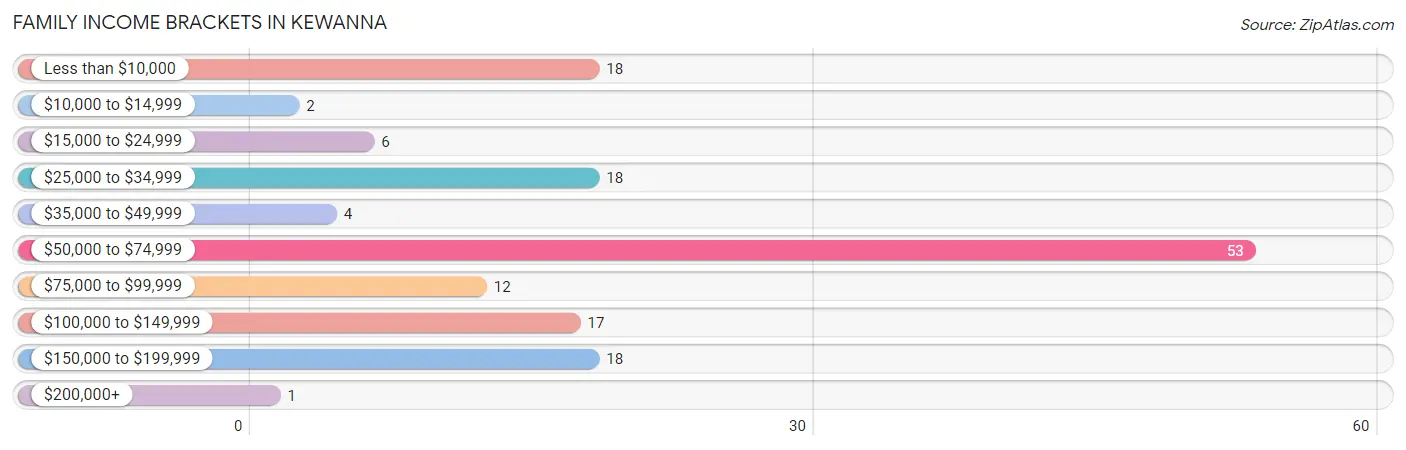
| Income Bracket | # Families | % Families |
| Less than $10,000 | 18 | 12.1% |
| $10,000 to $14,999 | 2 | 1.3% |
| $15,000 to $24,999 | 6 | 4.0% |
| $25,000 to $34,999 | 18 | 12.1% |
| $35,000 to $49,999 | 4 | 2.7% |
| $50,000 to $74,999 | 53 | 35.6% |
| $75,000 to $99,999 | 12 | 8.1% |
| $100,000 to $149,999 | 17 | 11.4% |
| $150,000 to $199,999 | 18 | 12.1% |
| $200,000+ | 1 | 0.7% |
Family Income by Famaliy Size in Kewanna
4-person families (23 | 15.4%) account for the highest median family income in Kewanna with $71,806 per family, while 2-person families (87 | 58.4%) have the highest median income of $30,208 per family member.
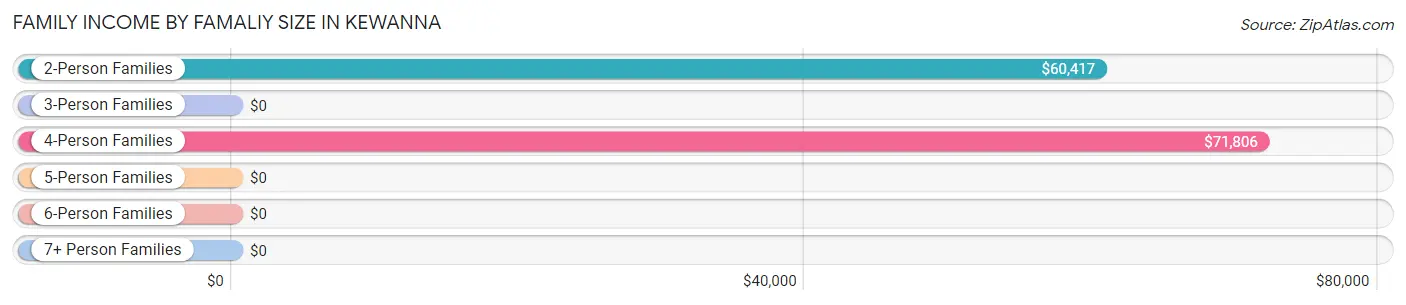
| Income Bracket | # Families | Median Income |
| 2-Person Families | 87 (58.4%) | $60,417 |
| 3-Person Families | 15 (10.1%) | $0 |
| 4-Person Families | 23 (15.4%) | $71,806 |
| 5-Person Families | 24 (16.1%) | $0 |
| 6-Person Families | 0 (0.0%) | $0 |
| 7+ Person Families | 0 (0.0%) | $0 |
| Total | 149 (100.0%) | $70,298 |
Family Income by Number of Earners in Kewanna
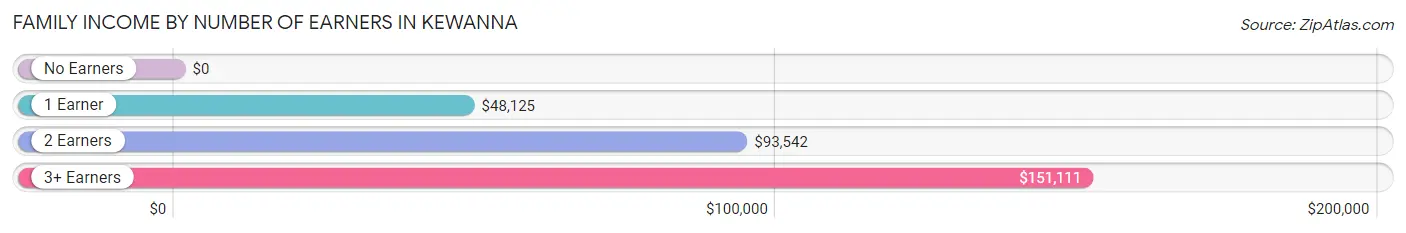
| Number of Earners | # Families | Median Income |
| No Earners | 25 (16.8%) | $0 |
| 1 Earner | 65 (43.6%) | $48,125 |
| 2 Earners | 47 (31.5%) | $93,542 |
| 3+ Earners | 12 (8.1%) | $151,111 |
| Total | 149 (100.0%) | $70,298 |
Household Income in Kewanna
Household Income Brackets in Kewanna
With 56 households falling in the category, the $50,000 to $74,999 income range is the most frequent in Kewanna, accounting for 25.2% of all households. In contrast, only 5 households (2.2%) fall into the $200,000+ income bracket, making it the least populous group.
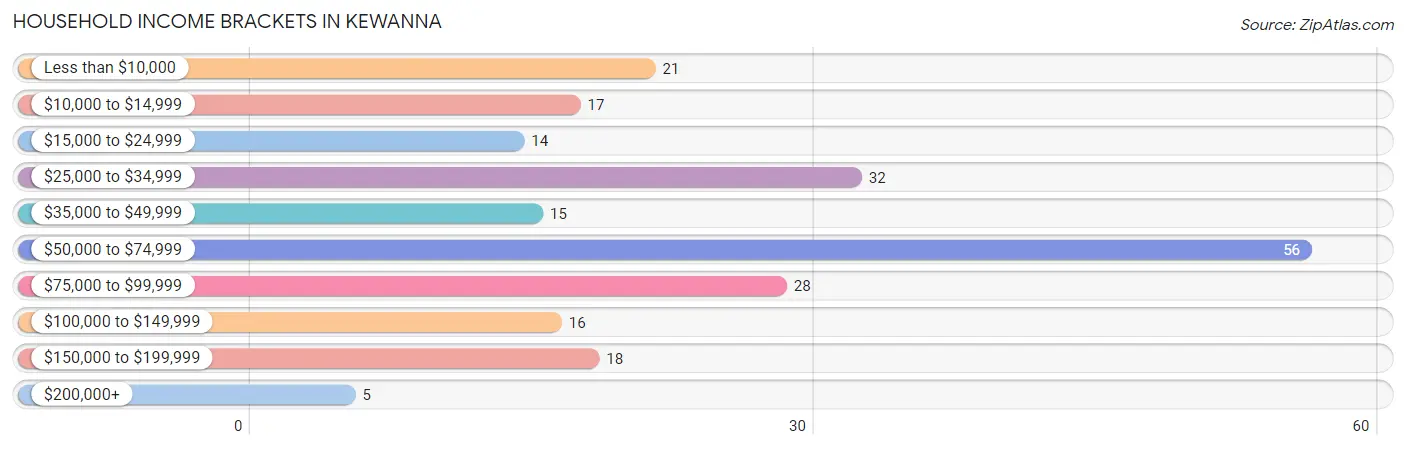
| Income Bracket | # Households | % Households |
| Less than $10,000 | 21 | 9.5% |
| $10,000 to $14,999 | 17 | 7.7% |
| $15,000 to $24,999 | 14 | 6.3% |
| $25,000 to $34,999 | 32 | 14.4% |
| $35,000 to $49,999 | 15 | 6.8% |
| $50,000 to $74,999 | 56 | 25.2% |
| $75,000 to $99,999 | 28 | 12.6% |
| $100,000 to $149,999 | 16 | 7.2% |
| $150,000 to $199,999 | 18 | 8.1% |
| $200,000+ | 5 | 2.3% |
Household Income by Householder Age in Kewanna
The median household income in Kewanna is $52,143, with the highest median household income of $70,909 found in the 25 to 44 years age bracket for the primary householder. A total of 64 households (28.8%) fall into this category. Meanwhile, the 45 to 64 years age bracket for the primary householder has the lowest median household income of $50,521, with 79 households (35.6%) in this group.
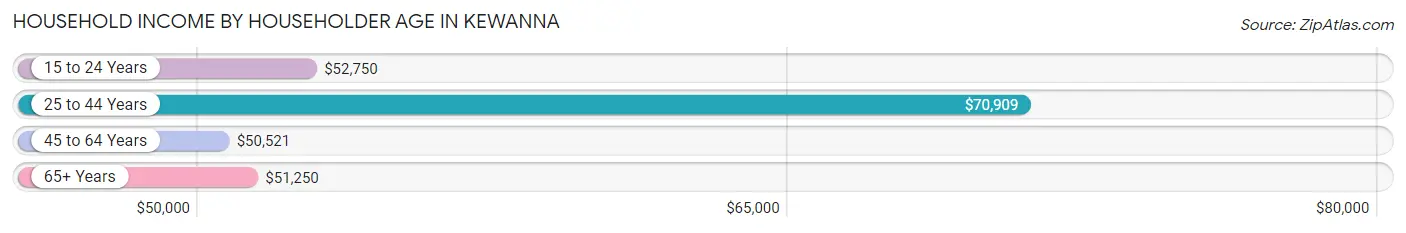
| Income Bracket | # Households | Median Income |
| 15 to 24 Years | 9 (4.1%) | $52,750 |
| 25 to 44 Years | 64 (28.8%) | $70,909 |
| 45 to 64 Years | 79 (35.6%) | $50,521 |
| 65+ Years | 70 (31.5%) | $51,250 |
| Total | 222 (100.0%) | $52,143 |
Poverty in Kewanna
Income Below Poverty by Sex and Age in Kewanna
With 28.0% poverty level for males and 23.8% for females among the residents of Kewanna, 6 to 11 year old males and 5 year old females are the most vulnerable to poverty, with 19 males (100.0%) and 2 females (100.0%) in their respective age groups living below the poverty level.
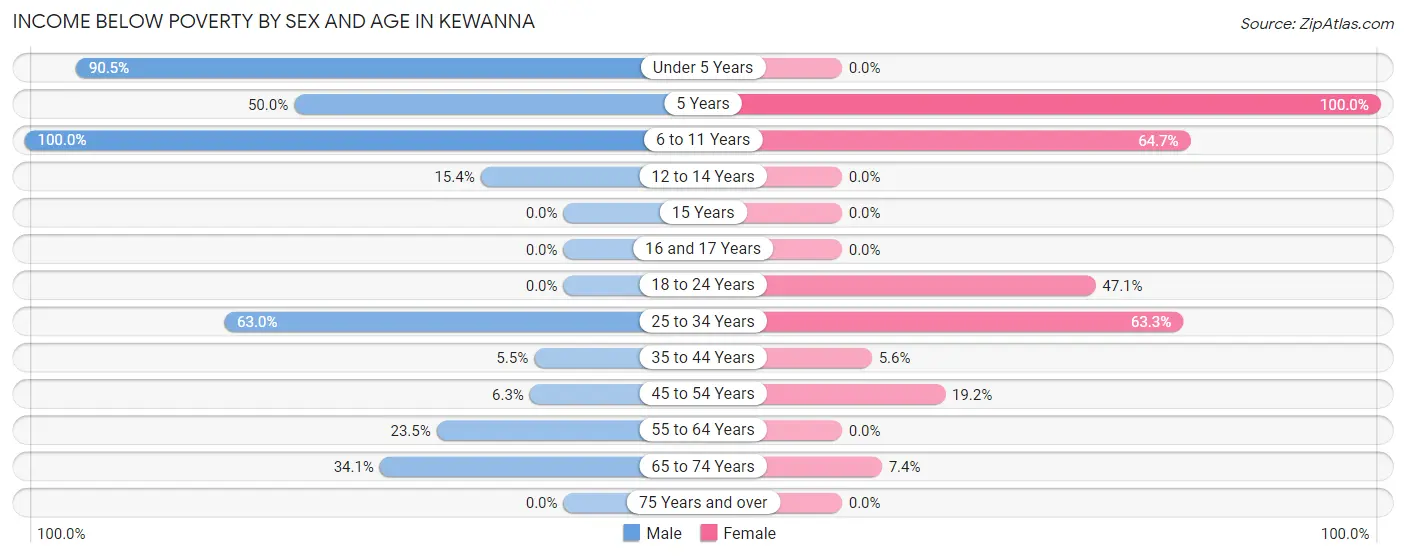
| Age Bracket | Male | Female |
| Under 5 Years | 19 (90.5%) | 0 (0.0%) |
| 5 Years | 4 (50.0%) | 2 (100.0%) |
| 6 to 11 Years | 19 (100.0%) | 22 (64.7%) |
| 12 to 14 Years | 2 (15.4%) | 0 (0.0%) |
| 15 Years | 0 (0.0%) | 0 (0.0%) |
| 16 and 17 Years | 0 (0.0%) | 0 (0.0%) |
| 18 to 24 Years | 0 (0.0%) | 8 (47.1%) |
| 25 to 34 Years | 17 (63.0%) | 19 (63.3%) |
| 35 to 44 Years | 3 (5.4%) | 2 (5.6%) |
| 45 to 54 Years | 2 (6.2%) | 9 (19.2%) |
| 55 to 64 Years | 8 (23.5%) | 0 (0.0%) |
| 65 to 74 Years | 15 (34.1%) | 2 (7.4%) |
| 75 Years and over | 0 (0.0%) | 0 (0.0%) |
| Total | 89 (28.0%) | 64 (23.8%) |
Income Above Poverty by Sex and Age in Kewanna
According to the poverty statistics in Kewanna, males aged 15 years and females aged 15 years are the age groups that are most secure financially, with 100.0% of males and 100.0% of females in these age groups living above the poverty line.
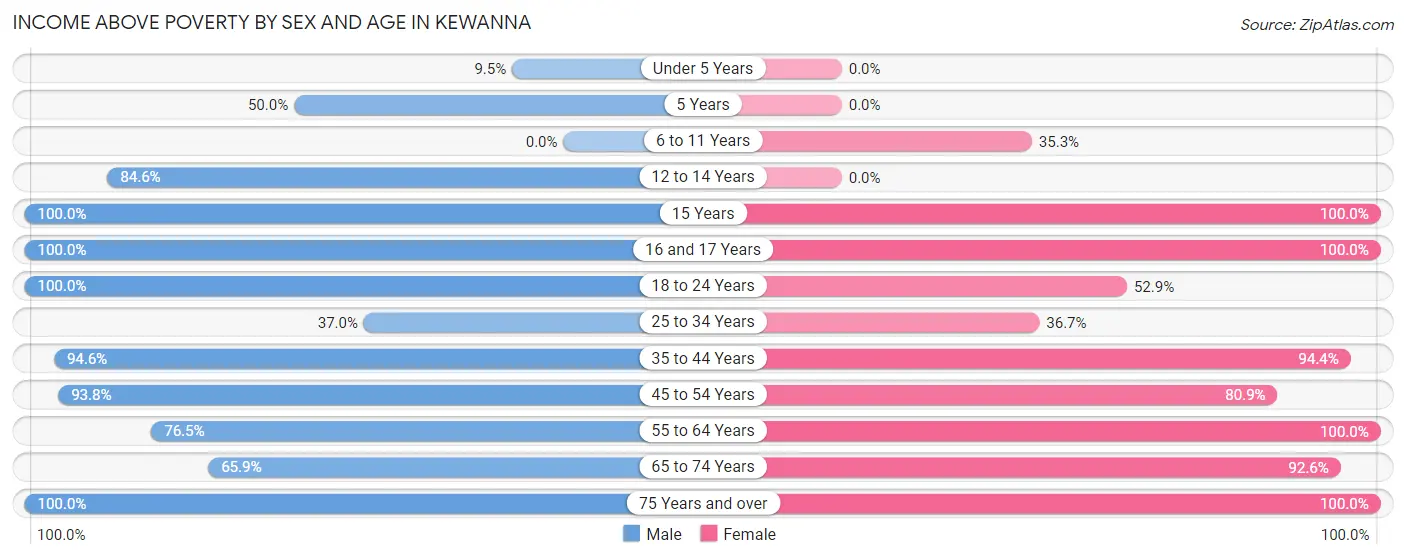
| Age Bracket | Male | Female |
| Under 5 Years | 2 (9.5%) | 0 (0.0%) |
| 5 Years | 4 (50.0%) | 0 (0.0%) |
| 6 to 11 Years | 0 (0.0%) | 12 (35.3%) |
| 12 to 14 Years | 11 (84.6%) | 0 (0.0%) |
| 15 Years | 8 (100.0%) | 3 (100.0%) |
| 16 and 17 Years | 3 (100.0%) | 25 (100.0%) |
| 18 to 24 Years | 35 (100.0%) | 9 (52.9%) |
| 25 to 34 Years | 10 (37.0%) | 11 (36.7%) |
| 35 to 44 Years | 52 (94.6%) | 34 (94.4%) |
| 45 to 54 Years | 30 (93.8%) | 38 (80.8%) |
| 55 to 64 Years | 26 (76.5%) | 29 (100.0%) |
| 65 to 74 Years | 29 (65.9%) | 25 (92.6%) |
| 75 Years and over | 19 (100.0%) | 19 (100.0%) |
| Total | 229 (72.0%) | 205 (76.2%) |
Income Below Poverty Among Married-Couple Families in Kewanna
The poverty statistics for married-couple families in Kewanna show that 14.3% or 14 of the total 98 families live below the poverty line. Families with 3 or 4 children have the highest poverty rate of 81.8%, comprising of 9 families. On the other hand, families with no children have the lowest poverty rate of 3.1%, which includes 2 families.
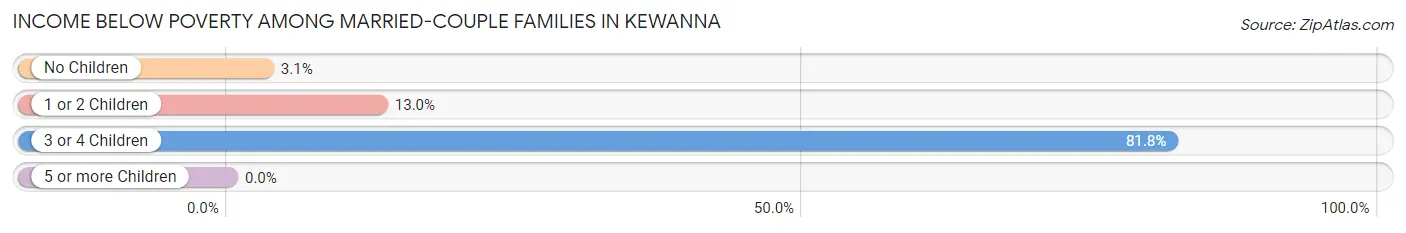
| Children | Above Poverty | Below Poverty |
| No Children | 62 (96.9%) | 2 (3.1%) |
| 1 or 2 Children | 20 (87.0%) | 3 (13.0%) |
| 3 or 4 Children | 2 (18.2%) | 9 (81.8%) |
| 5 or more Children | 0 (0.0%) | 0 (0.0%) |
| Total | 84 (85.7%) | 14 (14.3%) |
Income Below Poverty Among Single-Parent Households in Kewanna
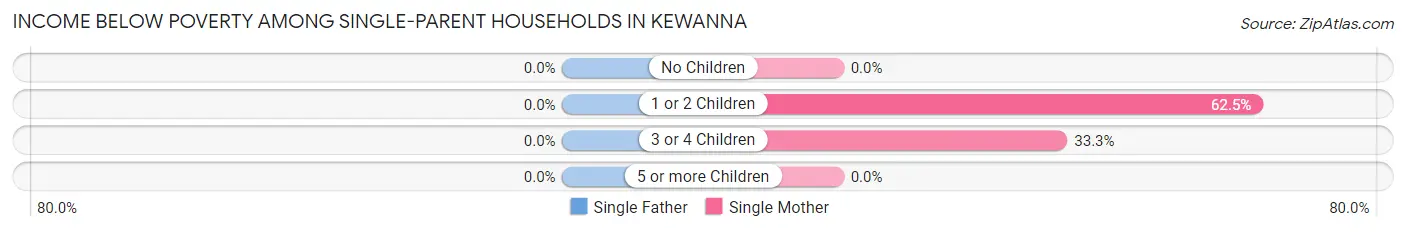
| Children | Single Father | Single Mother |
| No Children | 0 (0.0%) | 0 (0.0%) |
| 1 or 2 Children | 0 (0.0%) | 15 (62.5%) |
| 3 or 4 Children | 0 (0.0%) | 4 (33.3%) |
| 5 or more Children | 0 (0.0%) | 0 (0.0%) |
| Total | 0 (0.0%) | 19 (46.3%) |
Income Below Poverty Among Married-Couple vs Single-Parent Households in Kewanna
The poverty data for Kewanna shows that 14 of the married-couple family households (14.3%) and 19 of the single-parent households (37.2%) are living below the poverty level. Within the married-couple family households, those with 3 or 4 children have the highest poverty rate, with 9 households (81.8%) falling below the poverty line. Among the single-parent households, those with 1 or 2 children have the highest poverty rate, with 15 household (57.7%) living below poverty.
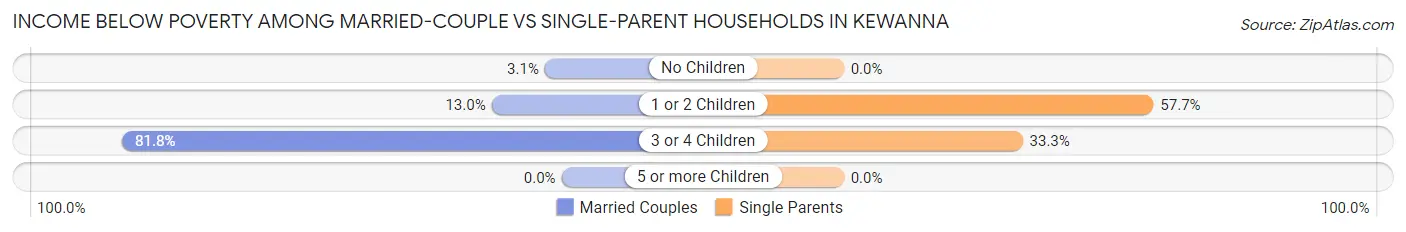
| Children | Married-Couple Families | Single-Parent Households |
| No Children | 2 (3.1%) | 0 (0.0%) |
| 1 or 2 Children | 3 (13.0%) | 15 (57.7%) |
| 3 or 4 Children | 9 (81.8%) | 4 (33.3%) |
| 5 or more Children | 0 (0.0%) | 0 (0.0%) |
| Total | 14 (14.3%) | 19 (37.2%) |
Race in Kewanna
The most populous races in Kewanna are White / Caucasian (567 | 96.6%), Two or more Races (14 | 2.4%), and Hispanic or Latino (6 | 1.0%).
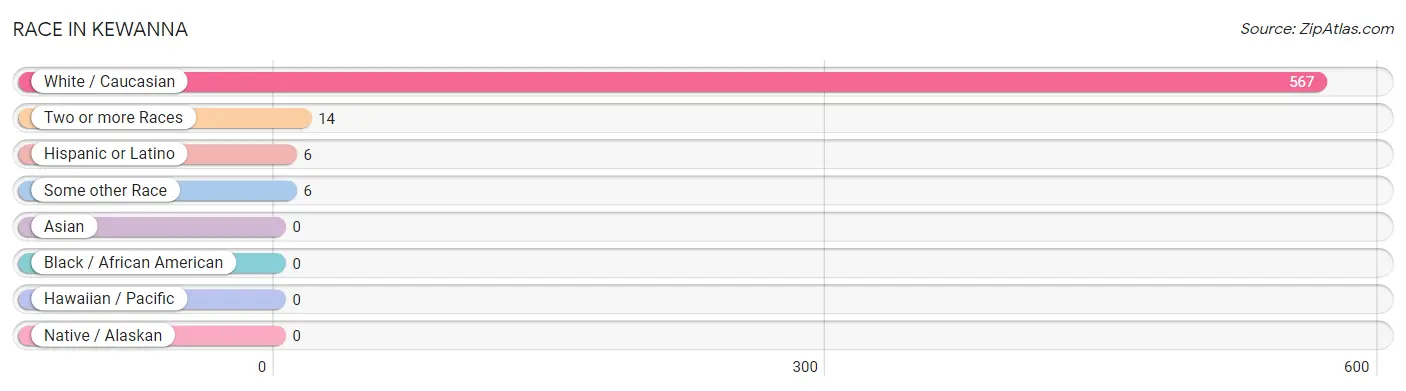
| Race | # Population | % Population |
| Asian | 0 | 0.0% |
| Black / African American | 0 | 0.0% |
| Hawaiian / Pacific | 0 | 0.0% |
| Hispanic or Latino | 6 | 1.0% |
| Native / Alaskan | 0 | 0.0% |
| White / Caucasian | 567 | 96.6% |
| Two or more Races | 14 | 2.4% |
| Some other Race | 6 | 1.0% |
| Total | 587 | 100.0% |
Ancestry in Kewanna
The most populous ancestries reported in Kewanna are German (155 | 26.4%), Irish (50 | 8.5%), Dutch (46 | 7.8%), English (46 | 7.8%), and Italian (32 | 5.4%), together accounting for 56.1% of all Kewanna residents.
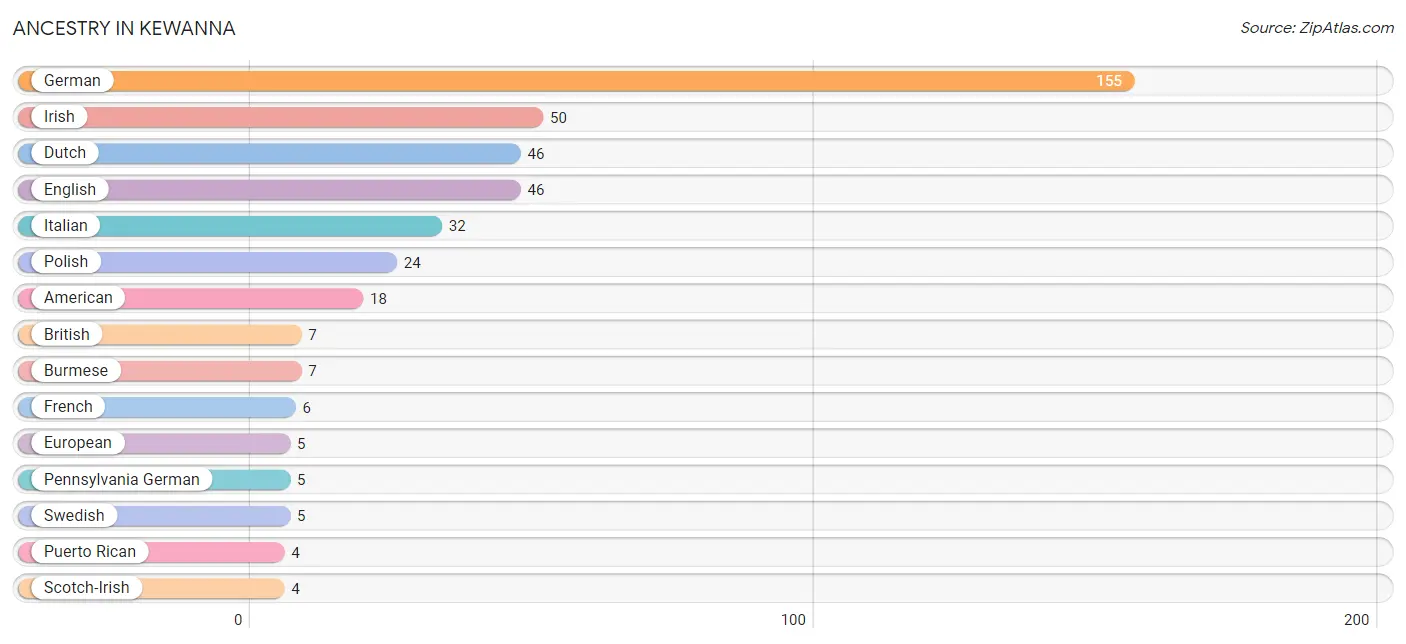
| Ancestry | # Population | % Population |
| American | 18 | 3.1% |
| Apache | 1 | 0.2% |
| Belgian | 2 | 0.3% |
| British | 7 | 1.2% |
| Burmese | 7 | 1.2% |
| Dutch | 46 | 7.8% |
| English | 46 | 7.8% |
| European | 5 | 0.9% |
| French | 6 | 1.0% |
| German | 155 | 26.4% |
| Irish | 50 | 8.5% |
| Italian | 32 | 5.4% |
| Mexican | 2 | 0.3% |
| Norwegian | 3 | 0.5% |
| Pennsylvania German | 5 | 0.9% |
| Polish | 24 | 4.1% |
| Puerto Rican | 4 | 0.7% |
| Scandinavian | 1 | 0.2% |
| Scotch-Irish | 4 | 0.7% |
| Scottish | 4 | 0.7% |
| Swedish | 5 | 0.9% | View All 21 Rows |
Immigrants in Kewanna
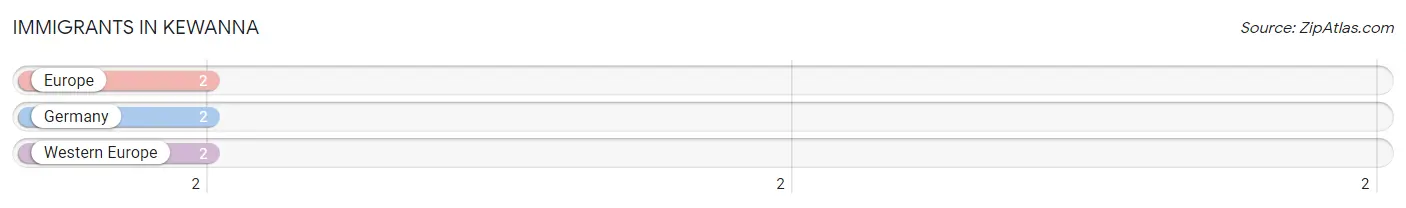
The most numerous immigrant groups reported in Kewanna came from Europe (2 | 0.3%), Germany (2 | 0.3%), and Western Europe (2 | 0.3%), together accounting for 1.0% of all Kewanna residents.
| Immigration Origin | # Population | % Population |
| Europe | 2 | 0.3% |
| Germany | 2 | 0.3% |
| Western Europe | 2 | 0.3% | View All 3 Rows |
Sex and Age in Kewanna
Sex and Age in Kewanna
The most populous age groups in Kewanna are 35 to 39 Years (29 | 9.1%) for men and 50 to 54 Years (40 | 14.9%) for women.
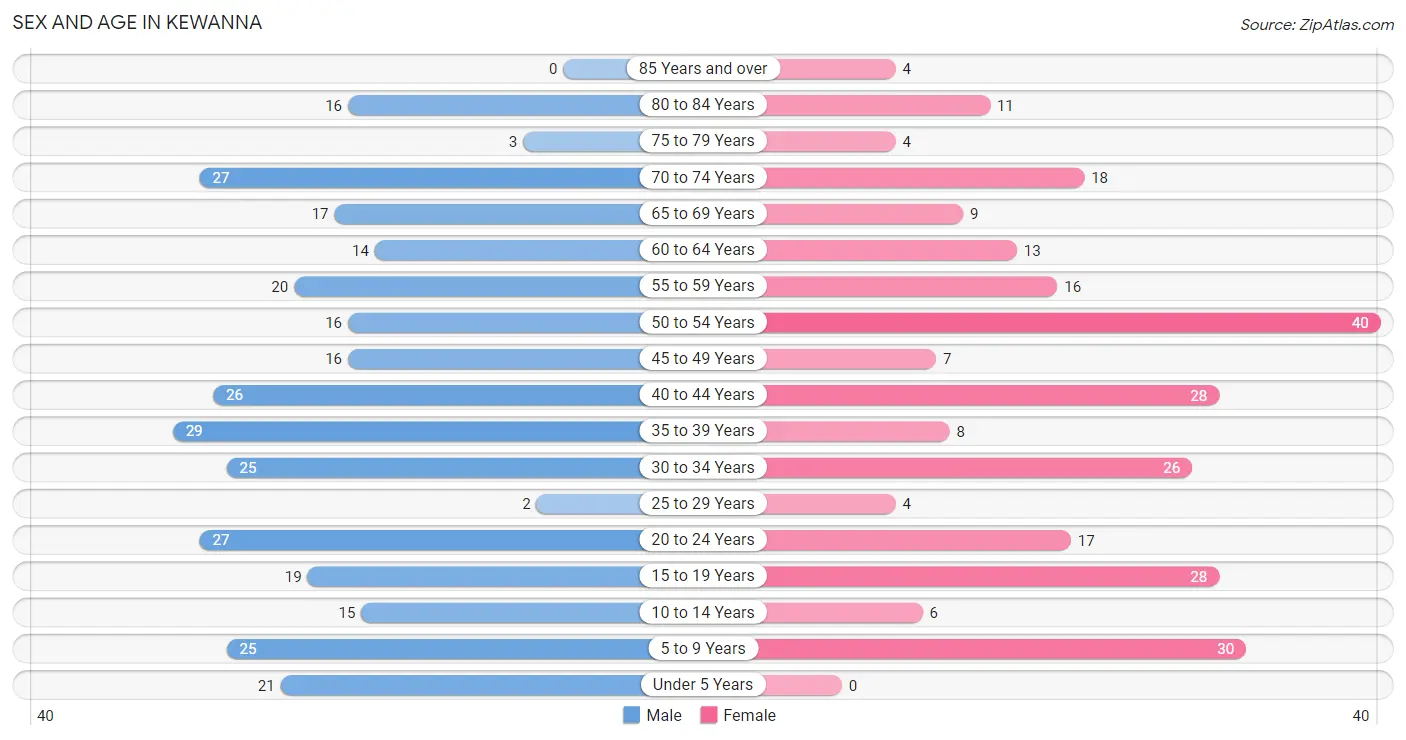
| Age Bracket | Male | Female |
| Under 5 Years | 21 (6.6%) | 0 (0.0%) |
| 5 to 9 Years | 25 (7.9%) | 30 (11.2%) |
| 10 to 14 Years | 15 (4.7%) | 6 (2.2%) |
| 15 to 19 Years | 19 (6.0%) | 28 (10.4%) |
| 20 to 24 Years | 27 (8.5%) | 17 (6.3%) |
| 25 to 29 Years | 2 (0.6%) | 4 (1.5%) |
| 30 to 34 Years | 25 (7.9%) | 26 (9.7%) |
| 35 to 39 Years | 29 (9.1%) | 8 (3.0%) |
| 40 to 44 Years | 26 (8.2%) | 28 (10.4%) |
| 45 to 49 Years | 16 (5.0%) | 7 (2.6%) |
| 50 to 54 Years | 16 (5.0%) | 40 (14.9%) |
| 55 to 59 Years | 20 (6.3%) | 16 (5.9%) |
| 60 to 64 Years | 14 (4.4%) | 13 (4.8%) |
| 65 to 69 Years | 17 (5.3%) | 9 (3.4%) |
| 70 to 74 Years | 27 (8.5%) | 18 (6.7%) |
| 75 to 79 Years | 3 (0.9%) | 4 (1.5%) |
| 80 to 84 Years | 16 (5.0%) | 11 (4.1%) |
| 85 Years and over | 0 (0.0%) | 4 (1.5%) |
| Total | 318 (100.0%) | 269 (100.0%) |
Families and Households in Kewanna
Median Family Size in Kewanna
The median family size in Kewanna is 3.05 persons per family, with married-couple families (98 | 65.8%) accounting for the largest median family size of 3.07 persons per family. On the other hand, single male/father families (10 | 6.7%) represent the smallest median family size with 3.00 persons per family.
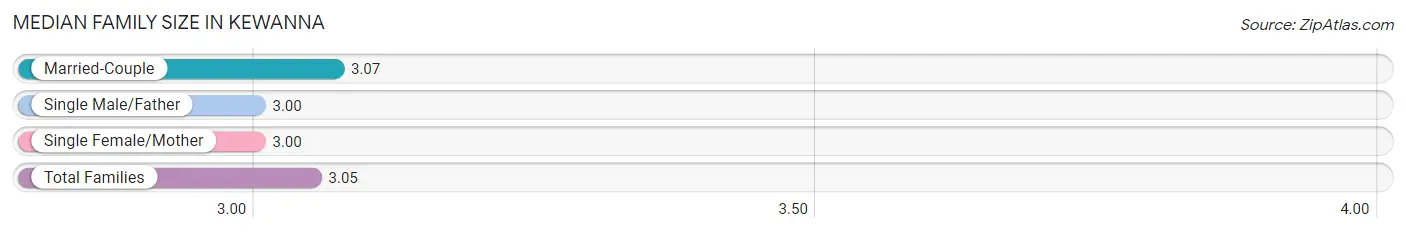
| Family Type | # Families | Family Size |
| Married-Couple | 98 (65.8%) | 3.07 |
| Single Male/Father | 10 (6.7%) | 3.00 |
| Single Female/Mother | 41 (27.5%) | 3.00 |
| Total Families | 149 (100.0%) | 3.05 |
Median Household Size in Kewanna
The median household size in Kewanna is 2.64 persons per household, with single male/father households (10 | 4.5%) accounting for the largest median household size of 3.9 persons per household. non-family households (73 | 32.9%) represent the smallest median household size with 1.34 persons per household.
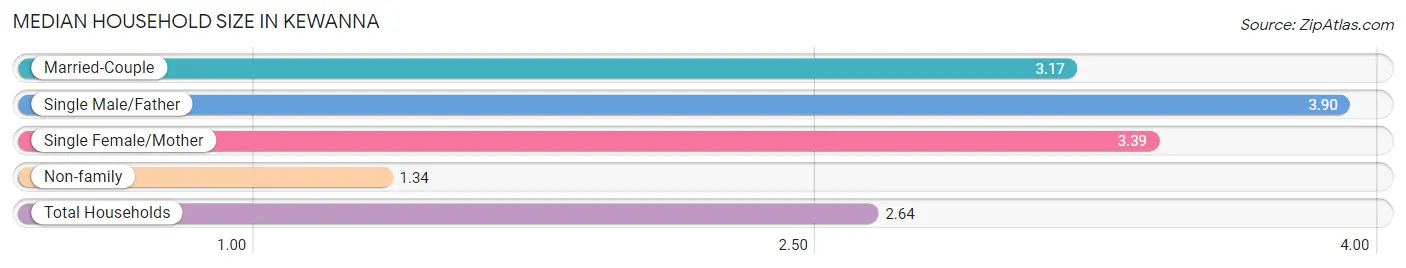
| Household Type | # Households | Household Size |
| Married-Couple | 98 (44.1%) | 3.17 |
| Single Male/Father | 10 (4.5%) | 3.90 |
| Single Female/Mother | 41 (18.5%) | 3.39 |
| Non-family | 73 (32.9%) | 1.34 |
| Total Households | 222 (100.0%) | 2.64 |
Household Size by Marriage Status in Kewanna
Out of a total of 222 households in Kewanna, 149 (67.1%) are family households, while 73 (32.9%) are nonfamily households. The most numerous type of family households are 2-person households, comprising 81, and the most common type of nonfamily households are 1-person households, comprising 57.
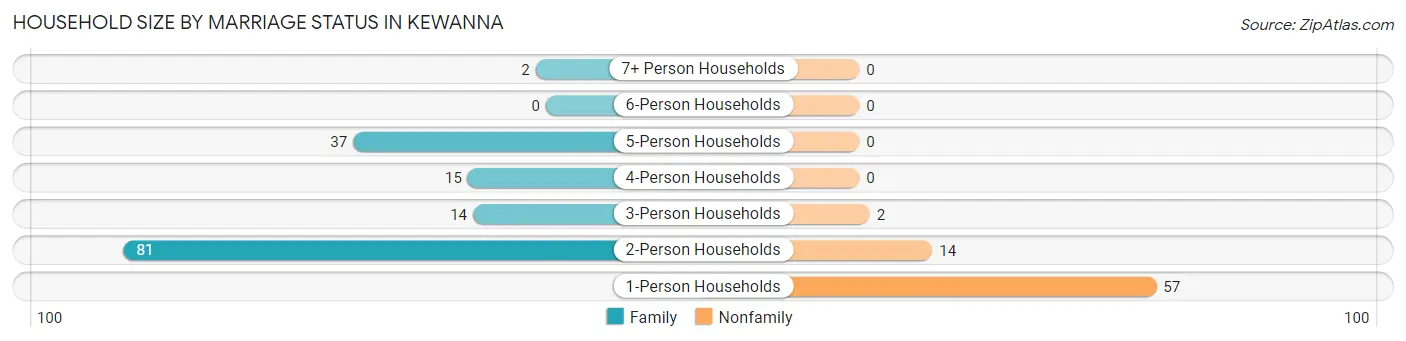
| Household Size | Family Households | Nonfamily Households |
| 1-Person Households | - | 57 (25.7%) |
| 2-Person Households | 81 (36.5%) | 14 (6.3%) |
| 3-Person Households | 14 (6.3%) | 2 (0.9%) |
| 4-Person Households | 15 (6.8%) | 0 (0.0%) |
| 5-Person Households | 37 (16.7%) | 0 (0.0%) |
| 6-Person Households | 0 (0.0%) | 0 (0.0%) |
| 7+ Person Households | 2 (0.9%) | 0 (0.0%) |
| Total | 149 (67.1%) | 73 (32.9%) |
Female Fertility in Kewanna
Fertility by Age in Kewanna
Average fertility rate in Kewanna is 33.0 births per 1,000 women. Women in the age bracket of 20 to 34 years have the highest fertility rate with 85.0 births per 1,000 women. Women in the age bracket of 20 to 34 years acount for 100.0% of all women with births.
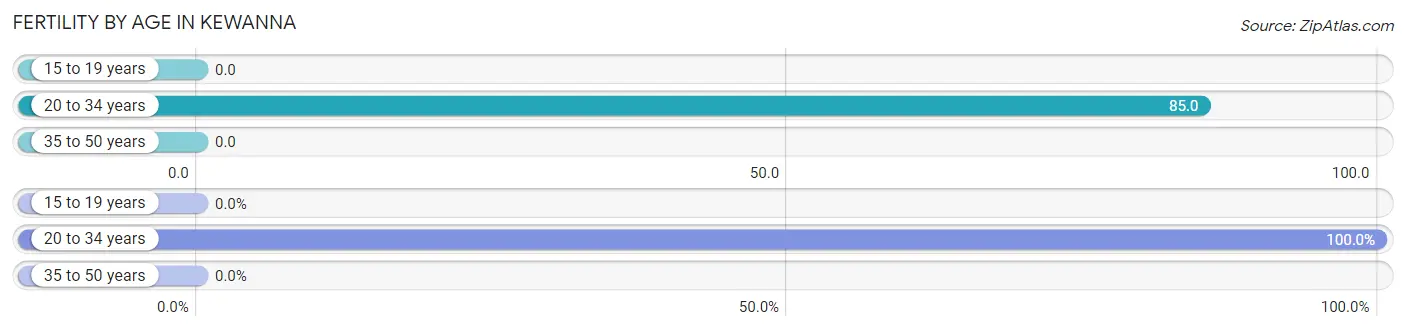
| Age Bracket | Women with Births | Births / 1,000 Women |
| 15 to 19 years | 0 (0.0%) | 0.0 |
| 20 to 34 years | 4 (100.0%) | 85.0 |
| 35 to 50 years | 0 (0.0%) | 0.0 |
| Total | 4 (100.0%) | 33.0 |
Fertility by Age by Marriage Status in Kewanna
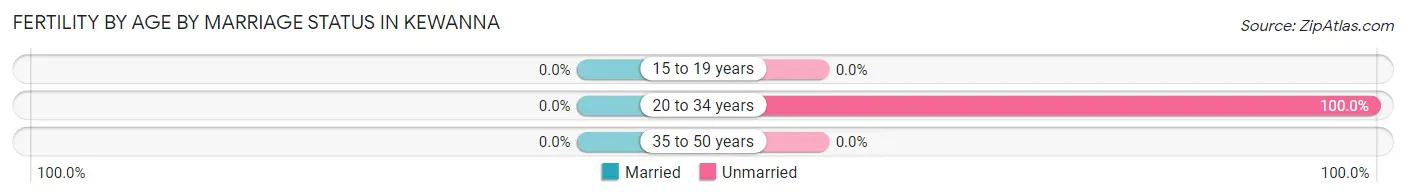
| Age Bracket | Married | Unmarried |
| 15 to 19 years | 0 (0.0%) | 0 (0.0%) |
| 20 to 34 years | 0 (0.0%) | 4 (100.0%) |
| 35 to 50 years | 0 (0.0%) | 0 (0.0%) |
| Total | 0 (0.0%) | 4 (100.0%) |
Fertility by Education in Kewanna
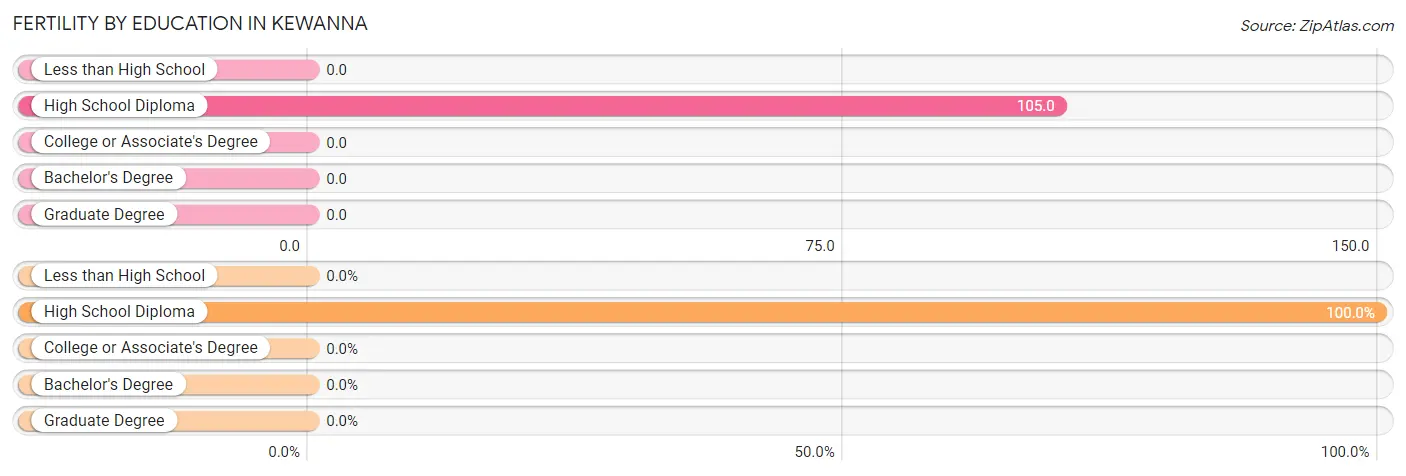
| Educational Attainment | Women with Births | Births / 1,000 Women |
| Less than High School | 0 (0.0%) | 0.0 |
| High School Diploma | 4 (100.0%) | 105.0 |
| College or Associate's Degree | 0 (0.0%) | 0.0 |
| Bachelor's Degree | 0 (0.0%) | 0.0 |
| Graduate Degree | 0 (0.0%) | 0.0 |
| Total | 4 (100.0%) | 33.0 |
Fertility by Education by Marriage Status in Kewanna
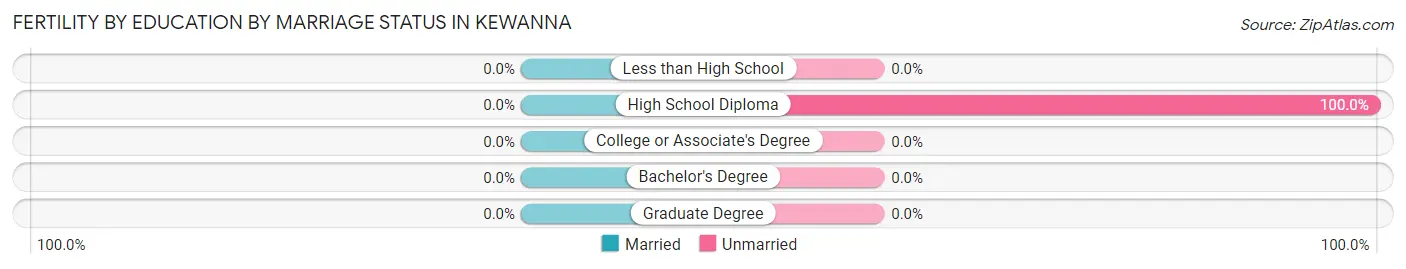
| Educational Attainment | Married | Unmarried |
| Less than High School | 0 (0.0%) | 0 (0.0%) |
| High School Diploma | 0 (0.0%) | 4 (100.0%) |
| College or Associate's Degree | 0 (0.0%) | 0 (0.0%) |
| Bachelor's Degree | 0 (0.0%) | 0 (0.0%) |
| Graduate Degree | 0 (0.0%) | 0 (0.0%) |
| Total | 0 (0.0%) | 4 (100.0%) |
Employment Characteristics in Kewanna
Employment by Class of Employer in Kewanna
Among the 279 employed individuals in Kewanna, private company employees (220 | 78.8%), not-for-profit organizations (21 | 7.5%), and self-employed (incorporated) (12 | 4.3%) make up the most common classes of employment.
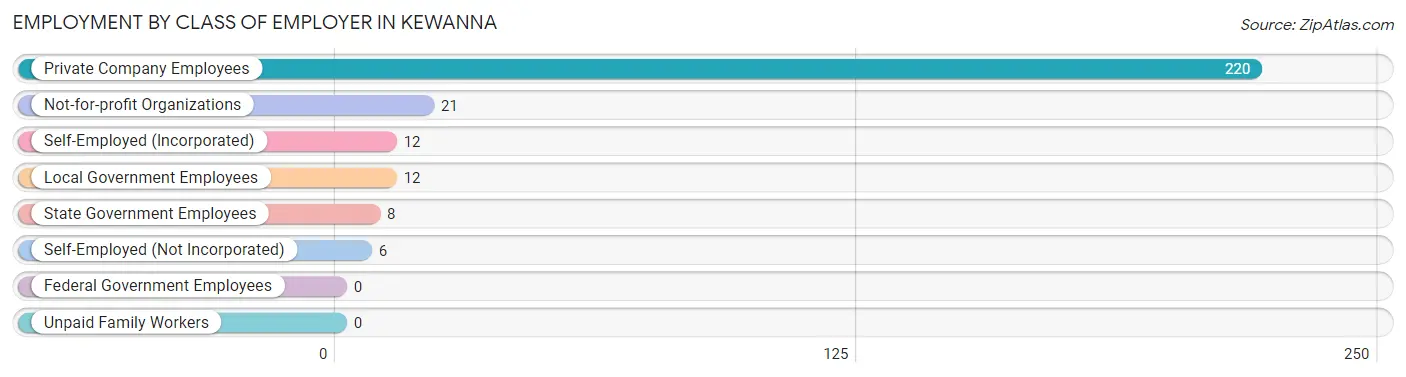
| Employer Class | # Employees | % Employees |
| Private Company Employees | 220 | 78.8% |
| Self-Employed (Incorporated) | 12 | 4.3% |
| Self-Employed (Not Incorporated) | 6 | 2.1% |
| Not-for-profit Organizations | 21 | 7.5% |
| Local Government Employees | 12 | 4.3% |
| State Government Employees | 8 | 2.9% |
| Federal Government Employees | 0 | 0.0% |
| Unpaid Family Workers | 0 | 0.0% |
| Total | 279 | 100.0% |
Employment Status by Age in Kewanna
According to the labor force statistics for Kewanna, out of the total population over 16 years of age (479), 62.8% or 301 individuals are in the labor force, with 5.0% or 15 of them unemployed. The age group with the highest labor force participation rate is 20 to 24 years, with 90.9% or 40 individuals in the labor force. Within the labor force, the 30 to 34 years age range has the highest percentage of unemployed individuals, with 21.1% or 8 of them being unemployed.
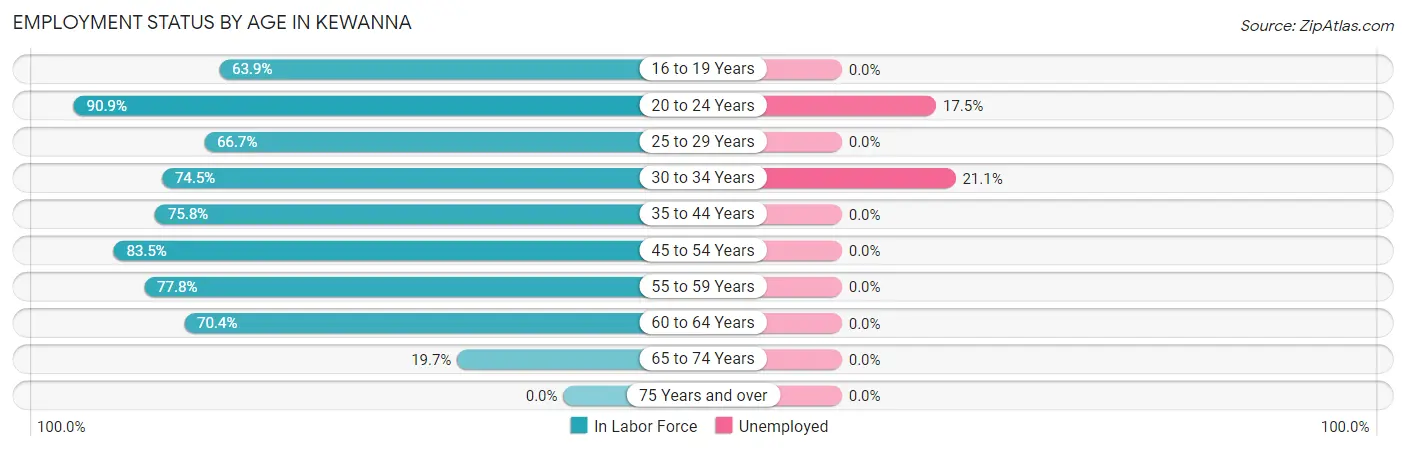
| Age Bracket | In Labor Force | Unemployed |
| 16 to 19 Years | 23 (63.9%) | 0 (0.0%) |
| 20 to 24 Years | 40 (90.9%) | 7 (17.5%) |
| 25 to 29 Years | 4 (66.7%) | 0 (0.0%) |
| 30 to 34 Years | 38 (74.5%) | 8 (21.1%) |
| 35 to 44 Years | 69 (75.8%) | 0 (0.0%) |
| 45 to 54 Years | 66 (83.5%) | 0 (0.0%) |
| 55 to 59 Years | 28 (77.8%) | 0 (0.0%) |
| 60 to 64 Years | 19 (70.4%) | 0 (0.0%) |
| 65 to 74 Years | 14 (19.7%) | 0 (0.0%) |
| 75 Years and over | 0 (0.0%) | 0 (0.0%) |
| Total | 301 (62.8%) | 15 (5.0%) |
Employment Status by Educational Attainment in Kewanna
According to labor force statistics for Kewanna, 77.2% of individuals (224) out of the total population between 25 and 64 years of age (290) are in the labor force, with 3.6% or 8 of them being unemployed. The group with the highest labor force participation rate are those with the educational attainment of bachelor's degree or higher, with 86.4% or 38 individuals in the labor force. Within the labor force, individuals with less than high school education have the highest percentage of unemployment, with 36.8% or 7 of them being unemployed.
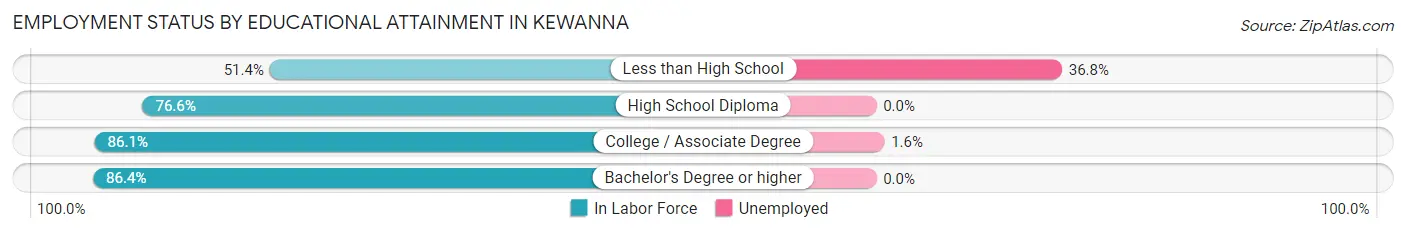
| Educational Attainment | In Labor Force | Unemployed |
| Less than High School | 19 (51.4%) | 14 (36.8%) |
| High School Diploma | 105 (76.6%) | 0 (0.0%) |
| College / Associate Degree | 62 (86.1%) | 1 (1.6%) |
| Bachelor's Degree or higher | 38 (86.4%) | 0 (0.0%) |
| Total | 224 (77.2%) | 10 (3.6%) |
Employment Occupations by Sex in Kewanna
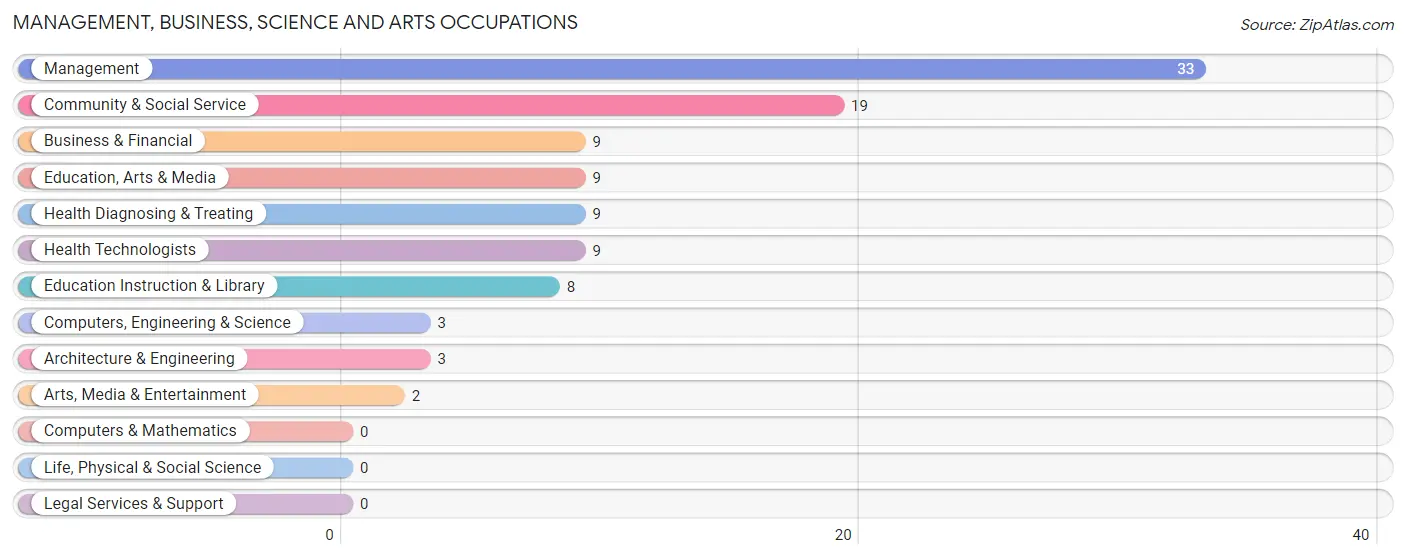
Management, Business, Science and Arts Occupations
The most common Management, Business, Science and Arts occupations in Kewanna are Management (33 | 11.5%), Community & Social Service (19 | 6.6%), Business & Financial (9 | 3.2%), Education, Arts & Media (9 | 3.2%), and Health Diagnosing & Treating (9 | 3.2%).
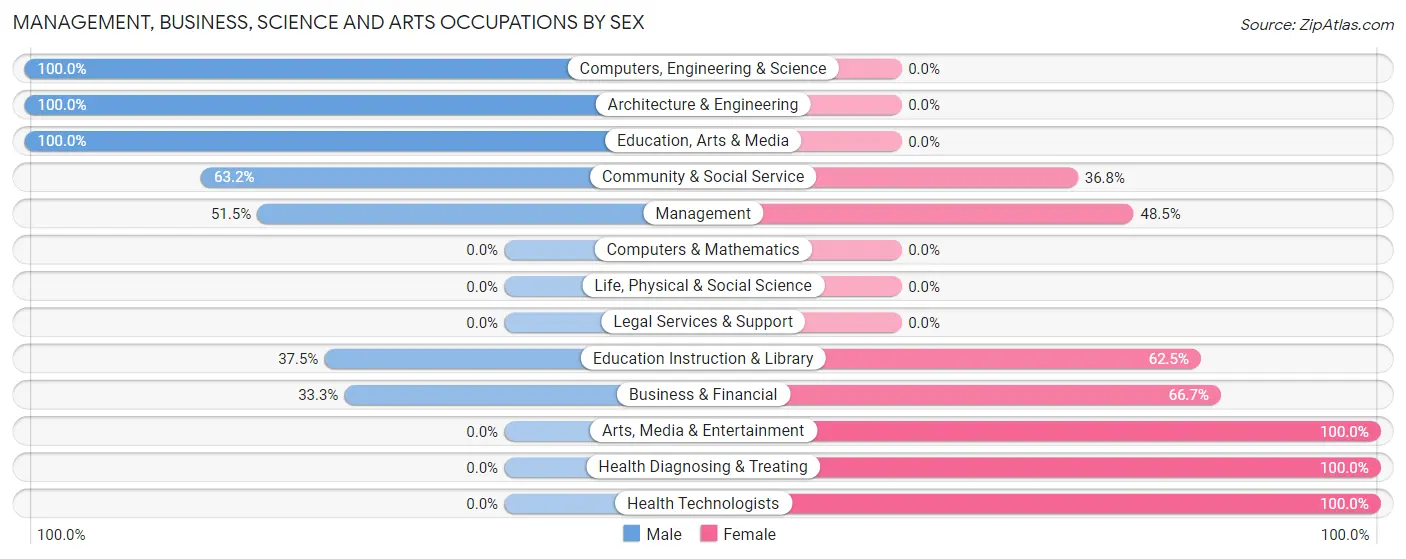
Management, Business, Science and Arts Occupations by Sex
Within the Management, Business, Science and Arts occupations in Kewanna, the most male-oriented occupations are Computers, Engineering & Science (100.0%), Architecture & Engineering (100.0%), and Education, Arts & Media (100.0%), while the most female-oriented occupations are Arts, Media & Entertainment (100.0%), Health Diagnosing & Treating (100.0%), and Health Technologists (100.0%).
| Occupation | Male | Female |
| Management | 17 (51.5%) | 16 (48.5%) |
| Business & Financial | 3 (33.3%) | 6 (66.7%) |
| Computers, Engineering & Science | 3 (100.0%) | 0 (0.0%) |
| Computers & Mathematics | 0 (0.0%) | 0 (0.0%) |
| Architecture & Engineering | 3 (100.0%) | 0 (0.0%) |
| Life, Physical & Social Science | 0 (0.0%) | 0 (0.0%) |
| Community & Social Service | 12 (63.2%) | 7 (36.8%) |
| Education, Arts & Media | 9 (100.0%) | 0 (0.0%) |
| Legal Services & Support | 0 (0.0%) | 0 (0.0%) |
| Education Instruction & Library | 3 (37.5%) | 5 (62.5%) |
| Arts, Media & Entertainment | 0 (0.0%) | 2 (100.0%) |
| Health Diagnosing & Treating | 0 (0.0%) | 9 (100.0%) |
| Health Technologists | 0 (0.0%) | 9 (100.0%) |
| Total (Category) | 35 (47.9%) | 38 (52.0%) |
| Total (Overall) | 171 (59.8%) | 115 (40.2%) |
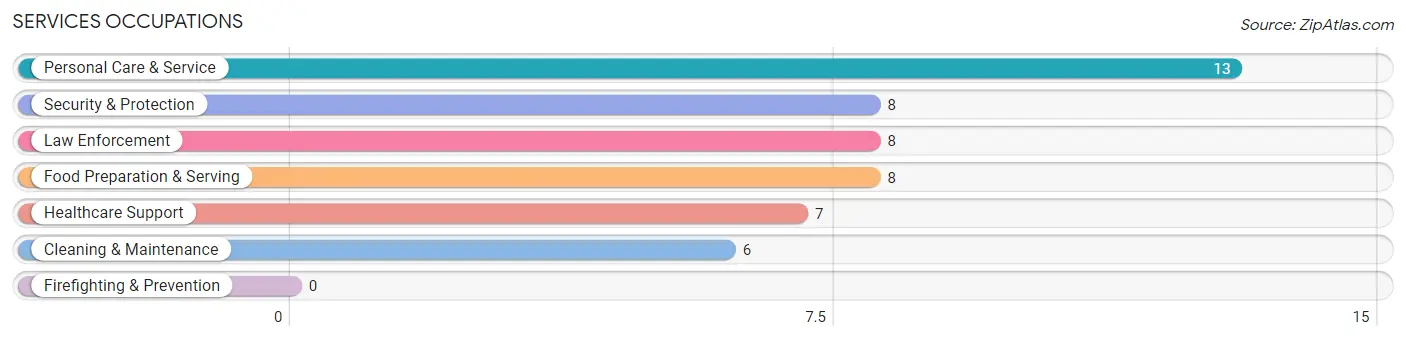
Services Occupations
The most common Services occupations in Kewanna are Personal Care & Service (13 | 4.5%), Security & Protection (8 | 2.8%), Law Enforcement (8 | 2.8%), Food Preparation & Serving (8 | 2.8%), and Healthcare Support (7 | 2.5%).
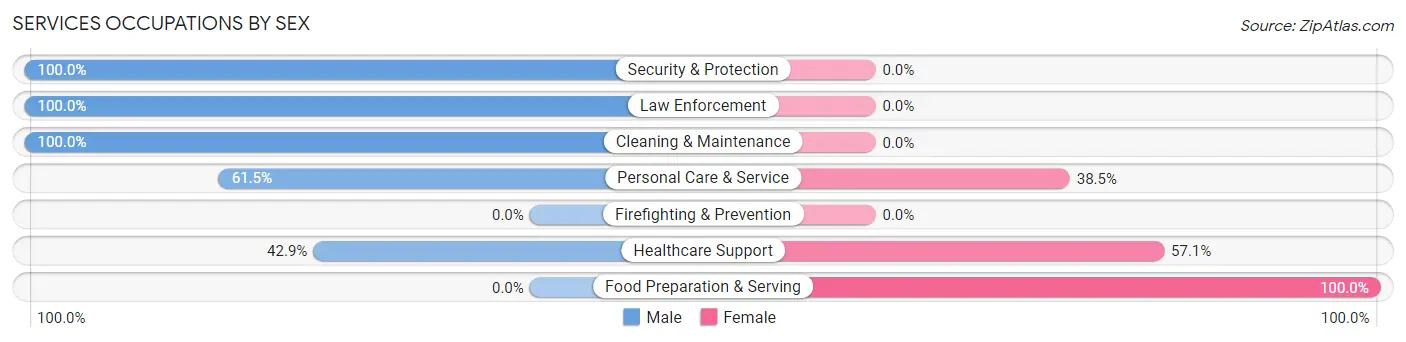
Services Occupations by Sex
Within the Services occupations in Kewanna, the most male-oriented occupations are Security & Protection (100.0%), Law Enforcement (100.0%), and Cleaning & Maintenance (100.0%), while the most female-oriented occupations are Food Preparation & Serving (100.0%), Healthcare Support (57.1%), and Personal Care & Service (38.5%).
| Occupation | Male | Female |
| Healthcare Support | 3 (42.9%) | 4 (57.1%) |
| Security & Protection | 8 (100.0%) | 0 (0.0%) |
| Firefighting & Prevention | 0 (0.0%) | 0 (0.0%) |
| Law Enforcement | 8 (100.0%) | 0 (0.0%) |
| Food Preparation & Serving | 0 (0.0%) | 8 (100.0%) |
| Cleaning & Maintenance | 6 (100.0%) | 0 (0.0%) |
| Personal Care & Service | 8 (61.5%) | 5 (38.5%) |
| Total (Category) | 25 (59.5%) | 17 (40.5%) |
| Total (Overall) | 171 (59.8%) | 115 (40.2%) |
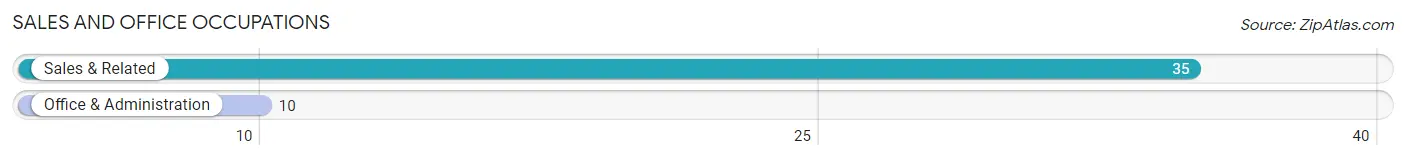
Sales and Office Occupations
The most common Sales and Office occupations in Kewanna are Sales & Related (35 | 12.2%), and Office & Administration (10 | 3.5%).
Sales and Office Occupations by Sex
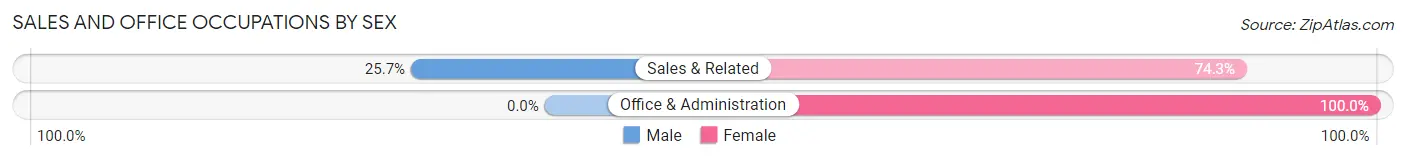
| Occupation | Male | Female |
| Sales & Related | 9 (25.7%) | 26 (74.3%) |
| Office & Administration | 0 (0.0%) | 10 (100.0%) |
| Total (Category) | 9 (20.0%) | 36 (80.0%) |
| Total (Overall) | 171 (59.8%) | 115 (40.2%) |
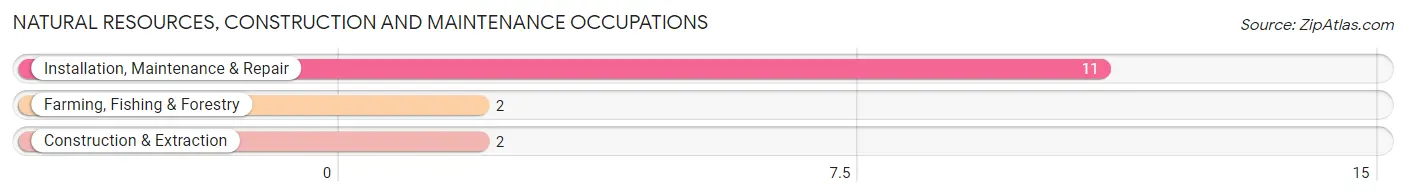
Natural Resources, Construction and Maintenance Occupations
The most common Natural Resources, Construction and Maintenance occupations in Kewanna are Installation, Maintenance & Repair (11 | 3.8%), Farming, Fishing & Forestry (2 | 0.7%), and Construction & Extraction (2 | 0.7%).
Natural Resources, Construction and Maintenance Occupations by Sex
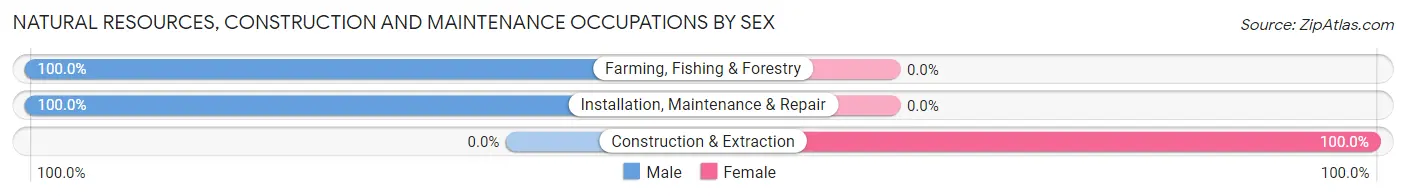
| Occupation | Male | Female |
| Farming, Fishing & Forestry | 2 (100.0%) | 0 (0.0%) |
| Construction & Extraction | 0 (0.0%) | 2 (100.0%) |
| Installation, Maintenance & Repair | 11 (100.0%) | 0 (0.0%) |
| Total (Category) | 13 (86.7%) | 2 (13.3%) |
| Total (Overall) | 171 (59.8%) | 115 (40.2%) |
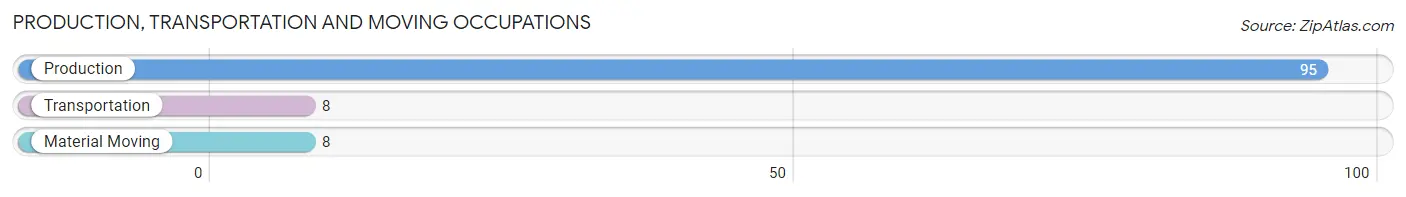
Production, Transportation and Moving Occupations
The most common Production, Transportation and Moving occupations in Kewanna are Production (95 | 33.2%), Transportation (8 | 2.8%), and Material Moving (8 | 2.8%).
Production, Transportation and Moving Occupations by Sex
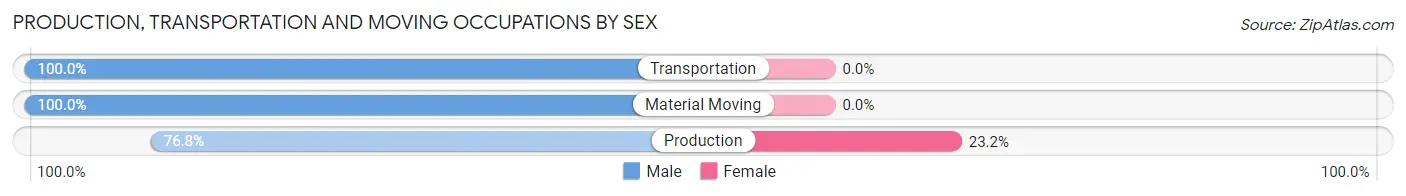
| Occupation | Male | Female |
| Production | 73 (76.8%) | 22 (23.2%) |
| Transportation | 8 (100.0%) | 0 (0.0%) |
| Material Moving | 8 (100.0%) | 0 (0.0%) |
| Total (Category) | 89 (80.2%) | 22 (19.8%) |
| Total (Overall) | 171 (59.8%) | 115 (40.2%) |
Employment Industries by Sex in Kewanna
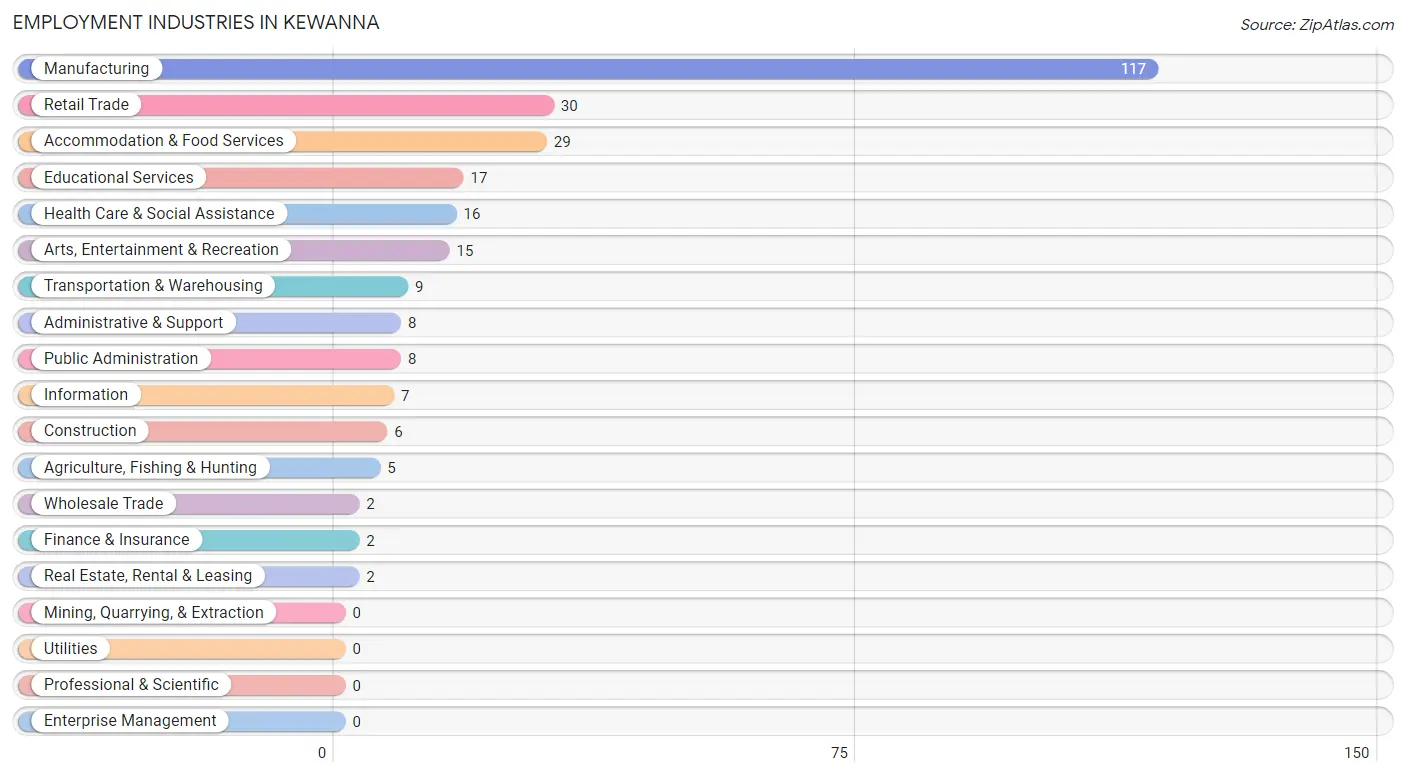
Employment Industries in Kewanna
The major employment industries in Kewanna include Manufacturing (117 | 40.9%), Retail Trade (30 | 10.5%), Accommodation & Food Services (29 | 10.1%), Educational Services (17 | 5.9%), and Health Care & Social Assistance (16 | 5.6%).
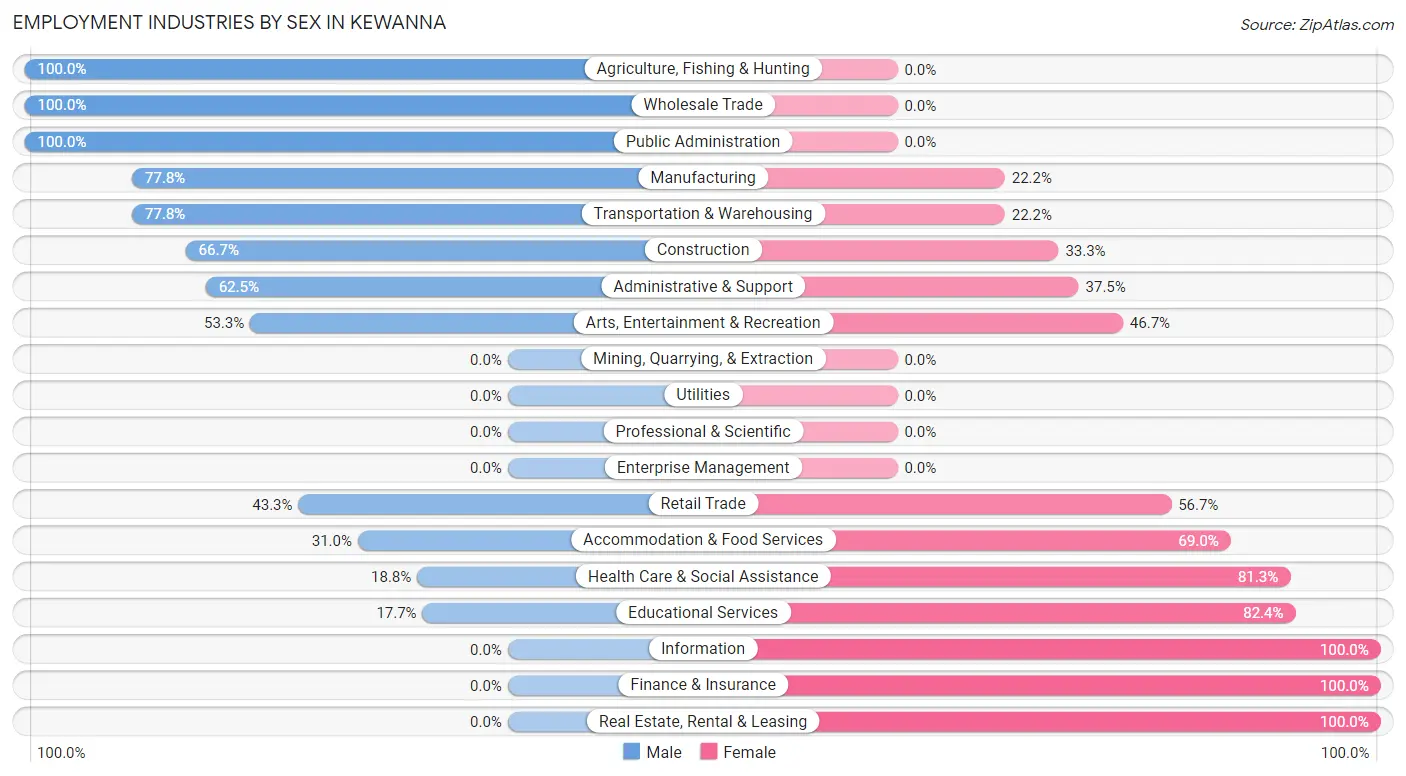
Employment Industries by Sex in Kewanna
The Kewanna industries that see more men than women are Agriculture, Fishing & Hunting (100.0%), Wholesale Trade (100.0%), and Public Administration (100.0%), whereas the industries that tend to have a higher number of women are Information (100.0%), Finance & Insurance (100.0%), and Real Estate, Rental & Leasing (100.0%).
| Industry | Male | Female |
| Agriculture, Fishing & Hunting | 5 (100.0%) | 0 (0.0%) |
| Mining, Quarrying, & Extraction | 0 (0.0%) | 0 (0.0%) |
| Construction | 4 (66.7%) | 2 (33.3%) |
| Manufacturing | 91 (77.8%) | 26 (22.2%) |
| Wholesale Trade | 2 (100.0%) | 0 (0.0%) |
| Retail Trade | 13 (43.3%) | 17 (56.7%) |
| Transportation & Warehousing | 7 (77.8%) | 2 (22.2%) |
| Utilities | 0 (0.0%) | 0 (0.0%) |
| Information | 0 (0.0%) | 7 (100.0%) |
| Finance & Insurance | 0 (0.0%) | 2 (100.0%) |
| Real Estate, Rental & Leasing | 0 (0.0%) | 2 (100.0%) |
| Professional & Scientific | 0 (0.0%) | 0 (0.0%) |
| Enterprise Management | 0 (0.0%) | 0 (0.0%) |
| Administrative & Support | 5 (62.5%) | 3 (37.5%) |
| Educational Services | 3 (17.6%) | 14 (82.4%) |
| Health Care & Social Assistance | 3 (18.8%) | 13 (81.2%) |
| Arts, Entertainment & Recreation | 8 (53.3%) | 7 (46.7%) |
| Accommodation & Food Services | 9 (31.0%) | 20 (69.0%) |
| Public Administration | 8 (100.0%) | 0 (0.0%) |
| Total | 171 (59.8%) | 115 (40.2%) |
Education in Kewanna
School Enrollment in Kewanna
The most common levels of schooling among the 117 students in Kewanna are elementary school (39 | 33.3%), high school (28 | 23.9%), and middle school (20 | 17.1%).
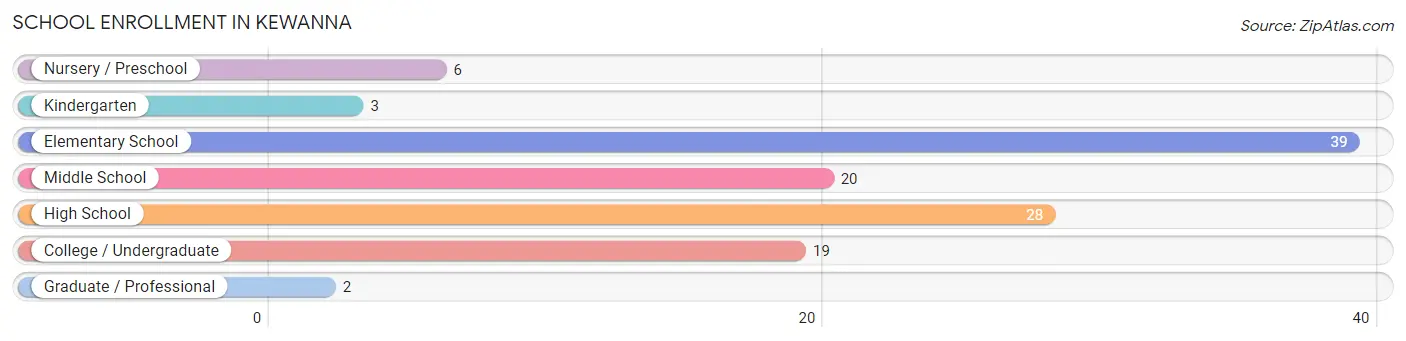
| School Level | # Students | % Students |
| Nursery / Preschool | 6 | 5.1% |
| Kindergarten | 3 | 2.6% |
| Elementary School | 39 | 33.3% |
| Middle School | 20 | 17.1% |
| High School | 28 | 23.9% |
| College / Undergraduate | 19 | 16.2% |
| Graduate / Professional | 2 | 1.7% |
| Total | 117 | 100.0% |
School Enrollment by Age by Funding Source in Kewanna
Out of a total of 117 students who are enrolled in schools in Kewanna, 3 (2.6%) attend a private institution, while the remaining 114 (97.4%) are enrolled in public schools. The age group of 35 years and over has the highest likelihood of being enrolled in private schools, with 3 (33.3% in the age bracket) enrolled. Conversely, the age group of 5 to 9 year old has the lowest likelihood of being enrolled in a private school, with 48 (100.0% in the age bracket) attending a public institution.
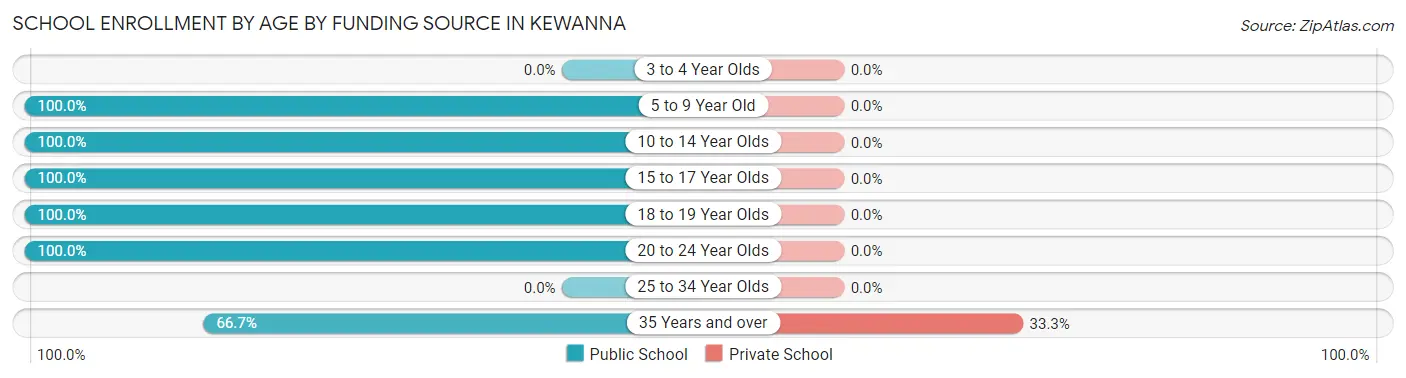
| Age Bracket | Public School | Private School |
| 3 to 4 Year Olds | 0 (0.0%) | 0 (0.0%) |
| 5 to 9 Year Old | 48 (100.0%) | 0 (0.0%) |
| 10 to 14 Year Olds | 13 (100.0%) | 0 (0.0%) |
| 15 to 17 Year Olds | 31 (100.0%) | 0 (0.0%) |
| 18 to 19 Year Olds | 8 (100.0%) | 0 (0.0%) |
| 20 to 24 Year Olds | 8 (100.0%) | 0 (0.0%) |
| 25 to 34 Year Olds | 0 (0.0%) | 0 (0.0%) |
| 35 Years and over | 6 (66.7%) | 3 (33.3%) |
| Total | 114 (97.4%) | 3 (2.6%) |
Educational Attainment by Field of Study in Kewanna
Education (24 | 38.1%), social sciences (13 | 20.6%), engineering (8 | 12.7%), business (7 | 11.1%), and visual & performing arts (4 | 6.4%) are the most common fields of study among 63 individuals in Kewanna who have obtained a bachelor's degree or higher.
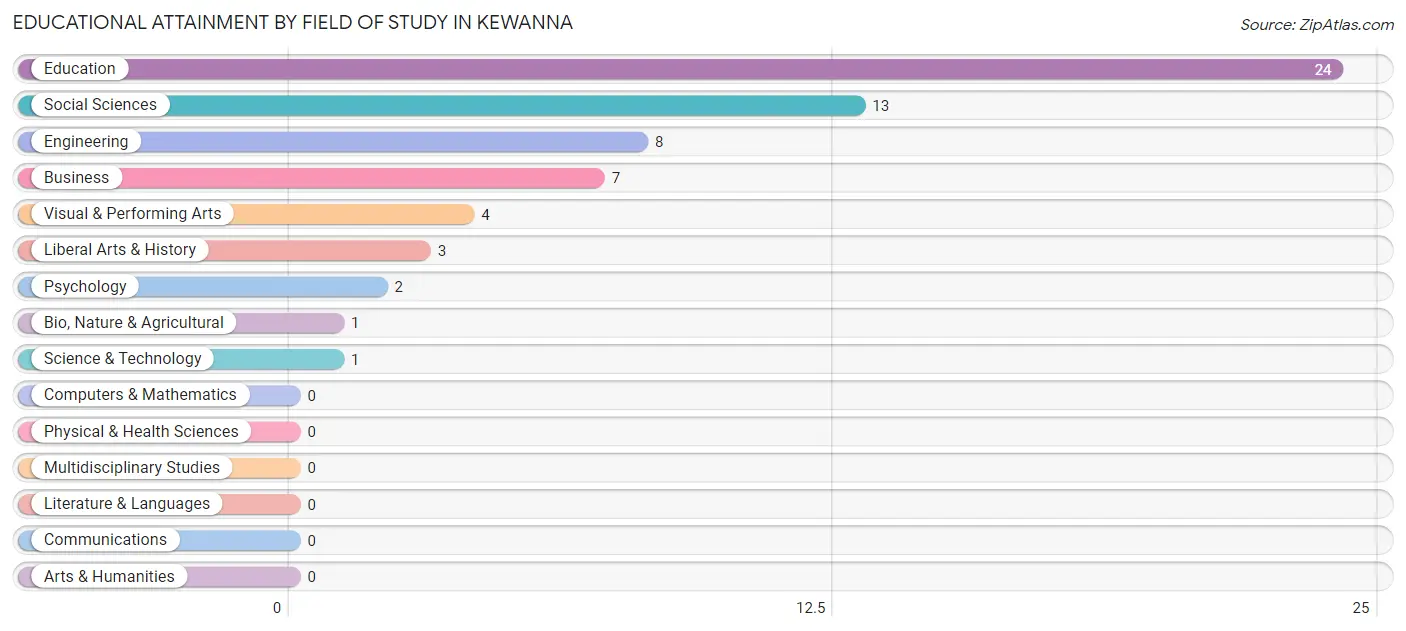
| Field of Study | # Graduates | % Graduates |
| Computers & Mathematics | 0 | 0.0% |
| Bio, Nature & Agricultural | 1 | 1.6% |
| Physical & Health Sciences | 0 | 0.0% |
| Psychology | 2 | 3.2% |
| Social Sciences | 13 | 20.6% |
| Engineering | 8 | 12.7% |
| Multidisciplinary Studies | 0 | 0.0% |
| Science & Technology | 1 | 1.6% |
| Business | 7 | 11.1% |
| Education | 24 | 38.1% |
| Literature & Languages | 0 | 0.0% |
| Liberal Arts & History | 3 | 4.8% |
| Visual & Performing Arts | 4 | 6.4% |
| Communications | 0 | 0.0% |
| Arts & Humanities | 0 | 0.0% |
| Total | 63 | 100.0% |
Transportation & Commute in Kewanna
Vehicle Availability by Sex in Kewanna
The most prevalent vehicle ownership categories in Kewanna are males with 2 vehicles (78, accounting for 47.6%) and females with 2 vehicles (54, making up 67.8%).
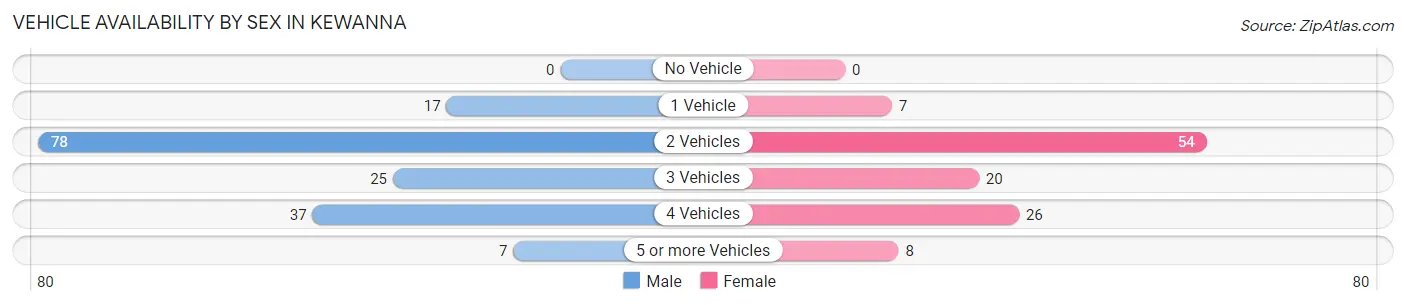
| Vehicles Available | Male | Female |
| No Vehicle | 0 (0.0%) | 0 (0.0%) |
| 1 Vehicle | 17 (10.4%) | 7 (6.1%) |
| 2 Vehicles | 78 (47.6%) | 54 (47.0%) |
| 3 Vehicles | 25 (15.2%) | 20 (17.4%) |
| 4 Vehicles | 37 (22.6%) | 26 (22.6%) |
| 5 or more Vehicles | 7 (4.3%) | 8 (7.0%) |
| Total | 164 (100.0%) | 115 (100.0%) |
Commute Time in Kewanna
The most frequently occuring commute durations in Kewanna are 15 to 19 minutes (62 commuters, 22.5%), 20 to 24 minutes (49 commuters, 17.7%), and less than 5 minutes (37 commuters, 13.4%).
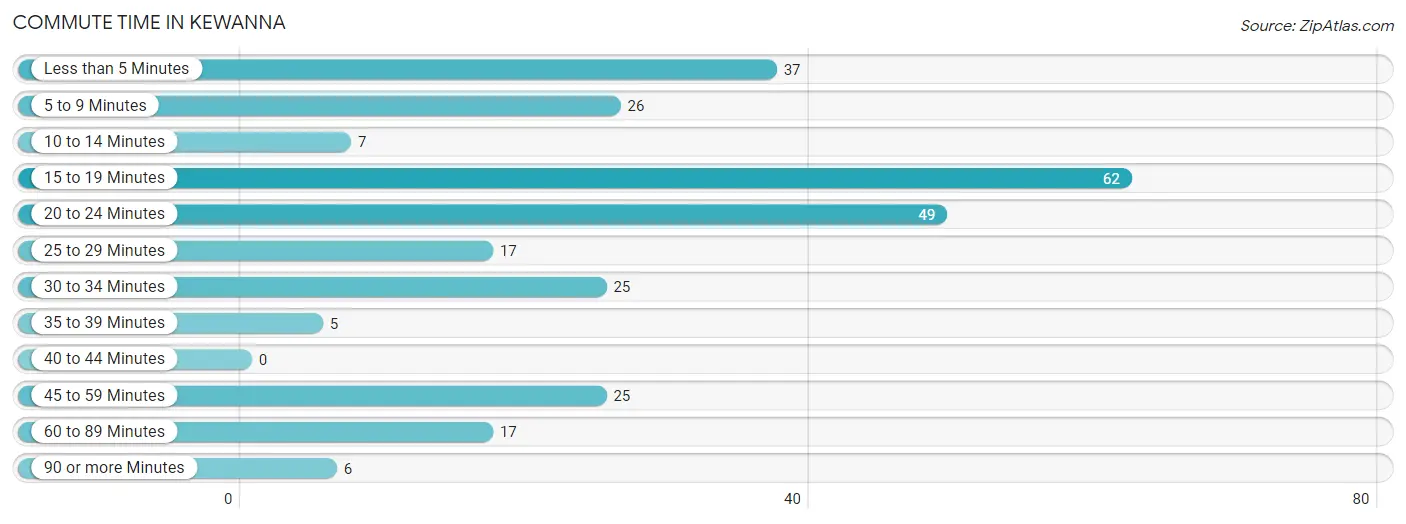
| Commute Time | # Commuters | % Commuters |
| Less than 5 Minutes | 37 | 13.4% |
| 5 to 9 Minutes | 26 | 9.4% |
| 10 to 14 Minutes | 7 | 2.5% |
| 15 to 19 Minutes | 62 | 22.5% |
| 20 to 24 Minutes | 49 | 17.7% |
| 25 to 29 Minutes | 17 | 6.2% |
| 30 to 34 Minutes | 25 | 9.1% |
| 35 to 39 Minutes | 5 | 1.8% |
| 40 to 44 Minutes | 0 | 0.0% |
| 45 to 59 Minutes | 25 | 9.1% |
| 60 to 89 Minutes | 17 | 6.2% |
| 90 or more Minutes | 6 | 2.2% |
Commute Time by Sex in Kewanna
The most common commute times in Kewanna are 20 to 24 minutes (31 commuters, 19.3%) for males and 15 to 19 minutes (39 commuters, 33.9%) for females.
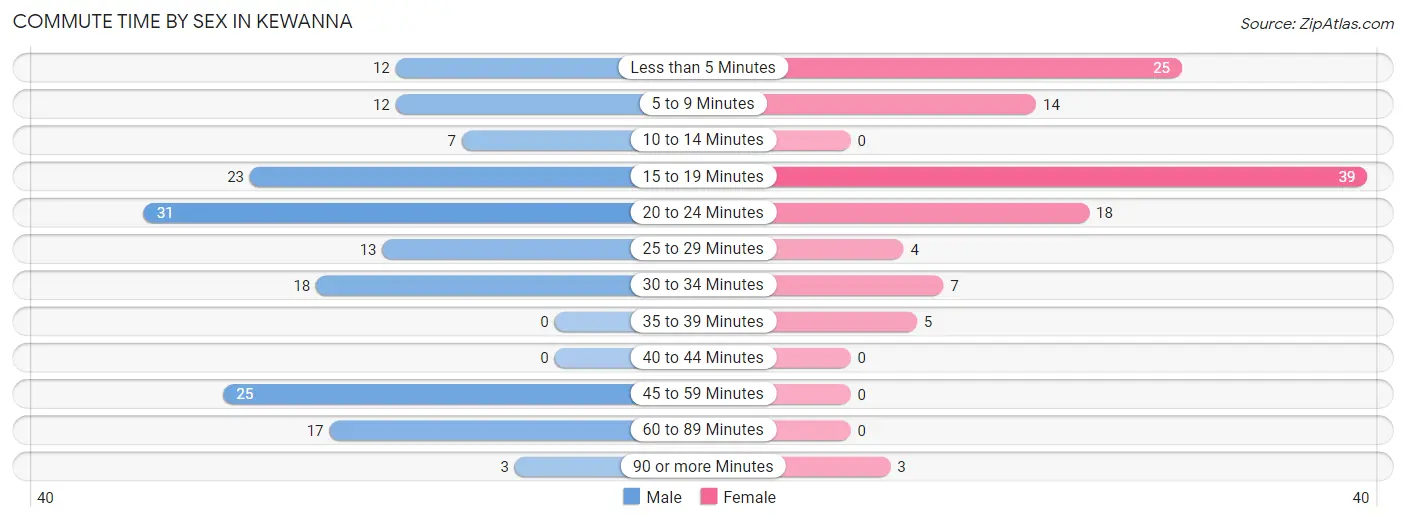
| Commute Time | Male | Female |
| Less than 5 Minutes | 12 (7.4%) | 25 (21.7%) |
| 5 to 9 Minutes | 12 (7.4%) | 14 (12.2%) |
| 10 to 14 Minutes | 7 (4.3%) | 0 (0.0%) |
| 15 to 19 Minutes | 23 (14.3%) | 39 (33.9%) |
| 20 to 24 Minutes | 31 (19.3%) | 18 (15.7%) |
| 25 to 29 Minutes | 13 (8.1%) | 4 (3.5%) |
| 30 to 34 Minutes | 18 (11.2%) | 7 (6.1%) |
| 35 to 39 Minutes | 0 (0.0%) | 5 (4.3%) |
| 40 to 44 Minutes | 0 (0.0%) | 0 (0.0%) |
| 45 to 59 Minutes | 25 (15.5%) | 0 (0.0%) |
| 60 to 89 Minutes | 17 (10.6%) | 0 (0.0%) |
| 90 or more Minutes | 3 (1.9%) | 3 (2.6%) |
Time of Departure to Work by Sex in Kewanna
The most frequent times of departure to work in Kewanna are 12:00 AM to 4:59 AM (38, 23.6%) for males and 4:00 PM to 11:59 PM (20, 17.4%) for females.
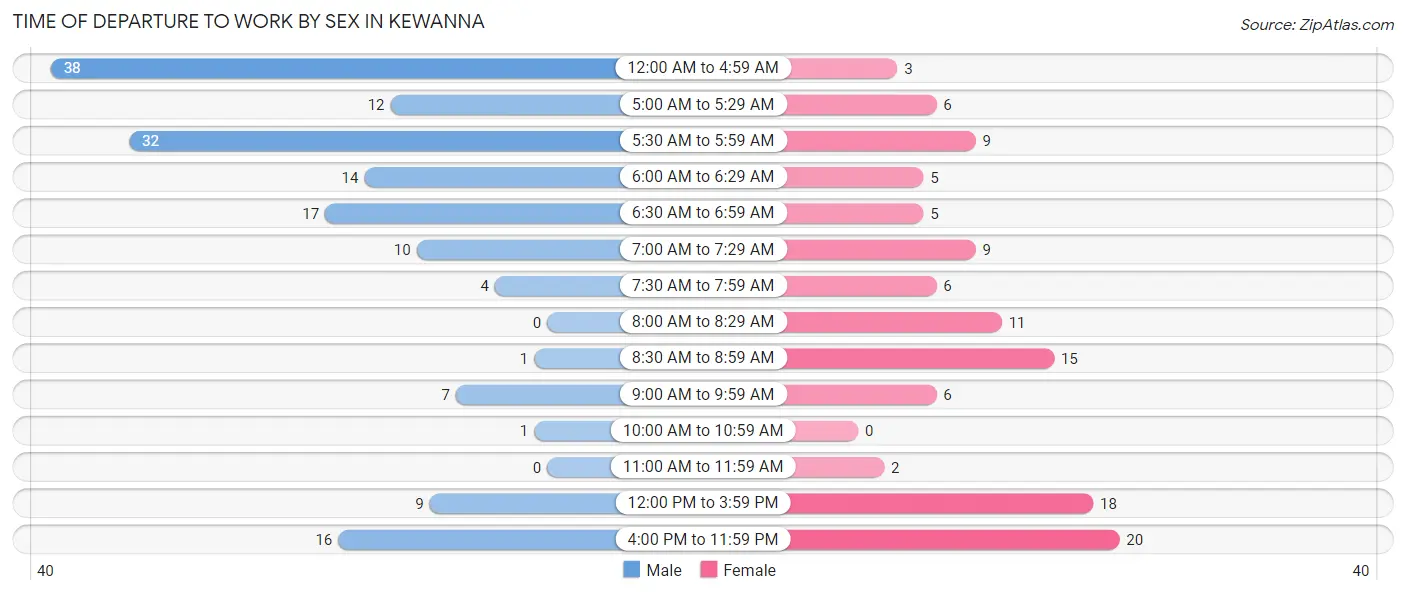
| Time of Departure | Male | Female |
| 12:00 AM to 4:59 AM | 38 (23.6%) | 3 (2.6%) |
| 5:00 AM to 5:29 AM | 12 (7.4%) | 6 (5.2%) |
| 5:30 AM to 5:59 AM | 32 (19.9%) | 9 (7.8%) |
| 6:00 AM to 6:29 AM | 14 (8.7%) | 5 (4.3%) |
| 6:30 AM to 6:59 AM | 17 (10.6%) | 5 (4.3%) |
| 7:00 AM to 7:29 AM | 10 (6.2%) | 9 (7.8%) |
| 7:30 AM to 7:59 AM | 4 (2.5%) | 6 (5.2%) |
| 8:00 AM to 8:29 AM | 0 (0.0%) | 11 (9.6%) |
| 8:30 AM to 8:59 AM | 1 (0.6%) | 15 (13.0%) |
| 9:00 AM to 9:59 AM | 7 (4.3%) | 6 (5.2%) |
| 10:00 AM to 10:59 AM | 1 (0.6%) | 0 (0.0%) |
| 11:00 AM to 11:59 AM | 0 (0.0%) | 2 (1.7%) |
| 12:00 PM to 3:59 PM | 9 (5.6%) | 18 (15.7%) |
| 4:00 PM to 11:59 PM | 16 (9.9%) | 20 (17.4%) |
| Total | 161 (100.0%) | 115 (100.0%) |
Housing Occupancy in Kewanna
Occupancy by Ownership in Kewanna
Of the total 222 dwellings in Kewanna, owner-occupied units account for 173 (77.9%), while renter-occupied units make up 49 (22.1%).
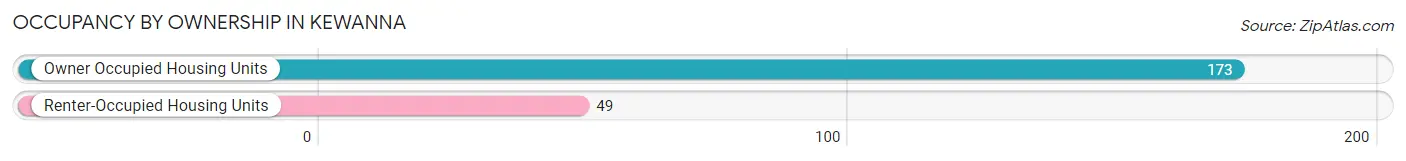
| Occupancy | # Housing Units | % Housing Units |
| Owner Occupied Housing Units | 173 | 77.9% |
| Renter-Occupied Housing Units | 49 | 22.1% |
| Total Occupied Housing Units | 222 | 100.0% |
Occupancy by Household Size in Kewanna
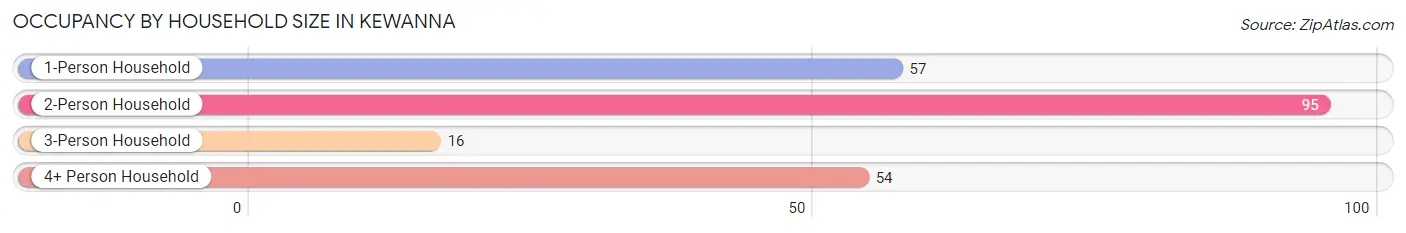
| Household Size | # Housing Units | % Housing Units |
| 1-Person Household | 57 | 25.7% |
| 2-Person Household | 95 | 42.8% |
| 3-Person Household | 16 | 7.2% |
| 4+ Person Household | 54 | 24.3% |
| Total Housing Units | 222 | 100.0% |
Occupancy by Ownership by Household Size in Kewanna
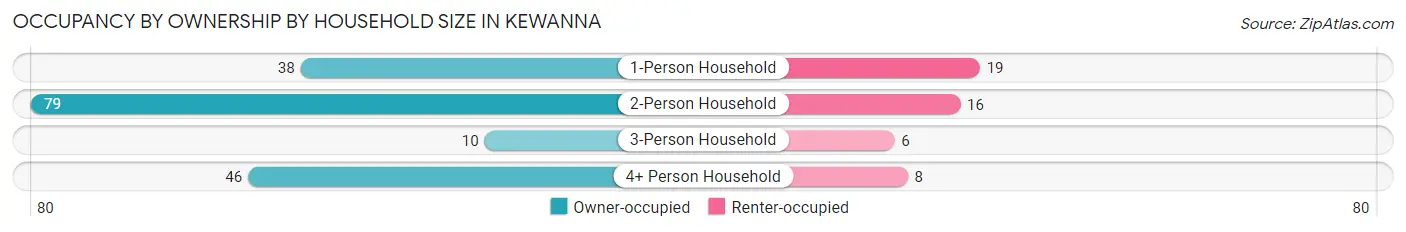
| Household Size | Owner-occupied | Renter-occupied |
| 1-Person Household | 38 (66.7%) | 19 (33.3%) |
| 2-Person Household | 79 (83.2%) | 16 (16.8%) |
| 3-Person Household | 10 (62.5%) | 6 (37.5%) |
| 4+ Person Household | 46 (85.2%) | 8 (14.8%) |
| Total Housing Units | 173 (77.9%) | 49 (22.1%) |
Occupancy by Educational Attainment in Kewanna
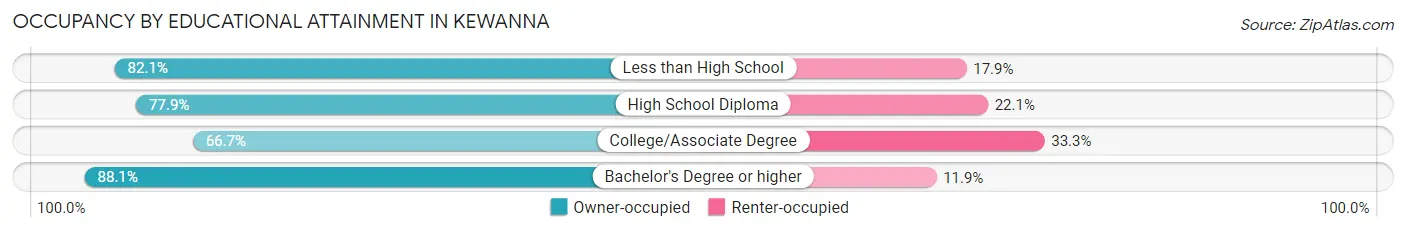
| Household Size | Owner-occupied | Renter-occupied |
| Less than High School | 23 (82.1%) | 5 (17.9%) |
| High School Diploma | 81 (77.9%) | 23 (22.1%) |
| College/Associate Degree | 32 (66.7%) | 16 (33.3%) |
| Bachelor's Degree or higher | 37 (88.1%) | 5 (11.9%) |
Occupancy by Age of Householder in Kewanna
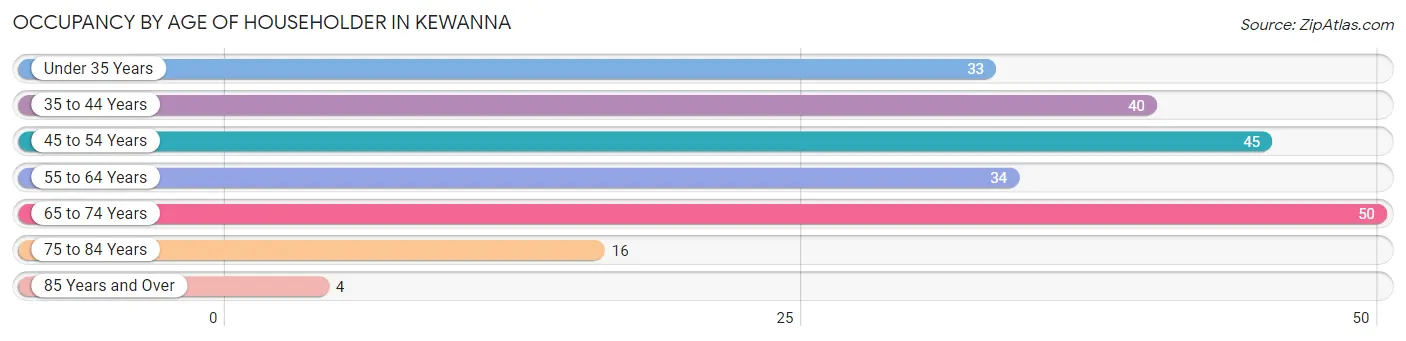
| Age Bracket | # Households | % Households |
| Under 35 Years | 33 | 14.9% |
| 35 to 44 Years | 40 | 18.0% |
| 45 to 54 Years | 45 | 20.3% |
| 55 to 64 Years | 34 | 15.3% |
| 65 to 74 Years | 50 | 22.5% |
| 75 to 84 Years | 16 | 7.2% |
| 85 Years and Over | 4 | 1.8% |
| Total | 222 | 100.0% |
Housing Finances in Kewanna
Median Income by Occupancy in Kewanna
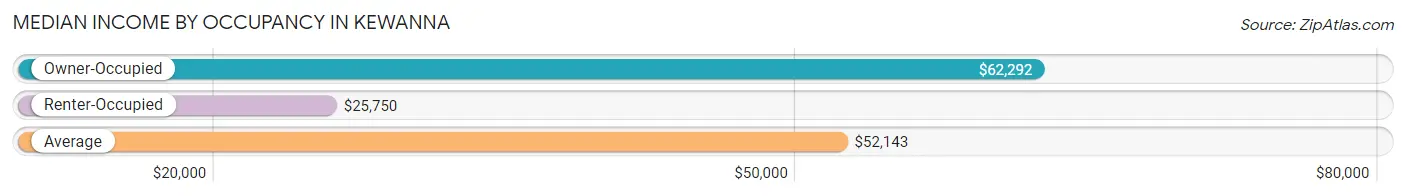
| Occupancy Type | # Households | Median Income |
| Owner-Occupied | 173 (77.9%) | $62,292 |
| Renter-Occupied | 49 (22.1%) | $25,750 |
| Average | 222 (100.0%) | $52,143 |
Occupancy by Householder Income Bracket in Kewanna
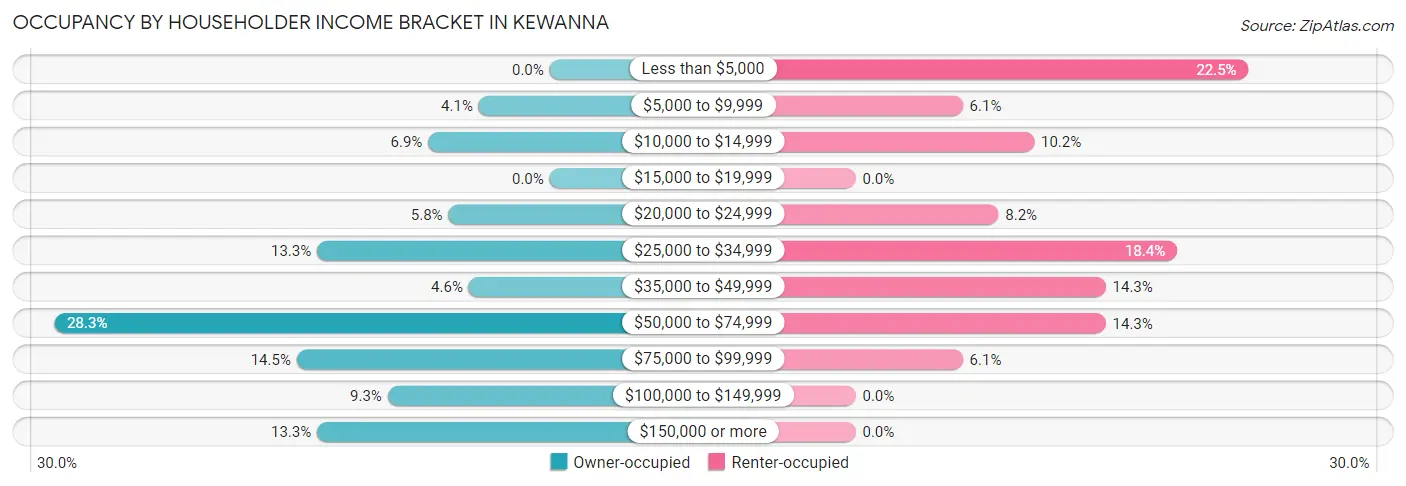
| Income Bracket | Owner-occupied | Renter-occupied |
| Less than $5,000 | 0 (0.0%) | 11 (22.5%) |
| $5,000 to $9,999 | 7 (4.1%) | 3 (6.1%) |
| $10,000 to $14,999 | 12 (6.9%) | 5 (10.2%) |
| $15,000 to $19,999 | 0 (0.0%) | 0 (0.0%) |
| $20,000 to $24,999 | 10 (5.8%) | 4 (8.2%) |
| $25,000 to $34,999 | 23 (13.3%) | 9 (18.4%) |
| $35,000 to $49,999 | 8 (4.6%) | 7 (14.3%) |
| $50,000 to $74,999 | 49 (28.3%) | 7 (14.3%) |
| $75,000 to $99,999 | 25 (14.4%) | 3 (6.1%) |
| $100,000 to $149,999 | 16 (9.2%) | 0 (0.0%) |
| $150,000 or more | 23 (13.3%) | 0 (0.0%) |
| Total | 173 (100.0%) | 49 (100.0%) |
Monthly Housing Cost Tiers in Kewanna
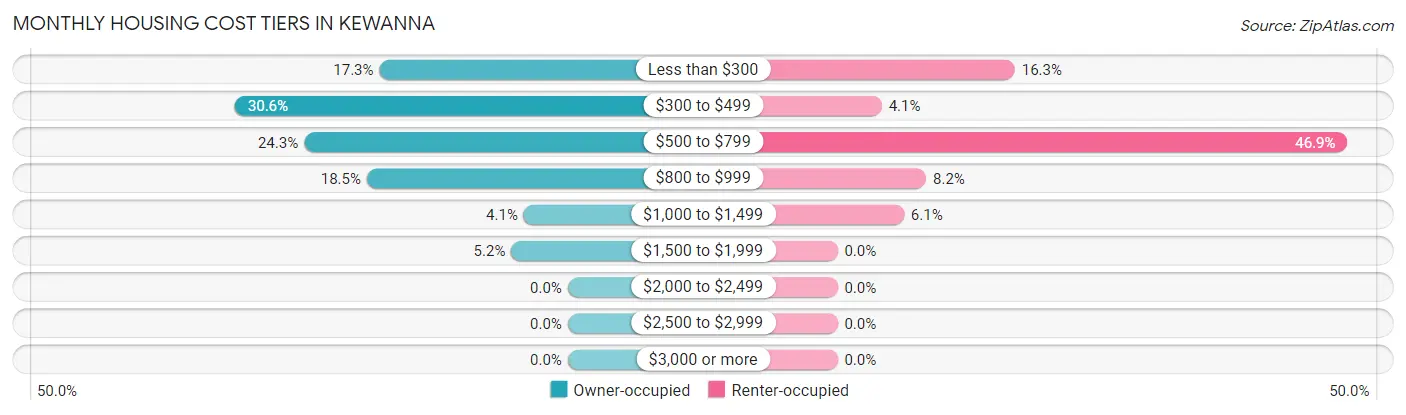
| Monthly Cost | Owner-occupied | Renter-occupied |
| Less than $300 | 30 (17.3%) | 8 (16.3%) |
| $300 to $499 | 53 (30.6%) | 2 (4.1%) |
| $500 to $799 | 42 (24.3%) | 23 (46.9%) |
| $800 to $999 | 32 (18.5%) | 4 (8.2%) |
| $1,000 to $1,499 | 7 (4.1%) | 3 (6.1%) |
| $1,500 to $1,999 | 9 (5.2%) | 0 (0.0%) |
| $2,000 to $2,499 | 0 (0.0%) | 0 (0.0%) |
| $2,500 to $2,999 | 0 (0.0%) | 0 (0.0%) |
| $3,000 or more | 0 (0.0%) | 0 (0.0%) |
| Total | 173 (100.0%) | 49 (100.0%) |
Physical Housing Characteristics in Kewanna
Housing Structures in Kewanna
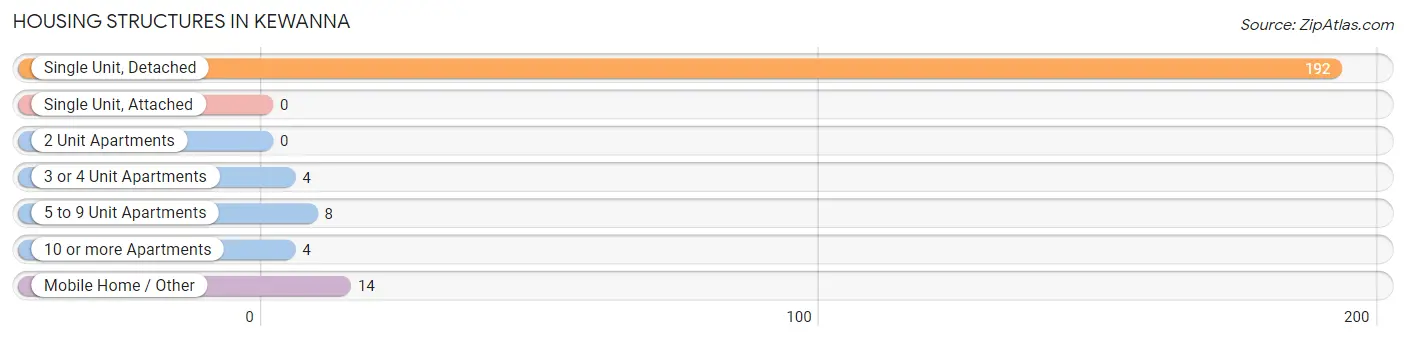
| Structure Type | # Housing Units | % Housing Units |
| Single Unit, Detached | 192 | 86.5% |
| Single Unit, Attached | 0 | 0.0% |
| 2 Unit Apartments | 0 | 0.0% |
| 3 or 4 Unit Apartments | 4 | 1.8% |
| 5 to 9 Unit Apartments | 8 | 3.6% |
| 10 or more Apartments | 4 | 1.8% |
| Mobile Home / Other | 14 | 6.3% |
| Total | 222 | 100.0% |
Housing Structures by Occupancy in Kewanna
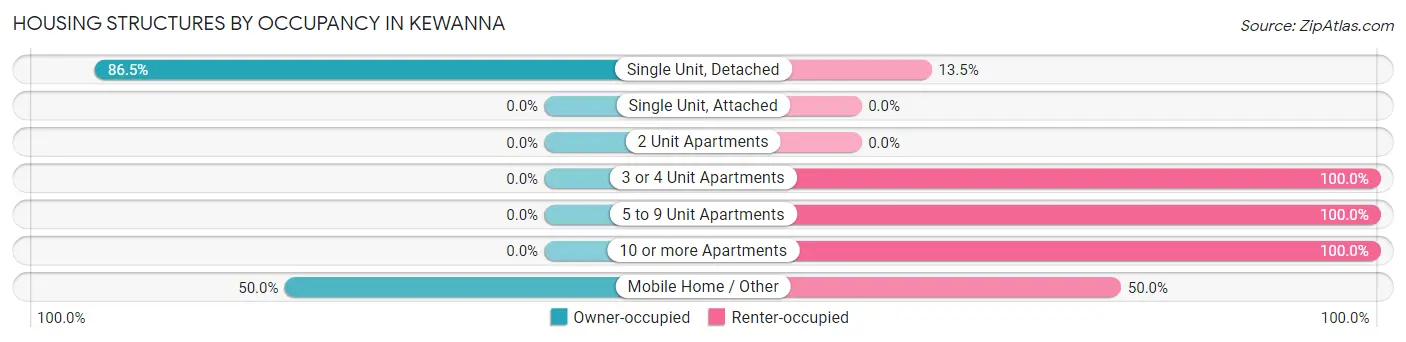
| Structure Type | Owner-occupied | Renter-occupied |
| Single Unit, Detached | 166 (86.5%) | 26 (13.5%) |
| Single Unit, Attached | 0 (0.0%) | 0 (0.0%) |
| 2 Unit Apartments | 0 (0.0%) | 0 (0.0%) |
| 3 or 4 Unit Apartments | 0 (0.0%) | 4 (100.0%) |
| 5 to 9 Unit Apartments | 0 (0.0%) | 8 (100.0%) |
| 10 or more Apartments | 0 (0.0%) | 4 (100.0%) |
| Mobile Home / Other | 7 (50.0%) | 7 (50.0%) |
| Total | 173 (77.9%) | 49 (22.1%) |
Housing Structures by Number of Rooms in Kewanna
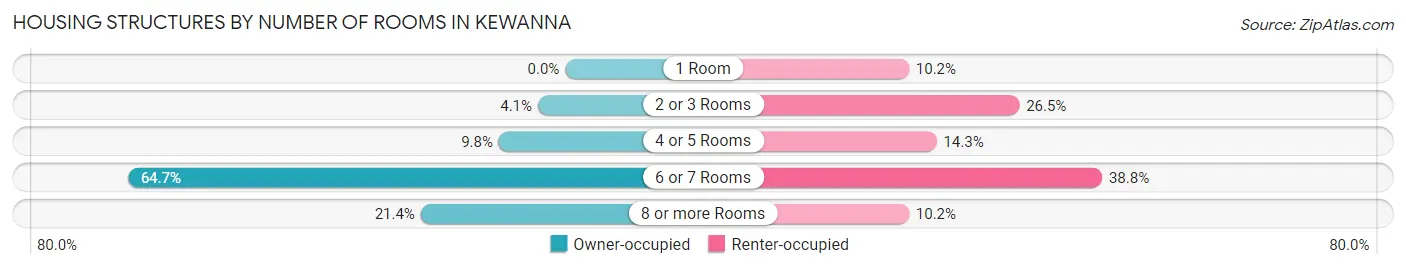
| Number of Rooms | Owner-occupied | Renter-occupied |
| 1 Room | 0 (0.0%) | 5 (10.2%) |
| 2 or 3 Rooms | 7 (4.1%) | 13 (26.5%) |
| 4 or 5 Rooms | 17 (9.8%) | 7 (14.3%) |
| 6 or 7 Rooms | 112 (64.7%) | 19 (38.8%) |
| 8 or more Rooms | 37 (21.4%) | 5 (10.2%) |
| Total | 173 (100.0%) | 49 (100.0%) |
Housing Structure by Heating Type in Kewanna
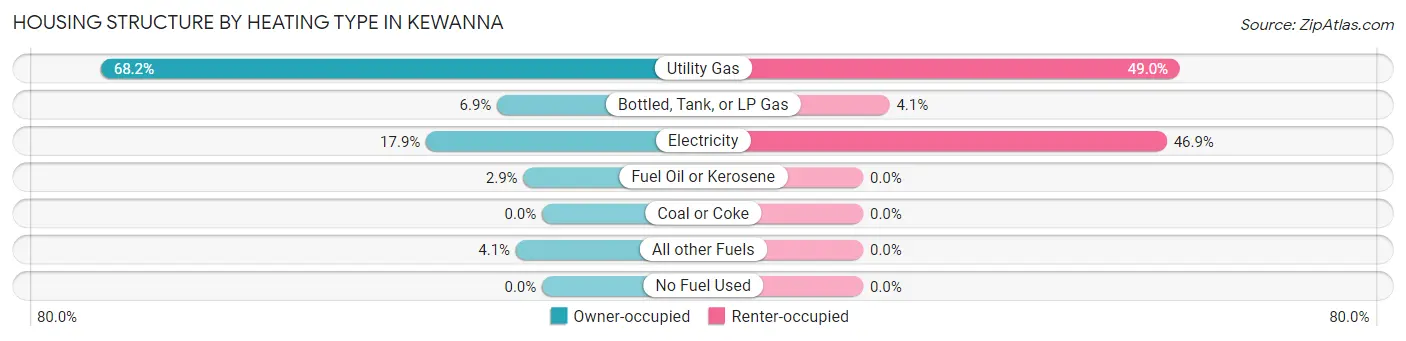
| Heating Type | Owner-occupied | Renter-occupied |
| Utility Gas | 118 (68.2%) | 24 (49.0%) |
| Bottled, Tank, or LP Gas | 12 (6.9%) | 2 (4.1%) |
| Electricity | 31 (17.9%) | 23 (46.9%) |
| Fuel Oil or Kerosene | 5 (2.9%) | 0 (0.0%) |
| Coal or Coke | 0 (0.0%) | 0 (0.0%) |
| All other Fuels | 7 (4.1%) | 0 (0.0%) |
| No Fuel Used | 0 (0.0%) | 0 (0.0%) |
| Total | 173 (100.0%) | 49 (100.0%) |
Household Vehicle Usage in Kewanna
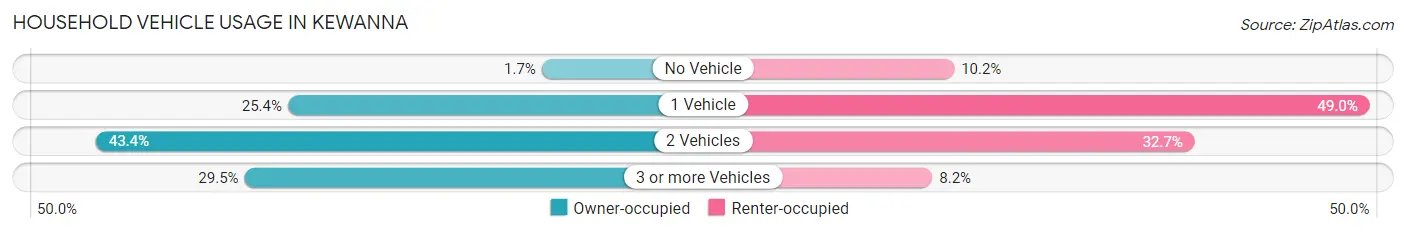
| Vehicles per Household | Owner-occupied | Renter-occupied |
| No Vehicle | 3 (1.7%) | 5 (10.2%) |
| 1 Vehicle | 44 (25.4%) | 24 (49.0%) |
| 2 Vehicles | 75 (43.3%) | 16 (32.7%) |
| 3 or more Vehicles | 51 (29.5%) | 4 (8.2%) |
| Total | 173 (100.0%) | 49 (100.0%) |
Real Estate & Mortgages in Kewanna
Real Estate and Mortgage Overview in Kewanna
| Characteristic | Without Mortgage | With Mortgage |
| Housing Units | 95 | 78 |
| Median Property Value | $52,600 | $68,800 |
| Median Household Income | $54,688 | $5 |
| Monthly Housing Costs | $363 | $0 |
| Real Estate Taxes | $358 | $0 |
Property Value by Mortgage Status in Kewanna
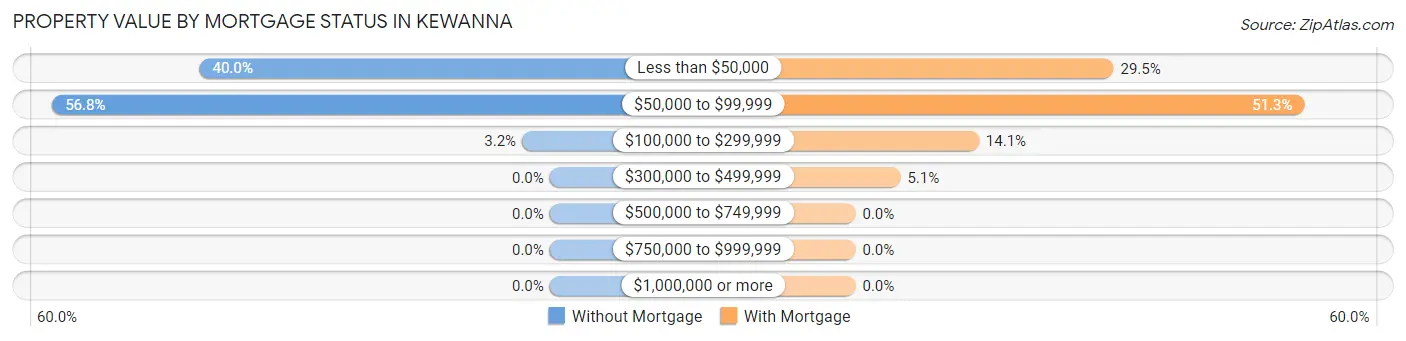
| Property Value | Without Mortgage | With Mortgage |
| Less than $50,000 | 38 (40.0%) | 23 (29.5%) |
| $50,000 to $99,999 | 54 (56.8%) | 40 (51.3%) |
| $100,000 to $299,999 | 3 (3.2%) | 11 (14.1%) |
| $300,000 to $499,999 | 0 (0.0%) | 4 (5.1%) |
| $500,000 to $749,999 | 0 (0.0%) | 0 (0.0%) |
| $750,000 to $999,999 | 0 (0.0%) | 0 (0.0%) |
| $1,000,000 or more | 0 (0.0%) | 0 (0.0%) |
| Total | 95 (100.0%) | 78 (100.0%) |
Household Income by Mortgage Status in Kewanna
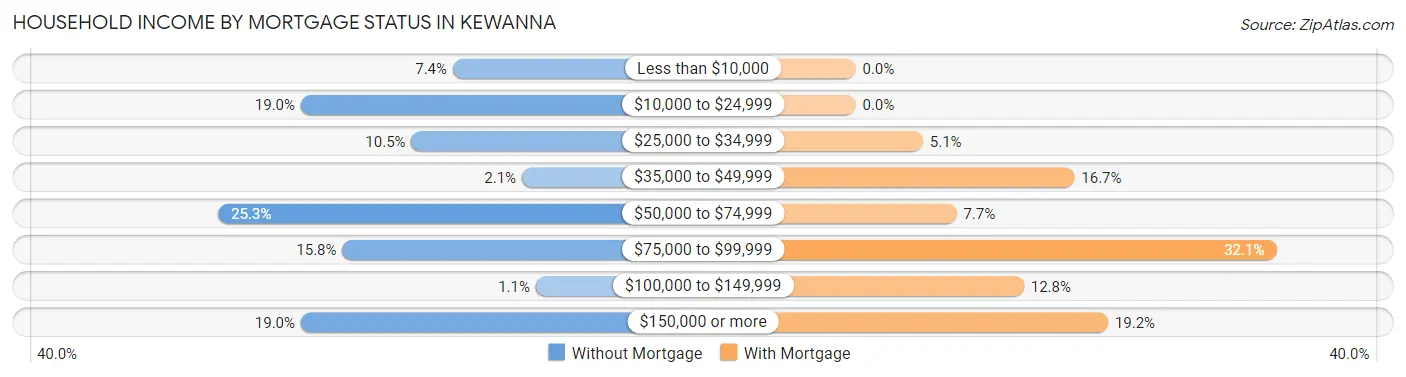
| Household Income | Without Mortgage | With Mortgage |
| Less than $10,000 | 7 (7.4%) | 0 (0.0%) |
| $10,000 to $24,999 | 18 (19.0%) | 0 (0.0%) |
| $25,000 to $34,999 | 10 (10.5%) | 4 (5.1%) |
| $35,000 to $49,999 | 2 (2.1%) | 13 (16.7%) |
| $50,000 to $74,999 | 24 (25.3%) | 6 (7.7%) |
| $75,000 to $99,999 | 15 (15.8%) | 25 (32.1%) |
| $100,000 to $149,999 | 1 (1.1%) | 10 (12.8%) |
| $150,000 or more | 18 (19.0%) | 15 (19.2%) |
| Total | 95 (100.0%) | 78 (100.0%) |
Property Value to Household Income Ratio in Kewanna
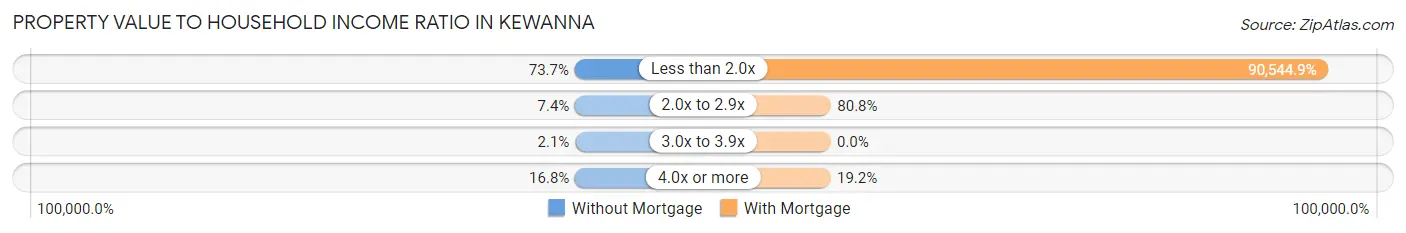
| Value-to-Income Ratio | Without Mortgage | With Mortgage |
| Less than 2.0x | 70 (73.7%) | 70,625 (90,544.9%) |
| 2.0x to 2.9x | 7 (7.4%) | 63 (80.8%) |
| 3.0x to 3.9x | 2 (2.1%) | 0 (0.0%) |
| 4.0x or more | 16 (16.8%) | 15 (19.2%) |
| Total | 95 (100.0%) | 78 (100.0%) |
Real Estate Taxes by Mortgage Status in Kewanna
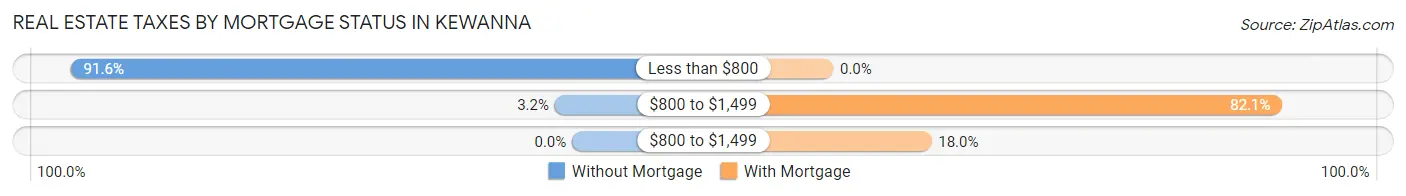
| Property Taxes | Without Mortgage | With Mortgage |
| Less than $800 | 87 (91.6%) | 0 (0.0%) |
| $800 to $1,499 | 3 (3.2%) | 64 (82.1%) |
| $800 to $1,499 | 0 (0.0%) | 14 (17.9%) |
| Total | 95 (100.0%) | 78 (100.0%) |
Health & Disability in Kewanna
Health Insurance Coverage by Age in Kewanna
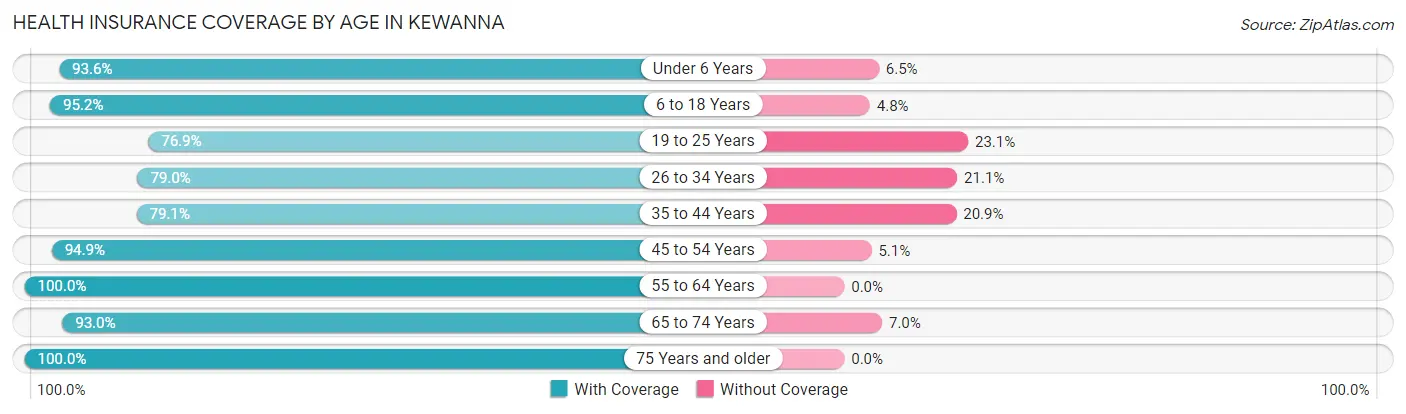
| Age Bracket | With Coverage | Without Coverage |
| Under 6 Years | 29 (93.5%) | 2 (6.5%) |
| 6 to 18 Years | 100 (95.2%) | 5 (4.8%) |
| 19 to 25 Years | 40 (76.9%) | 12 (23.1%) |
| 26 to 34 Years | 45 (78.9%) | 12 (21.0%) |
| 35 to 44 Years | 72 (79.1%) | 19 (20.9%) |
| 45 to 54 Years | 75 (94.9%) | 4 (5.1%) |
| 55 to 64 Years | 63 (100.0%) | 0 (0.0%) |
| 65 to 74 Years | 66 (93.0%) | 5 (7.0%) |
| 75 Years and older | 38 (100.0%) | 0 (0.0%) |
| Total | 528 (89.9%) | 59 (10.1%) |
Health Insurance Coverage by Citizenship Status in Kewanna
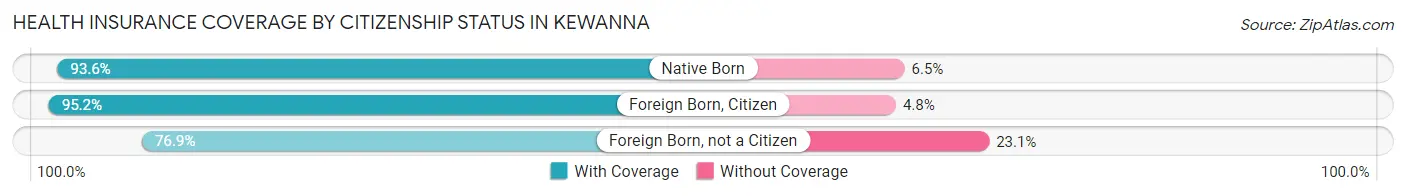
| Citizenship Status | With Coverage | Without Coverage |
| Native Born | 29 (93.5%) | 2 (6.5%) |
| Foreign Born, Citizen | 100 (95.2%) | 5 (4.8%) |
| Foreign Born, not a Citizen | 40 (76.9%) | 12 (23.1%) |
Health Insurance Coverage by Household Income in Kewanna
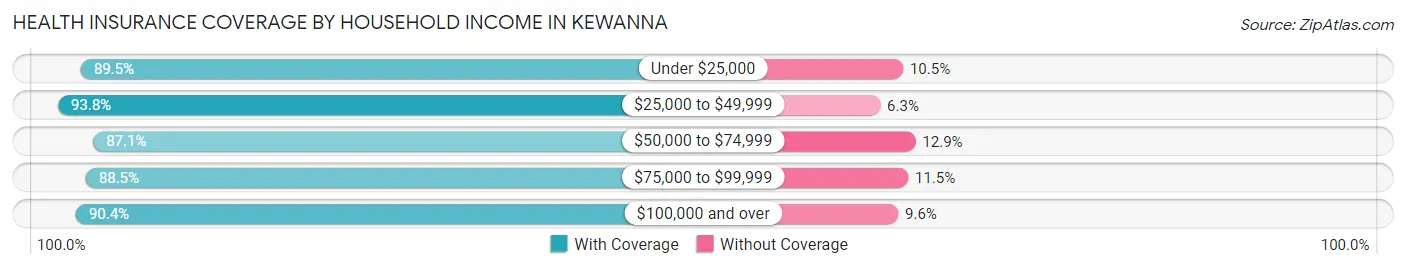
| Household Income | With Coverage | Without Coverage |
| Under $25,000 | 68 (89.5%) | 8 (10.5%) |
| $25,000 to $49,999 | 120 (93.8%) | 8 (6.2%) |
| $50,000 to $74,999 | 122 (87.1%) | 18 (12.9%) |
| $75,000 to $99,999 | 77 (88.5%) | 10 (11.5%) |
| $100,000 and over | 141 (90.4%) | 15 (9.6%) |
Public vs Private Health Insurance Coverage by Age in Kewanna
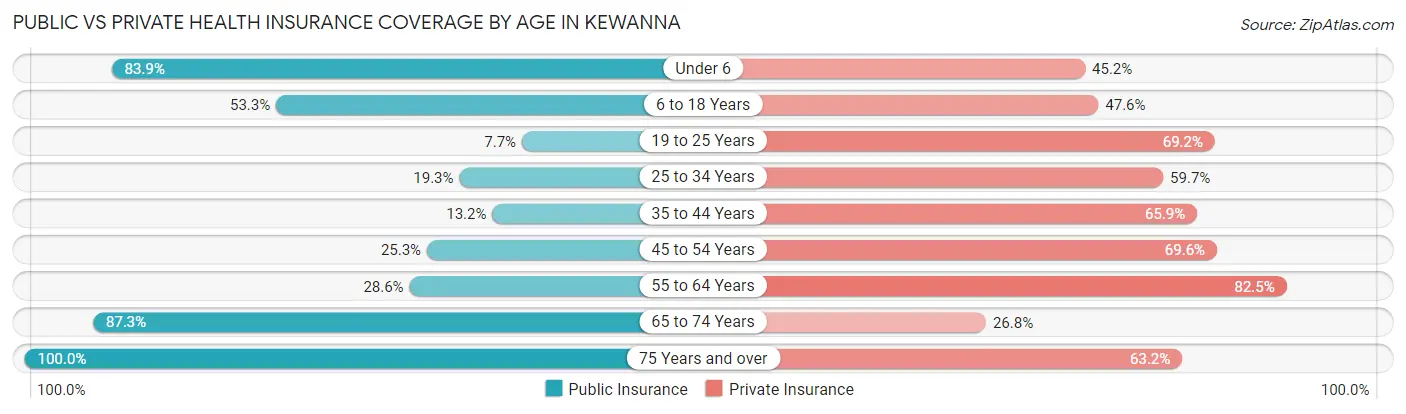
| Age Bracket | Public Insurance | Private Insurance |
| Under 6 | 26 (83.9%) | 14 (45.2%) |
| 6 to 18 Years | 56 (53.3%) | 50 (47.6%) |
| 19 to 25 Years | 4 (7.7%) | 36 (69.2%) |
| 25 to 34 Years | 11 (19.3%) | 34 (59.7%) |
| 35 to 44 Years | 12 (13.2%) | 60 (65.9%) |
| 45 to 54 Years | 20 (25.3%) | 55 (69.6%) |
| 55 to 64 Years | 18 (28.6%) | 52 (82.5%) |
| 65 to 74 Years | 62 (87.3%) | 19 (26.8%) |
| 75 Years and over | 38 (100.0%) | 24 (63.2%) |
| Total | 247 (42.1%) | 344 (58.6%) |
Disability Status by Sex by Age in Kewanna
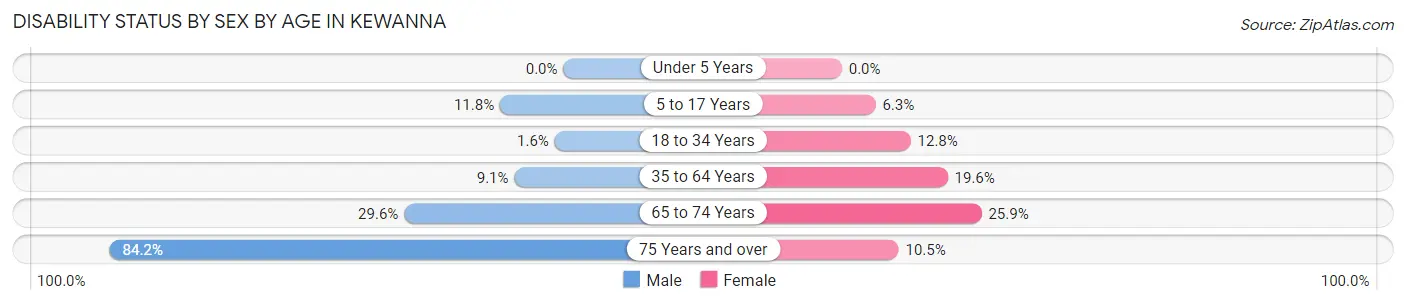
| Age Bracket | Male | Female |
| Under 5 Years | 0 (0.0%) | 0 (0.0%) |
| 5 to 17 Years | 6 (11.8%) | 4 (6.2%) |
| 18 to 34 Years | 1 (1.6%) | 6 (12.8%) |
| 35 to 64 Years | 11 (9.1%) | 22 (19.6%) |
| 65 to 74 Years | 13 (29.5%) | 7 (25.9%) |
| 75 Years and over | 16 (84.2%) | 2 (10.5%) |
Disability Class by Sex by Age in Kewanna
Disability Class: Hearing Difficulty
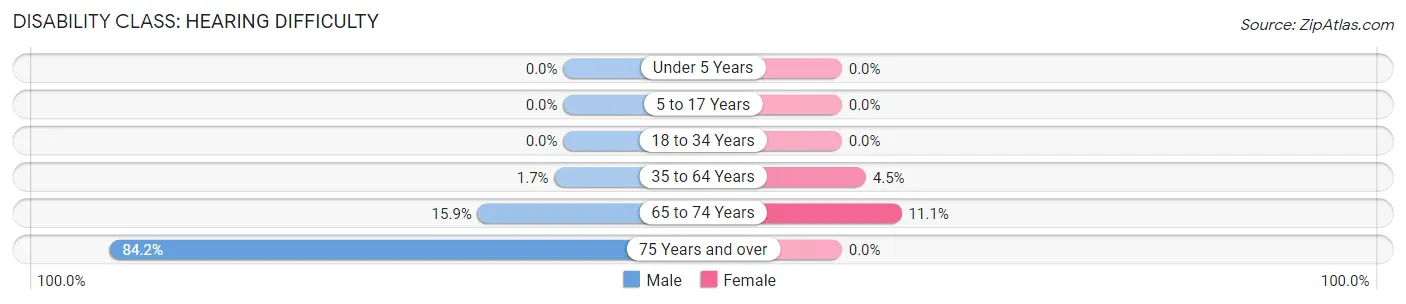
| Age Bracket | Male | Female |
| Under 5 Years | 0 (0.0%) | 0 (0.0%) |
| 5 to 17 Years | 0 (0.0%) | 0 (0.0%) |
| 18 to 34 Years | 0 (0.0%) | 0 (0.0%) |
| 35 to 64 Years | 2 (1.7%) | 5 (4.5%) |
| 65 to 74 Years | 7 (15.9%) | 3 (11.1%) |
| 75 Years and over | 16 (84.2%) | 0 (0.0%) |
Disability Class: Vision Difficulty
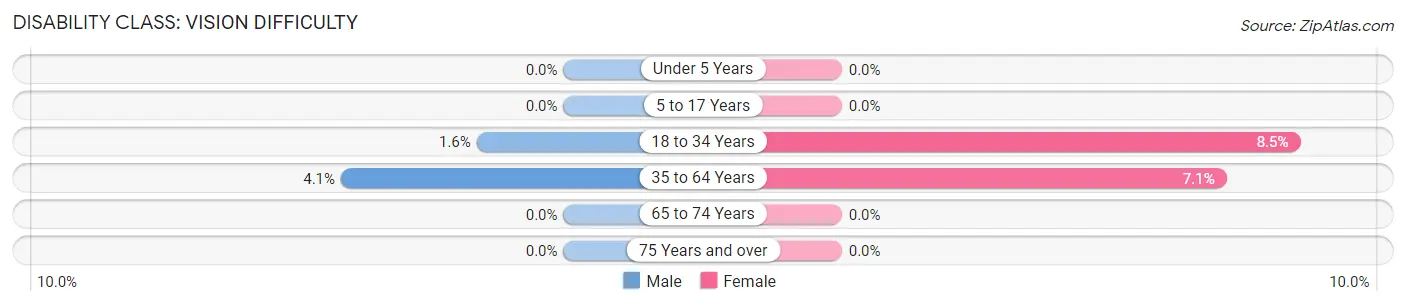
| Age Bracket | Male | Female |
| Under 5 Years | 0 (0.0%) | 0 (0.0%) |
| 5 to 17 Years | 0 (0.0%) | 0 (0.0%) |
| 18 to 34 Years | 1 (1.6%) | 4 (8.5%) |
| 35 to 64 Years | 5 (4.1%) | 8 (7.1%) |
| 65 to 74 Years | 0 (0.0%) | 0 (0.0%) |
| 75 Years and over | 0 (0.0%) | 0 (0.0%) |
Disability Class: Cognitive Difficulty
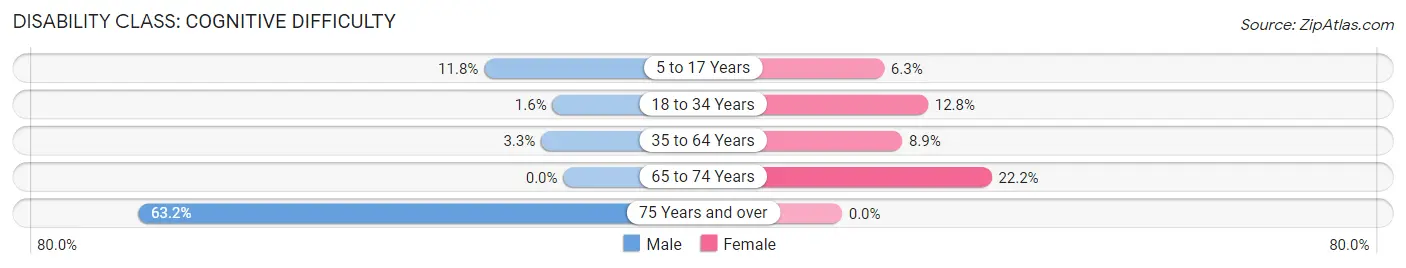
| Age Bracket | Male | Female |
| 5 to 17 Years | 6 (11.8%) | 4 (6.2%) |
| 18 to 34 Years | 1 (1.6%) | 6 (12.8%) |
| 35 to 64 Years | 4 (3.3%) | 10 (8.9%) |
| 65 to 74 Years | 0 (0.0%) | 6 (22.2%) |
| 75 Years and over | 12 (63.2%) | 0 (0.0%) |
Disability Class: Ambulatory Difficulty
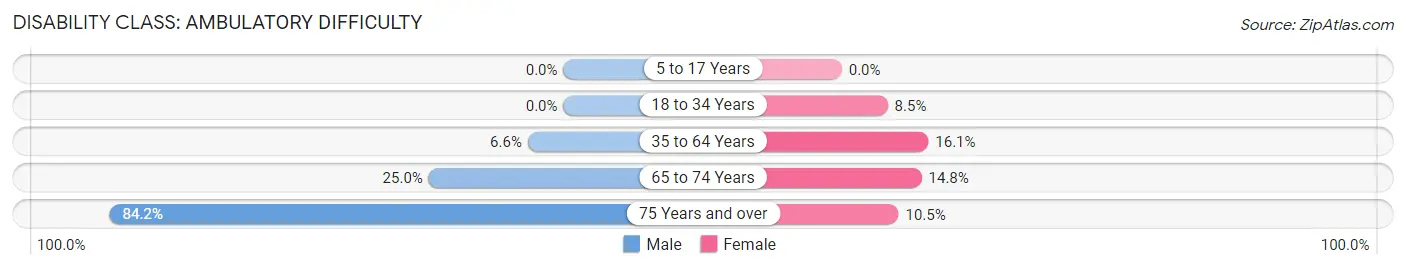
| Age Bracket | Male | Female |
| 5 to 17 Years | 0 (0.0%) | 0 (0.0%) |
| 18 to 34 Years | 0 (0.0%) | 4 (8.5%) |
| 35 to 64 Years | 8 (6.6%) | 18 (16.1%) |
| 65 to 74 Years | 11 (25.0%) | 4 (14.8%) |
| 75 Years and over | 16 (84.2%) | 2 (10.5%) |
Disability Class: Self-Care Difficulty
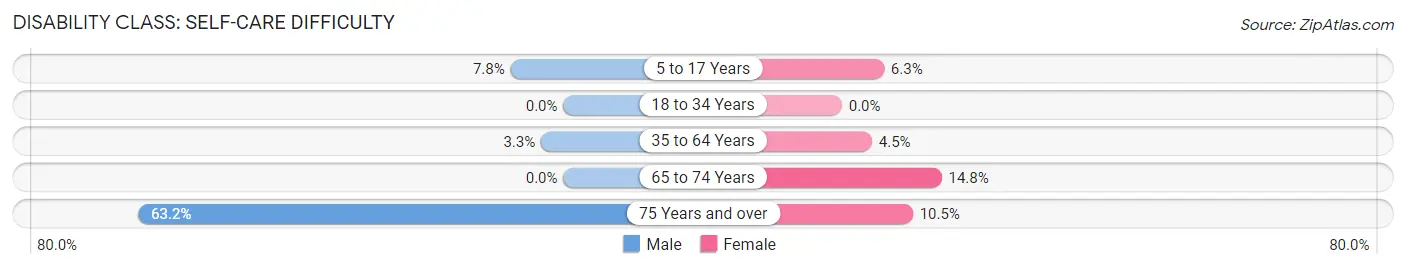
| Age Bracket | Male | Female |
| 5 to 17 Years | 4 (7.8%) | 4 (6.2%) |
| 18 to 34 Years | 0 (0.0%) | 0 (0.0%) |
| 35 to 64 Years | 4 (3.3%) | 5 (4.5%) |
| 65 to 74 Years | 0 (0.0%) | 4 (14.8%) |
| 75 Years and over | 12 (63.2%) | 2 (10.5%) |
Technology Access in Kewanna
Computing Device Access in Kewanna
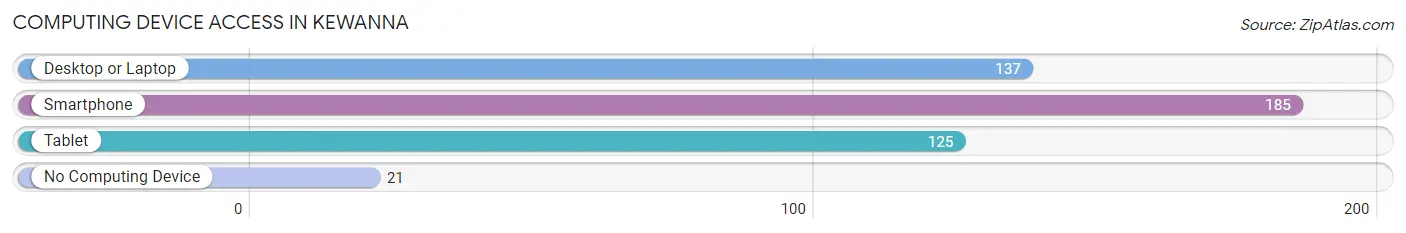
| Device Type | # Households | % Households |
| Desktop or Laptop | 137 | 61.7% |
| Smartphone | 185 | 83.3% |
| Tablet | 125 | 56.3% |
| No Computing Device | 21 | 9.5% |
| Total | 222 | 100.0% |
Internet Access in Kewanna
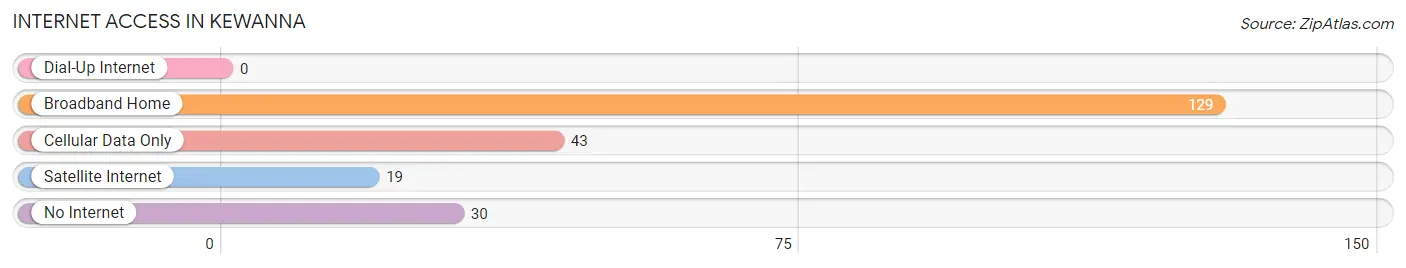
| Internet Type | # Households | % Households |
| Dial-Up Internet | 0 | 0.0% |
| Broadband Home | 129 | 58.1% |
| Cellular Data Only | 43 | 19.4% |
| Satellite Internet | 19 | 8.6% |
| No Internet | 30 | 13.5% |
| Total | 222 | 100.0% |
Kewanna Summary
Kewanna is a small town located in Fulton County, Indiana, United States. It is situated in the northwest corner of the state, approximately 40 miles south of South Bend and 40 miles north of Indianapolis. The population of Kewanna was estimated to be 645 in 2019.
Geography
Kewanna is located in the Tippecanoe River Valley, which is part of the Wabash River watershed. The town is situated on the east side of the Tippecanoe River, which is the main waterway in the area. The town is surrounded by rolling hills and farmland, and is located in a rural area. The nearest major city is South Bend, which is approximately 40 miles away.
History
Kewanna was founded in 1851 by a group of settlers from Ohio. The town was named after a Native American chief, Kewanna, who lived in the area. The town was originally a farming community, and the main crops grown were corn, wheat, and oats. In the late 19th century, the town began to grow and develop, and several businesses were established. The first bank in Kewanna was established in 1891, and the first newspaper was published in 1895.
In the early 20th century, Kewanna began to experience a period of growth and development. The town was incorporated in 1908, and the first mayor was elected in 1909. The town continued to grow and develop, and in the 1950s, the population reached its peak of 1,000.
Economy
Kewanna’s economy is largely based on agriculture and manufacturing. The town is home to several small businesses, including a grocery store, a hardware store, and a restaurant. The town also has a few small manufacturing companies, which produce a variety of products, including furniture, clothing, and automotive parts.
Demographics
Kewanna’s population is predominantly white, with a small percentage of African Americans and Hispanics. The median household income is $41,000, and the median home value is $90,000. The town has a low unemployment rate of 3.2%, and the poverty rate is 11.3%.
Conclusion
Kewanna is a small town located in Fulton County, Indiana. It is situated in the northwest corner of the state, and is surrounded by rolling hills and farmland. The town was founded in 1851, and has a population of 645. The economy is largely based on agriculture and manufacturing, and the median household income is $41,000. Kewanna is a small, rural town with a rich history and a bright future.
Common Questions
What is Per Capita Income in Kewanna?
Per Capita income in Kewanna is $27,021.
What is the Median Family Income in Kewanna?
Median Family Income in Kewanna is $70,298.
What is the Median Household income in Kewanna?
Median Household Income in Kewanna is $52,143.
What is Income or Wage Gap in Kewanna?
Income or Wage Gap in Kewanna is 37.6%.
Women in Kewanna earn 62.4 cents for every dollar earned by a man.
What is Family Income Deficit in Kewanna?
Family Income Deficit in Kewanna is $9,618.
Families that are below poverty line in Kewanna earn $9,618 less on average than the poverty threshold level.
What is Inequality or Gini Index in Kewanna?
Inequality or Gini Index in Kewanna is 0.43.
What is the Total Population of Kewanna?
Total Population of Kewanna is 587.
What is the Total Male Population of Kewanna?
Total Male Population of Kewanna is 318.
What is the Total Female Population of Kewanna?
Total Female Population of Kewanna is 269.
What is the Ratio of Males per 100 Females in Kewanna?
There are 118.22 Males per 100 Females in Kewanna.
What is the Ratio of Females per 100 Males in Kewanna?
There are 84.59 Females per 100 Males in Kewanna.
What is the Median Population Age in Kewanna?
Median Population Age in Kewanna is 41.3 Years.
What is the Average Family Size in Kewanna
Average Family Size in Kewanna is 3.0 People.
What is the Average Household Size in Kewanna
Average Household Size in Kewanna is 2.6 People.
How Large is the Labor Force in Kewanna?
There are 301 People in the Labor Forcein in Kewanna.
What is the Percentage of People in the Labor Force in Kewanna?
62.8% of People are in the Labor Force in Kewanna.
What is the Unemployment Rate in Kewanna?
Unemployment Rate in Kewanna is 5.0%.