Milan, IN Map & Demographics
Milan Map
Milan Overview
$26,004
PER CAPITA INCOME
$66,698
AVG FAMILY INCOME
$53,047
AVG HOUSEHOLD INCOME
34.8%
WAGE / INCOME GAP [ % ]
65.2¢/ $1
WAGE / INCOME GAP [ $ ]
0.43
INEQUALITY / GINI INDEX
1,981
TOTAL POPULATION
968
MALE POPULATION
1,013
FEMALE POPULATION
95.56
MALES / 100 FEMALES
104.65
FEMALES / 100 MALES
44.4
MEDIAN AGE
3.2
AVG FAMILY SIZE
2.6
AVG HOUSEHOLD SIZE
886
LABOR FORCE [ PEOPLE ]
54.5%
PERCENT IN LABOR FORCE
3.7%
UNEMPLOYMENT RATE
Milan Zip Codes
Milan Area Codes
Income in Milan
Income Overview in Milan
Per Capita Income in Milan is $26,004, while median incomes of families and households are $66,698 and $53,047 respectively.
| Characteristic | Number | Measure |
| Per Capita Income | 1,981 | $26,004 |
| Median Family Income | 466 | $66,698 |
| Mean Family Income | 466 | $78,023 |
| Median Household Income | 725 | $53,047 |
| Mean Household Income | 725 | $66,561 |
| Income Deficit | 466 | $0 |
| Wage / Income Gap (%) | 1,981 | 34.79% |
| Wage / Income Gap ($) | 1,981 | 65.21¢ per $1 |
| Gini / Inequality Index | 1,981 | 0.43 |
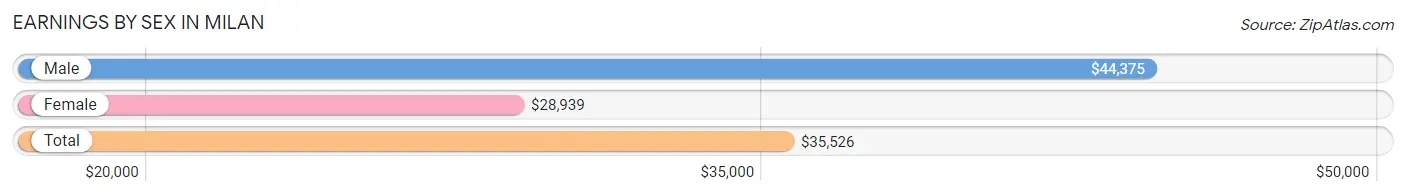
Earnings by Sex in Milan
Average Earnings in Milan are $35,526, $44,375 for men and $28,939 for women, a difference of 34.8%.
| Sex | Number | Average Earnings |
| Male | 534 (56.3%) | $44,375 |
| Female | 414 (43.7%) | $28,939 |
| Total | 948 (100.0%) | $35,526 |
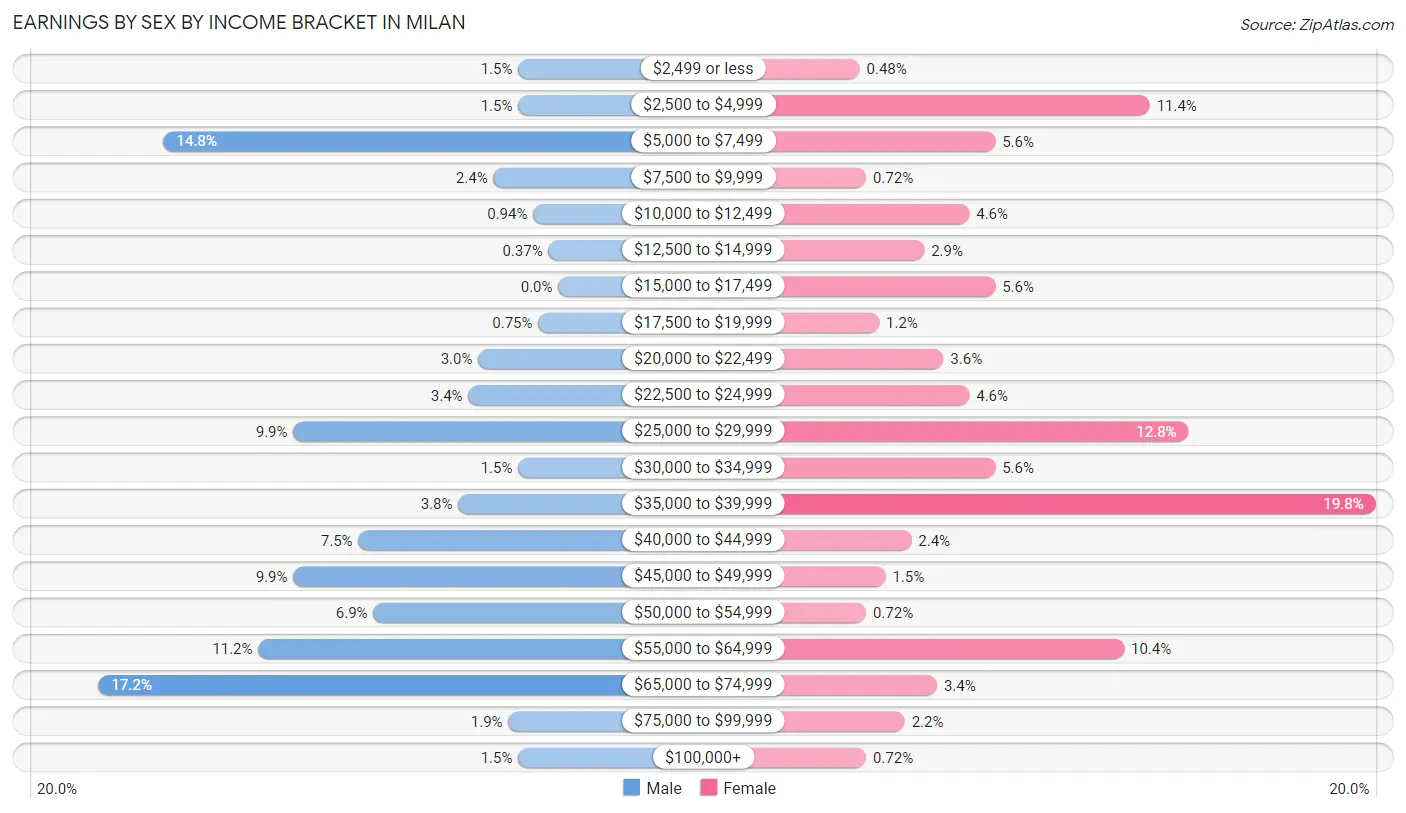
Earnings by Sex by Income Bracket in Milan
The most common earnings brackets in Milan are $65,000 to $74,999 for men (92 | 17.2%) and $35,000 to $39,999 for women (82 | 19.8%).
| Income | Male | Female |
| $2,499 or less | 8 (1.5%) | 2 (0.5%) |
| $2,500 to $4,999 | 8 (1.5%) | 47 (11.4%) |
| $5,000 to $7,499 | 79 (14.8%) | 23 (5.6%) |
| $7,500 to $9,999 | 13 (2.4%) | 3 (0.7%) |
| $10,000 to $12,499 | 5 (0.9%) | 19 (4.6%) |
| $12,500 to $14,999 | 2 (0.4%) | 12 (2.9%) |
| $15,000 to $17,499 | 0 (0.0%) | 23 (5.6%) |
| $17,500 to $19,999 | 4 (0.7%) | 5 (1.2%) |
| $20,000 to $22,499 | 16 (3.0%) | 15 (3.6%) |
| $22,500 to $24,999 | 18 (3.4%) | 19 (4.6%) |
| $25,000 to $29,999 | 53 (9.9%) | 53 (12.8%) |
| $30,000 to $34,999 | 8 (1.5%) | 23 (5.6%) |
| $35,000 to $39,999 | 20 (3.7%) | 82 (19.8%) |
| $40,000 to $44,999 | 40 (7.5%) | 10 (2.4%) |
| $45,000 to $49,999 | 53 (9.9%) | 6 (1.5%) |
| $50,000 to $54,999 | 37 (6.9%) | 3 (0.7%) |
| $55,000 to $64,999 | 60 (11.2%) | 43 (10.4%) |
| $65,000 to $74,999 | 92 (17.2%) | 14 (3.4%) |
| $75,000 to $99,999 | 10 (1.9%) | 9 (2.2%) |
| $100,000+ | 8 (1.5%) | 3 (0.7%) |
| Total | 534 (100.0%) | 414 (100.0%) |
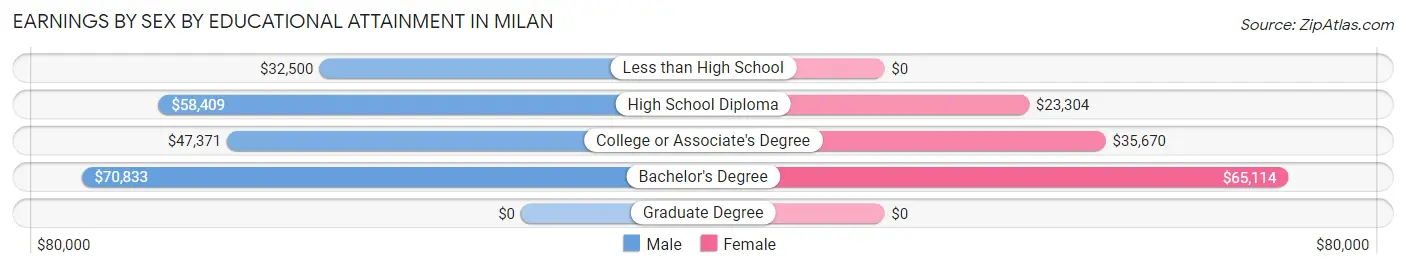
Earnings by Sex by Educational Attainment in Milan
Average earnings in Milan are $53,563 for men and $29,313 for women, a difference of 45.3%. Men with an educational attainment of bachelor's degree enjoy the highest average annual earnings of $70,833, while those with less than high school education earn the least with $32,500. Women with an educational attainment of bachelor's degree earn the most with the average annual earnings of $65,114, while those with high school diploma education have the smallest earnings of $23,304.
| Educational Attainment | Male Income | Female Income |
| Less than High School | $32,500 | $0 |
| High School Diploma | $58,409 | $23,304 |
| College or Associate's Degree | $47,371 | $35,670 |
| Bachelor's Degree | $70,833 | $65,114 |
| Graduate Degree | - | - |
| Total | $53,563 | $29,313 |
Family Income in Milan
Family Income Brackets in Milan
According to the Milan family income data, there are 120 families falling into the $50,000 to $74,999 income range, which is the most common income bracket and makes up 25.8% of all families.
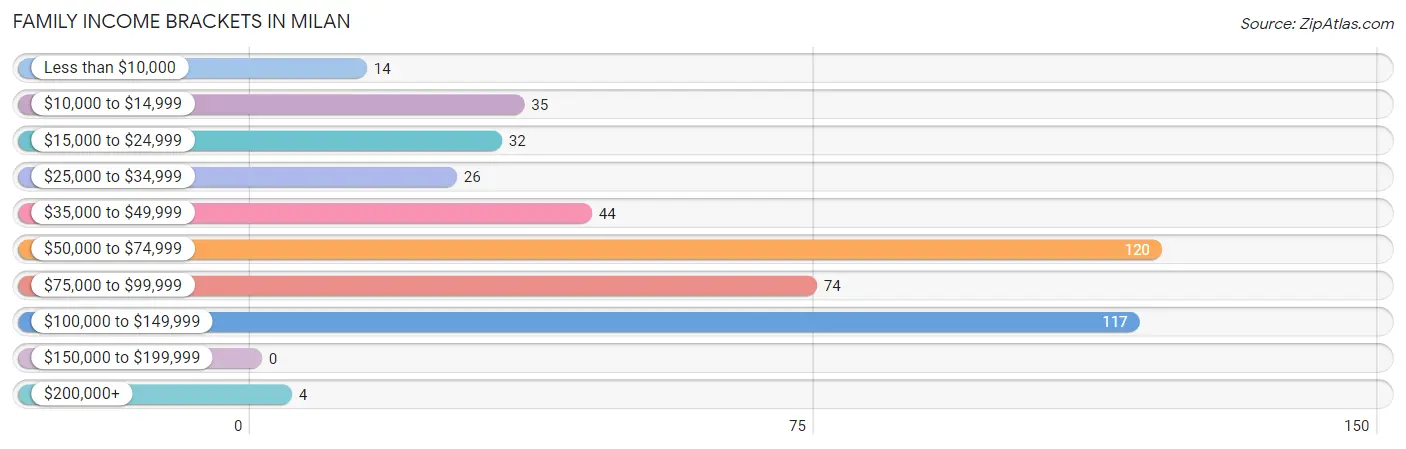
| Income Bracket | # Families | % Families |
| Less than $10,000 | 14 | 3.0% |
| $10,000 to $14,999 | 35 | 7.5% |
| $15,000 to $24,999 | 32 | 6.9% |
| $25,000 to $34,999 | 26 | 5.6% |
| $35,000 to $49,999 | 44 | 9.4% |
| $50,000 to $74,999 | 120 | 25.8% |
| $75,000 to $99,999 | 74 | 15.9% |
| $100,000 to $149,999 | 117 | 25.1% |
| $150,000 to $199,999 | 0 | 0.0% |
| $200,000+ | 4 | 0.9% |
Family Income by Famaliy Size in Milan
4-person families (110 | 23.6%) account for the highest median family income in Milan with $83,333 per family, while 2-person families (237 | 50.9%) have the highest median income of $32,125 per family member.
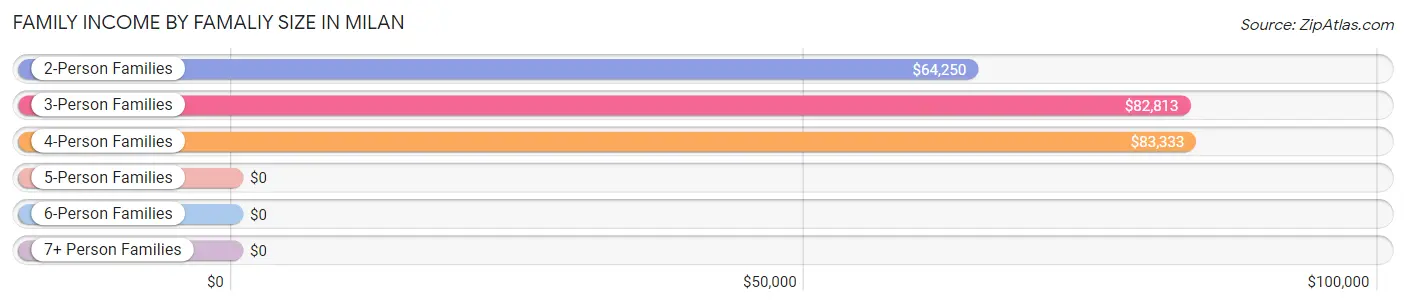
| Income Bracket | # Families | Median Income |
| 2-Person Families | 237 (50.9%) | $64,250 |
| 3-Person Families | 77 (16.5%) | $82,813 |
| 4-Person Families | 110 (23.6%) | $83,333 |
| 5-Person Families | 23 (4.9%) | $0 |
| 6-Person Families | 17 (3.6%) | $0 |
| 7+ Person Families | 2 (0.4%) | $0 |
| Total | 466 (100.0%) | $66,698 |
Family Income by Number of Earners in Milan
The median family income in Milan is $66,698, with families comprising 3+ earners (62) having the highest median family income of $125,385, while families with no earners (86) have the lowest median family income of $27,222, accounting for 13.3% and 18.4% of families, respectively.
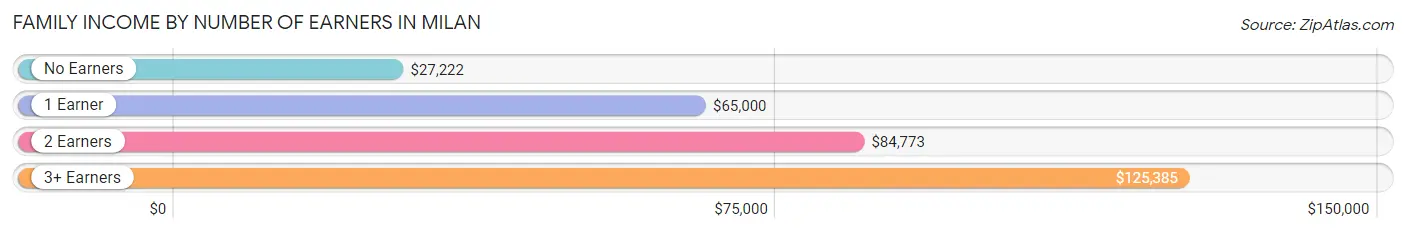
| Number of Earners | # Families | Median Income |
| No Earners | 86 (18.4%) | $27,222 |
| 1 Earner | 192 (41.2%) | $65,000 |
| 2 Earners | 126 (27.0%) | $84,773 |
| 3+ Earners | 62 (13.3%) | $125,385 |
| Total | 466 (100.0%) | $66,698 |
Household Income in Milan
Household Income Brackets in Milan
With 168 households falling in the category, the $50,000 to $74,999 income range is the most frequent in Milan, accounting for 23.2% of all households. In contrast, only 4 households (0.5%) fall into the $200,000+ income bracket, making it the least populous group.
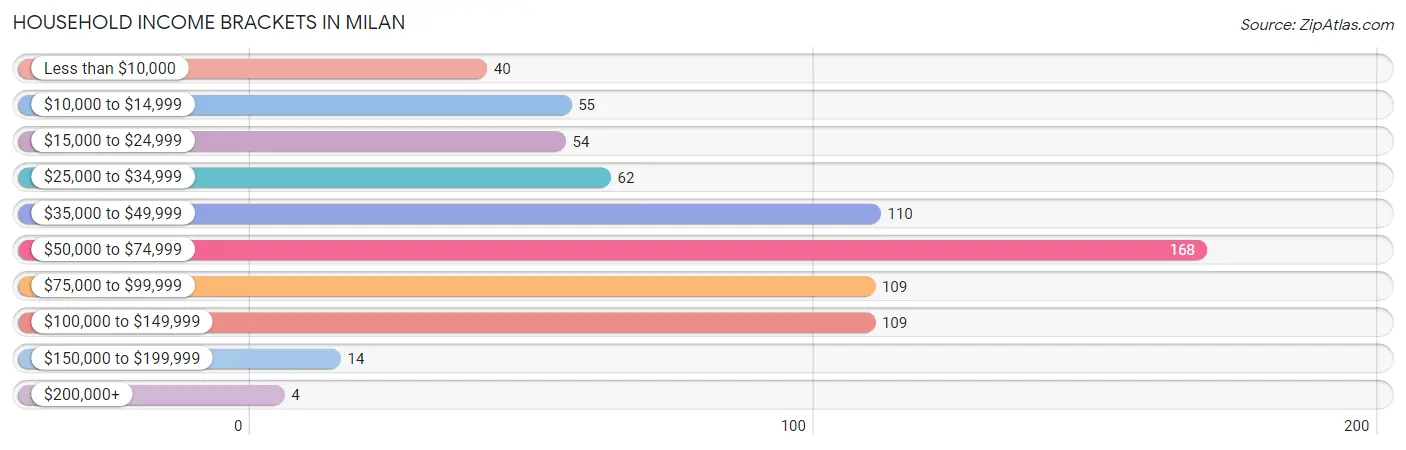
| Income Bracket | # Households | % Households |
| Less than $10,000 | 40 | 5.5% |
| $10,000 to $14,999 | 55 | 7.6% |
| $15,000 to $24,999 | 54 | 7.4% |
| $25,000 to $34,999 | 62 | 8.6% |
| $35,000 to $49,999 | 110 | 15.2% |
| $50,000 to $74,999 | 168 | 23.2% |
| $75,000 to $99,999 | 109 | 15.0% |
| $100,000 to $149,999 | 109 | 15.0% |
| $150,000 to $199,999 | 14 | 1.9% |
| $200,000+ | 4 | 0.6% |
Household Income by Householder Age in Milan
The median household income in Milan is $53,047, with the highest median household income of $66,719 found in the 45 to 64 years age bracket for the primary householder. A total of 260 households (35.9%) fall into this category. Meanwhile, the 65+ years age bracket for the primary householder has the lowest median household income of $35,682, with 230 households (31.7%) in this group.
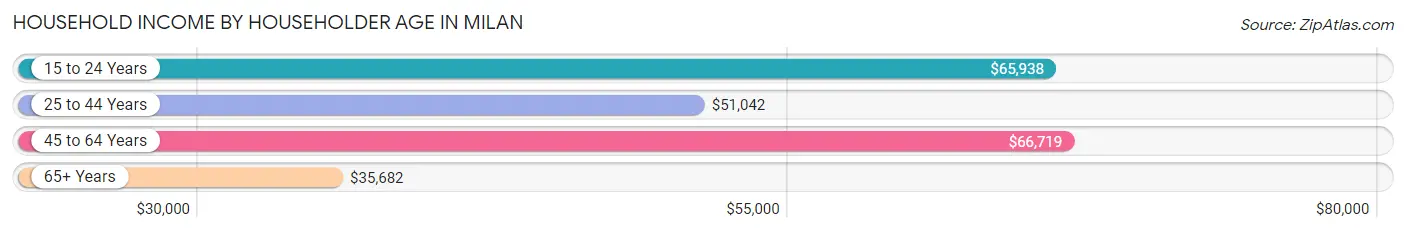
| Income Bracket | # Households | Median Income |
| 15 to 24 Years | 29 (4.0%) | $65,938 |
| 25 to 44 Years | 206 (28.4%) | $51,042 |
| 45 to 64 Years | 260 (35.9%) | $66,719 |
| 65+ Years | 230 (31.7%) | $35,682 |
| Total | 725 (100.0%) | $53,047 |
Poverty in Milan
Income Below Poverty by Sex and Age in Milan
With 15.3% poverty level for males and 21.2% for females among the residents of Milan, 12 to 14 year old males and 12 to 14 year old females are the most vulnerable to poverty, with 34 males (40.5%) and 36 females (49.3%) in their respective age groups living below the poverty level.
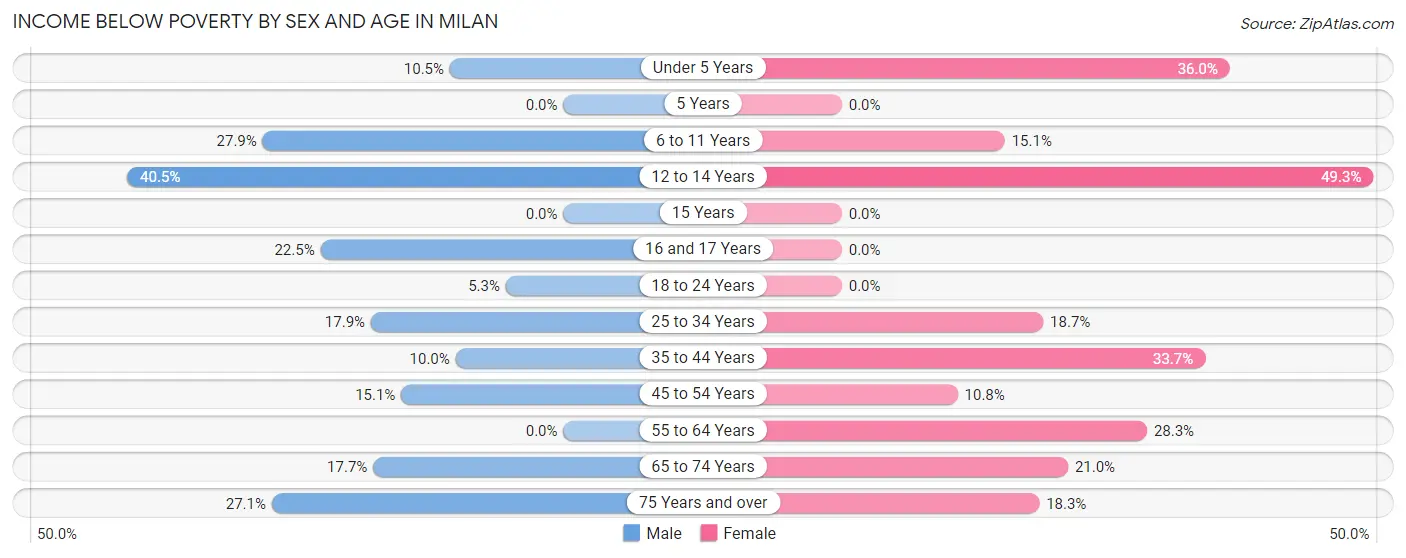
| Age Bracket | Male | Female |
| Under 5 Years | 4 (10.5%) | 9 (36.0%) |
| 5 Years | 0 (0.0%) | 0 (0.0%) |
| 6 to 11 Years | 12 (27.9%) | 13 (15.1%) |
| 12 to 14 Years | 34 (40.5%) | 36 (49.3%) |
| 15 Years | 0 (0.0%) | 0 (0.0%) |
| 16 and 17 Years | 16 (22.5%) | 0 (0.0%) |
| 18 to 24 Years | 7 (5.3%) | 0 (0.0%) |
| 25 to 34 Years | 10 (17.9%) | 20 (18.7%) |
| 35 to 44 Years | 13 (10.0%) | 30 (33.7%) |
| 45 to 54 Years | 14 (15.0%) | 20 (10.7%) |
| 55 to 64 Years | 0 (0.0%) | 32 (28.3%) |
| 65 to 74 Years | 9 (17.6%) | 17 (21.0%) |
| 75 Years and over | 23 (27.1%) | 24 (18.3%) |
| Total | 142 (15.3%) | 201 (21.2%) |
Income Above Poverty by Sex and Age in Milan
According to the poverty statistics in Milan, males aged 15 years and females aged 16 and 17 years are the age groups that are most secure financially, with 100.0% of males and 100.0% of females in these age groups living above the poverty line.
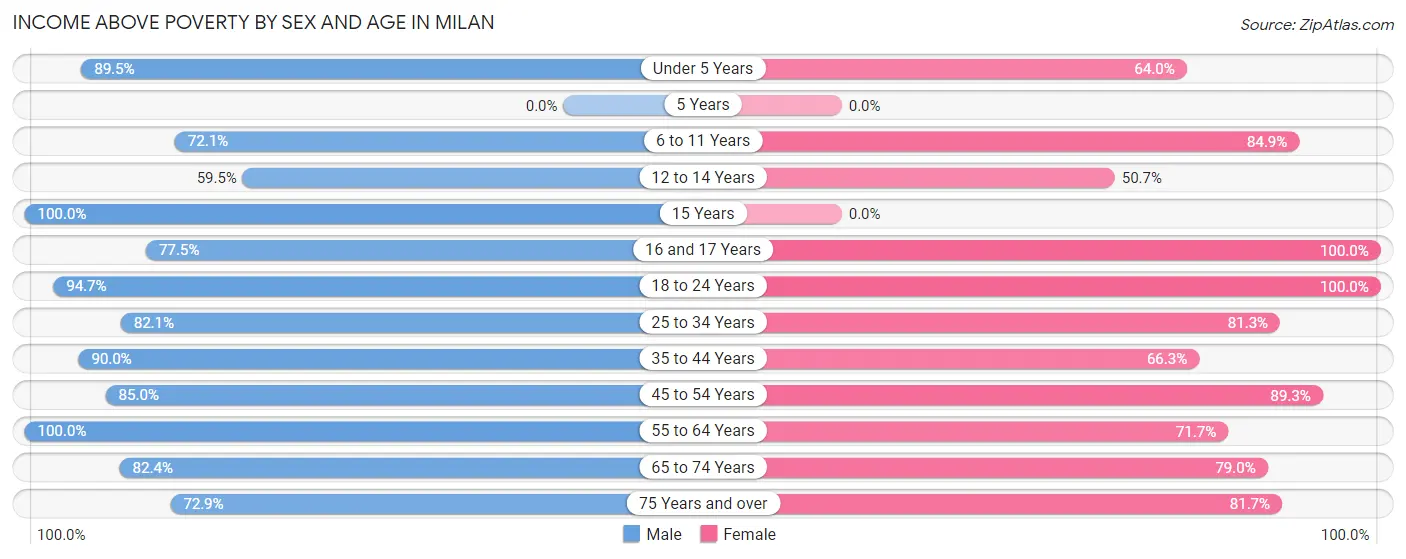
| Age Bracket | Male | Female |
| Under 5 Years | 34 (89.5%) | 16 (64.0%) |
| 5 Years | 0 (0.0%) | 0 (0.0%) |
| 6 to 11 Years | 31 (72.1%) | 73 (84.9%) |
| 12 to 14 Years | 50 (59.5%) | 37 (50.7%) |
| 15 Years | 6 (100.0%) | 0 (0.0%) |
| 16 and 17 Years | 55 (77.5%) | 15 (100.0%) |
| 18 to 24 Years | 124 (94.7%) | 44 (100.0%) |
| 25 to 34 Years | 46 (82.1%) | 87 (81.3%) |
| 35 to 44 Years | 117 (90.0%) | 59 (66.3%) |
| 45 to 54 Years | 79 (85.0%) | 166 (89.2%) |
| 55 to 64 Years | 137 (100.0%) | 81 (71.7%) |
| 65 to 74 Years | 42 (82.4%) | 64 (79.0%) |
| 75 Years and over | 62 (72.9%) | 107 (81.7%) |
| Total | 783 (84.7%) | 749 (78.8%) |
Income Below Poverty Among Married-Couple Families in Milan
The poverty statistics for married-couple families in Milan show that 7.7% or 27 of the total 349 families live below the poverty line. Families with 3 or 4 children have the highest poverty rate of 22.5%, comprising of 9 families. On the other hand, families with 1 or 2 children have the lowest poverty rate of 0.0%, which includes 0 families.
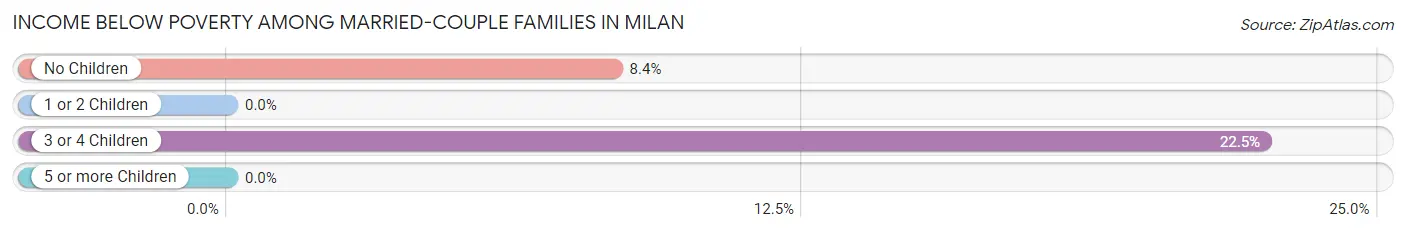
| Children | Above Poverty | Below Poverty |
| No Children | 197 (91.6%) | 18 (8.4%) |
| 1 or 2 Children | 94 (100.0%) | 0 (0.0%) |
| 3 or 4 Children | 31 (77.5%) | 9 (22.5%) |
| 5 or more Children | 0 (0.0%) | 0 (0.0%) |
| Total | 322 (92.3%) | 27 (7.7%) |
Income Below Poverty Among Single-Parent Households in Milan
According to the poverty data in Milan, 13.3% or 4 single-father households and 54.0% or 47 single-mother households are living below the poverty line. Among single-father households, those with 1 or 2 children have the highest poverty rate, with 4 households (18.2%) experiencing poverty. Likewise, among single-mother households, those with 3 or 4 children have the highest poverty rate, with 25 households (69.4%) falling below the poverty line.
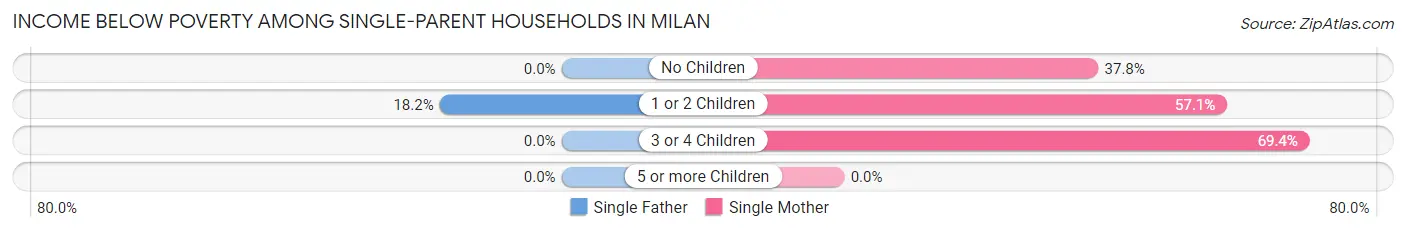
| Children | Single Father | Single Mother |
| No Children | 0 (0.0%) | 14 (37.8%) |
| 1 or 2 Children | 4 (18.2%) | 8 (57.1%) |
| 3 or 4 Children | 0 (0.0%) | 25 (69.4%) |
| 5 or more Children | 0 (0.0%) | 0 (0.0%) |
| Total | 4 (13.3%) | 47 (54.0%) |
Income Below Poverty Among Married-Couple vs Single-Parent Households in Milan
The poverty data for Milan shows that 27 of the married-couple family households (7.7%) and 51 of the single-parent households (43.6%) are living below the poverty level. Within the married-couple family households, those with 3 or 4 children have the highest poverty rate, with 9 households (22.5%) falling below the poverty line. Among the single-parent households, those with 3 or 4 children have the highest poverty rate, with 25 household (69.4%) living below poverty.
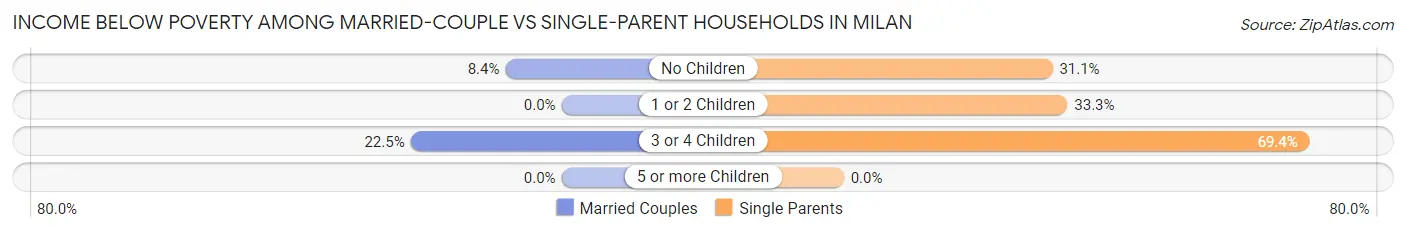
| Children | Married-Couple Families | Single-Parent Households |
| No Children | 18 (8.4%) | 14 (31.1%) |
| 1 or 2 Children | 0 (0.0%) | 12 (33.3%) |
| 3 or 4 Children | 9 (22.5%) | 25 (69.4%) |
| 5 or more Children | 0 (0.0%) | 0 (0.0%) |
| Total | 27 (7.7%) | 51 (43.6%) |
Race in Milan
The most populous races in Milan are White / Caucasian (1,863 | 94.0%), Asian (82 | 4.1%), and Two or more Races (31 | 1.6%).
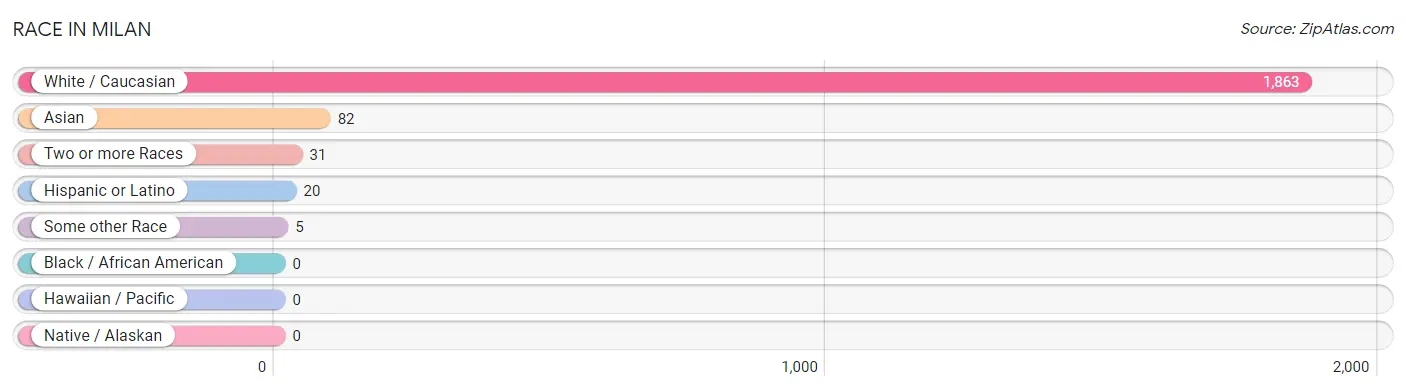
| Race | # Population | % Population |
| Asian | 82 | 4.1% |
| Black / African American | 0 | 0.0% |
| Hawaiian / Pacific | 0 | 0.0% |
| Hispanic or Latino | 20 | 1.0% |
| Native / Alaskan | 0 | 0.0% |
| White / Caucasian | 1,863 | 94.0% |
| Two or more Races | 31 | 1.6% |
| Some other Race | 5 | 0.3% |
| Total | 1,981 | 100.0% |
Ancestry in Milan
The most populous ancestries reported in Milan are German (365 | 18.4%), Irish (268 | 13.5%), American (225 | 11.4%), English (137 | 6.9%), and European (101 | 5.1%), together accounting for 55.3% of all Milan residents.
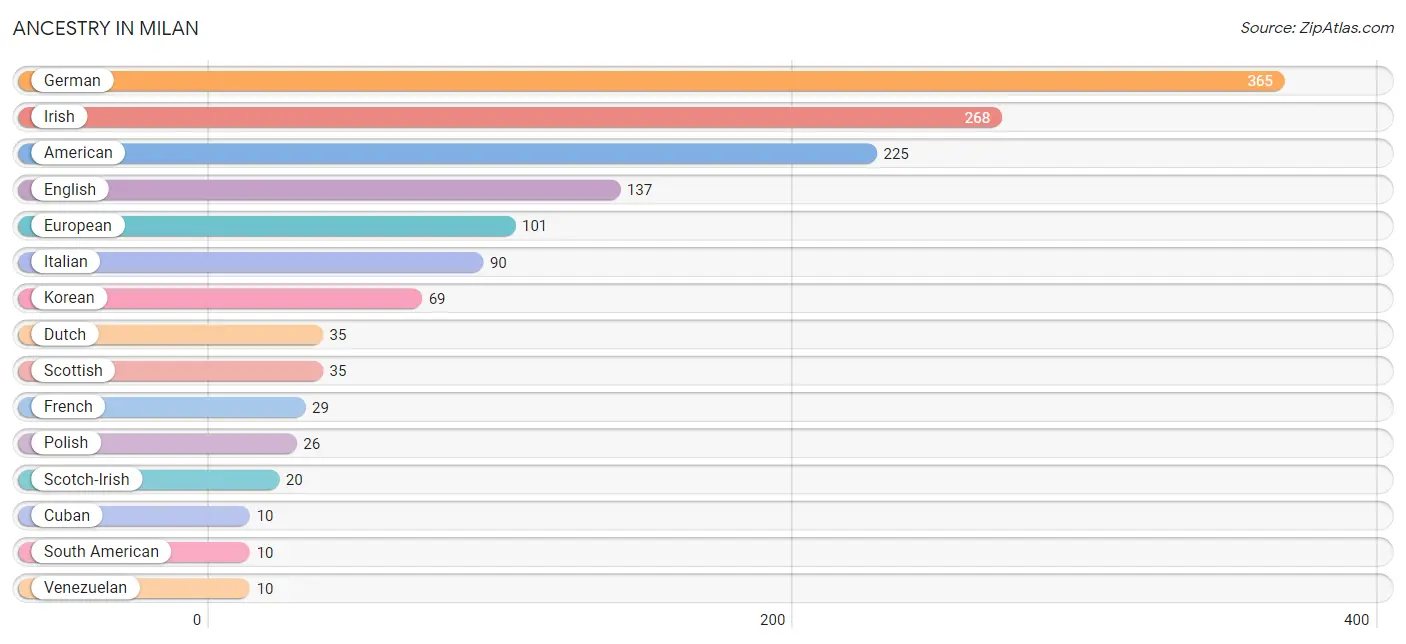
| Ancestry | # Population | % Population |
| African | 5 | 0.3% |
| American | 225 | 11.4% |
| Arab | 3 | 0.2% |
| Bhutanese | 8 | 0.4% |
| Blackfeet | 4 | 0.2% |
| Cherokee | 9 | 0.4% |
| Cheyenne | 4 | 0.2% |
| Cuban | 10 | 0.5% |
| Dutch | 35 | 1.8% |
| Eastern European | 1 | 0.1% |
| English | 137 | 6.9% |
| European | 101 | 5.1% |
| French | 29 | 1.5% |
| German | 365 | 18.4% |
| Hungarian | 4 | 0.2% |
| Irish | 268 | 13.5% |
| Italian | 90 | 4.5% |
| Korean | 69 | 3.5% |
| Lebanese | 3 | 0.2% |
| Norwegian | 1 | 0.1% |
| Polish | 26 | 1.3% |
| Scotch-Irish | 20 | 1.0% |
| Scottish | 35 | 1.8% |
| South American | 10 | 0.5% |
| Sri Lankan | 5 | 0.3% |
| Subsaharan African | 5 | 0.3% |
| Venezuelan | 10 | 0.5% | View All 27 Rows |
Immigrants in Milan
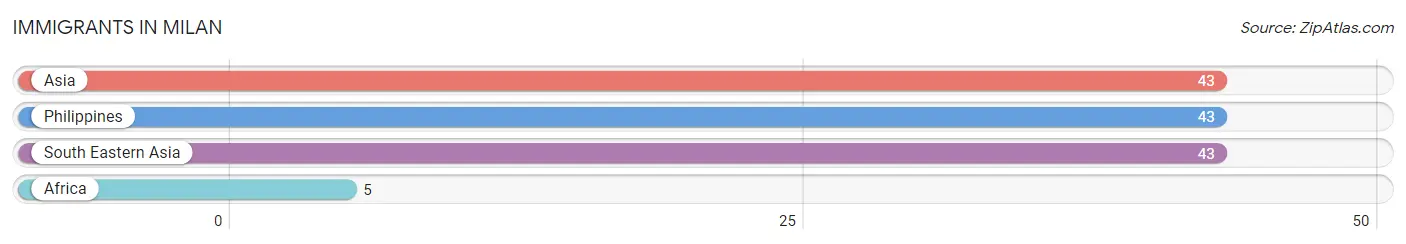
The most numerous immigrant groups reported in Milan came from Asia (43 | 2.2%), Philippines (43 | 2.2%), South Eastern Asia (43 | 2.2%), and Africa (5 | 0.3%), together accounting for 6.8% of all Milan residents.
| Immigration Origin | # Population | % Population |
| Africa | 5 | 0.3% |
| Asia | 43 | 2.2% |
| Philippines | 43 | 2.2% |
| South Eastern Asia | 43 | 2.2% | View All 4 Rows |
Sex and Age in Milan
Sex and Age in Milan
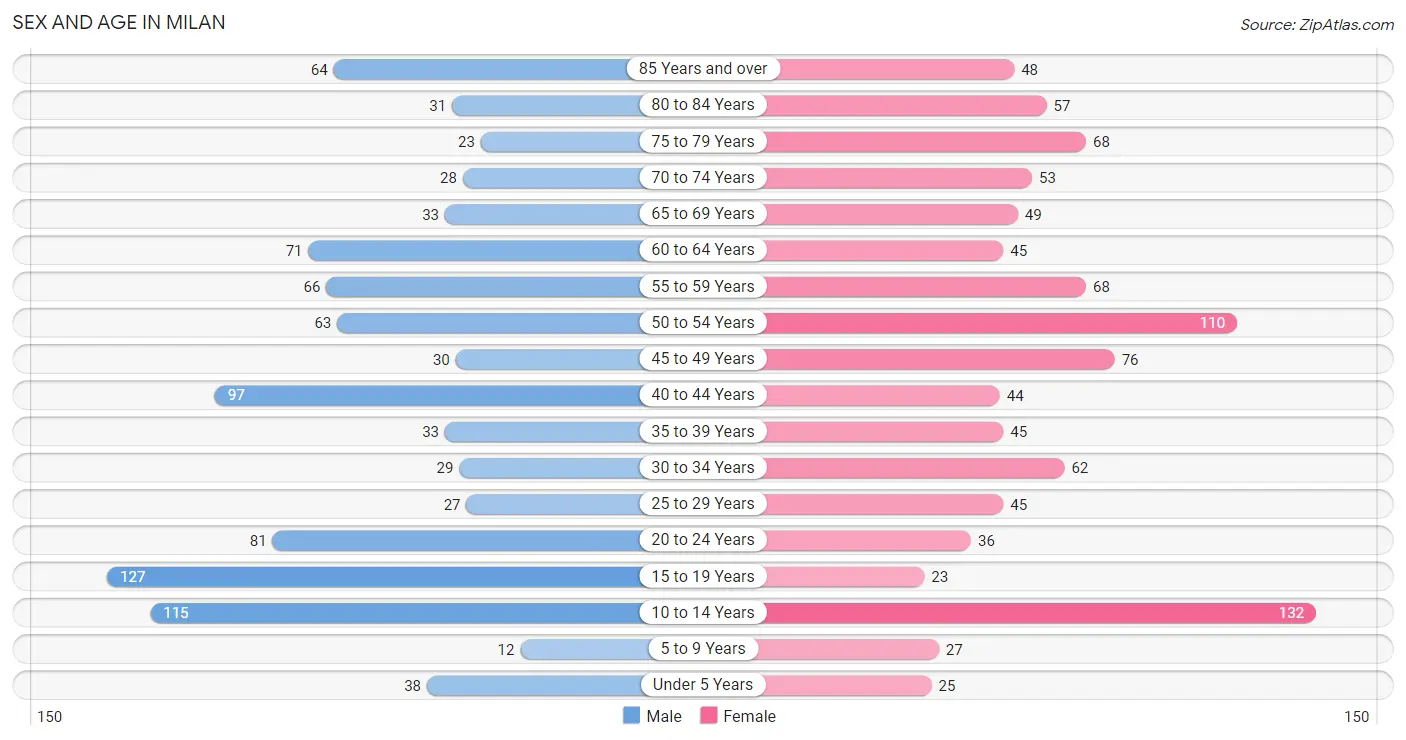
The most populous age groups in Milan are 15 to 19 Years (127 | 13.1%) for men and 10 to 14 Years (132 | 13.0%) for women.
| Age Bracket | Male | Female |
| Under 5 Years | 38 (3.9%) | 25 (2.5%) |
| 5 to 9 Years | 12 (1.2%) | 27 (2.7%) |
| 10 to 14 Years | 115 (11.9%) | 132 (13.0%) |
| 15 to 19 Years | 127 (13.1%) | 23 (2.3%) |
| 20 to 24 Years | 81 (8.4%) | 36 (3.5%) |
| 25 to 29 Years | 27 (2.8%) | 45 (4.4%) |
| 30 to 34 Years | 29 (3.0%) | 62 (6.1%) |
| 35 to 39 Years | 33 (3.4%) | 45 (4.4%) |
| 40 to 44 Years | 97 (10.0%) | 44 (4.3%) |
| 45 to 49 Years | 30 (3.1%) | 76 (7.5%) |
| 50 to 54 Years | 63 (6.5%) | 110 (10.9%) |
| 55 to 59 Years | 66 (6.8%) | 68 (6.7%) |
| 60 to 64 Years | 71 (7.3%) | 45 (4.4%) |
| 65 to 69 Years | 33 (3.4%) | 49 (4.8%) |
| 70 to 74 Years | 28 (2.9%) | 53 (5.2%) |
| 75 to 79 Years | 23 (2.4%) | 68 (6.7%) |
| 80 to 84 Years | 31 (3.2%) | 57 (5.6%) |
| 85 Years and over | 64 (6.6%) | 48 (4.7%) |
| Total | 968 (100.0%) | 1,013 (100.0%) |
Families and Households in Milan
Median Family Size in Milan
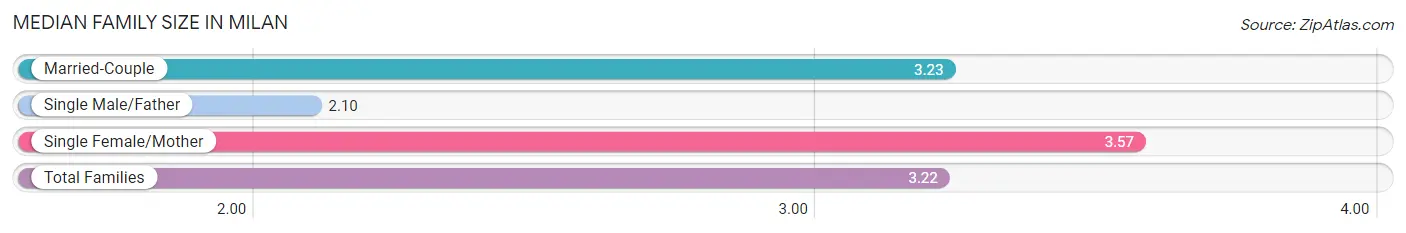
The median family size in Milan is 3.22 persons per family, with single female/mother families (87 | 18.7%) accounting for the largest median family size of 3.57 persons per family. On the other hand, single male/father families (30 | 6.4%) represent the smallest median family size with 2.10 persons per family.
| Family Type | # Families | Family Size |
| Married-Couple | 349 (74.9%) | 3.23 |
| Single Male/Father | 30 (6.4%) | 2.10 |
| Single Female/Mother | 87 (18.7%) | 3.57 |
| Total Families | 466 (100.0%) | 3.22 |
Median Household Size in Milan
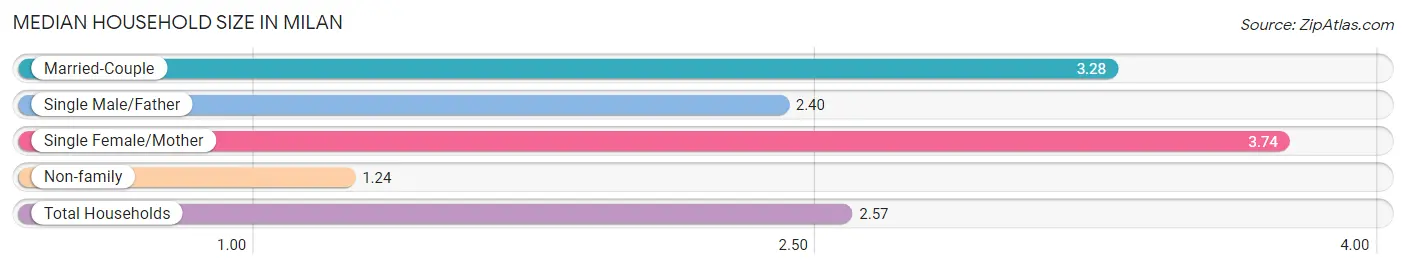
The median household size in Milan is 2.57 persons per household, with single female/mother households (87 | 12.0%) accounting for the largest median household size of 3.74 persons per household. non-family households (259 | 35.7%) represent the smallest median household size with 1.24 persons per household.
| Household Type | # Households | Household Size |
| Married-Couple | 349 (48.1%) | 3.28 |
| Single Male/Father | 30 (4.1%) | 2.40 |
| Single Female/Mother | 87 (12.0%) | 3.74 |
| Non-family | 259 (35.7%) | 1.24 |
| Total Households | 725 (100.0%) | 2.57 |
Household Size by Marriage Status in Milan
Out of a total of 725 households in Milan, 466 (64.3%) are family households, while 259 (35.7%) are nonfamily households. The most numerous type of family households are 2-person households, comprising 223, and the most common type of nonfamily households are 1-person households, comprising 203.
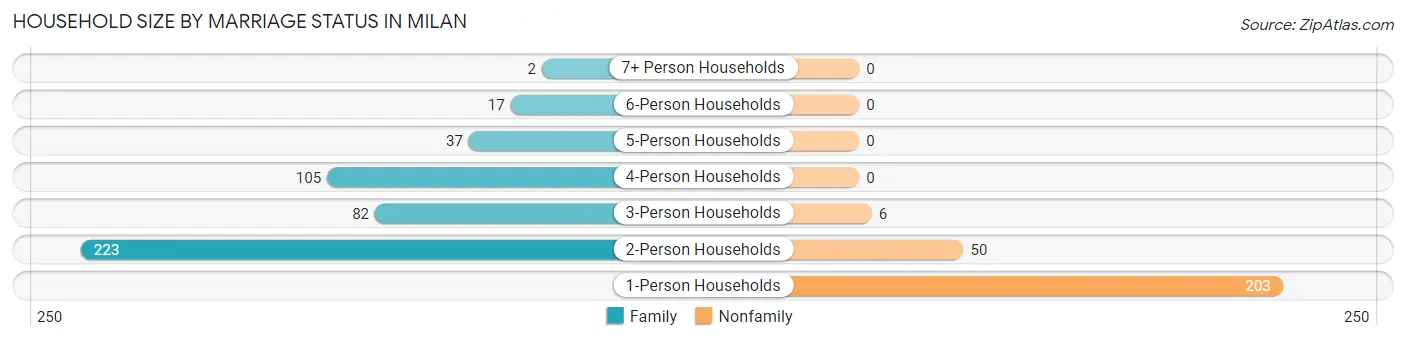
| Household Size | Family Households | Nonfamily Households |
| 1-Person Households | - | 203 (28.0%) |
| 2-Person Households | 223 (30.8%) | 50 (6.9%) |
| 3-Person Households | 82 (11.3%) | 6 (0.8%) |
| 4-Person Households | 105 (14.5%) | 0 (0.0%) |
| 5-Person Households | 37 (5.1%) | 0 (0.0%) |
| 6-Person Households | 17 (2.3%) | 0 (0.0%) |
| 7+ Person Households | 2 (0.3%) | 0 (0.0%) |
| Total | 466 (64.3%) | 259 (35.7%) |
Female Fertility in Milan
Fertility by Age in Milan
| Age Bracket | Women with Births | Births / 1,000 Women |
| 15 to 19 years | 0 (0.0%) | 0.0 |
| 20 to 34 years | 0 (0.0%) | 0.0 |
| 35 to 50 years | 0 (0.0%) | 0.0 |
| Total | 0 (0.0%) | 0.0 |
Fertility by Age by Marriage Status in Milan
| Age Bracket | Married | Unmarried |
| 15 to 19 years | 0 (0.0%) | 0 (0.0%) |
| 20 to 34 years | 0 (0.0%) | 0 (0.0%) |
| 35 to 50 years | 0 (0.0%) | 0 (0.0%) |
| Total | 0 (0.0%) | 0 (0.0%) |
Fertility by Education in Milan
| Educational Attainment | Women with Births | Births / 1,000 Women |
| Less than High School | 0 (0.0%) | 0.0 |
| High School Diploma | 0 (0.0%) | 0.0 |
| College or Associate's Degree | 0 (0.0%) | 0.0 |
| Bachelor's Degree | 0 (0.0%) | 0.0 |
| Graduate Degree | 0 (0.0%) | 0.0 |
| Total | 0 (0.0%) | 0.0 |
Fertility by Education by Marriage Status in Milan
| Educational Attainment | Married | Unmarried |
| Less than High School | 0 (0.0%) | 0 (0.0%) |
| High School Diploma | 0 (0.0%) | 0 (0.0%) |
| College or Associate's Degree | 0 (0.0%) | 0 (0.0%) |
| Bachelor's Degree | 0 (0.0%) | 0 (0.0%) |
| Graduate Degree | 0 (0.0%) | 0 (0.0%) |
| Total | 0 (0.0%) | 0 (0.0%) |
Employment Characteristics in Milan
Employment by Class of Employer in Milan
Among the 849 employed individuals in Milan, private company employees (738 | 86.9%), not-for-profit organizations (37 | 4.4%), and local government employees (26 | 3.1%) make up the most common classes of employment.
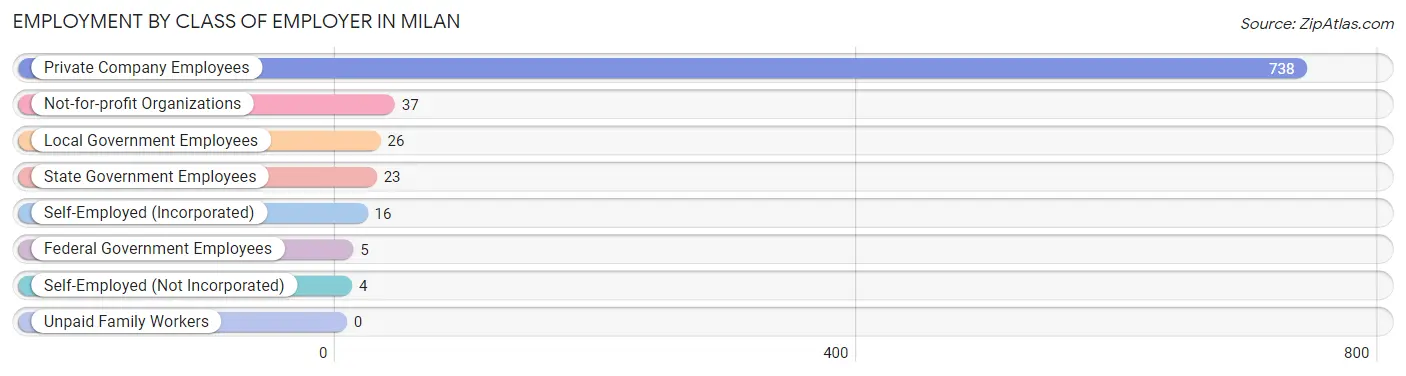
| Employer Class | # Employees | % Employees |
| Private Company Employees | 738 | 86.9% |
| Self-Employed (Incorporated) | 16 | 1.9% |
| Self-Employed (Not Incorporated) | 4 | 0.5% |
| Not-for-profit Organizations | 37 | 4.4% |
| Local Government Employees | 26 | 3.1% |
| State Government Employees | 23 | 2.7% |
| Federal Government Employees | 5 | 0.6% |
| Unpaid Family Workers | 0 | 0.0% |
| Total | 849 | 100.0% |
Employment Status by Age in Milan
According to the labor force statistics for Milan, out of the total population over 16 years of age (1,626), 54.5% or 886 individuals are in the labor force, with 3.7% or 33 of them unemployed. The age group with the highest labor force participation rate is 30 to 34 years, with 95.6% or 87 individuals in the labor force. Within the labor force, the 16 to 19 years age range has the highest percentage of unemployed individuals, with 16.9% or 15 of them being unemployed.
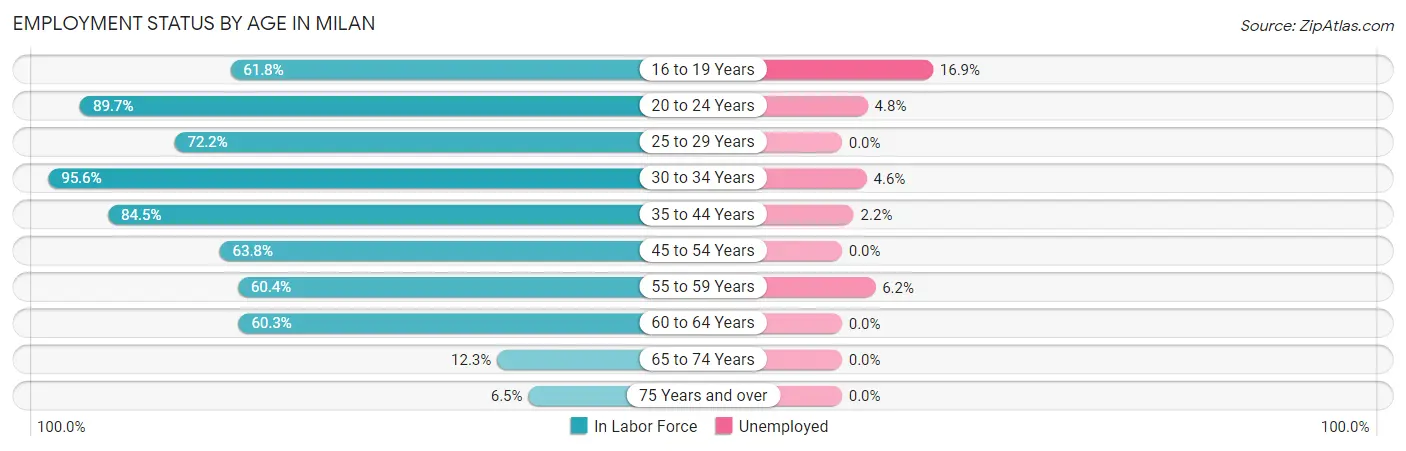
| Age Bracket | In Labor Force | Unemployed |
| 16 to 19 Years | 89 (61.8%) | 15 (16.9%) |
| 20 to 24 Years | 105 (89.7%) | 5 (4.8%) |
| 25 to 29 Years | 52 (72.2%) | 0 (0.0%) |
| 30 to 34 Years | 87 (95.6%) | 4 (4.6%) |
| 35 to 44 Years | 185 (84.5%) | 4 (2.2%) |
| 45 to 54 Years | 178 (63.8%) | 0 (0.0%) |
| 55 to 59 Years | 81 (60.4%) | 5 (6.2%) |
| 60 to 64 Years | 70 (60.3%) | 0 (0.0%) |
| 65 to 74 Years | 20 (12.3%) | 0 (0.0%) |
| 75 Years and over | 19 (6.5%) | 0 (0.0%) |
| Total | 886 (54.5%) | 33 (3.7%) |
Employment Status by Educational Attainment in Milan
According to labor force statistics for Milan, 71.7% of individuals (653) out of the total population between 25 and 64 years of age (911) are in the labor force, with 2.0% or 13 of them being unemployed. The group with the highest labor force participation rate are those with the educational attainment of bachelor's degree or higher, with 89.2% or 66 individuals in the labor force. Within the labor force, individuals with less than high school education have the highest percentage of unemployment, with 22.2% or 4 of them being unemployed.
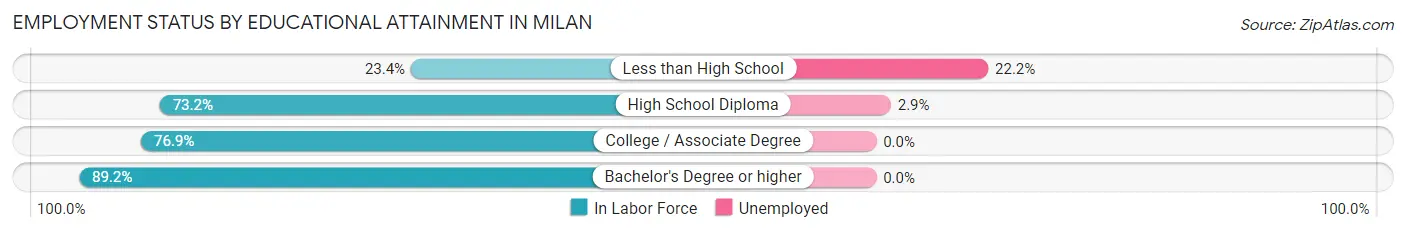
| Educational Attainment | In Labor Force | Unemployed |
| Less than High School | 18 (23.4%) | 17 (22.2%) |
| High School Diploma | 312 (73.2%) | 12 (2.9%) |
| College / Associate Degree | 257 (76.9%) | 0 (0.0%) |
| Bachelor's Degree or higher | 66 (89.2%) | 0 (0.0%) |
| Total | 653 (71.7%) | 18 (2.0%) |
Employment Occupations by Sex in Milan
Management, Business, Science and Arts Occupations
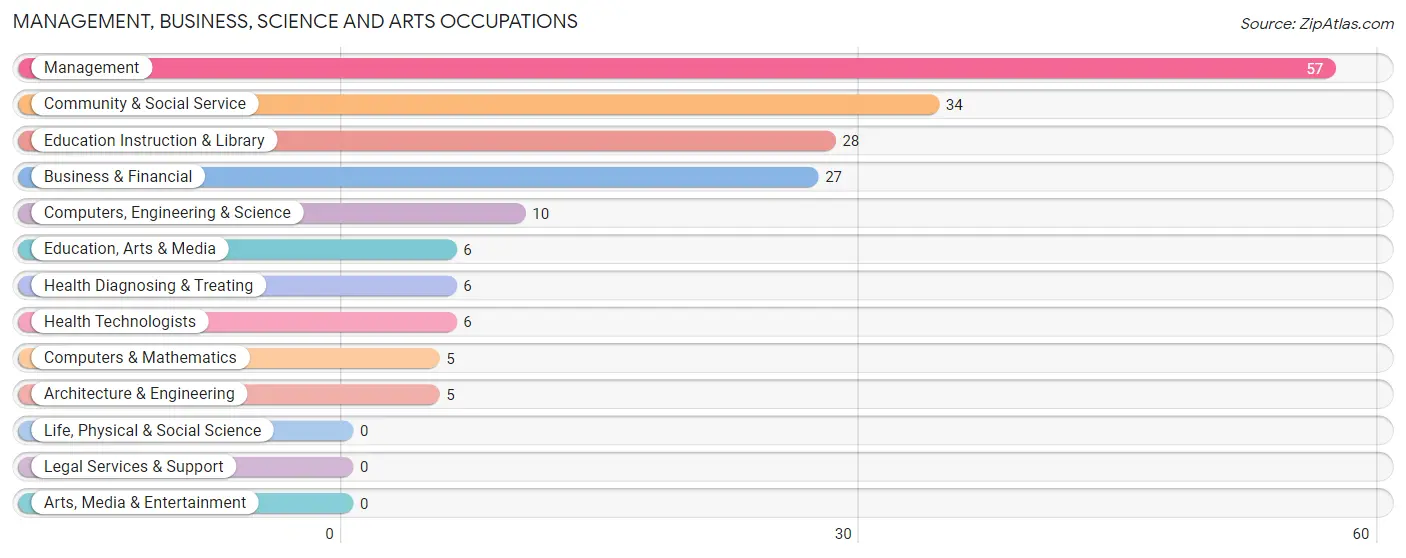
The most common Management, Business, Science and Arts occupations in Milan are Management (57 | 6.7%), Community & Social Service (34 | 4.0%), Education Instruction & Library (28 | 3.3%), Business & Financial (27 | 3.2%), and Computers, Engineering & Science (10 | 1.2%).
Management, Business, Science and Arts Occupations by Sex
Within the Management, Business, Science and Arts occupations in Milan, the most male-oriented occupations are Business & Financial (100.0%), Computers, Engineering & Science (100.0%), and Computers & Mathematics (100.0%), while the most female-oriented occupations are Community & Social Service (100.0%), Education, Arts & Media (100.0%), and Education Instruction & Library (100.0%).
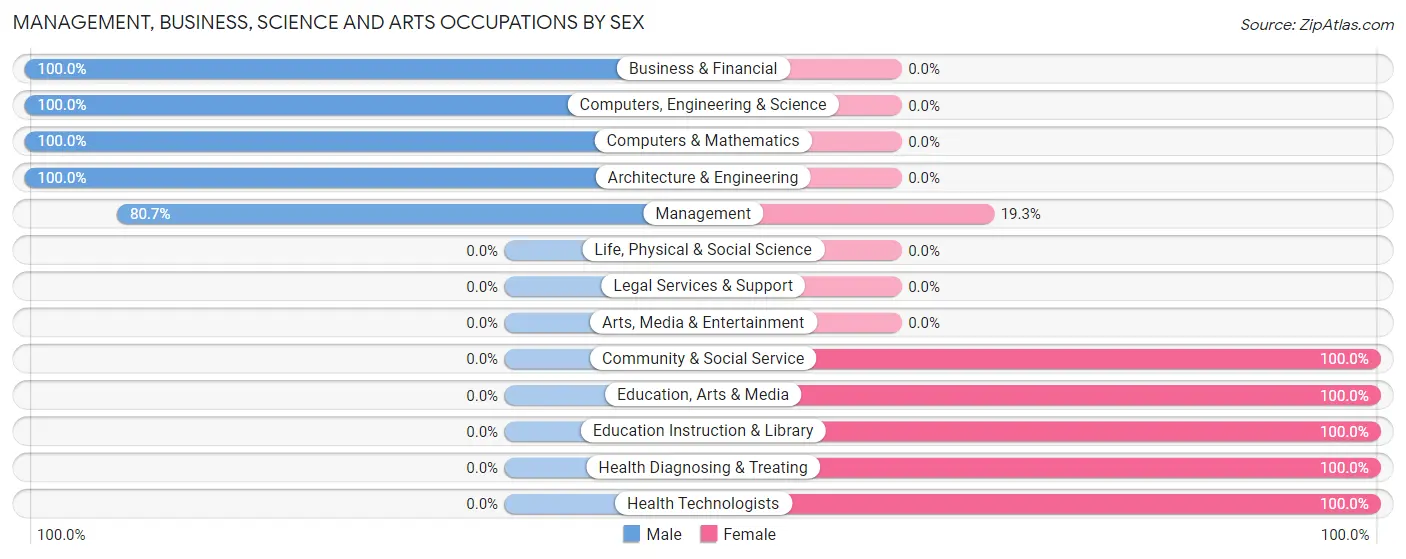
| Occupation | Male | Female |
| Management | 46 (80.7%) | 11 (19.3%) |
| Business & Financial | 27 (100.0%) | 0 (0.0%) |
| Computers, Engineering & Science | 10 (100.0%) | 0 (0.0%) |
| Computers & Mathematics | 5 (100.0%) | 0 (0.0%) |
| Architecture & Engineering | 5 (100.0%) | 0 (0.0%) |
| Life, Physical & Social Science | 0 (0.0%) | 0 (0.0%) |
| Community & Social Service | 0 (0.0%) | 34 (100.0%) |
| Education, Arts & Media | 0 (0.0%) | 6 (100.0%) |
| Legal Services & Support | 0 (0.0%) | 0 (0.0%) |
| Education Instruction & Library | 0 (0.0%) | 28 (100.0%) |
| Arts, Media & Entertainment | 0 (0.0%) | 0 (0.0%) |
| Health Diagnosing & Treating | 0 (0.0%) | 6 (100.0%) |
| Health Technologists | 0 (0.0%) | 6 (100.0%) |
| Total (Category) | 83 (61.9%) | 51 (38.1%) |
| Total (Overall) | 491 (57.6%) | 362 (42.4%) |
Services Occupations
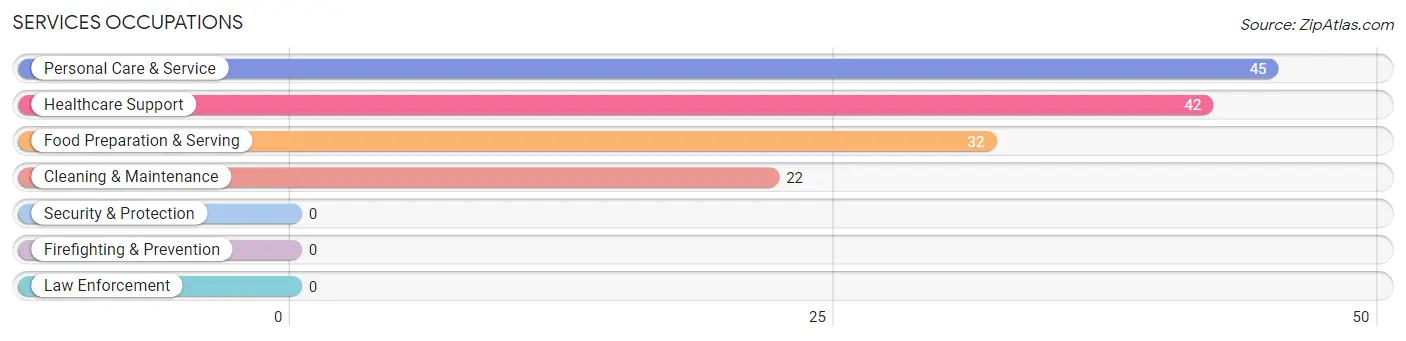
The most common Services occupations in Milan are Personal Care & Service (45 | 5.3%), Healthcare Support (42 | 4.9%), Food Preparation & Serving (32 | 3.7%), and Cleaning & Maintenance (22 | 2.6%).
Services Occupations by Sex
Within the Services occupations in Milan, the most male-oriented occupations are Cleaning & Maintenance (59.1%), Healthcare Support (11.9%), and Food Preparation & Serving (3.1%), while the most female-oriented occupations are Personal Care & Service (100.0%), Food Preparation & Serving (96.9%), and Healthcare Support (88.1%).
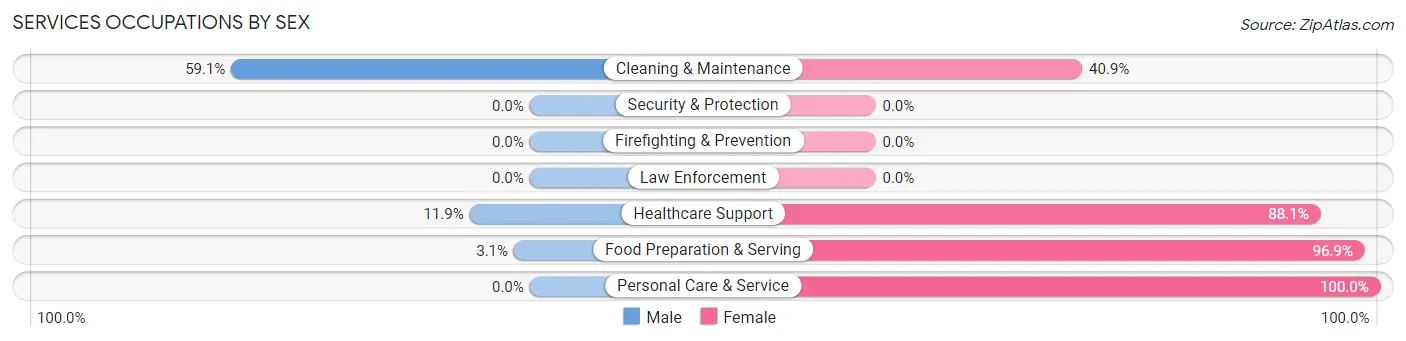
| Occupation | Male | Female |
| Healthcare Support | 5 (11.9%) | 37 (88.1%) |
| Security & Protection | 0 (0.0%) | 0 (0.0%) |
| Firefighting & Prevention | 0 (0.0%) | 0 (0.0%) |
| Law Enforcement | 0 (0.0%) | 0 (0.0%) |
| Food Preparation & Serving | 1 (3.1%) | 31 (96.9%) |
| Cleaning & Maintenance | 13 (59.1%) | 9 (40.9%) |
| Personal Care & Service | 0 (0.0%) | 45 (100.0%) |
| Total (Category) | 19 (13.5%) | 122 (86.5%) |
| Total (Overall) | 491 (57.6%) | 362 (42.4%) |
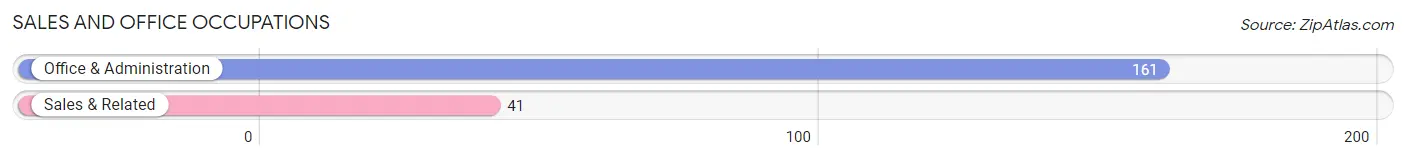
Sales and Office Occupations
The most common Sales and Office occupations in Milan are Office & Administration (161 | 18.9%), and Sales & Related (41 | 4.8%).
Sales and Office Occupations by Sex
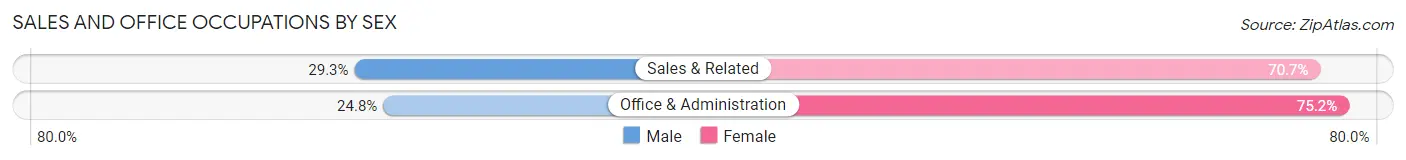
| Occupation | Male | Female |
| Sales & Related | 12 (29.3%) | 29 (70.7%) |
| Office & Administration | 40 (24.8%) | 121 (75.2%) |
| Total (Category) | 52 (25.7%) | 150 (74.3%) |
| Total (Overall) | 491 (57.6%) | 362 (42.4%) |
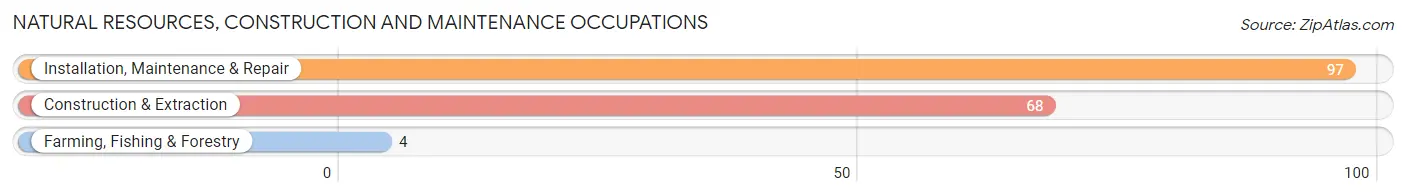
Natural Resources, Construction and Maintenance Occupations
The most common Natural Resources, Construction and Maintenance occupations in Milan are Installation, Maintenance & Repair (97 | 11.4%), Construction & Extraction (68 | 8.0%), and Farming, Fishing & Forestry (4 | 0.5%).
Natural Resources, Construction and Maintenance Occupations by Sex
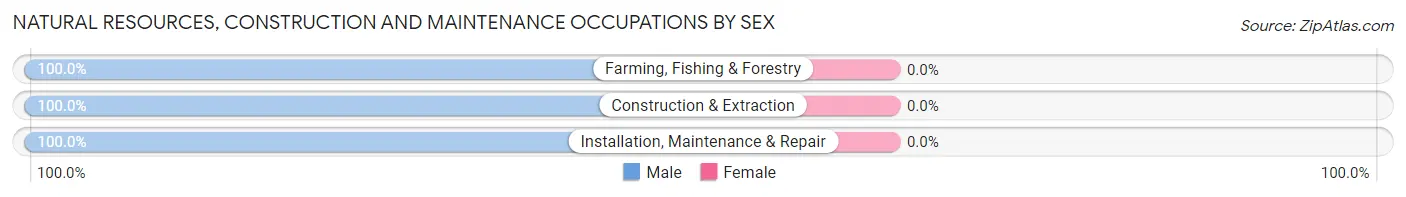
| Occupation | Male | Female |
| Farming, Fishing & Forestry | 4 (100.0%) | 0 (0.0%) |
| Construction & Extraction | 68 (100.0%) | 0 (0.0%) |
| Installation, Maintenance & Repair | 97 (100.0%) | 0 (0.0%) |
| Total (Category) | 169 (100.0%) | 0 (0.0%) |
| Total (Overall) | 491 (57.6%) | 362 (42.4%) |
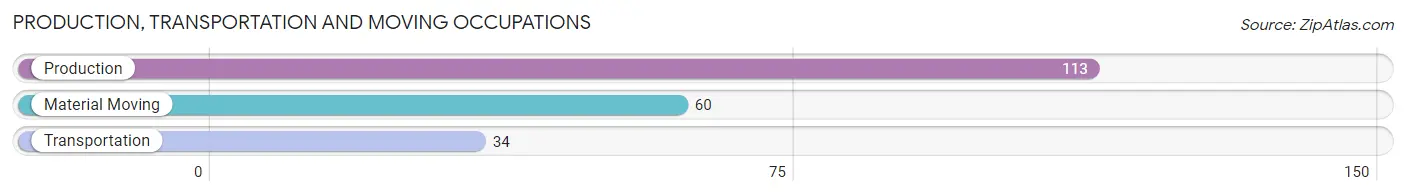
Production, Transportation and Moving Occupations
The most common Production, Transportation and Moving occupations in Milan are Production (113 | 13.3%), Material Moving (60 | 7.0%), and Transportation (34 | 4.0%).
Production, Transportation and Moving Occupations by Sex
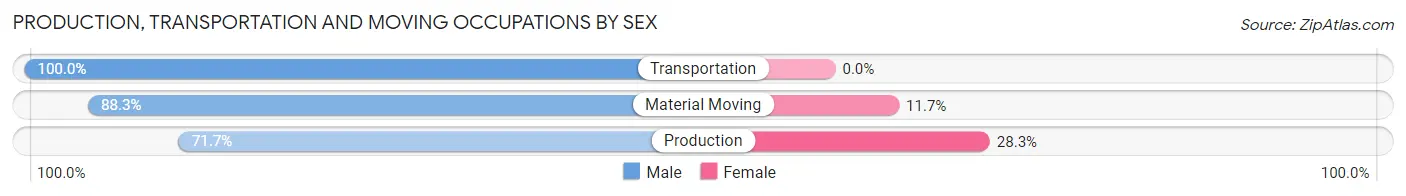
| Occupation | Male | Female |
| Production | 81 (71.7%) | 32 (28.3%) |
| Transportation | 34 (100.0%) | 0 (0.0%) |
| Material Moving | 53 (88.3%) | 7 (11.7%) |
| Total (Category) | 168 (81.2%) | 39 (18.8%) |
| Total (Overall) | 491 (57.6%) | 362 (42.4%) |
Employment Industries by Sex in Milan
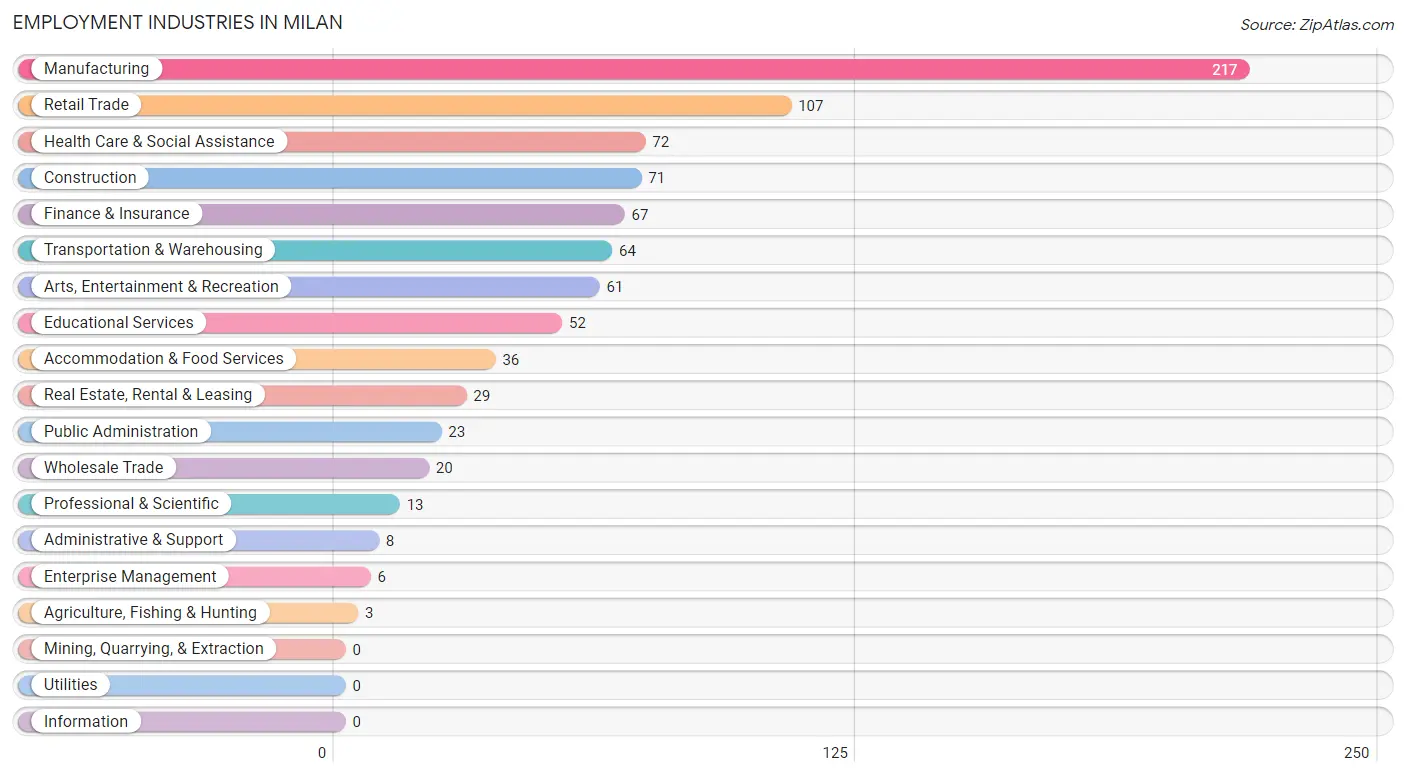
Employment Industries in Milan
The major employment industries in Milan include Manufacturing (217 | 25.4%), Retail Trade (107 | 12.5%), Health Care & Social Assistance (72 | 8.4%), Construction (71 | 8.3%), and Finance & Insurance (67 | 7.9%).
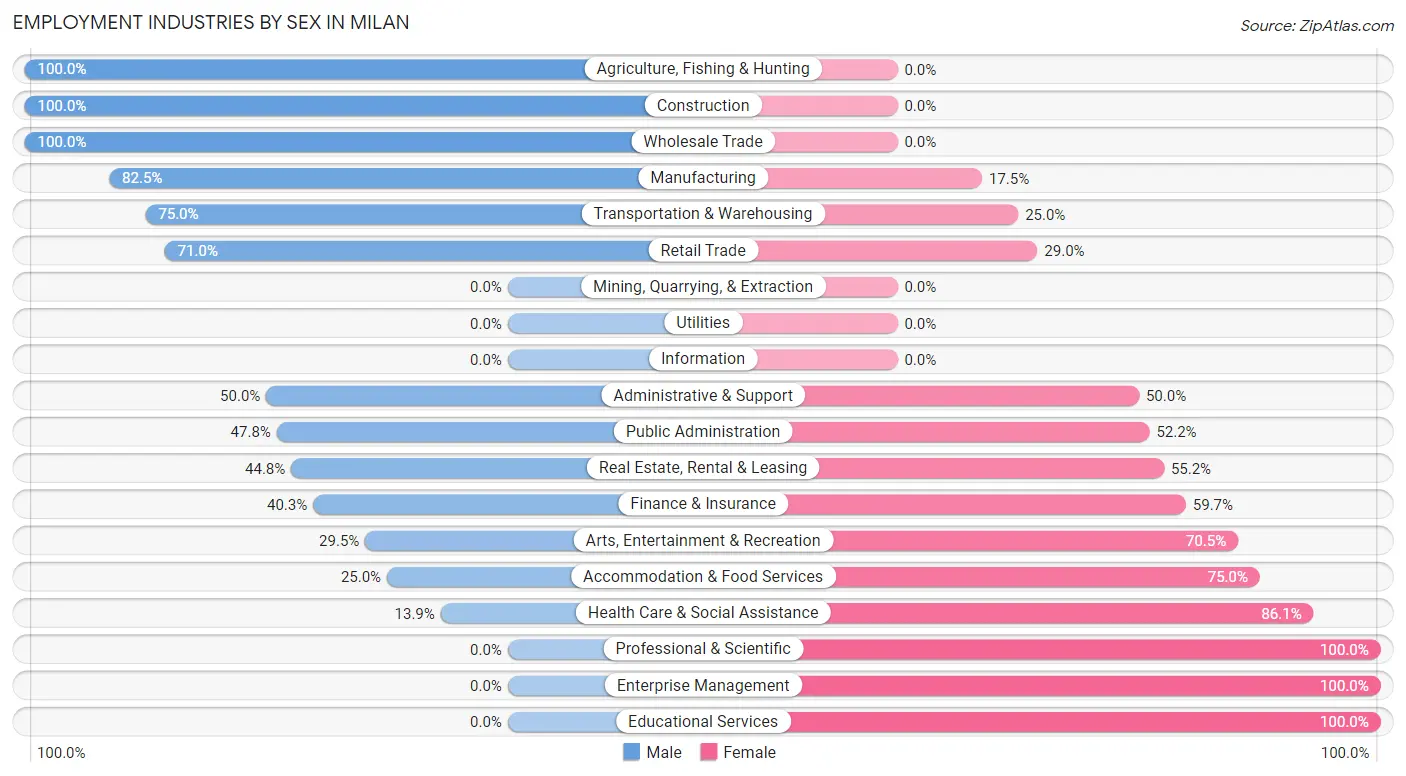
Employment Industries by Sex in Milan
The Milan industries that see more men than women are Agriculture, Fishing & Hunting (100.0%), Construction (100.0%), and Wholesale Trade (100.0%), whereas the industries that tend to have a higher number of women are Professional & Scientific (100.0%), Enterprise Management (100.0%), and Educational Services (100.0%).
| Industry | Male | Female |
| Agriculture, Fishing & Hunting | 3 (100.0%) | 0 (0.0%) |
| Mining, Quarrying, & Extraction | 0 (0.0%) | 0 (0.0%) |
| Construction | 71 (100.0%) | 0 (0.0%) |
| Manufacturing | 179 (82.5%) | 38 (17.5%) |
| Wholesale Trade | 20 (100.0%) | 0 (0.0%) |
| Retail Trade | 76 (71.0%) | 31 (29.0%) |
| Transportation & Warehousing | 48 (75.0%) | 16 (25.0%) |
| Utilities | 0 (0.0%) | 0 (0.0%) |
| Information | 0 (0.0%) | 0 (0.0%) |
| Finance & Insurance | 27 (40.3%) | 40 (59.7%) |
| Real Estate, Rental & Leasing | 13 (44.8%) | 16 (55.2%) |
| Professional & Scientific | 0 (0.0%) | 13 (100.0%) |
| Enterprise Management | 0 (0.0%) | 6 (100.0%) |
| Administrative & Support | 4 (50.0%) | 4 (50.0%) |
| Educational Services | 0 (0.0%) | 52 (100.0%) |
| Health Care & Social Assistance | 10 (13.9%) | 62 (86.1%) |
| Arts, Entertainment & Recreation | 18 (29.5%) | 43 (70.5%) |
| Accommodation & Food Services | 9 (25.0%) | 27 (75.0%) |
| Public Administration | 11 (47.8%) | 12 (52.2%) |
| Total | 491 (57.6%) | 362 (42.4%) |
Education in Milan
School Enrollment in Milan
The most common levels of schooling among the 387 students in Milan are middle school (214 | 55.3%), high school (108 | 27.9%), and elementary school (39 | 10.1%).
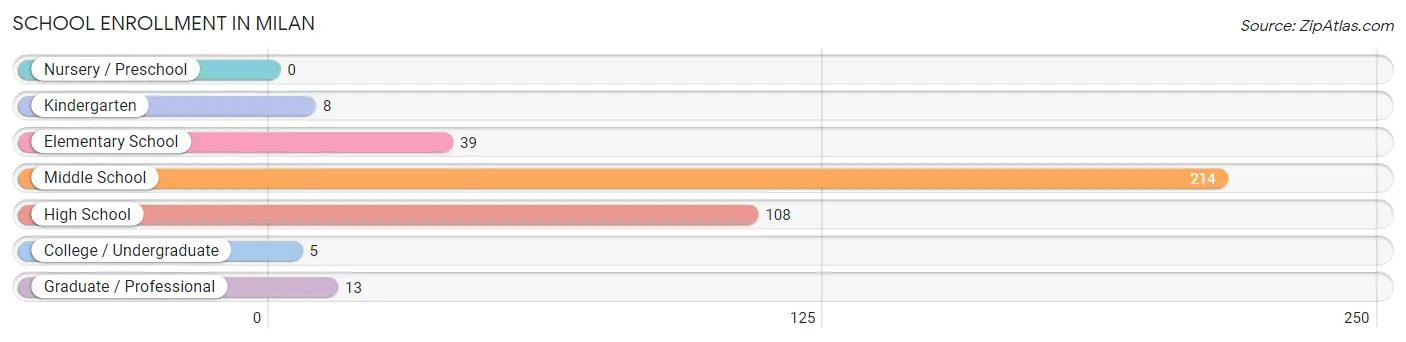
| School Level | # Students | % Students |
| Nursery / Preschool | 0 | 0.0% |
| Kindergarten | 8 | 2.1% |
| Elementary School | 39 | 10.1% |
| Middle School | 214 | 55.3% |
| High School | 108 | 27.9% |
| College / Undergraduate | 5 | 1.3% |
| Graduate / Professional | 13 | 3.4% |
| Total | 387 | 100.0% |
School Enrollment by Age by Funding Source in Milan
Out of a total of 387 students who are enrolled in schools in Milan, 4 (1.0%) attend a private institution, while the remaining 383 (99.0%) are enrolled in public schools. The age group of 10 to 14 year olds has the highest likelihood of being enrolled in private schools, with 4 (1.7% in the age bracket) enrolled. Conversely, the age group of 5 to 9 year old has the lowest likelihood of being enrolled in a private school, with 39 (100.0% in the age bracket) attending a public institution.
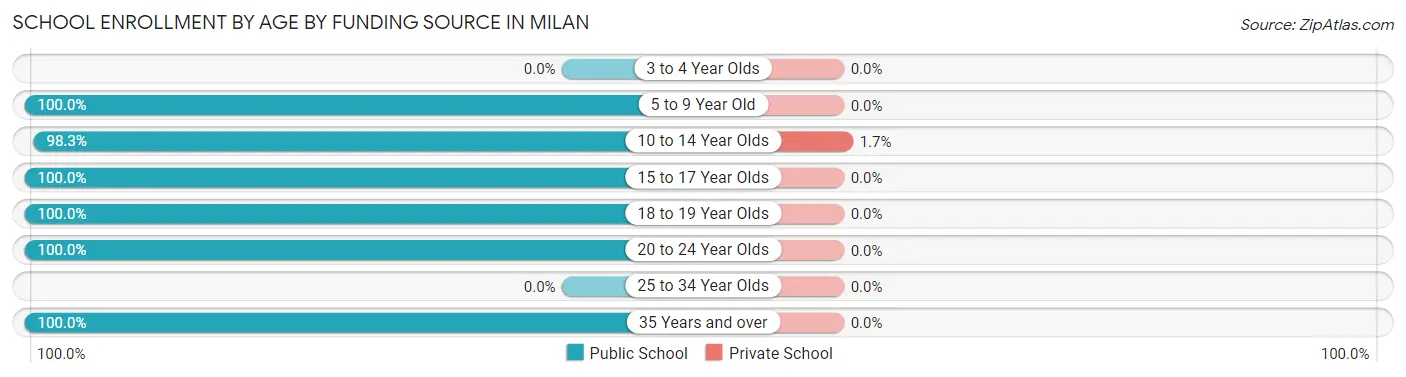
| Age Bracket | Public School | Private School |
| 3 to 4 Year Olds | 0 (0.0%) | 0 (0.0%) |
| 5 to 9 Year Old | 39 (100.0%) | 0 (0.0%) |
| 10 to 14 Year Olds | 234 (98.3%) | 4 (1.7%) |
| 15 to 17 Year Olds | 81 (100.0%) | 0 (0.0%) |
| 18 to 19 Year Olds | 11 (100.0%) | 0 (0.0%) |
| 20 to 24 Year Olds | 12 (100.0%) | 0 (0.0%) |
| 25 to 34 Year Olds | 0 (0.0%) | 0 (0.0%) |
| 35 Years and over | 6 (100.0%) | 0 (0.0%) |
| Total | 383 (99.0%) | 4 (1.0%) |
Educational Attainment by Field of Study in Milan
Education (41 | 29.5%), arts & humanities (25 | 18.0%), business (18 | 13.0%), science & technology (17 | 12.2%), and visual & performing arts (11 | 7.9%) are the most common fields of study among 139 individuals in Milan who have obtained a bachelor's degree or higher.
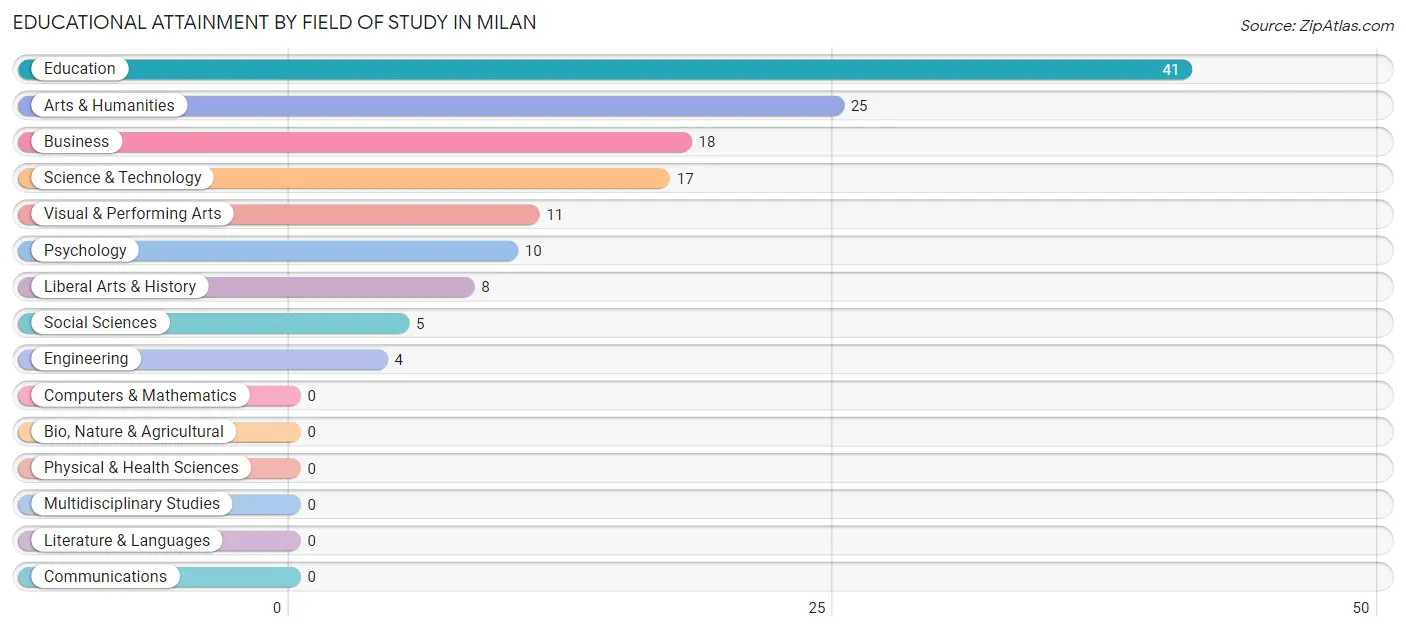
| Field of Study | # Graduates | % Graduates |
| Computers & Mathematics | 0 | 0.0% |
| Bio, Nature & Agricultural | 0 | 0.0% |
| Physical & Health Sciences | 0 | 0.0% |
| Psychology | 10 | 7.2% |
| Social Sciences | 5 | 3.6% |
| Engineering | 4 | 2.9% |
| Multidisciplinary Studies | 0 | 0.0% |
| Science & Technology | 17 | 12.2% |
| Business | 18 | 13.0% |
| Education | 41 | 29.5% |
| Literature & Languages | 0 | 0.0% |
| Liberal Arts & History | 8 | 5.8% |
| Visual & Performing Arts | 11 | 7.9% |
| Communications | 0 | 0.0% |
| Arts & Humanities | 25 | 18.0% |
| Total | 139 | 100.0% |
Transportation & Commute in Milan
Vehicle Availability by Sex in Milan
The most prevalent vehicle ownership categories in Milan are males with 3 vehicles (120, accounting for 24.7%) and females with 3 vehicles (72, making up 33.2%).
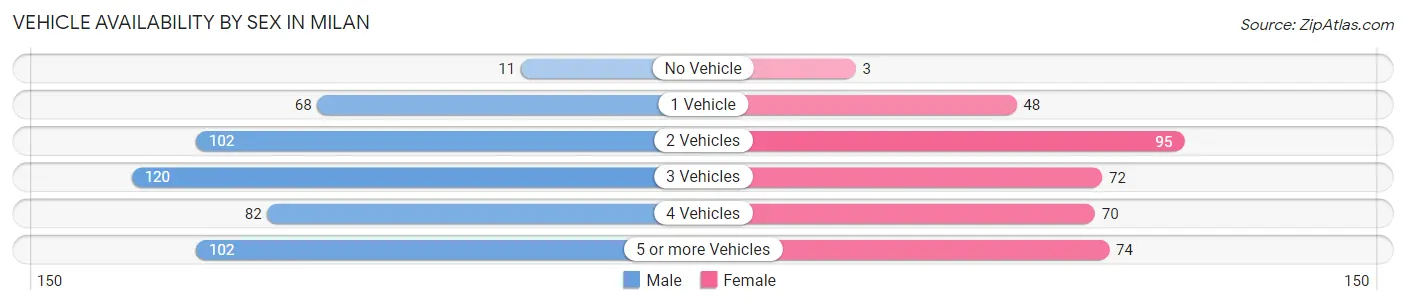
| Vehicles Available | Male | Female |
| No Vehicle | 11 (2.3%) | 3 (0.8%) |
| 1 Vehicle | 68 (14.0%) | 48 (13.3%) |
| 2 Vehicles | 102 (21.0%) | 95 (26.2%) |
| 3 Vehicles | 120 (24.7%) | 72 (19.9%) |
| 4 Vehicles | 82 (16.9%) | 70 (19.3%) |
| 5 or more Vehicles | 102 (21.0%) | 74 (20.4%) |
| Total | 485 (100.0%) | 362 (100.0%) |
Commute Time in Milan
The most frequently occuring commute durations in Milan are 20 to 24 minutes (130 commuters, 16.0%), 30 to 34 minutes (121 commuters, 14.8%), and 60 to 89 minutes (119 commuters, 14.6%).
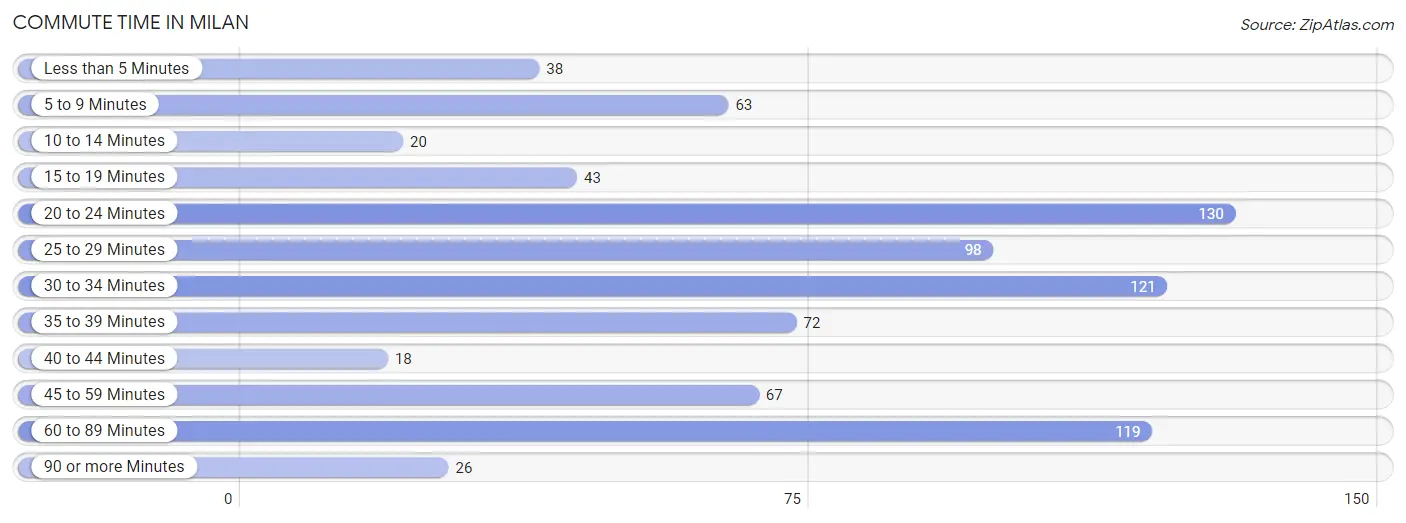
| Commute Time | # Commuters | % Commuters |
| Less than 5 Minutes | 38 | 4.7% |
| 5 to 9 Minutes | 63 | 7.7% |
| 10 to 14 Minutes | 20 | 2.5% |
| 15 to 19 Minutes | 43 | 5.3% |
| 20 to 24 Minutes | 130 | 16.0% |
| 25 to 29 Minutes | 98 | 12.0% |
| 30 to 34 Minutes | 121 | 14.8% |
| 35 to 39 Minutes | 72 | 8.8% |
| 40 to 44 Minutes | 18 | 2.2% |
| 45 to 59 Minutes | 67 | 8.2% |
| 60 to 89 Minutes | 119 | 14.6% |
| 90 or more Minutes | 26 | 3.2% |
Commute Time by Sex in Milan
The most common commute times in Milan are 30 to 34 minutes (96 commuters, 20.7%) for males and 20 to 24 minutes (53 commuters, 15.1%) for females.
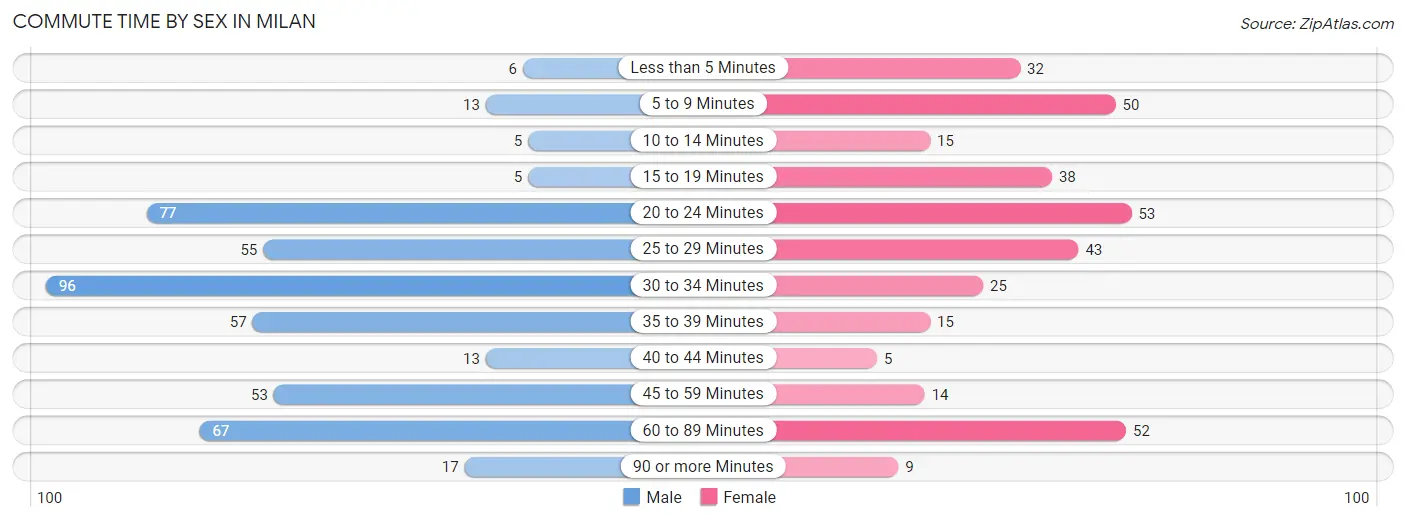
| Commute Time | Male | Female |
| Less than 5 Minutes | 6 (1.3%) | 32 (9.1%) |
| 5 to 9 Minutes | 13 (2.8%) | 50 (14.2%) |
| 10 to 14 Minutes | 5 (1.1%) | 15 (4.3%) |
| 15 to 19 Minutes | 5 (1.1%) | 38 (10.8%) |
| 20 to 24 Minutes | 77 (16.6%) | 53 (15.1%) |
| 25 to 29 Minutes | 55 (11.8%) | 43 (12.2%) |
| 30 to 34 Minutes | 96 (20.7%) | 25 (7.1%) |
| 35 to 39 Minutes | 57 (12.3%) | 15 (4.3%) |
| 40 to 44 Minutes | 13 (2.8%) | 5 (1.4%) |
| 45 to 59 Minutes | 53 (11.4%) | 14 (4.0%) |
| 60 to 89 Minutes | 67 (14.4%) | 52 (14.8%) |
| 90 or more Minutes | 17 (3.7%) | 9 (2.6%) |
Time of Departure to Work by Sex in Milan
The most frequent times of departure to work in Milan are 6:00 AM to 6:29 AM (101, 21.8%) for males and 7:00 AM to 7:29 AM (97, 27.6%) for females.
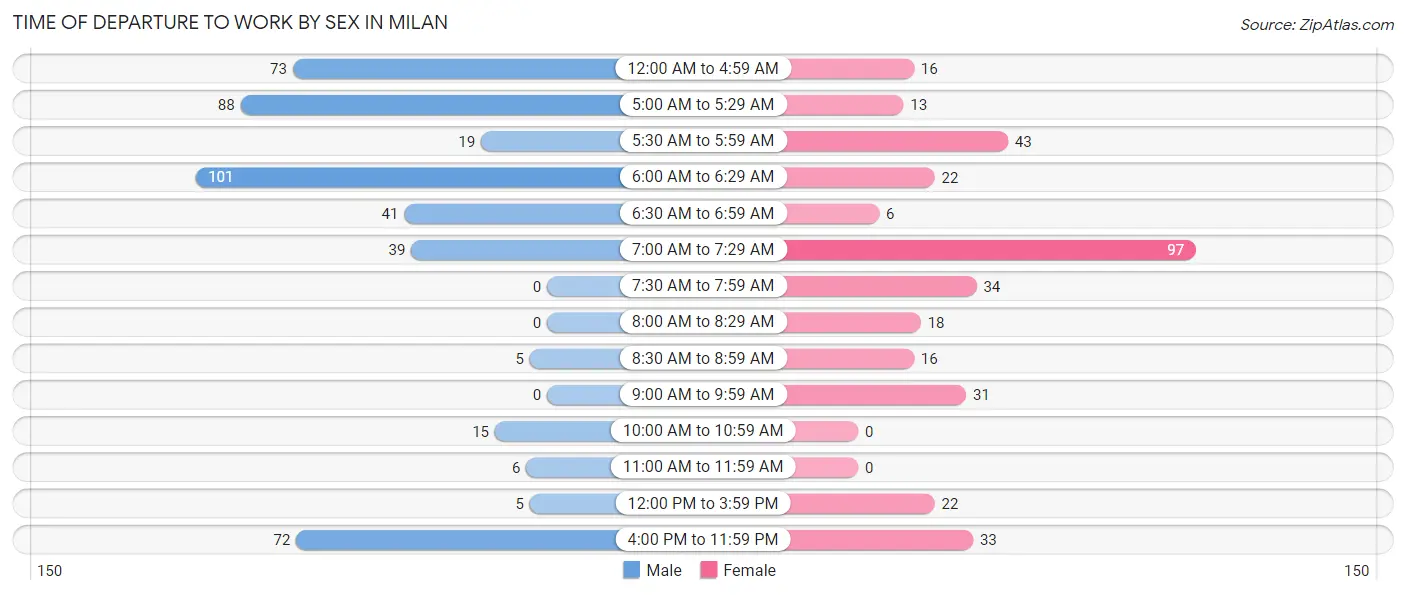
| Time of Departure | Male | Female |
| 12:00 AM to 4:59 AM | 73 (15.7%) | 16 (4.6%) |
| 5:00 AM to 5:29 AM | 88 (19.0%) | 13 (3.7%) |
| 5:30 AM to 5:59 AM | 19 (4.1%) | 43 (12.2%) |
| 6:00 AM to 6:29 AM | 101 (21.8%) | 22 (6.3%) |
| 6:30 AM to 6:59 AM | 41 (8.8%) | 6 (1.7%) |
| 7:00 AM to 7:29 AM | 39 (8.4%) | 97 (27.6%) |
| 7:30 AM to 7:59 AM | 0 (0.0%) | 34 (9.7%) |
| 8:00 AM to 8:29 AM | 0 (0.0%) | 18 (5.1%) |
| 8:30 AM to 8:59 AM | 5 (1.1%) | 16 (4.6%) |
| 9:00 AM to 9:59 AM | 0 (0.0%) | 31 (8.8%) |
| 10:00 AM to 10:59 AM | 15 (3.2%) | 0 (0.0%) |
| 11:00 AM to 11:59 AM | 6 (1.3%) | 0 (0.0%) |
| 12:00 PM to 3:59 PM | 5 (1.1%) | 22 (6.3%) |
| 4:00 PM to 11:59 PM | 72 (15.5%) | 33 (9.4%) |
| Total | 464 (100.0%) | 351 (100.0%) |
Housing Occupancy in Milan
Occupancy by Ownership in Milan
Of the total 725 dwellings in Milan, owner-occupied units account for 531 (73.2%), while renter-occupied units make up 194 (26.8%).
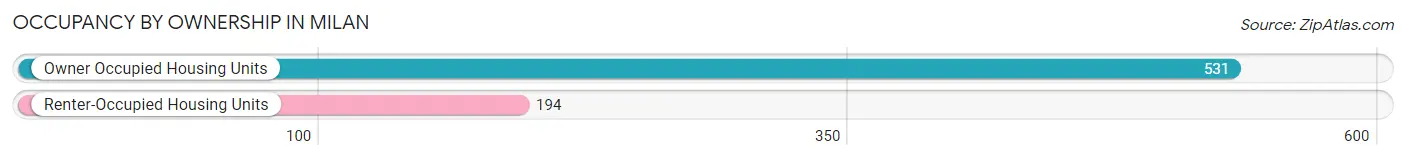
| Occupancy | # Housing Units | % Housing Units |
| Owner Occupied Housing Units | 531 | 73.2% |
| Renter-Occupied Housing Units | 194 | 26.8% |
| Total Occupied Housing Units | 725 | 100.0% |
Occupancy by Household Size in Milan
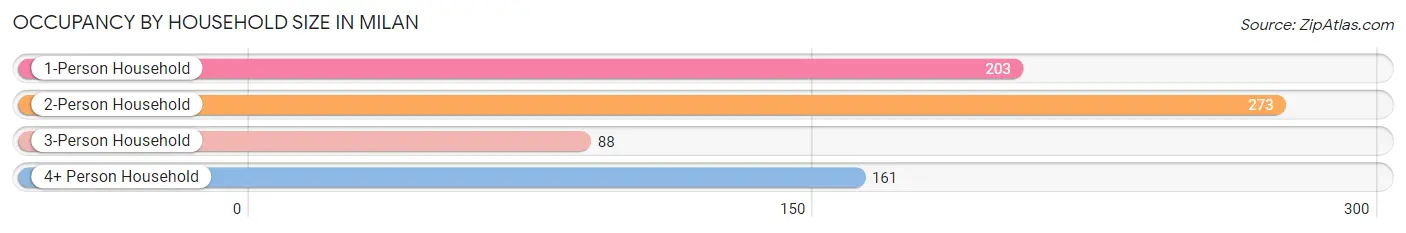
| Household Size | # Housing Units | % Housing Units |
| 1-Person Household | 203 | 28.0% |
| 2-Person Household | 273 | 37.7% |
| 3-Person Household | 88 | 12.1% |
| 4+ Person Household | 161 | 22.2% |
| Total Housing Units | 725 | 100.0% |
Occupancy by Ownership by Household Size in Milan
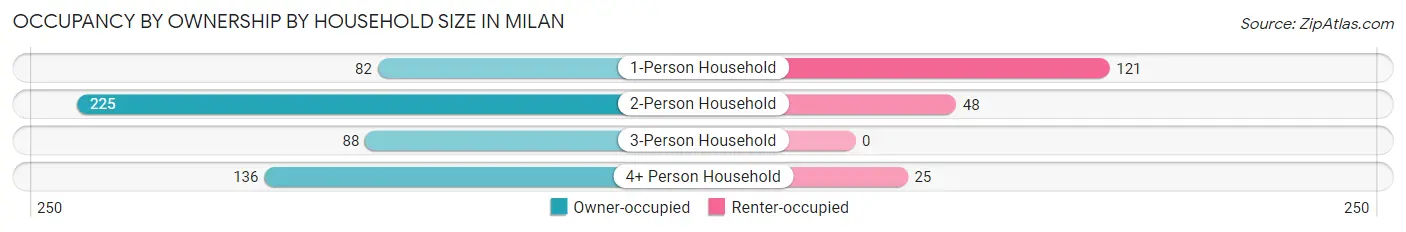
| Household Size | Owner-occupied | Renter-occupied |
| 1-Person Household | 82 (40.4%) | 121 (59.6%) |
| 2-Person Household | 225 (82.4%) | 48 (17.6%) |
| 3-Person Household | 88 (100.0%) | 0 (0.0%) |
| 4+ Person Household | 136 (84.5%) | 25 (15.5%) |
| Total Housing Units | 531 (73.2%) | 194 (26.8%) |
Occupancy by Educational Attainment in Milan
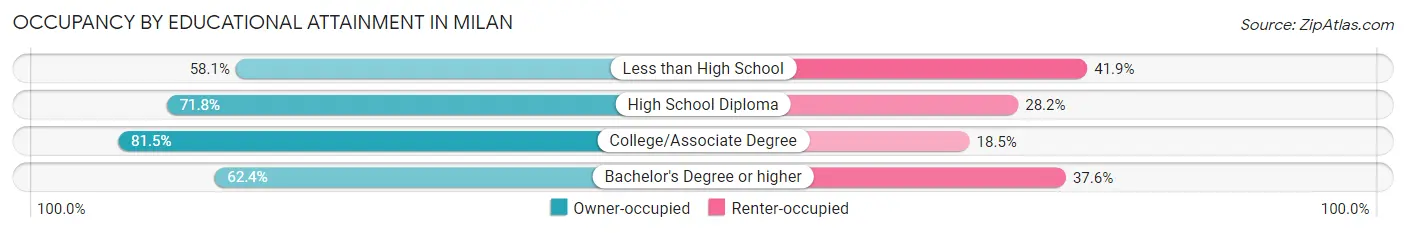
| Household Size | Owner-occupied | Renter-occupied |
| Less than High School | 25 (58.1%) | 18 (41.9%) |
| High School Diploma | 237 (71.8%) | 93 (28.2%) |
| College/Associate Degree | 211 (81.5%) | 48 (18.5%) |
| Bachelor's Degree or higher | 58 (62.4%) | 35 (37.6%) |
Occupancy by Age of Householder in Milan
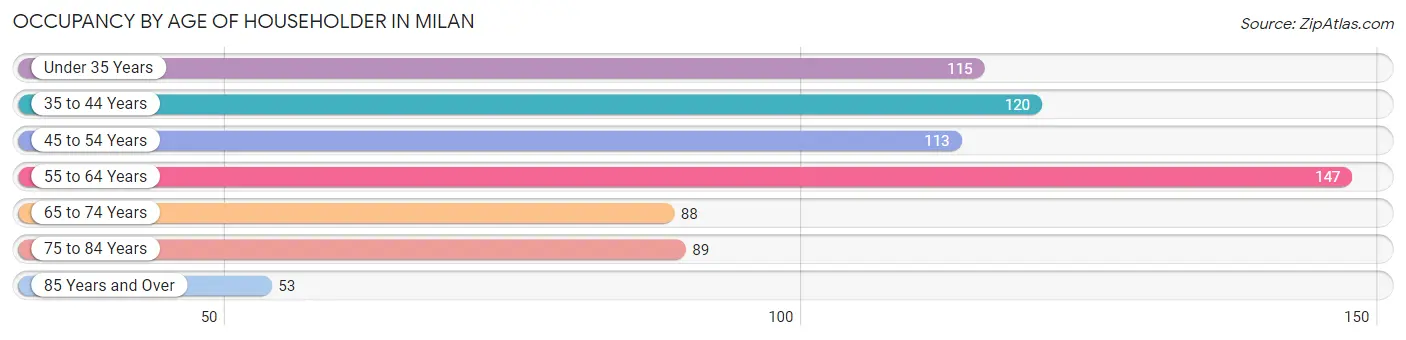
| Age Bracket | # Households | % Households |
| Under 35 Years | 115 | 15.9% |
| 35 to 44 Years | 120 | 16.6% |
| 45 to 54 Years | 113 | 15.6% |
| 55 to 64 Years | 147 | 20.3% |
| 65 to 74 Years | 88 | 12.1% |
| 75 to 84 Years | 89 | 12.3% |
| 85 Years and Over | 53 | 7.3% |
| Total | 725 | 100.0% |
Housing Finances in Milan
Median Income by Occupancy in Milan
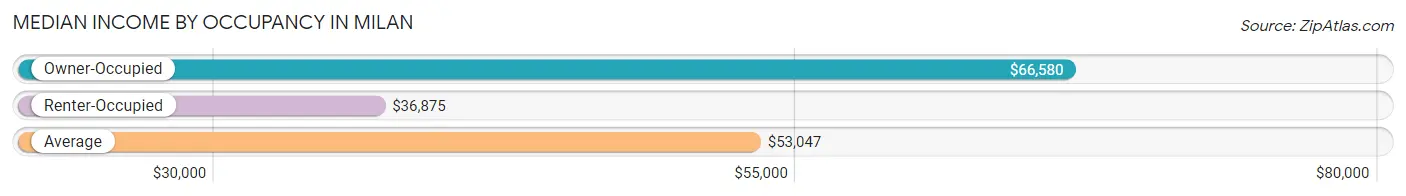
| Occupancy Type | # Households | Median Income |
| Owner-Occupied | 531 (73.2%) | $66,580 |
| Renter-Occupied | 194 (26.8%) | $36,875 |
| Average | 725 (100.0%) | $53,047 |
Occupancy by Householder Income Bracket in Milan
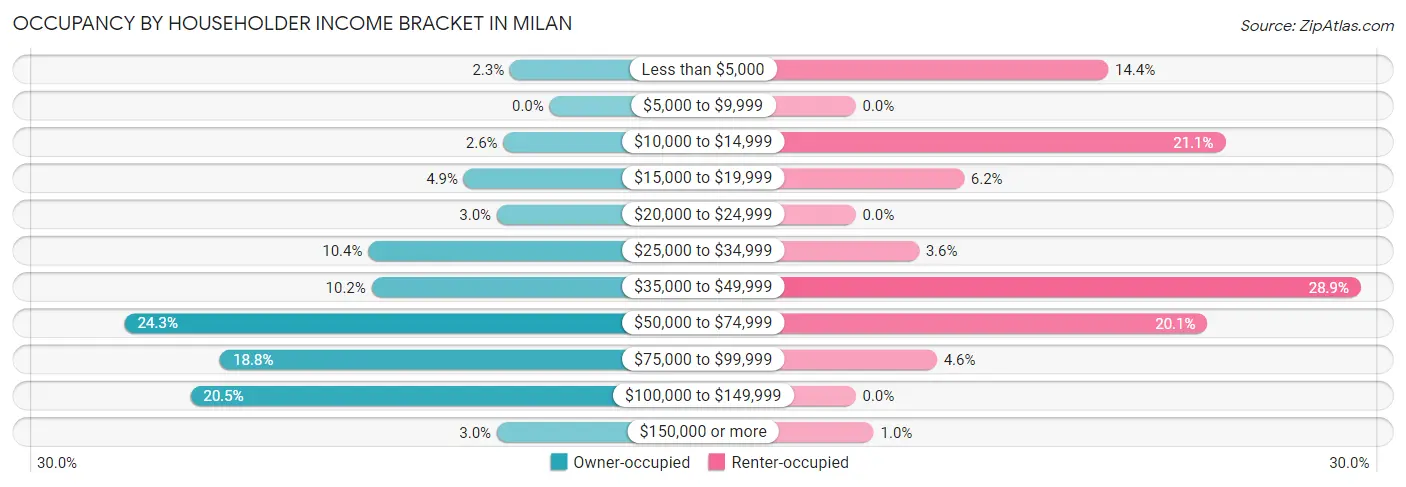
| Income Bracket | Owner-occupied | Renter-occupied |
| Less than $5,000 | 12 (2.3%) | 28 (14.4%) |
| $5,000 to $9,999 | 0 (0.0%) | 0 (0.0%) |
| $10,000 to $14,999 | 14 (2.6%) | 41 (21.1%) |
| $15,000 to $19,999 | 26 (4.9%) | 12 (6.2%) |
| $20,000 to $24,999 | 16 (3.0%) | 0 (0.0%) |
| $25,000 to $34,999 | 55 (10.4%) | 7 (3.6%) |
| $35,000 to $49,999 | 54 (10.2%) | 56 (28.9%) |
| $50,000 to $74,999 | 129 (24.3%) | 39 (20.1%) |
| $75,000 to $99,999 | 100 (18.8%) | 9 (4.6%) |
| $100,000 to $149,999 | 109 (20.5%) | 0 (0.0%) |
| $150,000 or more | 16 (3.0%) | 2 (1.0%) |
| Total | 531 (100.0%) | 194 (100.0%) |
Monthly Housing Cost Tiers in Milan
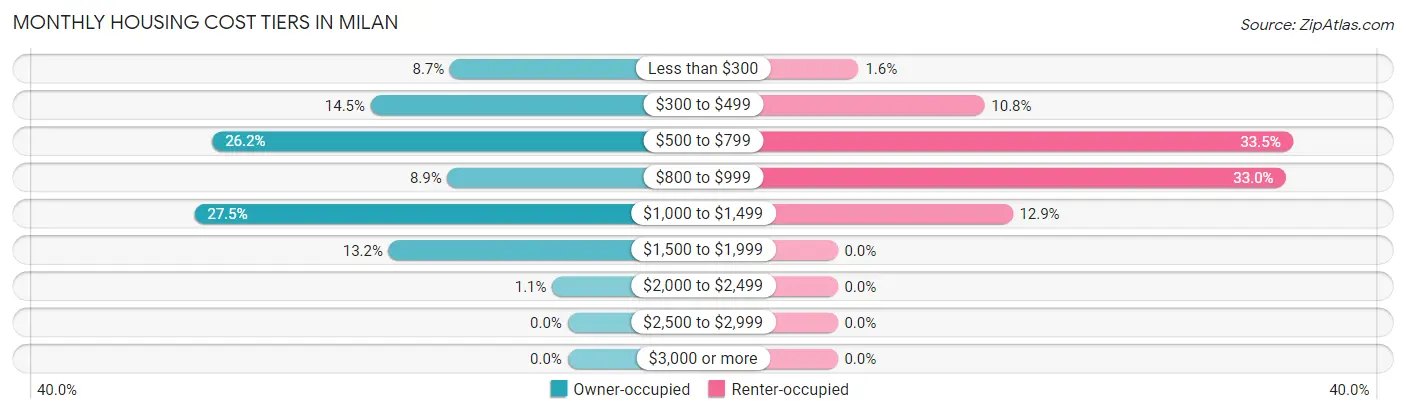
| Monthly Cost | Owner-occupied | Renter-occupied |
| Less than $300 | 46 (8.7%) | 3 (1.5%) |
| $300 to $499 | 77 (14.5%) | 21 (10.8%) |
| $500 to $799 | 139 (26.2%) | 65 (33.5%) |
| $800 to $999 | 47 (8.8%) | 64 (33.0%) |
| $1,000 to $1,499 | 146 (27.5%) | 25 (12.9%) |
| $1,500 to $1,999 | 70 (13.2%) | 0 (0.0%) |
| $2,000 to $2,499 | 6 (1.1%) | 0 (0.0%) |
| $2,500 to $2,999 | 0 (0.0%) | 0 (0.0%) |
| $3,000 or more | 0 (0.0%) | 0 (0.0%) |
| Total | 531 (100.0%) | 194 (100.0%) |
Physical Housing Characteristics in Milan
Housing Structures in Milan
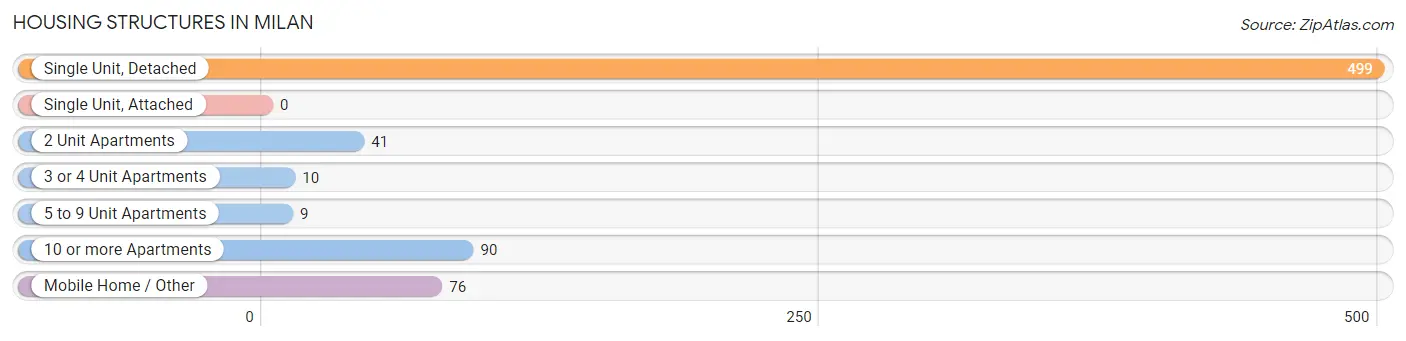
| Structure Type | # Housing Units | % Housing Units |
| Single Unit, Detached | 499 | 68.8% |
| Single Unit, Attached | 0 | 0.0% |
| 2 Unit Apartments | 41 | 5.7% |
| 3 or 4 Unit Apartments | 10 | 1.4% |
| 5 to 9 Unit Apartments | 9 | 1.2% |
| 10 or more Apartments | 90 | 12.4% |
| Mobile Home / Other | 76 | 10.5% |
| Total | 725 | 100.0% |
Housing Structures by Occupancy in Milan
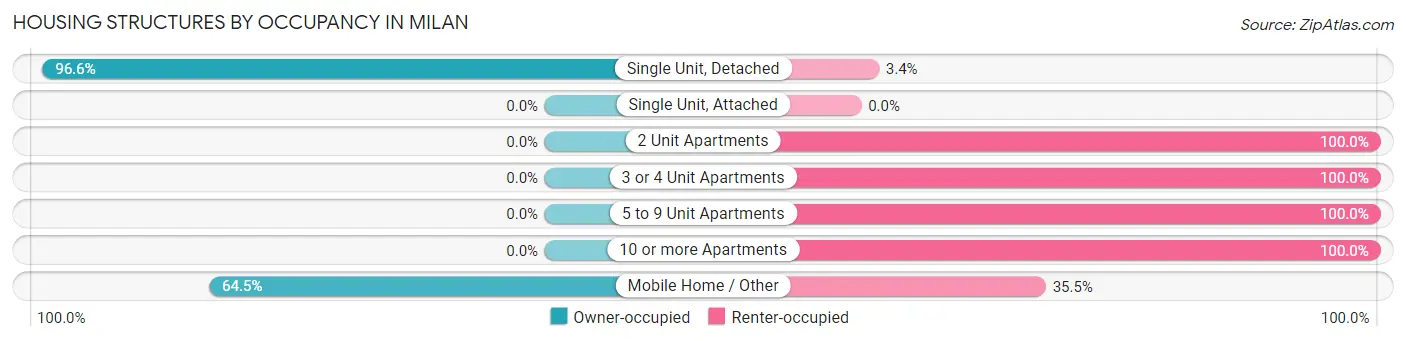
| Structure Type | Owner-occupied | Renter-occupied |
| Single Unit, Detached | 482 (96.6%) | 17 (3.4%) |
| Single Unit, Attached | 0 (0.0%) | 0 (0.0%) |
| 2 Unit Apartments | 0 (0.0%) | 41 (100.0%) |
| 3 or 4 Unit Apartments | 0 (0.0%) | 10 (100.0%) |
| 5 to 9 Unit Apartments | 0 (0.0%) | 9 (100.0%) |
| 10 or more Apartments | 0 (0.0%) | 90 (100.0%) |
| Mobile Home / Other | 49 (64.5%) | 27 (35.5%) |
| Total | 531 (73.2%) | 194 (26.8%) |
Housing Structures by Number of Rooms in Milan
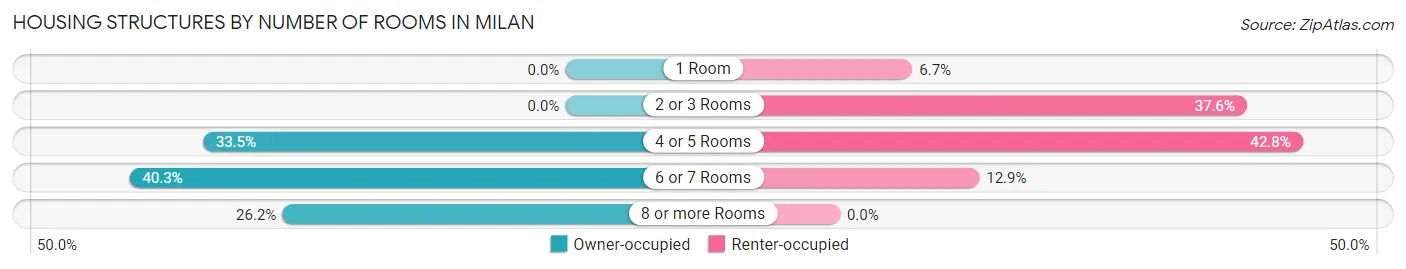
| Number of Rooms | Owner-occupied | Renter-occupied |
| 1 Room | 0 (0.0%) | 13 (6.7%) |
| 2 or 3 Rooms | 0 (0.0%) | 73 (37.6%) |
| 4 or 5 Rooms | 178 (33.5%) | 83 (42.8%) |
| 6 or 7 Rooms | 214 (40.3%) | 25 (12.9%) |
| 8 or more Rooms | 139 (26.2%) | 0 (0.0%) |
| Total | 531 (100.0%) | 194 (100.0%) |
Housing Structure by Heating Type in Milan
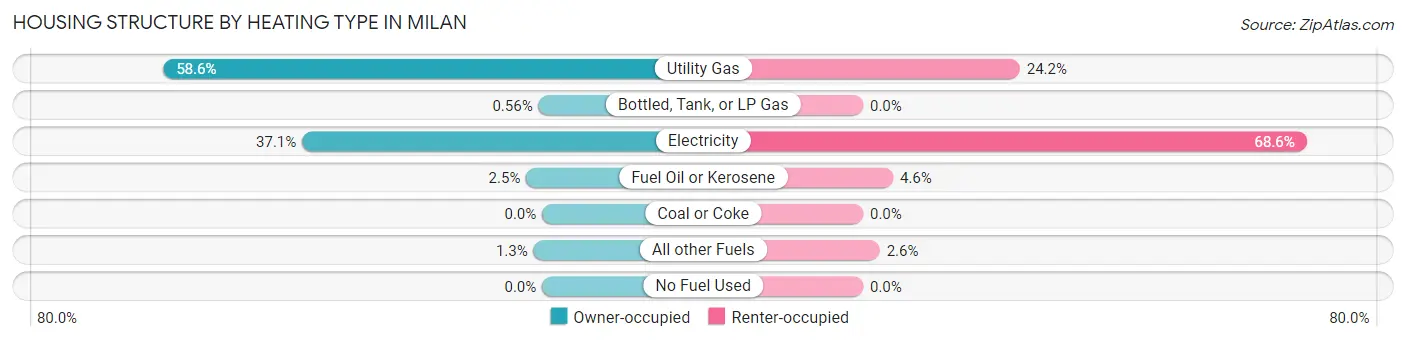
| Heating Type | Owner-occupied | Renter-occupied |
| Utility Gas | 311 (58.6%) | 47 (24.2%) |
| Bottled, Tank, or LP Gas | 3 (0.6%) | 0 (0.0%) |
| Electricity | 197 (37.1%) | 133 (68.6%) |
| Fuel Oil or Kerosene | 13 (2.5%) | 9 (4.6%) |
| Coal or Coke | 0 (0.0%) | 0 (0.0%) |
| All other Fuels | 7 (1.3%) | 5 (2.6%) |
| No Fuel Used | 0 (0.0%) | 0 (0.0%) |
| Total | 531 (100.0%) | 194 (100.0%) |
Household Vehicle Usage in Milan
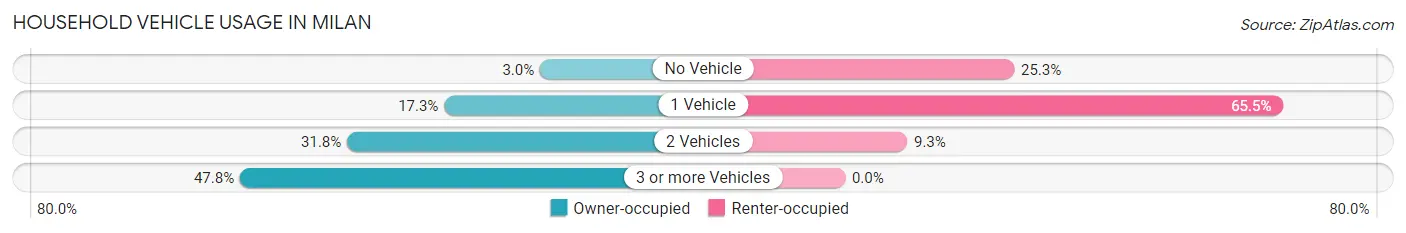
| Vehicles per Household | Owner-occupied | Renter-occupied |
| No Vehicle | 16 (3.0%) | 49 (25.3%) |
| 1 Vehicle | 92 (17.3%) | 127 (65.5%) |
| 2 Vehicles | 169 (31.8%) | 18 (9.3%) |
| 3 or more Vehicles | 254 (47.8%) | 0 (0.0%) |
| Total | 531 (100.0%) | 194 (100.0%) |
Real Estate & Mortgages in Milan
Real Estate and Mortgage Overview in Milan
| Characteristic | Without Mortgage | With Mortgage |
| Housing Units | 190 | 341 |
| Median Property Value | $107,700 | $139,100 |
| Median Household Income | $42,763 | $16 |
| Monthly Housing Costs | $422 | $0 |
| Real Estate Taxes | $541 | $7 |
Property Value by Mortgage Status in Milan
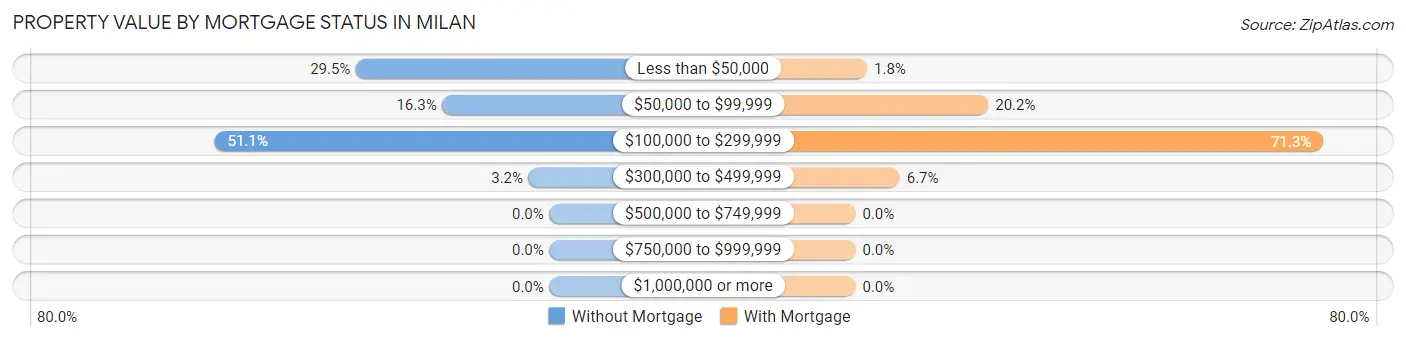
| Property Value | Without Mortgage | With Mortgage |
| Less than $50,000 | 56 (29.5%) | 6 (1.8%) |
| $50,000 to $99,999 | 31 (16.3%) | 69 (20.2%) |
| $100,000 to $299,999 | 97 (51.0%) | 243 (71.3%) |
| $300,000 to $499,999 | 6 (3.2%) | 23 (6.7%) |
| $500,000 to $749,999 | 0 (0.0%) | 0 (0.0%) |
| $750,000 to $999,999 | 0 (0.0%) | 0 (0.0%) |
| $1,000,000 or more | 0 (0.0%) | 0 (0.0%) |
| Total | 190 (100.0%) | 341 (100.0%) |
Household Income by Mortgage Status in Milan
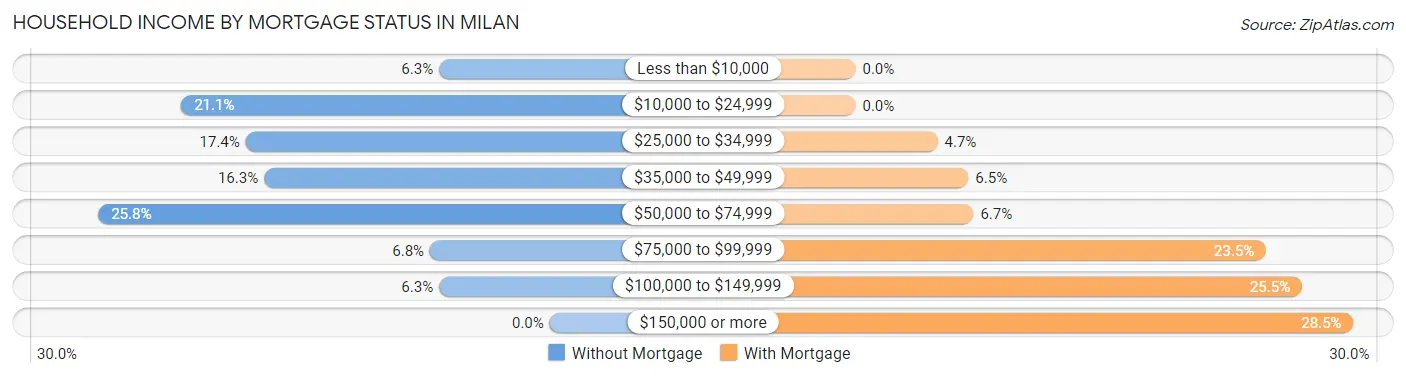
| Household Income | Without Mortgage | With Mortgage |
| Less than $10,000 | 12 (6.3%) | 0 (0.0%) |
| $10,000 to $24,999 | 40 (21.0%) | 0 (0.0%) |
| $25,000 to $34,999 | 33 (17.4%) | 16 (4.7%) |
| $35,000 to $49,999 | 31 (16.3%) | 22 (6.5%) |
| $50,000 to $74,999 | 49 (25.8%) | 23 (6.7%) |
| $75,000 to $99,999 | 13 (6.8%) | 80 (23.5%) |
| $100,000 to $149,999 | 12 (6.3%) | 87 (25.5%) |
| $150,000 or more | 0 (0.0%) | 97 (28.4%) |
| Total | 190 (100.0%) | 341 (100.0%) |
Property Value to Household Income Ratio in Milan
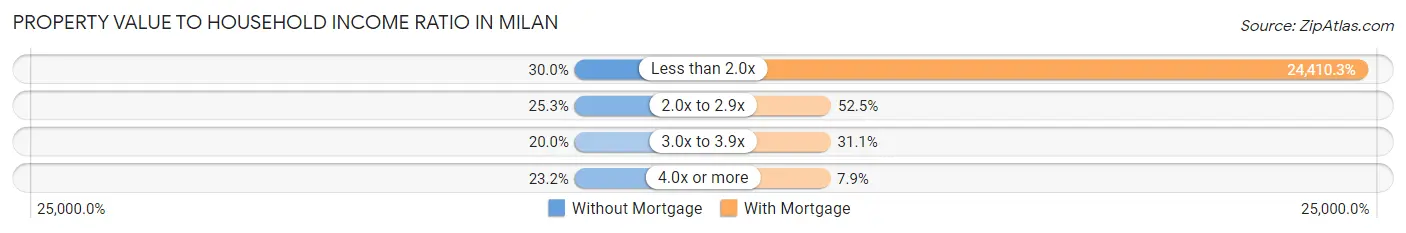
| Value-to-Income Ratio | Without Mortgage | With Mortgage |
| Less than 2.0x | 57 (30.0%) | 83,239 (24,410.3%) |
| 2.0x to 2.9x | 48 (25.3%) | 179 (52.5%) |
| 3.0x to 3.9x | 38 (20.0%) | 106 (31.1%) |
| 4.0x or more | 44 (23.2%) | 27 (7.9%) |
| Total | 190 (100.0%) | 341 (100.0%) |
Real Estate Taxes by Mortgage Status in Milan
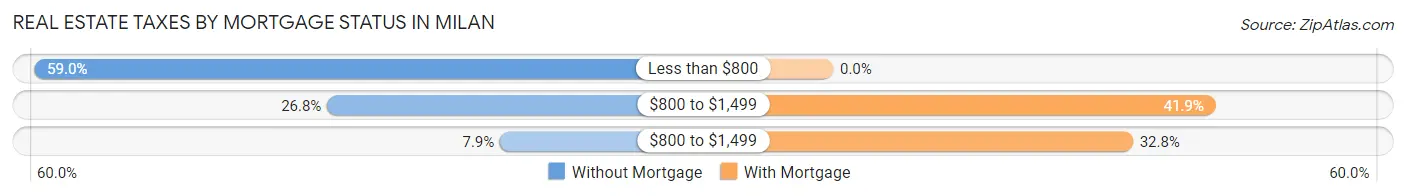
| Property Taxes | Without Mortgage | With Mortgage |
| Less than $800 | 112 (59.0%) | 0 (0.0%) |
| $800 to $1,499 | 51 (26.8%) | 143 (41.9%) |
| $800 to $1,499 | 15 (7.9%) | 112 (32.8%) |
| Total | 190 (100.0%) | 341 (100.0%) |
Health & Disability in Milan
Health Insurance Coverage by Age in Milan
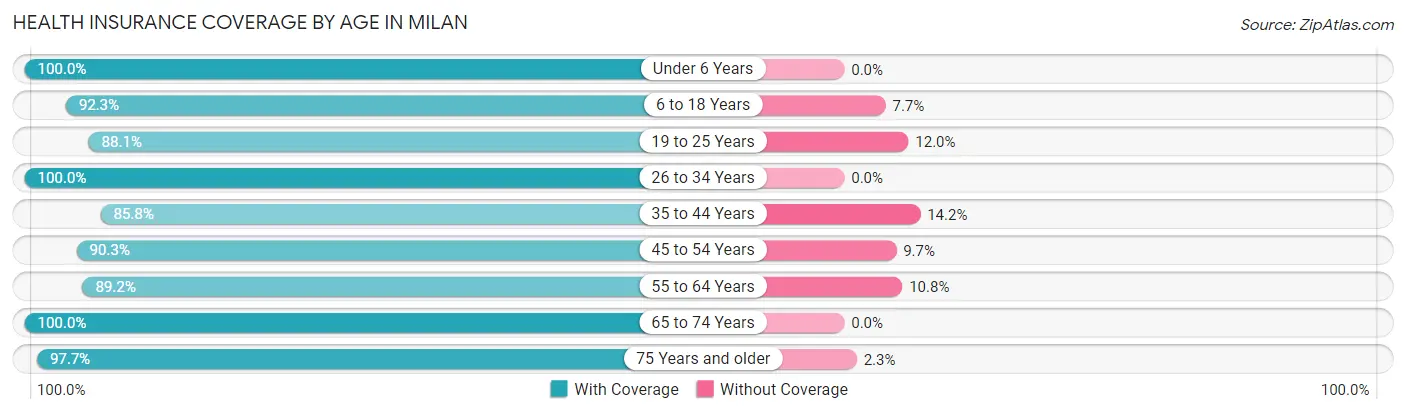
| Age Bracket | With Coverage | Without Coverage |
| Under 6 Years | 63 (100.0%) | 0 (0.0%) |
| 6 to 18 Years | 384 (92.3%) | 32 (7.7%) |
| 19 to 25 Years | 140 (88.0%) | 19 (11.9%) |
| 26 to 34 Years | 141 (100.0%) | 0 (0.0%) |
| 35 to 44 Years | 188 (85.8%) | 31 (14.2%) |
| 45 to 54 Years | 252 (90.3%) | 27 (9.7%) |
| 55 to 64 Years | 223 (89.2%) | 27 (10.8%) |
| 65 to 74 Years | 132 (100.0%) | 0 (0.0%) |
| 75 Years and older | 211 (97.7%) | 5 (2.3%) |
| Total | 1,734 (92.5%) | 141 (7.5%) |
Health Insurance Coverage by Citizenship Status in Milan
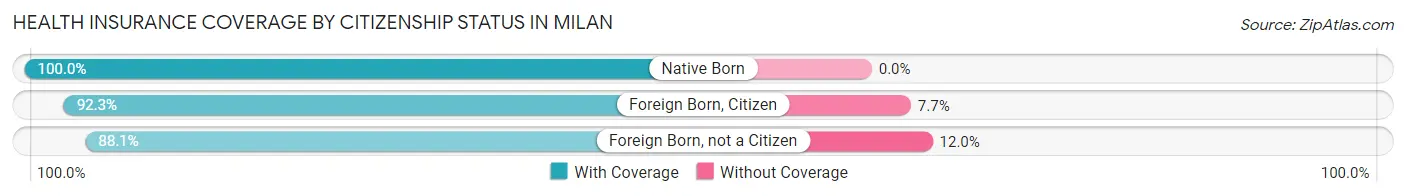
| Citizenship Status | With Coverage | Without Coverage |
| Native Born | 63 (100.0%) | 0 (0.0%) |
| Foreign Born, Citizen | 384 (92.3%) | 32 (7.7%) |
| Foreign Born, not a Citizen | 140 (88.0%) | 19 (11.9%) |
Health Insurance Coverage by Household Income in Milan
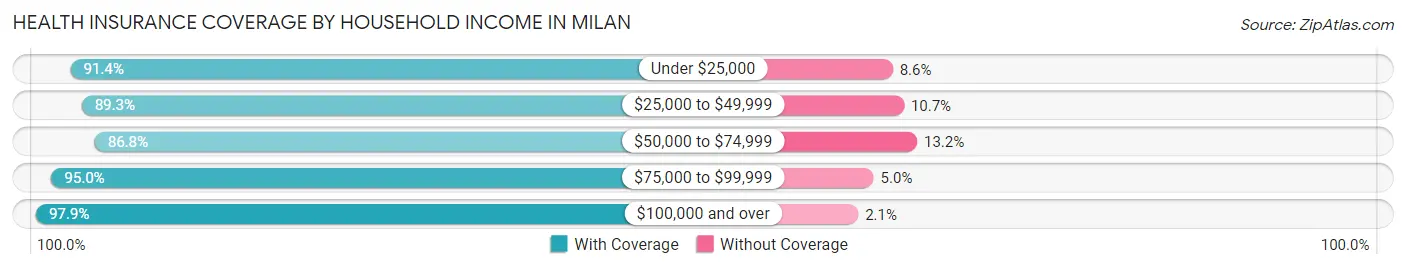
| Household Income | With Coverage | Without Coverage |
| Under $25,000 | 276 (91.4%) | 26 (8.6%) |
| $25,000 to $49,999 | 275 (89.3%) | 33 (10.7%) |
| $50,000 to $74,999 | 363 (86.8%) | 55 (13.2%) |
| $75,000 to $99,999 | 302 (95.0%) | 16 (5.0%) |
| $100,000 and over | 503 (97.9%) | 11 (2.1%) |
Public vs Private Health Insurance Coverage by Age in Milan
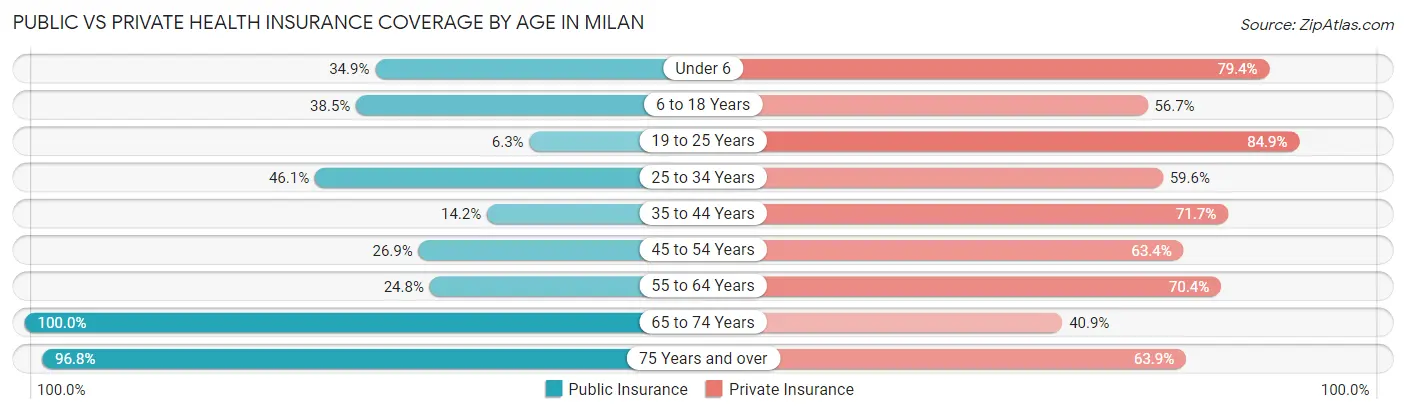
| Age Bracket | Public Insurance | Private Insurance |
| Under 6 | 22 (34.9%) | 50 (79.4%) |
| 6 to 18 Years | 160 (38.5%) | 236 (56.7%) |
| 19 to 25 Years | 10 (6.3%) | 135 (84.9%) |
| 25 to 34 Years | 65 (46.1%) | 84 (59.6%) |
| 35 to 44 Years | 31 (14.2%) | 157 (71.7%) |
| 45 to 54 Years | 75 (26.9%) | 177 (63.4%) |
| 55 to 64 Years | 62 (24.8%) | 176 (70.4%) |
| 65 to 74 Years | 132 (100.0%) | 54 (40.9%) |
| 75 Years and over | 209 (96.8%) | 138 (63.9%) |
| Total | 766 (40.8%) | 1,207 (64.4%) |
Disability Status by Sex by Age in Milan
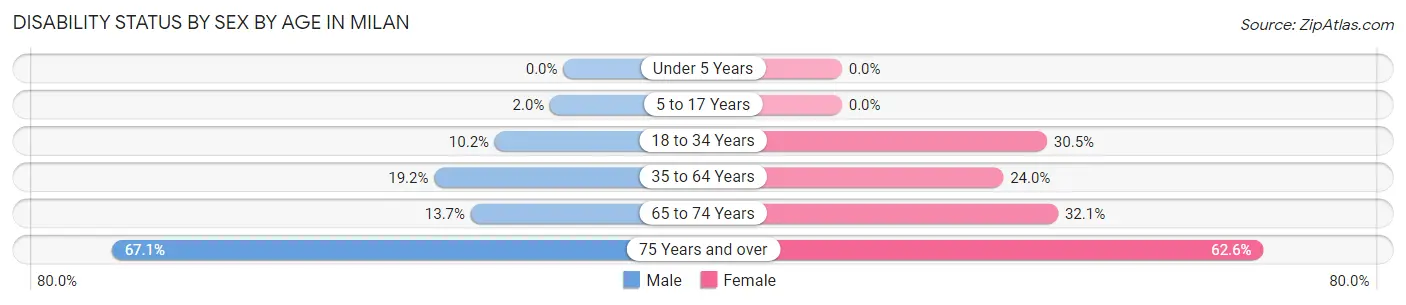
| Age Bracket | Male | Female |
| Under 5 Years | 0 (0.0%) | 0 (0.0%) |
| 5 to 17 Years | 4 (2.0%) | 0 (0.0%) |
| 18 to 34 Years | 19 (10.2%) | 46 (30.5%) |
| 35 to 64 Years | 69 (19.2%) | 93 (24.0%) |
| 65 to 74 Years | 7 (13.7%) | 26 (32.1%) |
| 75 Years and over | 57 (67.1%) | 82 (62.6%) |
Disability Class by Sex by Age in Milan
Disability Class: Hearing Difficulty
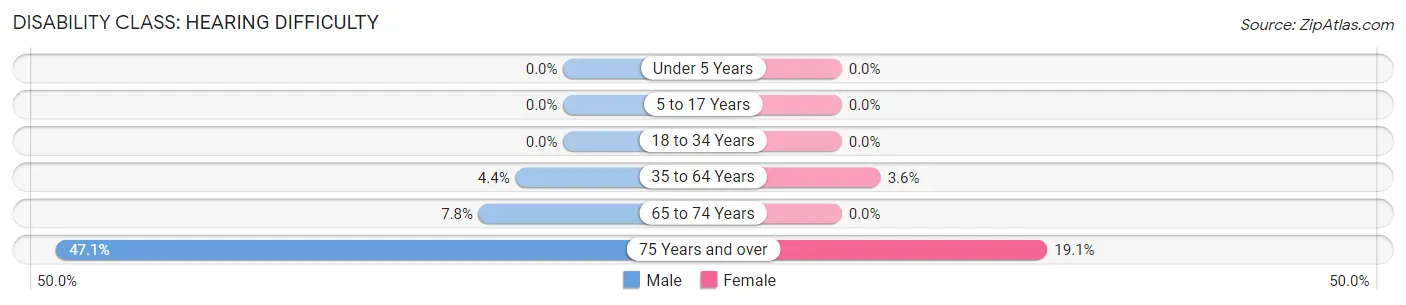
| Age Bracket | Male | Female |
| Under 5 Years | 0 (0.0%) | 0 (0.0%) |
| 5 to 17 Years | 0 (0.0%) | 0 (0.0%) |
| 18 to 34 Years | 0 (0.0%) | 0 (0.0%) |
| 35 to 64 Years | 16 (4.4%) | 14 (3.6%) |
| 65 to 74 Years | 4 (7.8%) | 0 (0.0%) |
| 75 Years and over | 40 (47.1%) | 25 (19.1%) |
Disability Class: Vision Difficulty
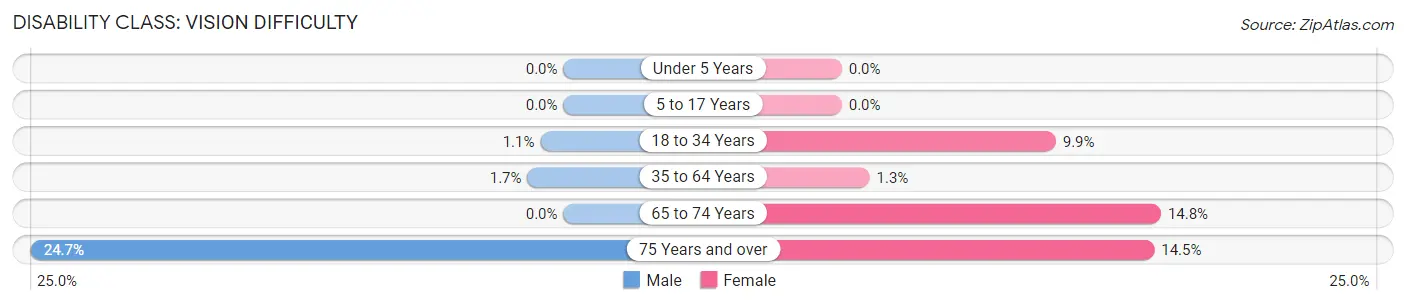
| Age Bracket | Male | Female |
| Under 5 Years | 0 (0.0%) | 0 (0.0%) |
| 5 to 17 Years | 0 (0.0%) | 0 (0.0%) |
| 18 to 34 Years | 2 (1.1%) | 15 (9.9%) |
| 35 to 64 Years | 6 (1.7%) | 5 (1.3%) |
| 65 to 74 Years | 0 (0.0%) | 12 (14.8%) |
| 75 Years and over | 21 (24.7%) | 19 (14.5%) |
Disability Class: Cognitive Difficulty
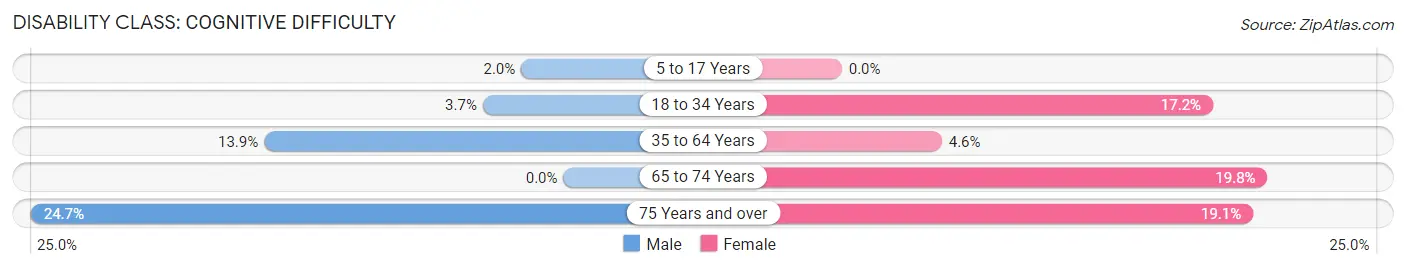
| Age Bracket | Male | Female |
| 5 to 17 Years | 4 (2.0%) | 0 (0.0%) |
| 18 to 34 Years | 7 (3.7%) | 26 (17.2%) |
| 35 to 64 Years | 50 (13.9%) | 18 (4.6%) |
| 65 to 74 Years | 0 (0.0%) | 16 (19.8%) |
| 75 Years and over | 21 (24.7%) | 25 (19.1%) |
Disability Class: Ambulatory Difficulty
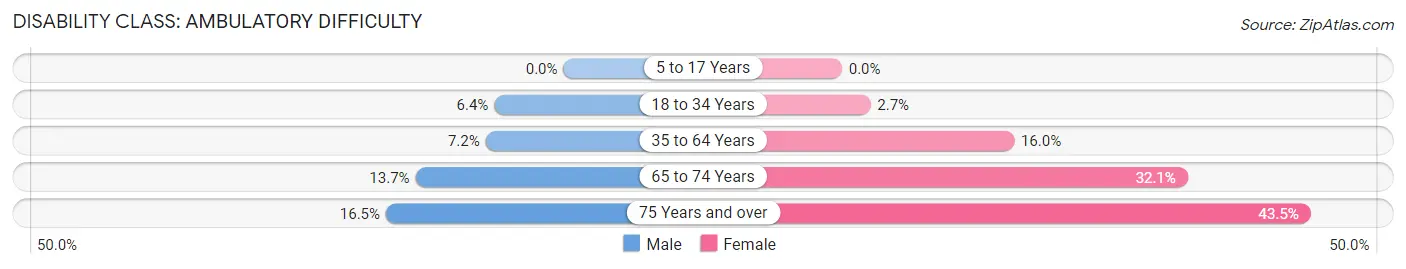
| Age Bracket | Male | Female |
| 5 to 17 Years | 0 (0.0%) | 0 (0.0%) |
| 18 to 34 Years | 12 (6.4%) | 4 (2.6%) |
| 35 to 64 Years | 26 (7.2%) | 62 (16.0%) |
| 65 to 74 Years | 7 (13.7%) | 26 (32.1%) |
| 75 Years and over | 14 (16.5%) | 57 (43.5%) |
Disability Class: Self-Care Difficulty
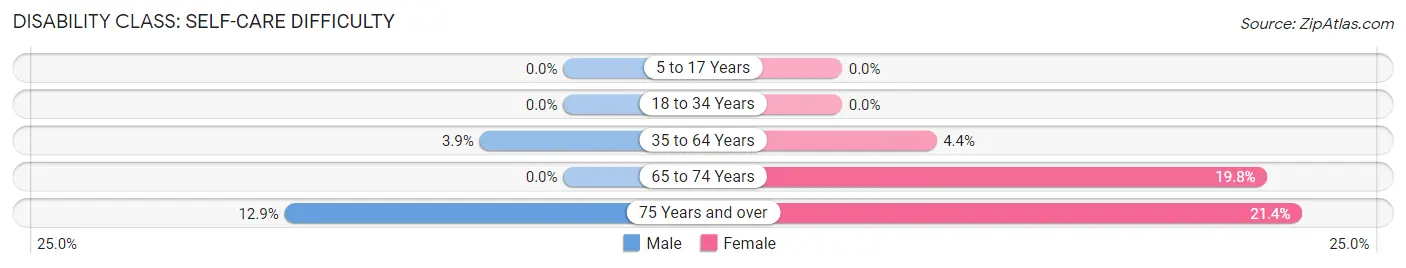
| Age Bracket | Male | Female |
| 5 to 17 Years | 0 (0.0%) | 0 (0.0%) |
| 18 to 34 Years | 0 (0.0%) | 0 (0.0%) |
| 35 to 64 Years | 14 (3.9%) | 17 (4.4%) |
| 65 to 74 Years | 0 (0.0%) | 16 (19.8%) |
| 75 Years and over | 11 (12.9%) | 28 (21.4%) |
Technology Access in Milan
Computing Device Access in Milan
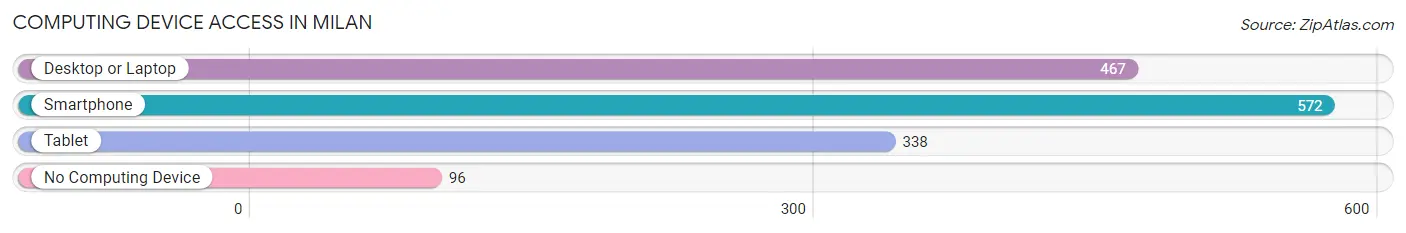
| Device Type | # Households | % Households |
| Desktop or Laptop | 467 | 64.4% |
| Smartphone | 572 | 78.9% |
| Tablet | 338 | 46.6% |
| No Computing Device | 96 | 13.2% |
| Total | 725 | 100.0% |
Internet Access in Milan
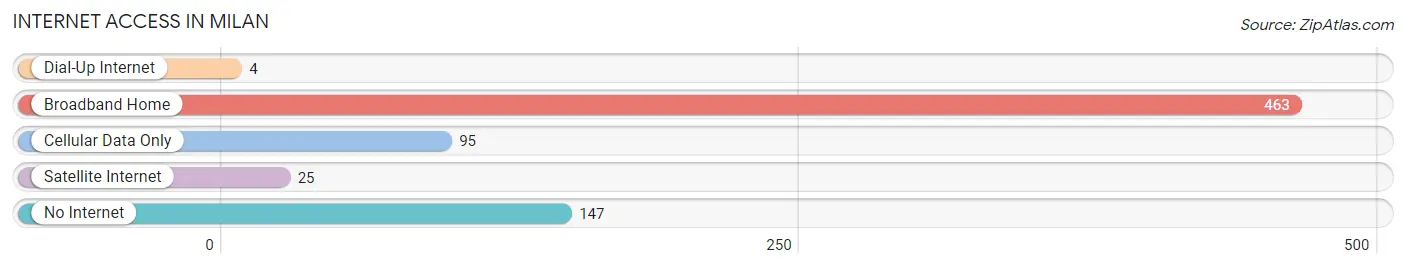
| Internet Type | # Households | % Households |
| Dial-Up Internet | 4 | 0.5% |
| Broadband Home | 463 | 63.9% |
| Cellular Data Only | 95 | 13.1% |
| Satellite Internet | 25 | 3.5% |
| No Internet | 147 | 20.3% |
| Total | 725 | 100.0% |
Milan Summary
Milan, Indiana is a small town located in the southeastern corner of the state, in Ripley County. It is situated on the banks of the Ohio River, and is part of the Cincinnati metropolitan area. The town has a population of approximately 2,000 people, and is known for its rural charm and small-town atmosphere.
Geography
Milan is located in the southeastern corner of Indiana, in Ripley County. It is situated on the banks of the Ohio River, and is part of the Cincinnati metropolitan area. The town is located approximately 30 miles from Cincinnati, Ohio, and is bordered by the towns of Versailles, Osgood, and Sunman. The town is situated on a flat plain, with the Ohio River to the south and the hills of the Hoosier National Forest to the north.
Economy
The economy of Milan is largely based on agriculture and manufacturing. The town is home to several small businesses, including a feed mill, a lumber yard, and a hardware store. The town also has a number of small restaurants and shops. The town is also home to a number of small manufacturing companies, including a plastics factory and a metal fabrication plant.
Demographics
As of the 2010 census, the population of Milan was 2,037. The racial makeup of the town was 97.2% White, 0.7% African American, 0.2% Native American, 0.3% Asian, 0.1% Pacific Islander, 0.4% from other races, and 1.1% from two or more races. Hispanic or Latino of any race were 1.2% of the population.
The median income for a household in the town was $37,917, and the median income for a family was $45,000. The per capita income for the town was $18,945. About 11.2% of families and 14.2% of the population were below the poverty line, including 18.2% of those under age 18 and 8.2% of those age 65 or over.
History
Milan was founded in 1818 by a group of settlers from Kentucky. The town was named after the Italian city of Milan, and was originally intended to be a trading post. The town quickly grew, and by the mid-1800s it had become a thriving agricultural center. The town was also home to a number of small manufacturing companies, including a flour mill, a sawmill, and a brickyard.
In the late 1800s, the town was connected to the outside world by the Cincinnati, Hamilton, and Dayton Railroad. This allowed the town to become a major shipping center for the region. The town also became a popular tourist destination, and was home to a number of resorts and hotels.
In the early 1900s, the town was hit hard by the Great Depression, and many of the businesses and factories closed. The town slowly recovered, and by the 1950s it had become a thriving agricultural center once again. The town has remained largely unchanged since then, and is still known for its rural charm and small-town atmosphere.
Common Questions
What is Per Capita Income in Milan?
Per Capita income in Milan is $26,004.
What is the Median Family Income in Milan?
Median Family Income in Milan is $66,698.
What is the Median Household income in Milan?
Median Household Income in Milan is $53,047.
What is Income or Wage Gap in Milan?
Income or Wage Gap in Milan is 34.8%.
Women in Milan earn 65.2 cents for every dollar earned by a man.
What is Inequality or Gini Index in Milan?
Inequality or Gini Index in Milan is 0.43.
What is the Total Population of Milan?
Total Population of Milan is 1,981.
What is the Total Male Population of Milan?
Total Male Population of Milan is 968.
What is the Total Female Population of Milan?
Total Female Population of Milan is 1,013.
What is the Ratio of Males per 100 Females in Milan?
There are 95.56 Males per 100 Females in Milan.
What is the Ratio of Females per 100 Males in Milan?
There are 104.65 Females per 100 Males in Milan.
What is the Median Population Age in Milan?
Median Population Age in Milan is 44.4 Years.
What is the Average Family Size in Milan
Average Family Size in Milan is 3.2 People.
What is the Average Household Size in Milan
Average Household Size in Milan is 2.6 People.
How Large is the Labor Force in Milan?
There are 886 People in the Labor Forcein in Milan.
What is the Percentage of People in the Labor Force in Milan?
54.5% of People are in the Labor Force in Milan.
What is the Unemployment Rate in Milan?
Unemployment Rate in Milan is 3.7%.