North Manchester, IN Map & Demographics
North Manchester Map
North Manchester Overview
$30,705
PER CAPITA INCOME
$97,028
AVG FAMILY INCOME
$63,029
AVG HOUSEHOLD INCOME
48.7%
WAGE / INCOME GAP [ % ]
51.3¢/ $1
WAGE / INCOME GAP [ $ ]
0.39
INEQUALITY / GINI INDEX
5,017
TOTAL POPULATION
2,280
MALE POPULATION
2,737
FEMALE POPULATION
83.30
MALES / 100 FEMALES
120.04
FEMALES / 100 MALES
40.6
MEDIAN AGE
2.9
AVG FAMILY SIZE
2.2
AVG HOUSEHOLD SIZE
2,377
LABOR FORCE [ PEOPLE ]
56.8%
PERCENT IN LABOR FORCE
2.4%
UNEMPLOYMENT RATE
North Manchester Zip Codes
North Manchester Area Codes
Income in North Manchester
Income Overview in North Manchester
Per Capita Income in North Manchester is $30,705, while median incomes of families and households are $97,028 and $63,029 respectively.
| Characteristic | Number | Measure |
| Per Capita Income | 5,017 | $30,705 |
| Median Family Income | 1,029 | $97,028 |
| Mean Family Income | 1,029 | $99,289 |
| Median Household Income | 1,801 | $63,029 |
| Mean Household Income | 1,801 | $77,270 |
| Income Deficit | 1,029 | $0 |
| Wage / Income Gap (%) | 5,017 | 48.72% |
| Wage / Income Gap ($) | 5,017 | 51.28¢ per $1 |
| Gini / Inequality Index | 5,017 | 0.39 |
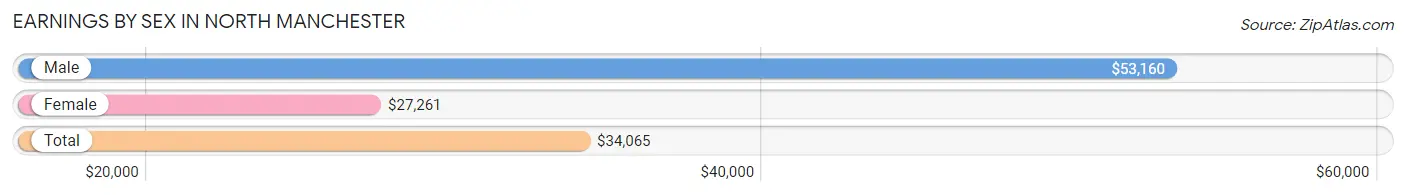
Earnings by Sex in North Manchester
Average Earnings in North Manchester are $34,065, $53,160 for men and $27,261 for women, a difference of 48.7%.
| Sex | Number | Average Earnings |
| Male | 1,345 (50.4%) | $53,160 |
| Female | 1,326 (49.6%) | $27,261 |
| Total | 2,671 (100.0%) | $34,065 |
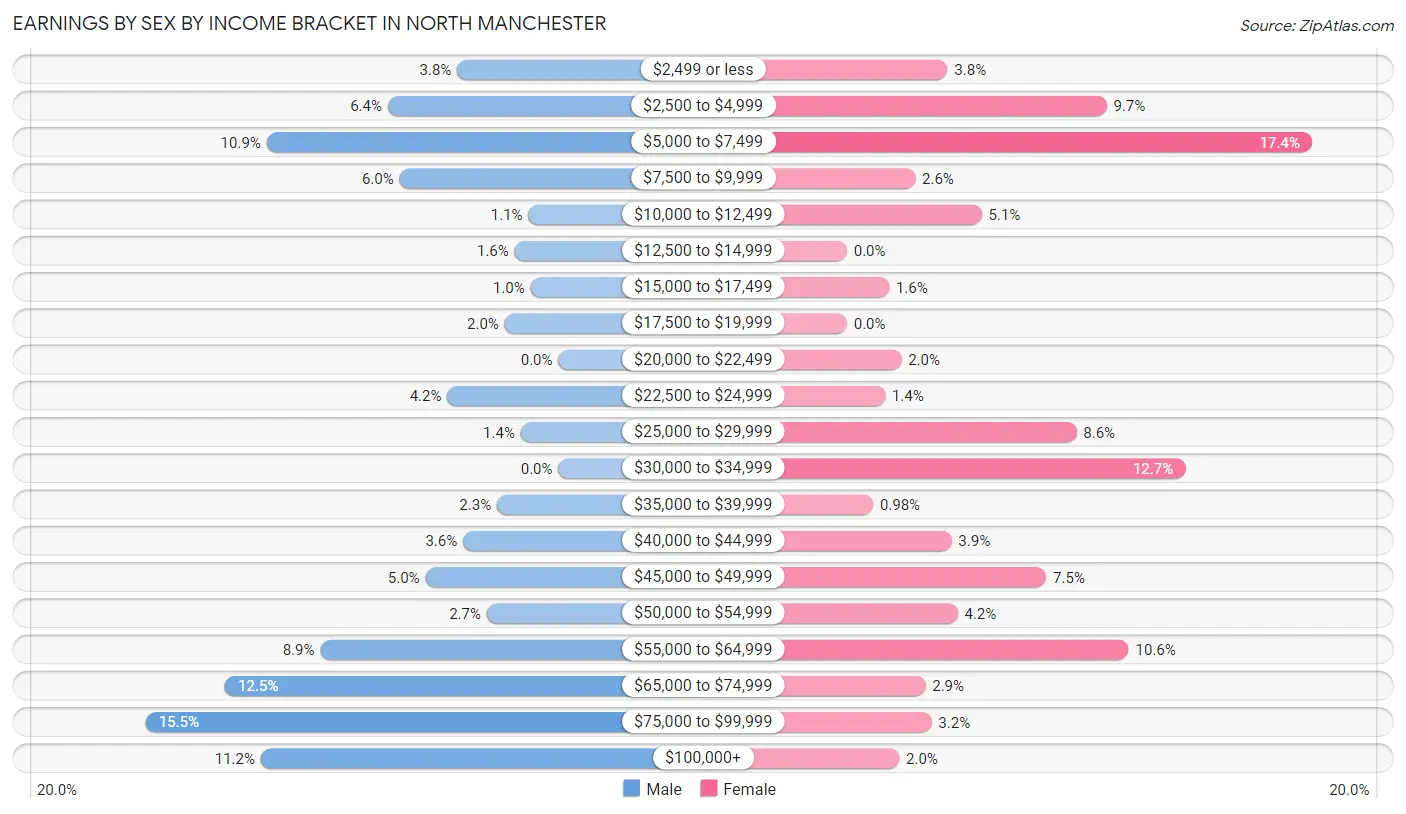
Earnings by Sex by Income Bracket in North Manchester
The most common earnings brackets in North Manchester are $75,000 to $99,999 for men (208 | 15.5%) and $5,000 to $7,499 for women (231 | 17.4%).
| Income | Male | Female |
| $2,499 or less | 51 (3.8%) | 50 (3.8%) |
| $2,500 to $4,999 | 86 (6.4%) | 129 (9.7%) |
| $5,000 to $7,499 | 147 (10.9%) | 231 (17.4%) |
| $7,500 to $9,999 | 80 (5.9%) | 34 (2.6%) |
| $10,000 to $12,499 | 15 (1.1%) | 67 (5.1%) |
| $12,500 to $14,999 | 22 (1.6%) | 0 (0.0%) |
| $15,000 to $17,499 | 14 (1.0%) | 21 (1.6%) |
| $17,500 to $19,999 | 27 (2.0%) | 0 (0.0%) |
| $20,000 to $22,499 | 0 (0.0%) | 27 (2.0%) |
| $22,500 to $24,999 | 56 (4.2%) | 19 (1.4%) |
| $25,000 to $29,999 | 19 (1.4%) | 114 (8.6%) |
| $30,000 to $34,999 | 0 (0.0%) | 168 (12.7%) |
| $35,000 to $39,999 | 31 (2.3%) | 13 (1.0%) |
| $40,000 to $44,999 | 48 (3.6%) | 52 (3.9%) |
| $45,000 to $49,999 | 67 (5.0%) | 99 (7.5%) |
| $50,000 to $54,999 | 36 (2.7%) | 55 (4.2%) |
| $55,000 to $64,999 | 120 (8.9%) | 140 (10.6%) |
| $65,000 to $74,999 | 168 (12.5%) | 39 (2.9%) |
| $75,000 to $99,999 | 208 (15.5%) | 42 (3.2%) |
| $100,000+ | 150 (11.2%) | 26 (2.0%) |
| Total | 1,345 (100.0%) | 1,326 (100.0%) |
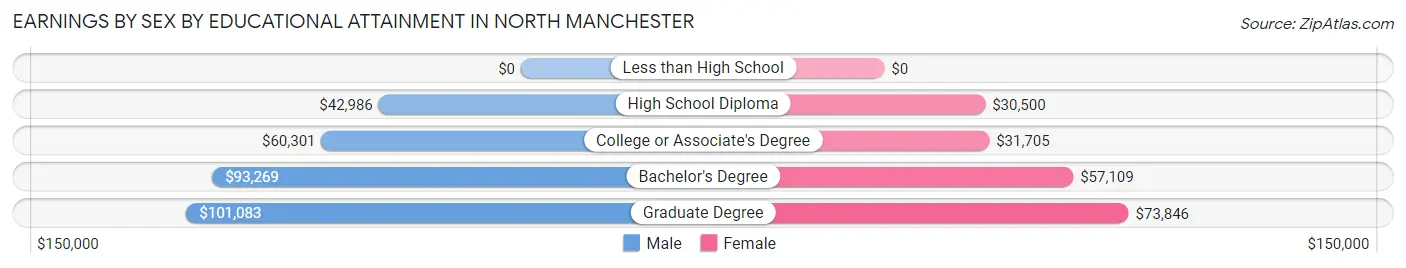
Earnings by Sex by Educational Attainment in North Manchester
Average earnings in North Manchester are $62,384 for men and $34,088 for women, a difference of 45.4%. Men with an educational attainment of graduate degree enjoy the highest average annual earnings of $101,083, while those with high school diploma education earn the least with $42,986. Women with an educational attainment of graduate degree earn the most with the average annual earnings of $73,846, while those with high school diploma education have the smallest earnings of $30,500.
| Educational Attainment | Male Income | Female Income |
| Less than High School | - | - |
| High School Diploma | $42,986 | $30,500 |
| College or Associate's Degree | $60,301 | $31,705 |
| Bachelor's Degree | $93,269 | $57,109 |
| Graduate Degree | $101,083 | $73,846 |
| Total | $62,384 | $34,088 |
Family Income in North Manchester
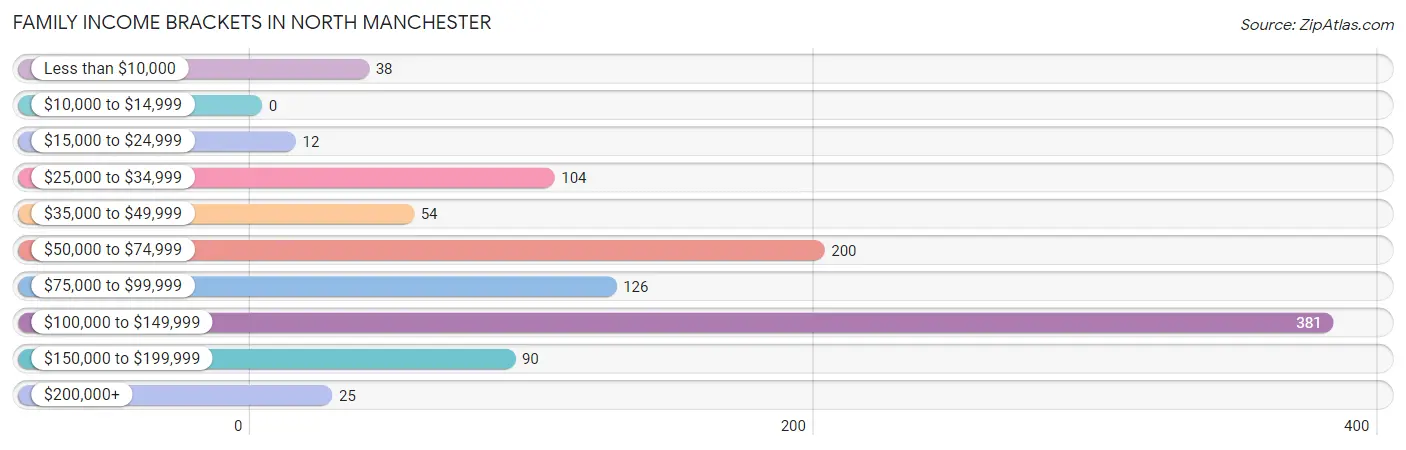
Family Income Brackets in North Manchester
According to the North Manchester family income data, there are 381 families falling into the $100,000 to $149,999 income range, which is the most common income bracket and makes up 37.0% of all families.
| Income Bracket | # Families | % Families |
| Less than $10,000 | 38 | 3.7% |
| $10,000 to $14,999 | 0 | 0.0% |
| $15,000 to $24,999 | 12 | 1.2% |
| $25,000 to $34,999 | 104 | 10.1% |
| $35,000 to $49,999 | 54 | 5.2% |
| $50,000 to $74,999 | 200 | 19.4% |
| $75,000 to $99,999 | 126 | 12.2% |
| $100,000 to $149,999 | 381 | 37.0% |
| $150,000 to $199,999 | 90 | 8.7% |
| $200,000+ | 25 | 2.4% |
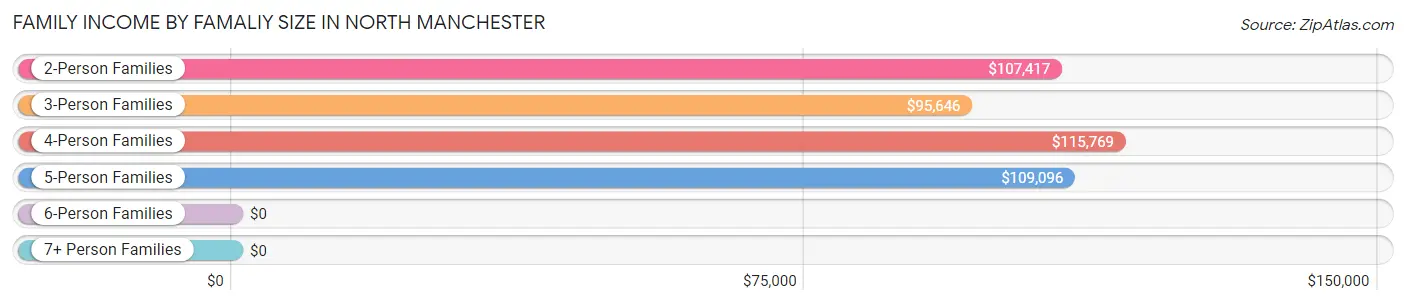
Family Income by Famaliy Size in North Manchester
4-person families (74 | 7.2%) account for the highest median family income in North Manchester with $115,769 per family, while 2-person families (577 | 56.1%) have the highest median income of $53,708 per family member.
| Income Bracket | # Families | Median Income |
| 2-Person Families | 577 (56.1%) | $107,417 |
| 3-Person Families | 247 (24.0%) | $95,646 |
| 4-Person Families | 74 (7.2%) | $115,769 |
| 5-Person Families | 96 (9.3%) | $109,096 |
| 6-Person Families | 0 (0.0%) | $0 |
| 7+ Person Families | 35 (3.4%) | $0 |
| Total | 1,029 (100.0%) | $97,028 |
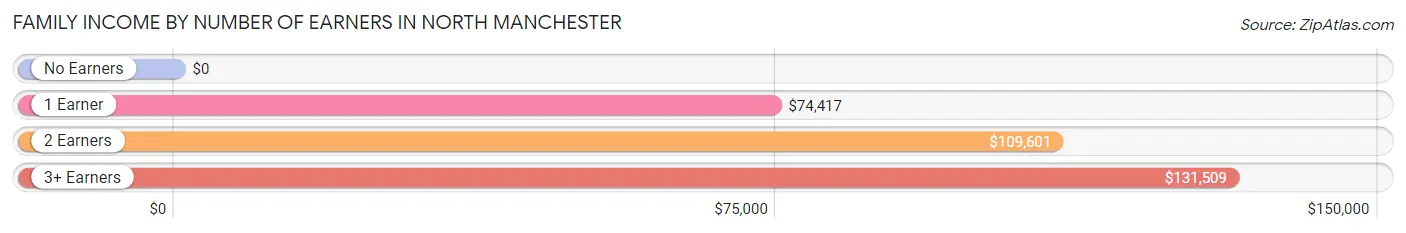
Family Income by Number of Earners in North Manchester
| Number of Earners | # Families | Median Income |
| No Earners | 161 (15.7%) | $0 |
| 1 Earner | 338 (32.9%) | $74,417 |
| 2 Earners | 441 (42.9%) | $109,601 |
| 3+ Earners | 89 (8.6%) | $131,509 |
| Total | 1,029 (100.0%) | $97,028 |
Household Income in North Manchester
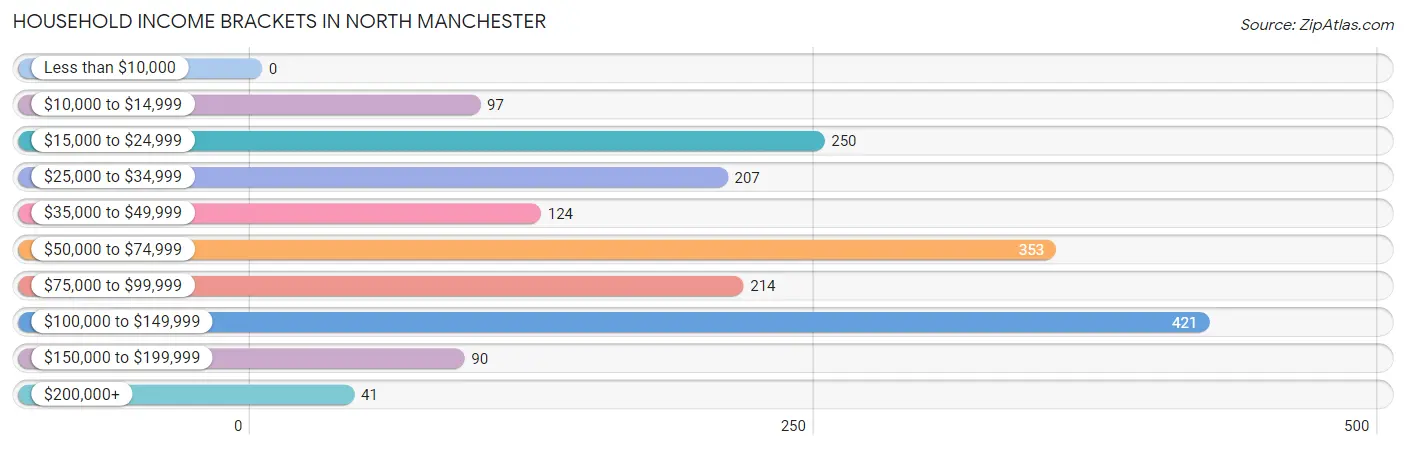
Household Income Brackets in North Manchester
With 421 households falling in the category, the $100,000 to $149,999 income range is the most frequent in North Manchester, accounting for 23.4% of all households.
| Income Bracket | # Households | % Households |
| Less than $10,000 | 0 | 0.0% |
| $10,000 to $14,999 | 97 | 5.4% |
| $15,000 to $24,999 | 250 | 13.9% |
| $25,000 to $34,999 | 207 | 11.5% |
| $35,000 to $49,999 | 124 | 6.9% |
| $50,000 to $74,999 | 353 | 19.6% |
| $75,000 to $99,999 | 214 | 11.9% |
| $100,000 to $149,999 | 421 | 23.4% |
| $150,000 to $199,999 | 90 | 5.0% |
| $200,000+ | 41 | 2.3% |
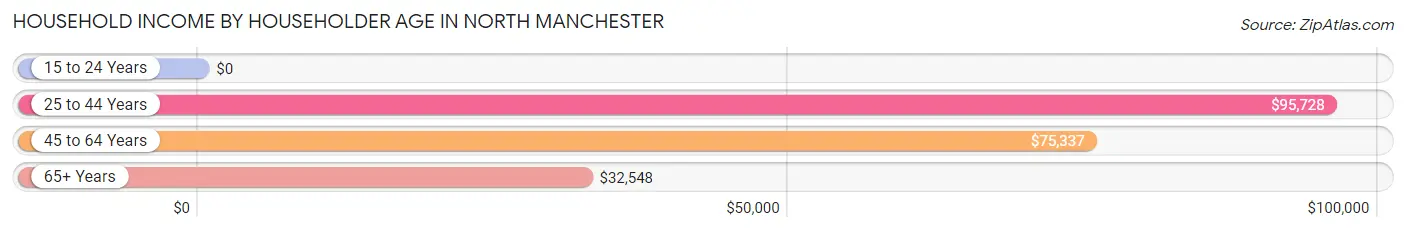
Household Income by Householder Age in North Manchester
The median household income in North Manchester is $63,029, with the highest median household income of $95,728 found in the 25 to 44 years age bracket for the primary householder. A total of 493 households (27.4%) fall into this category. Meanwhile, the 15 to 24 years age bracket for the primary householder has the lowest median household income of $0, with 12 households (0.7%) in this group.
| Income Bracket | # Households | Median Income |
| 15 to 24 Years | 12 (0.7%) | $0 |
| 25 to 44 Years | 493 (27.4%) | $95,728 |
| 45 to 64 Years | 609 (33.8%) | $75,337 |
| 65+ Years | 687 (38.2%) | $32,548 |
| Total | 1,801 (100.0%) | $63,029 |
Poverty in North Manchester
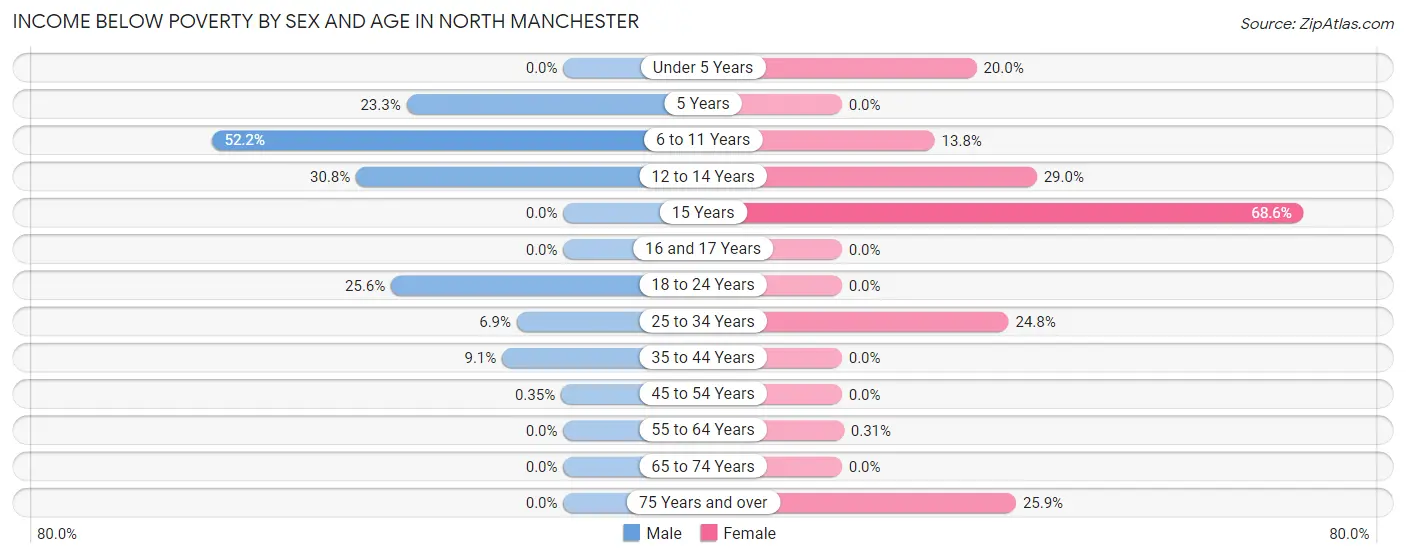
Income Below Poverty by Sex and Age in North Manchester
With 7.7% poverty level for males and 13.7% for females among the residents of North Manchester, 6 to 11 year old males and 15 year old females are the most vulnerable to poverty, with 35 males (52.2%) and 24 females (68.6%) in their respective age groups living below the poverty level.
| Age Bracket | Male | Female |
| Under 5 Years | 0 (0.0%) | 16 (20.0%) |
| 5 Years | 17 (23.3%) | 0 (0.0%) |
| 6 to 11 Years | 35 (52.2%) | 16 (13.8%) |
| 12 to 14 Years | 28 (30.8%) | 33 (28.9%) |
| 15 Years | 0 (0.0%) | 24 (68.6%) |
| 16 and 17 Years | 0 (0.0%) | 0 (0.0%) |
| 18 to 24 Years | 22 (25.6%) | 0 (0.0%) |
| 25 to 34 Years | 20 (6.9%) | 102 (24.8%) |
| 35 to 44 Years | 16 (9.1%) | 0 (0.0%) |
| 45 to 54 Years | 1 (0.4%) | 0 (0.0%) |
| 55 to 64 Years | 0 (0.0%) | 1 (0.3%) |
| 65 to 74 Years | 0 (0.0%) | 0 (0.0%) |
| 75 Years and over | 0 (0.0%) | 98 (25.9%) |
| Total | 139 (7.7%) | 290 (13.7%) |
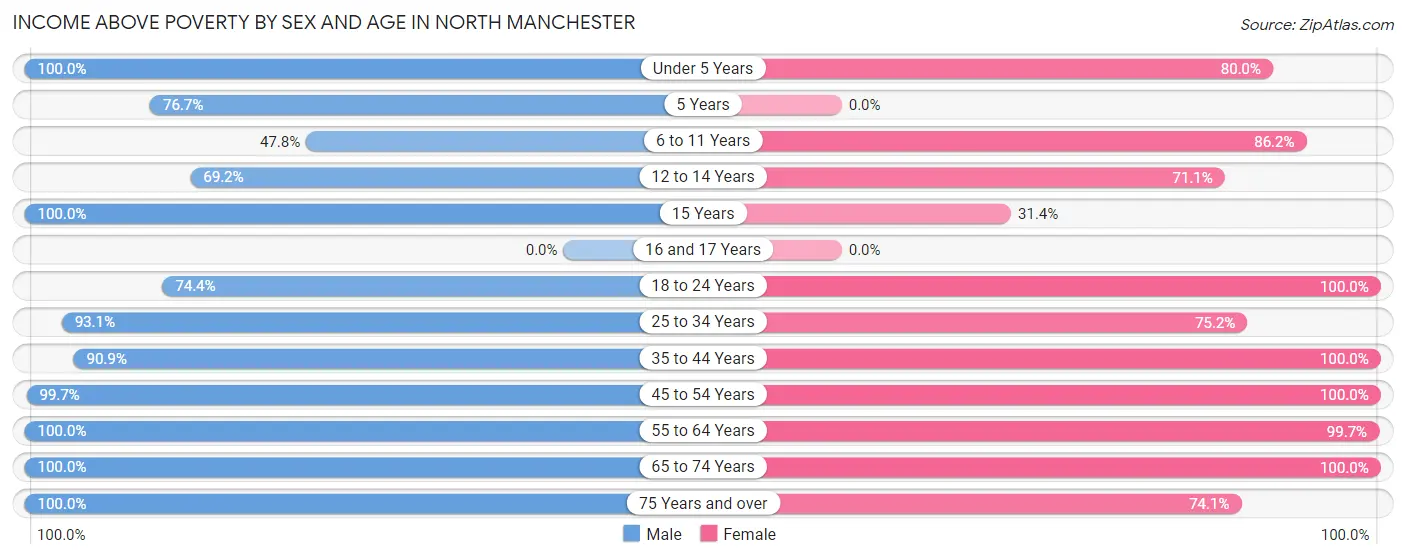
Income Above Poverty by Sex and Age in North Manchester
According to the poverty statistics in North Manchester, males aged under 5 years and females aged 18 to 24 years are the age groups that are most secure financially, with 100.0% of males and 100.0% of females in these age groups living above the poverty line.
| Age Bracket | Male | Female |
| Under 5 Years | 199 (100.0%) | 64 (80.0%) |
| 5 Years | 56 (76.7%) | 0 (0.0%) |
| 6 to 11 Years | 32 (47.8%) | 100 (86.2%) |
| 12 to 14 Years | 63 (69.2%) | 81 (71.1%) |
| 15 Years | 57 (100.0%) | 11 (31.4%) |
| 16 and 17 Years | 0 (0.0%) | 0 (0.0%) |
| 18 to 24 Years | 64 (74.4%) | 90 (100.0%) |
| 25 to 34 Years | 270 (93.1%) | 310 (75.2%) |
| 35 to 44 Years | 160 (90.9%) | 113 (100.0%) |
| 45 to 54 Years | 283 (99.7%) | 225 (100.0%) |
| 55 to 64 Years | 215 (100.0%) | 325 (99.7%) |
| 65 to 74 Years | 139 (100.0%) | 235 (100.0%) |
| 75 Years and over | 131 (100.0%) | 281 (74.1%) |
| Total | 1,669 (92.3%) | 1,835 (86.4%) |
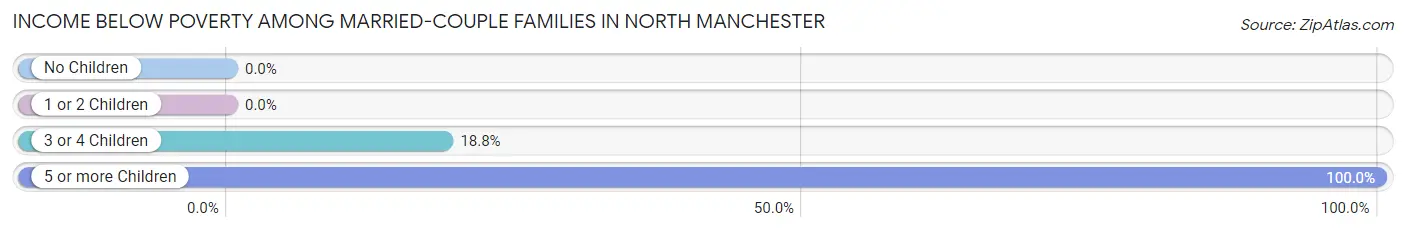
Income Below Poverty Among Married-Couple Families in North Manchester
The poverty statistics for married-couple families in North Manchester show that 4.9% or 39 of the total 801 families live below the poverty line. Families with 5 or more children have the highest poverty rate of 100.0%, comprising of 21 families. On the other hand, families with no children have the lowest poverty rate of 0.0%, which includes 0 families.
| Children | Above Poverty | Below Poverty |
| No Children | 507 (100.0%) | 0 (0.0%) |
| 1 or 2 Children | 177 (100.0%) | 0 (0.0%) |
| 3 or 4 Children | 78 (81.2%) | 18 (18.8%) |
| 5 or more Children | 0 (0.0%) | 21 (100.0%) |
| Total | 762 (95.1%) | 39 (4.9%) |
Income Below Poverty Among Single-Parent Households in North Manchester
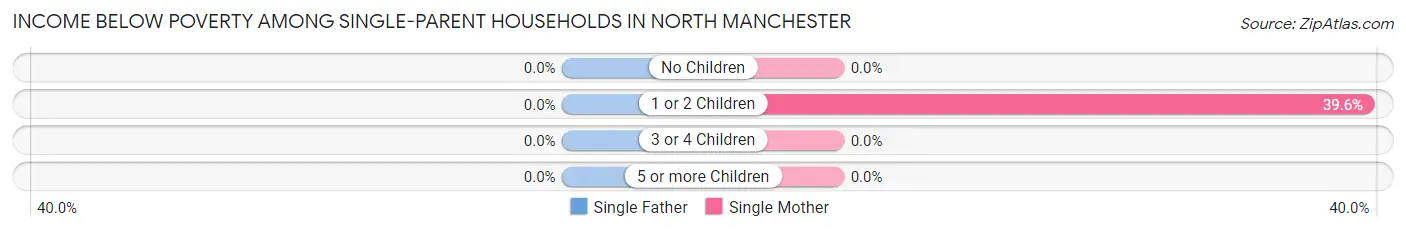
| Children | Single Father | Single Mother |
| No Children | 0 (0.0%) | 0 (0.0%) |
| 1 or 2 Children | 0 (0.0%) | 38 (39.6%) |
| 3 or 4 Children | 0 (0.0%) | 0 (0.0%) |
| 5 or more Children | 0 (0.0%) | 0 (0.0%) |
| Total | 0 (0.0%) | 38 (22.2%) |
Income Below Poverty Among Married-Couple vs Single-Parent Households in North Manchester
The poverty data for North Manchester shows that 39 of the married-couple family households (4.9%) and 38 of the single-parent households (16.7%) are living below the poverty level. Within the married-couple family households, those with 5 or more children have the highest poverty rate, with 21 households (100.0%) falling below the poverty line. Among the single-parent households, those with 1 or 2 children have the highest poverty rate, with 38 household (30.2%) living below poverty.
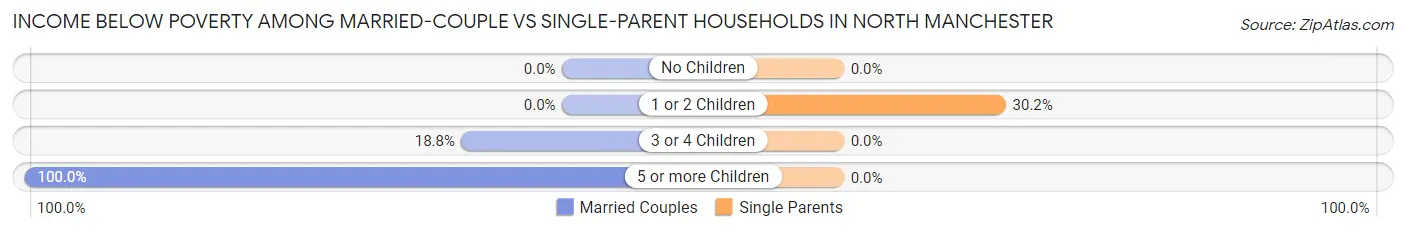
| Children | Married-Couple Families | Single-Parent Households |
| No Children | 0 (0.0%) | 0 (0.0%) |
| 1 or 2 Children | 0 (0.0%) | 38 (30.2%) |
| 3 or 4 Children | 18 (18.8%) | 0 (0.0%) |
| 5 or more Children | 21 (100.0%) | 0 (0.0%) |
| Total | 39 (4.9%) | 38 (16.7%) |
Race in North Manchester
The most populous races in North Manchester are White / Caucasian (4,603 | 91.7%), Black / African American (204 | 4.1%), and Hispanic or Latino (185 | 3.7%).
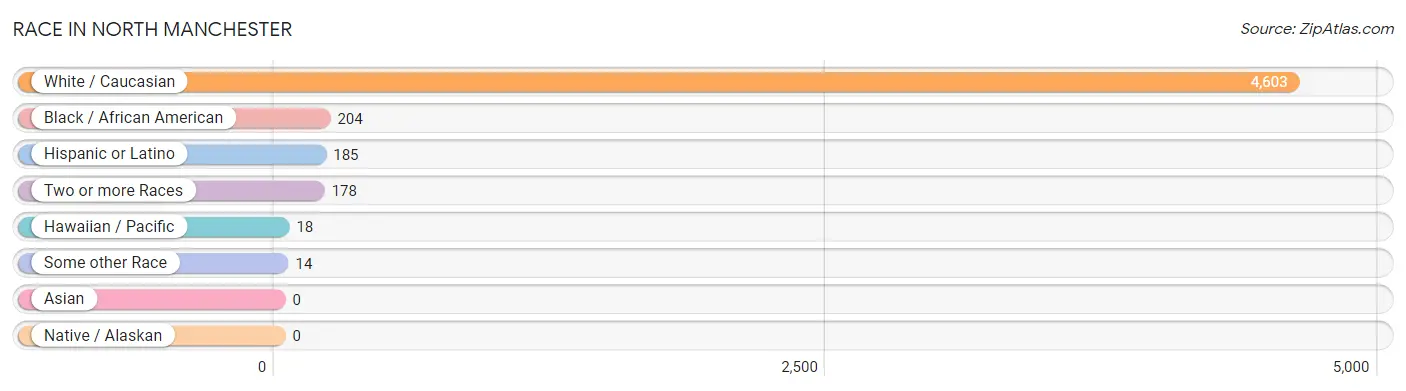
| Race | # Population | % Population |
| Asian | 0 | 0.0% |
| Black / African American | 204 | 4.1% |
| Hawaiian / Pacific | 18 | 0.4% |
| Hispanic or Latino | 185 | 3.7% |
| Native / Alaskan | 0 | 0.0% |
| White / Caucasian | 4,603 | 91.7% |
| Two or more Races | 178 | 3.5% |
| Some other Race | 14 | 0.3% |
| Total | 5,017 | 100.0% |
Ancestry in North Manchester
The most populous ancestries reported in North Manchester are German (1,341 | 26.7%), English (680 | 13.6%), Irish (520 | 10.4%), American (330 | 6.6%), and Norwegian (223 | 4.4%), together accounting for 61.7% of all North Manchester residents.
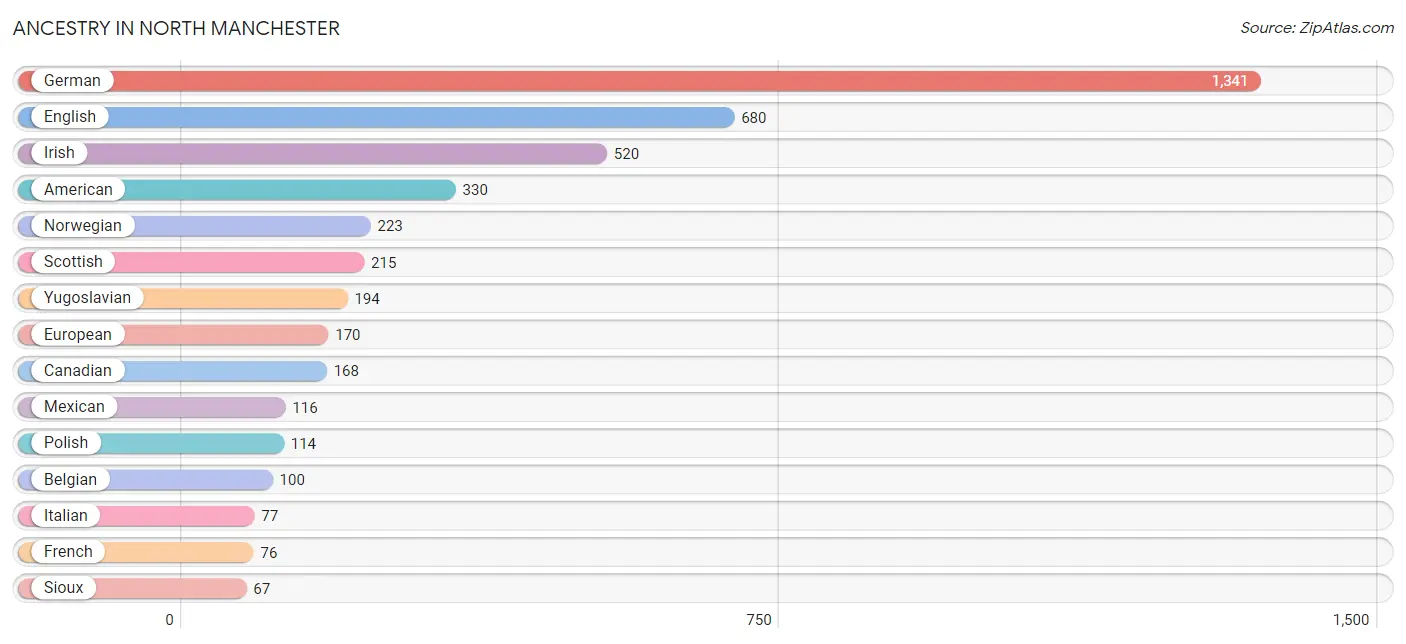
| Ancestry | # Population | % Population |
| American | 330 | 6.6% |
| Arab | 18 | 0.4% |
| Bahamian | 5 | 0.1% |
| Belgian | 100 | 2.0% |
| Canadian | 168 | 3.4% |
| Cuban | 55 | 1.1% |
| Czechoslovakian | 12 | 0.2% |
| Dutch | 31 | 0.6% |
| Eastern European | 13 | 0.3% |
| Ecuadorian | 4 | 0.1% |
| English | 680 | 13.6% |
| European | 170 | 3.4% |
| French | 76 | 1.5% |
| French Canadian | 9 | 0.2% |
| German | 1,341 | 26.7% |
| Indonesian | 9 | 0.2% |
| Iraqi | 18 | 0.4% |
| Irish | 520 | 10.4% |
| Italian | 77 | 1.5% |
| Liberian | 5 | 0.1% |
| Mexican | 116 | 2.3% |
| Northern European | 5 | 0.1% |
| Norwegian | 223 | 4.4% |
| Pennsylvania German | 4 | 0.1% |
| Polish | 114 | 2.3% |
| Portuguese | 4 | 0.1% |
| Russian | 48 | 1.0% |
| Scotch-Irish | 36 | 0.7% |
| Scottish | 215 | 4.3% |
| Sioux | 67 | 1.3% |
| Slovak | 13 | 0.3% |
| South American | 4 | 0.1% |
| Spaniard | 5 | 0.1% |
| Subsaharan African | 26 | 0.5% |
| Swedish | 34 | 0.7% |
| Swiss | 24 | 0.5% |
| Ukrainian | 28 | 0.6% |
| Welsh | 35 | 0.7% |
| Yugoslavian | 194 | 3.9% | View All 39 Rows |
Immigrants in North Manchester
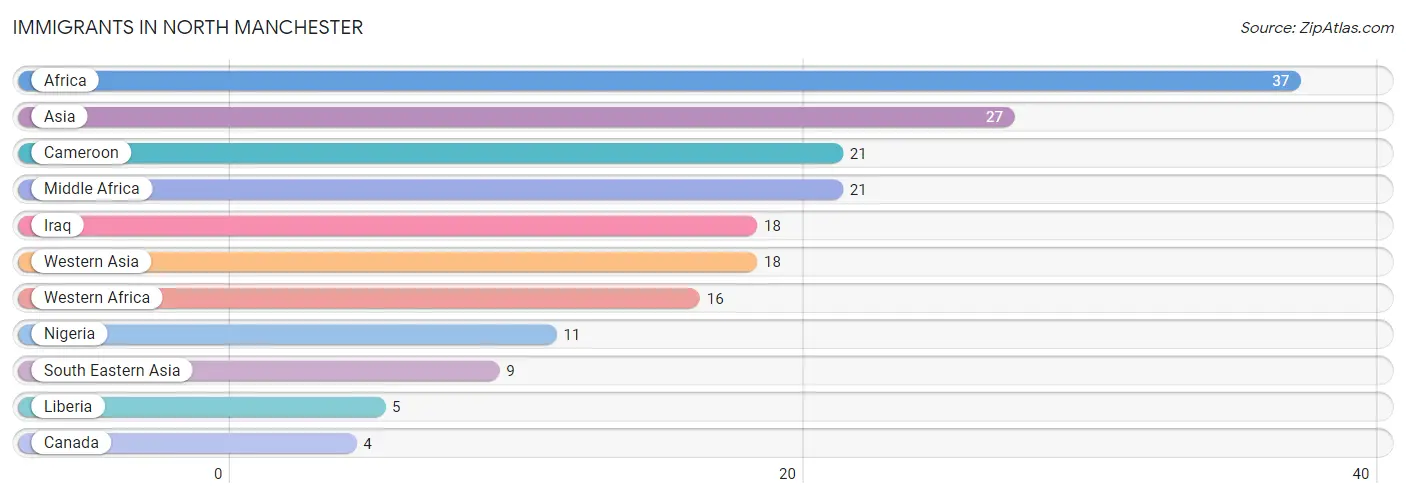
The most numerous immigrant groups reported in North Manchester came from Africa (37 | 0.7%), Asia (27 | 0.5%), Cameroon (21 | 0.4%), Middle Africa (21 | 0.4%), and Iraq (18 | 0.4%), together accounting for 2.5% of all North Manchester residents.
| Immigration Origin | # Population | % Population |
| Africa | 37 | 0.7% |
| Asia | 27 | 0.5% |
| Cameroon | 21 | 0.4% |
| Canada | 4 | 0.1% |
| Iraq | 18 | 0.4% |
| Liberia | 5 | 0.1% |
| Middle Africa | 21 | 0.4% |
| Nigeria | 11 | 0.2% |
| South Eastern Asia | 9 | 0.2% |
| Western Africa | 16 | 0.3% |
| Western Asia | 18 | 0.4% | View All 11 Rows |
Sex and Age in North Manchester
Sex and Age in North Manchester
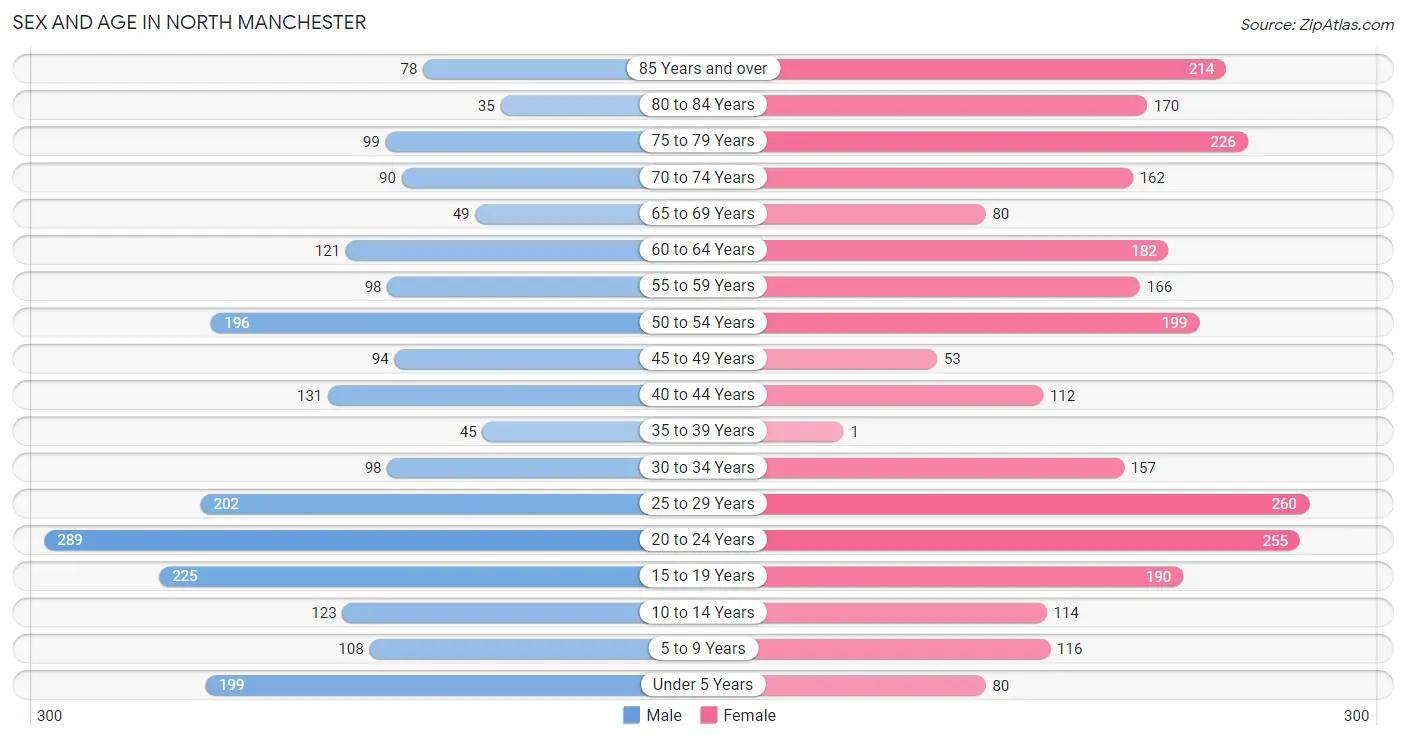
The most populous age groups in North Manchester are 20 to 24 Years (289 | 12.7%) for men and 25 to 29 Years (260 | 9.5%) for women.
| Age Bracket | Male | Female |
| Under 5 Years | 199 (8.7%) | 80 (2.9%) |
| 5 to 9 Years | 108 (4.7%) | 116 (4.2%) |
| 10 to 14 Years | 123 (5.4%) | 114 (4.2%) |
| 15 to 19 Years | 225 (9.9%) | 190 (6.9%) |
| 20 to 24 Years | 289 (12.7%) | 255 (9.3%) |
| 25 to 29 Years | 202 (8.9%) | 260 (9.5%) |
| 30 to 34 Years | 98 (4.3%) | 157 (5.7%) |
| 35 to 39 Years | 45 (2.0%) | 1 (0.0%) |
| 40 to 44 Years | 131 (5.8%) | 112 (4.1%) |
| 45 to 49 Years | 94 (4.1%) | 53 (1.9%) |
| 50 to 54 Years | 196 (8.6%) | 199 (7.3%) |
| 55 to 59 Years | 98 (4.3%) | 166 (6.1%) |
| 60 to 64 Years | 121 (5.3%) | 182 (6.7%) |
| 65 to 69 Years | 49 (2.1%) | 80 (2.9%) |
| 70 to 74 Years | 90 (4.0%) | 162 (5.9%) |
| 75 to 79 Years | 99 (4.3%) | 226 (8.3%) |
| 80 to 84 Years | 35 (1.5%) | 170 (6.2%) |
| 85 Years and over | 78 (3.4%) | 214 (7.8%) |
| Total | 2,280 (100.0%) | 2,737 (100.0%) |
Families and Households in North Manchester
Median Family Size in North Manchester
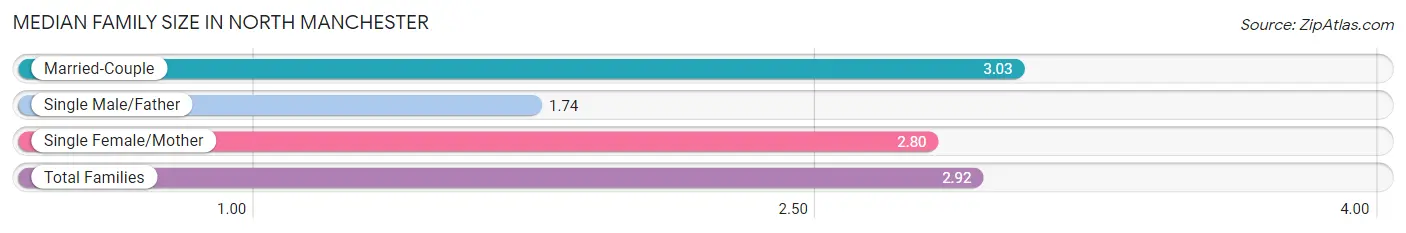
The median family size in North Manchester is 2.92 persons per family, with married-couple families (801 | 77.8%) accounting for the largest median family size of 3.03 persons per family. On the other hand, single male/father families (57 | 5.5%) represent the smallest median family size with 1.74 persons per family.
| Family Type | # Families | Family Size |
| Married-Couple | 801 (77.8%) | 3.03 |
| Single Male/Father | 57 (5.5%) | 1.74 |
| Single Female/Mother | 171 (16.6%) | 2.80 |
| Total Families | 1,029 (100.0%) | 2.92 |
Median Household Size in North Manchester
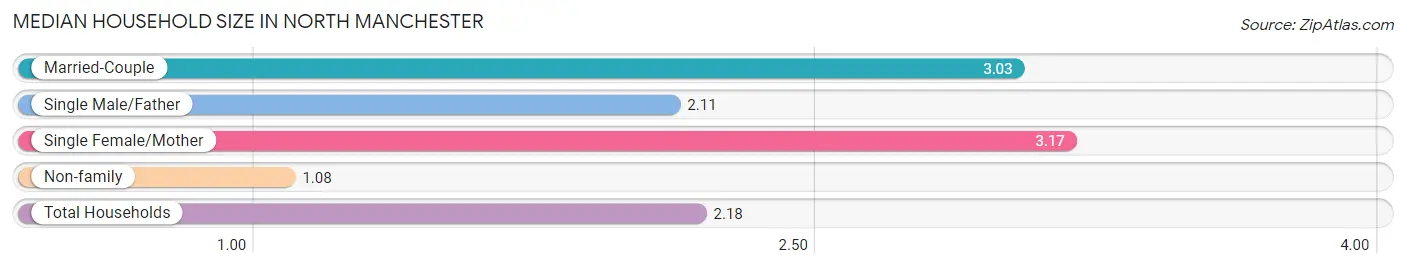
The median household size in North Manchester is 2.18 persons per household, with single female/mother households (171 | 9.5%) accounting for the largest median household size of 3.17 persons per household. non-family households (772 | 42.9%) represent the smallest median household size with 1.08 persons per household.
| Household Type | # Households | Household Size |
| Married-Couple | 801 (44.5%) | 3.03 |
| Single Male/Father | 57 (3.2%) | 2.11 |
| Single Female/Mother | 171 (9.5%) | 3.17 |
| Non-family | 772 (42.9%) | 1.08 |
| Total Households | 1,801 (100.0%) | 2.18 |
Household Size by Marriage Status in North Manchester
Out of a total of 1,801 households in North Manchester, 1,029 (57.1%) are family households, while 772 (42.9%) are nonfamily households. The most numerous type of family households are 2-person households, comprising 490, and the most common type of nonfamily households are 1-person households, comprising 715.
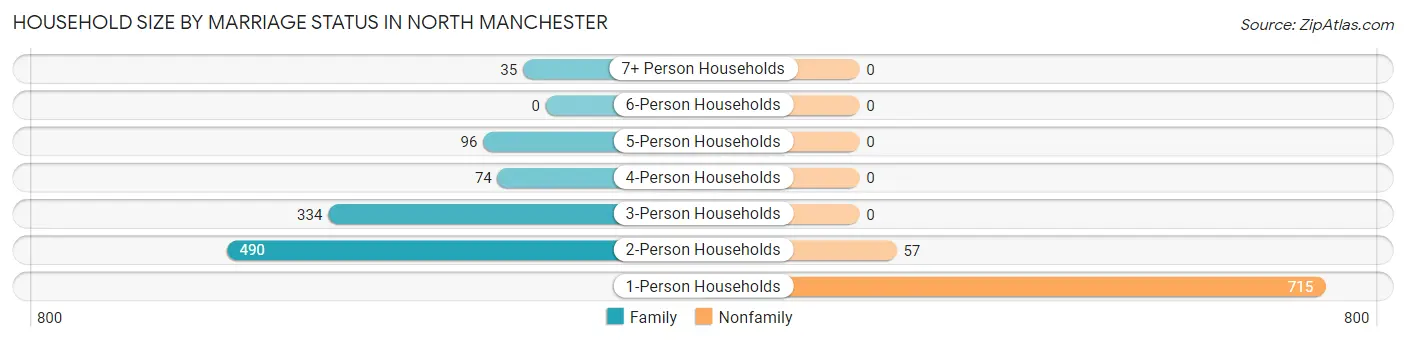
| Household Size | Family Households | Nonfamily Households |
| 1-Person Households | - | 715 (39.7%) |
| 2-Person Households | 490 (27.2%) | 57 (3.2%) |
| 3-Person Households | 334 (18.5%) | 0 (0.0%) |
| 4-Person Households | 74 (4.1%) | 0 (0.0%) |
| 5-Person Households | 96 (5.3%) | 0 (0.0%) |
| 6-Person Households | 0 (0.0%) | 0 (0.0%) |
| 7+ Person Households | 35 (1.9%) | 0 (0.0%) |
| Total | 1,029 (57.1%) | 772 (42.9%) |
Female Fertility in North Manchester
Fertility by Age in North Manchester
Average fertility rate in North Manchester is 32.0 births per 1,000 women. Women in the age bracket of 20 to 34 years have the highest fertility rate with 49.0 births per 1,000 women. Women in the age bracket of 20 to 34 years acount for 100.0% of all women with births.
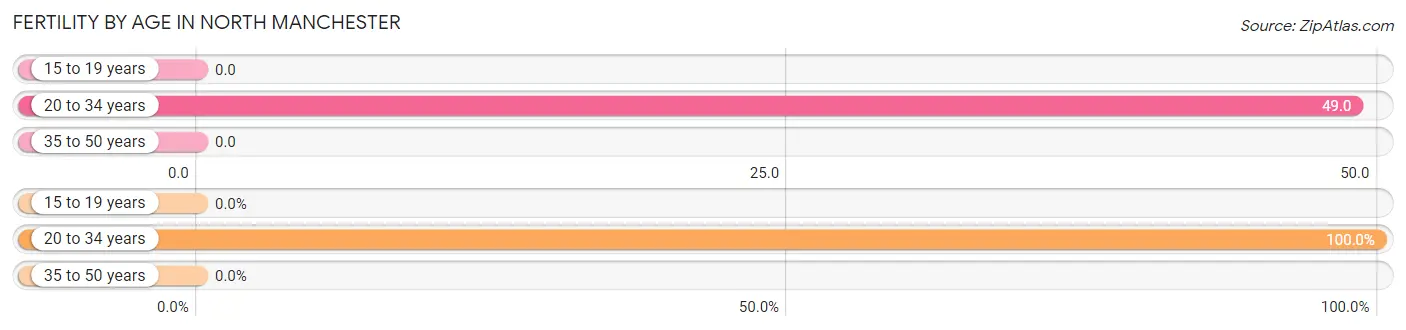
| Age Bracket | Women with Births | Births / 1,000 Women |
| 15 to 19 years | 0 (0.0%) | 0.0 |
| 20 to 34 years | 33 (100.0%) | 49.0 |
| 35 to 50 years | 0 (0.0%) | 0.0 |
| Total | 33 (100.0%) | 32.0 |
Fertility by Age by Marriage Status in North Manchester
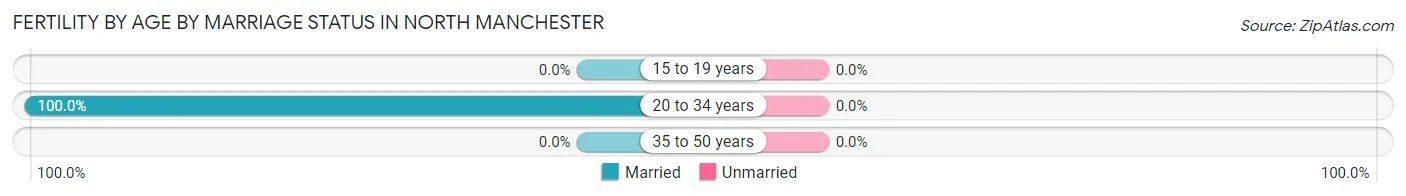
| Age Bracket | Married | Unmarried |
| 15 to 19 years | 0 (0.0%) | 0 (0.0%) |
| 20 to 34 years | 33 (100.0%) | 0 (0.0%) |
| 35 to 50 years | 0 (0.0%) | 0 (0.0%) |
| Total | 33 (100.0%) | 0 (0.0%) |
Fertility by Education in North Manchester
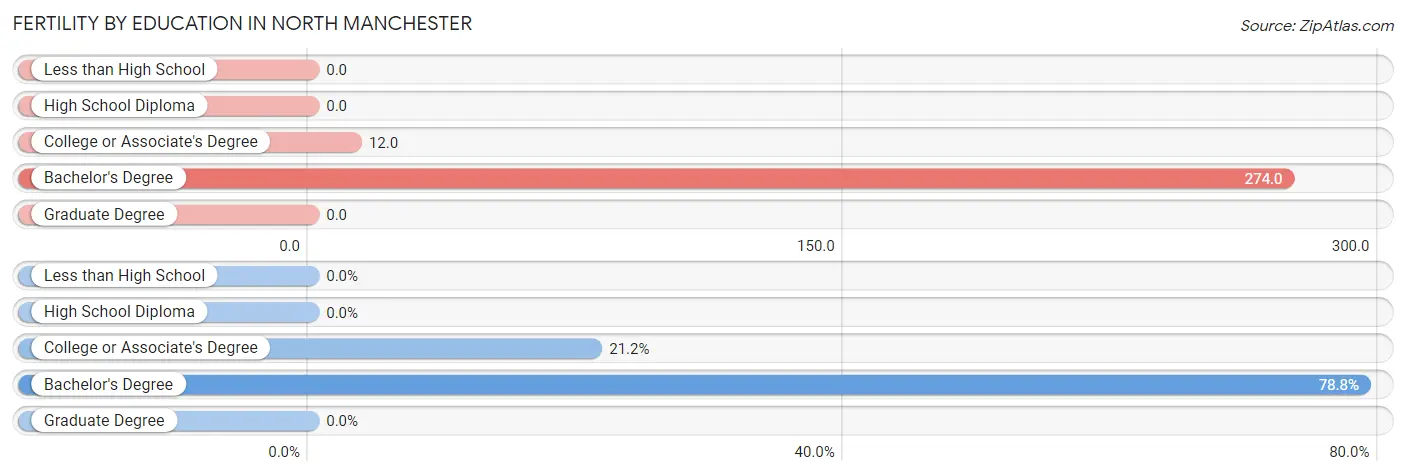
| Educational Attainment | Women with Births | Births / 1,000 Women |
| Less than High School | 0 (0.0%) | 0.0 |
| High School Diploma | 0 (0.0%) | 0.0 |
| College or Associate's Degree | 7 (21.2%) | 12.0 |
| Bachelor's Degree | 26 (78.8%) | 274.0 |
| Graduate Degree | 0 (0.0%) | 0.0 |
| Total | 33 (100.0%) | 32.0 |
Fertility by Education by Marriage Status in North Manchester
| Educational Attainment | Married | Unmarried |
| Less than High School | 0 (0.0%) | 0 (0.0%) |
| High School Diploma | 0 (0.0%) | 0 (0.0%) |
| College or Associate's Degree | 7 (100.0%) | 0 (0.0%) |
| Bachelor's Degree | 26 (100.0%) | 0 (0.0%) |
| Graduate Degree | 0 (0.0%) | 0 (0.0%) |
| Total | 33 (100.0%) | 0 (0.0%) |
Employment Characteristics in North Manchester
Employment by Class of Employer in North Manchester
Among the 2,293 employed individuals in North Manchester, private company employees (1,381 | 60.2%), not-for-profit organizations (428 | 18.7%), and local government employees (246 | 10.7%) make up the most common classes of employment.
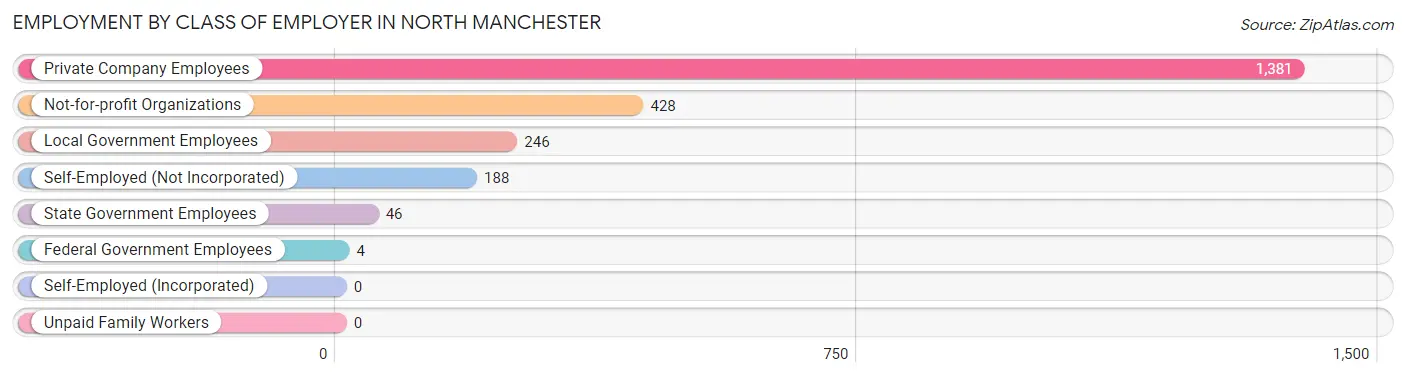
| Employer Class | # Employees | % Employees |
| Private Company Employees | 1,381 | 60.2% |
| Self-Employed (Incorporated) | 0 | 0.0% |
| Self-Employed (Not Incorporated) | 188 | 8.2% |
| Not-for-profit Organizations | 428 | 18.7% |
| Local Government Employees | 246 | 10.7% |
| State Government Employees | 46 | 2.0% |
| Federal Government Employees | 4 | 0.2% |
| Unpaid Family Workers | 0 | 0.0% |
| Total | 2,293 | 100.0% |
Employment Status by Age in North Manchester
According to the labor force statistics for North Manchester, out of the total population over 16 years of age (4,185), 56.8% or 2,377 individuals are in the labor force, with 2.4% or 57 of them unemployed. The age group with the highest labor force participation rate is 25 to 29 years, with 95.5% or 441 individuals in the labor force. Within the labor force, the 16 to 19 years age range has the highest percentage of unemployed individuals, with 8.1% or 12 of them being unemployed.
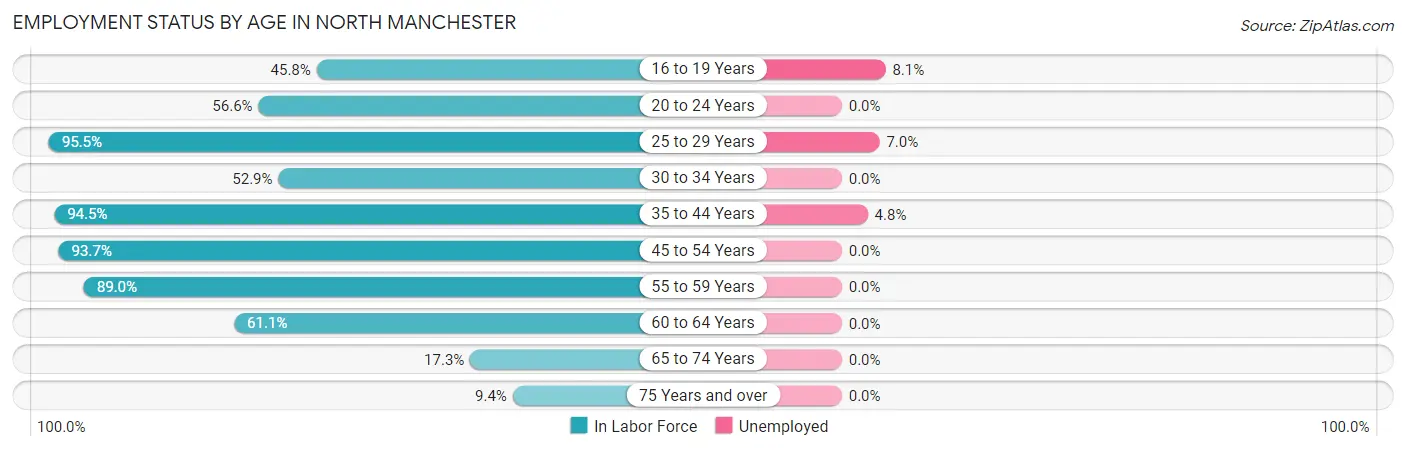
| Age Bracket | In Labor Force | Unemployed |
| 16 to 19 Years | 148 (45.8%) | 12 (8.1%) |
| 20 to 24 Years | 308 (56.6%) | 0 (0.0%) |
| 25 to 29 Years | 441 (95.5%) | 31 (7.0%) |
| 30 to 34 Years | 135 (52.9%) | 0 (0.0%) |
| 35 to 44 Years | 273 (94.5%) | 13 (4.8%) |
| 45 to 54 Years | 508 (93.7%) | 0 (0.0%) |
| 55 to 59 Years | 235 (89.0%) | 0 (0.0%) |
| 60 to 64 Years | 185 (61.1%) | 0 (0.0%) |
| 65 to 74 Years | 66 (17.3%) | 0 (0.0%) |
| 75 Years and over | 77 (9.4%) | 0 (0.0%) |
| Total | 2,377 (56.8%) | 57 (2.4%) |
Employment Status by Educational Attainment in North Manchester
According to labor force statistics for North Manchester, 84.0% of individuals (1,777) out of the total population between 25 and 64 years of age (2,115) are in the labor force, with 2.5% or 44 of them being unemployed. The group with the highest labor force participation rate are those with the educational attainment of bachelor's degree or higher, with 91.2% or 602 individuals in the labor force. Within the labor force, individuals with high school diploma education have the highest percentage of unemployment, with 9.4% or 42 of them being unemployed.
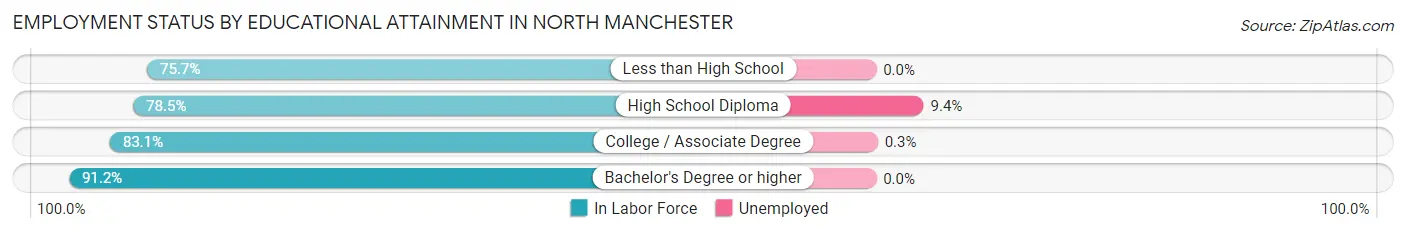
| Educational Attainment | In Labor Force | Unemployed |
| Less than High School | 78 (75.7%) | 0 (0.0%) |
| High School Diploma | 448 (78.5%) | 54 (9.4%) |
| College / Associate Degree | 649 (83.1%) | 2 (0.3%) |
| Bachelor's Degree or higher | 602 (91.2%) | 0 (0.0%) |
| Total | 1,777 (84.0%) | 53 (2.5%) |
Employment Occupations by Sex in North Manchester
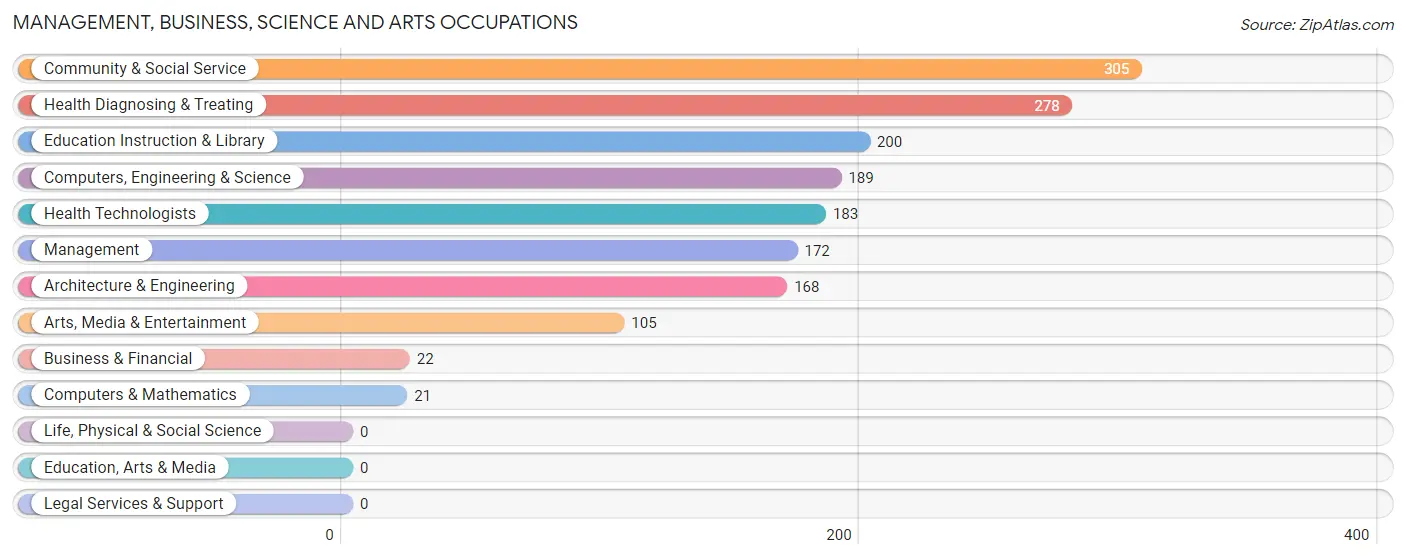
Management, Business, Science and Arts Occupations
The most common Management, Business, Science and Arts occupations in North Manchester are Community & Social Service (305 | 13.2%), Health Diagnosing & Treating (278 | 12.0%), Education Instruction & Library (200 | 8.6%), Computers, Engineering & Science (189 | 8.2%), and Health Technologists (183 | 7.9%).
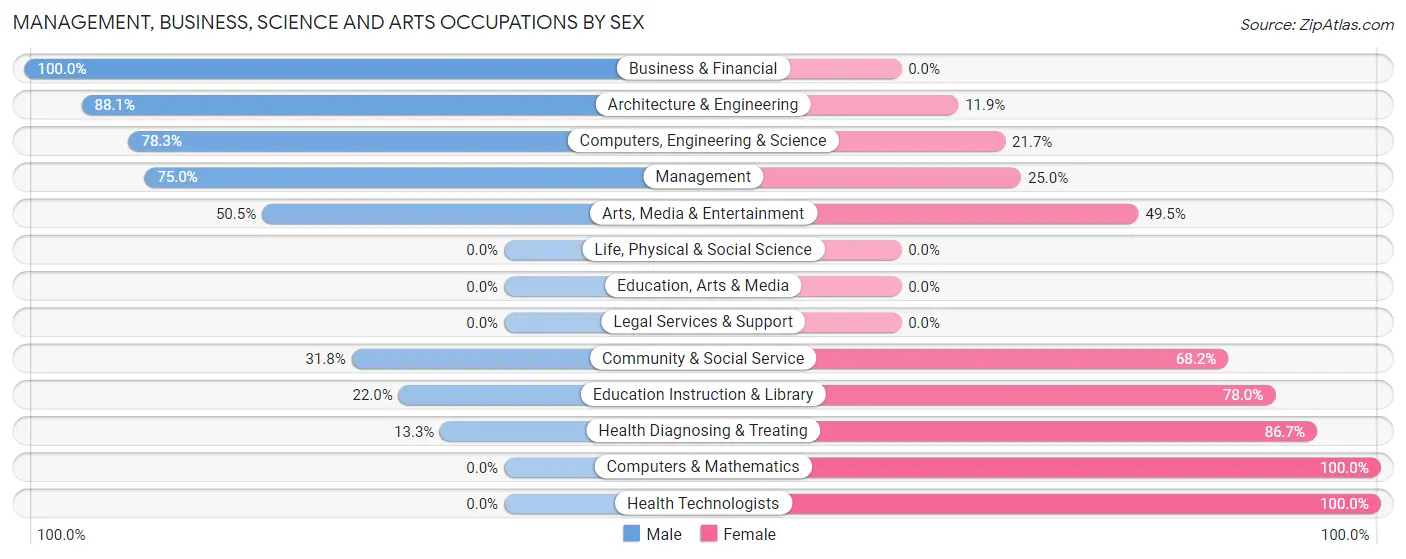
Management, Business, Science and Arts Occupations by Sex
Within the Management, Business, Science and Arts occupations in North Manchester, the most male-oriented occupations are Business & Financial (100.0%), Architecture & Engineering (88.1%), and Computers, Engineering & Science (78.3%), while the most female-oriented occupations are Computers & Mathematics (100.0%), Health Technologists (100.0%), and Health Diagnosing & Treating (86.7%).
| Occupation | Male | Female |
| Management | 129 (75.0%) | 43 (25.0%) |
| Business & Financial | 22 (100.0%) | 0 (0.0%) |
| Computers, Engineering & Science | 148 (78.3%) | 41 (21.7%) |
| Computers & Mathematics | 0 (0.0%) | 21 (100.0%) |
| Architecture & Engineering | 148 (88.1%) | 20 (11.9%) |
| Life, Physical & Social Science | 0 (0.0%) | 0 (0.0%) |
| Community & Social Service | 97 (31.8%) | 208 (68.2%) |
| Education, Arts & Media | 0 (0.0%) | 0 (0.0%) |
| Legal Services & Support | 0 (0.0%) | 0 (0.0%) |
| Education Instruction & Library | 44 (22.0%) | 156 (78.0%) |
| Arts, Media & Entertainment | 53 (50.5%) | 52 (49.5%) |
| Health Diagnosing & Treating | 37 (13.3%) | 241 (86.7%) |
| Health Technologists | 0 (0.0%) | 183 (100.0%) |
| Total (Category) | 433 (44.8%) | 533 (55.2%) |
| Total (Overall) | 1,100 (47.4%) | 1,220 (52.6%) |
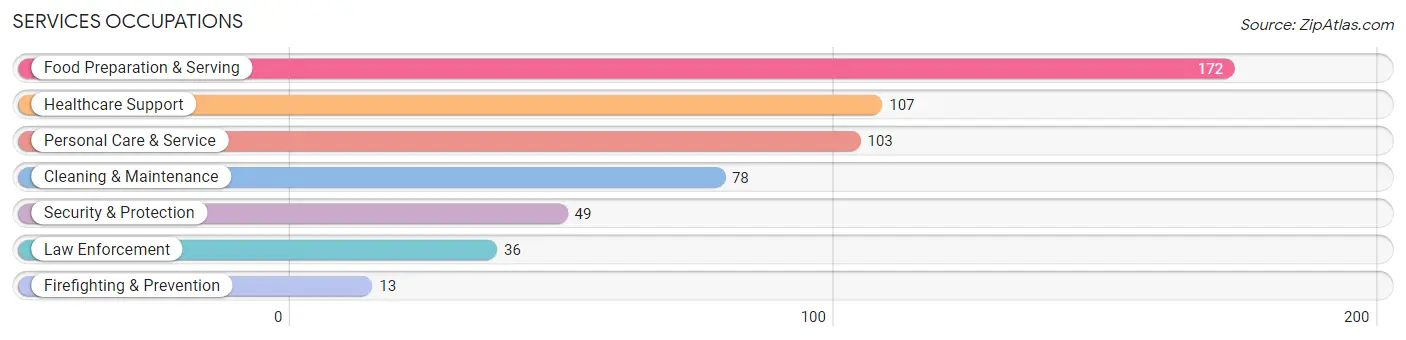
Services Occupations
The most common Services occupations in North Manchester are Food Preparation & Serving (172 | 7.4%), Healthcare Support (107 | 4.6%), Personal Care & Service (103 | 4.4%), Cleaning & Maintenance (78 | 3.4%), and Security & Protection (49 | 2.1%).
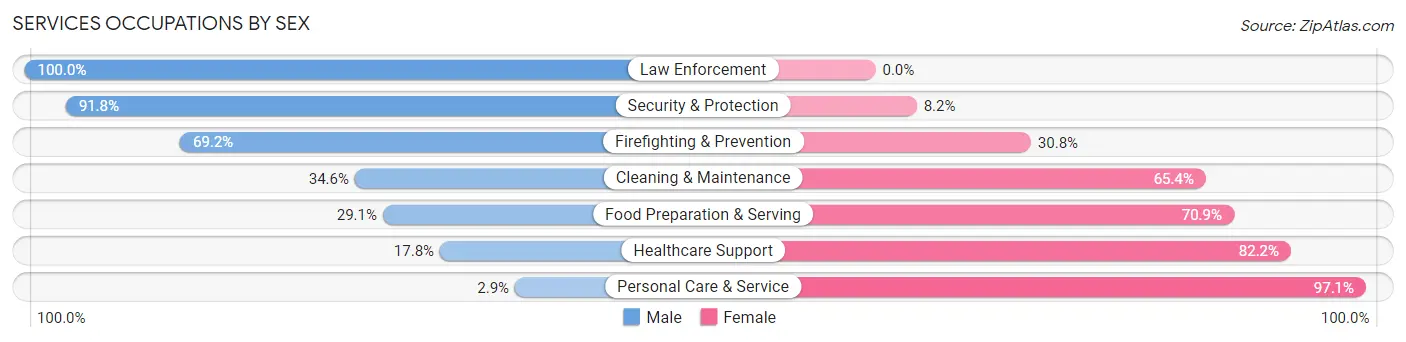
Services Occupations by Sex
Within the Services occupations in North Manchester, the most male-oriented occupations are Law Enforcement (100.0%), Security & Protection (91.8%), and Firefighting & Prevention (69.2%), while the most female-oriented occupations are Personal Care & Service (97.1%), Healthcare Support (82.2%), and Food Preparation & Serving (70.9%).
| Occupation | Male | Female |
| Healthcare Support | 19 (17.8%) | 88 (82.2%) |
| Security & Protection | 45 (91.8%) | 4 (8.2%) |
| Firefighting & Prevention | 9 (69.2%) | 4 (30.8%) |
| Law Enforcement | 36 (100.0%) | 0 (0.0%) |
| Food Preparation & Serving | 50 (29.1%) | 122 (70.9%) |
| Cleaning & Maintenance | 27 (34.6%) | 51 (65.4%) |
| Personal Care & Service | 3 (2.9%) | 100 (97.1%) |
| Total (Category) | 144 (28.3%) | 365 (71.7%) |
| Total (Overall) | 1,100 (47.4%) | 1,220 (52.6%) |
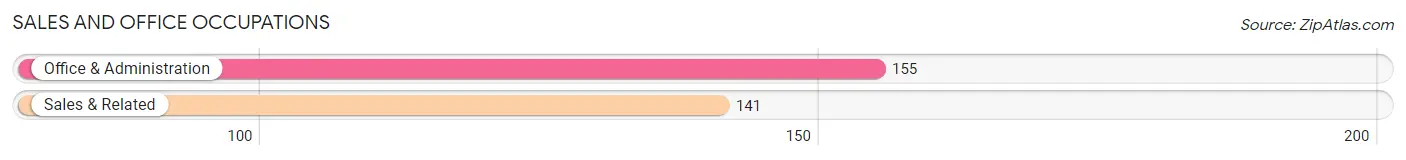
Sales and Office Occupations
The most common Sales and Office occupations in North Manchester are Office & Administration (155 | 6.7%), and Sales & Related (141 | 6.1%).
Sales and Office Occupations by Sex
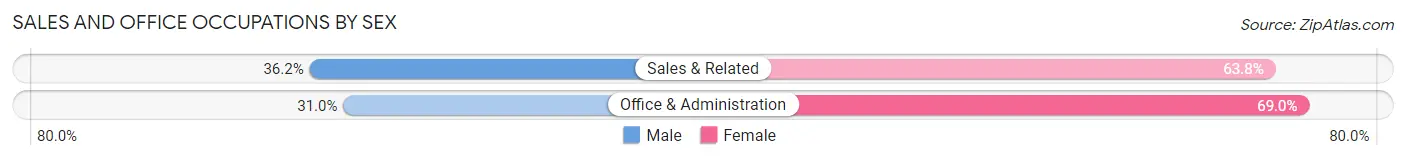
| Occupation | Male | Female |
| Sales & Related | 51 (36.2%) | 90 (63.8%) |
| Office & Administration | 48 (31.0%) | 107 (69.0%) |
| Total (Category) | 99 (33.5%) | 197 (66.5%) |
| Total (Overall) | 1,100 (47.4%) | 1,220 (52.6%) |
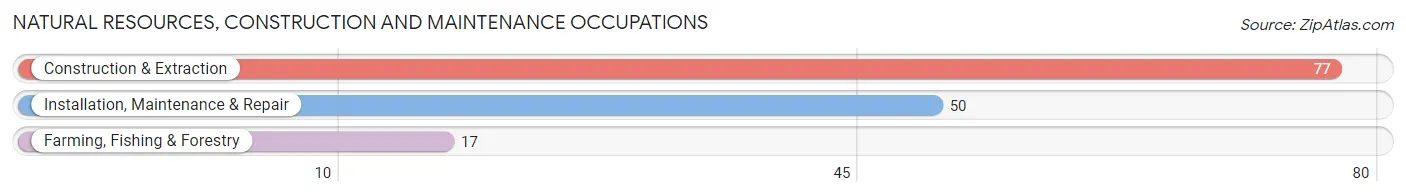
Natural Resources, Construction and Maintenance Occupations
The most common Natural Resources, Construction and Maintenance occupations in North Manchester are Construction & Extraction (77 | 3.3%), Installation, Maintenance & Repair (50 | 2.2%), and Farming, Fishing & Forestry (17 | 0.7%).
Natural Resources, Construction and Maintenance Occupations by Sex
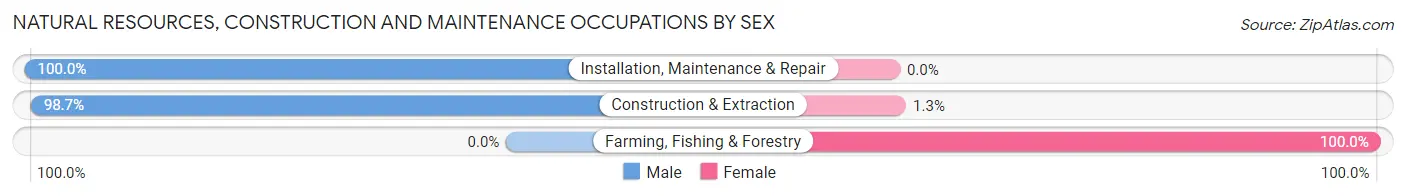
| Occupation | Male | Female |
| Farming, Fishing & Forestry | 0 (0.0%) | 17 (100.0%) |
| Construction & Extraction | 76 (98.7%) | 1 (1.3%) |
| Installation, Maintenance & Repair | 50 (100.0%) | 0 (0.0%) |
| Total (Category) | 126 (87.5%) | 18 (12.5%) |
| Total (Overall) | 1,100 (47.4%) | 1,220 (52.6%) |
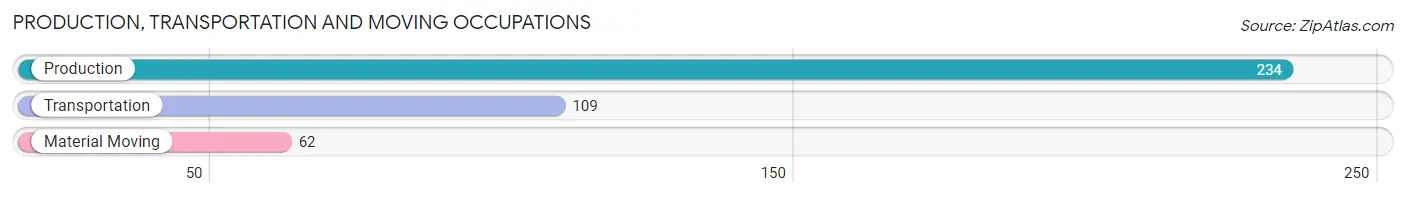
Production, Transportation and Moving Occupations
The most common Production, Transportation and Moving occupations in North Manchester are Production (234 | 10.1%), Transportation (109 | 4.7%), and Material Moving (62 | 2.7%).
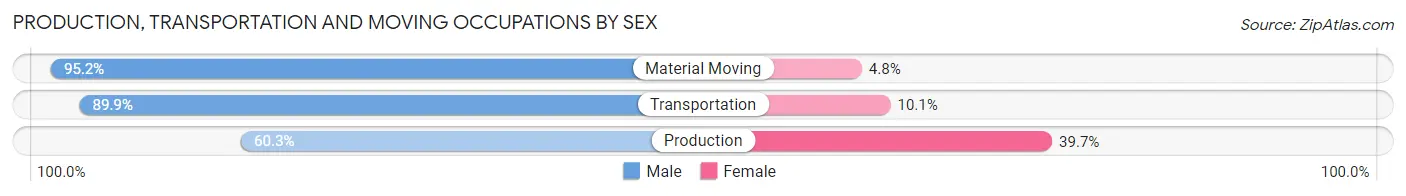
Production, Transportation and Moving Occupations by Sex
| Occupation | Male | Female |
| Production | 141 (60.3%) | 93 (39.7%) |
| Transportation | 98 (89.9%) | 11 (10.1%) |
| Material Moving | 59 (95.2%) | 3 (4.8%) |
| Total (Category) | 298 (73.6%) | 107 (26.4%) |
| Total (Overall) | 1,100 (47.4%) | 1,220 (52.6%) |
Employment Industries by Sex in North Manchester
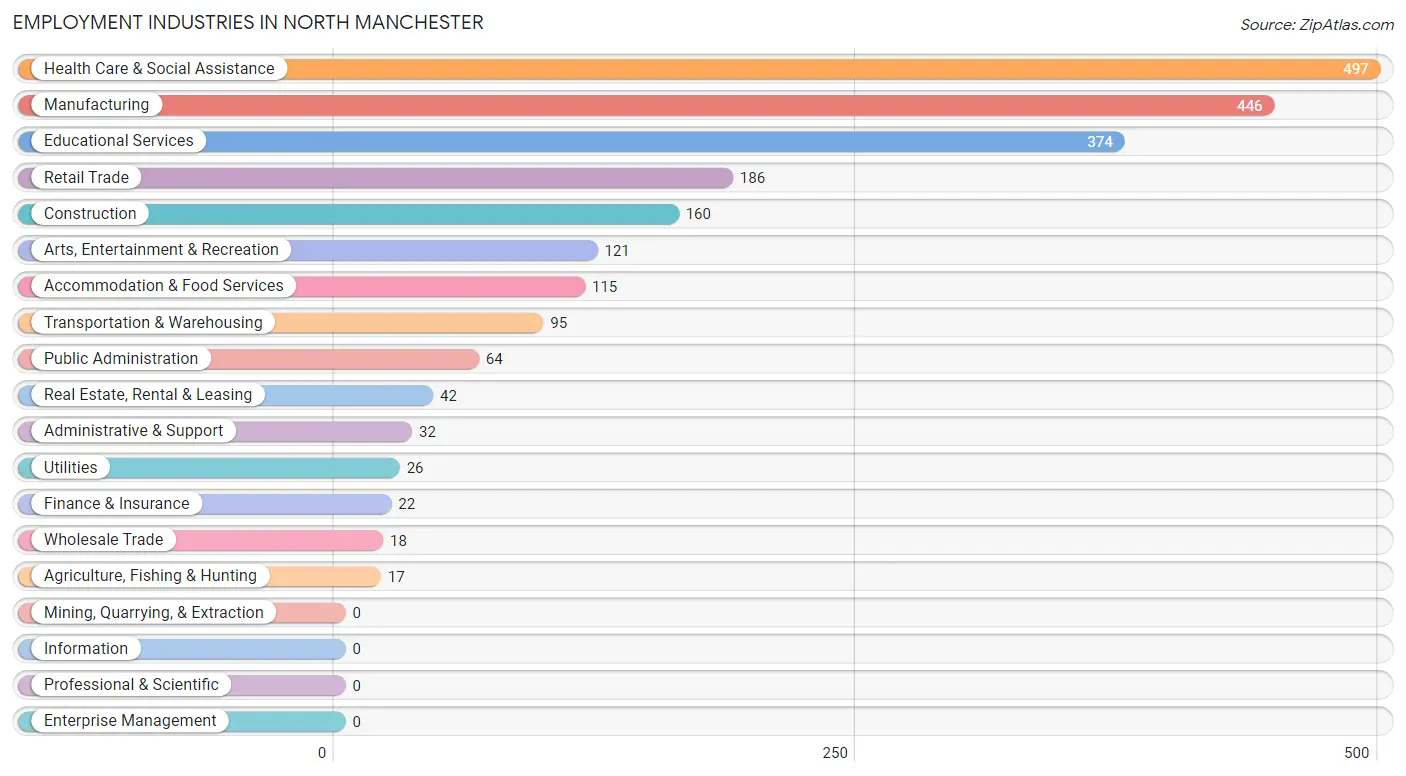
Employment Industries in North Manchester
The major employment industries in North Manchester include Health Care & Social Assistance (497 | 21.4%), Manufacturing (446 | 19.2%), Educational Services (374 | 16.1%), Retail Trade (186 | 8.0%), and Construction (160 | 6.9%).
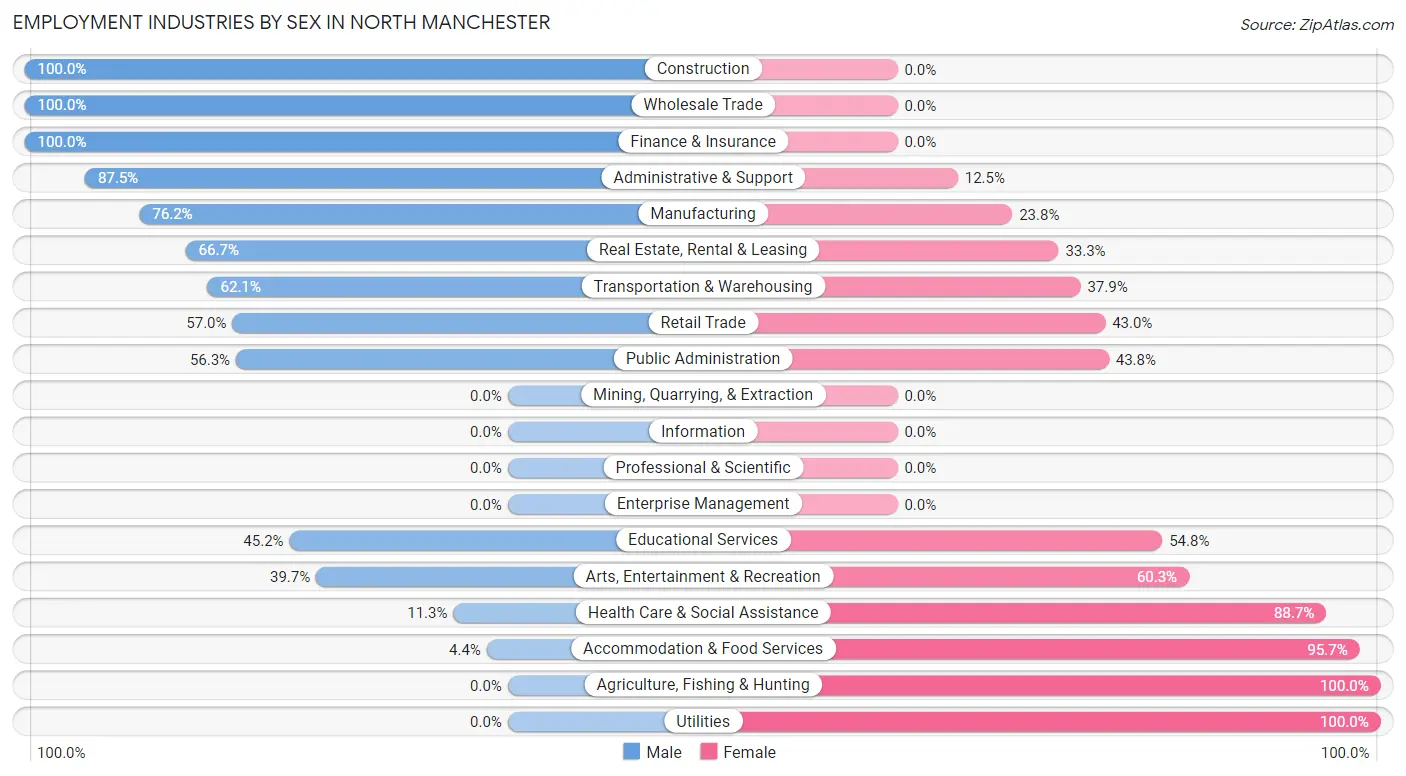
Employment Industries by Sex in North Manchester
The North Manchester industries that see more men than women are Construction (100.0%), Wholesale Trade (100.0%), and Finance & Insurance (100.0%), whereas the industries that tend to have a higher number of women are Agriculture, Fishing & Hunting (100.0%), Utilities (100.0%), and Accommodation & Food Services (95.7%).
| Industry | Male | Female |
| Agriculture, Fishing & Hunting | 0 (0.0%) | 17 (100.0%) |
| Mining, Quarrying, & Extraction | 0 (0.0%) | 0 (0.0%) |
| Construction | 160 (100.0%) | 0 (0.0%) |
| Manufacturing | 340 (76.2%) | 106 (23.8%) |
| Wholesale Trade | 18 (100.0%) | 0 (0.0%) |
| Retail Trade | 106 (57.0%) | 80 (43.0%) |
| Transportation & Warehousing | 59 (62.1%) | 36 (37.9%) |
| Utilities | 0 (0.0%) | 26 (100.0%) |
| Information | 0 (0.0%) | 0 (0.0%) |
| Finance & Insurance | 22 (100.0%) | 0 (0.0%) |
| Real Estate, Rental & Leasing | 28 (66.7%) | 14 (33.3%) |
| Professional & Scientific | 0 (0.0%) | 0 (0.0%) |
| Enterprise Management | 0 (0.0%) | 0 (0.0%) |
| Administrative & Support | 28 (87.5%) | 4 (12.5%) |
| Educational Services | 169 (45.2%) | 205 (54.8%) |
| Health Care & Social Assistance | 56 (11.3%) | 441 (88.7%) |
| Arts, Entertainment & Recreation | 48 (39.7%) | 73 (60.3%) |
| Accommodation & Food Services | 5 (4.3%) | 110 (95.7%) |
| Public Administration | 36 (56.2%) | 28 (43.8%) |
| Total | 1,100 (47.4%) | 1,220 (52.6%) |
Education in North Manchester
School Enrollment in North Manchester
The most common levels of schooling among the 1,444 students in North Manchester are college / undergraduate (759 | 52.6%), middle school (195 | 13.5%), and high school (160 | 11.1%).
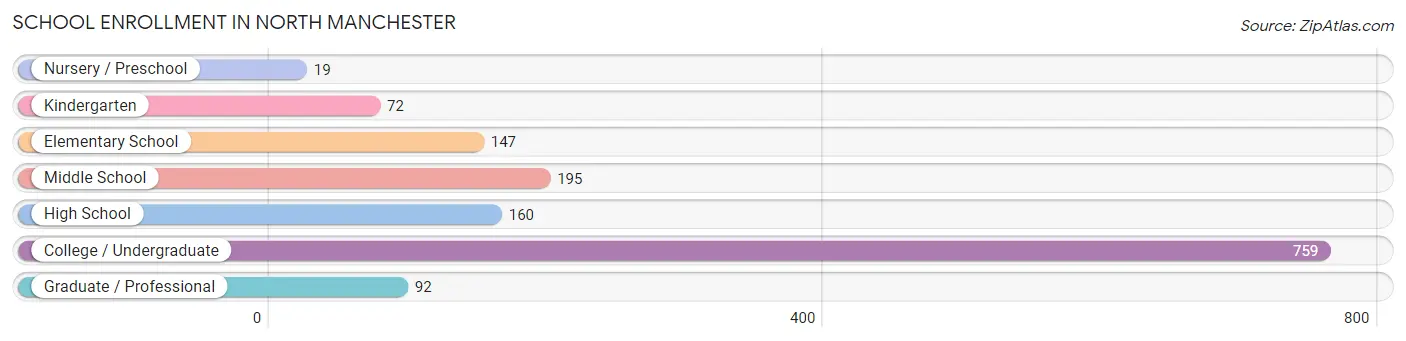
| School Level | # Students | % Students |
| Nursery / Preschool | 19 | 1.3% |
| Kindergarten | 72 | 5.0% |
| Elementary School | 147 | 10.2% |
| Middle School | 195 | 13.5% |
| High School | 160 | 11.1% |
| College / Undergraduate | 759 | 52.6% |
| Graduate / Professional | 92 | 6.4% |
| Total | 1,444 | 100.0% |
School Enrollment by Age by Funding Source in North Manchester
Out of a total of 1,444 students who are enrolled in schools in North Manchester, 667 (46.2%) attend a private institution, while the remaining 777 (53.8%) are enrolled in public schools. The age group of 20 to 24 year olds has the highest likelihood of being enrolled in private schools, with 388 (79.7% in the age bracket) enrolled. Conversely, the age group of 10 to 14 year olds has the lowest likelihood of being enrolled in a private school, with 237 (100.0% in the age bracket) attending a public institution.
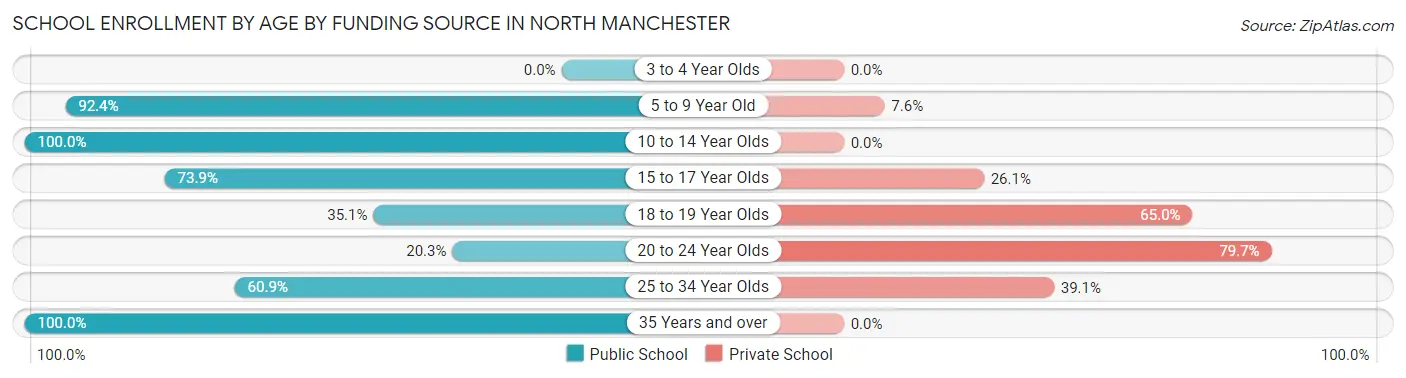
| Age Bracket | Public School | Private School |
| 3 to 4 Year Olds | 0 (0.0%) | 0 (0.0%) |
| 5 to 9 Year Old | 207 (92.4%) | 17 (7.6%) |
| 10 to 14 Year Olds | 237 (100.0%) | 0 (0.0%) |
| 15 to 17 Year Olds | 68 (73.9%) | 24 (26.1%) |
| 18 to 19 Year Olds | 109 (35.0%) | 202 (64.9%) |
| 20 to 24 Year Olds | 99 (20.3%) | 388 (79.7%) |
| 25 to 34 Year Olds | 56 (60.9%) | 36 (39.1%) |
| 35 Years and over | 1 (100.0%) | 0 (0.0%) |
| Total | 777 (53.8%) | 667 (46.2%) |
Educational Attainment by Field of Study in North Manchester
Education (306 | 31.6%), engineering (163 | 16.9%), liberal arts & history (75 | 7.8%), social sciences (74 | 7.6%), and business (70 | 7.2%) are the most common fields of study among 967 individuals in North Manchester who have obtained a bachelor's degree or higher.
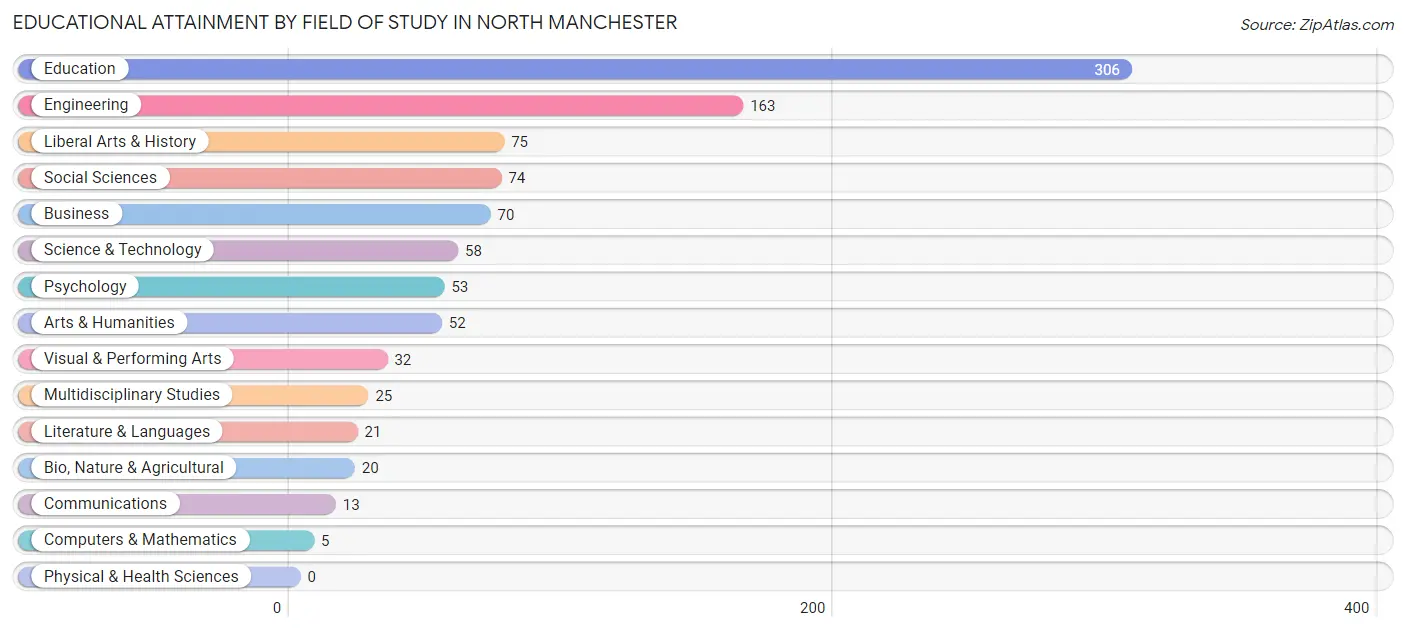
| Field of Study | # Graduates | % Graduates |
| Computers & Mathematics | 5 | 0.5% |
| Bio, Nature & Agricultural | 20 | 2.1% |
| Physical & Health Sciences | 0 | 0.0% |
| Psychology | 53 | 5.5% |
| Social Sciences | 74 | 7.6% |
| Engineering | 163 | 16.9% |
| Multidisciplinary Studies | 25 | 2.6% |
| Science & Technology | 58 | 6.0% |
| Business | 70 | 7.2% |
| Education | 306 | 31.6% |
| Literature & Languages | 21 | 2.2% |
| Liberal Arts & History | 75 | 7.8% |
| Visual & Performing Arts | 32 | 3.3% |
| Communications | 13 | 1.3% |
| Arts & Humanities | 52 | 5.4% |
| Total | 967 | 100.0% |
Transportation & Commute in North Manchester
Vehicle Availability by Sex in North Manchester
The most prevalent vehicle ownership categories in North Manchester are males with 2 vehicles (392, accounting for 41.2%) and females with 2 vehicles (377, making up 37.4%).
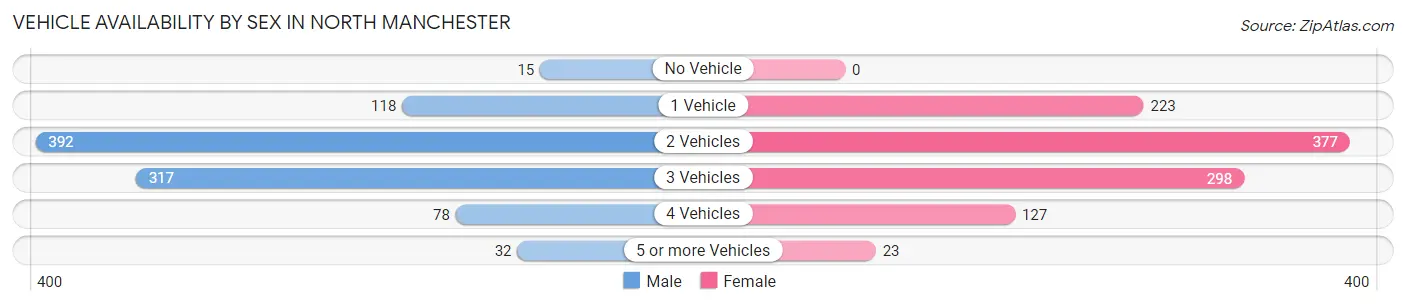
| Vehicles Available | Male | Female |
| No Vehicle | 15 (1.6%) | 0 (0.0%) |
| 1 Vehicle | 118 (12.4%) | 223 (21.3%) |
| 2 Vehicles | 392 (41.2%) | 377 (36.0%) |
| 3 Vehicles | 317 (33.3%) | 298 (28.4%) |
| 4 Vehicles | 78 (8.2%) | 127 (12.1%) |
| 5 or more Vehicles | 32 (3.4%) | 23 (2.2%) |
| Total | 952 (100.0%) | 1,048 (100.0%) |
Commute Time in North Manchester
The most frequently occuring commute durations in North Manchester are 5 to 9 minutes (492 commuters, 22.7%), less than 5 minutes (338 commuters, 15.6%), and 20 to 24 minutes (308 commuters, 14.2%).
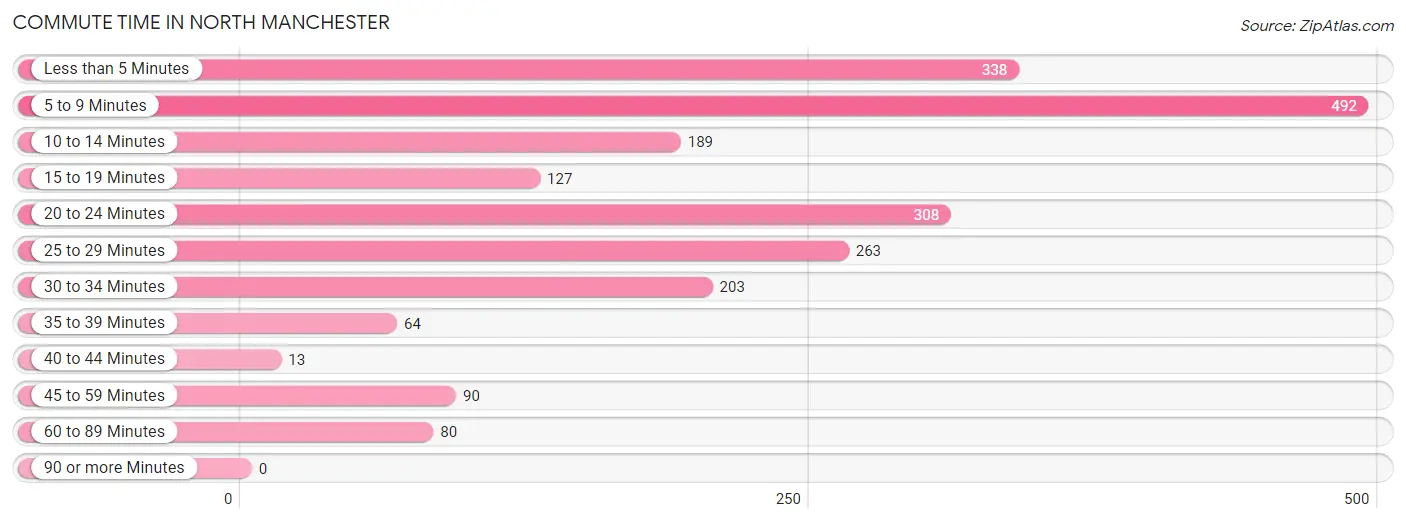
| Commute Time | # Commuters | % Commuters |
| Less than 5 Minutes | 338 | 15.6% |
| 5 to 9 Minutes | 492 | 22.7% |
| 10 to 14 Minutes | 189 | 8.7% |
| 15 to 19 Minutes | 127 | 5.9% |
| 20 to 24 Minutes | 308 | 14.2% |
| 25 to 29 Minutes | 263 | 12.1% |
| 30 to 34 Minutes | 203 | 9.4% |
| 35 to 39 Minutes | 64 | 2.9% |
| 40 to 44 Minutes | 13 | 0.6% |
| 45 to 59 Minutes | 90 | 4.2% |
| 60 to 89 Minutes | 80 | 3.7% |
| 90 or more Minutes | 0 | 0.0% |
Commute Time by Sex in North Manchester
The most common commute times in North Manchester are 25 to 29 minutes (228 commuters, 22.1%) for males and 5 to 9 minutes (365 commuters, 32.1%) for females.
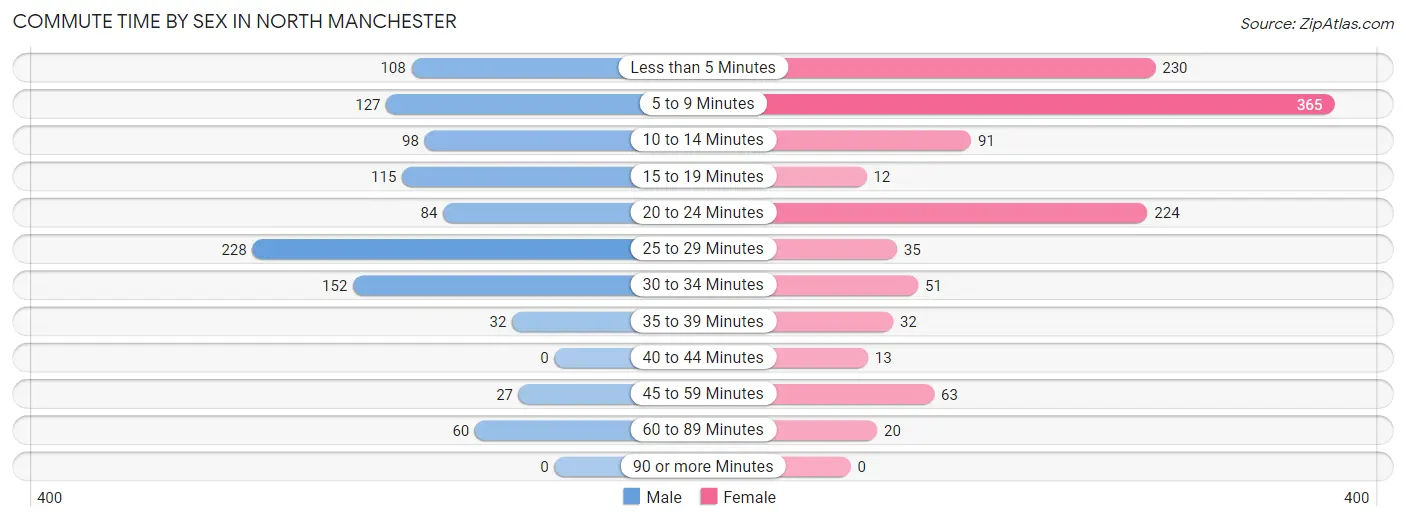
| Commute Time | Male | Female |
| Less than 5 Minutes | 108 (10.5%) | 230 (20.3%) |
| 5 to 9 Minutes | 127 (12.3%) | 365 (32.1%) |
| 10 to 14 Minutes | 98 (9.5%) | 91 (8.0%) |
| 15 to 19 Minutes | 115 (11.2%) | 12 (1.1%) |
| 20 to 24 Minutes | 84 (8.2%) | 224 (19.7%) |
| 25 to 29 Minutes | 228 (22.1%) | 35 (3.1%) |
| 30 to 34 Minutes | 152 (14.7%) | 51 (4.5%) |
| 35 to 39 Minutes | 32 (3.1%) | 32 (2.8%) |
| 40 to 44 Minutes | 0 (0.0%) | 13 (1.1%) |
| 45 to 59 Minutes | 27 (2.6%) | 63 (5.6%) |
| 60 to 89 Minutes | 60 (5.8%) | 20 (1.8%) |
| 90 or more Minutes | 0 (0.0%) | 0 (0.0%) |
Time of Departure to Work by Sex in North Manchester
The most frequent times of departure to work in North Manchester are 7:00 AM to 7:29 AM (148, 14.3%) for males and 7:30 AM to 7:59 AM (219, 19.3%) for females.
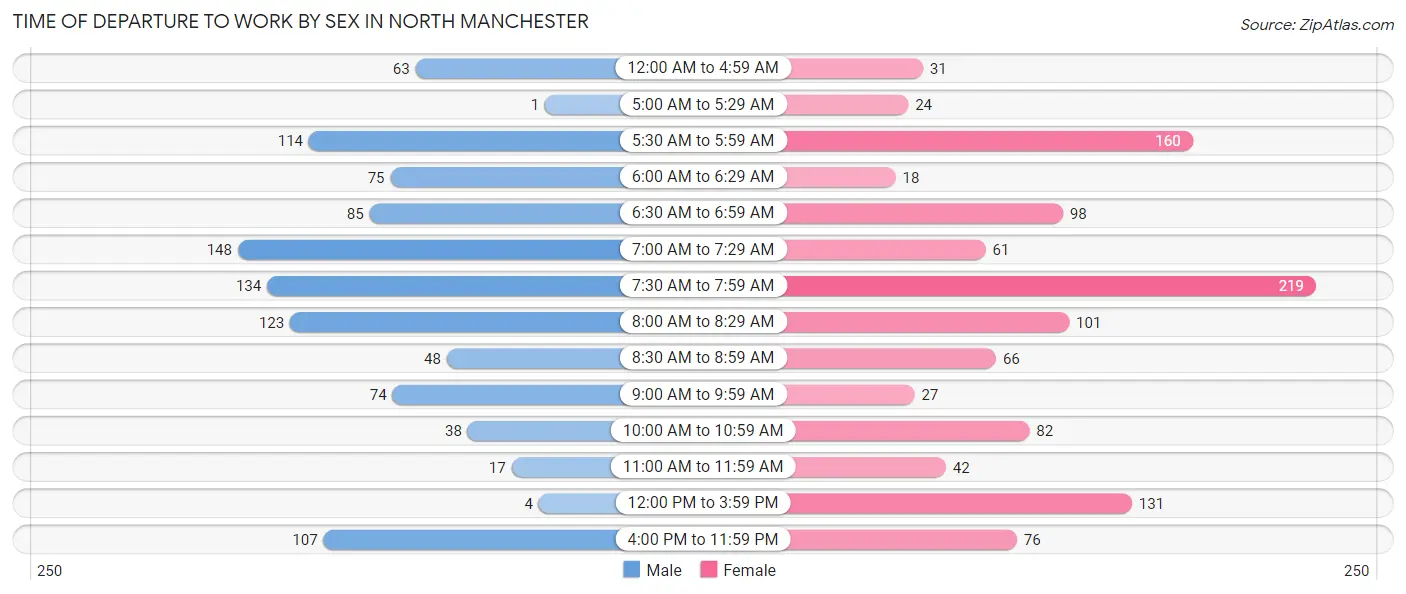
| Time of Departure | Male | Female |
| 12:00 AM to 4:59 AM | 63 (6.1%) | 31 (2.7%) |
| 5:00 AM to 5:29 AM | 1 (0.1%) | 24 (2.1%) |
| 5:30 AM to 5:59 AM | 114 (11.1%) | 160 (14.1%) |
| 6:00 AM to 6:29 AM | 75 (7.3%) | 18 (1.6%) |
| 6:30 AM to 6:59 AM | 85 (8.2%) | 98 (8.6%) |
| 7:00 AM to 7:29 AM | 148 (14.3%) | 61 (5.4%) |
| 7:30 AM to 7:59 AM | 134 (13.0%) | 219 (19.3%) |
| 8:00 AM to 8:29 AM | 123 (11.9%) | 101 (8.9%) |
| 8:30 AM to 8:59 AM | 48 (4.7%) | 66 (5.8%) |
| 9:00 AM to 9:59 AM | 74 (7.2%) | 27 (2.4%) |
| 10:00 AM to 10:59 AM | 38 (3.7%) | 82 (7.2%) |
| 11:00 AM to 11:59 AM | 17 (1.7%) | 42 (3.7%) |
| 12:00 PM to 3:59 PM | 4 (0.4%) | 131 (11.5%) |
| 4:00 PM to 11:59 PM | 107 (10.4%) | 76 (6.7%) |
| Total | 1,031 (100.0%) | 1,136 (100.0%) |
Housing Occupancy in North Manchester
Occupancy by Ownership in North Manchester
Of the total 1,801 dwellings in North Manchester, owner-occupied units account for 1,387 (77.0%), while renter-occupied units make up 414 (23.0%).
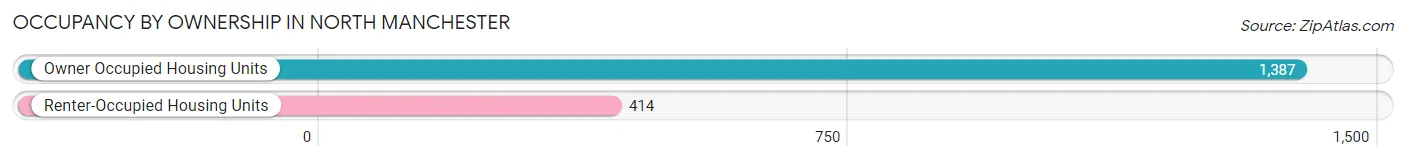
| Occupancy | # Housing Units | % Housing Units |
| Owner Occupied Housing Units | 1,387 | 77.0% |
| Renter-Occupied Housing Units | 414 | 23.0% |
| Total Occupied Housing Units | 1,801 | 100.0% |
Occupancy by Household Size in North Manchester
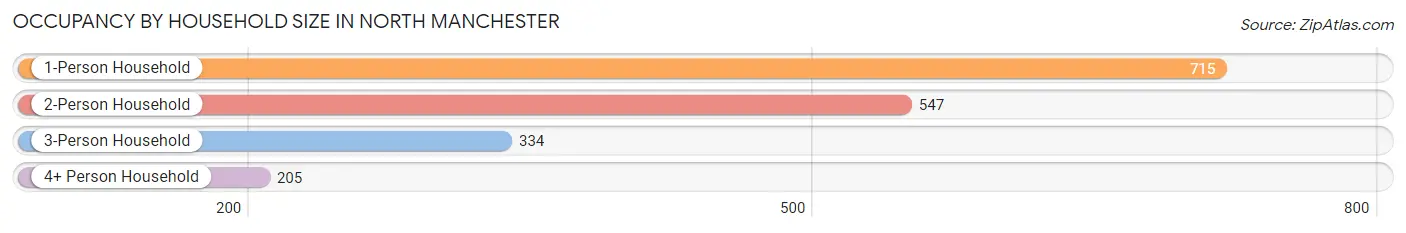
| Household Size | # Housing Units | % Housing Units |
| 1-Person Household | 715 | 39.7% |
| 2-Person Household | 547 | 30.4% |
| 3-Person Household | 334 | 18.5% |
| 4+ Person Household | 205 | 11.4% |
| Total Housing Units | 1,801 | 100.0% |
Occupancy by Ownership by Household Size in North Manchester
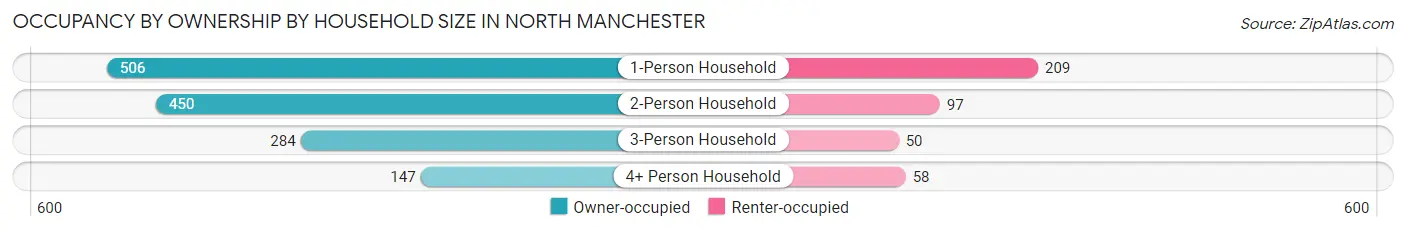
| Household Size | Owner-occupied | Renter-occupied |
| 1-Person Household | 506 (70.8%) | 209 (29.2%) |
| 2-Person Household | 450 (82.3%) | 97 (17.7%) |
| 3-Person Household | 284 (85.0%) | 50 (15.0%) |
| 4+ Person Household | 147 (71.7%) | 58 (28.3%) |
| Total Housing Units | 1,387 (77.0%) | 414 (23.0%) |
Occupancy by Educational Attainment in North Manchester
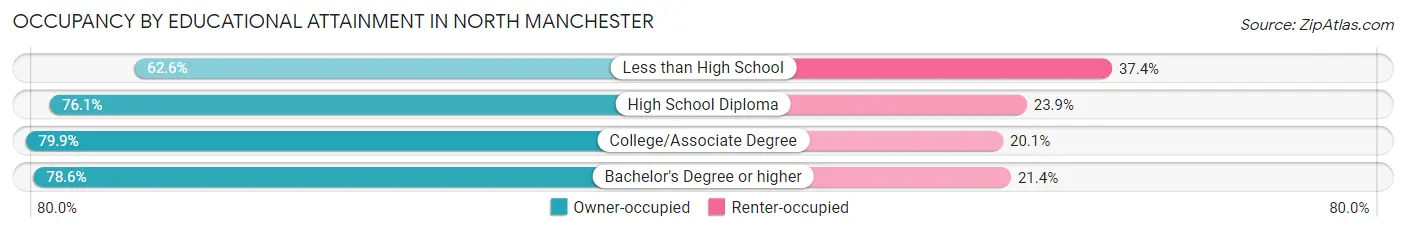
| Household Size | Owner-occupied | Renter-occupied |
| Less than High School | 77 (62.6%) | 46 (37.4%) |
| High School Diploma | 462 (76.1%) | 145 (23.9%) |
| College/Associate Degree | 381 (79.9%) | 96 (20.1%) |
| Bachelor's Degree or higher | 467 (78.6%) | 127 (21.4%) |
Occupancy by Age of Householder in North Manchester
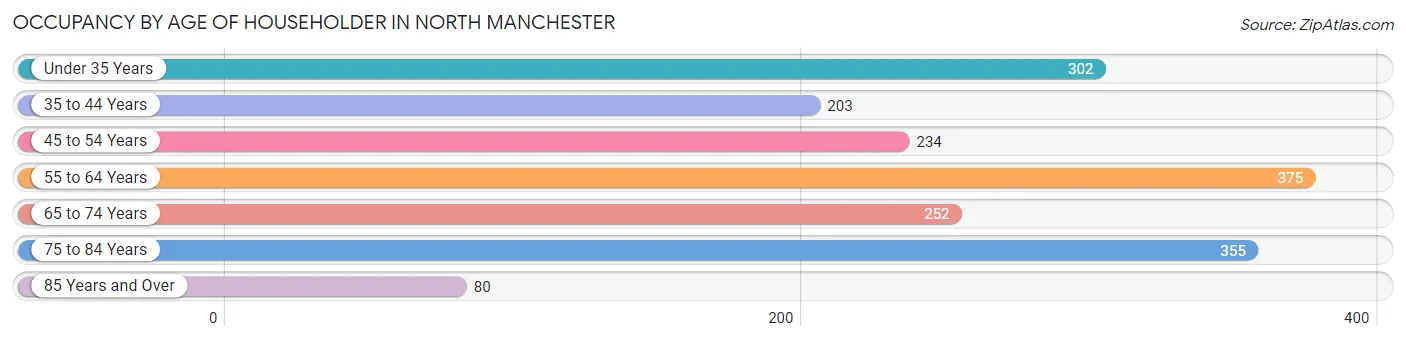
| Age Bracket | # Households | % Households |
| Under 35 Years | 302 | 16.8% |
| 35 to 44 Years | 203 | 11.3% |
| 45 to 54 Years | 234 | 13.0% |
| 55 to 64 Years | 375 | 20.8% |
| 65 to 74 Years | 252 | 14.0% |
| 75 to 84 Years | 355 | 19.7% |
| 85 Years and Over | 80 | 4.4% |
| Total | 1,801 | 100.0% |
Housing Finances in North Manchester
Median Income by Occupancy in North Manchester
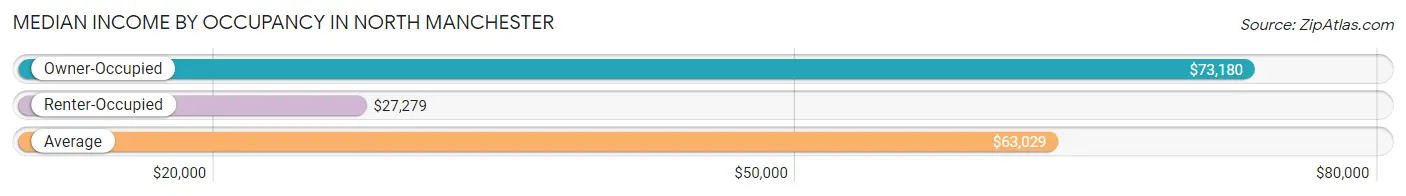
| Occupancy Type | # Households | Median Income |
| Owner-Occupied | 1,387 (77.0%) | $73,180 |
| Renter-Occupied | 414 (23.0%) | $27,279 |
| Average | 1,801 (100.0%) | $63,029 |
Occupancy by Householder Income Bracket in North Manchester
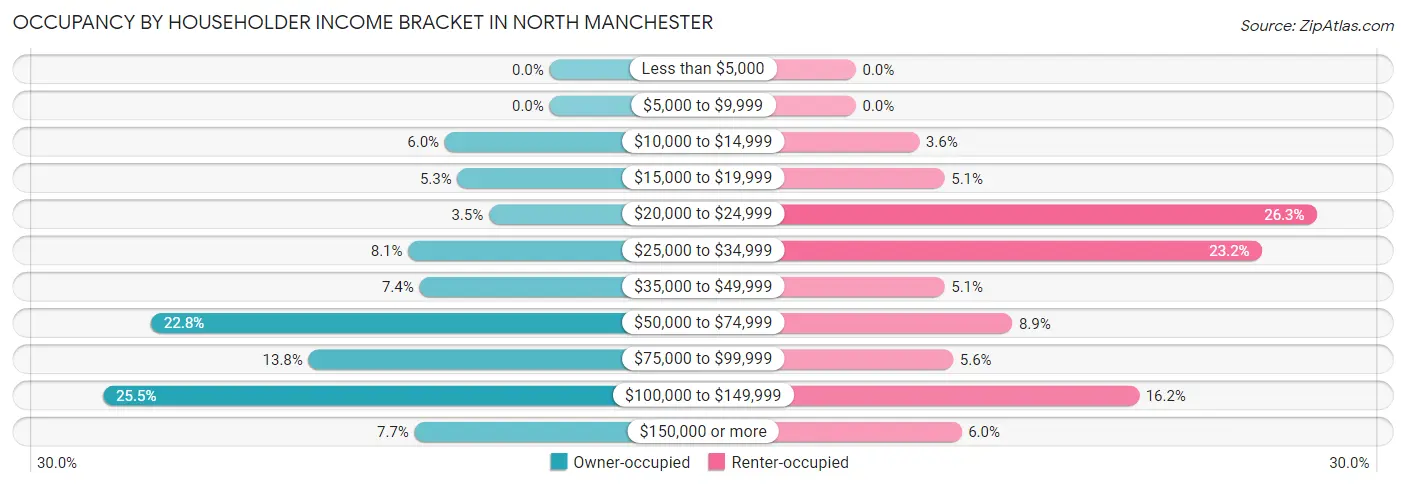
| Income Bracket | Owner-occupied | Renter-occupied |
| Less than $5,000 | 0 (0.0%) | 0 (0.0%) |
| $5,000 to $9,999 | 0 (0.0%) | 0 (0.0%) |
| $10,000 to $14,999 | 83 (6.0%) | 15 (3.6%) |
| $15,000 to $19,999 | 73 (5.3%) | 21 (5.1%) |
| $20,000 to $24,999 | 48 (3.5%) | 109 (26.3%) |
| $25,000 to $34,999 | 112 (8.1%) | 96 (23.2%) |
| $35,000 to $49,999 | 103 (7.4%) | 21 (5.1%) |
| $50,000 to $74,999 | 316 (22.8%) | 37 (8.9%) |
| $75,000 to $99,999 | 191 (13.8%) | 23 (5.6%) |
| $100,000 to $149,999 | 354 (25.5%) | 67 (16.2%) |
| $150,000 or more | 107 (7.7%) | 25 (6.0%) |
| Total | 1,387 (100.0%) | 414 (100.0%) |
Monthly Housing Cost Tiers in North Manchester
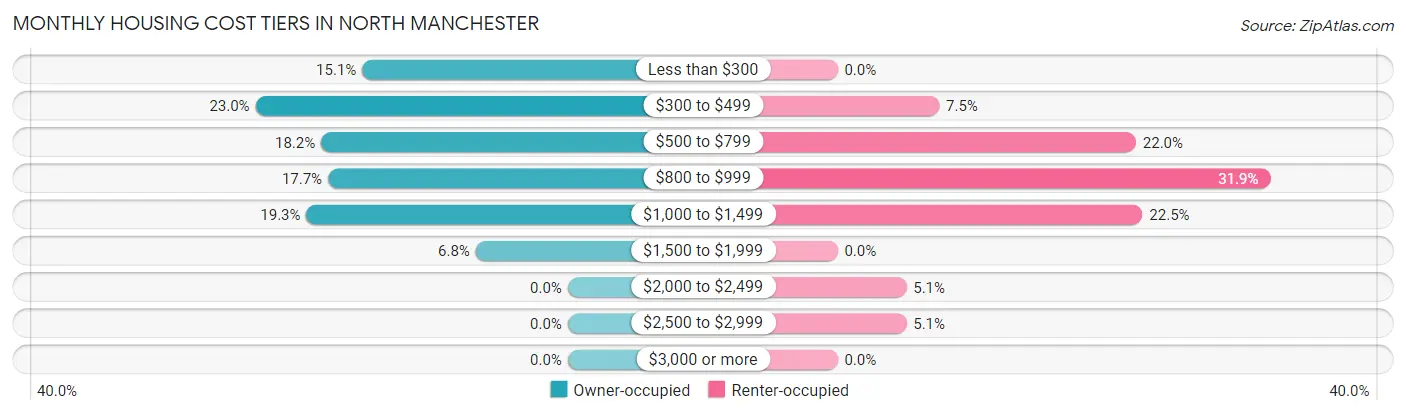
| Monthly Cost | Owner-occupied | Renter-occupied |
| Less than $300 | 210 (15.1%) | 0 (0.0%) |
| $300 to $499 | 319 (23.0%) | 31 (7.5%) |
| $500 to $799 | 252 (18.2%) | 91 (22.0%) |
| $800 to $999 | 245 (17.7%) | 132 (31.9%) |
| $1,000 to $1,499 | 267 (19.3%) | 93 (22.5%) |
| $1,500 to $1,999 | 94 (6.8%) | 0 (0.0%) |
| $2,000 to $2,499 | 0 (0.0%) | 21 (5.1%) |
| $2,500 to $2,999 | 0 (0.0%) | 21 (5.1%) |
| $3,000 or more | 0 (0.0%) | 0 (0.0%) |
| Total | 1,387 (100.0%) | 414 (100.0%) |
Physical Housing Characteristics in North Manchester
Housing Structures in North Manchester
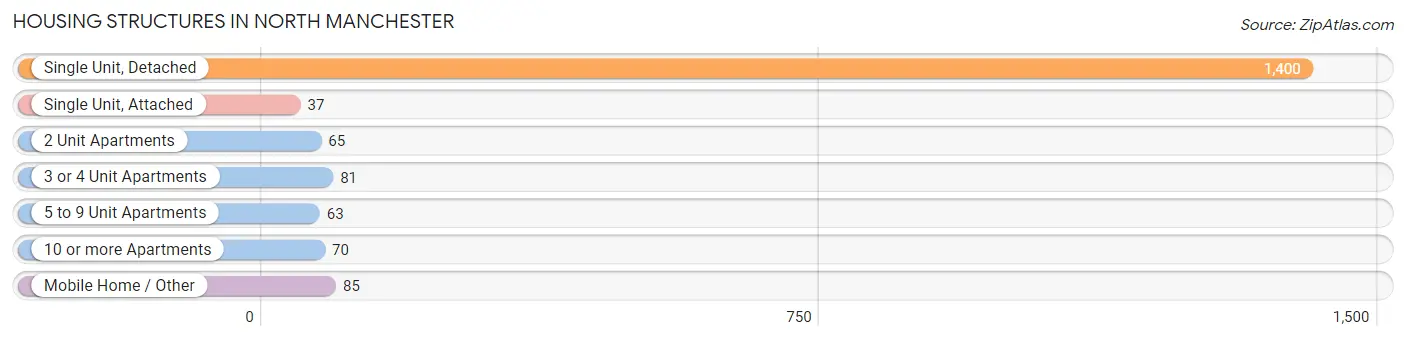
| Structure Type | # Housing Units | % Housing Units |
| Single Unit, Detached | 1,400 | 77.7% |
| Single Unit, Attached | 37 | 2.1% |
| 2 Unit Apartments | 65 | 3.6% |
| 3 or 4 Unit Apartments | 81 | 4.5% |
| 5 to 9 Unit Apartments | 63 | 3.5% |
| 10 or more Apartments | 70 | 3.9% |
| Mobile Home / Other | 85 | 4.7% |
| Total | 1,801 | 100.0% |
Housing Structures by Occupancy in North Manchester
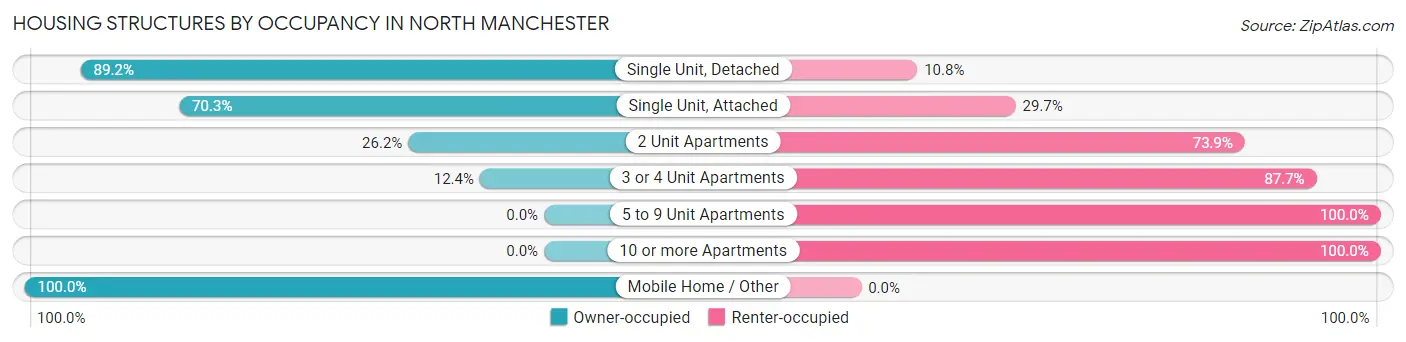
| Structure Type | Owner-occupied | Renter-occupied |
| Single Unit, Detached | 1,249 (89.2%) | 151 (10.8%) |
| Single Unit, Attached | 26 (70.3%) | 11 (29.7%) |
| 2 Unit Apartments | 17 (26.2%) | 48 (73.9%) |
| 3 or 4 Unit Apartments | 10 (12.3%) | 71 (87.6%) |
| 5 to 9 Unit Apartments | 0 (0.0%) | 63 (100.0%) |
| 10 or more Apartments | 0 (0.0%) | 70 (100.0%) |
| Mobile Home / Other | 85 (100.0%) | 0 (0.0%) |
| Total | 1,387 (77.0%) | 414 (23.0%) |
Housing Structures by Number of Rooms in North Manchester
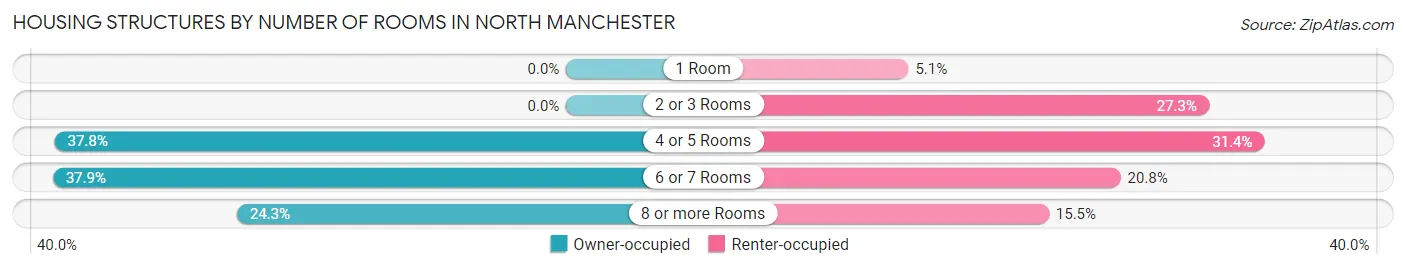
| Number of Rooms | Owner-occupied | Renter-occupied |
| 1 Room | 0 (0.0%) | 21 (5.1%) |
| 2 or 3 Rooms | 0 (0.0%) | 113 (27.3%) |
| 4 or 5 Rooms | 524 (37.8%) | 130 (31.4%) |
| 6 or 7 Rooms | 526 (37.9%) | 86 (20.8%) |
| 8 or more Rooms | 337 (24.3%) | 64 (15.5%) |
| Total | 1,387 (100.0%) | 414 (100.0%) |
Housing Structure by Heating Type in North Manchester
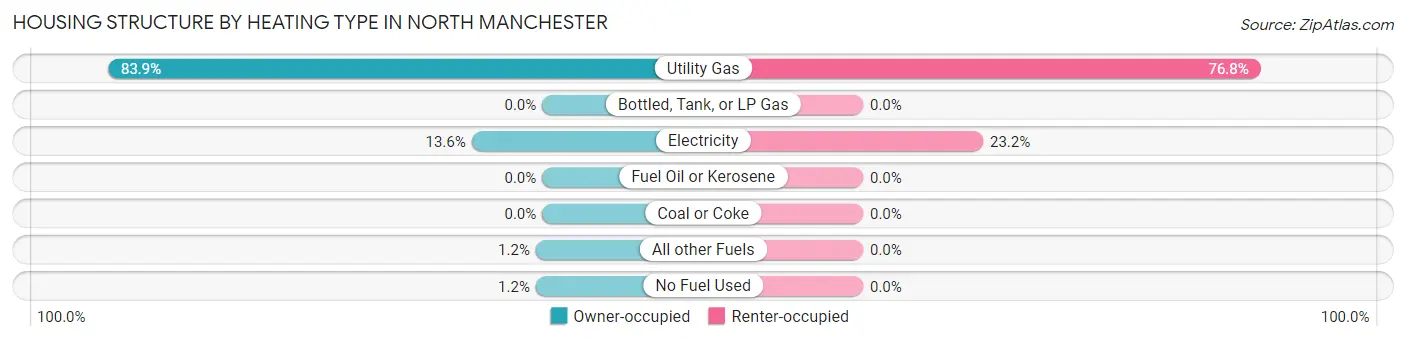
| Heating Type | Owner-occupied | Renter-occupied |
| Utility Gas | 1,164 (83.9%) | 318 (76.8%) |
| Bottled, Tank, or LP Gas | 0 (0.0%) | 0 (0.0%) |
| Electricity | 189 (13.6%) | 96 (23.2%) |
| Fuel Oil or Kerosene | 0 (0.0%) | 0 (0.0%) |
| Coal or Coke | 0 (0.0%) | 0 (0.0%) |
| All other Fuels | 17 (1.2%) | 0 (0.0%) |
| No Fuel Used | 17 (1.2%) | 0 (0.0%) |
| Total | 1,387 (100.0%) | 414 (100.0%) |
Household Vehicle Usage in North Manchester
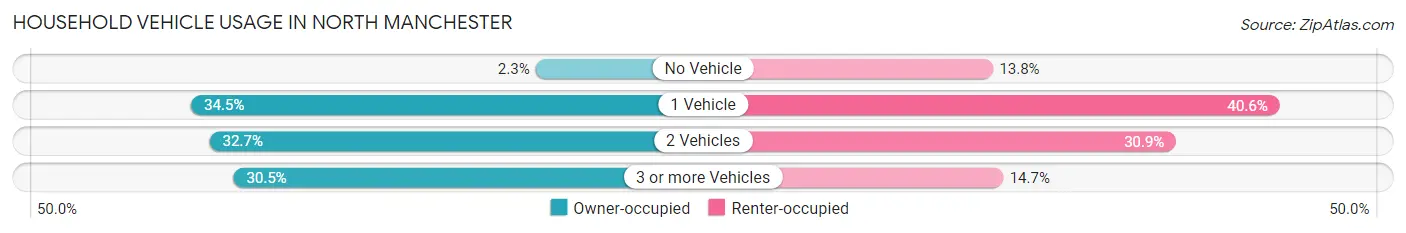
| Vehicles per Household | Owner-occupied | Renter-occupied |
| No Vehicle | 32 (2.3%) | 57 (13.8%) |
| 1 Vehicle | 478 (34.5%) | 168 (40.6%) |
| 2 Vehicles | 454 (32.7%) | 128 (30.9%) |
| 3 or more Vehicles | 423 (30.5%) | 61 (14.7%) |
| Total | 1,387 (100.0%) | 414 (100.0%) |
Real Estate & Mortgages in North Manchester
Real Estate and Mortgage Overview in North Manchester
| Characteristic | Without Mortgage | With Mortgage |
| Housing Units | 493 | 894 |
| Median Property Value | $129,700 | $136,500 |
| Median Household Income | $48,419 | $29 |
| Monthly Housing Costs | $385 | $0 |
| Real Estate Taxes | $505 | $0 |
Property Value by Mortgage Status in North Manchester
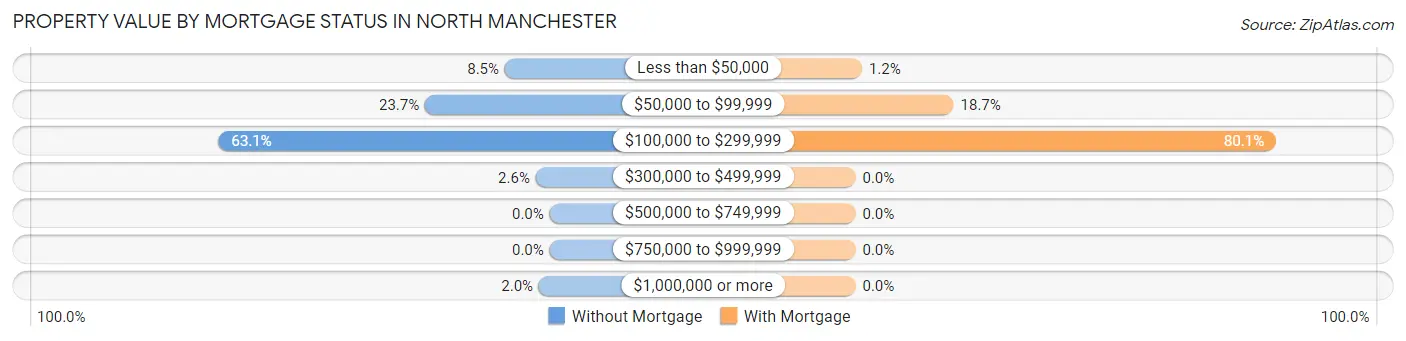
| Property Value | Without Mortgage | With Mortgage |
| Less than $50,000 | 42 (8.5%) | 11 (1.2%) |
| $50,000 to $99,999 | 117 (23.7%) | 167 (18.7%) |
| $100,000 to $299,999 | 311 (63.1%) | 716 (80.1%) |
| $300,000 to $499,999 | 13 (2.6%) | 0 (0.0%) |
| $500,000 to $749,999 | 0 (0.0%) | 0 (0.0%) |
| $750,000 to $999,999 | 0 (0.0%) | 0 (0.0%) |
| $1,000,000 or more | 10 (2.0%) | 0 (0.0%) |
| Total | 493 (100.0%) | 894 (100.0%) |
Household Income by Mortgage Status in North Manchester
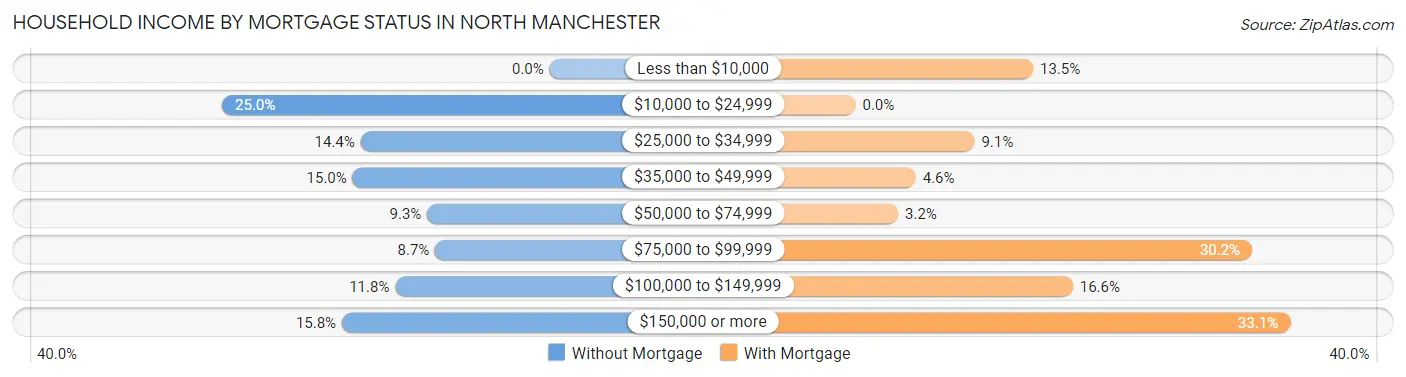
| Household Income | Without Mortgage | With Mortgage |
| Less than $10,000 | 0 (0.0%) | 121 (13.5%) |
| $10,000 to $24,999 | 123 (24.9%) | 0 (0.0%) |
| $25,000 to $34,999 | 71 (14.4%) | 81 (9.1%) |
| $35,000 to $49,999 | 74 (15.0%) | 41 (4.6%) |
| $50,000 to $74,999 | 46 (9.3%) | 29 (3.2%) |
| $75,000 to $99,999 | 43 (8.7%) | 270 (30.2%) |
| $100,000 to $149,999 | 58 (11.8%) | 148 (16.6%) |
| $150,000 or more | 78 (15.8%) | 296 (33.1%) |
| Total | 493 (100.0%) | 894 (100.0%) |
Property Value to Household Income Ratio in North Manchester
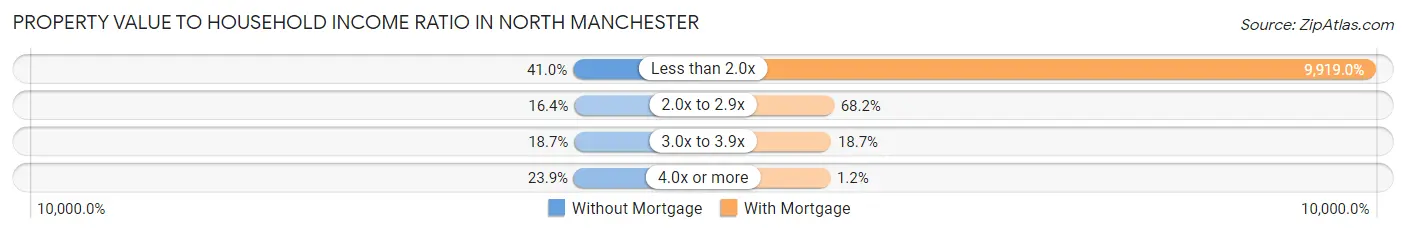
| Value-to-Income Ratio | Without Mortgage | With Mortgage |
| Less than 2.0x | 202 (41.0%) | 88,676 (9,919.0%) |
| 2.0x to 2.9x | 81 (16.4%) | 610 (68.2%) |
| 3.0x to 3.9x | 92 (18.7%) | 167 (18.7%) |
| 4.0x or more | 118 (23.9%) | 11 (1.2%) |
| Total | 493 (100.0%) | 894 (100.0%) |
Real Estate Taxes by Mortgage Status in North Manchester
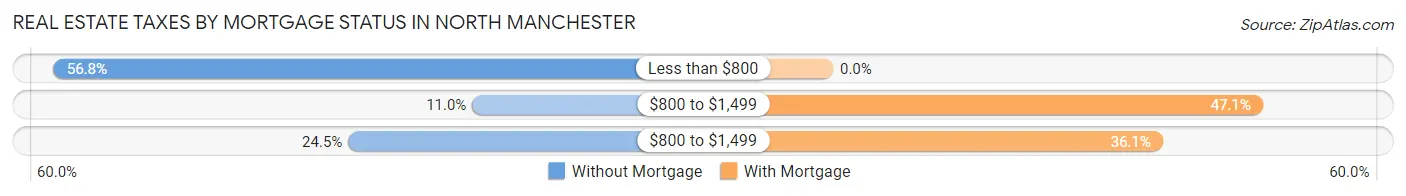
| Property Taxes | Without Mortgage | With Mortgage |
| Less than $800 | 280 (56.8%) | 0 (0.0%) |
| $800 to $1,499 | 54 (11.0%) | 421 (47.1%) |
| $800 to $1,499 | 121 (24.5%) | 323 (36.1%) |
| Total | 493 (100.0%) | 894 (100.0%) |
Health & Disability in North Manchester
Health Insurance Coverage by Age in North Manchester
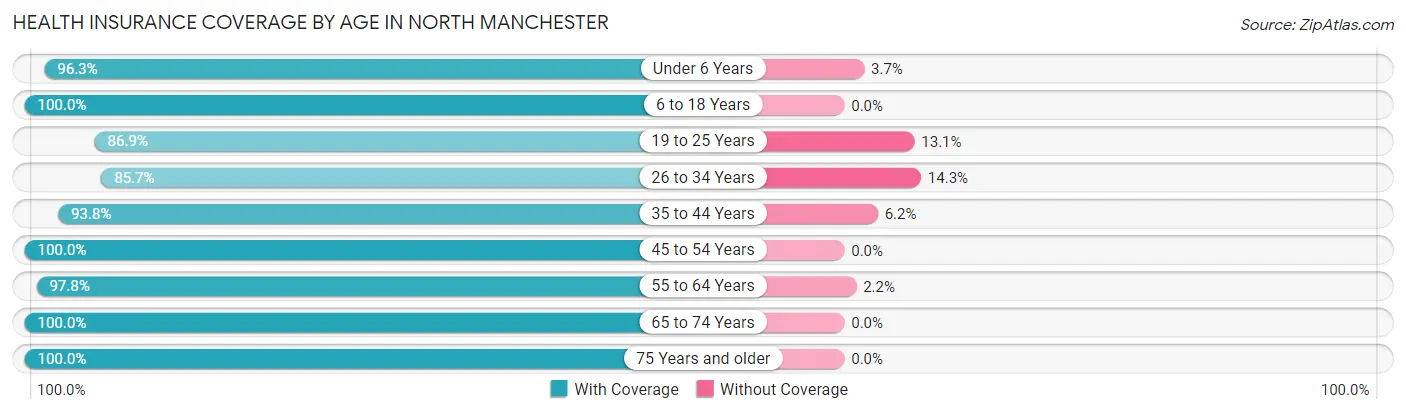
| Age Bracket | With Coverage | Without Coverage |
| Under 6 Years | 339 (96.3%) | 13 (3.7%) |
| 6 to 18 Years | 646 (100.0%) | 0 (0.0%) |
| 19 to 25 Years | 692 (86.9%) | 104 (13.1%) |
| 26 to 34 Years | 516 (85.7%) | 86 (14.3%) |
| 35 to 44 Years | 271 (93.8%) | 18 (6.2%) |
| 45 to 54 Years | 509 (100.0%) | 0 (0.0%) |
| 55 to 64 Years | 529 (97.8%) | 12 (2.2%) |
| 65 to 74 Years | 374 (100.0%) | 0 (0.0%) |
| 75 Years and older | 510 (100.0%) | 0 (0.0%) |
| Total | 4,386 (95.0%) | 233 (5.0%) |
Health Insurance Coverage by Citizenship Status in North Manchester
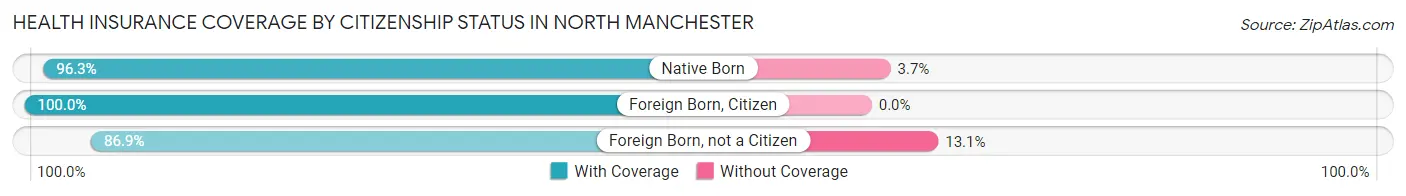
| Citizenship Status | With Coverage | Without Coverage |
| Native Born | 339 (96.3%) | 13 (3.7%) |
| Foreign Born, Citizen | 646 (100.0%) | 0 (0.0%) |
| Foreign Born, not a Citizen | 692 (86.9%) | 104 (13.1%) |
Health Insurance Coverage by Household Income in North Manchester
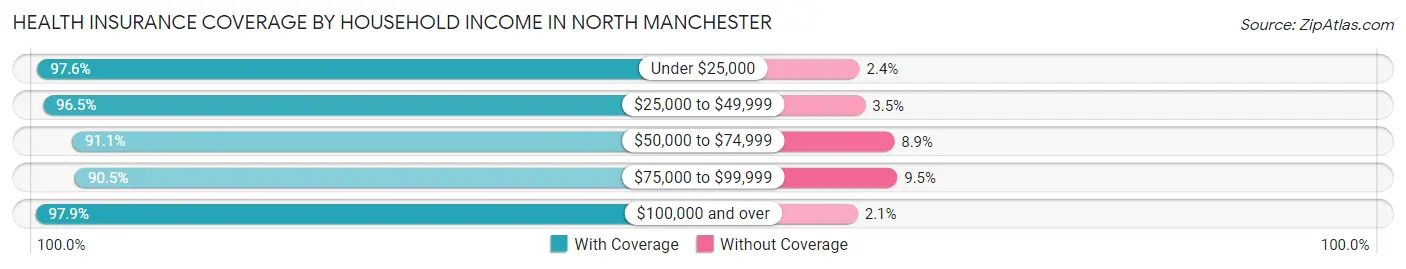
| Household Income | With Coverage | Without Coverage |
| Under $25,000 | 366 (97.6%) | 9 (2.4%) |
| $25,000 to $49,999 | 696 (96.5%) | 25 (3.5%) |
| $50,000 to $74,999 | 604 (91.1%) | 59 (8.9%) |
| $75,000 to $99,999 | 469 (90.5%) | 49 (9.5%) |
| $100,000 and over | 1,614 (97.9%) | 34 (2.1%) |
Public vs Private Health Insurance Coverage by Age in North Manchester
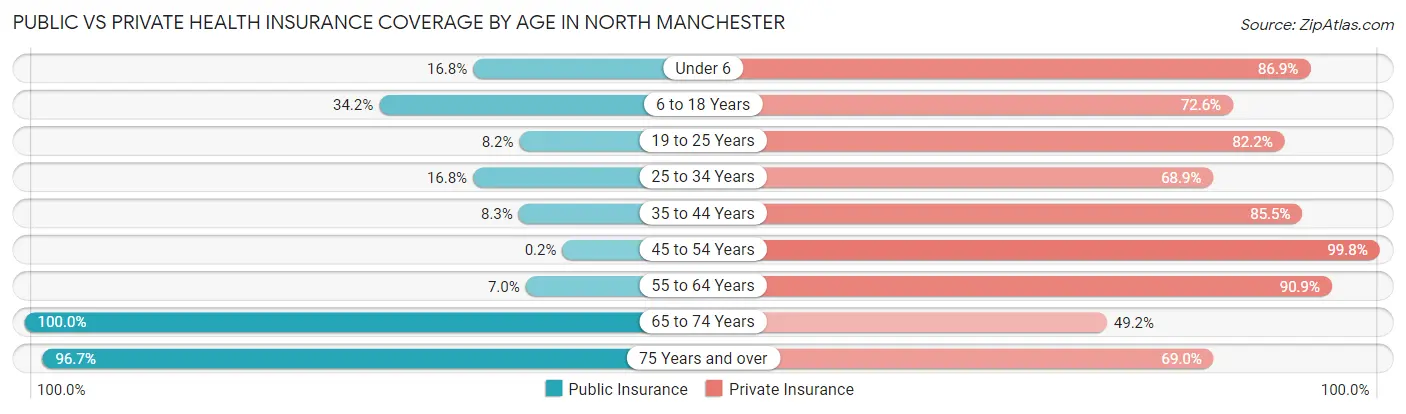
| Age Bracket | Public Insurance | Private Insurance |
| Under 6 | 59 (16.8%) | 306 (86.9%) |
| 6 to 18 Years | 221 (34.2%) | 469 (72.6%) |
| 19 to 25 Years | 65 (8.2%) | 654 (82.2%) |
| 25 to 34 Years | 101 (16.8%) | 415 (68.9%) |
| 35 to 44 Years | 24 (8.3%) | 247 (85.5%) |
| 45 to 54 Years | 1 (0.2%) | 508 (99.8%) |
| 55 to 64 Years | 38 (7.0%) | 492 (90.9%) |
| 65 to 74 Years | 374 (100.0%) | 184 (49.2%) |
| 75 Years and over | 493 (96.7%) | 352 (69.0%) |
| Total | 1,376 (29.8%) | 3,627 (78.5%) |
Disability Status by Sex by Age in North Manchester
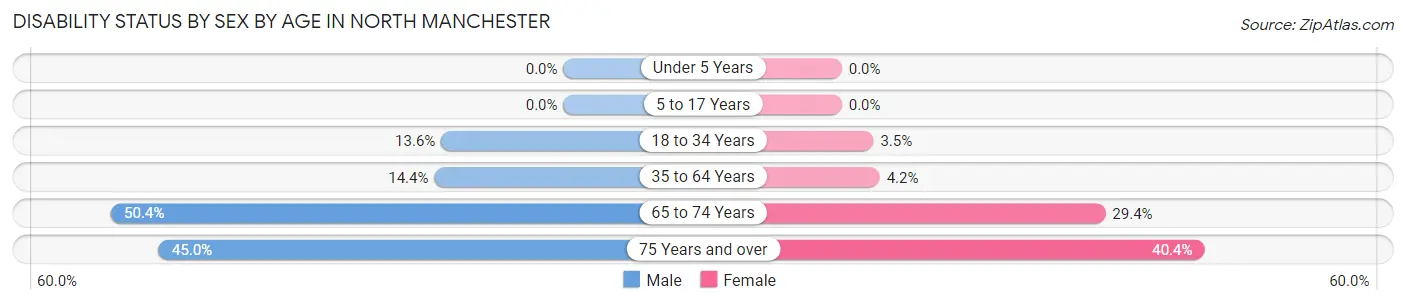
| Age Bracket | Male | Female |
| Under 5 Years | 0 (0.0%) | 0 (0.0%) |
| 5 to 17 Years | 0 (0.0%) | 0 (0.0%) |
| 18 to 34 Years | 101 (13.6%) | 29 (3.5%) |
| 35 to 64 Years | 97 (14.4%) | 28 (4.2%) |
| 65 to 74 Years | 70 (50.4%) | 69 (29.4%) |
| 75 Years and over | 59 (45.0%) | 153 (40.4%) |
Disability Class by Sex by Age in North Manchester
Disability Class: Hearing Difficulty
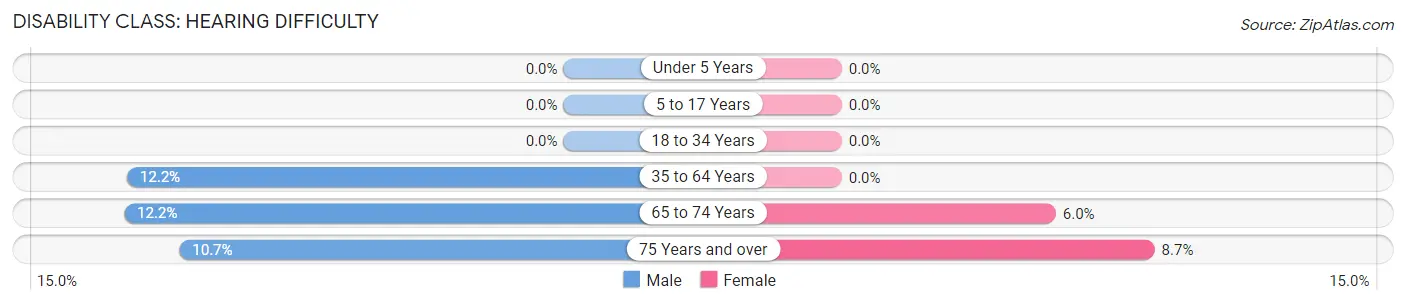
| Age Bracket | Male | Female |
| Under 5 Years | 0 (0.0%) | 0 (0.0%) |
| 5 to 17 Years | 0 (0.0%) | 0 (0.0%) |
| 18 to 34 Years | 0 (0.0%) | 0 (0.0%) |
| 35 to 64 Years | 82 (12.1%) | 0 (0.0%) |
| 65 to 74 Years | 17 (12.2%) | 14 (6.0%) |
| 75 Years and over | 14 (10.7%) | 33 (8.7%) |
Disability Class: Vision Difficulty
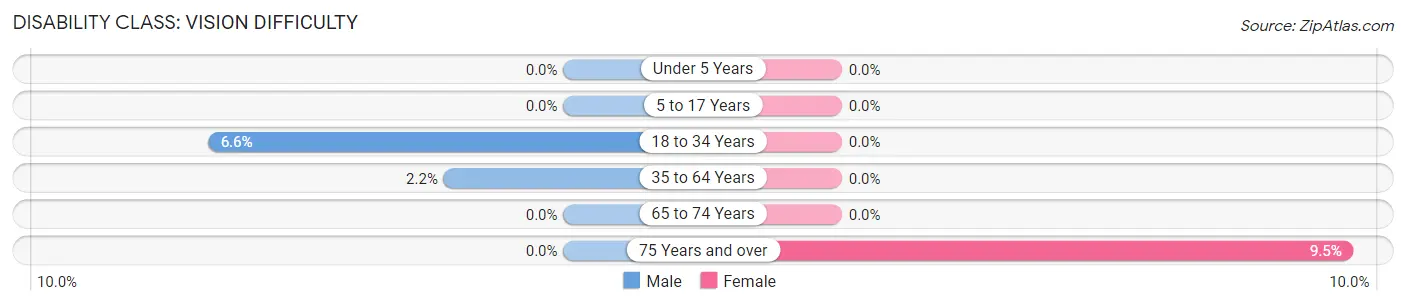
| Age Bracket | Male | Female |
| Under 5 Years | 0 (0.0%) | 0 (0.0%) |
| 5 to 17 Years | 0 (0.0%) | 0 (0.0%) |
| 18 to 34 Years | 49 (6.6%) | 0 (0.0%) |
| 35 to 64 Years | 15 (2.2%) | 0 (0.0%) |
| 65 to 74 Years | 0 (0.0%) | 0 (0.0%) |
| 75 Years and over | 0 (0.0%) | 36 (9.5%) |
Disability Class: Cognitive Difficulty
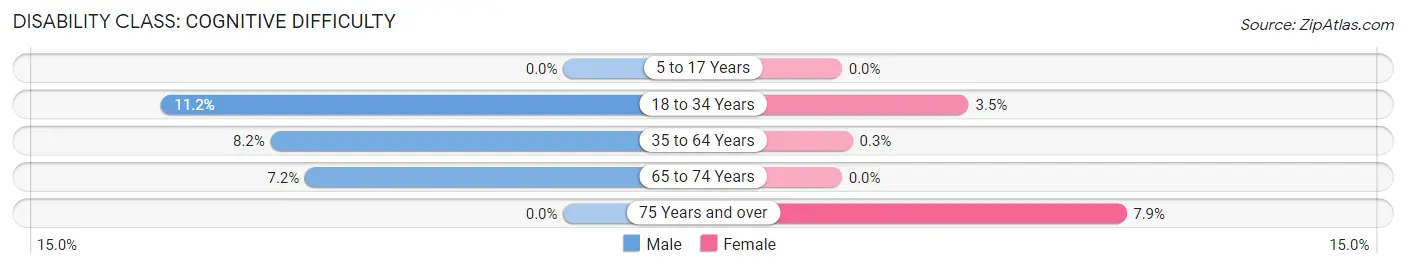
| Age Bracket | Male | Female |
| 5 to 17 Years | 0 (0.0%) | 0 (0.0%) |
| 18 to 34 Years | 83 (11.2%) | 29 (3.5%) |
| 35 to 64 Years | 55 (8.2%) | 2 (0.3%) |
| 65 to 74 Years | 10 (7.2%) | 0 (0.0%) |
| 75 Years and over | 0 (0.0%) | 30 (7.9%) |
Disability Class: Ambulatory Difficulty
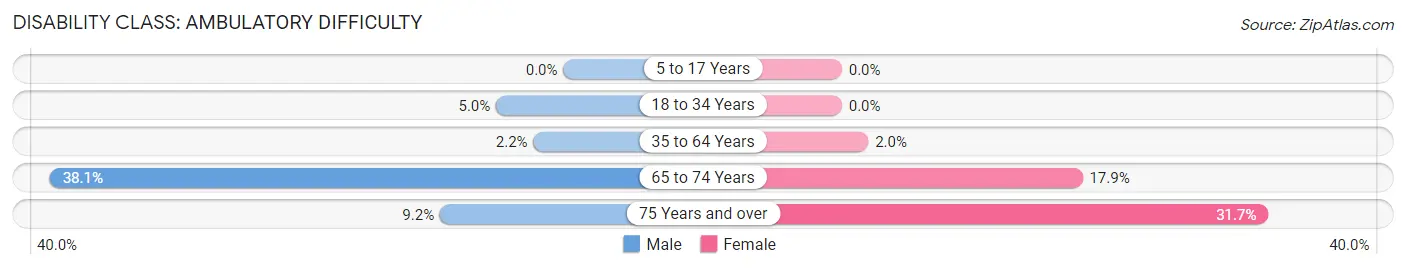
| Age Bracket | Male | Female |
| 5 to 17 Years | 0 (0.0%) | 0 (0.0%) |
| 18 to 34 Years | 37 (5.0%) | 0 (0.0%) |
| 35 to 64 Years | 15 (2.2%) | 13 (2.0%) |
| 65 to 74 Years | 53 (38.1%) | 42 (17.9%) |
| 75 Years and over | 12 (9.2%) | 120 (31.7%) |
Disability Class: Self-Care Difficulty
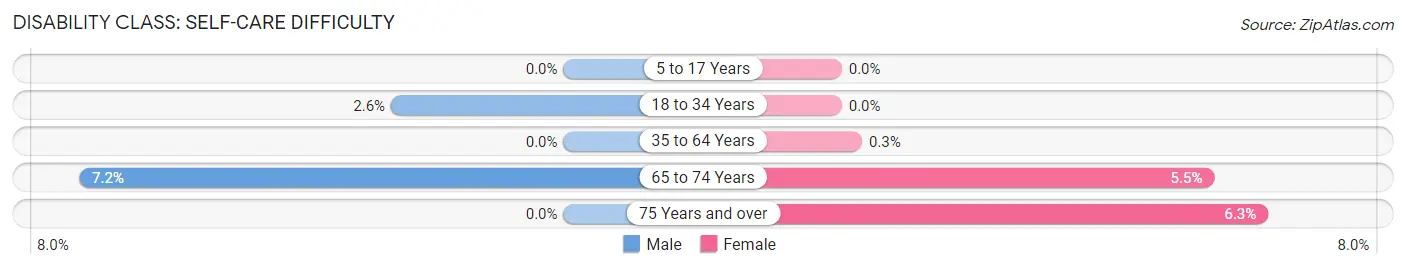
| Age Bracket | Male | Female |
| 5 to 17 Years | 0 (0.0%) | 0 (0.0%) |
| 18 to 34 Years | 19 (2.6%) | 0 (0.0%) |
| 35 to 64 Years | 0 (0.0%) | 2 (0.3%) |
| 65 to 74 Years | 10 (7.2%) | 13 (5.5%) |
| 75 Years and over | 0 (0.0%) | 24 (6.3%) |
Technology Access in North Manchester
Computing Device Access in North Manchester
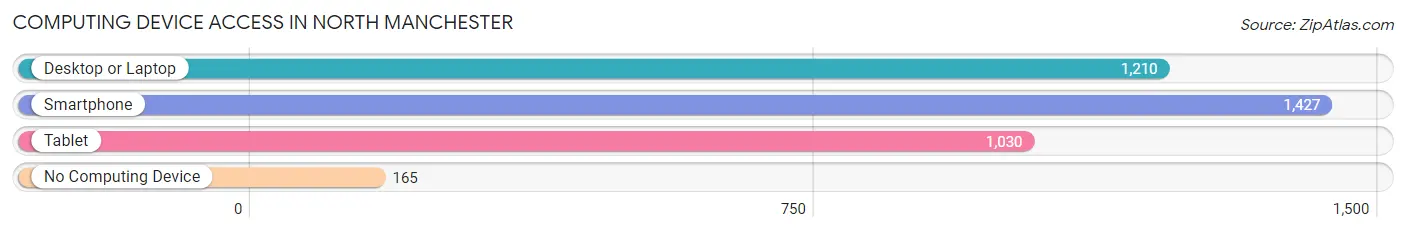
| Device Type | # Households | % Households |
| Desktop or Laptop | 1,210 | 67.2% |
| Smartphone | 1,427 | 79.2% |
| Tablet | 1,030 | 57.2% |
| No Computing Device | 165 | 9.2% |
| Total | 1,801 | 100.0% |
Internet Access in North Manchester
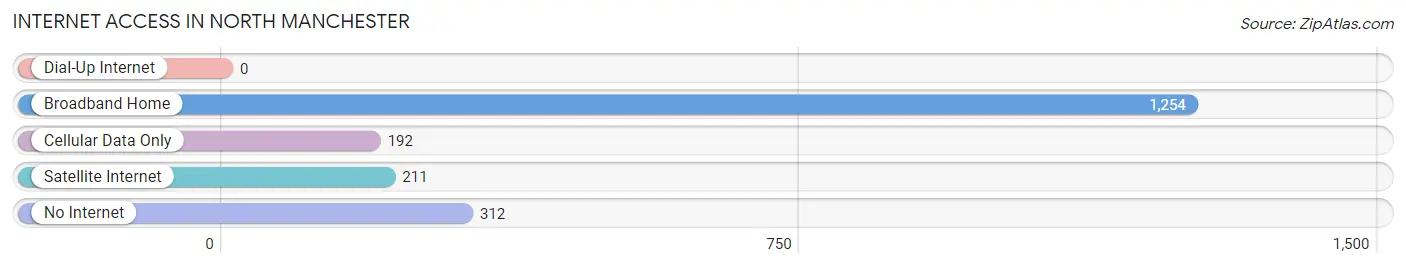
| Internet Type | # Households | % Households |
| Dial-Up Internet | 0 | 0.0% |
| Broadband Home | 1,254 | 69.6% |
| Cellular Data Only | 192 | 10.7% |
| Satellite Internet | 211 | 11.7% |
| No Internet | 312 | 17.3% |
| Total | 1,801 | 100.0% |
North Manchester Summary
Manchester, Indiana is a small town located in Wabash County, Indiana. It is situated in the northeast corner of the state, approximately 40 miles from Fort Wayne and 60 miles from Indianapolis. The town has a population of approximately 5,000 people and is part of the Wabash-Huntington-Whitley Combined Statistical Area.
History
Manchester was founded in 1835 by a group of settlers from Manchester, England. The town was originally known as Manchester Station, as it was a stop on the Wabash and Erie Canal. The town was officially incorporated in 1867.
In the late 19th century, Manchester was a thriving industrial center, with several factories producing furniture, wagons, and other goods. The town was also home to a large number of coal mines, which provided employment for many of the town’s residents.
In the early 20th century, Manchester’s economy shifted away from industry and towards agriculture. The town is now home to several large farms, as well as a number of small businesses.
Geography
Manchester is located in the northeast corner of Indiana, approximately 40 miles from Fort Wayne and 60 miles from Indianapolis. The town is situated in the Wabash Valley, which is part of the larger Wabash-Huntington-Whitley Combined Statistical Area.
The town is situated on the banks of the Wabash River, which provides a number of recreational opportunities for residents and visitors alike. The town is also home to several parks, including Manchester City Park and Manchester State Park.
Economy
Manchester’s economy is largely based on agriculture and small businesses. The town is home to several large farms, as well as a number of small businesses. The town is also home to a number of manufacturing companies, including a furniture factory and a wagon factory.
The town is also home to a number of retail stores, including a grocery store, a hardware store, and a number of restaurants. The town is also home to a number of service-based businesses, including a number of medical and dental offices.
Demographics
As of the 2010 census, Manchester had a population of 5,000 people. The town is predominantly white, with approximately 95% of the population identifying as white. The town is also home to a small Hispanic population, with approximately 3% of the population identifying as Hispanic or Latino.
The town has a median household income of approximately $45,000, which is slightly lower than the state average. The town also has a poverty rate of approximately 15%, which is slightly higher than the state average.
Conclusion
Manchester, Indiana is a small town located in Wabash County, Indiana. The town has a population of approximately 5,000 people and is part of the Wabash-Huntington-Whitley Combined Statistical Area. The town was founded in 1835 by a group of settlers from Manchester, England and was originally known as Manchester Station. The town’s economy is largely based on agriculture and small businesses, and the town is home to a number of manufacturing companies, retail stores, and service-based businesses. The town is predominantly white, with approximately 95% of the population identifying as white. The town has a median household income of approximately $45,000 and a poverty rate of approximately 15%.
Common Questions
What is Per Capita Income in North Manchester?
Per Capita income in North Manchester is $30,705.
What is the Median Family Income in North Manchester?
Median Family Income in North Manchester is $97,028.
What is the Median Household income in North Manchester?
Median Household Income in North Manchester is $63,029.
What is Income or Wage Gap in North Manchester?
Income or Wage Gap in North Manchester is 48.7%.
Women in North Manchester earn 51.3 cents for every dollar earned by a man.
What is Inequality or Gini Index in North Manchester?
Inequality or Gini Index in North Manchester is 0.39.
What is the Total Population of North Manchester?
Total Population of North Manchester is 5,017.
What is the Total Male Population of North Manchester?
Total Male Population of North Manchester is 2,280.
What is the Total Female Population of North Manchester?
Total Female Population of North Manchester is 2,737.
What is the Ratio of Males per 100 Females in North Manchester?
There are 83.30 Males per 100 Females in North Manchester.
What is the Ratio of Females per 100 Males in North Manchester?
There are 120.04 Females per 100 Males in North Manchester.
What is the Median Population Age in North Manchester?
Median Population Age in North Manchester is 40.6 Years.
What is the Average Family Size in North Manchester
Average Family Size in North Manchester is 2.9 People.
What is the Average Household Size in North Manchester
Average Household Size in North Manchester is 2.2 People.
How Large is the Labor Force in North Manchester?
There are 2,377 People in the Labor Forcein in North Manchester.
What is the Percentage of People in the Labor Force in North Manchester?
56.8% of People are in the Labor Force in North Manchester.
What is the Unemployment Rate in North Manchester?
Unemployment Rate in North Manchester is 2.4%.