La Porte, IN Map & Demographics
La Porte Map
La Porte Overview
$28,437
PER CAPITA INCOME
$66,024
AVG FAMILY INCOME
$55,031
AVG HOUSEHOLD INCOME
21.9%
WAGE / INCOME GAP [ % ]
78.1¢/ $1
WAGE / INCOME GAP [ $ ]
$11,271
FAMILY INCOME DEFICIT
0.42
INEQUALITY / GINI INDEX
22,409
TOTAL POPULATION
10,790
MALE POPULATION
11,619
FEMALE POPULATION
92.87
MALES / 100 FEMALES
107.68
FEMALES / 100 MALES
35.0
MEDIAN AGE
3.0
AVG FAMILY SIZE
2.4
AVG HOUSEHOLD SIZE
11,369
LABOR FORCE [ PEOPLE ]
65.8%
PERCENT IN LABOR FORCE
5.5%
UNEMPLOYMENT RATE
La Porte Zip Codes
La Porte Area Codes
Income in La Porte
Income Overview in La Porte
Per Capita Income in La Porte is $28,437, while median incomes of families and households are $66,024 and $55,031 respectively.
| Characteristic | Number | Measure |
| Per Capita Income | 22,409 | $28,437 |
| Median Family Income | 5,517 | $66,024 |
| Mean Family Income | 5,517 | $79,864 |
| Median Household Income | 9,177 | $55,031 |
| Mean Household Income | 9,177 | $68,632 |
| Income Deficit | 5,517 | $11,271 |
| Wage / Income Gap (%) | 22,409 | 21.90% |
| Wage / Income Gap ($) | 22,409 | 78.10¢ per $1 |
| Gini / Inequality Index | 22,409 | 0.42 |
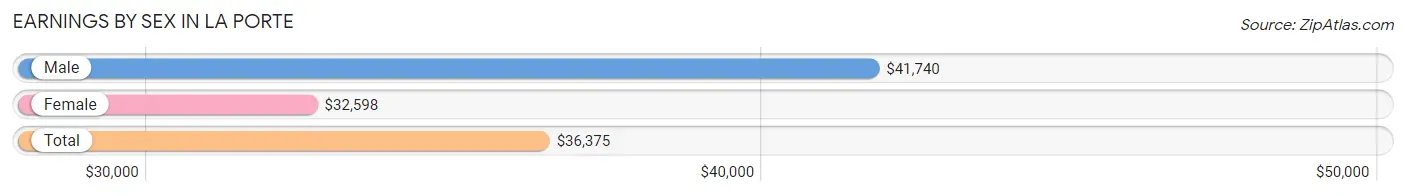
Earnings by Sex in La Porte
Average Earnings in La Porte are $36,375, $41,740 for men and $32,598 for women, a difference of 21.9%.
| Sex | Number | Average Earnings |
| Male | 6,089 (51.4%) | $41,740 |
| Female | 5,758 (48.6%) | $32,598 |
| Total | 11,847 (100.0%) | $36,375 |
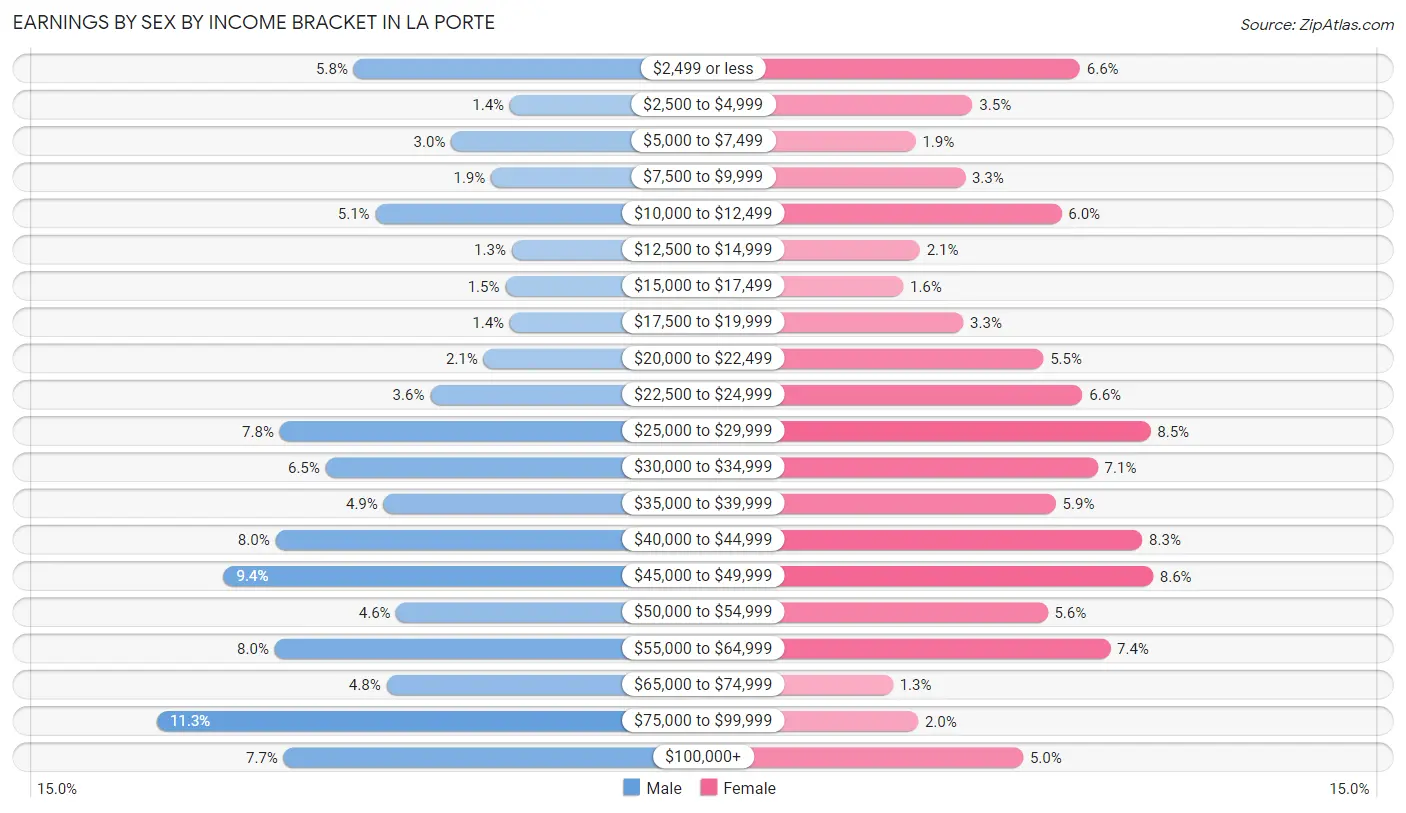
Earnings by Sex by Income Bracket in La Porte
The most common earnings brackets in La Porte are $75,000 to $99,999 for men (687 | 11.3%) and $45,000 to $49,999 for women (495 | 8.6%).
| Income | Male | Female |
| $2,499 or less | 350 (5.8%) | 377 (6.6%) |
| $2,500 to $4,999 | 83 (1.4%) | 203 (3.5%) |
| $5,000 to $7,499 | 183 (3.0%) | 111 (1.9%) |
| $7,500 to $9,999 | 115 (1.9%) | 191 (3.3%) |
| $10,000 to $12,499 | 313 (5.1%) | 347 (6.0%) |
| $12,500 to $14,999 | 80 (1.3%) | 118 (2.1%) |
| $15,000 to $17,499 | 91 (1.5%) | 91 (1.6%) |
| $17,500 to $19,999 | 83 (1.4%) | 188 (3.3%) |
| $20,000 to $22,499 | 128 (2.1%) | 318 (5.5%) |
| $22,500 to $24,999 | 219 (3.6%) | 381 (6.6%) |
| $25,000 to $29,999 | 477 (7.8%) | 491 (8.5%) |
| $30,000 to $34,999 | 398 (6.5%) | 406 (7.0%) |
| $35,000 to $39,999 | 299 (4.9%) | 338 (5.9%) |
| $40,000 to $44,999 | 484 (8.0%) | 478 (8.3%) |
| $45,000 to $49,999 | 573 (9.4%) | 495 (8.6%) |
| $50,000 to $54,999 | 277 (4.5%) | 325 (5.6%) |
| $55,000 to $64,999 | 485 (8.0%) | 426 (7.4%) |
| $65,000 to $74,999 | 294 (4.8%) | 74 (1.3%) |
| $75,000 to $99,999 | 687 (11.3%) | 115 (2.0%) |
| $100,000+ | 470 (7.7%) | 285 (5.0%) |
| Total | 6,089 (100.0%) | 5,758 (100.0%) |
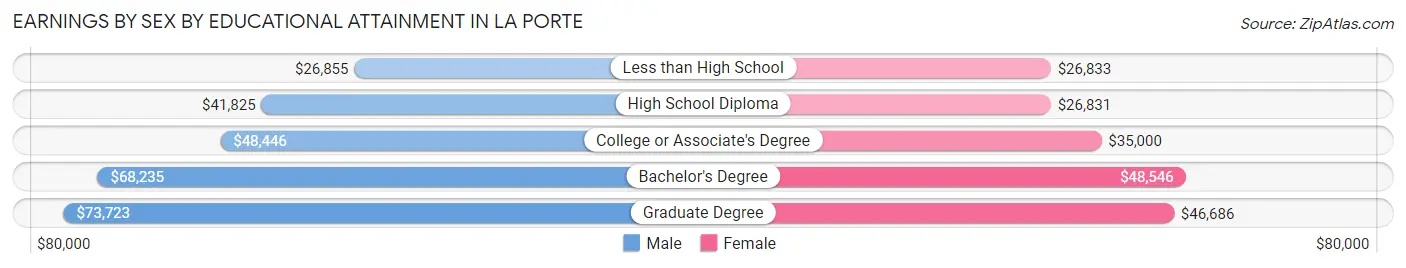
Earnings by Sex by Educational Attainment in La Porte
Average earnings in La Porte are $45,796 for men and $34,992 for women, a difference of 23.6%. Men with an educational attainment of graduate degree enjoy the highest average annual earnings of $73,723, while those with less than high school education earn the least with $26,855. Women with an educational attainment of bachelor's degree earn the most with the average annual earnings of $48,546, while those with high school diploma education have the smallest earnings of $26,831.
| Educational Attainment | Male Income | Female Income |
| Less than High School | $26,855 | $26,833 |
| High School Diploma | $41,825 | $26,831 |
| College or Associate's Degree | $48,446 | $35,000 |
| Bachelor's Degree | $68,235 | $48,546 |
| Graduate Degree | $73,723 | $46,686 |
| Total | $45,796 | $34,992 |
Family Income in La Porte
Family Income Brackets in La Porte
According to the La Porte family income data, there are 1,087 families falling into the $50,000 to $74,999 income range, which is the most common income bracket and makes up 19.7% of all families. Conversely, the $10,000 to $14,999 income bracket is the least frequent group with only 132 families (2.4%) belonging to this category.
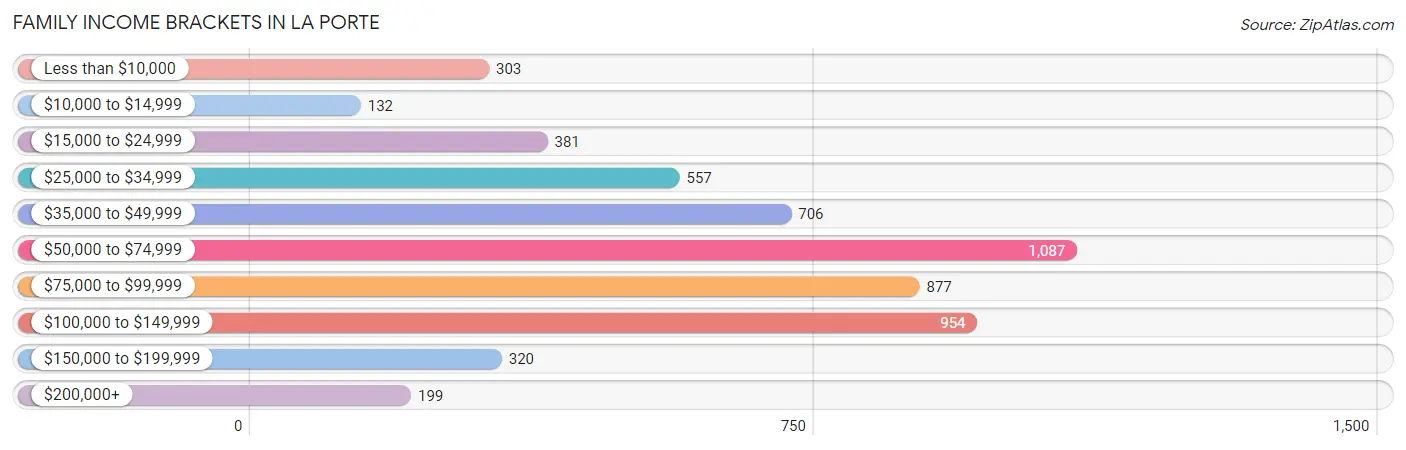
| Income Bracket | # Families | % Families |
| Less than $10,000 | 303 | 5.5% |
| $10,000 to $14,999 | 132 | 2.4% |
| $15,000 to $24,999 | 381 | 6.9% |
| $25,000 to $34,999 | 557 | 10.1% |
| $35,000 to $49,999 | 706 | 12.8% |
| $50,000 to $74,999 | 1,087 | 19.7% |
| $75,000 to $99,999 | 877 | 15.9% |
| $100,000 to $149,999 | 954 | 17.3% |
| $150,000 to $199,999 | 320 | 5.8% |
| $200,000+ | 199 | 3.6% |
Family Income by Famaliy Size in La Porte
5-person families (303 | 5.5%) account for the highest median family income in La Porte with $101,705 per family, while 2-person families (2,720 | 49.3%) have the highest median income of $32,500 per family member.
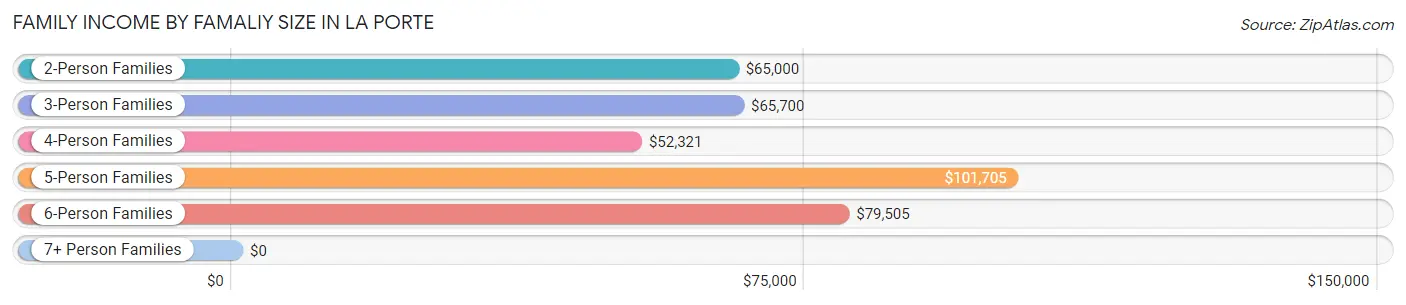
| Income Bracket | # Families | Median Income |
| 2-Person Families | 2,720 (49.3%) | $65,000 |
| 3-Person Families | 1,186 (21.5%) | $65,700 |
| 4-Person Families | 901 (16.3%) | $52,321 |
| 5-Person Families | 303 (5.5%) | $101,705 |
| 6-Person Families | 283 (5.1%) | $79,505 |
| 7+ Person Families | 124 (2.2%) | $0 |
| Total | 5,517 (100.0%) | $66,024 |
Family Income by Number of Earners in La Porte
The median family income in La Porte is $66,024, with families comprising 3+ earners (406) having the highest median family income of $133,603, while families with 1 earner (2,272) have the lowest median family income of $42,386, accounting for 7.4% and 41.2% of families, respectively.
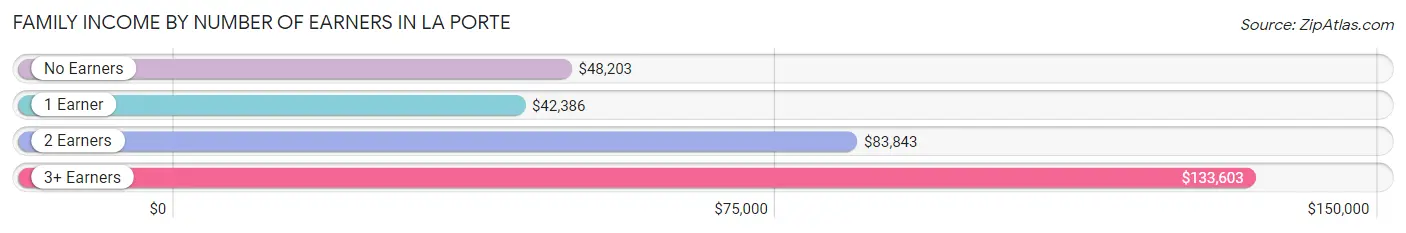
| Number of Earners | # Families | Median Income |
| No Earners | 511 (9.3%) | $48,203 |
| 1 Earner | 2,272 (41.2%) | $42,386 |
| 2 Earners | 2,328 (42.2%) | $83,843 |
| 3+ Earners | 406 (7.4%) | $133,603 |
| Total | 5,517 (100.0%) | $66,024 |
Household Income in La Porte
Household Income Brackets in La Porte
With 1,946 households falling in the category, the $50,000 to $74,999 income range is the most frequent in La Porte, accounting for 21.2% of all households. In contrast, only 284 households (3.1%) fall into the $200,000+ income bracket, making it the least populous group.
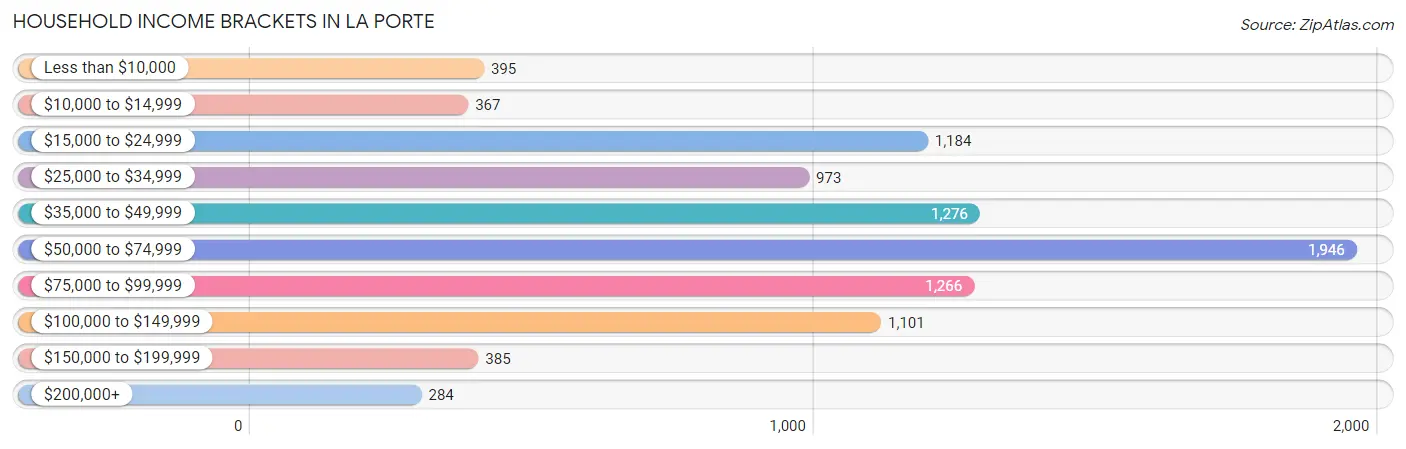
| Income Bracket | # Households | % Households |
| Less than $10,000 | 395 | 4.3% |
| $10,000 to $14,999 | 367 | 4.0% |
| $15,000 to $24,999 | 1,184 | 12.9% |
| $25,000 to $34,999 | 973 | 10.6% |
| $35,000 to $49,999 | 1,276 | 13.9% |
| $50,000 to $74,999 | 1,946 | 21.2% |
| $75,000 to $99,999 | 1,266 | 13.8% |
| $100,000 to $149,999 | 1,101 | 12.0% |
| $150,000 to $199,999 | 385 | 4.2% |
| $200,000+ | 284 | 3.1% |
Household Income by Householder Age in La Porte
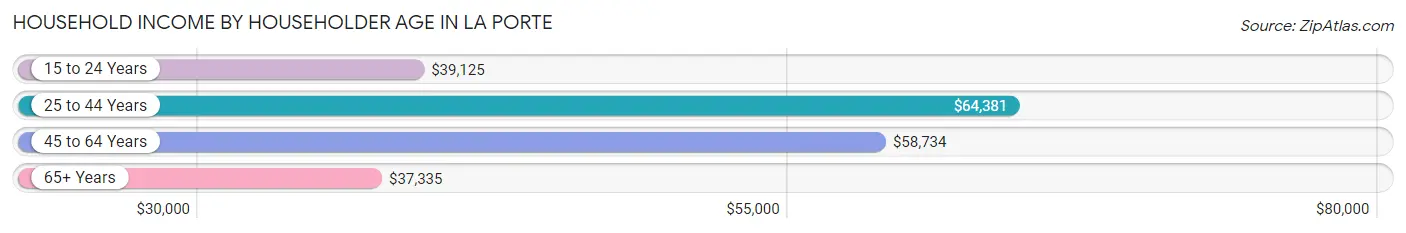
The median household income in La Porte is $55,031, with the highest median household income of $64,381 found in the 25 to 44 years age bracket for the primary householder. A total of 3,063 households (33.4%) fall into this category. Meanwhile, the 65+ years age bracket for the primary householder has the lowest median household income of $37,335, with 2,277 households (24.8%) in this group.
| Income Bracket | # Households | Median Income |
| 15 to 24 Years | 699 (7.6%) | $39,125 |
| 25 to 44 Years | 3,063 (33.4%) | $64,381 |
| 45 to 64 Years | 3,138 (34.2%) | $58,734 |
| 65+ Years | 2,277 (24.8%) | $37,335 |
| Total | 9,177 (100.0%) | $55,031 |
Poverty in La Porte
Income Below Poverty by Sex and Age in La Porte
With 17.6% poverty level for males and 19.4% for females among the residents of La Porte, 15 year old males and 5 year old females are the most vulnerable to poverty, with 96 males (70.1%) and 68 females (75.6%) in their respective age groups living below the poverty level.
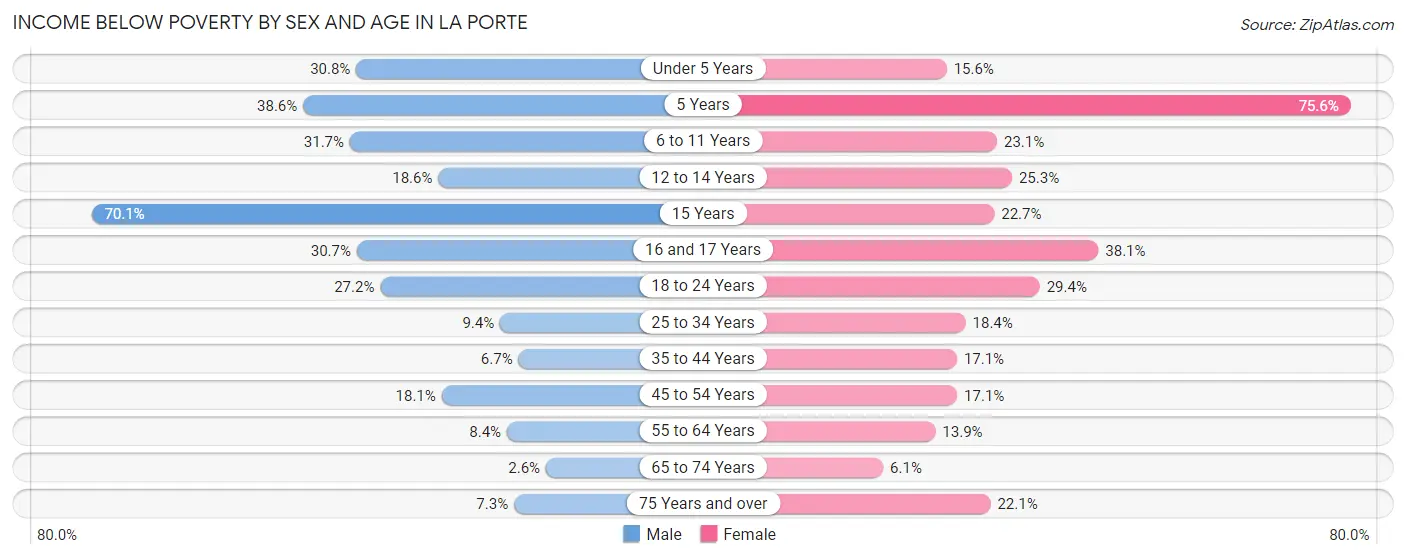
| Age Bracket | Male | Female |
| Under 5 Years | 235 (30.8%) | 129 (15.6%) |
| 5 Years | 34 (38.6%) | 68 (75.6%) |
| 6 to 11 Years | 382 (31.7%) | 180 (23.1%) |
| 12 to 14 Years | 65 (18.6%) | 118 (25.3%) |
| 15 Years | 96 (70.1%) | 70 (22.7%) |
| 16 and 17 Years | 69 (30.7%) | 160 (38.1%) |
| 18 to 24 Years | 342 (27.2%) | 308 (29.4%) |
| 25 to 34 Years | 149 (9.4%) | 255 (18.4%) |
| 35 to 44 Years | 76 (6.7%) | 254 (17.1%) |
| 45 to 54 Years | 220 (18.1%) | 202 (17.1%) |
| 55 to 64 Years | 106 (8.4%) | 198 (13.9%) |
| 65 to 74 Years | 19 (2.6%) | 64 (6.1%) |
| 75 Years and over | 28 (7.3%) | 210 (22.1%) |
| Total | 1,821 (17.6%) | 2,216 (19.4%) |
Income Above Poverty by Sex and Age in La Porte
According to the poverty statistics in La Porte, males aged 65 to 74 years and females aged 65 to 74 years are the age groups that are most secure financially, with 97.4% of males and 93.9% of females in these age groups living above the poverty line.
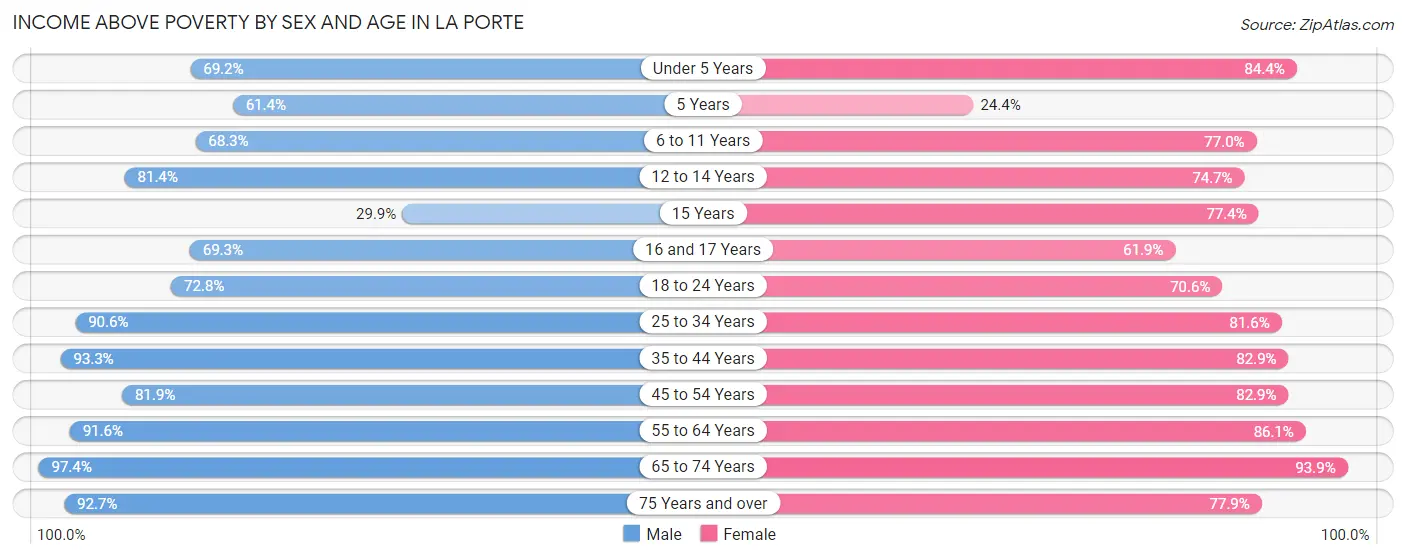
| Age Bracket | Male | Female |
| Under 5 Years | 529 (69.2%) | 699 (84.4%) |
| 5 Years | 54 (61.4%) | 22 (24.4%) |
| 6 to 11 Years | 823 (68.3%) | 601 (76.9%) |
| 12 to 14 Years | 285 (81.4%) | 349 (74.7%) |
| 15 Years | 41 (29.9%) | 239 (77.3%) |
| 16 and 17 Years | 156 (69.3%) | 260 (61.9%) |
| 18 to 24 Years | 916 (72.8%) | 740 (70.6%) |
| 25 to 34 Years | 1,436 (90.6%) | 1,132 (81.6%) |
| 35 to 44 Years | 1,065 (93.3%) | 1,231 (82.9%) |
| 45 to 54 Years | 997 (81.9%) | 977 (82.9%) |
| 55 to 64 Years | 1,159 (91.6%) | 1,226 (86.1%) |
| 65 to 74 Years | 714 (97.4%) | 979 (93.9%) |
| 75 Years and over | 354 (92.7%) | 741 (77.9%) |
| Total | 8,529 (82.4%) | 9,196 (80.6%) |
Income Below Poverty Among Married-Couple Families in La Porte
The poverty statistics for married-couple families in La Porte show that 4.9% or 162 of the total 3,307 families live below the poverty line. Families with 5 or more children have the highest poverty rate of 70.8%, comprising of 17 families. On the other hand, families with 3 or 4 children have the lowest poverty rate of 0.7%, which includes 3 families.
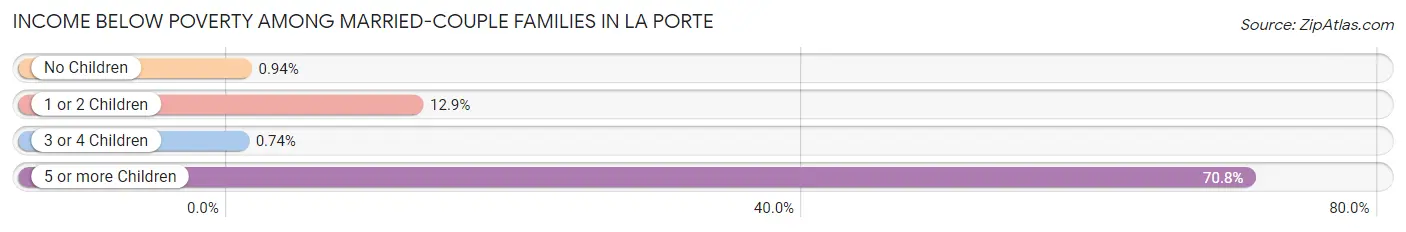
| Children | Above Poverty | Below Poverty |
| No Children | 1,895 (99.1%) | 18 (0.9%) |
| 1 or 2 Children | 838 (87.1%) | 124 (12.9%) |
| 3 or 4 Children | 405 (99.3%) | 3 (0.7%) |
| 5 or more Children | 7 (29.2%) | 17 (70.8%) |
| Total | 3,145 (95.1%) | 162 (4.9%) |
Income Below Poverty Among Single-Parent Households in La Porte
According to the poverty data in La Porte, 31.8% or 282 single-father households and 25.6% or 339 single-mother households are living below the poverty line. Among single-father households, those with 3 or 4 children have the highest poverty rate, with 41 households (41.4%) experiencing poverty. Likewise, among single-mother households, those with 5 or more children have the highest poverty rate, with 62 households (76.5%) falling below the poverty line.
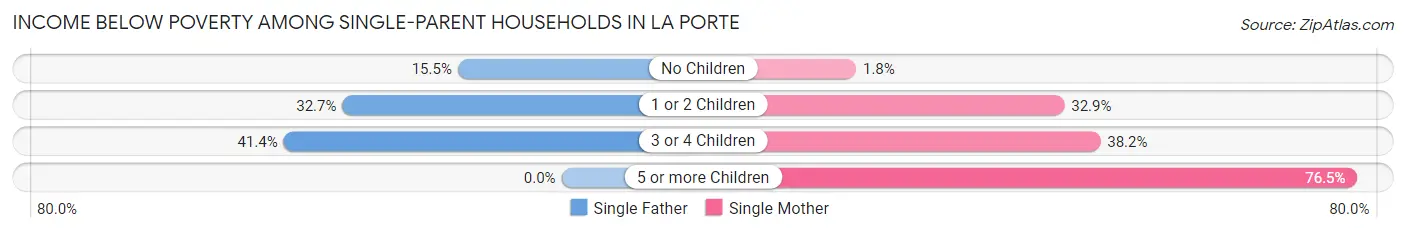
| Children | Single Father | Single Mother |
| No Children | 15 (15.5%) | 8 (1.8%) |
| 1 or 2 Children | 226 (32.7%) | 243 (32.9%) |
| 3 or 4 Children | 41 (41.4%) | 26 (38.2%) |
| 5 or more Children | 0 (0.0%) | 62 (76.5%) |
| Total | 282 (31.8%) | 339 (25.6%) |
Income Below Poverty Among Married-Couple vs Single-Parent Households in La Porte
The poverty data for La Porte shows that 162 of the married-couple family households (4.9%) and 621 of the single-parent households (28.1%) are living below the poverty level. Within the married-couple family households, those with 5 or more children have the highest poverty rate, with 17 households (70.8%) falling below the poverty line. Among the single-parent households, those with 5 or more children have the highest poverty rate, with 62 household (76.5%) living below poverty.
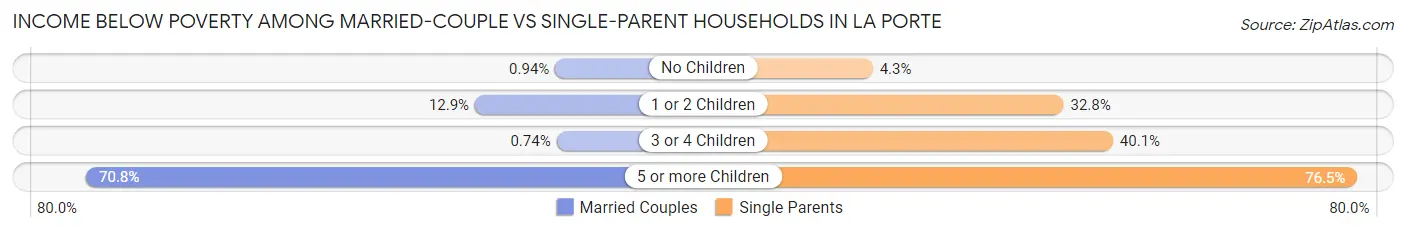
| Children | Married-Couple Families | Single-Parent Households |
| No Children | 18 (0.9%) | 23 (4.3%) |
| 1 or 2 Children | 124 (12.9%) | 469 (32.8%) |
| 3 or 4 Children | 3 (0.7%) | 67 (40.1%) |
| 5 or more Children | 17 (70.8%) | 62 (76.5%) |
| Total | 162 (4.9%) | 621 (28.1%) |
Race in La Porte
The most populous races in La Porte are White / Caucasian (18,322 | 81.8%), Hispanic or Latino (2,925 | 13.1%), and Two or more Races (1,877 | 8.4%).
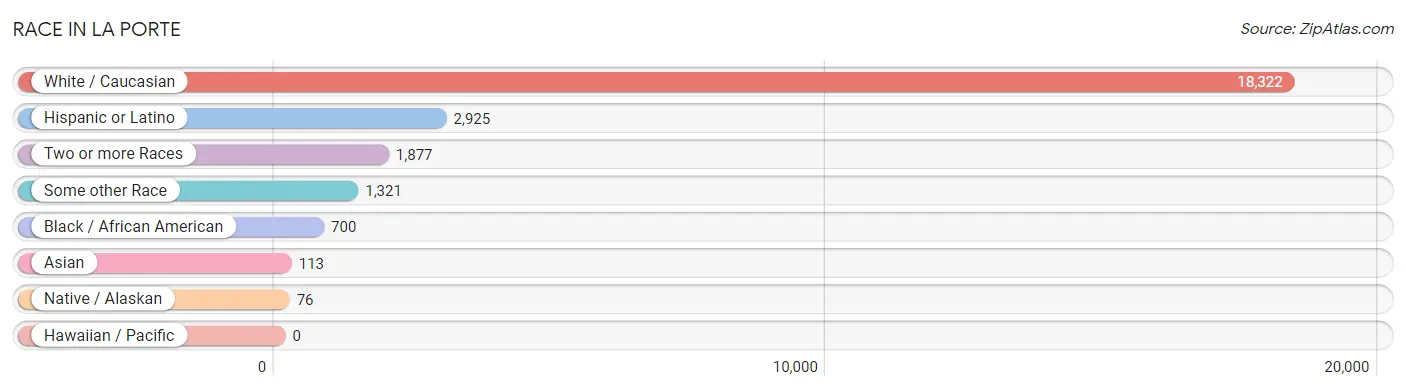
| Race | # Population | % Population |
| Asian | 113 | 0.5% |
| Black / African American | 700 | 3.1% |
| Hawaiian / Pacific | 0 | 0.0% |
| Hispanic or Latino | 2,925 | 13.1% |
| Native / Alaskan | 76 | 0.3% |
| White / Caucasian | 18,322 | 81.8% |
| Two or more Races | 1,877 | 8.4% |
| Some other Race | 1,321 | 5.9% |
| Total | 22,409 | 100.0% |
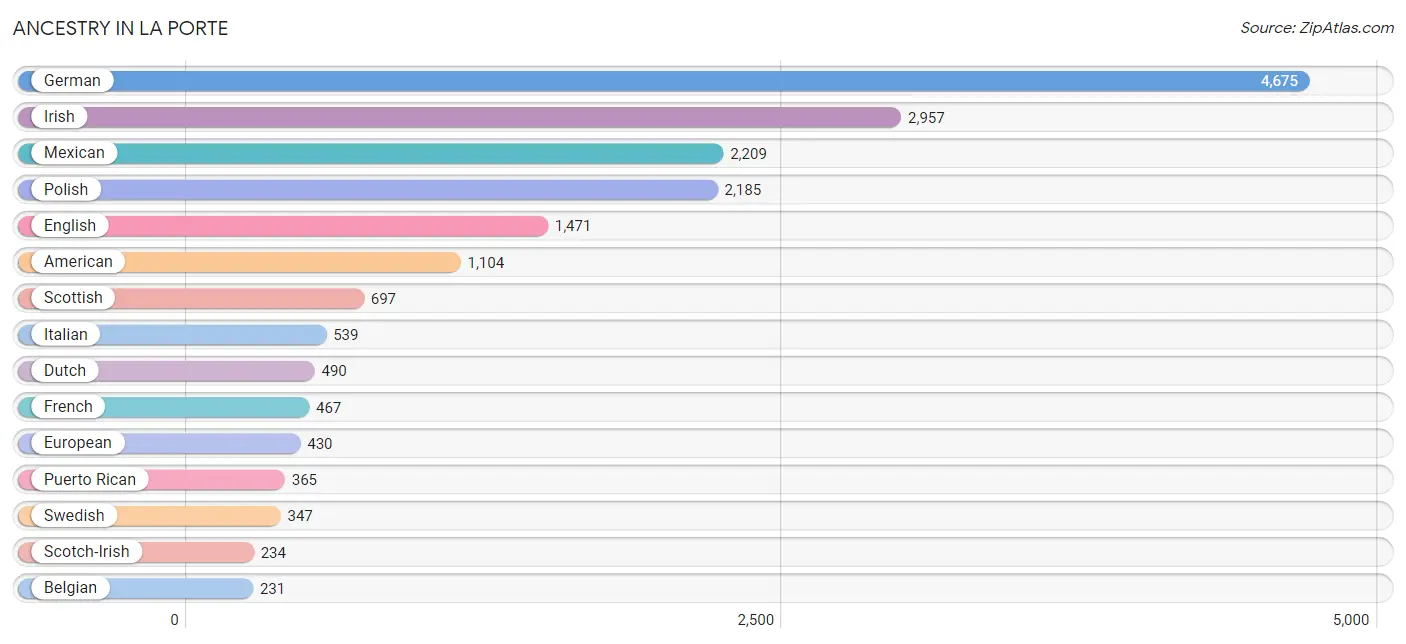
Ancestry in La Porte
The most populous ancestries reported in La Porte are German (4,675 | 20.9%), Irish (2,957 | 13.2%), Mexican (2,209 | 9.9%), Polish (2,185 | 9.8%), and English (1,471 | 6.6%), together accounting for 60.2% of all La Porte residents.
| Ancestry | # Population | % Population |
| American | 1,104 | 4.9% |
| Arab | 68 | 0.3% |
| Austrian | 20 | 0.1% |
| Belgian | 231 | 1.0% |
| Blackfeet | 29 | 0.1% |
| Brazilian | 9 | 0.0% |
| British | 51 | 0.2% |
| Canadian | 43 | 0.2% |
| Central American | 213 | 0.9% |
| Cherokee | 66 | 0.3% |
| Choctaw | 9 | 0.0% |
| Croatian | 33 | 0.2% |
| Czech | 175 | 0.8% |
| Czechoslovakian | 16 | 0.1% |
| Danish | 21 | 0.1% |
| Dominican | 43 | 0.2% |
| Dutch | 490 | 2.2% |
| Eastern European | 16 | 0.1% |
| English | 1,471 | 6.6% |
| European | 430 | 1.9% |
| Finnish | 45 | 0.2% |
| French | 467 | 2.1% |
| French Canadian | 91 | 0.4% |
| German | 4,675 | 20.9% |
| Greek | 124 | 0.5% |
| Guatemalan | 21 | 0.1% |
| Honduran | 20 | 0.1% |
| Hungarian | 127 | 0.6% |
| Irish | 2,957 | 13.2% |
| Italian | 539 | 2.4% |
| Korean | 63 | 0.3% |
| Lebanese | 68 | 0.3% |
| Lithuanian | 46 | 0.2% |
| Mexican | 2,209 | 9.9% |
| Norwegian | 78 | 0.4% |
| Pennsylvania German | 3 | 0.0% |
| Polish | 2,185 | 9.8% |
| Puerto Rican | 365 | 1.6% |
| Russian | 226 | 1.0% |
| Salvadoran | 172 | 0.8% |
| Scandinavian | 37 | 0.2% |
| Scotch-Irish | 234 | 1.0% |
| Scottish | 697 | 3.1% |
| Serbian | 33 | 0.2% |
| Slovak | 102 | 0.5% |
| Spaniard | 53 | 0.2% |
| Sri Lankan | 50 | 0.2% |
| Swedish | 347 | 1.5% |
| Swiss | 49 | 0.2% |
| Ukrainian | 52 | 0.2% |
| Welsh | 58 | 0.3% | View All 51 Rows |
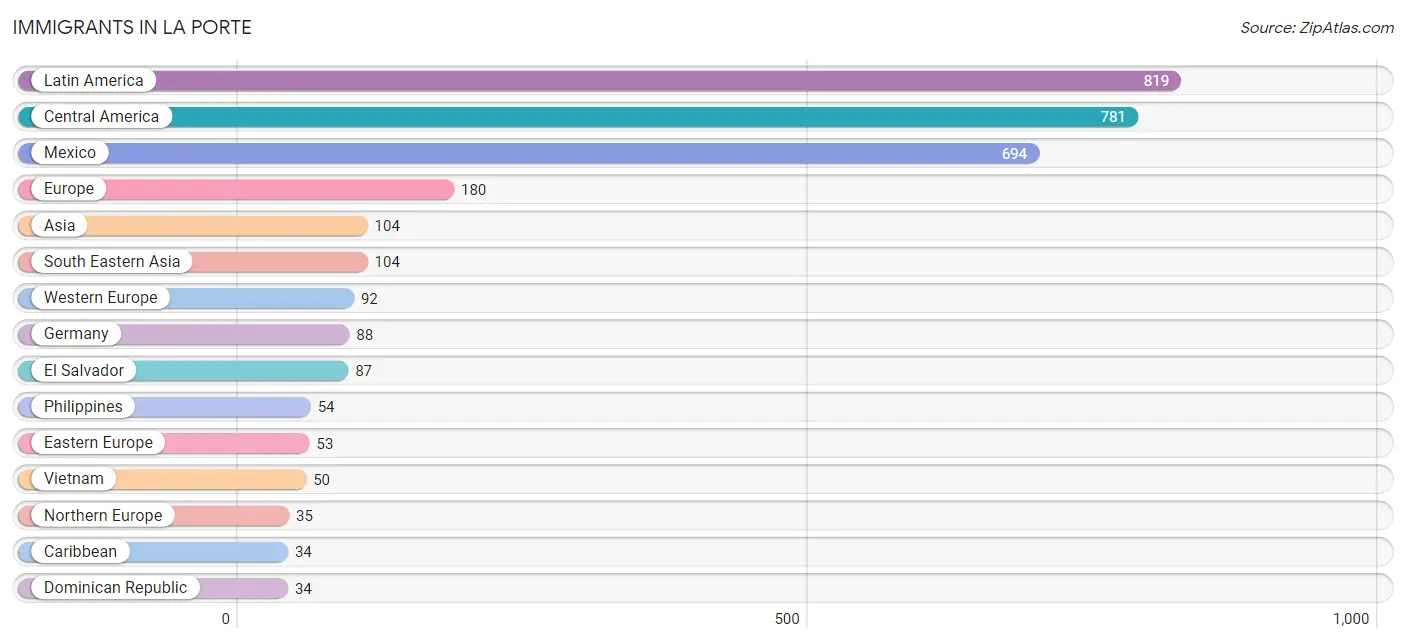
Immigrants in La Porte
The most numerous immigrant groups reported in La Porte came from Latin America (819 | 3.6%), Central America (781 | 3.5%), Mexico (694 | 3.1%), Europe (180 | 0.8%), and Asia (104 | 0.5%), together accounting for 11.5% of all La Porte residents.
| Immigration Origin | # Population | % Population |
| Asia | 104 | 0.5% |
| Australia | 7 | 0.0% |
| Brazil | 4 | 0.0% |
| Caribbean | 34 | 0.2% |
| Central America | 781 | 3.5% |
| Dominican Republic | 34 | 0.2% |
| Eastern Europe | 53 | 0.2% |
| El Salvador | 87 | 0.4% |
| England | 21 | 0.1% |
| Europe | 180 | 0.8% |
| France | 4 | 0.0% |
| Germany | 88 | 0.4% |
| Latin America | 819 | 3.6% |
| Lithuania | 9 | 0.0% |
| Mexico | 694 | 3.1% |
| Northern Europe | 35 | 0.2% |
| Oceania | 7 | 0.0% |
| Philippines | 54 | 0.2% |
| Poland | 14 | 0.1% |
| Russia | 30 | 0.1% |
| South America | 4 | 0.0% |
| South Eastern Asia | 104 | 0.5% |
| Vietnam | 50 | 0.2% |
| Western Europe | 92 | 0.4% | View All 24 Rows |
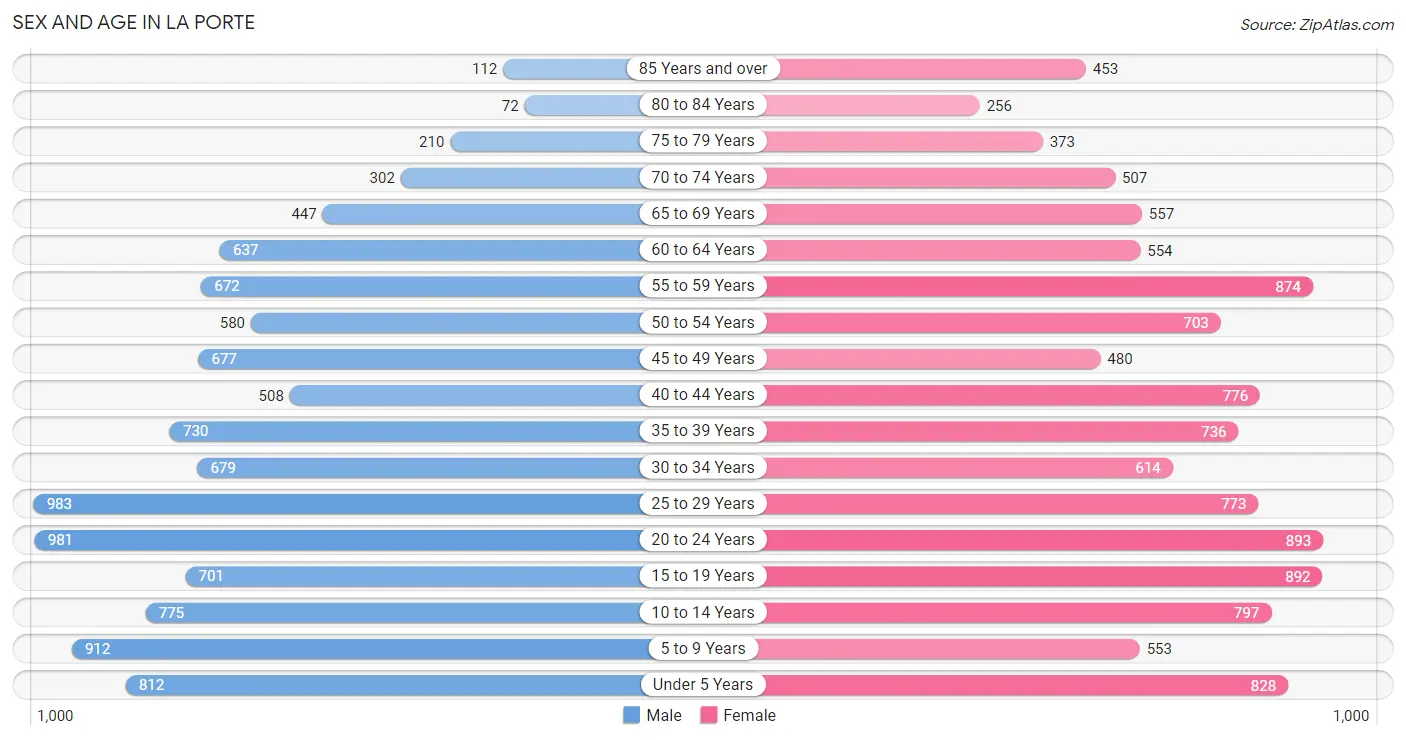
Sex and Age in La Porte
Sex and Age in La Porte
The most populous age groups in La Porte are 25 to 29 Years (983 | 9.1%) for men and 20 to 24 Years (893 | 7.7%) for women.
| Age Bracket | Male | Female |
| Under 5 Years | 812 (7.5%) | 828 (7.1%) |
| 5 to 9 Years | 912 (8.5%) | 553 (4.8%) |
| 10 to 14 Years | 775 (7.2%) | 797 (6.9%) |
| 15 to 19 Years | 701 (6.5%) | 892 (7.7%) |
| 20 to 24 Years | 981 (9.1%) | 893 (7.7%) |
| 25 to 29 Years | 983 (9.1%) | 773 (6.7%) |
| 30 to 34 Years | 679 (6.3%) | 614 (5.3%) |
| 35 to 39 Years | 730 (6.8%) | 736 (6.3%) |
| 40 to 44 Years | 508 (4.7%) | 776 (6.7%) |
| 45 to 49 Years | 677 (6.3%) | 480 (4.1%) |
| 50 to 54 Years | 580 (5.4%) | 703 (6.0%) |
| 55 to 59 Years | 672 (6.2%) | 874 (7.5%) |
| 60 to 64 Years | 637 (5.9%) | 554 (4.8%) |
| 65 to 69 Years | 447 (4.1%) | 557 (4.8%) |
| 70 to 74 Years | 302 (2.8%) | 507 (4.4%) |
| 75 to 79 Years | 210 (1.9%) | 373 (3.2%) |
| 80 to 84 Years | 72 (0.7%) | 256 (2.2%) |
| 85 Years and over | 112 (1.0%) | 453 (3.9%) |
| Total | 10,790 (100.0%) | 11,619 (100.0%) |
Families and Households in La Porte
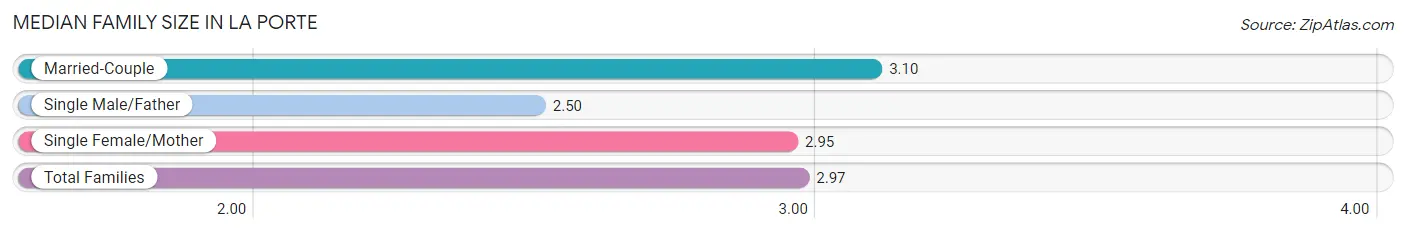
Median Family Size in La Porte
The median family size in La Porte is 2.97 persons per family, with married-couple families (3,307 | 59.9%) accounting for the largest median family size of 3.1 persons per family. On the other hand, single male/father families (888 | 16.1%) represent the smallest median family size with 2.50 persons per family.
| Family Type | # Families | Family Size |
| Married-Couple | 3,307 (59.9%) | 3.10 |
| Single Male/Father | 888 (16.1%) | 2.50 |
| Single Female/Mother | 1,322 (24.0%) | 2.95 |
| Total Families | 5,517 (100.0%) | 2.97 |
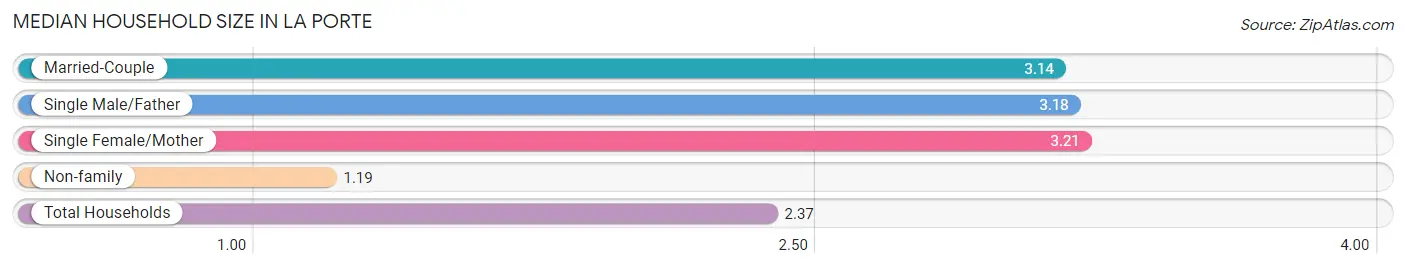
Median Household Size in La Porte
The median household size in La Porte is 2.37 persons per household, with single female/mother households (1,322 | 14.4%) accounting for the largest median household size of 3.21 persons per household. non-family households (3,660 | 39.9%) represent the smallest median household size with 1.19 persons per household.
| Household Type | # Households | Household Size |
| Married-Couple | 3,307 (36.0%) | 3.14 |
| Single Male/Father | 888 (9.7%) | 3.18 |
| Single Female/Mother | 1,322 (14.4%) | 3.21 |
| Non-family | 3,660 (39.9%) | 1.19 |
| Total Households | 9,177 (100.0%) | 2.37 |
Household Size by Marriage Status in La Porte
Out of a total of 9,177 households in La Porte, 5,517 (60.1%) are family households, while 3,660 (39.9%) are nonfamily households. The most numerous type of family households are 2-person households, comprising 2,259, and the most common type of nonfamily households are 1-person households, comprising 2,916.
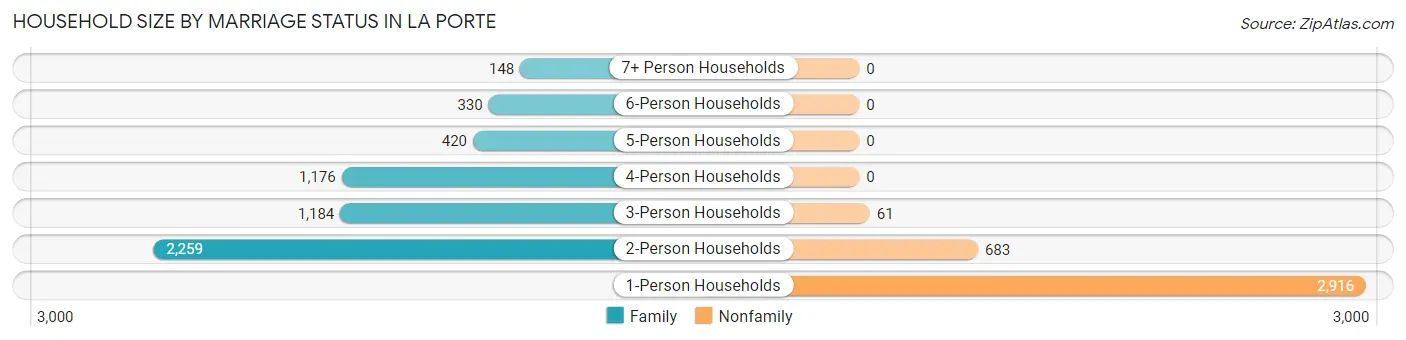
| Household Size | Family Households | Nonfamily Households |
| 1-Person Households | - | 2,916 (31.8%) |
| 2-Person Households | 2,259 (24.6%) | 683 (7.4%) |
| 3-Person Households | 1,184 (12.9%) | 61 (0.7%) |
| 4-Person Households | 1,176 (12.8%) | 0 (0.0%) |
| 5-Person Households | 420 (4.6%) | 0 (0.0%) |
| 6-Person Households | 330 (3.6%) | 0 (0.0%) |
| 7+ Person Households | 148 (1.6%) | 0 (0.0%) |
| Total | 5,517 (60.1%) | 3,660 (39.9%) |
Female Fertility in La Porte
Fertility by Age in La Porte
Average fertility rate in La Porte is 63.0 births per 1,000 women. Women in the age bracket of 20 to 34 years have the highest fertility rate with 107.0 births per 1,000 women. Women in the age bracket of 20 to 34 years acount for 71.0% of all women with births.
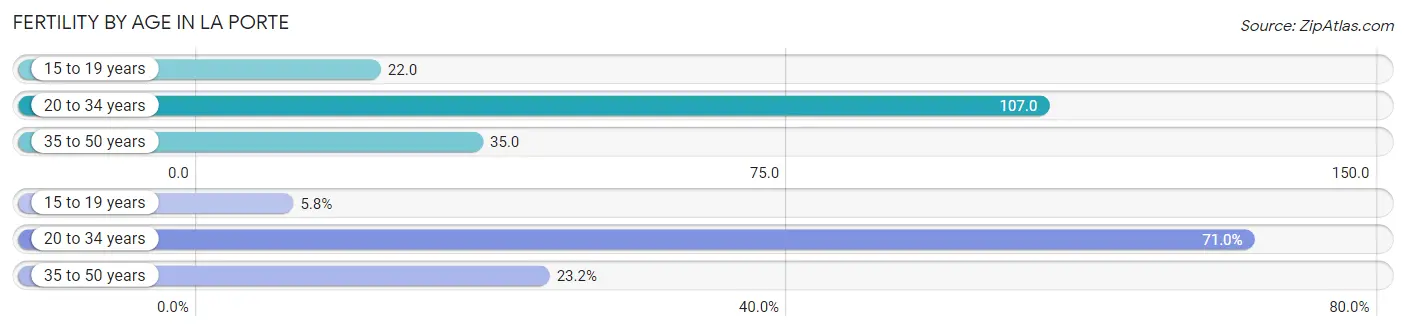
| Age Bracket | Women with Births | Births / 1,000 Women |
| 15 to 19 years | 20 (5.8%) | 22.0 |
| 20 to 34 years | 245 (71.0%) | 107.0 |
| 35 to 50 years | 80 (23.2%) | 35.0 |
| Total | 345 (100.0%) | 63.0 |
Fertility by Age by Marriage Status in La Porte
49.0% of women with births (345) in La Porte are married. The highest percentage of unmarried women with births falls into 15 to 19 years age bracket with 100.0% of them unmarried at the time of birth, while the lowest percentage of unmarried women with births belong to 35 to 50 years age bracket with 47.5% of them unmarried.
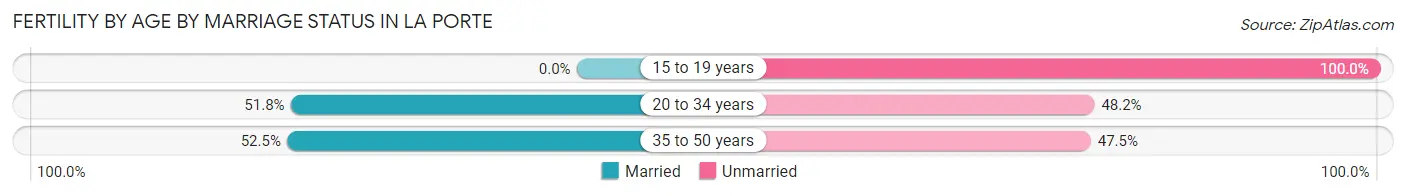
| Age Bracket | Married | Unmarried |
| 15 to 19 years | 0 (0.0%) | 20 (100.0%) |
| 20 to 34 years | 127 (51.8%) | 118 (48.2%) |
| 35 to 50 years | 42 (52.5%) | 38 (47.5%) |
| Total | 169 (49.0%) | 176 (51.0%) |
Fertility by Education in La Porte
Average fertility rate in La Porte is 63.0 births per 1,000 women. Women with the education attainment of graduate degree have the highest fertility rate of 269.0 births per 1,000 women, while women with the education attainment of bachelor's degree have the lowest fertility at 6.0 births per 1,000 women. Women with the education attainment of high school diploma represent 42.9% of all women with births.
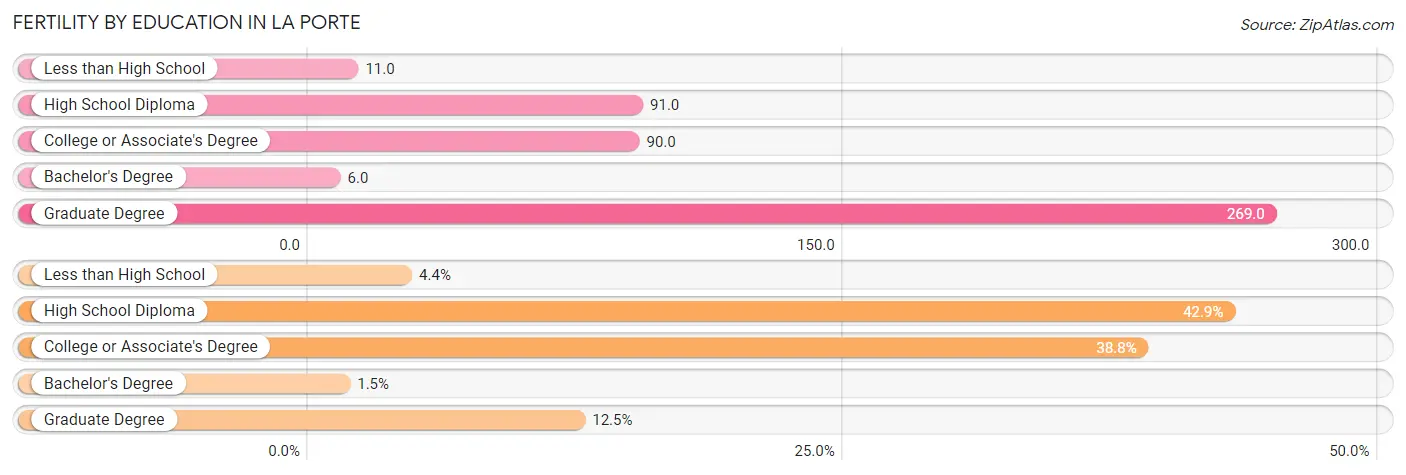
| Educational Attainment | Women with Births | Births / 1,000 Women |
| Less than High School | 15 (4.3%) | 11.0 |
| High School Diploma | 148 (42.9%) | 91.0 |
| College or Associate's Degree | 134 (38.8%) | 90.0 |
| Bachelor's Degree | 5 (1.5%) | 6.0 |
| Graduate Degree | 43 (12.5%) | 269.0 |
| Total | 345 (100.0%) | 63.0 |
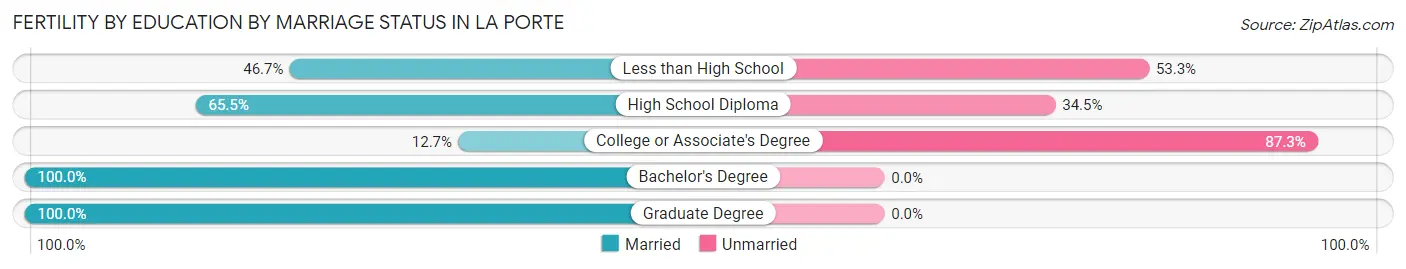
Fertility by Education by Marriage Status in La Porte
51.0% of women with births in La Porte are unmarried. Women with the educational attainment of bachelor's degree are most likely to be married with 100.0% of them married at childbirth, while women with the educational attainment of college or associate's degree are least likely to be married with 87.3% of them unmarried at childbirth.
| Educational Attainment | Married | Unmarried |
| Less than High School | 7 (46.7%) | 8 (53.3%) |
| High School Diploma | 97 (65.5%) | 51 (34.5%) |
| College or Associate's Degree | 17 (12.7%) | 117 (87.3%) |
| Bachelor's Degree | 5 (100.0%) | 0 (0.0%) |
| Graduate Degree | 43 (100.0%) | 0 (0.0%) |
| Total | 169 (49.0%) | 176 (51.0%) |
Employment Characteristics in La Porte
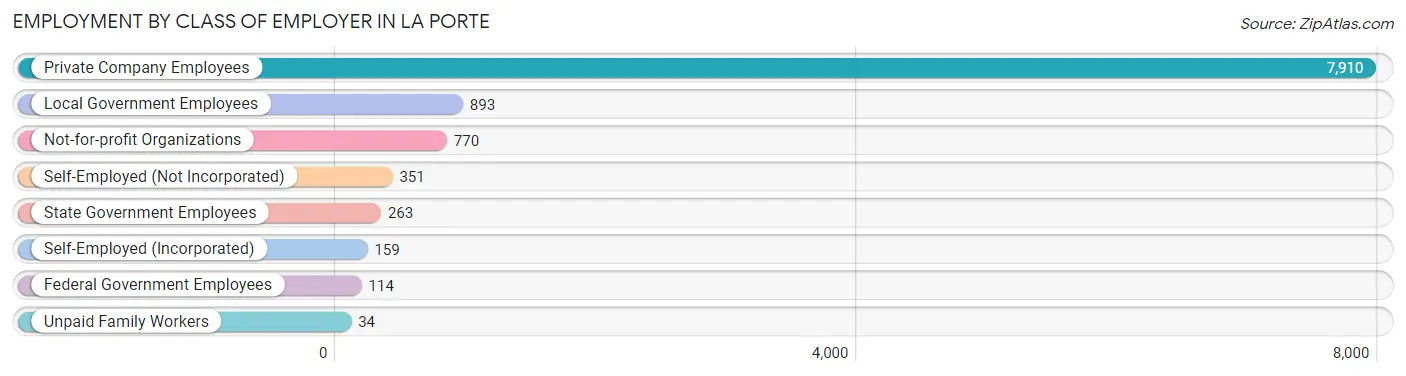
Employment by Class of Employer in La Porte
Among the 10,494 employed individuals in La Porte, private company employees (7,910 | 75.4%), local government employees (893 | 8.5%), and not-for-profit organizations (770 | 7.3%) make up the most common classes of employment.
| Employer Class | # Employees | % Employees |
| Private Company Employees | 7,910 | 75.4% |
| Self-Employed (Incorporated) | 159 | 1.5% |
| Self-Employed (Not Incorporated) | 351 | 3.3% |
| Not-for-profit Organizations | 770 | 7.3% |
| Local Government Employees | 893 | 8.5% |
| State Government Employees | 263 | 2.5% |
| Federal Government Employees | 114 | 1.1% |
| Unpaid Family Workers | 34 | 0.3% |
| Total | 10,494 | 100.0% |
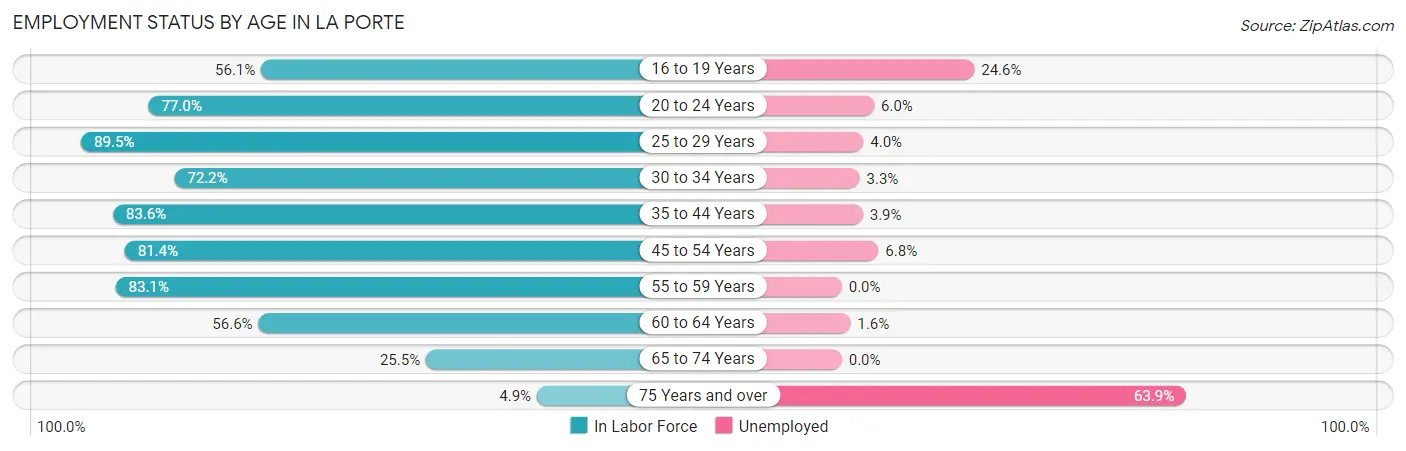
Employment Status by Age in La Porte
According to the labor force statistics for La Porte, out of the total population over 16 years of age (17,278), 65.8% or 11,369 individuals are in the labor force, with 5.5% or 625 of them unemployed. The age group with the highest labor force participation rate is 25 to 29 years, with 89.5% or 1,572 individuals in the labor force. Within the labor force, the 75 years and over age range has the highest percentage of unemployed individuals, with 63.9% or 46 of them being unemployed.
| Age Bracket | In Labor Force | Unemployed |
| 16 to 19 Years | 639 (56.1%) | 157 (24.6%) |
| 20 to 24 Years | 1,443 (77.0%) | 87 (6.0%) |
| 25 to 29 Years | 1,572 (89.5%) | 63 (4.0%) |
| 30 to 34 Years | 934 (72.2%) | 31 (3.3%) |
| 35 to 44 Years | 2,299 (83.6%) | 90 (3.9%) |
| 45 to 54 Years | 1,986 (81.4%) | 135 (6.8%) |
| 55 to 59 Years | 1,285 (83.1%) | 0 (0.0%) |
| 60 to 64 Years | 674 (56.6%) | 11 (1.6%) |
| 65 to 74 Years | 462 (25.5%) | 0 (0.0%) |
| 75 Years and over | 72 (4.9%) | 46 (63.9%) |
| Total | 11,369 (65.8%) | 625 (5.5%) |
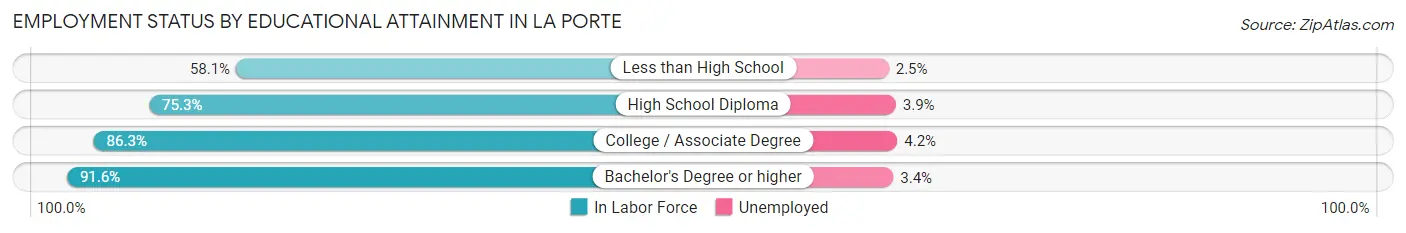
Employment Status by Educational Attainment in La Porte
According to labor force statistics for La Porte, 79.7% of individuals (8,748) out of the total population between 25 and 64 years of age (10,976) are in the labor force, with 3.8% or 332 of them being unemployed. The group with the highest labor force participation rate are those with the educational attainment of bachelor's degree or higher, with 91.6% or 2,028 individuals in the labor force. Within the labor force, individuals with college / associate degree education have the highest percentage of unemployment, with 4.2% or 114 of them being unemployed.
| Educational Attainment | In Labor Force | Unemployed |
| Less than High School | 747 (58.1%) | 32 (2.5%) |
| High School Diploma | 3,267 (75.3%) | 169 (3.9%) |
| College / Associate Degree | 2,707 (86.3%) | 132 (4.2%) |
| Bachelor's Degree or higher | 2,028 (91.6%) | 75 (3.4%) |
| Total | 8,748 (79.7%) | 417 (3.8%) |
Employment Occupations by Sex in La Porte
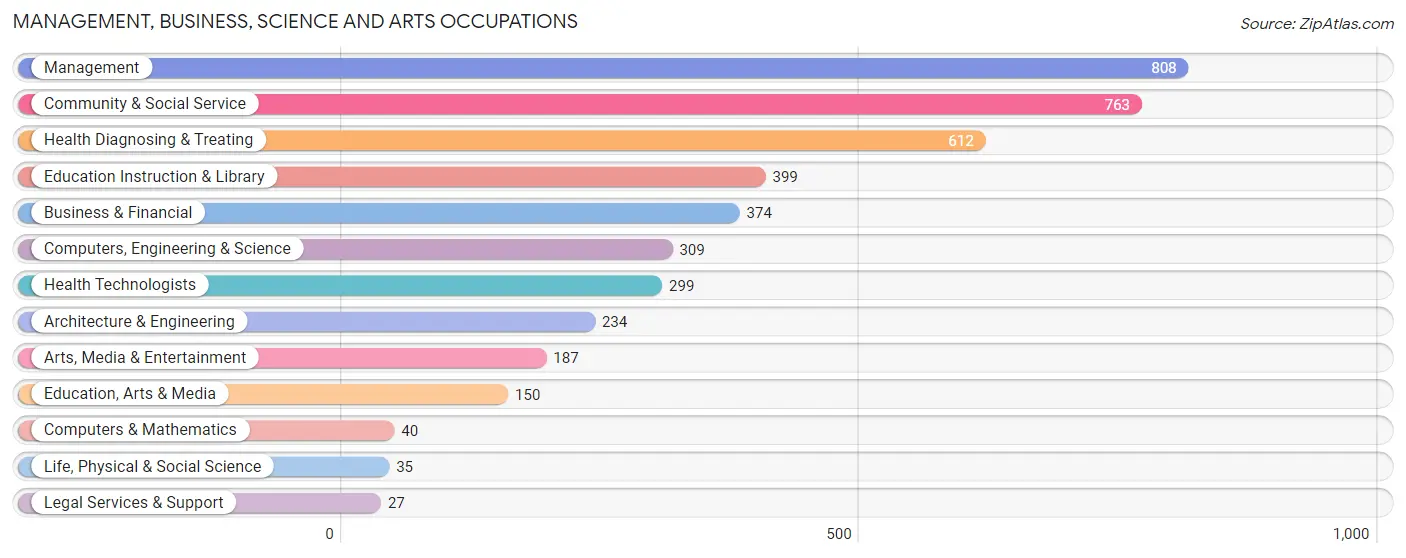
Management, Business, Science and Arts Occupations
The most common Management, Business, Science and Arts occupations in La Porte are Management (808 | 7.5%), Community & Social Service (763 | 7.1%), Health Diagnosing & Treating (612 | 5.7%), Education Instruction & Library (399 | 3.7%), and Business & Financial (374 | 3.5%).
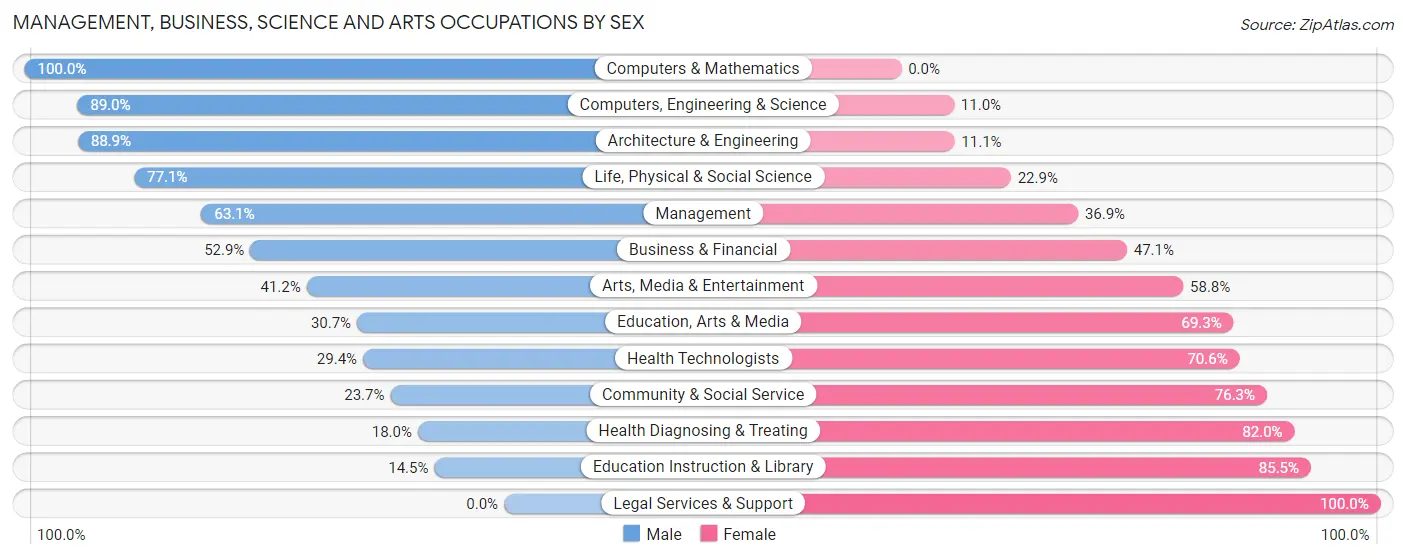
Management, Business, Science and Arts Occupations by Sex
Within the Management, Business, Science and Arts occupations in La Porte, the most male-oriented occupations are Computers & Mathematics (100.0%), Computers, Engineering & Science (89.0%), and Architecture & Engineering (88.9%), while the most female-oriented occupations are Legal Services & Support (100.0%), Education Instruction & Library (85.5%), and Health Diagnosing & Treating (82.0%).
| Occupation | Male | Female |
| Management | 510 (63.1%) | 298 (36.9%) |
| Business & Financial | 198 (52.9%) | 176 (47.1%) |
| Computers, Engineering & Science | 275 (89.0%) | 34 (11.0%) |
| Computers & Mathematics | 40 (100.0%) | 0 (0.0%) |
| Architecture & Engineering | 208 (88.9%) | 26 (11.1%) |
| Life, Physical & Social Science | 27 (77.1%) | 8 (22.9%) |
| Community & Social Service | 181 (23.7%) | 582 (76.3%) |
| Education, Arts & Media | 46 (30.7%) | 104 (69.3%) |
| Legal Services & Support | 0 (0.0%) | 27 (100.0%) |
| Education Instruction & Library | 58 (14.5%) | 341 (85.5%) |
| Arts, Media & Entertainment | 77 (41.2%) | 110 (58.8%) |
| Health Diagnosing & Treating | 110 (18.0%) | 502 (82.0%) |
| Health Technologists | 88 (29.4%) | 211 (70.6%) |
| Total (Category) | 1,274 (44.5%) | 1,592 (55.5%) |
| Total (Overall) | 5,530 (51.5%) | 5,216 (48.5%) |
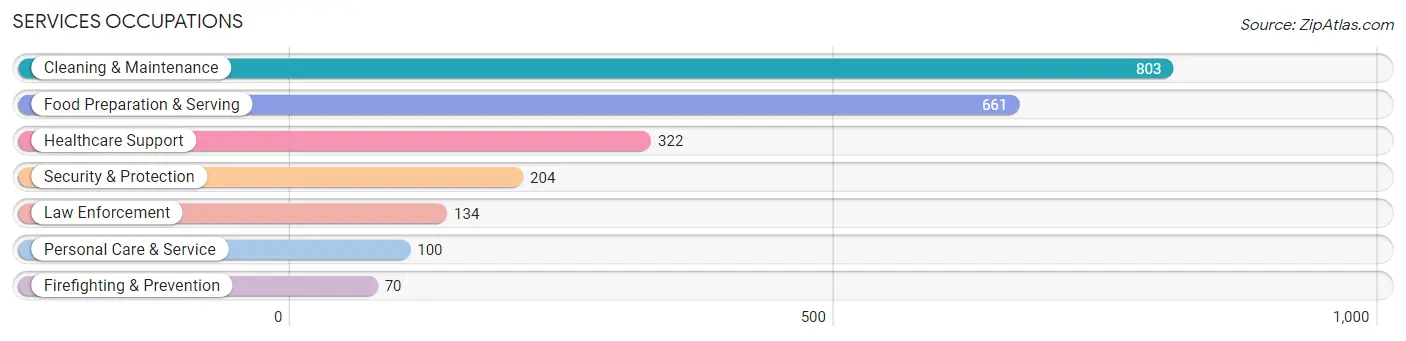
Services Occupations
The most common Services occupations in La Porte are Cleaning & Maintenance (803 | 7.5%), Food Preparation & Serving (661 | 6.1%), Healthcare Support (322 | 3.0%), Security & Protection (204 | 1.9%), and Law Enforcement (134 | 1.3%).
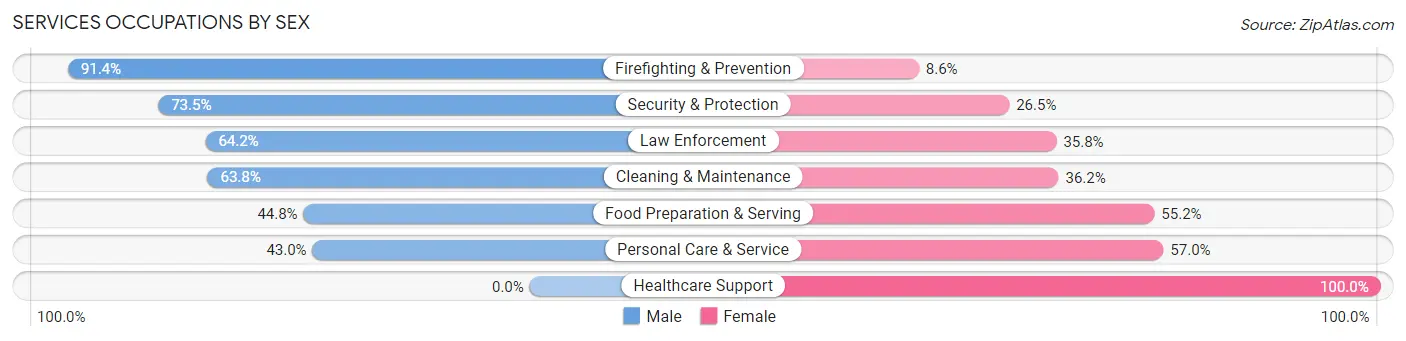
Services Occupations by Sex
Within the Services occupations in La Porte, the most male-oriented occupations are Firefighting & Prevention (91.4%), Security & Protection (73.5%), and Law Enforcement (64.2%), while the most female-oriented occupations are Healthcare Support (100.0%), Personal Care & Service (57.0%), and Food Preparation & Serving (55.2%).
| Occupation | Male | Female |
| Healthcare Support | 0 (0.0%) | 322 (100.0%) |
| Security & Protection | 150 (73.5%) | 54 (26.5%) |
| Firefighting & Prevention | 64 (91.4%) | 6 (8.6%) |
| Law Enforcement | 86 (64.2%) | 48 (35.8%) |
| Food Preparation & Serving | 296 (44.8%) | 365 (55.2%) |
| Cleaning & Maintenance | 512 (63.8%) | 291 (36.2%) |
| Personal Care & Service | 43 (43.0%) | 57 (57.0%) |
| Total (Category) | 1,001 (47.9%) | 1,089 (52.1%) |
| Total (Overall) | 5,530 (51.5%) | 5,216 (48.5%) |
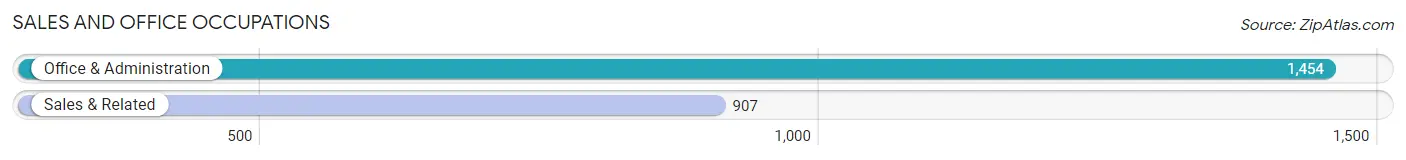
Sales and Office Occupations
The most common Sales and Office occupations in La Porte are Office & Administration (1,454 | 13.5%), and Sales & Related (907 | 8.4%).
Sales and Office Occupations by Sex
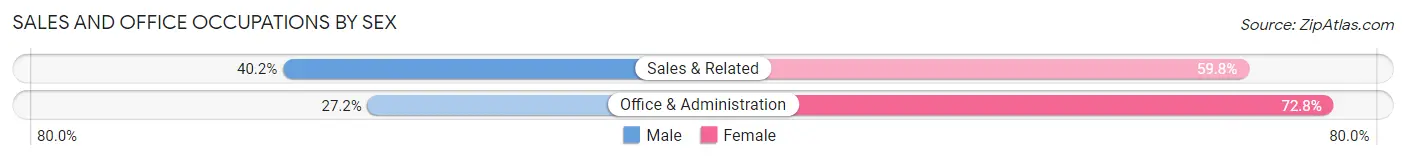
| Occupation | Male | Female |
| Sales & Related | 365 (40.2%) | 542 (59.8%) |
| Office & Administration | 396 (27.2%) | 1,058 (72.8%) |
| Total (Category) | 761 (32.2%) | 1,600 (67.8%) |
| Total (Overall) | 5,530 (51.5%) | 5,216 (48.5%) |
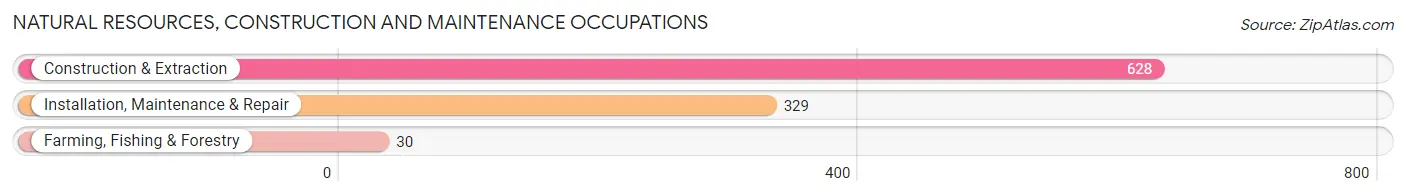
Natural Resources, Construction and Maintenance Occupations
The most common Natural Resources, Construction and Maintenance occupations in La Porte are Construction & Extraction (628 | 5.8%), Installation, Maintenance & Repair (329 | 3.1%), and Farming, Fishing & Forestry (30 | 0.3%).
Natural Resources, Construction and Maintenance Occupations by Sex
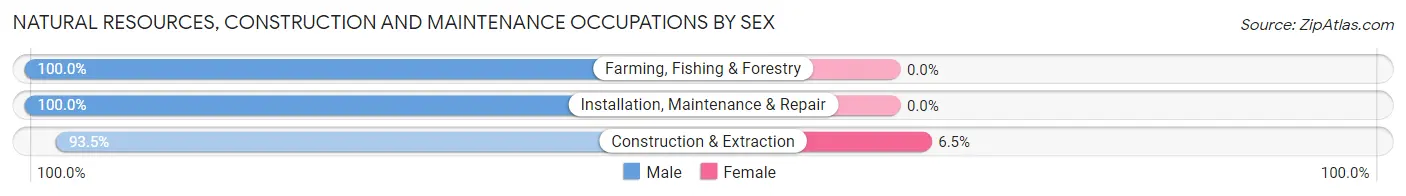
| Occupation | Male | Female |
| Farming, Fishing & Forestry | 30 (100.0%) | 0 (0.0%) |
| Construction & Extraction | 587 (93.5%) | 41 (6.5%) |
| Installation, Maintenance & Repair | 329 (100.0%) | 0 (0.0%) |
| Total (Category) | 946 (95.9%) | 41 (4.2%) |
| Total (Overall) | 5,530 (51.5%) | 5,216 (48.5%) |
Production, Transportation and Moving Occupations
The most common Production, Transportation and Moving occupations in La Porte are Production (1,599 | 14.9%), Material Moving (481 | 4.5%), and Transportation (362 | 3.4%).
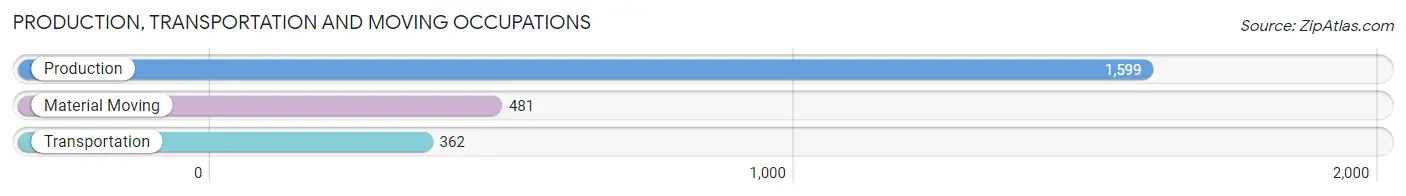
Production, Transportation and Moving Occupations by Sex
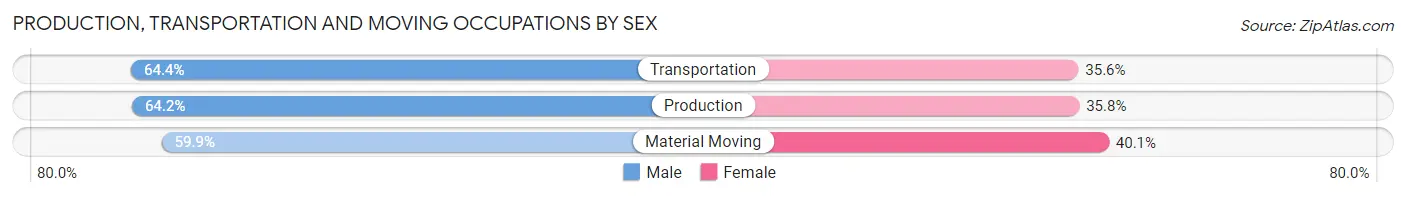
| Occupation | Male | Female |
| Production | 1,027 (64.2%) | 572 (35.8%) |
| Transportation | 233 (64.4%) | 129 (35.6%) |
| Material Moving | 288 (59.9%) | 193 (40.1%) |
| Total (Category) | 1,548 (63.4%) | 894 (36.6%) |
| Total (Overall) | 5,530 (51.5%) | 5,216 (48.5%) |
Employment Industries by Sex in La Porte
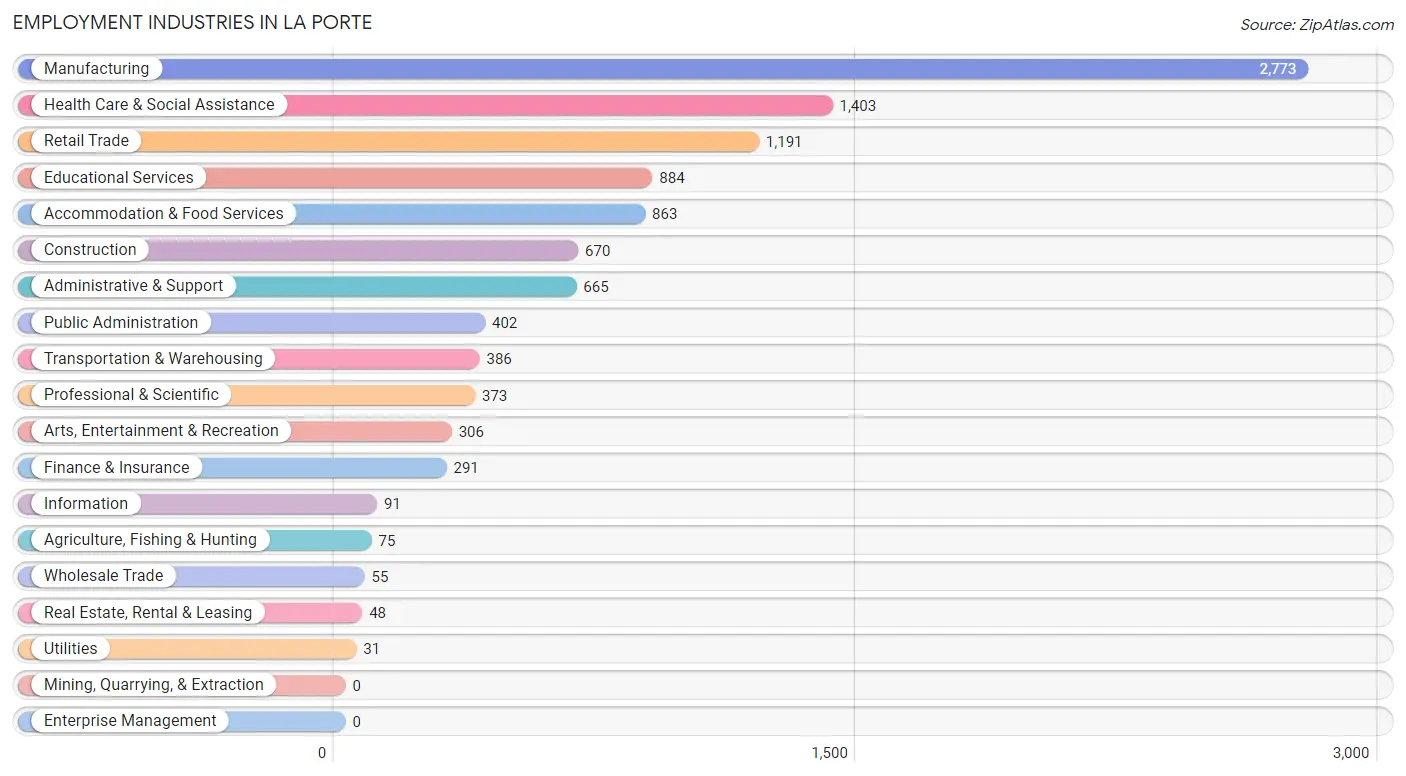
Employment Industries in La Porte
The major employment industries in La Porte include Manufacturing (2,773 | 25.8%), Health Care & Social Assistance (1,403 | 13.1%), Retail Trade (1,191 | 11.1%), Educational Services (884 | 8.2%), and Accommodation & Food Services (863 | 8.0%).
Employment Industries by Sex in La Porte
The La Porte industries that see more men than women are Agriculture, Fishing & Hunting (100.0%), Utilities (100.0%), and Construction (93.9%), whereas the industries that tend to have a higher number of women are Health Care & Social Assistance (88.5%), Educational Services (74.4%), and Professional & Scientific (72.9%).
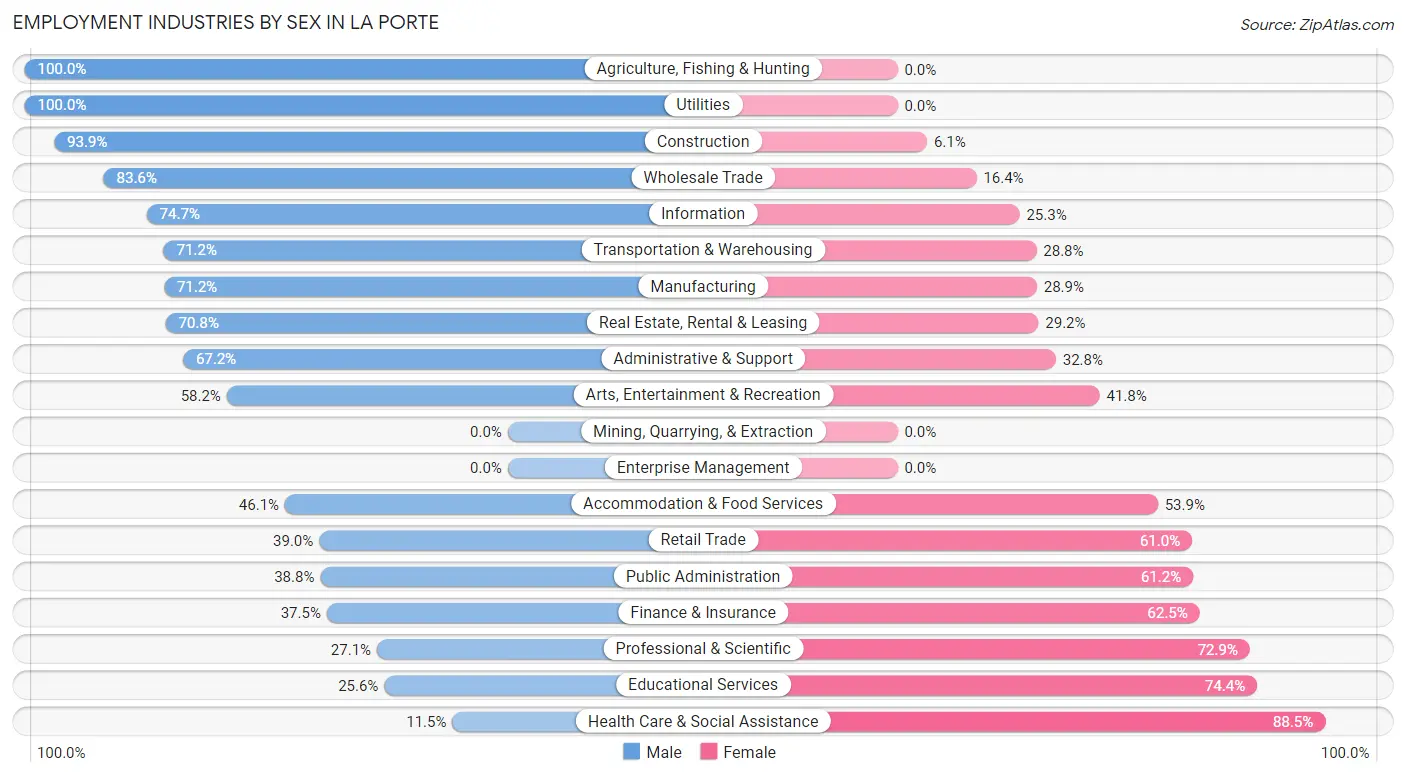
| Industry | Male | Female |
| Agriculture, Fishing & Hunting | 75 (100.0%) | 0 (0.0%) |
| Mining, Quarrying, & Extraction | 0 (0.0%) | 0 (0.0%) |
| Construction | 629 (93.9%) | 41 (6.1%) |
| Manufacturing | 1,973 (71.2%) | 800 (28.8%) |
| Wholesale Trade | 46 (83.6%) | 9 (16.4%) |
| Retail Trade | 465 (39.0%) | 726 (61.0%) |
| Transportation & Warehousing | 275 (71.2%) | 111 (28.8%) |
| Utilities | 31 (100.0%) | 0 (0.0%) |
| Information | 68 (74.7%) | 23 (25.3%) |
| Finance & Insurance | 109 (37.5%) | 182 (62.5%) |
| Real Estate, Rental & Leasing | 34 (70.8%) | 14 (29.2%) |
| Professional & Scientific | 101 (27.1%) | 272 (72.9%) |
| Enterprise Management | 0 (0.0%) | 0 (0.0%) |
| Administrative & Support | 447 (67.2%) | 218 (32.8%) |
| Educational Services | 226 (25.6%) | 658 (74.4%) |
| Health Care & Social Assistance | 161 (11.5%) | 1,242 (88.5%) |
| Arts, Entertainment & Recreation | 178 (58.2%) | 128 (41.8%) |
| Accommodation & Food Services | 398 (46.1%) | 465 (53.9%) |
| Public Administration | 156 (38.8%) | 246 (61.2%) |
| Total | 5,530 (51.5%) | 5,216 (48.5%) |
Education in La Porte
School Enrollment in La Porte
The most common levels of schooling among the 5,088 students in La Porte are middle school (1,352 | 26.6%), high school (1,243 | 24.4%), and elementary school (1,168 | 23.0%).
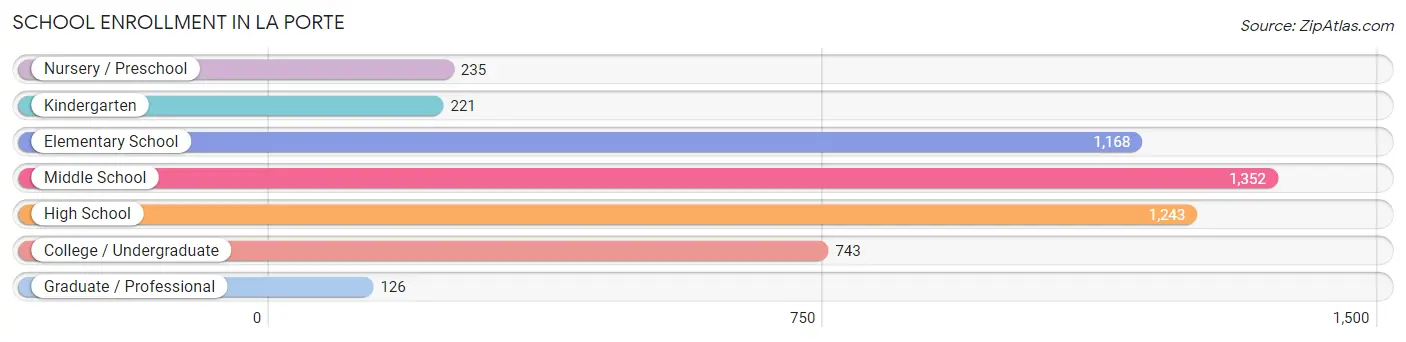
| School Level | # Students | % Students |
| Nursery / Preschool | 235 | 4.6% |
| Kindergarten | 221 | 4.3% |
| Elementary School | 1,168 | 23.0% |
| Middle School | 1,352 | 26.6% |
| High School | 1,243 | 24.4% |
| College / Undergraduate | 743 | 14.6% |
| Graduate / Professional | 126 | 2.5% |
| Total | 5,088 | 100.0% |
School Enrollment by Age by Funding Source in La Porte
Out of a total of 5,088 students who are enrolled in schools in La Porte, 438 (8.6%) attend a private institution, while the remaining 4,650 (91.4%) are enrolled in public schools. The age group of 3 to 4 year olds has the highest likelihood of being enrolled in private schools, with 48 (44.4% in the age bracket) enrolled. Conversely, the age group of 15 to 17 year olds has the lowest likelihood of being enrolled in a private school, with 1,029 (98.6% in the age bracket) attending a public institution.
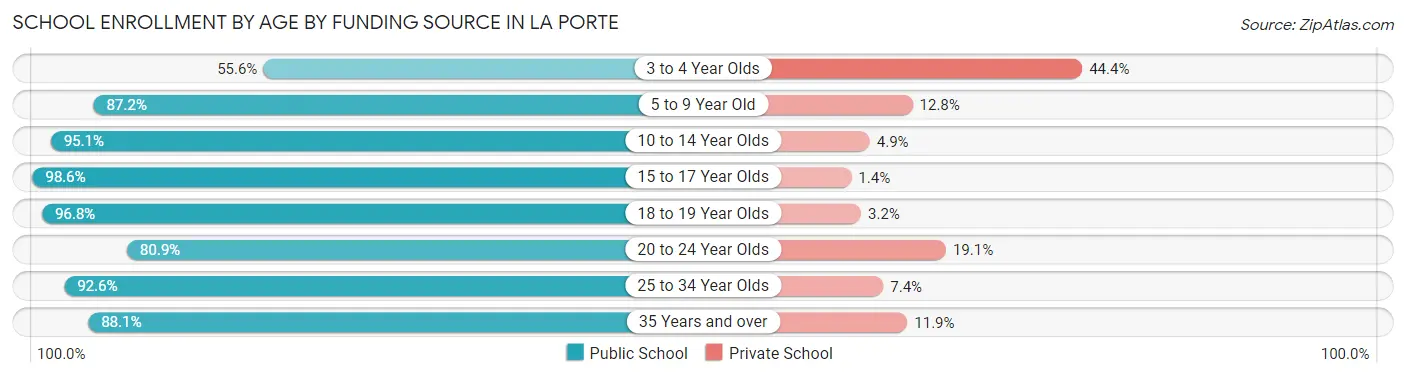
| Age Bracket | Public School | Private School |
| 3 to 4 Year Olds | 60 (55.6%) | 48 (44.4%) |
| 5 to 9 Year Old | 1,208 (87.2%) | 178 (12.8%) |
| 10 to 14 Year Olds | 1,465 (95.1%) | 75 (4.9%) |
| 15 to 17 Year Olds | 1,029 (98.6%) | 15 (1.4%) |
| 18 to 19 Year Olds | 209 (96.8%) | 7 (3.2%) |
| 20 to 24 Year Olds | 361 (80.9%) | 85 (19.1%) |
| 25 to 34 Year Olds | 213 (92.6%) | 17 (7.4%) |
| 35 Years and over | 104 (88.1%) | 14 (11.9%) |
| Total | 4,650 (91.4%) | 438 (8.6%) |
Educational Attainment by Field of Study in La Porte
Business (614 | 21.7%), education (593 | 20.9%), science & technology (529 | 18.7%), arts & humanities (206 | 7.3%), and liberal arts & history (170 | 6.0%) are the most common fields of study among 2,834 individuals in La Porte who have obtained a bachelor's degree or higher.
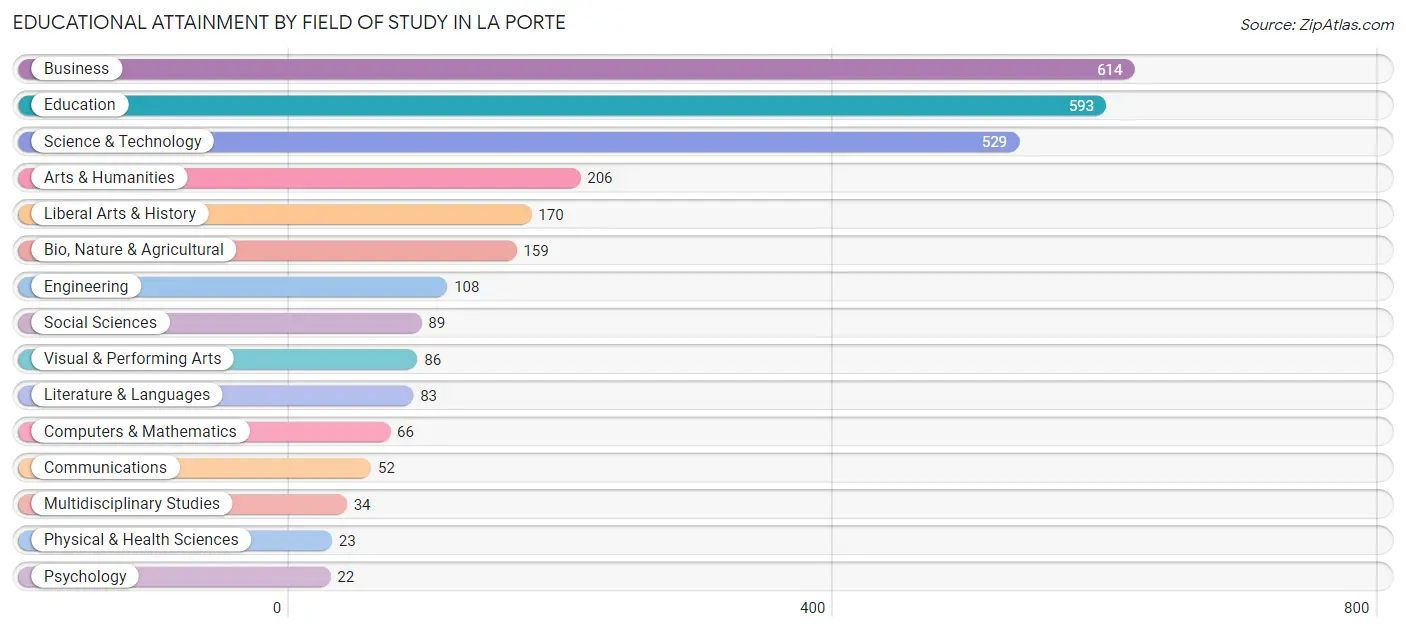
| Field of Study | # Graduates | % Graduates |
| Computers & Mathematics | 66 | 2.3% |
| Bio, Nature & Agricultural | 159 | 5.6% |
| Physical & Health Sciences | 23 | 0.8% |
| Psychology | 22 | 0.8% |
| Social Sciences | 89 | 3.1% |
| Engineering | 108 | 3.8% |
| Multidisciplinary Studies | 34 | 1.2% |
| Science & Technology | 529 | 18.7% |
| Business | 614 | 21.7% |
| Education | 593 | 20.9% |
| Literature & Languages | 83 | 2.9% |
| Liberal Arts & History | 170 | 6.0% |
| Visual & Performing Arts | 86 | 3.0% |
| Communications | 52 | 1.8% |
| Arts & Humanities | 206 | 7.3% |
| Total | 2,834 | 100.0% |
Transportation & Commute in La Porte
Vehicle Availability by Sex in La Porte
The most prevalent vehicle ownership categories in La Porte are males with 2 vehicles (2,628, accounting for 48.6%) and females with 2 vehicles (2,166, making up 51.8%).
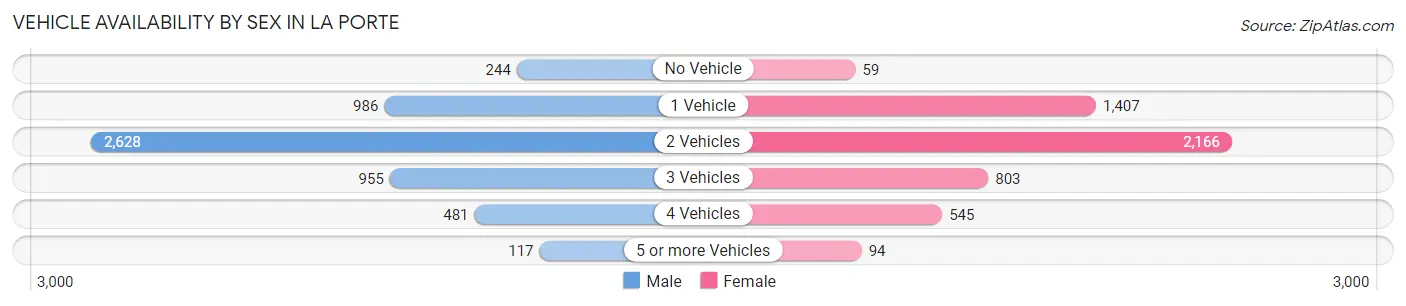
| Vehicles Available | Male | Female |
| No Vehicle | 244 (4.5%) | 59 (1.2%) |
| 1 Vehicle | 986 (18.2%) | 1,407 (27.7%) |
| 2 Vehicles | 2,628 (48.6%) | 2,166 (42.7%) |
| 3 Vehicles | 955 (17.6%) | 803 (15.8%) |
| 4 Vehicles | 481 (8.9%) | 545 (10.7%) |
| 5 or more Vehicles | 117 (2.2%) | 94 (1.8%) |
| Total | 5,411 (100.0%) | 5,074 (100.0%) |
Commute Time in La Porte
The most frequently occuring commute durations in La Porte are 5 to 9 minutes (2,067 commuters, 20.5%), 10 to 14 minutes (1,784 commuters, 17.7%), and 15 to 19 minutes (1,114 commuters, 11.1%).
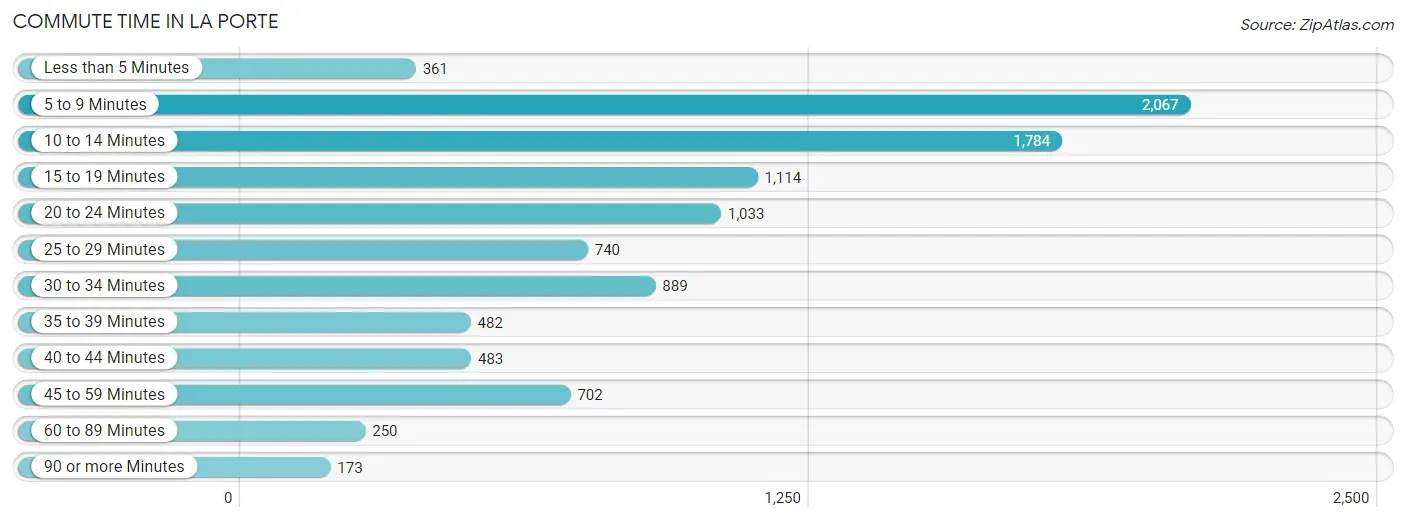
| Commute Time | # Commuters | % Commuters |
| Less than 5 Minutes | 361 | 3.6% |
| 5 to 9 Minutes | 2,067 | 20.5% |
| 10 to 14 Minutes | 1,784 | 17.7% |
| 15 to 19 Minutes | 1,114 | 11.1% |
| 20 to 24 Minutes | 1,033 | 10.2% |
| 25 to 29 Minutes | 740 | 7.3% |
| 30 to 34 Minutes | 889 | 8.8% |
| 35 to 39 Minutes | 482 | 4.8% |
| 40 to 44 Minutes | 483 | 4.8% |
| 45 to 59 Minutes | 702 | 7.0% |
| 60 to 89 Minutes | 250 | 2.5% |
| 90 or more Minutes | 173 | 1.7% |
Commute Time by Sex in La Porte
The most common commute times in La Porte are 5 to 9 minutes (1,059 commuters, 20.3%) for males and 5 to 9 minutes (1,008 commuters, 20.7%) for females.
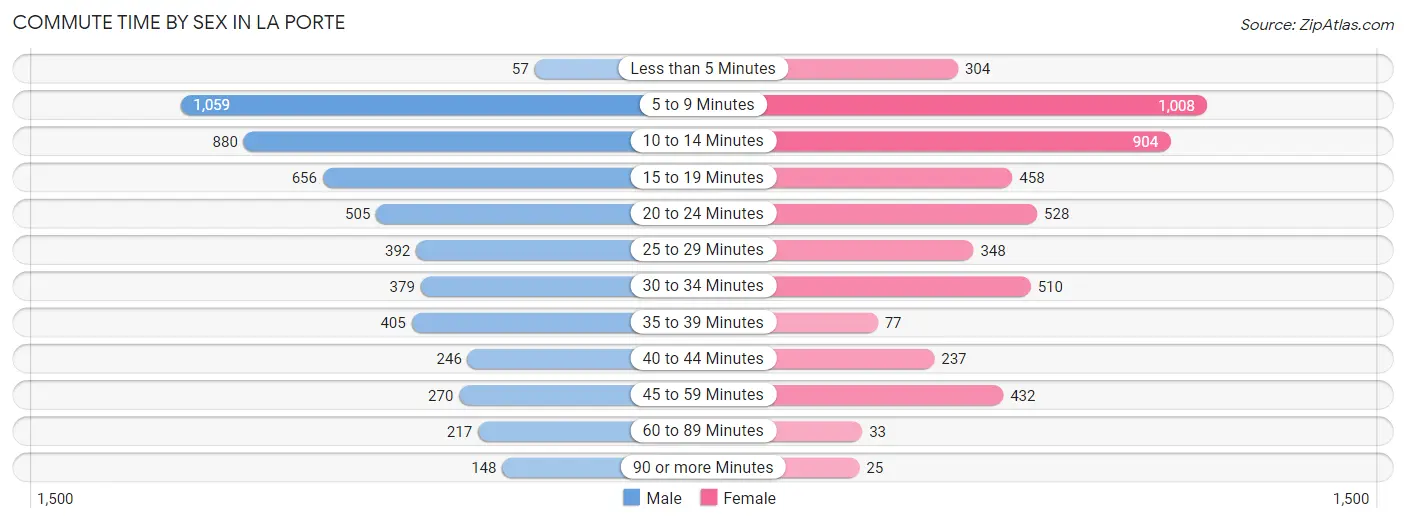
| Commute Time | Male | Female |
| Less than 5 Minutes | 57 (1.1%) | 304 (6.2%) |
| 5 to 9 Minutes | 1,059 (20.3%) | 1,008 (20.7%) |
| 10 to 14 Minutes | 880 (16.9%) | 904 (18.6%) |
| 15 to 19 Minutes | 656 (12.6%) | 458 (9.4%) |
| 20 to 24 Minutes | 505 (9.7%) | 528 (10.9%) |
| 25 to 29 Minutes | 392 (7.5%) | 348 (7.1%) |
| 30 to 34 Minutes | 379 (7.3%) | 510 (10.5%) |
| 35 to 39 Minutes | 405 (7.8%) | 77 (1.6%) |
| 40 to 44 Minutes | 246 (4.7%) | 237 (4.9%) |
| 45 to 59 Minutes | 270 (5.2%) | 432 (8.9%) |
| 60 to 89 Minutes | 217 (4.2%) | 33 (0.7%) |
| 90 or more Minutes | 148 (2.8%) | 25 (0.5%) |
Time of Departure to Work by Sex in La Porte
The most frequent times of departure to work in La Porte are 12:00 AM to 4:59 AM (829, 15.9%) for males and 7:30 AM to 7:59 AM (765, 15.7%) for females.
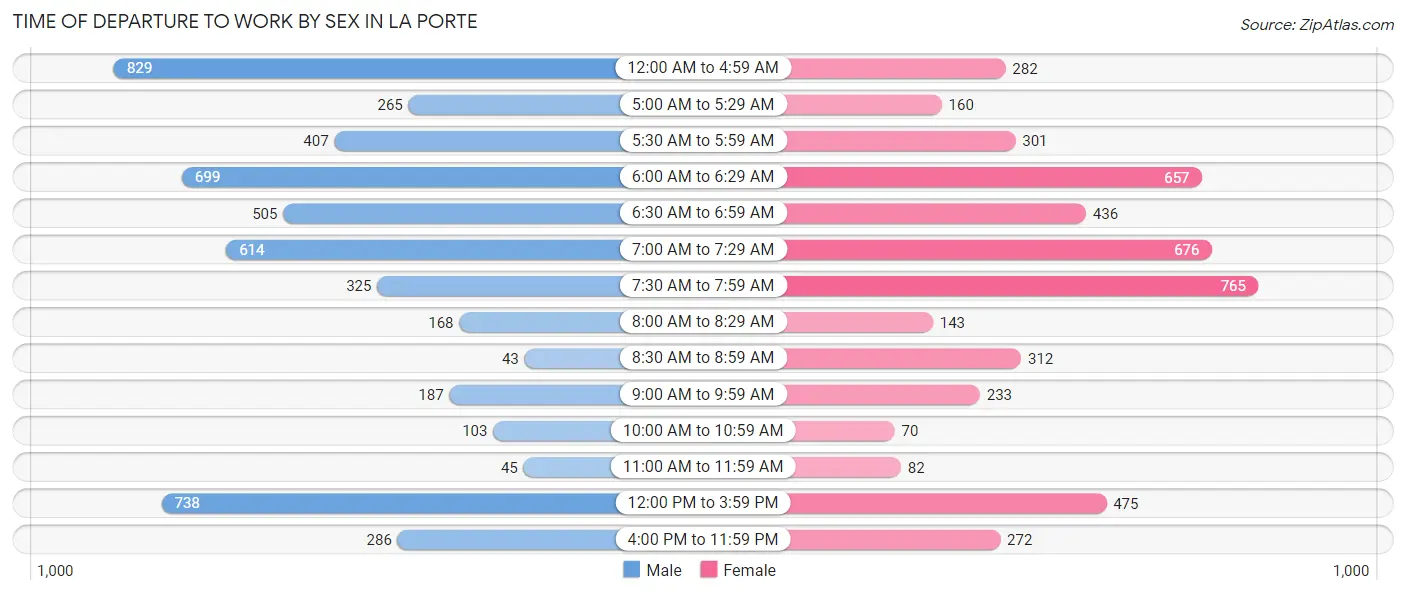
| Time of Departure | Male | Female |
| 12:00 AM to 4:59 AM | 829 (15.9%) | 282 (5.8%) |
| 5:00 AM to 5:29 AM | 265 (5.1%) | 160 (3.3%) |
| 5:30 AM to 5:59 AM | 407 (7.8%) | 301 (6.2%) |
| 6:00 AM to 6:29 AM | 699 (13.4%) | 657 (13.5%) |
| 6:30 AM to 6:59 AM | 505 (9.7%) | 436 (9.0%) |
| 7:00 AM to 7:29 AM | 614 (11.8%) | 676 (13.9%) |
| 7:30 AM to 7:59 AM | 325 (6.2%) | 765 (15.7%) |
| 8:00 AM to 8:29 AM | 168 (3.2%) | 143 (2.9%) |
| 8:30 AM to 8:59 AM | 43 (0.8%) | 312 (6.4%) |
| 9:00 AM to 9:59 AM | 187 (3.6%) | 233 (4.8%) |
| 10:00 AM to 10:59 AM | 103 (2.0%) | 70 (1.4%) |
| 11:00 AM to 11:59 AM | 45 (0.9%) | 82 (1.7%) |
| 12:00 PM to 3:59 PM | 738 (14.1%) | 475 (9.8%) |
| 4:00 PM to 11:59 PM | 286 (5.5%) | 272 (5.6%) |
| Total | 5,214 (100.0%) | 4,864 (100.0%) |
Housing Occupancy in La Porte
Occupancy by Ownership in La Porte
Of the total 9,177 dwellings in La Porte, owner-occupied units account for 5,615 (61.2%), while renter-occupied units make up 3,562 (38.8%).
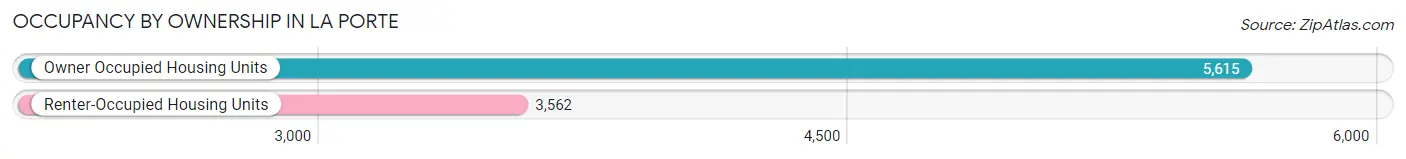
| Occupancy | # Housing Units | % Housing Units |
| Owner Occupied Housing Units | 5,615 | 61.2% |
| Renter-Occupied Housing Units | 3,562 | 38.8% |
| Total Occupied Housing Units | 9,177 | 100.0% |
Occupancy by Household Size in La Porte
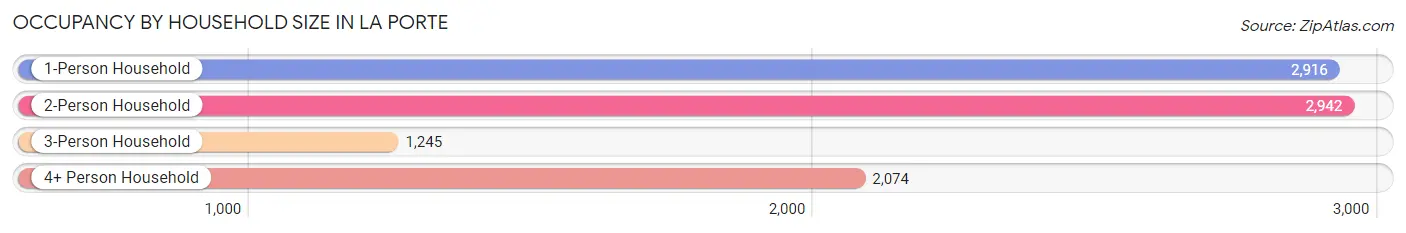
| Household Size | # Housing Units | % Housing Units |
| 1-Person Household | 2,916 | 31.8% |
| 2-Person Household | 2,942 | 32.1% |
| 3-Person Household | 1,245 | 13.6% |
| 4+ Person Household | 2,074 | 22.6% |
| Total Housing Units | 9,177 | 100.0% |
Occupancy by Ownership by Household Size in La Porte
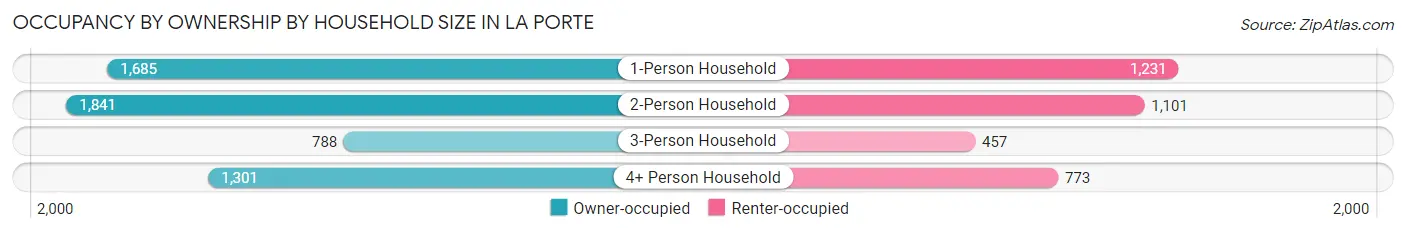
| Household Size | Owner-occupied | Renter-occupied |
| 1-Person Household | 1,685 (57.8%) | 1,231 (42.2%) |
| 2-Person Household | 1,841 (62.6%) | 1,101 (37.4%) |
| 3-Person Household | 788 (63.3%) | 457 (36.7%) |
| 4+ Person Household | 1,301 (62.7%) | 773 (37.3%) |
| Total Housing Units | 5,615 (61.2%) | 3,562 (38.8%) |
Occupancy by Educational Attainment in La Porte
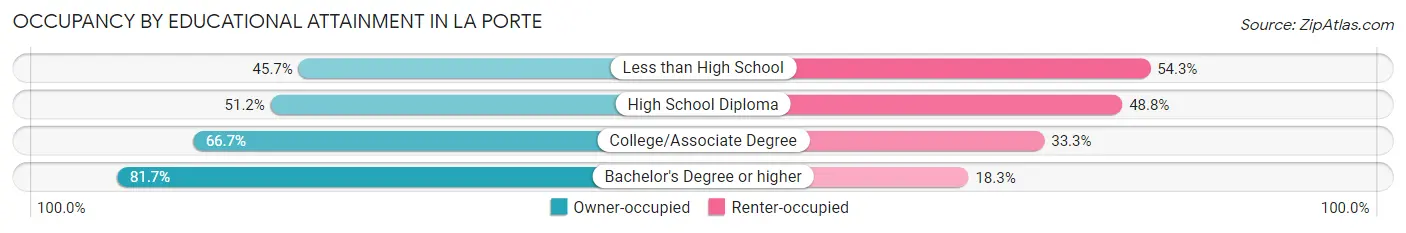
| Household Size | Owner-occupied | Renter-occupied |
| Less than High School | 491 (45.7%) | 584 (54.3%) |
| High School Diploma | 1,810 (51.2%) | 1,724 (48.8%) |
| College/Associate Degree | 1,854 (66.7%) | 927 (33.3%) |
| Bachelor's Degree or higher | 1,460 (81.7%) | 327 (18.3%) |
Occupancy by Age of Householder in La Porte
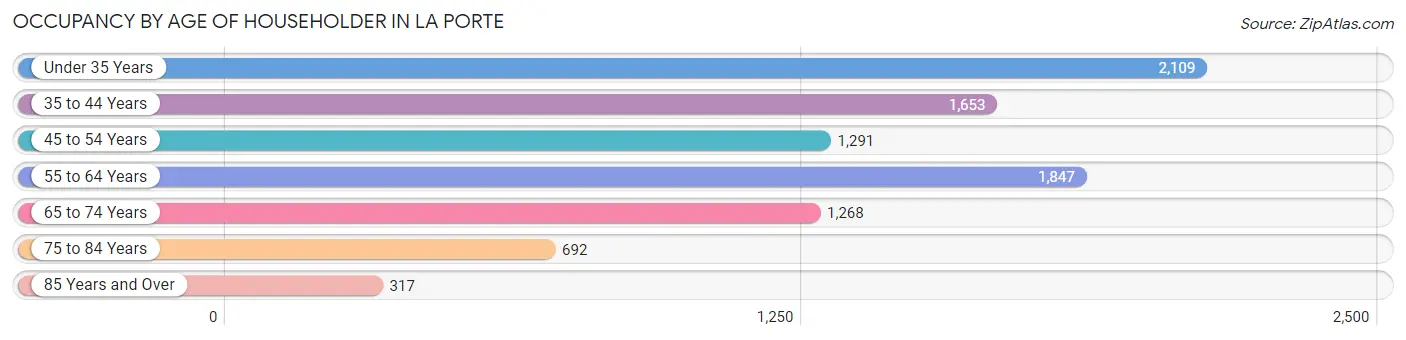
| Age Bracket | # Households | % Households |
| Under 35 Years | 2,109 | 23.0% |
| 35 to 44 Years | 1,653 | 18.0% |
| 45 to 54 Years | 1,291 | 14.1% |
| 55 to 64 Years | 1,847 | 20.1% |
| 65 to 74 Years | 1,268 | 13.8% |
| 75 to 84 Years | 692 | 7.5% |
| 85 Years and Over | 317 | 3.5% |
| Total | 9,177 | 100.0% |
Housing Finances in La Porte
Median Income by Occupancy in La Porte
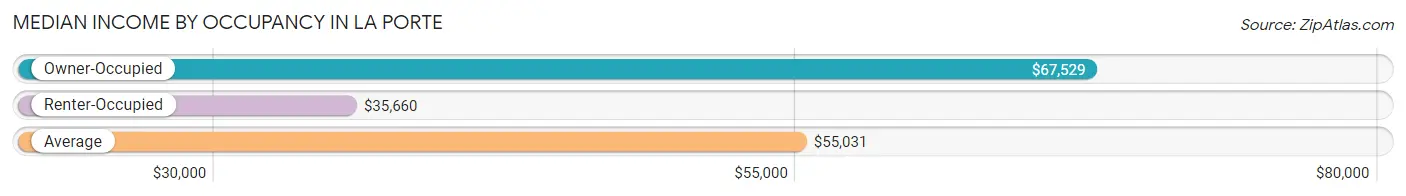
| Occupancy Type | # Households | Median Income |
| Owner-Occupied | 5,615 (61.2%) | $67,529 |
| Renter-Occupied | 3,562 (38.8%) | $35,660 |
| Average | 9,177 (100.0%) | $55,031 |
Occupancy by Householder Income Bracket in La Porte
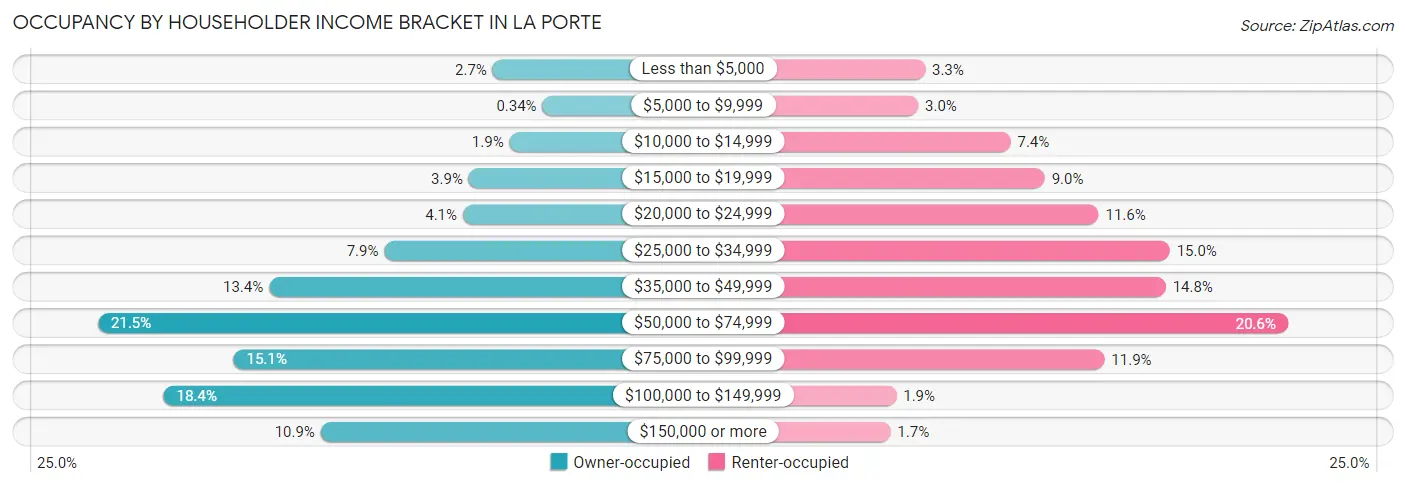
| Income Bracket | Owner-occupied | Renter-occupied |
| Less than $5,000 | 152 (2.7%) | 118 (3.3%) |
| $5,000 to $9,999 | 19 (0.3%) | 106 (3.0%) |
| $10,000 to $14,999 | 107 (1.9%) | 263 (7.4%) |
| $15,000 to $19,999 | 216 (3.8%) | 321 (9.0%) |
| $20,000 to $24,999 | 232 (4.1%) | 412 (11.6%) |
| $25,000 to $34,999 | 442 (7.9%) | 533 (15.0%) |
| $35,000 to $49,999 | 750 (13.4%) | 526 (14.8%) |
| $50,000 to $74,999 | 1,208 (21.5%) | 733 (20.6%) |
| $75,000 to $99,999 | 845 (15.0%) | 422 (11.8%) |
| $100,000 to $149,999 | 1,032 (18.4%) | 69 (1.9%) |
| $150,000 or more | 612 (10.9%) | 59 (1.7%) |
| Total | 5,615 (100.0%) | 3,562 (100.0%) |
Monthly Housing Cost Tiers in La Porte
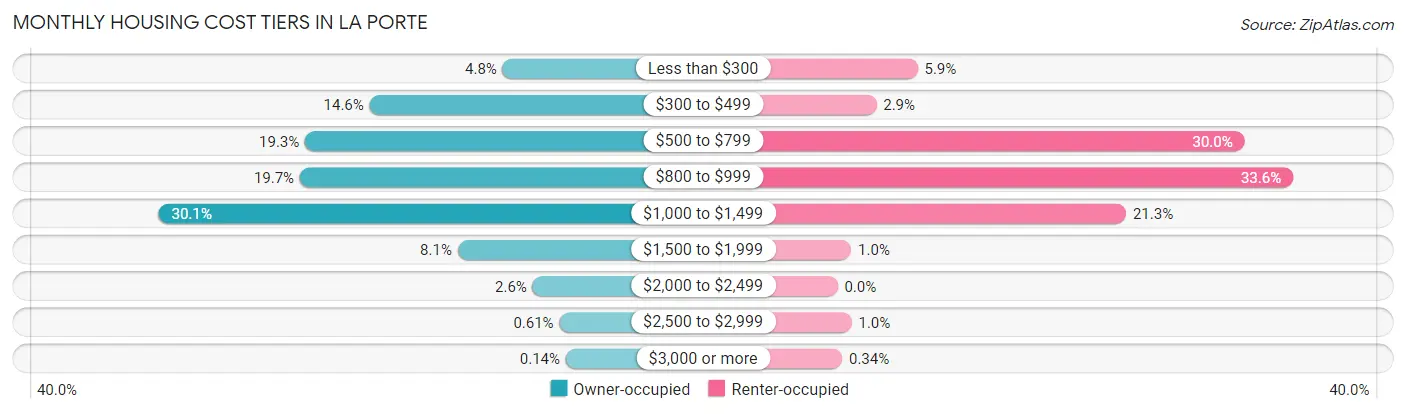
| Monthly Cost | Owner-occupied | Renter-occupied |
| Less than $300 | 269 (4.8%) | 210 (5.9%) |
| $300 to $499 | 819 (14.6%) | 102 (2.9%) |
| $500 to $799 | 1,086 (19.3%) | 1,068 (30.0%) |
| $800 to $999 | 1,107 (19.7%) | 1,195 (33.6%) |
| $1,000 to $1,499 | 1,692 (30.1%) | 757 (21.2%) |
| $1,500 to $1,999 | 455 (8.1%) | 36 (1.0%) |
| $2,000 to $2,499 | 145 (2.6%) | 0 (0.0%) |
| $2,500 to $2,999 | 34 (0.6%) | 37 (1.0%) |
| $3,000 or more | 8 (0.1%) | 12 (0.3%) |
| Total | 5,615 (100.0%) | 3,562 (100.0%) |
Physical Housing Characteristics in La Porte
Housing Structures in La Porte
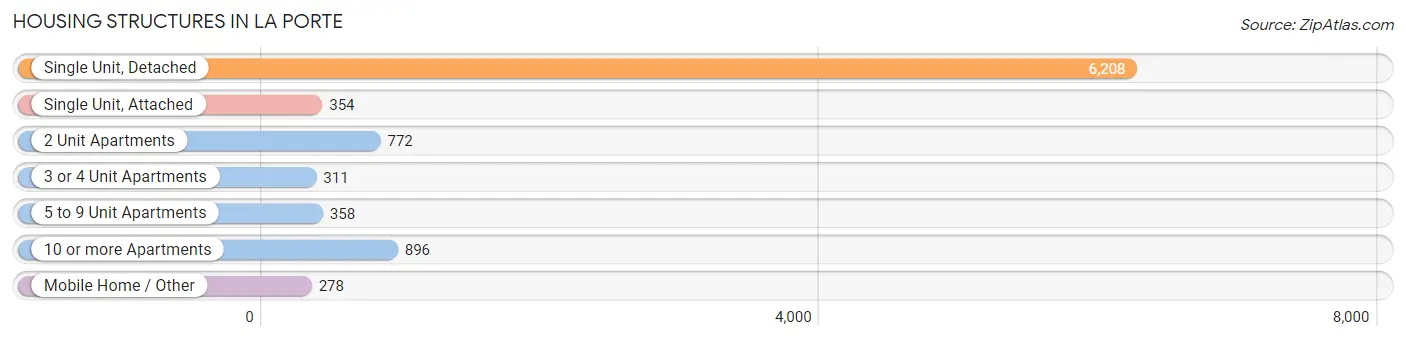
| Structure Type | # Housing Units | % Housing Units |
| Single Unit, Detached | 6,208 | 67.6% |
| Single Unit, Attached | 354 | 3.9% |
| 2 Unit Apartments | 772 | 8.4% |
| 3 or 4 Unit Apartments | 311 | 3.4% |
| 5 to 9 Unit Apartments | 358 | 3.9% |
| 10 or more Apartments | 896 | 9.8% |
| Mobile Home / Other | 278 | 3.0% |
| Total | 9,177 | 100.0% |
Housing Structures by Occupancy in La Porte
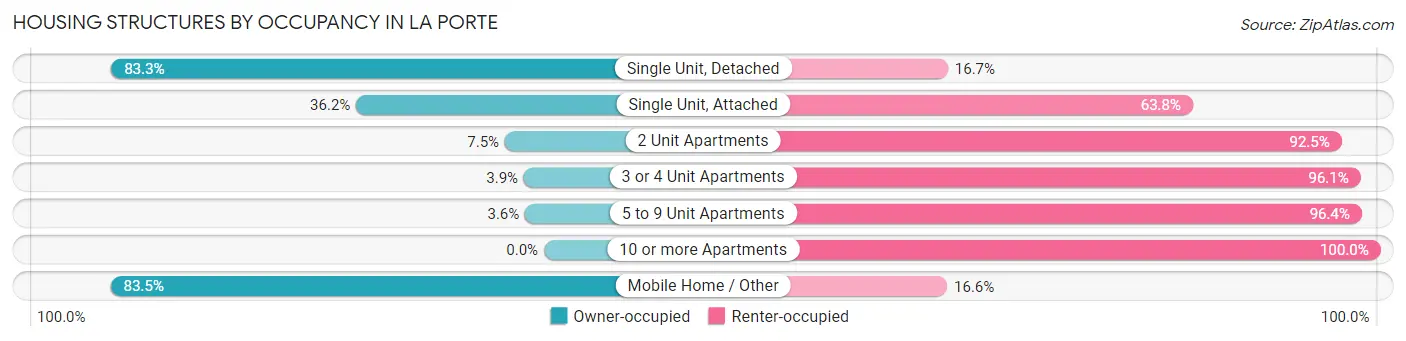
| Structure Type | Owner-occupied | Renter-occupied |
| Single Unit, Detached | 5,172 (83.3%) | 1,036 (16.7%) |
| Single Unit, Attached | 128 (36.2%) | 226 (63.8%) |
| 2 Unit Apartments | 58 (7.5%) | 714 (92.5%) |
| 3 or 4 Unit Apartments | 12 (3.9%) | 299 (96.1%) |
| 5 to 9 Unit Apartments | 13 (3.6%) | 345 (96.4%) |
| 10 or more Apartments | 0 (0.0%) | 896 (100.0%) |
| Mobile Home / Other | 232 (83.5%) | 46 (16.6%) |
| Total | 5,615 (61.2%) | 3,562 (38.8%) |
Housing Structures by Number of Rooms in La Porte
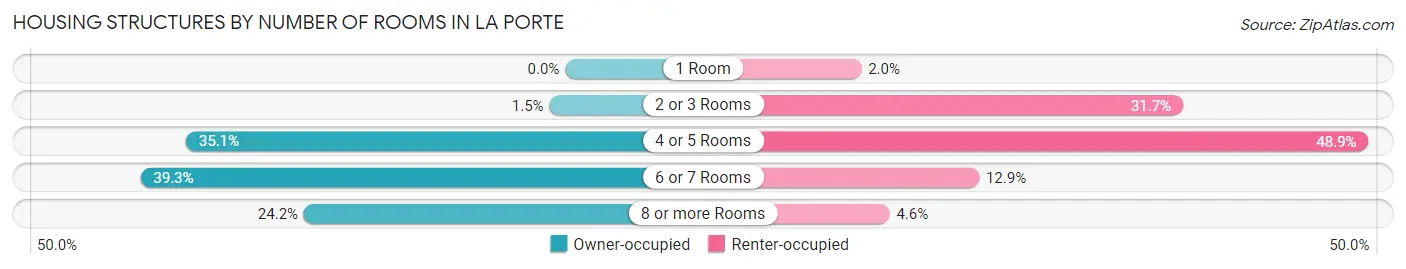
| Number of Rooms | Owner-occupied | Renter-occupied |
| 1 Room | 0 (0.0%) | 70 (2.0%) |
| 2 or 3 Rooms | 82 (1.5%) | 1,130 (31.7%) |
| 4 or 5 Rooms | 1,970 (35.1%) | 1,741 (48.9%) |
| 6 or 7 Rooms | 2,206 (39.3%) | 458 (12.9%) |
| 8 or more Rooms | 1,357 (24.2%) | 163 (4.6%) |
| Total | 5,615 (100.0%) | 3,562 (100.0%) |
Housing Structure by Heating Type in La Porte
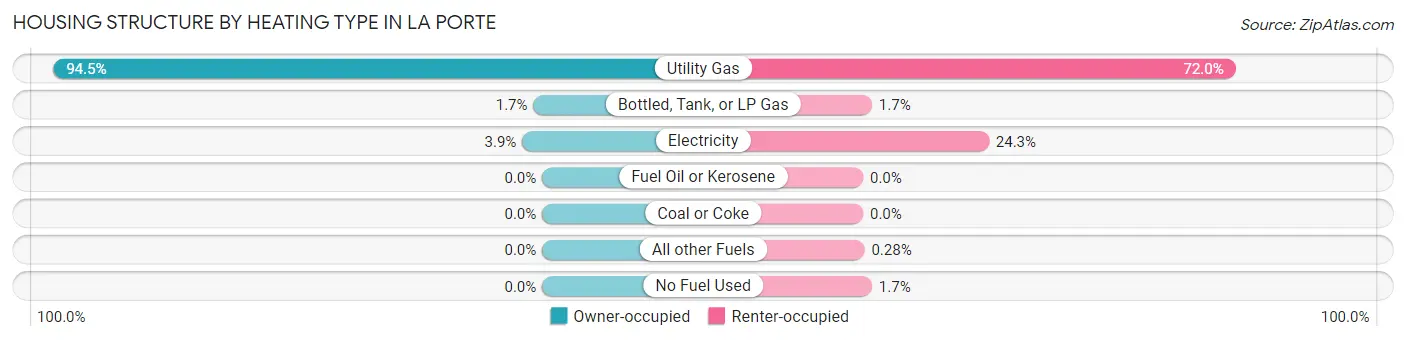
| Heating Type | Owner-occupied | Renter-occupied |
| Utility Gas | 5,304 (94.5%) | 2,564 (72.0%) |
| Bottled, Tank, or LP Gas | 95 (1.7%) | 61 (1.7%) |
| Electricity | 216 (3.8%) | 866 (24.3%) |
| Fuel Oil or Kerosene | 0 (0.0%) | 0 (0.0%) |
| Coal or Coke | 0 (0.0%) | 0 (0.0%) |
| All other Fuels | 0 (0.0%) | 10 (0.3%) |
| No Fuel Used | 0 (0.0%) | 61 (1.7%) |
| Total | 5,615 (100.0%) | 3,562 (100.0%) |
Household Vehicle Usage in La Porte
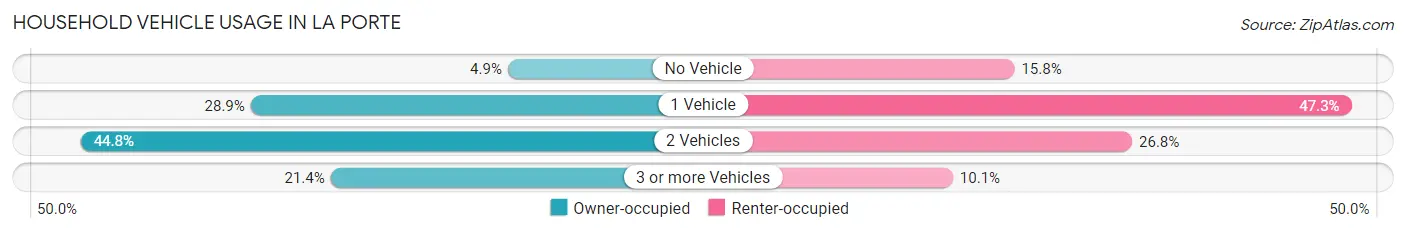
| Vehicles per Household | Owner-occupied | Renter-occupied |
| No Vehicle | 275 (4.9%) | 564 (15.8%) |
| 1 Vehicle | 1,623 (28.9%) | 1,684 (47.3%) |
| 2 Vehicles | 2,513 (44.8%) | 955 (26.8%) |
| 3 or more Vehicles | 1,204 (21.4%) | 359 (10.1%) |
| Total | 5,615 (100.0%) | 3,562 (100.0%) |
Real Estate & Mortgages in La Porte
Real Estate and Mortgage Overview in La Porte
| Characteristic | Without Mortgage | With Mortgage |
| Housing Units | 1,674 | 3,941 |
| Median Property Value | $137,600 | $135,300 |
| Median Household Income | $50,119 | $505 |
| Monthly Housing Costs | $457 | $8 |
| Real Estate Taxes | $1,141 | $103 |
Property Value by Mortgage Status in La Porte
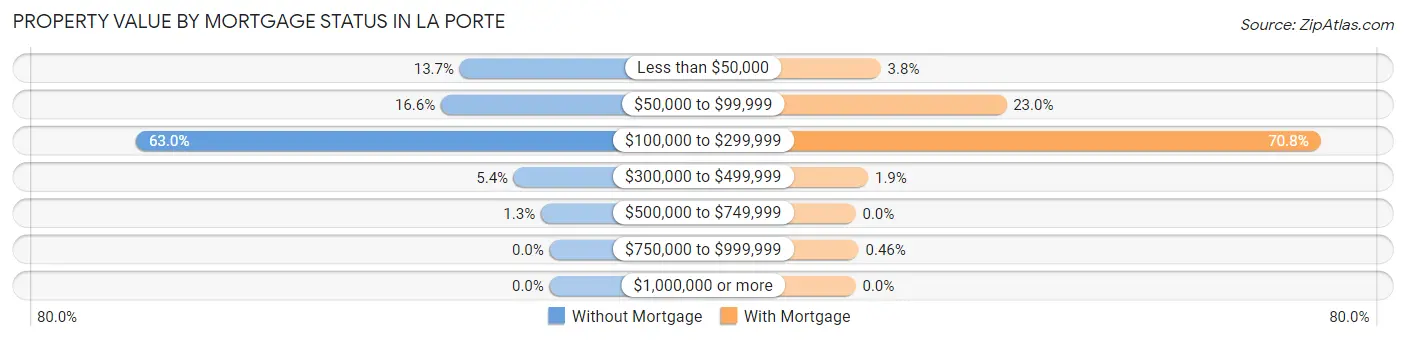
| Property Value | Without Mortgage | With Mortgage |
| Less than $50,000 | 229 (13.7%) | 151 (3.8%) |
| $50,000 to $99,999 | 277 (16.6%) | 905 (23.0%) |
| $100,000 to $299,999 | 1,055 (63.0%) | 2,792 (70.8%) |
| $300,000 to $499,999 | 91 (5.4%) | 75 (1.9%) |
| $500,000 to $749,999 | 22 (1.3%) | 0 (0.0%) |
| $750,000 to $999,999 | 0 (0.0%) | 18 (0.5%) |
| $1,000,000 or more | 0 (0.0%) | 0 (0.0%) |
| Total | 1,674 (100.0%) | 3,941 (100.0%) |
Household Income by Mortgage Status in La Porte
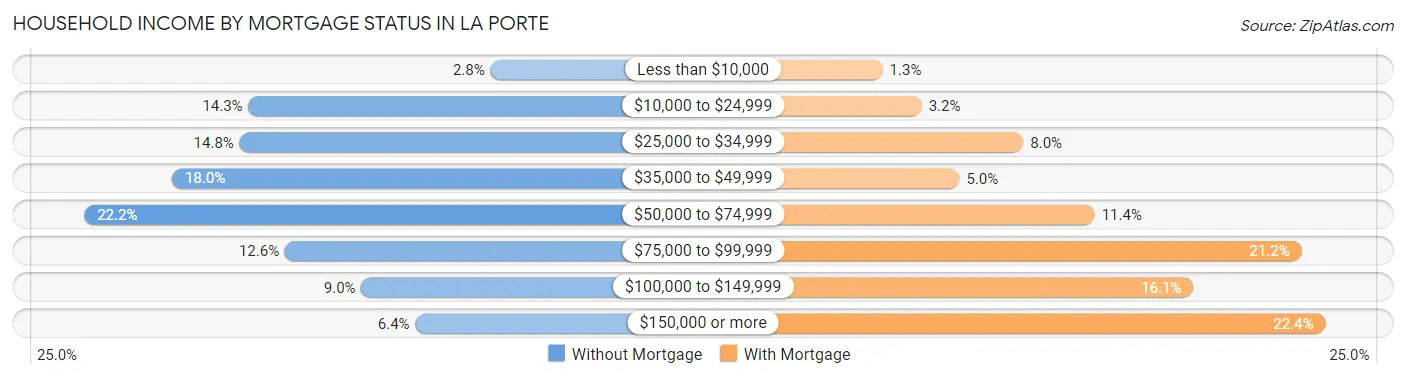
| Household Income | Without Mortgage | With Mortgage |
| Less than $10,000 | 47 (2.8%) | 51 (1.3%) |
| $10,000 to $24,999 | 240 (14.3%) | 124 (3.2%) |
| $25,000 to $34,999 | 247 (14.8%) | 315 (8.0%) |
| $35,000 to $49,999 | 301 (18.0%) | 195 (5.0%) |
| $50,000 to $74,999 | 371 (22.2%) | 449 (11.4%) |
| $75,000 to $99,999 | 211 (12.6%) | 837 (21.2%) |
| $100,000 to $149,999 | 150 (9.0%) | 634 (16.1%) |
| $150,000 or more | 107 (6.4%) | 882 (22.4%) |
| Total | 1,674 (100.0%) | 3,941 (100.0%) |
Property Value to Household Income Ratio in La Porte
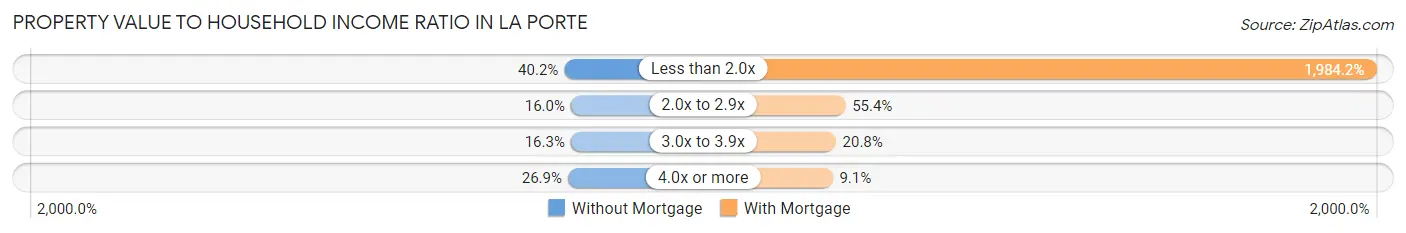
| Value-to-Income Ratio | Without Mortgage | With Mortgage |
| Less than 2.0x | 673 (40.2%) | 78,199 (1,984.2%) |
| 2.0x to 2.9x | 268 (16.0%) | 2,185 (55.4%) |
| 3.0x to 3.9x | 272 (16.3%) | 819 (20.8%) |
| 4.0x or more | 450 (26.9%) | 360 (9.1%) |
| Total | 1,674 (100.0%) | 3,941 (100.0%) |
Real Estate Taxes by Mortgage Status in La Porte
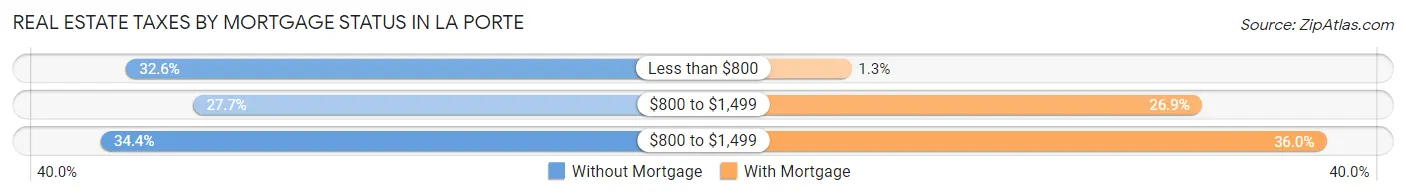
| Property Taxes | Without Mortgage | With Mortgage |
| Less than $800 | 545 (32.6%) | 53 (1.3%) |
| $800 to $1,499 | 463 (27.7%) | 1,061 (26.9%) |
| $800 to $1,499 | 576 (34.4%) | 1,420 (36.0%) |
| Total | 1,674 (100.0%) | 3,941 (100.0%) |
Health & Disability in La Porte
Health Insurance Coverage by Age in La Porte
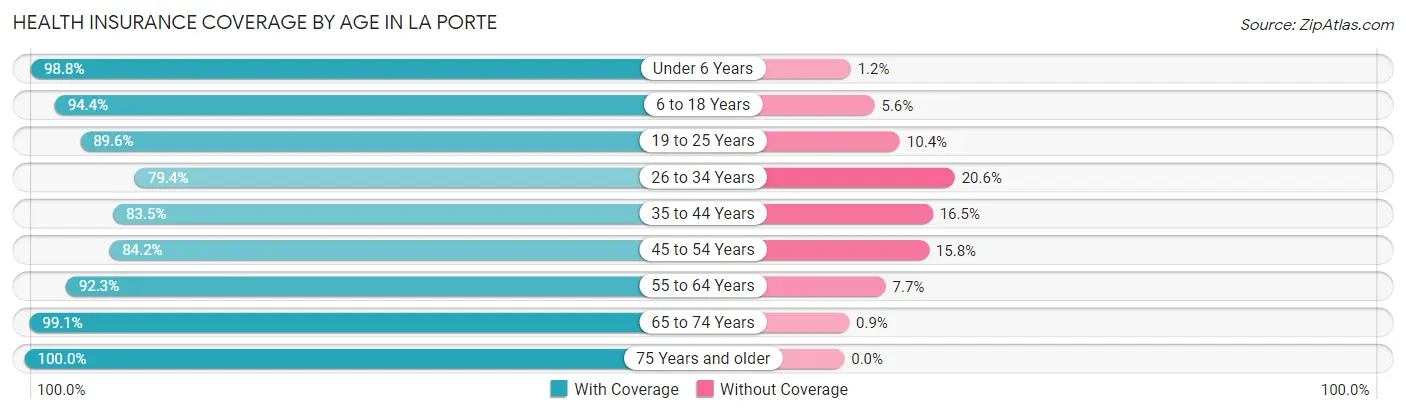
| Age Bracket | With Coverage | Without Coverage |
| Under 6 Years | 1,818 (98.8%) | 22 (1.2%) |
| 6 to 18 Years | 3,929 (94.4%) | 235 (5.6%) |
| 19 to 25 Years | 2,205 (89.6%) | 255 (10.4%) |
| 26 to 34 Years | 2,050 (79.4%) | 532 (20.6%) |
| 35 to 44 Years | 2,193 (83.5%) | 433 (16.5%) |
| 45 to 54 Years | 2,018 (84.2%) | 378 (15.8%) |
| 55 to 64 Years | 2,482 (92.3%) | 207 (7.7%) |
| 65 to 74 Years | 1,760 (99.1%) | 16 (0.9%) |
| 75 Years and older | 1,333 (100.0%) | 0 (0.0%) |
| Total | 19,788 (90.5%) | 2,078 (9.5%) |
Health Insurance Coverage by Citizenship Status in La Porte

| Citizenship Status | With Coverage | Without Coverage |
| Native Born | 1,818 (98.8%) | 22 (1.2%) |
| Foreign Born, Citizen | 3,929 (94.4%) | 235 (5.6%) |
| Foreign Born, not a Citizen | 2,205 (89.6%) | 255 (10.4%) |
Health Insurance Coverage by Household Income in La Porte
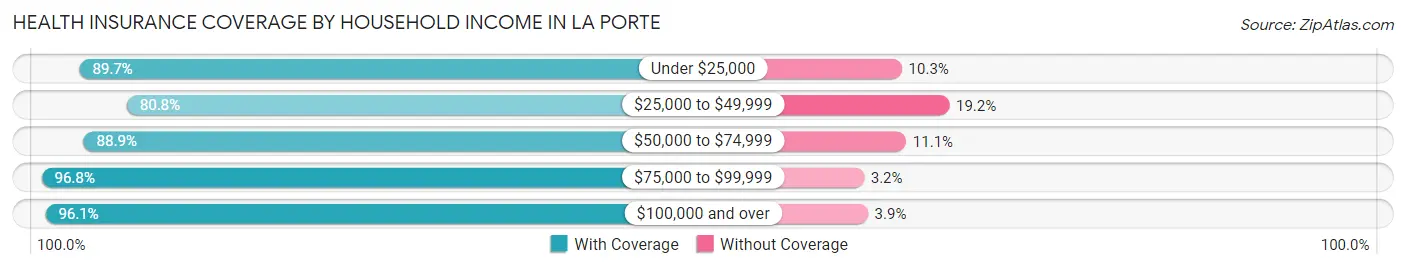
| Household Income | With Coverage | Without Coverage |
| Under $25,000 | 3,265 (89.7%) | 374 (10.3%) |
| $25,000 to $49,999 | 3,658 (80.8%) | 867 (19.2%) |
| $50,000 to $74,999 | 4,088 (88.9%) | 509 (11.1%) |
| $75,000 to $99,999 | 3,412 (96.8%) | 112 (3.2%) |
| $100,000 and over | 5,285 (96.1%) | 215 (3.9%) |
Public vs Private Health Insurance Coverage by Age in La Porte
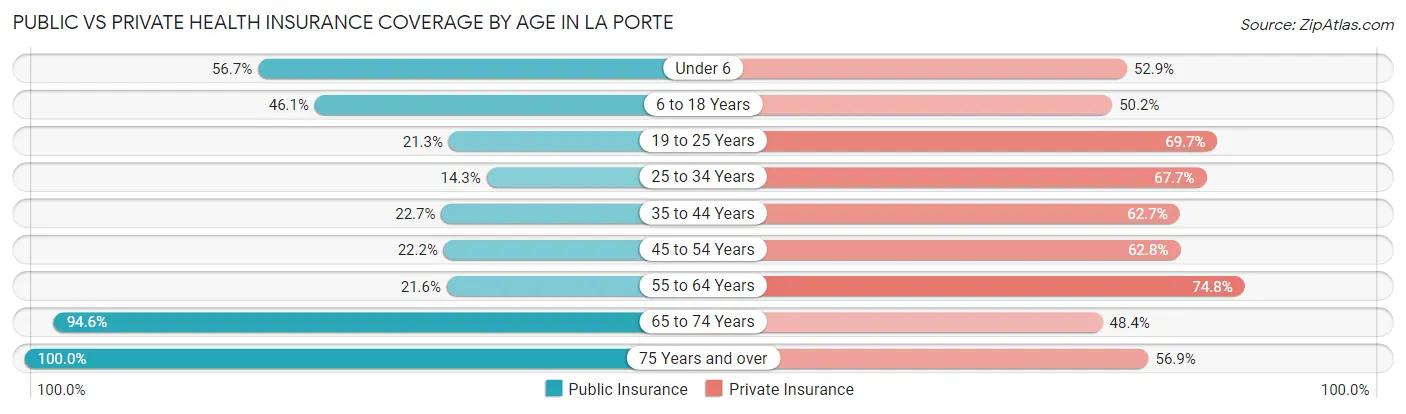
| Age Bracket | Public Insurance | Private Insurance |
| Under 6 | 1,043 (56.7%) | 974 (52.9%) |
| 6 to 18 Years | 1,921 (46.1%) | 2,090 (50.2%) |
| 19 to 25 Years | 523 (21.3%) | 1,715 (69.7%) |
| 25 to 34 Years | 368 (14.2%) | 1,747 (67.7%) |
| 35 to 44 Years | 595 (22.7%) | 1,646 (62.7%) |
| 45 to 54 Years | 532 (22.2%) | 1,505 (62.8%) |
| 55 to 64 Years | 582 (21.6%) | 2,010 (74.8%) |
| 65 to 74 Years | 1,680 (94.6%) | 860 (48.4%) |
| 75 Years and over | 1,333 (100.0%) | 759 (56.9%) |
| Total | 8,577 (39.2%) | 13,306 (60.9%) |
Disability Status by Sex by Age in La Porte
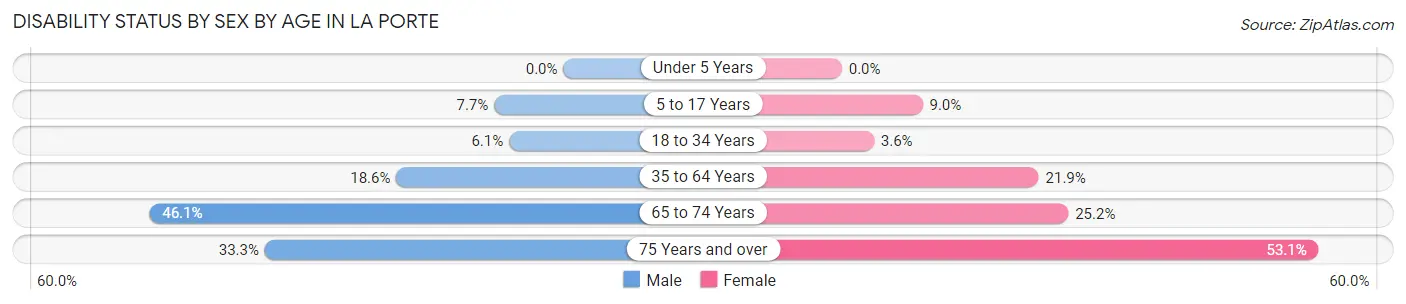
| Age Bracket | Male | Female |
| Under 5 Years | 0 (0.0%) | 0 (0.0%) |
| 5 to 17 Years | 158 (7.7%) | 187 (9.0%) |
| 18 to 34 Years | 172 (6.0%) | 87 (3.6%) |
| 35 to 64 Years | 674 (18.6%) | 896 (21.9%) |
| 65 to 74 Years | 338 (46.1%) | 263 (25.2%) |
| 75 Years and over | 127 (33.3%) | 505 (53.1%) |
Disability Class by Sex by Age in La Porte
Disability Class: Hearing Difficulty
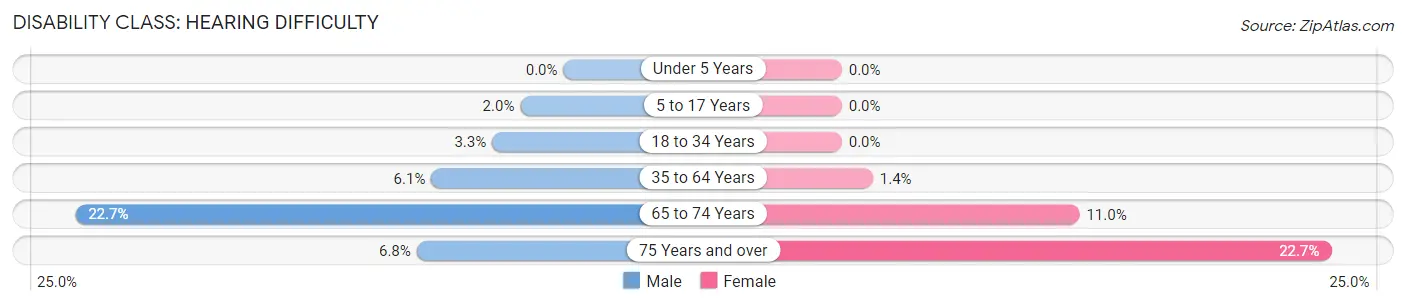
| Age Bracket | Male | Female |
| Under 5 Years | 0 (0.0%) | 0 (0.0%) |
| 5 to 17 Years | 41 (2.0%) | 0 (0.0%) |
| 18 to 34 Years | 94 (3.3%) | 0 (0.0%) |
| 35 to 64 Years | 222 (6.1%) | 59 (1.4%) |
| 65 to 74 Years | 166 (22.7%) | 115 (11.0%) |
| 75 Years and over | 26 (6.8%) | 216 (22.7%) |
Disability Class: Vision Difficulty
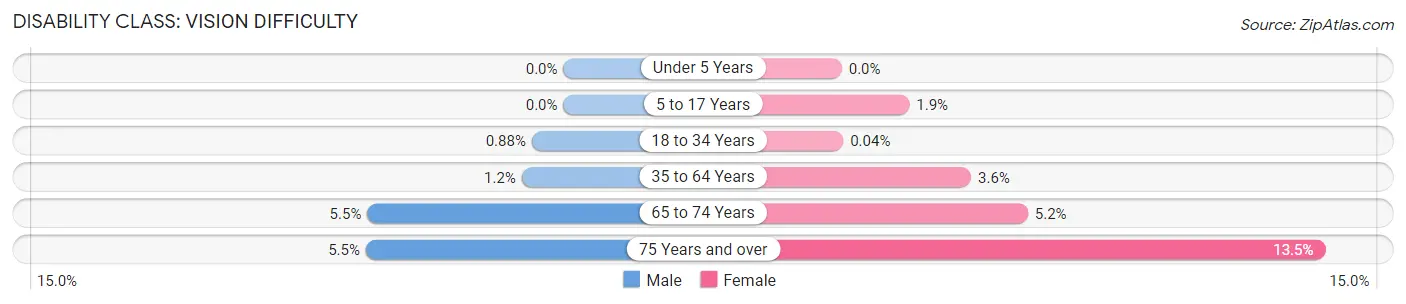
| Age Bracket | Male | Female |
| Under 5 Years | 0 (0.0%) | 0 (0.0%) |
| 5 to 17 Years | 0 (0.0%) | 39 (1.9%) |
| 18 to 34 Years | 25 (0.9%) | 1 (0.0%) |
| 35 to 64 Years | 42 (1.2%) | 147 (3.6%) |
| 65 to 74 Years | 40 (5.5%) | 54 (5.2%) |
| 75 Years and over | 21 (5.5%) | 128 (13.5%) |
Disability Class: Cognitive Difficulty
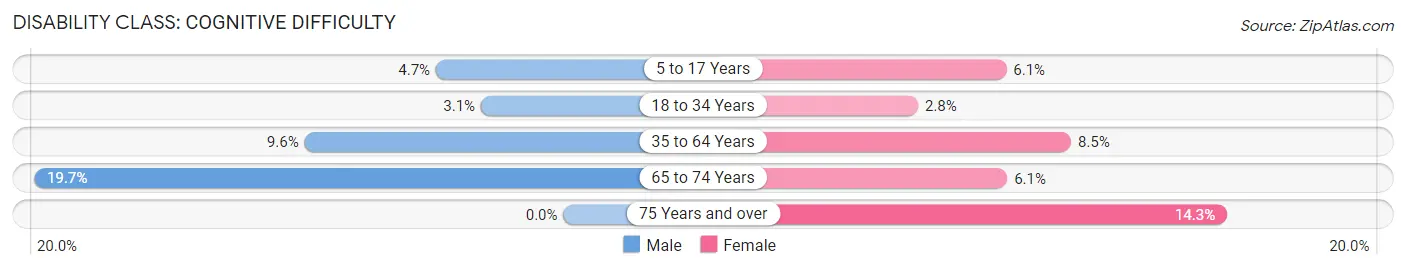
| Age Bracket | Male | Female |
| 5 to 17 Years | 97 (4.7%) | 127 (6.1%) |
| 18 to 34 Years | 87 (3.1%) | 69 (2.8%) |
| 35 to 64 Years | 348 (9.6%) | 348 (8.5%) |
| 65 to 74 Years | 144 (19.7%) | 64 (6.1%) |
| 75 Years and over | 0 (0.0%) | 136 (14.3%) |
Disability Class: Ambulatory Difficulty
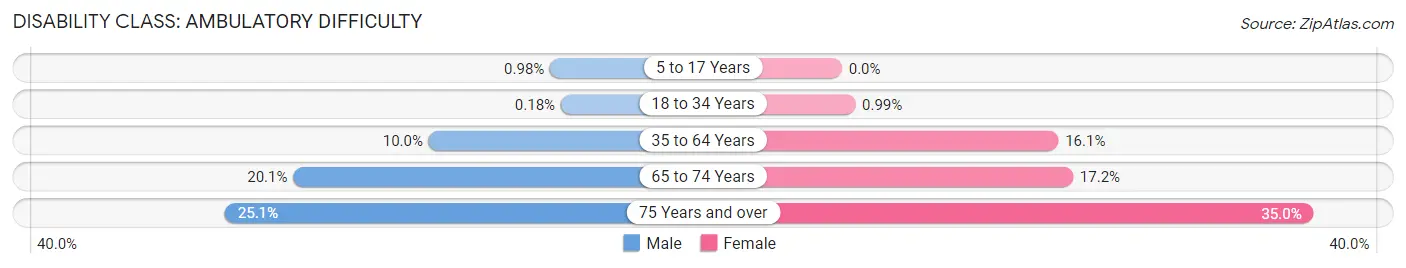
| Age Bracket | Male | Female |
| 5 to 17 Years | 20 (1.0%) | 0 (0.0%) |
| 18 to 34 Years | 5 (0.2%) | 24 (1.0%) |
| 35 to 64 Years | 362 (10.0%) | 657 (16.1%) |
| 65 to 74 Years | 147 (20.1%) | 179 (17.2%) |
| 75 Years and over | 96 (25.1%) | 333 (35.0%) |
Disability Class: Self-Care Difficulty
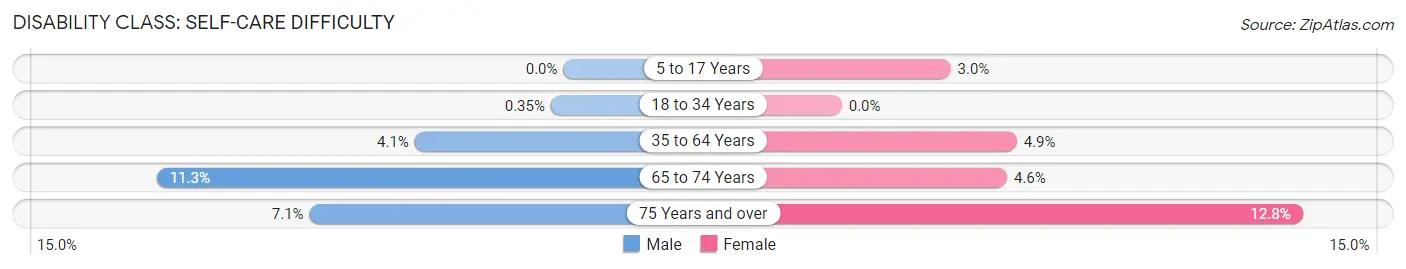
| Age Bracket | Male | Female |
| 5 to 17 Years | 0 (0.0%) | 63 (3.0%) |
| 18 to 34 Years | 10 (0.4%) | 0 (0.0%) |
| 35 to 64 Years | 150 (4.1%) | 199 (4.9%) |
| 65 to 74 Years | 83 (11.3%) | 48 (4.6%) |
| 75 Years and over | 27 (7.1%) | 122 (12.8%) |
Technology Access in La Porte
Computing Device Access in La Porte
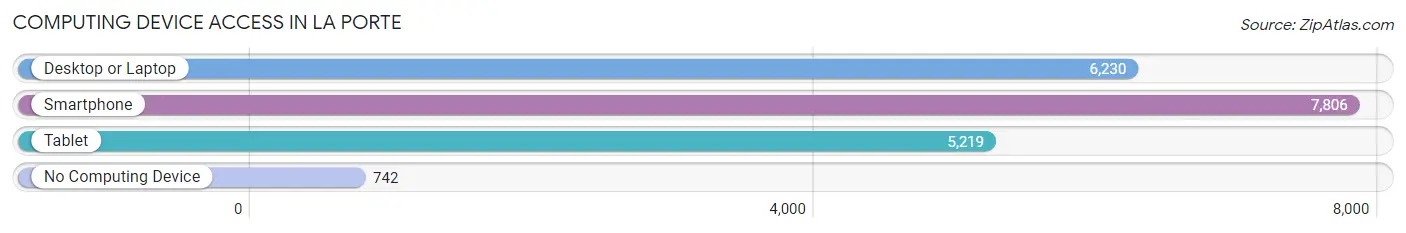
| Device Type | # Households | % Households |
| Desktop or Laptop | 6,230 | 67.9% |
| Smartphone | 7,806 | 85.1% |
| Tablet | 5,219 | 56.9% |
| No Computing Device | 742 | 8.1% |
| Total | 9,177 | 100.0% |
Internet Access in La Porte
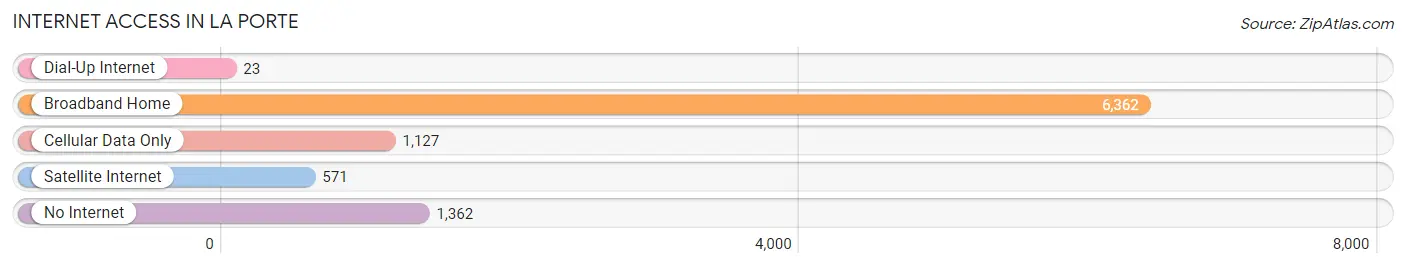
| Internet Type | # Households | % Households |
| Dial-Up Internet | 23 | 0.3% |
| Broadband Home | 6,362 | 69.3% |
| Cellular Data Only | 1,127 | 12.3% |
| Satellite Internet | 571 | 6.2% |
| No Internet | 1,362 | 14.8% |
| Total | 9,177 | 100.0% |
La Porte Summary
La Porte, Indiana is a city located in LaPorte County, Indiana, United States. It is the county seat of LaPorte County and is located on the shores of Lake Michigan. The population of LaPorte was estimated to be 22,053 in 2019.
History
LaPorte was founded in 1832 by fur trader William Digby. The city was named after the French phrase for “the door”, referring to the entrance to the area. The city was incorporated in 1837 and was the first city in LaPorte County.
In the late 19th century, LaPorte was a major industrial center. It was home to several factories, including the LaPorte Carriage Works, the LaPorte Foundry, and the LaPorte Iron Works. The city was also home to the LaPorte and Michigan City Railroad, which connected the city to Michigan City.
In the early 20th century, LaPorte was a popular tourist destination. The city was home to several resorts, including the LaPorte Beach Hotel and the LaPorte Country Club.
Geography
LaPorte is located in the northwest corner of Indiana, on the shores of Lake Michigan. The city is situated on the LaPorte Plain, a flat area of land that is surrounded by rolling hills. The city is located approximately 50 miles east of Chicago and 25 miles west of South Bend.
The climate in LaPorte is humid continental, with hot summers and cold winters. The average annual temperature is 48°F (9°C). The average annual precipitation is 37.5 inches (95 cm).
Economy
The economy of LaPorte is largely based on manufacturing and tourism. The city is home to several factories, including the LaPorte Foundry, the LaPorte Carriage Works, and the LaPorte Iron Works. The city is also home to several tourist attractions, including the LaPorte Beach Hotel and the LaPorte Country Club.
Demographics
As of the 2019 census, the population of LaPorte was estimated to be 22,053. The racial makeup of the city was 87.3% White, 8.2% African American, 0.7% Native American, 0.7% Asian, 0.1% Pacific Islander, 1.2% from other races, and 2.0% from two or more races. Hispanic or Latino of any race were 3.3% of the population.
The median household income in LaPorte was $45,945 in 2019. The per capita income was $25,845. The median age of the population was 38.7 years.
Conclusion
LaPorte, Indiana is a city located in LaPorte County, Indiana, United States. It is the county seat of LaPorte County and is located on the shores of Lake Michigan. The city was founded in 1832 and was incorporated in 1837. LaPorte is a major industrial center and a popular tourist destination. The economy of LaPorte is largely based on manufacturing and tourism. The population of LaPorte was estimated to be 22,053 in 2019. The racial makeup of the city was 87.3% White, 8.2% African American, 0.7% Native American, 0.7% Asian, 0.1% Pacific Islander, 1.2% from other races, and 2.0% from two or more races. The median household income in LaPorte was $45,945 in 2019.
Common Questions
What is Per Capita Income in La Porte?
Per Capita income in La Porte is $28,437.
What is the Median Family Income in La Porte?
Median Family Income in La Porte is $66,024.
What is the Median Household income in La Porte?
Median Household Income in La Porte is $55,031.
What is Income or Wage Gap in La Porte?
Income or Wage Gap in La Porte is 21.9%.
Women in La Porte earn 78.1 cents for every dollar earned by a man.
What is Family Income Deficit in La Porte?
Family Income Deficit in La Porte is $11,271.
Families that are below poverty line in La Porte earn $11,271 less on average than the poverty threshold level.
What is Inequality or Gini Index in La Porte?
Inequality or Gini Index in La Porte is 0.42.
What is the Total Population of La Porte?
Total Population of La Porte is 22,409.
What is the Total Male Population of La Porte?
Total Male Population of La Porte is 10,790.
What is the Total Female Population of La Porte?
Total Female Population of La Porte is 11,619.
What is the Ratio of Males per 100 Females in La Porte?
There are 92.87 Males per 100 Females in La Porte.
What is the Ratio of Females per 100 Males in La Porte?
There are 107.68 Females per 100 Males in La Porte.
What is the Median Population Age in La Porte?
Median Population Age in La Porte is 35.0 Years.
What is the Average Family Size in La Porte
Average Family Size in La Porte is 3.0 People.
What is the Average Household Size in La Porte
Average Household Size in La Porte is 2.4 People.
How Large is the Labor Force in La Porte?
There are 11,369 People in the Labor Forcein in La Porte.
What is the Percentage of People in the Labor Force in La Porte?
65.8% of People are in the Labor Force in La Porte.
What is the Unemployment Rate in La Porte?
Unemployment Rate in La Porte is 5.5%.