Zip Codes with the Highest Percentage of Population Employed in Arts, Entertainment & Recreation in Bloomington, IN
RELATED REPORTS & OPTIONS
Arts, Entertainment & Recreation
Bloomington
Compare Zip Codes
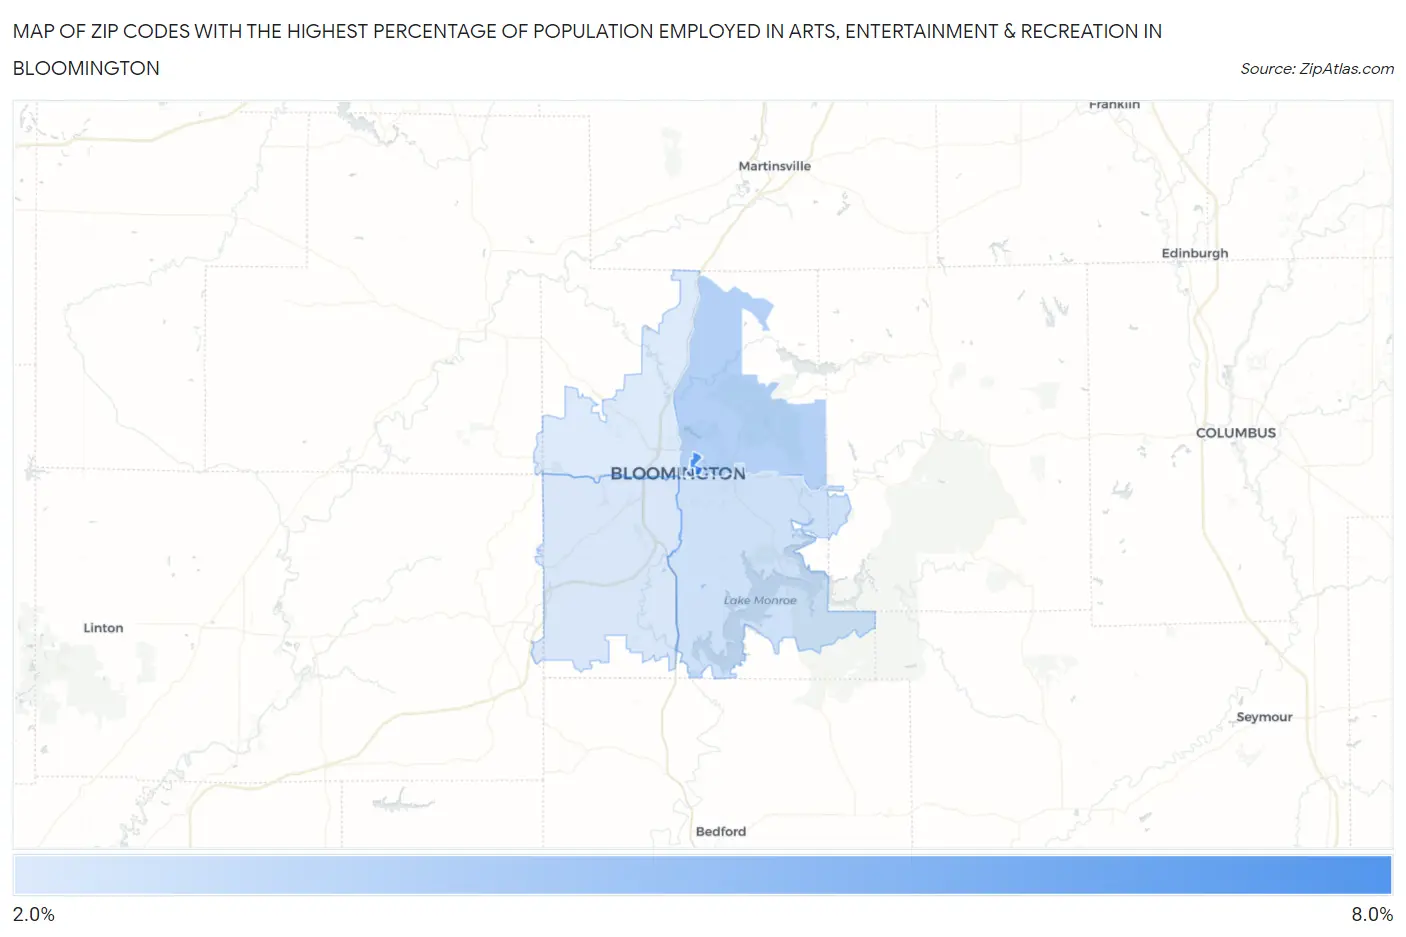
Map of Zip Codes with the Highest Percentage of Population Employed in Arts, Entertainment & Recreation in Bloomington
2.2%
7.0%
Zip Codes with the Highest Percentage of Population Employed in Arts, Entertainment & Recreation in Bloomington, IN
| Zip Code | % Employed | vs State | vs National | |
| 1. | 47406 | 7.0% | 1.6%(+5.40)#13 | 2.1%(+4.96)#1,317 |
| 2. | 47408 | 3.6% | 1.6%(+1.93)#48 | 2.1%(+1.49)#4,007 |
| 3. | 47405 | 3.5% | 1.6%(+1.89)#53 | 2.1%(+1.44)#4,070 |
| 4. | 47401 | 2.7% | 1.6%(+1.04)#99 | 2.1%(+0.602)#6,416 |
| 5. | 47403 | 2.4% | 1.6%(+0.741)#122 | 2.1%(+0.298)#7,739 |
| 6. | 47404 | 2.2% | 1.6%(+0.610)#130 | 2.1%(+0.167)#8,381 |
1
Common Questions
What are the Top 5 Zip Codes with the Highest Percentage of Population Employed in Arts, Entertainment & Recreation in Bloomington, IN?
Top 5 Zip Codes with the Highest Percentage of Population Employed in Arts, Entertainment & Recreation in Bloomington, IN are:
What zip code has the Highest Percentage of Population Employed in Arts, Entertainment & Recreation in Bloomington, IN?
47406 has the Highest Percentage of Population Employed in Arts, Entertainment & Recreation in Bloomington, IN with 7.0%.
What is the Percentage of Population Employed in Arts, Entertainment & Recreation in Bloomington, IN?
Percentage of Population Employed in Arts, Entertainment & Recreation in Bloomington is 3.5%.
What is the Percentage of Population Employed in Arts, Entertainment & Recreation in Indiana?
Percentage of Population Employed in Arts, Entertainment & Recreation in Indiana is 1.6%.
What is the Percentage of Population Employed in Arts, Entertainment & Recreation in the United States?
Percentage of Population Employed in Arts, Entertainment & Recreation in the United States is 2.1%.