Michigan City, IN Map & Demographics
Michigan City Map
Michigan City Overview
$27,120
PER CAPITA INCOME
$68,608
AVG FAMILY INCOME
$51,554
AVG HOUSEHOLD INCOME
21.9%
WAGE / INCOME GAP [ % ]
78.1¢/ $1
WAGE / INCOME GAP [ $ ]
$14,384
FAMILY INCOME DEFICIT
0.45
INEQUALITY / GINI INDEX
31,983
TOTAL POPULATION
16,637
MALE POPULATION
15,346
FEMALE POPULATION
108.41
MALES / 100 FEMALES
92.24
FEMALES / 100 MALES
38.2
MEDIAN AGE
3.2
AVG FAMILY SIZE
2.4
AVG HOUSEHOLD SIZE
14,002
LABOR FORCE [ PEOPLE ]
54.8%
PERCENT IN LABOR FORCE
7.1%
UNEMPLOYMENT RATE
Michigan City Zip Codes
Michigan City Area Codes
Income in Michigan City
Income Overview in Michigan City
Per Capita Income in Michigan City is $27,120, while median incomes of families and households are $68,608 and $51,554 respectively.
| Characteristic | Number | Measure |
| Per Capita Income | 31,983 | $27,120 |
| Median Family Income | 6,673 | $68,608 |
| Mean Family Income | 6,673 | $78,952 |
| Median Household Income | 12,408 | $51,554 |
| Mean Household Income | 12,408 | $67,248 |
| Income Deficit | 6,673 | $14,384 |
| Wage / Income Gap (%) | 31,983 | 21.89% |
| Wage / Income Gap ($) | 31,983 | 78.11¢ per $1 |
| Gini / Inequality Index | 31,983 | 0.45 |
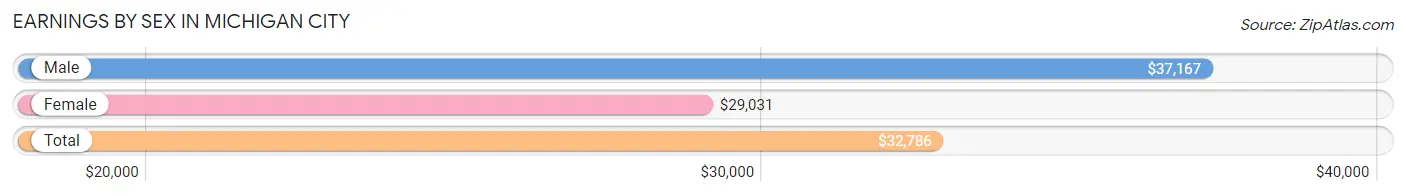
Earnings by Sex in Michigan City
Average Earnings in Michigan City are $32,786, $37,167 for men and $29,031 for women, a difference of 21.9%.
| Sex | Number | Average Earnings |
| Male | 7,348 (50.6%) | $37,167 |
| Female | 7,174 (49.4%) | $29,031 |
| Total | 14,522 (100.0%) | $32,786 |
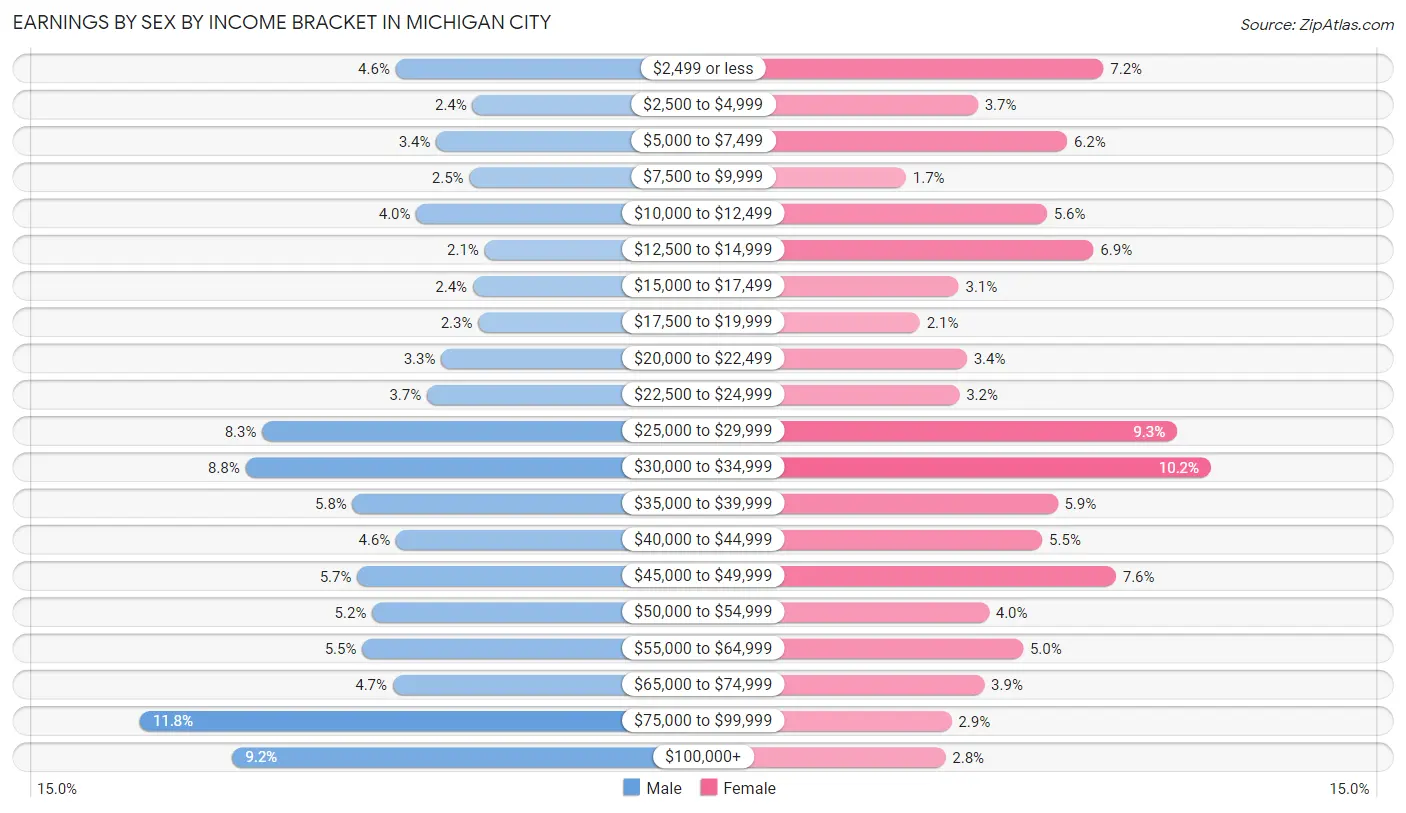
Earnings by Sex by Income Bracket in Michigan City
The most common earnings brackets in Michigan City are $75,000 to $99,999 for men (864 | 11.8%) and $30,000 to $34,999 for women (734 | 10.2%).
| Income | Male | Female |
| $2,499 or less | 336 (4.6%) | 517 (7.2%) |
| $2,500 to $4,999 | 177 (2.4%) | 264 (3.7%) |
| $5,000 to $7,499 | 252 (3.4%) | 444 (6.2%) |
| $7,500 to $9,999 | 184 (2.5%) | 119 (1.7%) |
| $10,000 to $12,499 | 293 (4.0%) | 403 (5.6%) |
| $12,500 to $14,999 | 152 (2.1%) | 497 (6.9%) |
| $15,000 to $17,499 | 176 (2.4%) | 225 (3.1%) |
| $17,500 to $19,999 | 165 (2.2%) | 147 (2.1%) |
| $20,000 to $22,499 | 242 (3.3%) | 242 (3.4%) |
| $22,500 to $24,999 | 271 (3.7%) | 227 (3.2%) |
| $25,000 to $29,999 | 611 (8.3%) | 666 (9.3%) |
| $30,000 to $34,999 | 646 (8.8%) | 734 (10.2%) |
| $35,000 to $39,999 | 425 (5.8%) | 425 (5.9%) |
| $40,000 to $44,999 | 335 (4.6%) | 394 (5.5%) |
| $45,000 to $49,999 | 415 (5.7%) | 542 (7.6%) |
| $50,000 to $54,999 | 384 (5.2%) | 286 (4.0%) |
| $55,000 to $64,999 | 405 (5.5%) | 355 (5.0%) |
| $65,000 to $74,999 | 342 (4.6%) | 277 (3.9%) |
| $75,000 to $99,999 | 864 (11.8%) | 211 (2.9%) |
| $100,000+ | 673 (9.2%) | 199 (2.8%) |
| Total | 7,348 (100.0%) | 7,174 (100.0%) |
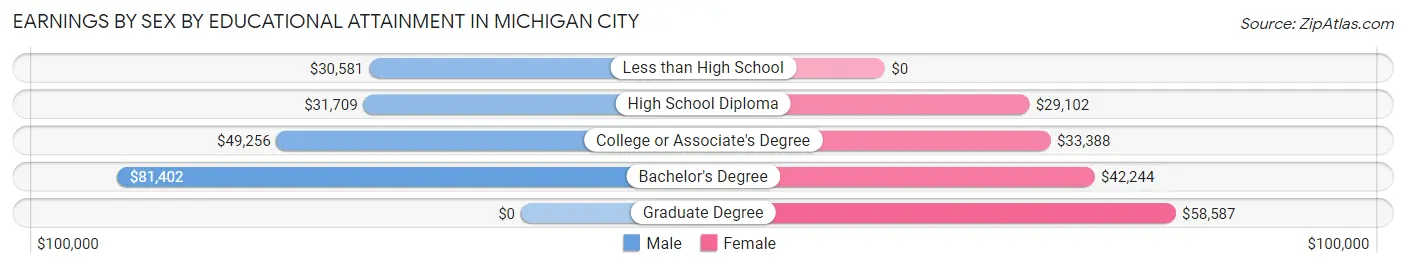
Earnings by Sex by Educational Attainment in Michigan City
Average earnings in Michigan City are $41,127 for men and $33,225 for women, a difference of 19.2%. Men with an educational attainment of bachelor's degree enjoy the highest average annual earnings of $81,402, while those with less than high school education earn the least with $30,581. Women with an educational attainment of graduate degree earn the most with the average annual earnings of $58,587, while those with high school diploma education have the smallest earnings of $29,102.
| Educational Attainment | Male Income | Female Income |
| Less than High School | $30,581 | $0 |
| High School Diploma | $31,709 | $29,102 |
| College or Associate's Degree | $49,256 | $33,388 |
| Bachelor's Degree | $81,402 | $42,244 |
| Graduate Degree | - | - |
| Total | $41,127 | $33,225 |
Family Income in Michigan City
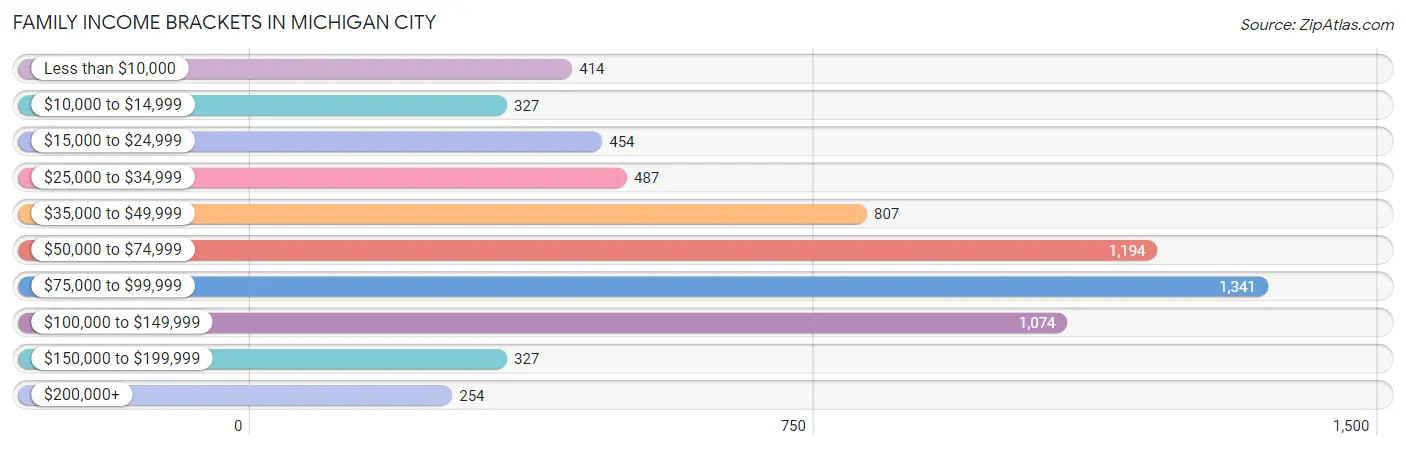
Family Income Brackets in Michigan City
According to the Michigan City family income data, there are 1,341 families falling into the $75,000 to $99,999 income range, which is the most common income bracket and makes up 20.1% of all families. Conversely, the $200,000+ income bracket is the least frequent group with only 254 families (3.8%) belonging to this category.
| Income Bracket | # Families | % Families |
| Less than $10,000 | 414 | 6.2% |
| $10,000 to $14,999 | 327 | 4.9% |
| $15,000 to $24,999 | 454 | 6.8% |
| $25,000 to $34,999 | 487 | 7.3% |
| $35,000 to $49,999 | 807 | 12.1% |
| $50,000 to $74,999 | 1,194 | 17.9% |
| $75,000 to $99,999 | 1,341 | 20.1% |
| $100,000 to $149,999 | 1,074 | 16.1% |
| $150,000 to $199,999 | 327 | 4.9% |
| $200,000+ | 254 | 3.8% |
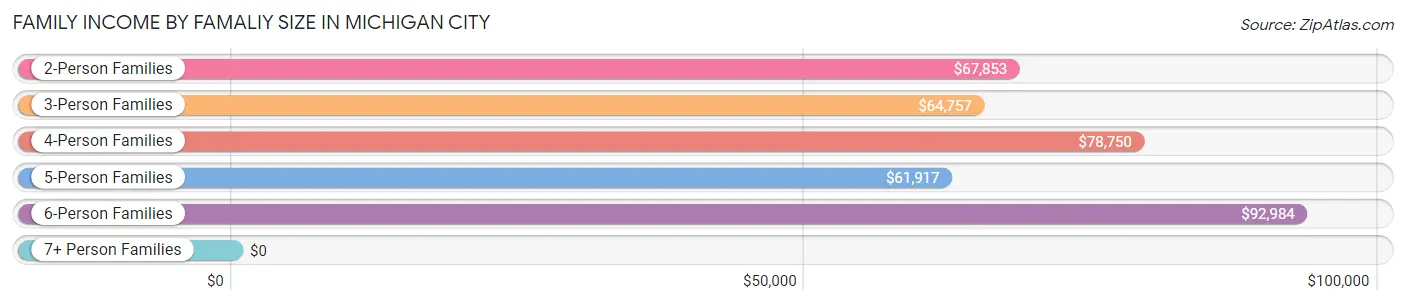
Family Income by Famaliy Size in Michigan City
6-person families (268 | 4.0%) account for the highest median family income in Michigan City with $92,984 per family, while 2-person families (3,359 | 50.3%) have the highest median income of $33,926 per family member.
| Income Bracket | # Families | Median Income |
| 2-Person Families | 3,359 (50.3%) | $67,853 |
| 3-Person Families | 1,447 (21.7%) | $64,757 |
| 4-Person Families | 783 (11.7%) | $78,750 |
| 5-Person Families | 795 (11.9%) | $61,917 |
| 6-Person Families | 268 (4.0%) | $92,984 |
| 7+ Person Families | 21 (0.3%) | $0 |
| Total | 6,673 (100.0%) | $68,608 |
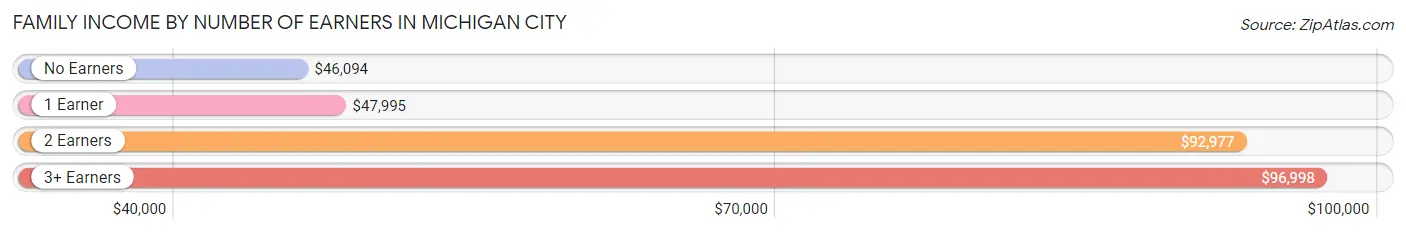
Family Income by Number of Earners in Michigan City
The median family income in Michigan City is $68,608, with families comprising 3+ earners (521) having the highest median family income of $96,998, while families with no earners (1,148) have the lowest median family income of $46,094, accounting for 7.8% and 17.2% of families, respectively.
| Number of Earners | # Families | Median Income |
| No Earners | 1,148 (17.2%) | $46,094 |
| 1 Earner | 2,833 (42.4%) | $47,995 |
| 2 Earners | 2,171 (32.5%) | $92,977 |
| 3+ Earners | 521 (7.8%) | $96,998 |
| Total | 6,673 (100.0%) | $68,608 |
Household Income in Michigan City
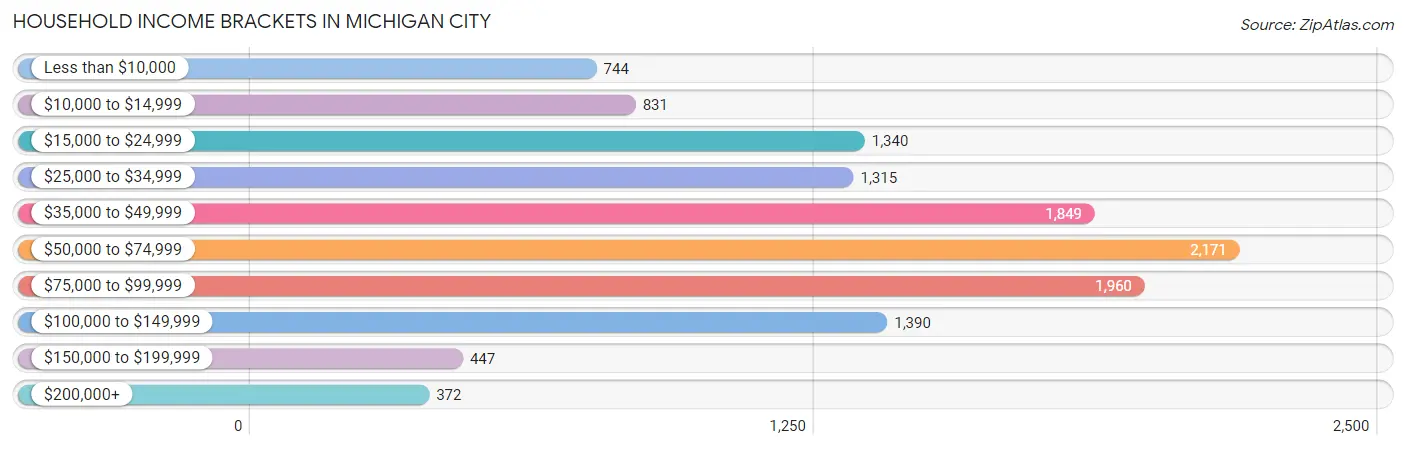
Household Income Brackets in Michigan City
With 2,171 households falling in the category, the $50,000 to $74,999 income range is the most frequent in Michigan City, accounting for 17.5% of all households. In contrast, only 372 households (3.0%) fall into the $200,000+ income bracket, making it the least populous group.
| Income Bracket | # Households | % Households |
| Less than $10,000 | 744 | 6.0% |
| $10,000 to $14,999 | 831 | 6.7% |
| $15,000 to $24,999 | 1,340 | 10.8% |
| $25,000 to $34,999 | 1,315 | 10.6% |
| $35,000 to $49,999 | 1,849 | 14.9% |
| $50,000 to $74,999 | 2,171 | 17.5% |
| $75,000 to $99,999 | 1,960 | 15.8% |
| $100,000 to $149,999 | 1,390 | 11.2% |
| $150,000 to $199,999 | 447 | 3.6% |
| $200,000+ | 372 | 3.0% |
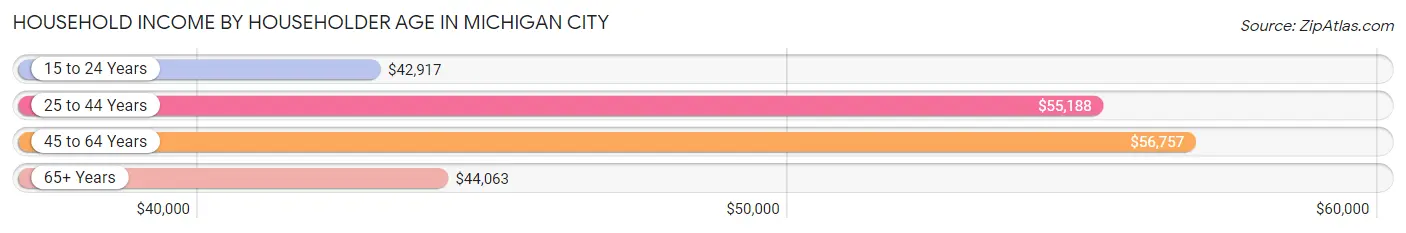
Household Income by Householder Age in Michigan City
The median household income in Michigan City is $51,554, with the highest median household income of $56,757 found in the 45 to 64 years age bracket for the primary householder. A total of 4,351 households (35.1%) fall into this category. Meanwhile, the 15 to 24 years age bracket for the primary householder has the lowest median household income of $42,917, with 611 households (4.9%) in this group.
| Income Bracket | # Households | Median Income |
| 15 to 24 Years | 611 (4.9%) | $42,917 |
| 25 to 44 Years | 3,708 (29.9%) | $55,188 |
| 45 to 64 Years | 4,351 (35.1%) | $56,757 |
| 65+ Years | 3,738 (30.1%) | $44,063 |
| Total | 12,408 (100.0%) | $51,554 |
Poverty in Michigan City
Income Below Poverty by Sex and Age in Michigan City
With 19.1% poverty level for males and 23.2% for females among the residents of Michigan City, under 5 year old males and 15 year old females are the most vulnerable to poverty, with 430 males (41.1%) and 78 females (57.8%) in their respective age groups living below the poverty level.
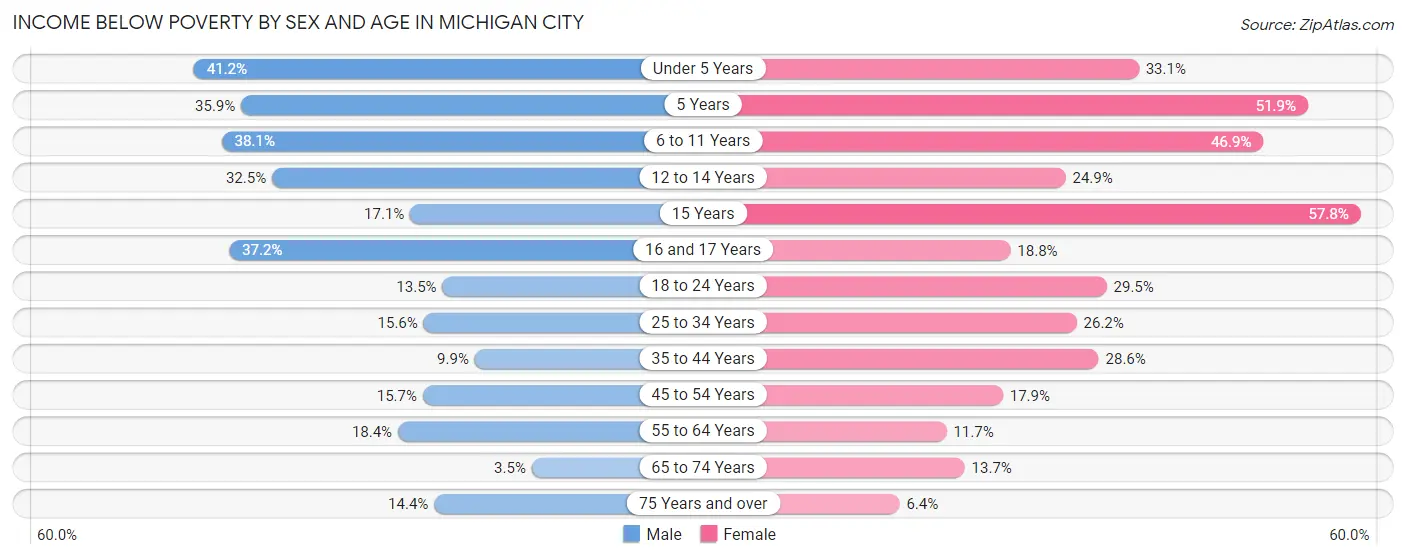
| Age Bracket | Male | Female |
| Under 5 Years | 430 (41.1%) | 291 (33.1%) |
| 5 Years | 89 (35.9%) | 96 (51.9%) |
| 6 to 11 Years | 470 (38.1%) | 566 (46.9%) |
| 12 to 14 Years | 135 (32.5%) | 161 (24.9%) |
| 15 Years | 65 (17.1%) | 78 (57.8%) |
| 16 and 17 Years | 131 (37.2%) | 37 (18.8%) |
| 18 to 24 Years | 226 (13.5%) | 407 (29.5%) |
| 25 to 34 Years | 305 (15.6%) | 506 (26.2%) |
| 35 to 44 Years | 141 (9.9%) | 516 (28.6%) |
| 45 to 54 Years | 234 (15.7%) | 290 (17.9%) |
| 55 to 64 Years | 324 (18.4%) | 244 (11.7%) |
| 65 to 74 Years | 51 (3.5%) | 233 (13.7%) |
| 75 Years and over | 102 (14.4%) | 86 (6.4%) |
| Total | 2,703 (19.1%) | 3,511 (23.2%) |
Income Above Poverty by Sex and Age in Michigan City
According to the poverty statistics in Michigan City, males aged 65 to 74 years and females aged 75 years and over are the age groups that are most secure financially, with 96.5% of males and 93.6% of females in these age groups living above the poverty line.
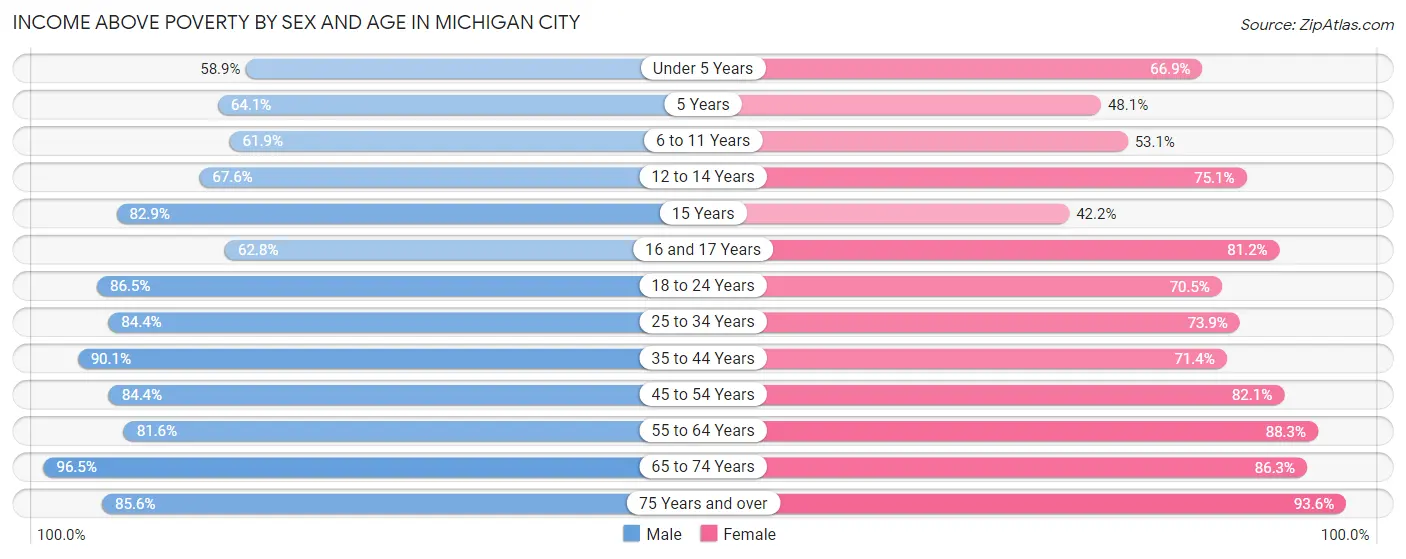
| Age Bracket | Male | Female |
| Under 5 Years | 615 (58.9%) | 589 (66.9%) |
| 5 Years | 159 (64.1%) | 89 (48.1%) |
| 6 to 11 Years | 765 (61.9%) | 640 (53.1%) |
| 12 to 14 Years | 281 (67.5%) | 485 (75.1%) |
| 15 Years | 316 (82.9%) | 57 (42.2%) |
| 16 and 17 Years | 221 (62.8%) | 160 (81.2%) |
| 18 to 24 Years | 1,452 (86.5%) | 973 (70.5%) |
| 25 to 34 Years | 1,655 (84.4%) | 1,429 (73.9%) |
| 35 to 44 Years | 1,287 (90.1%) | 1,288 (71.4%) |
| 45 to 54 Years | 1,261 (84.4%) | 1,327 (82.1%) |
| 55 to 64 Years | 1,435 (81.6%) | 1,848 (88.3%) |
| 65 to 74 Years | 1,398 (96.5%) | 1,470 (86.3%) |
| 75 Years and over | 607 (85.6%) | 1,253 (93.6%) |
| Total | 11,452 (80.9%) | 11,608 (76.8%) |
Income Below Poverty Among Married-Couple Families in Michigan City
The poverty statistics for married-couple families in Michigan City show that 3.8% or 135 of the total 3,562 families live below the poverty line. Families with 1 or 2 children have the highest poverty rate of 9.0%, comprising of 71 families. On the other hand, families with 5 or more children have the lowest poverty rate of 0.0%, which includes 0 families.
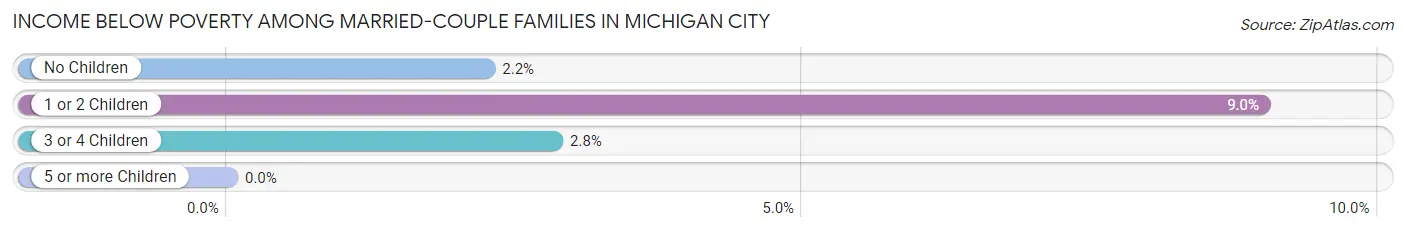
| Children | Above Poverty | Below Poverty |
| No Children | 2,362 (97.8%) | 54 (2.2%) |
| 1 or 2 Children | 719 (91.0%) | 71 (9.0%) |
| 3 or 4 Children | 343 (97.2%) | 10 (2.8%) |
| 5 or more Children | 3 (100.0%) | 0 (0.0%) |
| Total | 3,427 (96.2%) | 135 (3.8%) |
Income Below Poverty Among Single-Parent Households in Michigan City
According to the poverty data in Michigan City, 10.7% or 81 single-father households and 38.9% or 916 single-mother households are living below the poverty line. Among single-father households, those with 3 or 4 children have the highest poverty rate, with 28 households (68.3%) experiencing poverty. Likewise, among single-mother households, those with 5 or more children have the highest poverty rate, with 50 households (100.0%) falling below the poverty line.
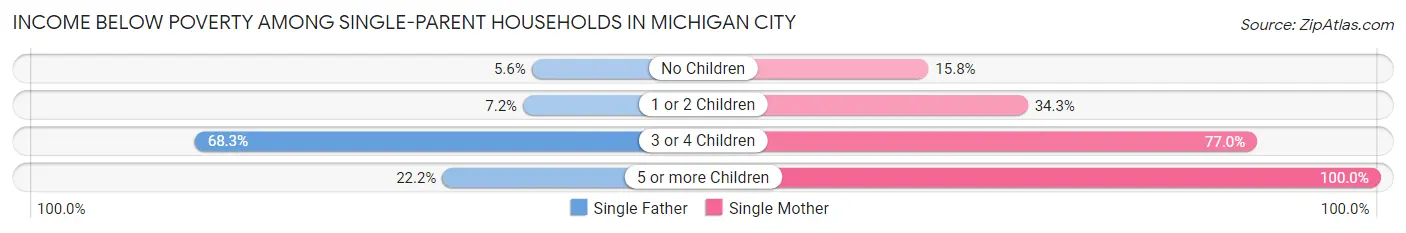
| Children | Single Father | Single Mother |
| No Children | 18 (5.6%) | 122 (15.8%) |
| 1 or 2 Children | 25 (7.2%) | 349 (34.3%) |
| 3 or 4 Children | 28 (68.3%) | 395 (77.0%) |
| 5 or more Children | 10 (22.2%) | 50 (100.0%) |
| Total | 81 (10.7%) | 916 (38.9%) |
Income Below Poverty Among Married-Couple vs Single-Parent Households in Michigan City
The poverty data for Michigan City shows that 135 of the married-couple family households (3.8%) and 997 of the single-parent households (32.1%) are living below the poverty level. Within the married-couple family households, those with 1 or 2 children have the highest poverty rate, with 71 households (9.0%) falling below the poverty line. Among the single-parent households, those with 3 or 4 children have the highest poverty rate, with 423 household (76.3%) living below poverty.
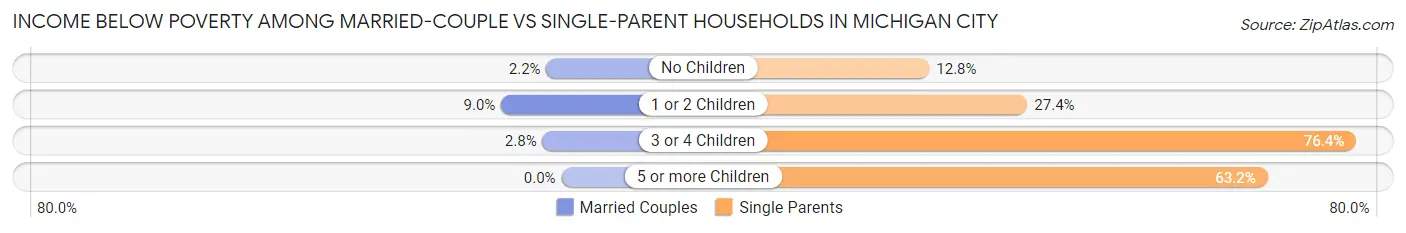
| Children | Married-Couple Families | Single-Parent Households |
| No Children | 54 (2.2%) | 140 (12.8%) |
| 1 or 2 Children | 71 (9.0%) | 374 (27.4%) |
| 3 or 4 Children | 10 (2.8%) | 423 (76.3%) |
| 5 or more Children | 0 (0.0%) | 60 (63.2%) |
| Total | 135 (3.8%) | 997 (32.1%) |
Race in Michigan City
The most populous races in Michigan City are White / Caucasian (20,065 | 62.7%), Black / African American (8,797 | 27.5%), and Hispanic or Latino (2,677 | 8.4%).
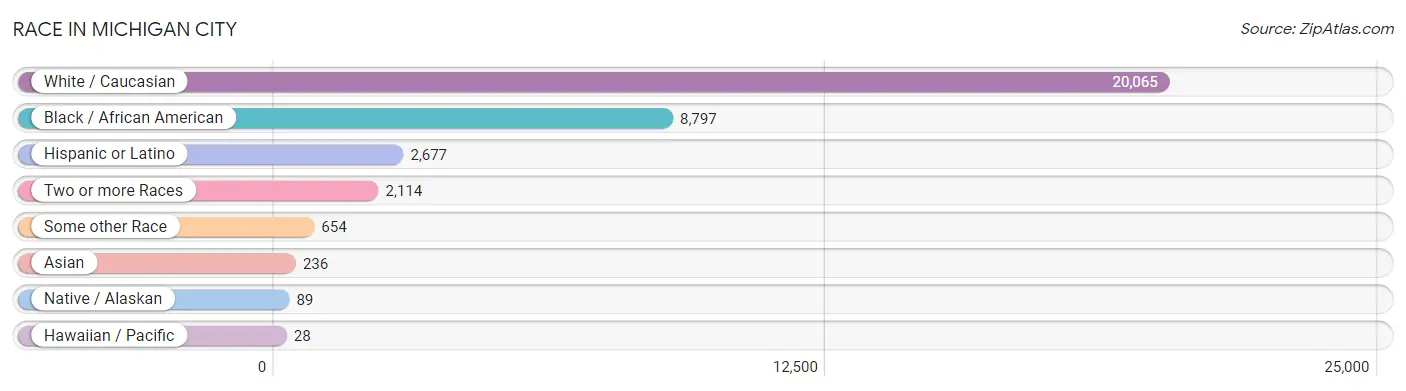
| Race | # Population | % Population |
| Asian | 236 | 0.7% |
| Black / African American | 8,797 | 27.5% |
| Hawaiian / Pacific | 28 | 0.1% |
| Hispanic or Latino | 2,677 | 8.4% |
| Native / Alaskan | 89 | 0.3% |
| White / Caucasian | 20,065 | 62.7% |
| Two or more Races | 2,114 | 6.6% |
| Some other Race | 654 | 2.0% |
| Total | 31,983 | 100.0% |
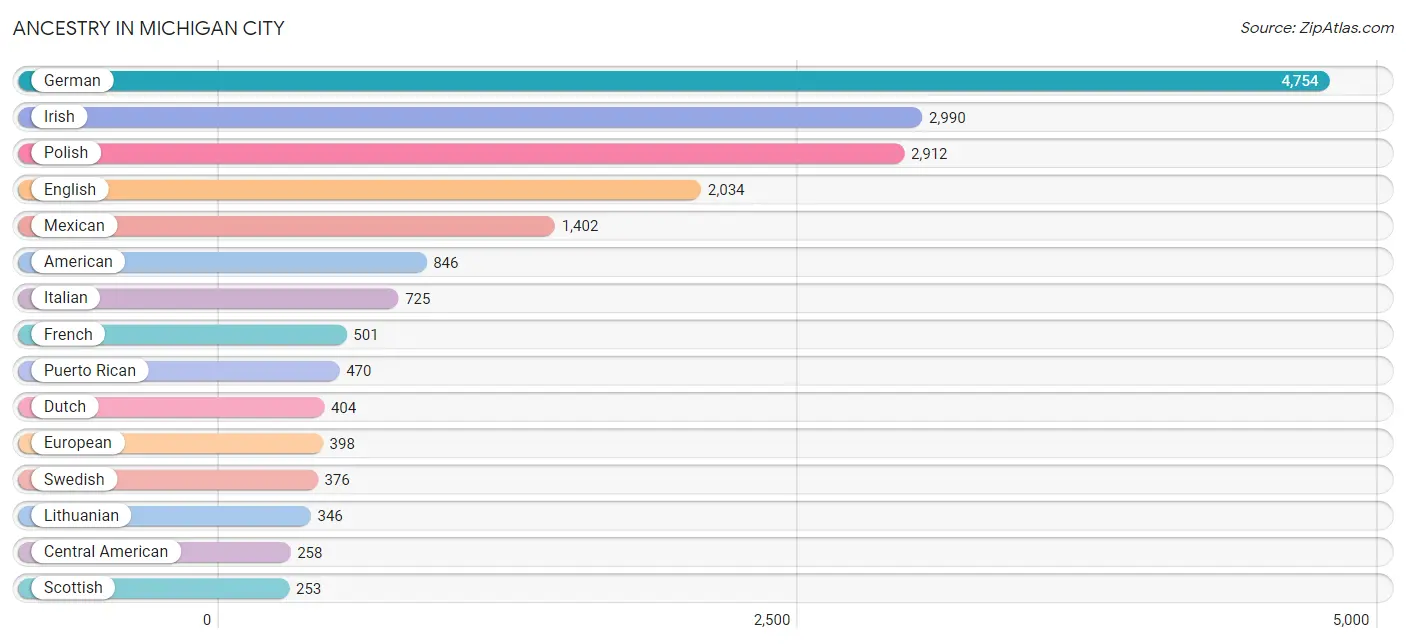
Ancestry in Michigan City
The most populous ancestries reported in Michigan City are German (4,754 | 14.9%), Irish (2,990 | 9.3%), Polish (2,912 | 9.1%), English (2,034 | 6.4%), and Mexican (1,402 | 4.4%), together accounting for 44.1% of all Michigan City residents.
| Ancestry | # Population | % Population |
| African | 66 | 0.2% |
| American | 846 | 2.6% |
| Arab | 184 | 0.6% |
| Assyrian / Chaldean / Syriac | 6 | 0.0% |
| Austrian | 32 | 0.1% |
| Belgian | 7 | 0.0% |
| Belizean | 3 | 0.0% |
| Bhutanese | 45 | 0.1% |
| Blackfeet | 65 | 0.2% |
| Brazilian | 27 | 0.1% |
| British | 158 | 0.5% |
| Burmese | 5 | 0.0% |
| Cambodian | 9 | 0.0% |
| Central American | 258 | 0.8% |
| Cherokee | 215 | 0.7% |
| Chippewa | 4 | 0.0% |
| Colombian | 107 | 0.3% |
| Croatian | 67 | 0.2% |
| Cuban | 49 | 0.2% |
| Czech | 154 | 0.5% |
| Czechoslovakian | 35 | 0.1% |
| Danish | 46 | 0.1% |
| Dominican | 9 | 0.0% |
| Dutch | 404 | 1.3% |
| Eastern European | 60 | 0.2% |
| Ecuadorian | 28 | 0.1% |
| English | 2,034 | 6.4% |
| European | 398 | 1.2% |
| French | 501 | 1.6% |
| French Canadian | 42 | 0.1% |
| German | 4,754 | 14.9% |
| Greek | 116 | 0.4% |
| Guamanian / Chamorro | 28 | 0.1% |
| Guatemalan | 29 | 0.1% |
| Honduran | 51 | 0.2% |
| Hungarian | 81 | 0.3% |
| Indian (Asian) | 21 | 0.1% |
| Irish | 2,990 | 9.3% |
| Italian | 725 | 2.3% |
| Korean | 74 | 0.2% |
| Latvian | 8 | 0.0% |
| Lebanese | 141 | 0.4% |
| Lithuanian | 346 | 1.1% |
| Luxembourger | 7 | 0.0% |
| Mexican | 1,402 | 4.4% |
| Moroccan | 5 | 0.0% |
| Nicaraguan | 23 | 0.1% |
| Nigerian | 44 | 0.1% |
| Northern European | 35 | 0.1% |
| Norwegian | 204 | 0.6% |
| Palestinian | 13 | 0.0% |
| Panamanian | 155 | 0.5% |
| Pennsylvania German | 20 | 0.1% |
| Peruvian | 10 | 0.0% |
| Polish | 2,912 | 9.1% |
| Potawatomi | 4 | 0.0% |
| Puerto Rican | 470 | 1.5% |
| Russian | 81 | 0.3% |
| Samoan | 28 | 0.1% |
| Scandinavian | 36 | 0.1% |
| Scotch-Irish | 205 | 0.6% |
| Scottish | 253 | 0.8% |
| Serbian | 90 | 0.3% |
| Slavic | 13 | 0.0% |
| Slovak | 53 | 0.2% |
| South American | 145 | 0.4% |
| South American Indian | 10 | 0.0% |
| Spaniard | 147 | 0.5% |
| Spanish | 103 | 0.3% |
| Sri Lankan | 17 | 0.1% |
| Subsaharan African | 110 | 0.3% |
| Swedish | 376 | 1.2% |
| Swiss | 49 | 0.2% |
| Ukrainian | 9 | 0.0% |
| Welsh | 48 | 0.2% | View All 75 Rows |
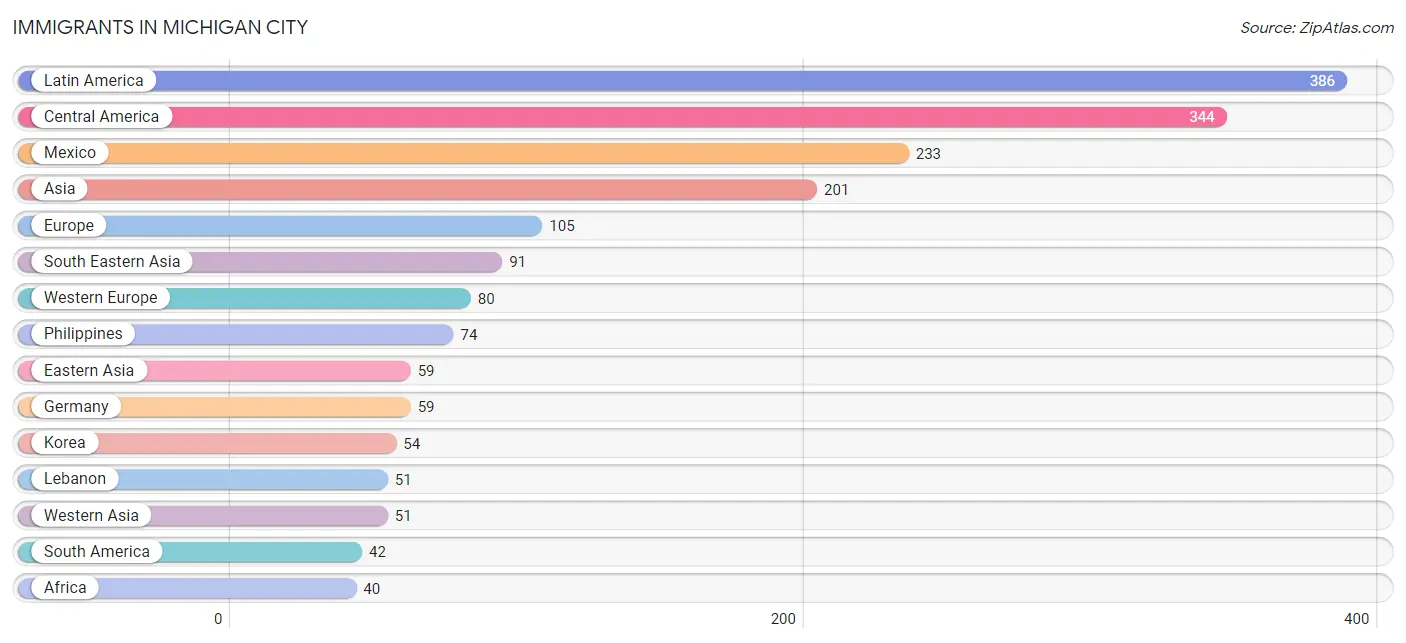
Immigrants in Michigan City
The most numerous immigrant groups reported in Michigan City came from Latin America (386 | 1.2%), Central America (344 | 1.1%), Mexico (233 | 0.7%), Asia (201 | 0.6%), and Europe (105 | 0.3%), together accounting for 4.0% of all Michigan City residents.
| Immigration Origin | # Population | % Population |
| Africa | 40 | 0.1% |
| Asia | 201 | 0.6% |
| Austria | 7 | 0.0% |
| Canada | 9 | 0.0% |
| Central America | 344 | 1.1% |
| Eastern Asia | 59 | 0.2% |
| Eastern Europe | 5 | 0.0% |
| Ecuador | 5 | 0.0% |
| El Salvador | 12 | 0.0% |
| Europe | 105 | 0.3% |
| France | 4 | 0.0% |
| Germany | 59 | 0.2% |
| Greece | 10 | 0.0% |
| Guatemala | 29 | 0.1% |
| Honduras | 7 | 0.0% |
| Italy | 10 | 0.0% |
| Japan | 5 | 0.0% |
| Korea | 54 | 0.2% |
| Latin America | 386 | 1.2% |
| Lebanon | 51 | 0.2% |
| Lithuania | 5 | 0.0% |
| Mexico | 233 | 0.7% |
| Middle Africa | 6 | 0.0% |
| Netherlands | 10 | 0.0% |
| Nicaragua | 23 | 0.1% |
| Nigeria | 34 | 0.1% |
| Panama | 40 | 0.1% |
| Peru | 10 | 0.0% |
| Philippines | 74 | 0.2% |
| South America | 42 | 0.1% |
| South Eastern Asia | 91 | 0.3% |
| Southern Europe | 20 | 0.1% |
| Vietnam | 17 | 0.1% |
| Western Africa | 34 | 0.1% |
| Western Asia | 51 | 0.2% |
| Western Europe | 80 | 0.3% | View All 36 Rows |
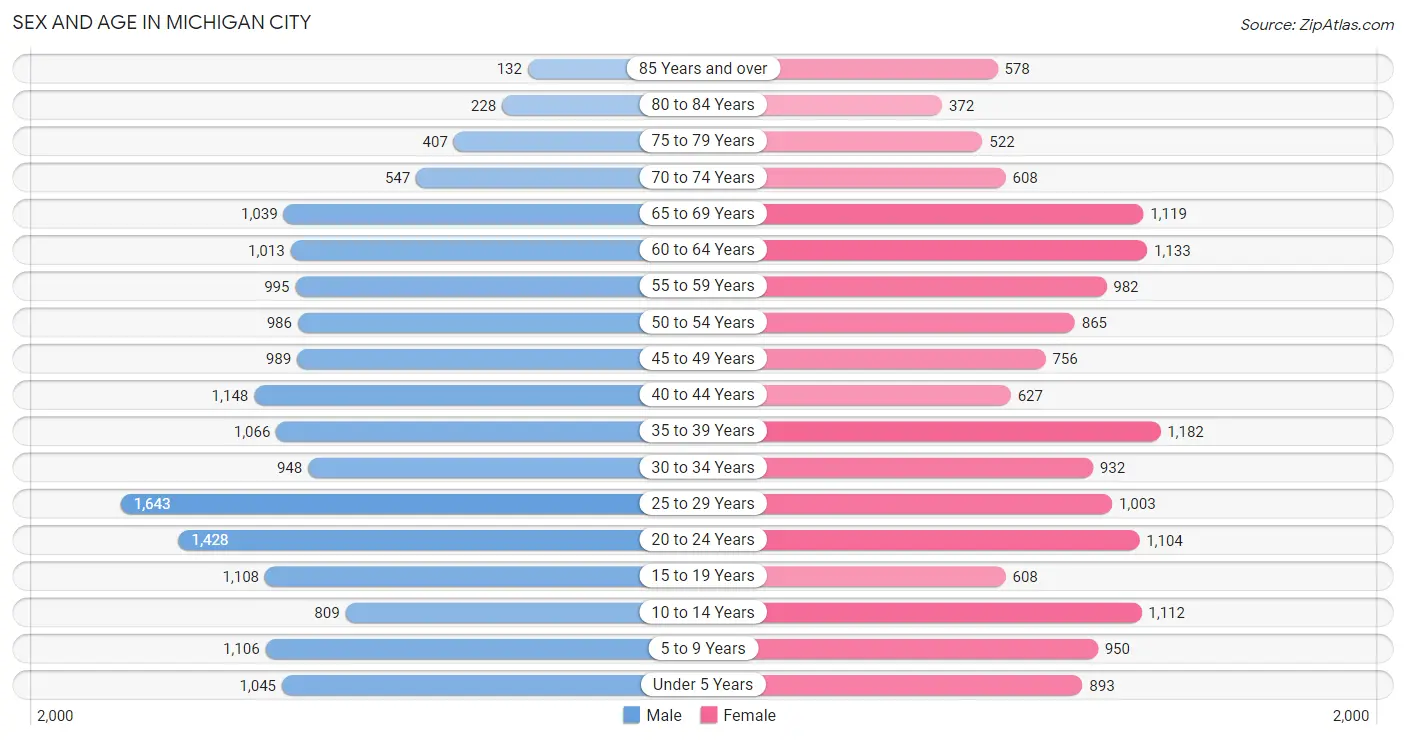
Sex and Age in Michigan City
Sex and Age in Michigan City
The most populous age groups in Michigan City are 25 to 29 Years (1,643 | 9.9%) for men and 35 to 39 Years (1,182 | 7.7%) for women.
| Age Bracket | Male | Female |
| Under 5 Years | 1,045 (6.3%) | 893 (5.8%) |
| 5 to 9 Years | 1,106 (6.7%) | 950 (6.2%) |
| 10 to 14 Years | 809 (4.9%) | 1,112 (7.2%) |
| 15 to 19 Years | 1,108 (6.7%) | 608 (4.0%) |
| 20 to 24 Years | 1,428 (8.6%) | 1,104 (7.2%) |
| 25 to 29 Years | 1,643 (9.9%) | 1,003 (6.5%) |
| 30 to 34 Years | 948 (5.7%) | 932 (6.1%) |
| 35 to 39 Years | 1,066 (6.4%) | 1,182 (7.7%) |
| 40 to 44 Years | 1,148 (6.9%) | 627 (4.1%) |
| 45 to 49 Years | 989 (5.9%) | 756 (4.9%) |
| 50 to 54 Years | 986 (5.9%) | 865 (5.6%) |
| 55 to 59 Years | 995 (6.0%) | 982 (6.4%) |
| 60 to 64 Years | 1,013 (6.1%) | 1,133 (7.4%) |
| 65 to 69 Years | 1,039 (6.2%) | 1,119 (7.3%) |
| 70 to 74 Years | 547 (3.3%) | 608 (4.0%) |
| 75 to 79 Years | 407 (2.5%) | 522 (3.4%) |
| 80 to 84 Years | 228 (1.4%) | 372 (2.4%) |
| 85 Years and over | 132 (0.8%) | 578 (3.8%) |
| Total | 16,637 (100.0%) | 15,346 (100.0%) |
Families and Households in Michigan City
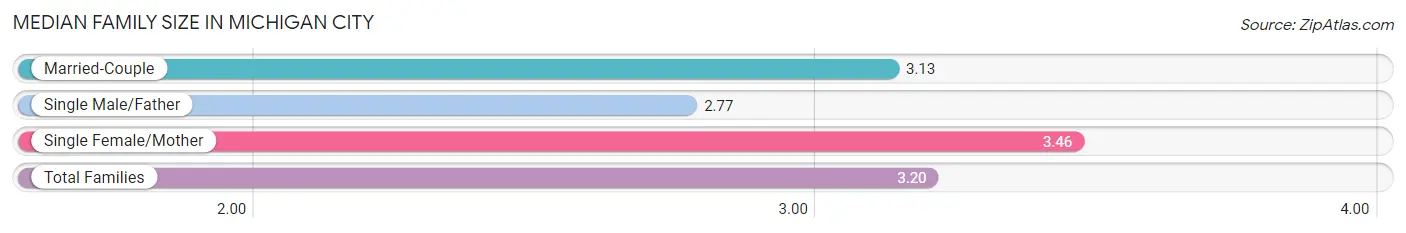
Median Family Size in Michigan City
The median family size in Michigan City is 3.20 persons per family, with single female/mother families (2,354 | 35.3%) accounting for the largest median family size of 3.46 persons per family. On the other hand, single male/father families (757 | 11.3%) represent the smallest median family size with 2.77 persons per family.
| Family Type | # Families | Family Size |
| Married-Couple | 3,562 (53.4%) | 3.13 |
| Single Male/Father | 757 (11.3%) | 2.77 |
| Single Female/Mother | 2,354 (35.3%) | 3.46 |
| Total Families | 6,673 (100.0%) | 3.20 |
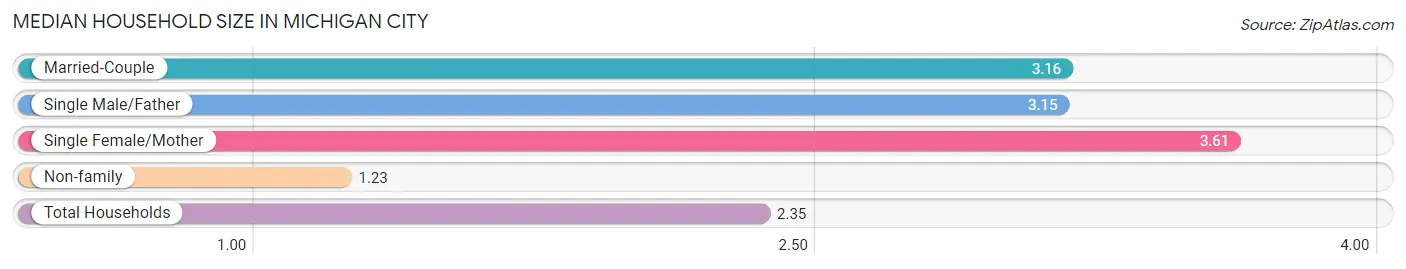
Median Household Size in Michigan City
The median household size in Michigan City is 2.35 persons per household, with single female/mother households (2,354 | 19.0%) accounting for the largest median household size of 3.61 persons per household. non-family households (5,735 | 46.2%) represent the smallest median household size with 1.23 persons per household.
| Household Type | # Households | Household Size |
| Married-Couple | 3,562 (28.7%) | 3.16 |
| Single Male/Father | 757 (6.1%) | 3.15 |
| Single Female/Mother | 2,354 (19.0%) | 3.61 |
| Non-family | 5,735 (46.2%) | 1.23 |
| Total Households | 12,408 (100.0%) | 2.35 |
Household Size by Marriage Status in Michigan City
Out of a total of 12,408 households in Michigan City, 6,673 (53.8%) are family households, while 5,735 (46.2%) are nonfamily households. The most numerous type of family households are 2-person households, comprising 3,158, and the most common type of nonfamily households are 1-person households, comprising 4,815.
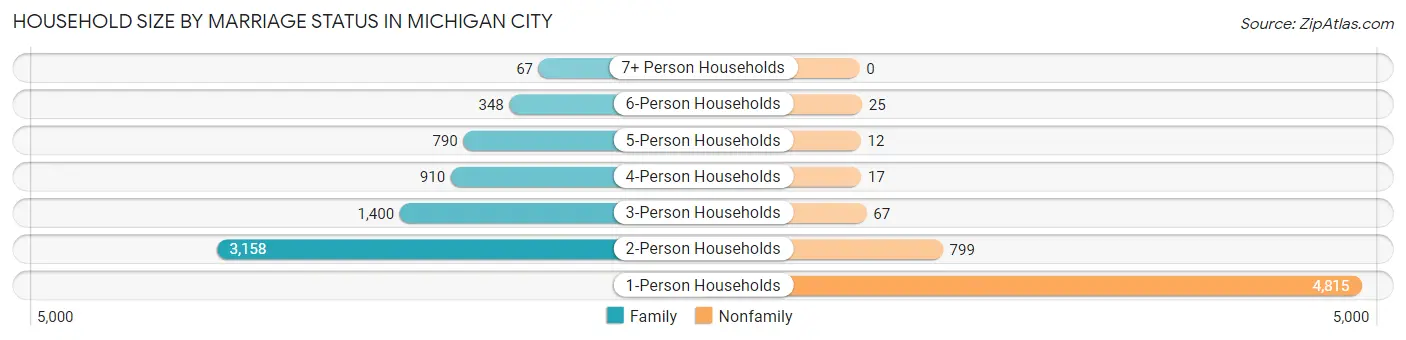
| Household Size | Family Households | Nonfamily Households |
| 1-Person Households | - | 4,815 (38.8%) |
| 2-Person Households | 3,158 (25.5%) | 799 (6.4%) |
| 3-Person Households | 1,400 (11.3%) | 67 (0.5%) |
| 4-Person Households | 910 (7.3%) | 17 (0.1%) |
| 5-Person Households | 790 (6.4%) | 12 (0.1%) |
| 6-Person Households | 348 (2.8%) | 25 (0.2%) |
| 7+ Person Households | 67 (0.5%) | 0 (0.0%) |
| Total | 6,673 (53.8%) | 5,735 (46.2%) |
Female Fertility in Michigan City
Fertility by Age in Michigan City
Average fertility rate in Michigan City is 81.0 births per 1,000 women. Women in the age bracket of 20 to 34 years have the highest fertility rate with 150.0 births per 1,000 women. Women in the age bracket of 20 to 34 years acount for 88.5% of all women with births.
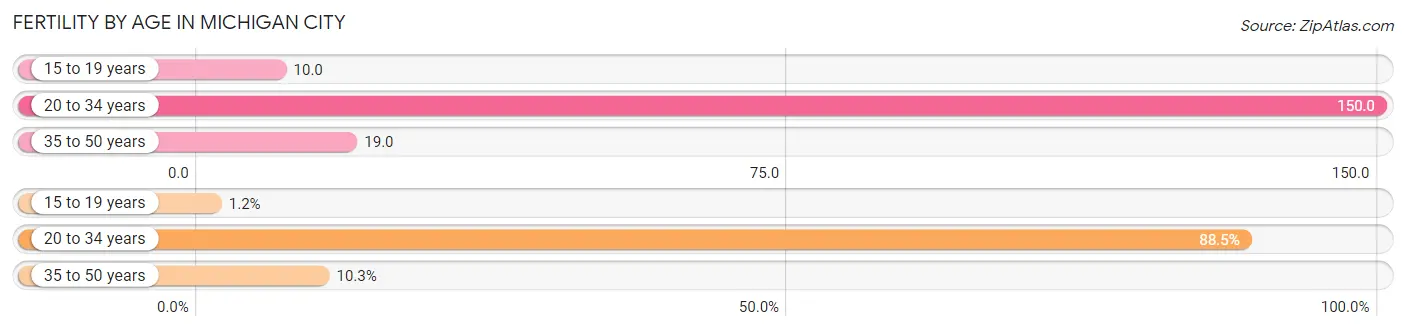
| Age Bracket | Women with Births | Births / 1,000 Women |
| 15 to 19 years | 6 (1.2%) | 10.0 |
| 20 to 34 years | 455 (88.5%) | 150.0 |
| 35 to 50 years | 53 (10.3%) | 19.0 |
| Total | 514 (100.0%) | 81.0 |
Fertility by Age by Marriage Status in Michigan City
37.9% of women with births (514) in Michigan City are married. The highest percentage of unmarried women with births falls into 15 to 19 years age bracket with 100.0% of them unmarried at the time of birth, while the lowest percentage of unmarried women with births belong to 35 to 50 years age bracket with 50.9% of them unmarried.
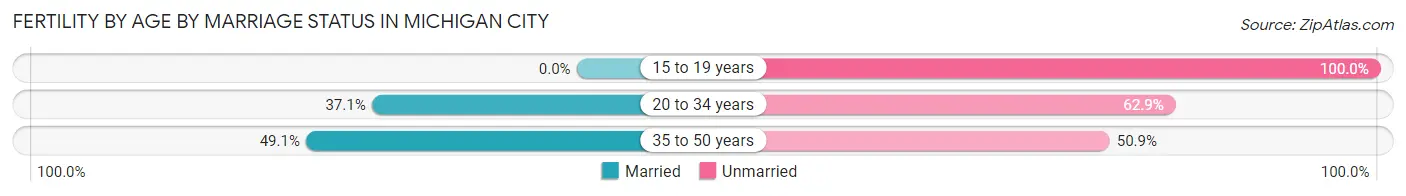
| Age Bracket | Married | Unmarried |
| 15 to 19 years | 0 (0.0%) | 6 (100.0%) |
| 20 to 34 years | 169 (37.1%) | 286 (62.9%) |
| 35 to 50 years | 26 (49.1%) | 27 (50.9%) |
| Total | 195 (37.9%) | 319 (62.1%) |
Fertility by Education in Michigan City
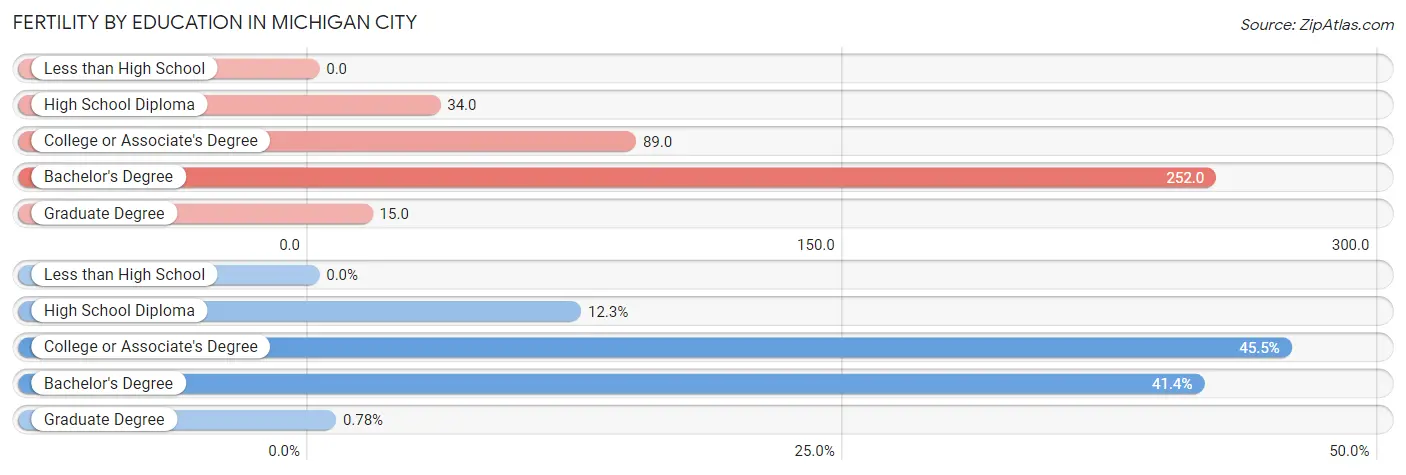
| Educational Attainment | Women with Births | Births / 1,000 Women |
| Less than High School | 0 (0.0%) | 0.0 |
| High School Diploma | 63 (12.3%) | 34.0 |
| College or Associate's Degree | 234 (45.5%) | 89.0 |
| Bachelor's Degree | 213 (41.4%) | 252.0 |
| Graduate Degree | 4 (0.8%) | 15.0 |
| Total | 514 (100.0%) | 81.0 |
Fertility by Education by Marriage Status in Michigan City
62.1% of women with births in Michigan City are unmarried. Women with the educational attainment of graduate degree are most likely to be married with 100.0% of them married at childbirth, while women with the educational attainment of college or associate's degree are least likely to be married with 82.9% of them unmarried at childbirth.
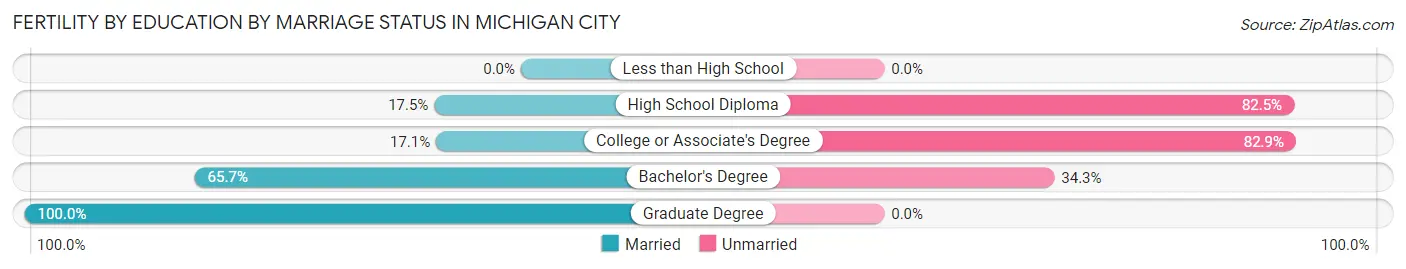
| Educational Attainment | Married | Unmarried |
| Less than High School | 0 (0.0%) | 0 (0.0%) |
| High School Diploma | 11 (17.5%) | 52 (82.5%) |
| College or Associate's Degree | 40 (17.1%) | 194 (82.9%) |
| Bachelor's Degree | 140 (65.7%) | 73 (34.3%) |
| Graduate Degree | 4 (100.0%) | 0 (0.0%) |
| Total | 195 (37.9%) | 319 (62.1%) |
Employment Characteristics in Michigan City
Employment by Class of Employer in Michigan City
Among the 12,787 employed individuals in Michigan City, private company employees (9,666 | 75.6%), not-for-profit organizations (933 | 7.3%), and local government employees (736 | 5.8%) make up the most common classes of employment.
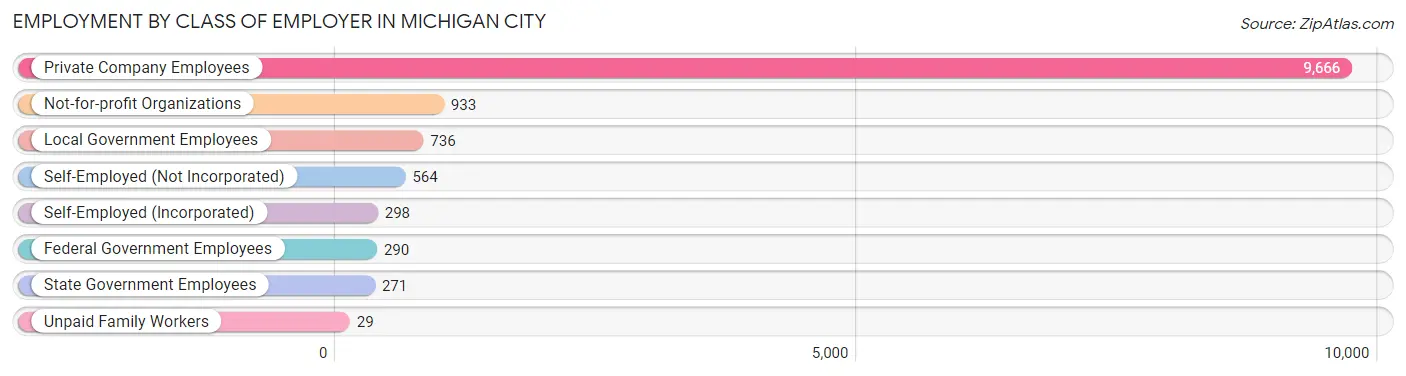
| Employer Class | # Employees | % Employees |
| Private Company Employees | 9,666 | 75.6% |
| Self-Employed (Incorporated) | 298 | 2.3% |
| Self-Employed (Not Incorporated) | 564 | 4.4% |
| Not-for-profit Organizations | 933 | 7.3% |
| Local Government Employees | 736 | 5.8% |
| State Government Employees | 271 | 2.1% |
| Federal Government Employees | 290 | 2.3% |
| Unpaid Family Workers | 29 | 0.2% |
| Total | 12,787 | 100.0% |
Employment Status by Age in Michigan City
According to the labor force statistics for Michigan City, out of the total population over 16 years of age (25,552), 54.8% or 14,002 individuals are in the labor force, with 7.1% or 994 of them unemployed. The age group with the highest labor force participation rate is 20 to 24 years, with 82.7% or 2,094 individuals in the labor force. Within the labor force, the 20 to 24 years age range has the highest percentage of unemployed individuals, with 11.7% or 245 of them being unemployed.
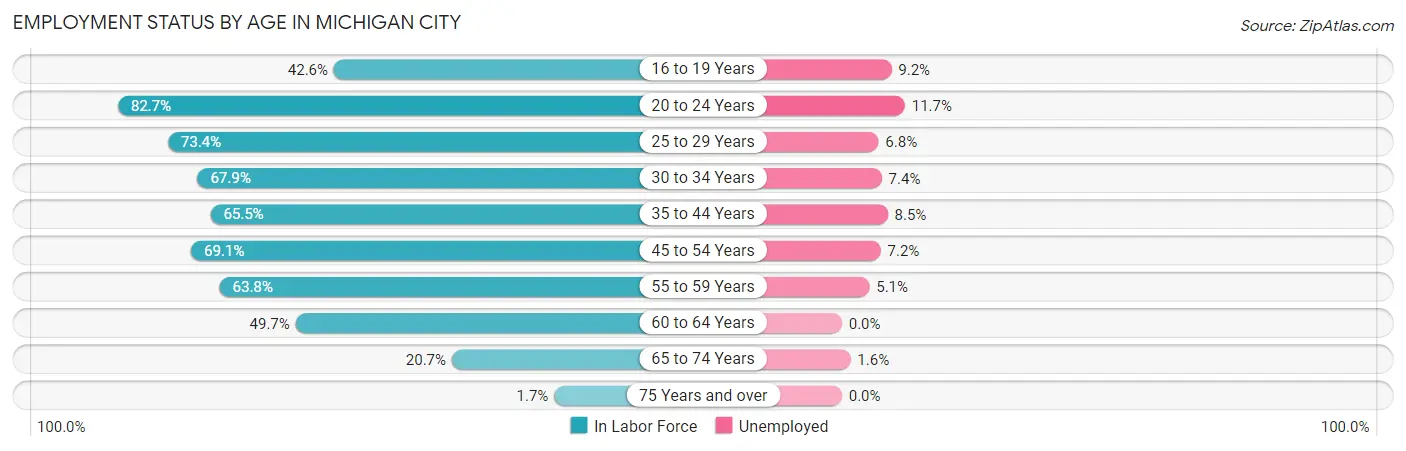
| Age Bracket | In Labor Force | Unemployed |
| 16 to 19 Years | 511 (42.6%) | 47 (9.2%) |
| 20 to 24 Years | 2,094 (82.7%) | 245 (11.7%) |
| 25 to 29 Years | 1,942 (73.4%) | 132 (6.8%) |
| 30 to 34 Years | 1,277 (67.9%) | 94 (7.4%) |
| 35 to 44 Years | 2,635 (65.5%) | 224 (8.5%) |
| 45 to 54 Years | 2,485 (69.1%) | 179 (7.2%) |
| 55 to 59 Years | 1,261 (63.8%) | 64 (5.1%) |
| 60 to 64 Years | 1,067 (49.7%) | 0 (0.0%) |
| 65 to 74 Years | 686 (20.7%) | 11 (1.6%) |
| 75 Years and over | 38 (1.7%) | 0 (0.0%) |
| Total | 14,002 (54.8%) | 994 (7.1%) |
Employment Status by Educational Attainment in Michigan City
According to labor force statistics for Michigan City, 65.6% of individuals (10,672) out of the total population between 25 and 64 years of age (16,268) are in the labor force, with 6.5% or 694 of them being unemployed. The group with the highest labor force participation rate are those with the educational attainment of bachelor's degree or higher, with 82.6% or 2,288 individuals in the labor force. Within the labor force, individuals with less than high school education have the highest percentage of unemployment, with 14.4% or 65 of them being unemployed.
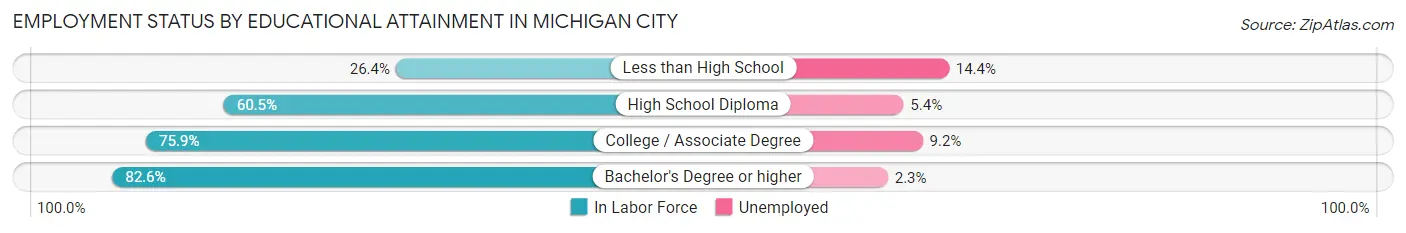
| Educational Attainment | In Labor Force | Unemployed |
| Less than High School | 451 (26.4%) | 246 (14.4%) |
| High School Diploma | 4,018 (60.5%) | 359 (5.4%) |
| College / Associate Degree | 3,907 (75.9%) | 474 (9.2%) |
| Bachelor's Degree or higher | 2,288 (82.6%) | 64 (2.3%) |
| Total | 10,672 (65.6%) | 1,057 (6.5%) |
Employment Occupations by Sex in Michigan City
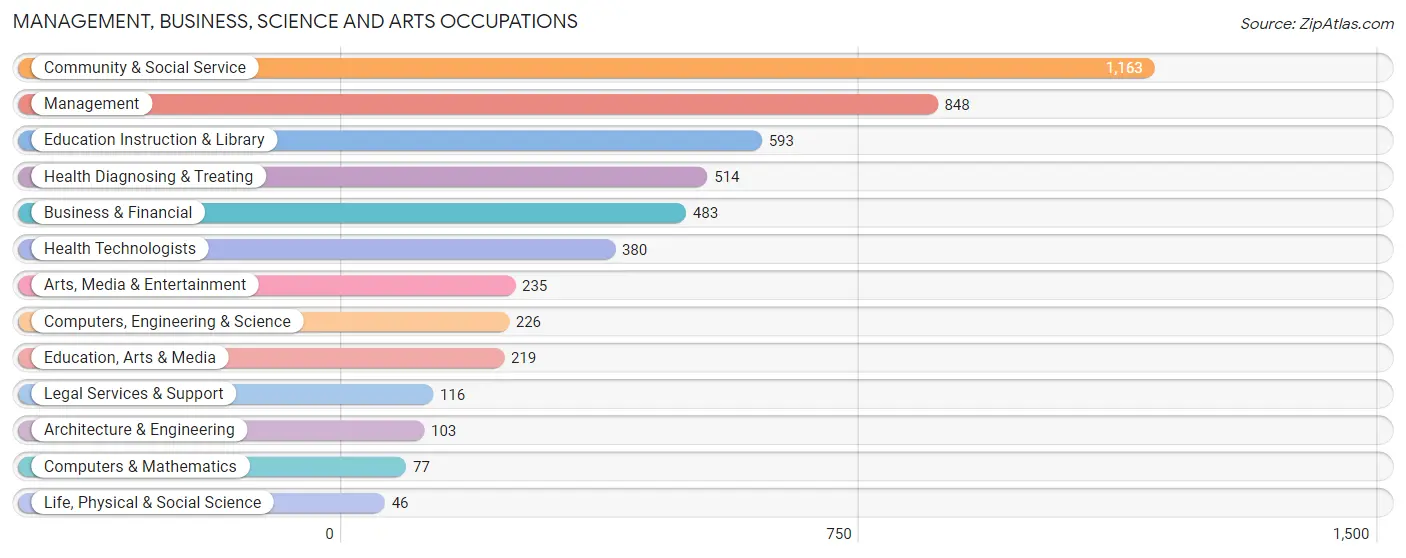
Management, Business, Science and Arts Occupations
The most common Management, Business, Science and Arts occupations in Michigan City are Community & Social Service (1,163 | 8.9%), Management (848 | 6.5%), Education Instruction & Library (593 | 4.6%), Health Diagnosing & Treating (514 | 4.0%), and Business & Financial (483 | 3.7%).
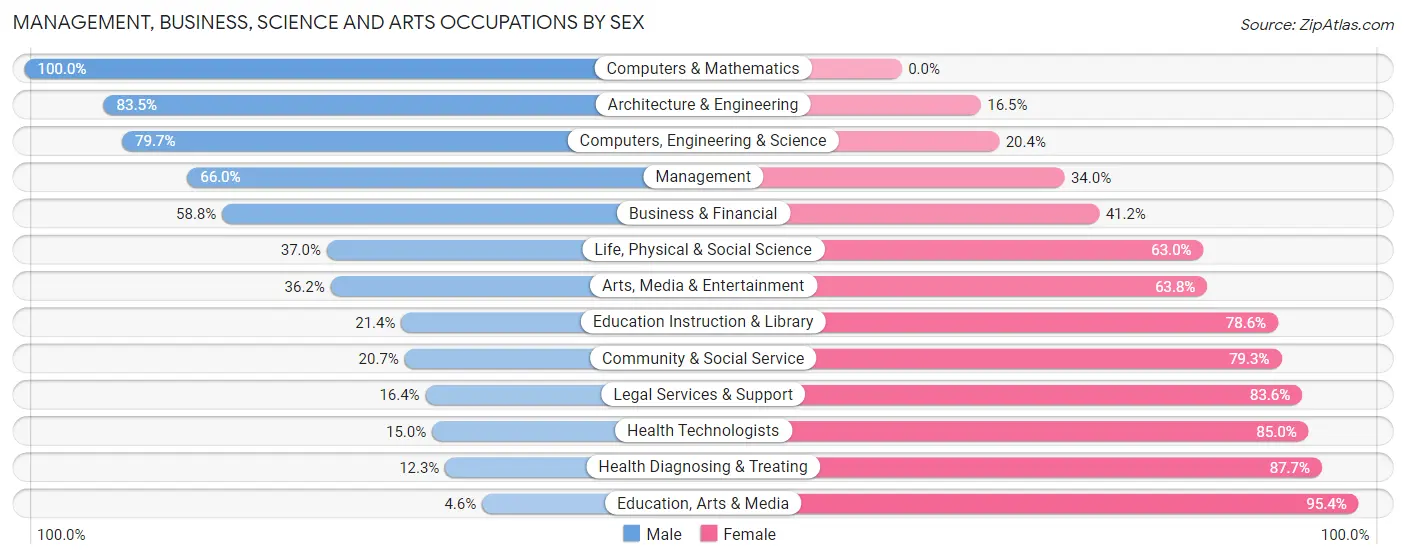
Management, Business, Science and Arts Occupations by Sex
Within the Management, Business, Science and Arts occupations in Michigan City, the most male-oriented occupations are Computers & Mathematics (100.0%), Architecture & Engineering (83.5%), and Computers, Engineering & Science (79.6%), while the most female-oriented occupations are Education, Arts & Media (95.4%), Health Diagnosing & Treating (87.7%), and Health Technologists (85.0%).
| Occupation | Male | Female |
| Management | 560 (66.0%) | 288 (34.0%) |
| Business & Financial | 284 (58.8%) | 199 (41.2%) |
| Computers, Engineering & Science | 180 (79.6%) | 46 (20.3%) |
| Computers & Mathematics | 77 (100.0%) | 0 (0.0%) |
| Architecture & Engineering | 86 (83.5%) | 17 (16.5%) |
| Life, Physical & Social Science | 17 (37.0%) | 29 (63.0%) |
| Community & Social Service | 241 (20.7%) | 922 (79.3%) |
| Education, Arts & Media | 10 (4.6%) | 209 (95.4%) |
| Legal Services & Support | 19 (16.4%) | 97 (83.6%) |
| Education Instruction & Library | 127 (21.4%) | 466 (78.6%) |
| Arts, Media & Entertainment | 85 (36.2%) | 150 (63.8%) |
| Health Diagnosing & Treating | 63 (12.3%) | 451 (87.7%) |
| Health Technologists | 57 (15.0%) | 323 (85.0%) |
| Total (Category) | 1,328 (41.1%) | 1,906 (58.9%) |
| Total (Overall) | 6,544 (50.3%) | 6,457 (49.7%) |
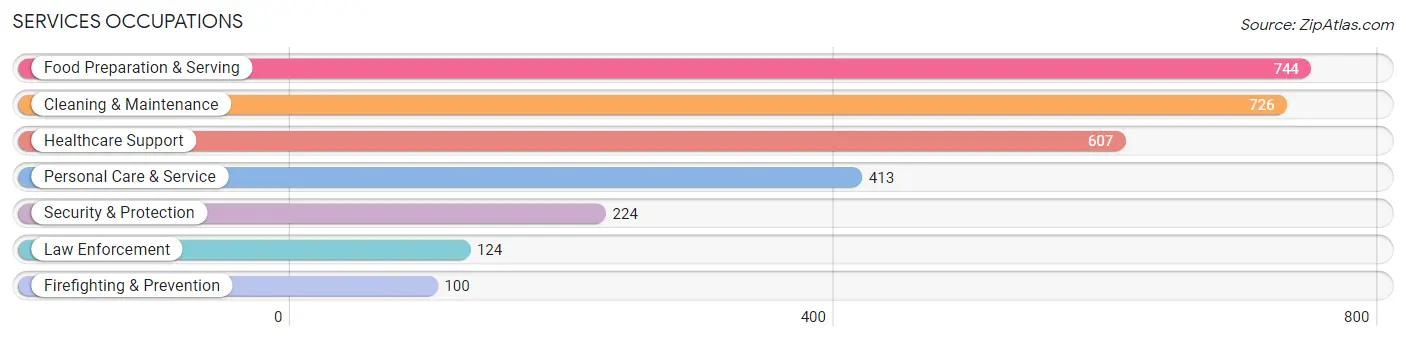
Services Occupations
The most common Services occupations in Michigan City are Food Preparation & Serving (744 | 5.7%), Cleaning & Maintenance (726 | 5.6%), Healthcare Support (607 | 4.7%), Personal Care & Service (413 | 3.2%), and Security & Protection (224 | 1.7%).
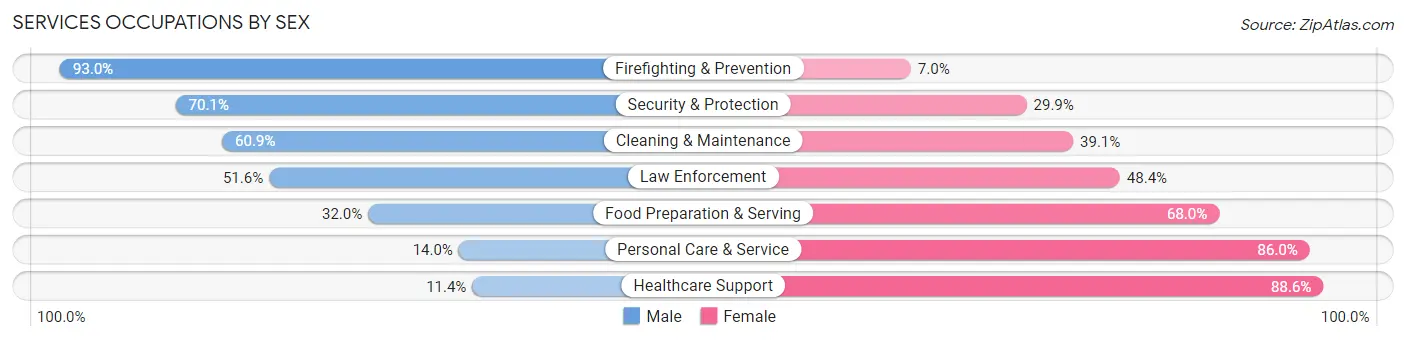
Services Occupations by Sex
Within the Services occupations in Michigan City, the most male-oriented occupations are Firefighting & Prevention (93.0%), Security & Protection (70.1%), and Cleaning & Maintenance (60.9%), while the most female-oriented occupations are Healthcare Support (88.6%), Personal Care & Service (86.0%), and Food Preparation & Serving (68.0%).
| Occupation | Male | Female |
| Healthcare Support | 69 (11.4%) | 538 (88.6%) |
| Security & Protection | 157 (70.1%) | 67 (29.9%) |
| Firefighting & Prevention | 93 (93.0%) | 7 (7.0%) |
| Law Enforcement | 64 (51.6%) | 60 (48.4%) |
| Food Preparation & Serving | 238 (32.0%) | 506 (68.0%) |
| Cleaning & Maintenance | 442 (60.9%) | 284 (39.1%) |
| Personal Care & Service | 58 (14.0%) | 355 (86.0%) |
| Total (Category) | 964 (35.5%) | 1,750 (64.5%) |
| Total (Overall) | 6,544 (50.3%) | 6,457 (49.7%) |
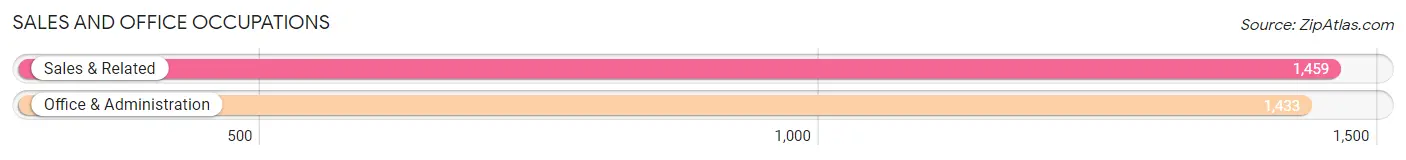
Sales and Office Occupations
The most common Sales and Office occupations in Michigan City are Sales & Related (1,459 | 11.2%), and Office & Administration (1,433 | 11.0%).
Sales and Office Occupations by Sex
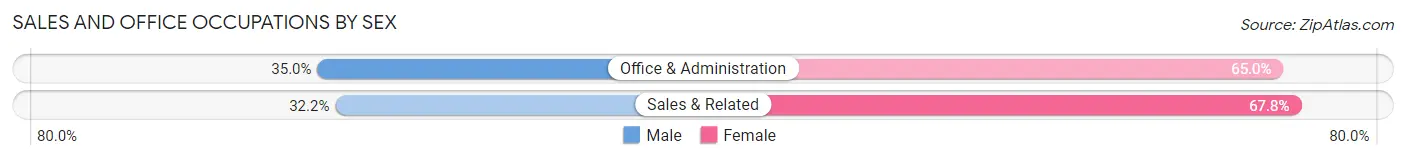
| Occupation | Male | Female |
| Sales & Related | 470 (32.2%) | 989 (67.8%) |
| Office & Administration | 501 (35.0%) | 932 (65.0%) |
| Total (Category) | 971 (33.6%) | 1,921 (66.4%) |
| Total (Overall) | 6,544 (50.3%) | 6,457 (49.7%) |
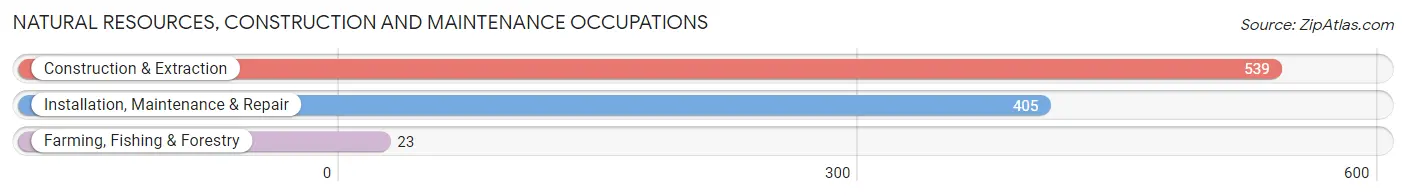
Natural Resources, Construction and Maintenance Occupations
The most common Natural Resources, Construction and Maintenance occupations in Michigan City are Construction & Extraction (539 | 4.2%), Installation, Maintenance & Repair (405 | 3.1%), and Farming, Fishing & Forestry (23 | 0.2%).
Natural Resources, Construction and Maintenance Occupations by Sex
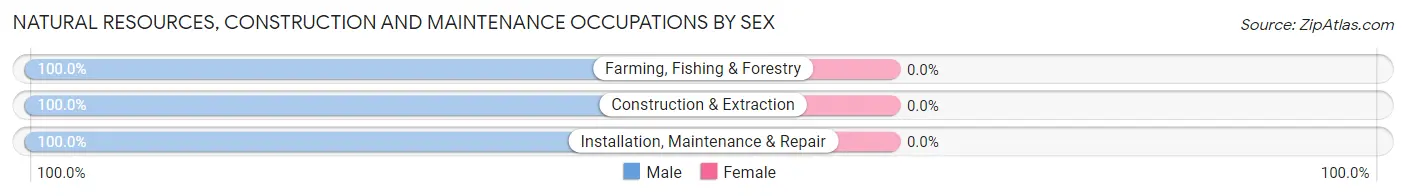
| Occupation | Male | Female |
| Farming, Fishing & Forestry | 23 (100.0%) | 0 (0.0%) |
| Construction & Extraction | 539 (100.0%) | 0 (0.0%) |
| Installation, Maintenance & Repair | 405 (100.0%) | 0 (0.0%) |
| Total (Category) | 967 (100.0%) | 0 (0.0%) |
| Total (Overall) | 6,544 (50.3%) | 6,457 (49.7%) |
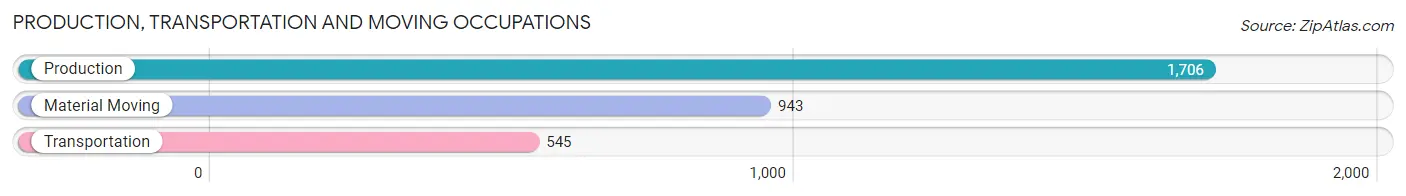
Production, Transportation and Moving Occupations
The most common Production, Transportation and Moving occupations in Michigan City are Production (1,706 | 13.1%), Material Moving (943 | 7.2%), and Transportation (545 | 4.2%).
Production, Transportation and Moving Occupations by Sex
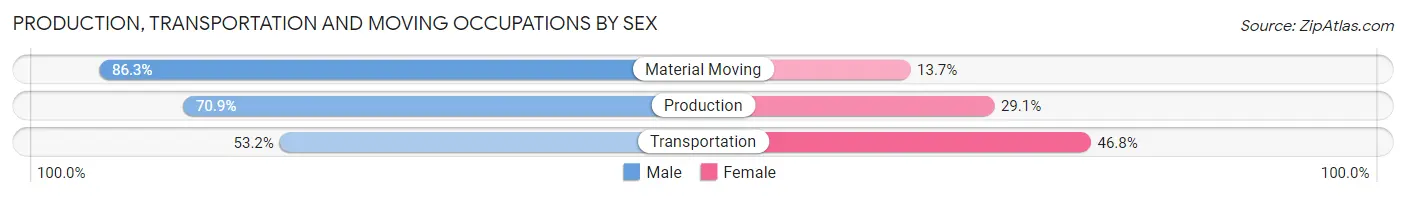
| Occupation | Male | Female |
| Production | 1,210 (70.9%) | 496 (29.1%) |
| Transportation | 290 (53.2%) | 255 (46.8%) |
| Material Moving | 814 (86.3%) | 129 (13.7%) |
| Total (Category) | 2,314 (72.5%) | 880 (27.6%) |
| Total (Overall) | 6,544 (50.3%) | 6,457 (49.7%) |
Employment Industries by Sex in Michigan City
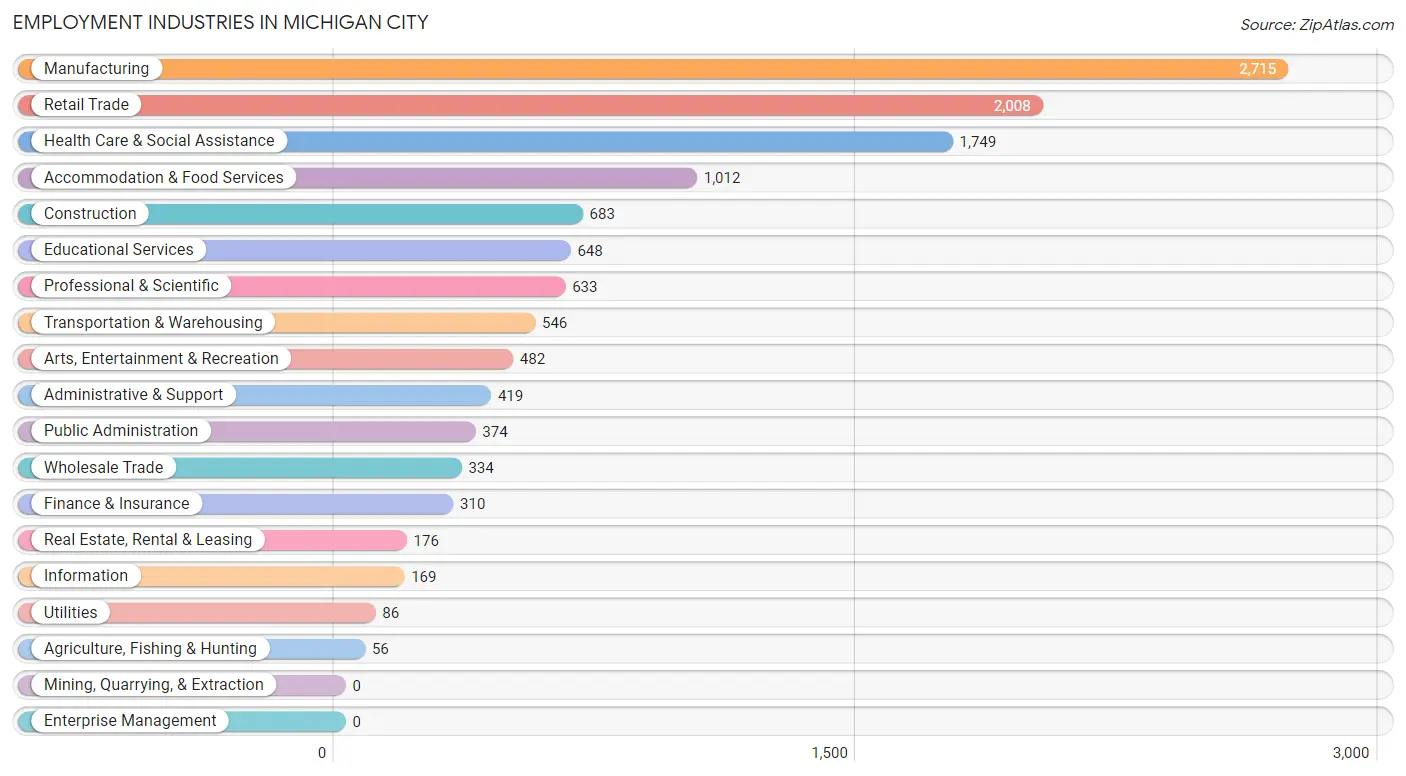
Employment Industries in Michigan City
The major employment industries in Michigan City include Manufacturing (2,715 | 20.9%), Retail Trade (2,008 | 15.4%), Health Care & Social Assistance (1,749 | 13.5%), Accommodation & Food Services (1,012 | 7.8%), and Construction (683 | 5.2%).
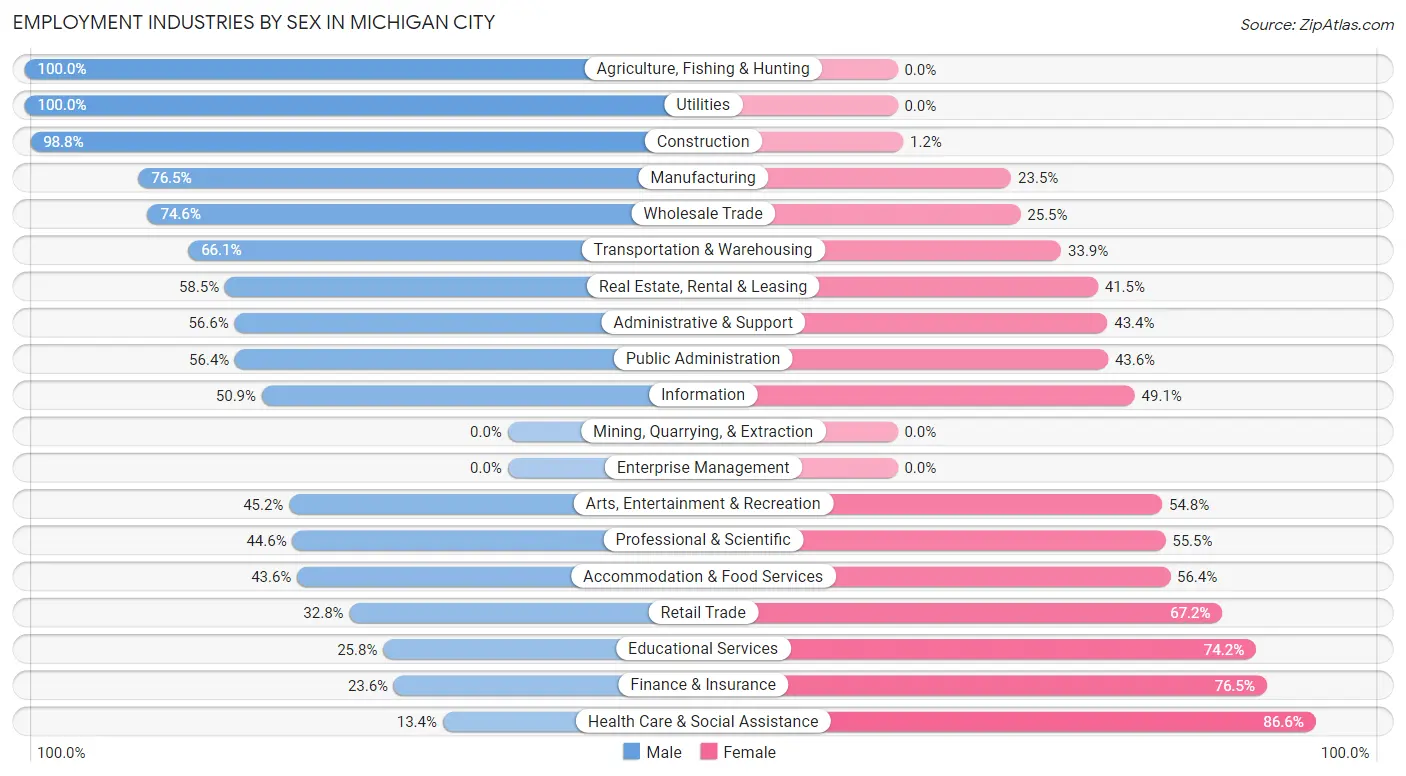
Employment Industries by Sex in Michigan City
The Michigan City industries that see more men than women are Agriculture, Fishing & Hunting (100.0%), Utilities (100.0%), and Construction (98.8%), whereas the industries that tend to have a higher number of women are Health Care & Social Assistance (86.6%), Finance & Insurance (76.4%), and Educational Services (74.2%).
| Industry | Male | Female |
| Agriculture, Fishing & Hunting | 56 (100.0%) | 0 (0.0%) |
| Mining, Quarrying, & Extraction | 0 (0.0%) | 0 (0.0%) |
| Construction | 675 (98.8%) | 8 (1.2%) |
| Manufacturing | 2,076 (76.5%) | 639 (23.5%) |
| Wholesale Trade | 249 (74.6%) | 85 (25.5%) |
| Retail Trade | 658 (32.8%) | 1,350 (67.2%) |
| Transportation & Warehousing | 361 (66.1%) | 185 (33.9%) |
| Utilities | 86 (100.0%) | 0 (0.0%) |
| Information | 86 (50.9%) | 83 (49.1%) |
| Finance & Insurance | 73 (23.5%) | 237 (76.4%) |
| Real Estate, Rental & Leasing | 103 (58.5%) | 73 (41.5%) |
| Professional & Scientific | 282 (44.6%) | 351 (55.4%) |
| Enterprise Management | 0 (0.0%) | 0 (0.0%) |
| Administrative & Support | 237 (56.6%) | 182 (43.4%) |
| Educational Services | 167 (25.8%) | 481 (74.2%) |
| Health Care & Social Assistance | 235 (13.4%) | 1,514 (86.6%) |
| Arts, Entertainment & Recreation | 218 (45.2%) | 264 (54.8%) |
| Accommodation & Food Services | 441 (43.6%) | 571 (56.4%) |
| Public Administration | 211 (56.4%) | 163 (43.6%) |
| Total | 6,544 (50.3%) | 6,457 (49.7%) |
Education in Michigan City
School Enrollment in Michigan City
The most common levels of schooling among the 6,257 students in Michigan City are elementary school (1,595 | 25.5%), middle school (1,534 | 24.5%), and high school (1,224 | 19.6%).
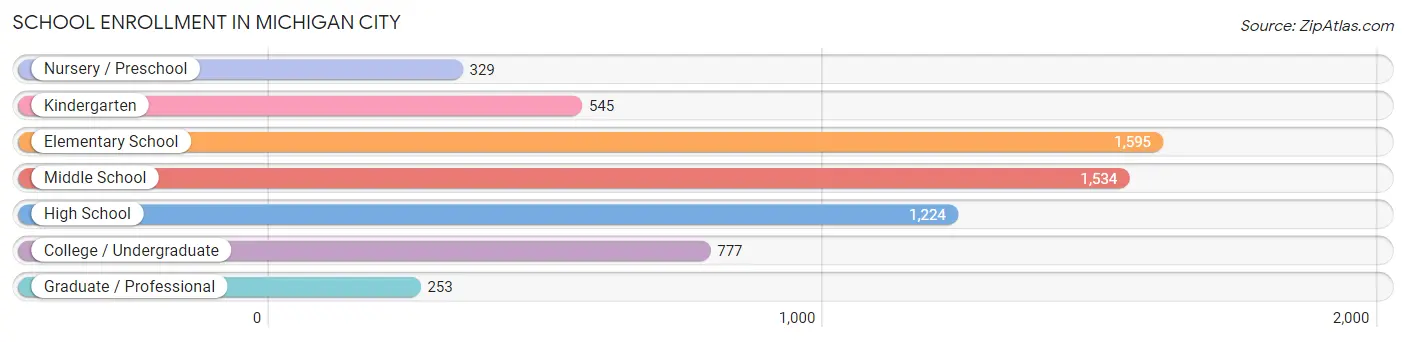
| School Level | # Students | % Students |
| Nursery / Preschool | 329 | 5.3% |
| Kindergarten | 545 | 8.7% |
| Elementary School | 1,595 | 25.5% |
| Middle School | 1,534 | 24.5% |
| High School | 1,224 | 19.6% |
| College / Undergraduate | 777 | 12.4% |
| Graduate / Professional | 253 | 4.0% |
| Total | 6,257 | 100.0% |
School Enrollment by Age by Funding Source in Michigan City
Out of a total of 6,257 students who are enrolled in schools in Michigan City, 688 (11.0%) attend a private institution, while the remaining 5,569 (89.0%) are enrolled in public schools. The age group of 3 to 4 year olds has the highest likelihood of being enrolled in private schools, with 123 (61.5% in the age bracket) enrolled. Conversely, the age group of 18 to 19 year olds has the lowest likelihood of being enrolled in a private school, with 267 (97.1% in the age bracket) attending a public institution.
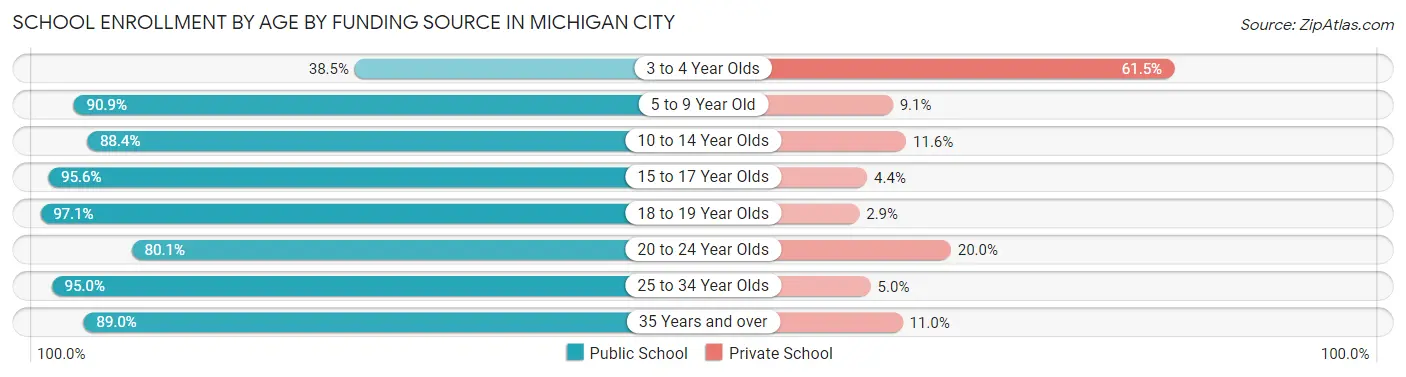
| Age Bracket | Public School | Private School |
| 3 to 4 Year Olds | 77 (38.5%) | 123 (61.5%) |
| 5 to 9 Year Old | 1,731 (90.9%) | 174 (9.1%) |
| 10 to 14 Year Olds | 1,671 (88.4%) | 220 (11.6%) |
| 15 to 17 Year Olds | 960 (95.6%) | 44 (4.4%) |
| 18 to 19 Year Olds | 267 (97.1%) | 8 (2.9%) |
| 20 to 24 Year Olds | 301 (80.0%) | 75 (20.0%) |
| 25 to 34 Year Olds | 359 (95.0%) | 19 (5.0%) |
| 35 Years and over | 203 (89.0%) | 25 (11.0%) |
| Total | 5,569 (89.0%) | 688 (11.0%) |
Educational Attainment by Field of Study in Michigan City
Business (801 | 18.7%), education (535 | 12.5%), liberal arts & history (496 | 11.6%), science & technology (492 | 11.5%), and arts & humanities (347 | 8.1%) are the most common fields of study among 4,287 individuals in Michigan City who have obtained a bachelor's degree or higher.
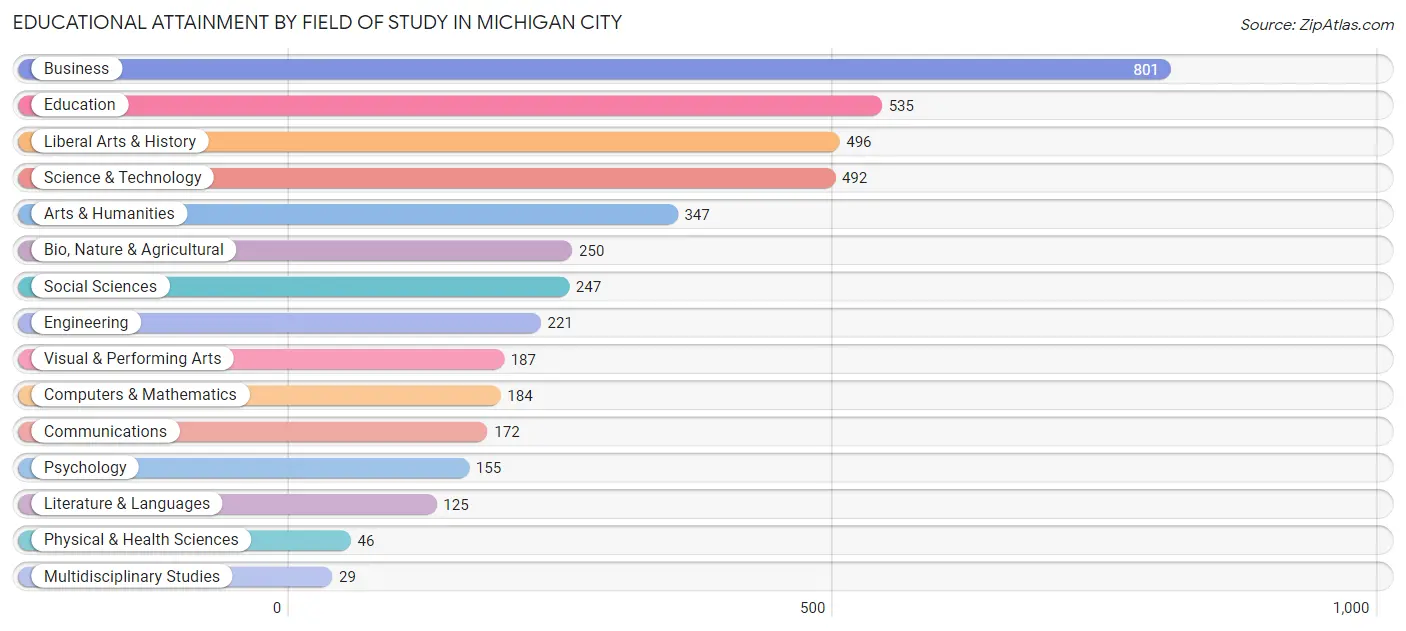
| Field of Study | # Graduates | % Graduates |
| Computers & Mathematics | 184 | 4.3% |
| Bio, Nature & Agricultural | 250 | 5.8% |
| Physical & Health Sciences | 46 | 1.1% |
| Psychology | 155 | 3.6% |
| Social Sciences | 247 | 5.8% |
| Engineering | 221 | 5.2% |
| Multidisciplinary Studies | 29 | 0.7% |
| Science & Technology | 492 | 11.5% |
| Business | 801 | 18.7% |
| Education | 535 | 12.5% |
| Literature & Languages | 125 | 2.9% |
| Liberal Arts & History | 496 | 11.6% |
| Visual & Performing Arts | 187 | 4.4% |
| Communications | 172 | 4.0% |
| Arts & Humanities | 347 | 8.1% |
| Total | 4,287 | 100.0% |
Transportation & Commute in Michigan City
Vehicle Availability by Sex in Michigan City
The most prevalent vehicle ownership categories in Michigan City are males with 2 vehicles (3,042, accounting for 47.4%) and females with 2 vehicles (2,845, making up 48.1%).
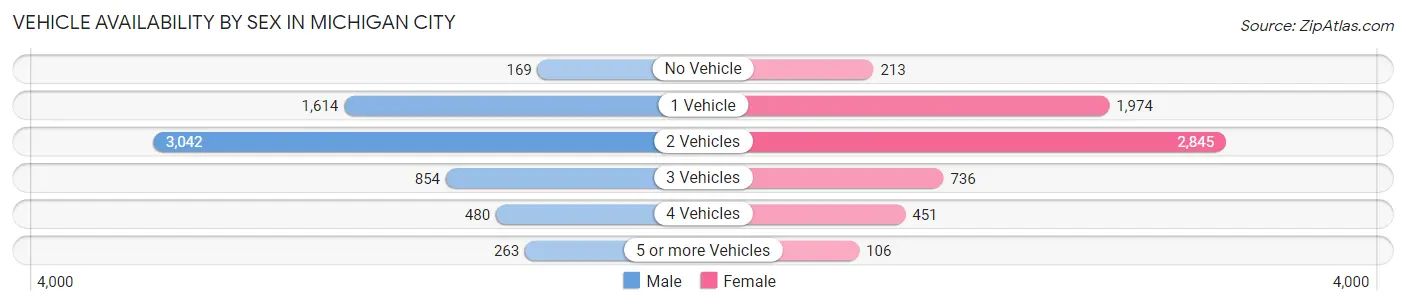
| Vehicles Available | Male | Female |
| No Vehicle | 169 (2.6%) | 213 (3.4%) |
| 1 Vehicle | 1,614 (25.1%) | 1,974 (31.2%) |
| 2 Vehicles | 3,042 (47.4%) | 2,845 (45.0%) |
| 3 Vehicles | 854 (13.3%) | 736 (11.6%) |
| 4 Vehicles | 480 (7.5%) | 451 (7.1%) |
| 5 or more Vehicles | 263 (4.1%) | 106 (1.7%) |
| Total | 6,422 (100.0%) | 6,325 (100.0%) |
Commute Time in Michigan City
The most frequently occuring commute durations in Michigan City are 10 to 14 minutes (2,957 commuters, 24.5%), 5 to 9 minutes (2,210 commuters, 18.3%), and 15 to 19 minutes (1,686 commuters, 14.0%).
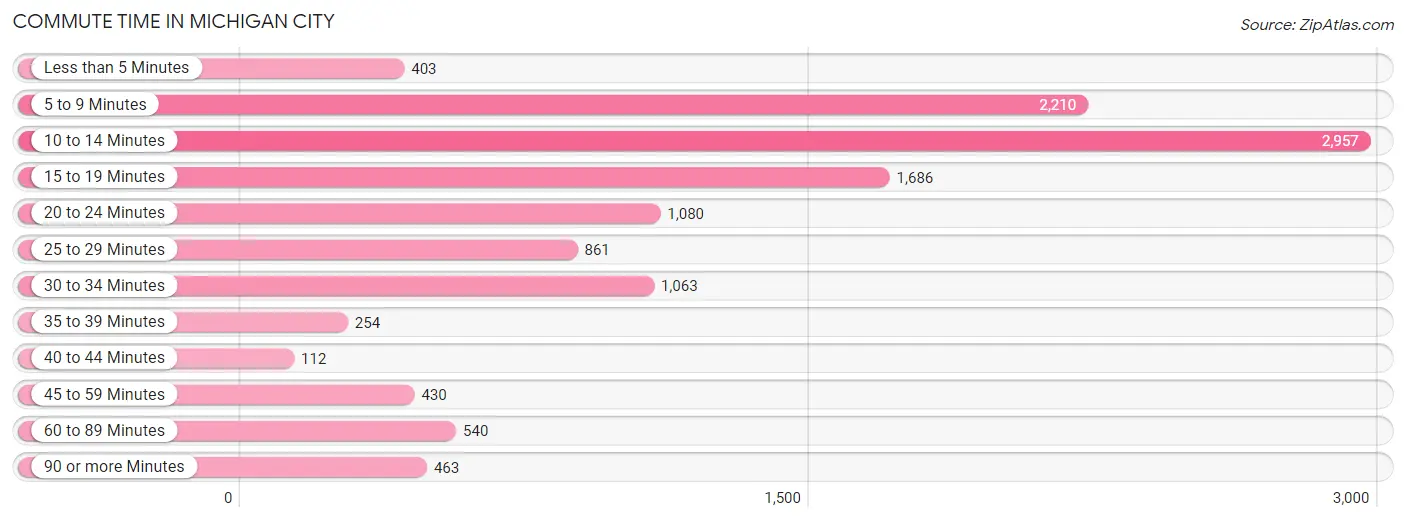
| Commute Time | # Commuters | % Commuters |
| Less than 5 Minutes | 403 | 3.3% |
| 5 to 9 Minutes | 2,210 | 18.3% |
| 10 to 14 Minutes | 2,957 | 24.5% |
| 15 to 19 Minutes | 1,686 | 14.0% |
| 20 to 24 Minutes | 1,080 | 9.0% |
| 25 to 29 Minutes | 861 | 7.1% |
| 30 to 34 Minutes | 1,063 | 8.8% |
| 35 to 39 Minutes | 254 | 2.1% |
| 40 to 44 Minutes | 112 | 0.9% |
| 45 to 59 Minutes | 430 | 3.6% |
| 60 to 89 Minutes | 540 | 4.5% |
| 90 or more Minutes | 463 | 3.8% |
Commute Time by Sex in Michigan City
The most common commute times in Michigan City are 10 to 14 minutes (1,529 commuters, 25.4%) for males and 5 to 9 minutes (1,494 commuters, 24.8%) for females.
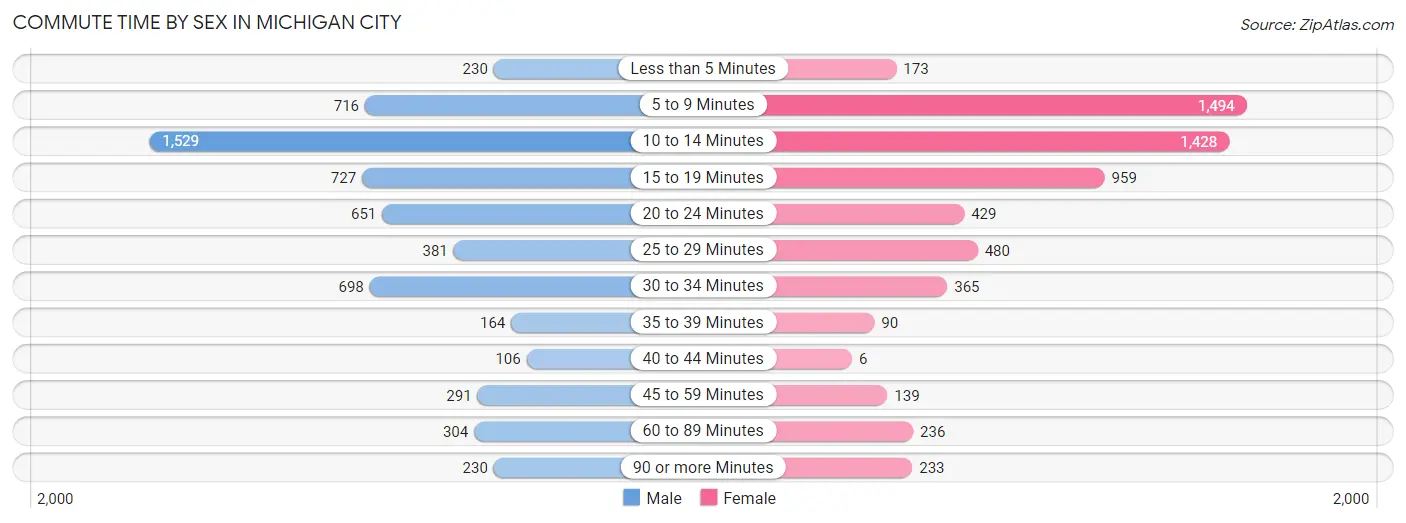
| Commute Time | Male | Female |
| Less than 5 Minutes | 230 (3.8%) | 173 (2.9%) |
| 5 to 9 Minutes | 716 (11.9%) | 1,494 (24.8%) |
| 10 to 14 Minutes | 1,529 (25.4%) | 1,428 (23.7%) |
| 15 to 19 Minutes | 727 (12.1%) | 959 (15.9%) |
| 20 to 24 Minutes | 651 (10.8%) | 429 (7.1%) |
| 25 to 29 Minutes | 381 (6.3%) | 480 (8.0%) |
| 30 to 34 Minutes | 698 (11.6%) | 365 (6.0%) |
| 35 to 39 Minutes | 164 (2.7%) | 90 (1.5%) |
| 40 to 44 Minutes | 106 (1.8%) | 6 (0.1%) |
| 45 to 59 Minutes | 291 (4.8%) | 139 (2.3%) |
| 60 to 89 Minutes | 304 (5.0%) | 236 (3.9%) |
| 90 or more Minutes | 230 (3.8%) | 233 (3.9%) |
Time of Departure to Work by Sex in Michigan City
The most frequent times of departure to work in Michigan City are 4:00 PM to 11:59 PM (913, 15.1%) for males and 7:00 AM to 7:29 AM (747, 12.4%) for females.
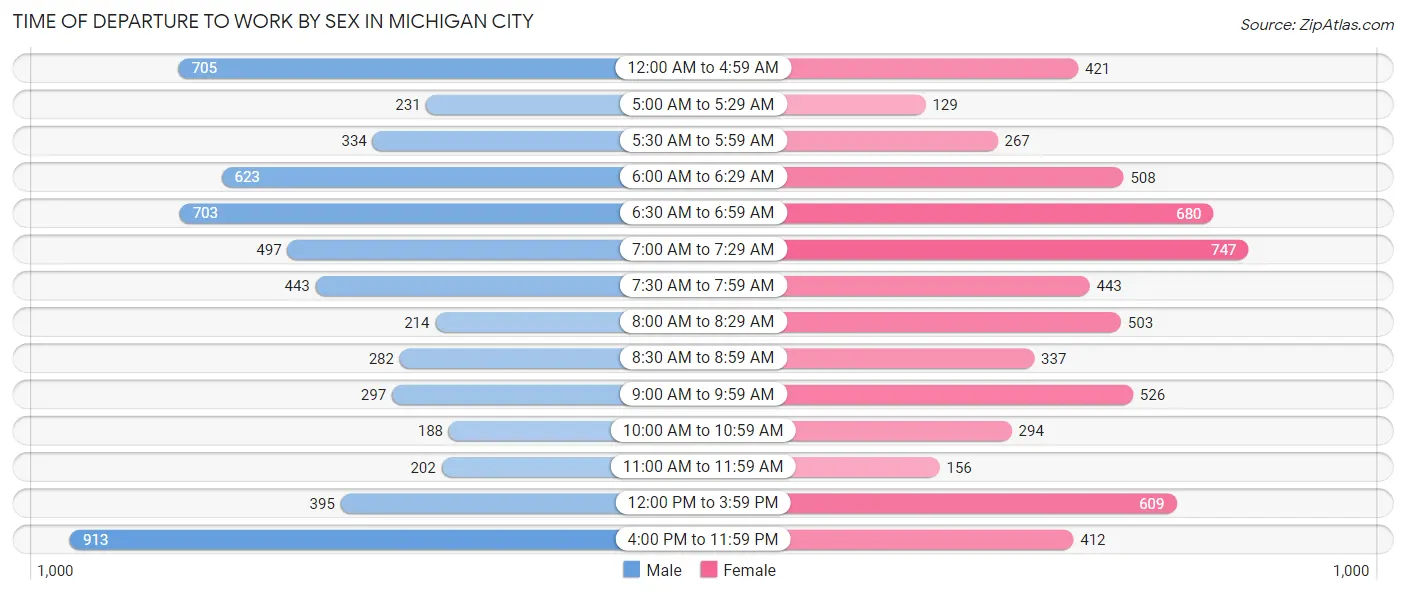
| Time of Departure | Male | Female |
| 12:00 AM to 4:59 AM | 705 (11.7%) | 421 (7.0%) |
| 5:00 AM to 5:29 AM | 231 (3.8%) | 129 (2.1%) |
| 5:30 AM to 5:59 AM | 334 (5.5%) | 267 (4.4%) |
| 6:00 AM to 6:29 AM | 623 (10.3%) | 508 (8.4%) |
| 6:30 AM to 6:59 AM | 703 (11.7%) | 680 (11.3%) |
| 7:00 AM to 7:29 AM | 497 (8.3%) | 747 (12.4%) |
| 7:30 AM to 7:59 AM | 443 (7.3%) | 443 (7.3%) |
| 8:00 AM to 8:29 AM | 214 (3.5%) | 503 (8.3%) |
| 8:30 AM to 8:59 AM | 282 (4.7%) | 337 (5.6%) |
| 9:00 AM to 9:59 AM | 297 (4.9%) | 526 (8.7%) |
| 10:00 AM to 10:59 AM | 188 (3.1%) | 294 (4.9%) |
| 11:00 AM to 11:59 AM | 202 (3.4%) | 156 (2.6%) |
| 12:00 PM to 3:59 PM | 395 (6.6%) | 609 (10.1%) |
| 4:00 PM to 11:59 PM | 913 (15.1%) | 412 (6.8%) |
| Total | 6,027 (100.0%) | 6,032 (100.0%) |
Housing Occupancy in Michigan City
Occupancy by Ownership in Michigan City
Of the total 12,408 dwellings in Michigan City, owner-occupied units account for 7,355 (59.3%), while renter-occupied units make up 5,053 (40.7%).
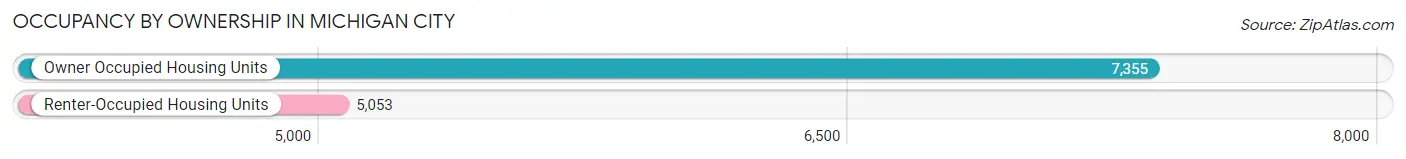
| Occupancy | # Housing Units | % Housing Units |
| Owner Occupied Housing Units | 7,355 | 59.3% |
| Renter-Occupied Housing Units | 5,053 | 40.7% |
| Total Occupied Housing Units | 12,408 | 100.0% |
Occupancy by Household Size in Michigan City
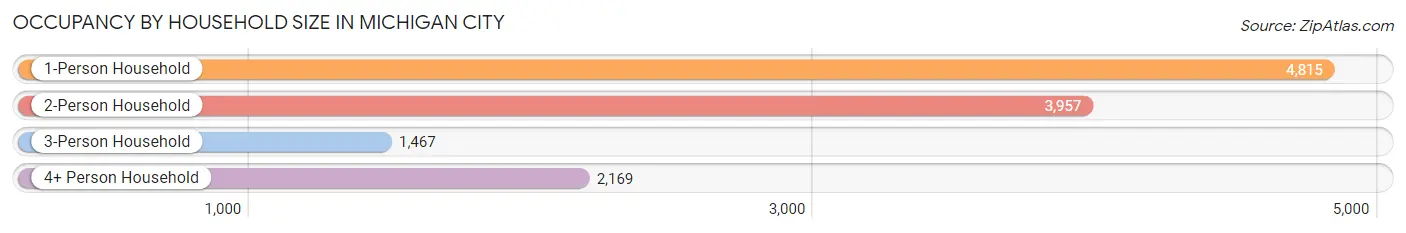
| Household Size | # Housing Units | % Housing Units |
| 1-Person Household | 4,815 | 38.8% |
| 2-Person Household | 3,957 | 31.9% |
| 3-Person Household | 1,467 | 11.8% |
| 4+ Person Household | 2,169 | 17.5% |
| Total Housing Units | 12,408 | 100.0% |
Occupancy by Ownership by Household Size in Michigan City
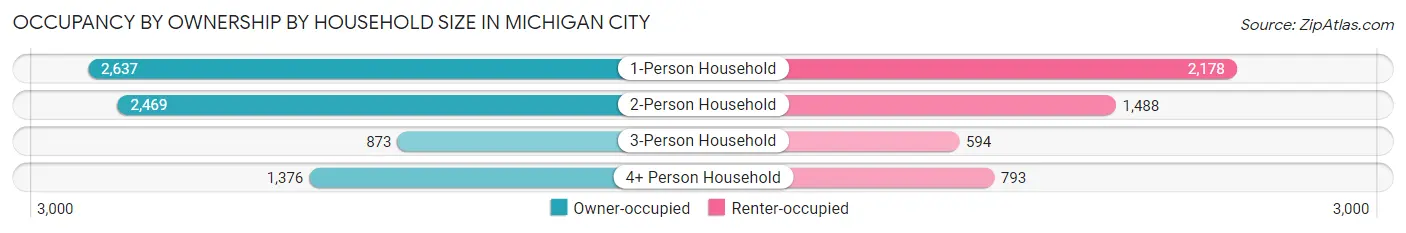
| Household Size | Owner-occupied | Renter-occupied |
| 1-Person Household | 2,637 (54.8%) | 2,178 (45.2%) |
| 2-Person Household | 2,469 (62.4%) | 1,488 (37.6%) |
| 3-Person Household | 873 (59.5%) | 594 (40.5%) |
| 4+ Person Household | 1,376 (63.4%) | 793 (36.6%) |
| Total Housing Units | 7,355 (59.3%) | 5,053 (40.7%) |
Occupancy by Educational Attainment in Michigan City
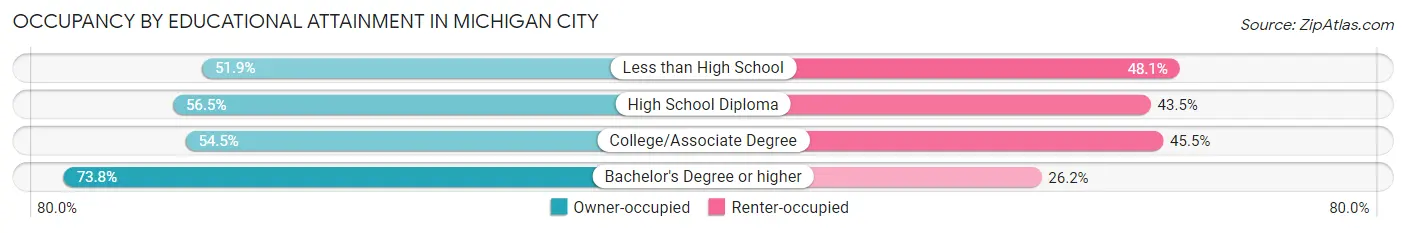
| Household Size | Owner-occupied | Renter-occupied |
| Less than High School | 488 (51.9%) | 453 (48.1%) |
| High School Diploma | 2,421 (56.5%) | 1,867 (43.5%) |
| College/Associate Degree | 2,402 (54.5%) | 2,007 (45.5%) |
| Bachelor's Degree or higher | 2,044 (73.8%) | 726 (26.2%) |
Occupancy by Age of Householder in Michigan City
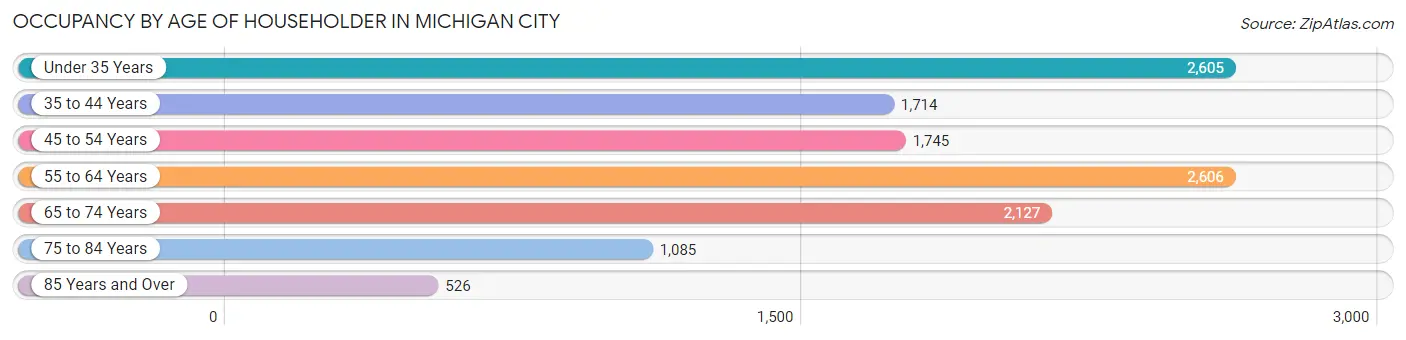
| Age Bracket | # Households | % Households |
| Under 35 Years | 2,605 | 21.0% |
| 35 to 44 Years | 1,714 | 13.8% |
| 45 to 54 Years | 1,745 | 14.1% |
| 55 to 64 Years | 2,606 | 21.0% |
| 65 to 74 Years | 2,127 | 17.1% |
| 75 to 84 Years | 1,085 | 8.7% |
| 85 Years and Over | 526 | 4.2% |
| Total | 12,408 | 100.0% |
Housing Finances in Michigan City
Median Income by Occupancy in Michigan City
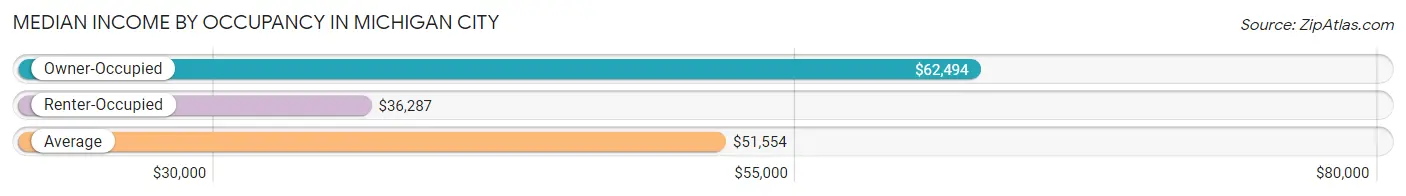
| Occupancy Type | # Households | Median Income |
| Owner-Occupied | 7,355 (59.3%) | $62,494 |
| Renter-Occupied | 5,053 (40.7%) | $36,287 |
| Average | 12,408 (100.0%) | $51,554 |
Occupancy by Householder Income Bracket in Michigan City
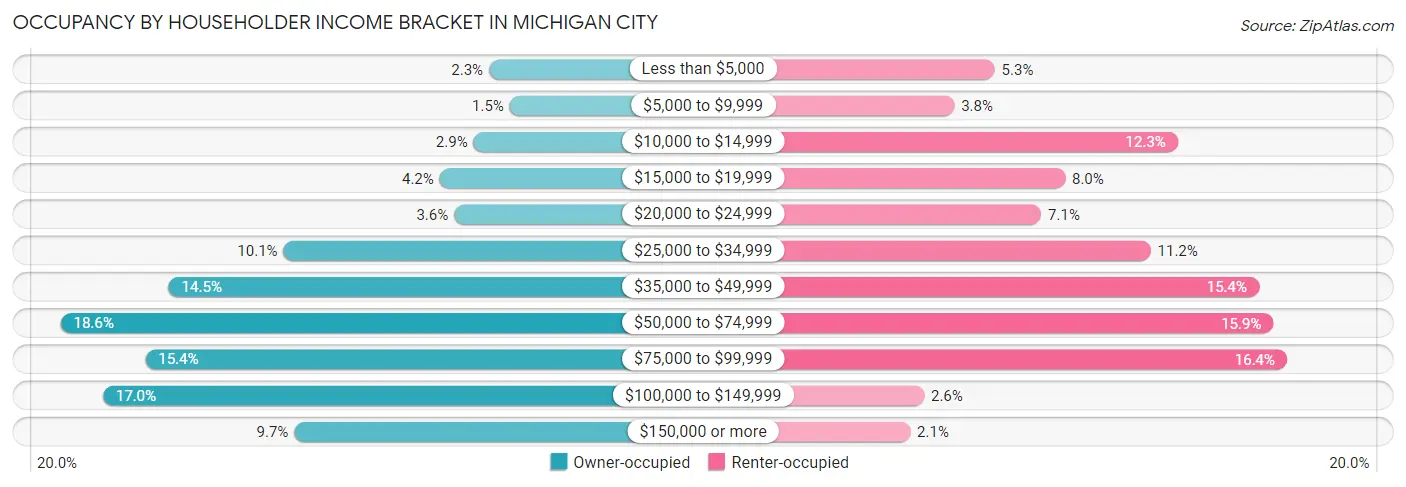
| Income Bracket | Owner-occupied | Renter-occupied |
| Less than $5,000 | 170 (2.3%) | 268 (5.3%) |
| $5,000 to $9,999 | 112 (1.5%) | 190 (3.8%) |
| $10,000 to $14,999 | 213 (2.9%) | 620 (12.3%) |
| $15,000 to $19,999 | 308 (4.2%) | 403 (8.0%) |
| $20,000 to $24,999 | 268 (3.6%) | 357 (7.1%) |
| $25,000 to $34,999 | 746 (10.1%) | 568 (11.2%) |
| $35,000 to $49,999 | 1,067 (14.5%) | 776 (15.4%) |
| $50,000 to $74,999 | 1,370 (18.6%) | 804 (15.9%) |
| $75,000 to $99,999 | 1,133 (15.4%) | 830 (16.4%) |
| $100,000 to $149,999 | 1,252 (17.0%) | 132 (2.6%) |
| $150,000 or more | 716 (9.7%) | 105 (2.1%) |
| Total | 7,355 (100.0%) | 5,053 (100.0%) |
Monthly Housing Cost Tiers in Michigan City
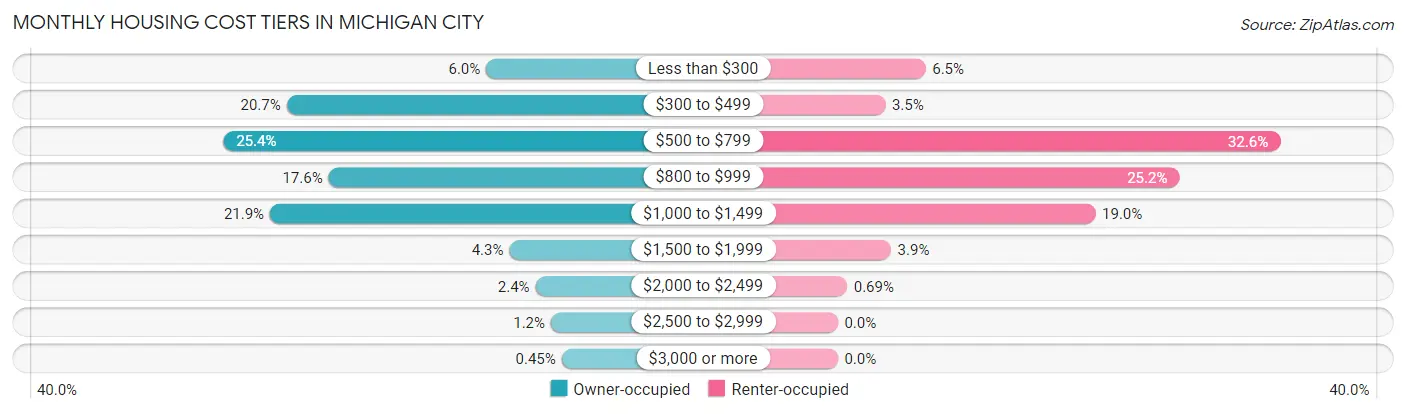
| Monthly Cost | Owner-occupied | Renter-occupied |
| Less than $300 | 442 (6.0%) | 327 (6.5%) |
| $300 to $499 | 1,523 (20.7%) | 177 (3.5%) |
| $500 to $799 | 1,866 (25.4%) | 1,647 (32.6%) |
| $800 to $999 | 1,296 (17.6%) | 1,272 (25.2%) |
| $1,000 to $1,499 | 1,613 (21.9%) | 959 (19.0%) |
| $1,500 to $1,999 | 316 (4.3%) | 198 (3.9%) |
| $2,000 to $2,499 | 175 (2.4%) | 35 (0.7%) |
| $2,500 to $2,999 | 91 (1.2%) | 0 (0.0%) |
| $3,000 or more | 33 (0.4%) | 0 (0.0%) |
| Total | 7,355 (100.0%) | 5,053 (100.0%) |
Physical Housing Characteristics in Michigan City
Housing Structures in Michigan City
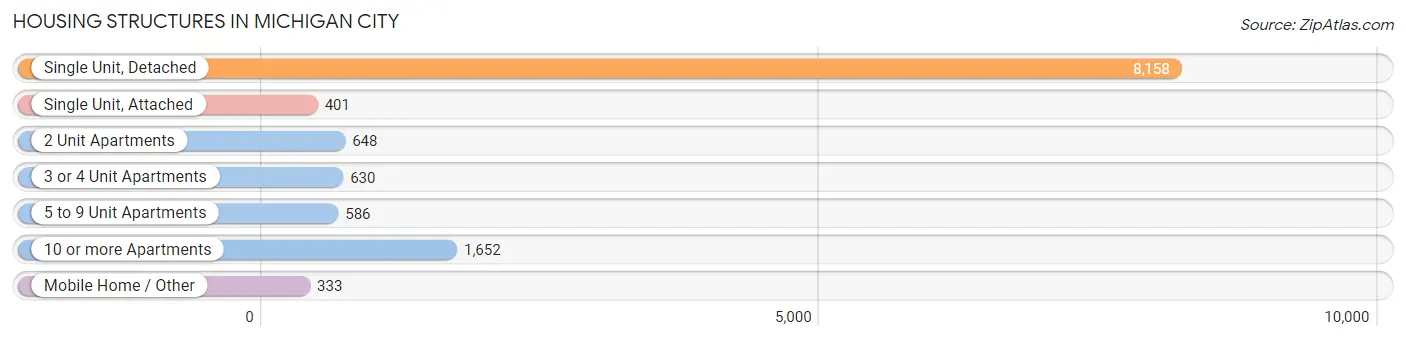
| Structure Type | # Housing Units | % Housing Units |
| Single Unit, Detached | 8,158 | 65.7% |
| Single Unit, Attached | 401 | 3.2% |
| 2 Unit Apartments | 648 | 5.2% |
| 3 or 4 Unit Apartments | 630 | 5.1% |
| 5 to 9 Unit Apartments | 586 | 4.7% |
| 10 or more Apartments | 1,652 | 13.3% |
| Mobile Home / Other | 333 | 2.7% |
| Total | 12,408 | 100.0% |
Housing Structures by Occupancy in Michigan City
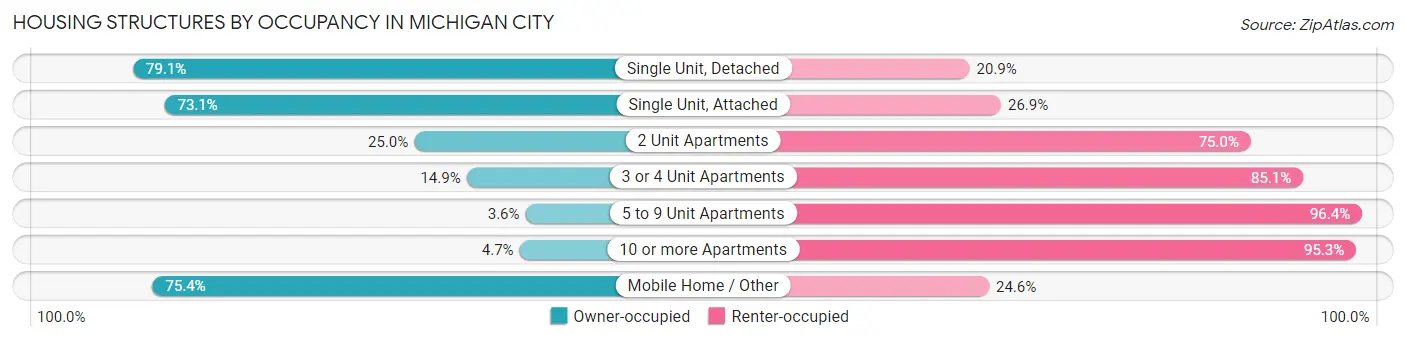
| Structure Type | Owner-occupied | Renter-occupied |
| Single Unit, Detached | 6,456 (79.1%) | 1,702 (20.9%) |
| Single Unit, Attached | 293 (73.1%) | 108 (26.9%) |
| 2 Unit Apartments | 162 (25.0%) | 486 (75.0%) |
| 3 or 4 Unit Apartments | 94 (14.9%) | 536 (85.1%) |
| 5 to 9 Unit Apartments | 21 (3.6%) | 565 (96.4%) |
| 10 or more Apartments | 78 (4.7%) | 1,574 (95.3%) |
| Mobile Home / Other | 251 (75.4%) | 82 (24.6%) |
| Total | 7,355 (59.3%) | 5,053 (40.7%) |
Housing Structures by Number of Rooms in Michigan City
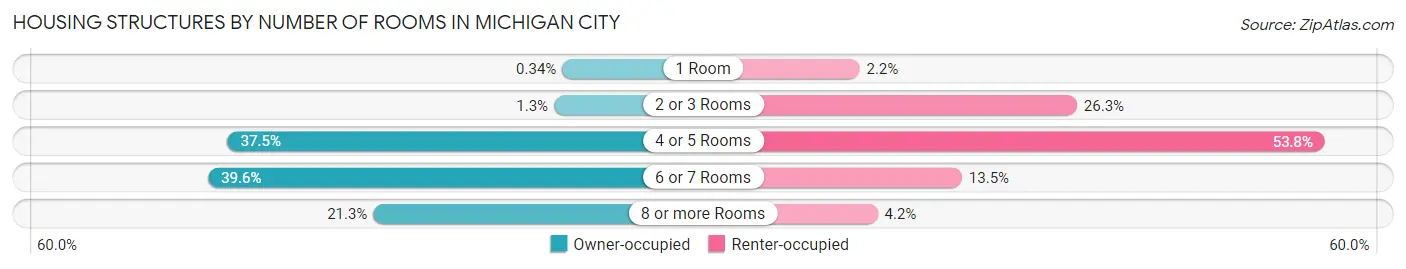
| Number of Rooms | Owner-occupied | Renter-occupied |
| 1 Room | 25 (0.3%) | 110 (2.2%) |
| 2 or 3 Rooms | 92 (1.3%) | 1,329 (26.3%) |
| 4 or 5 Rooms | 2,756 (37.5%) | 2,719 (53.8%) |
| 6 or 7 Rooms | 2,915 (39.6%) | 684 (13.5%) |
| 8 or more Rooms | 1,567 (21.3%) | 211 (4.2%) |
| Total | 7,355 (100.0%) | 5,053 (100.0%) |
Housing Structure by Heating Type in Michigan City
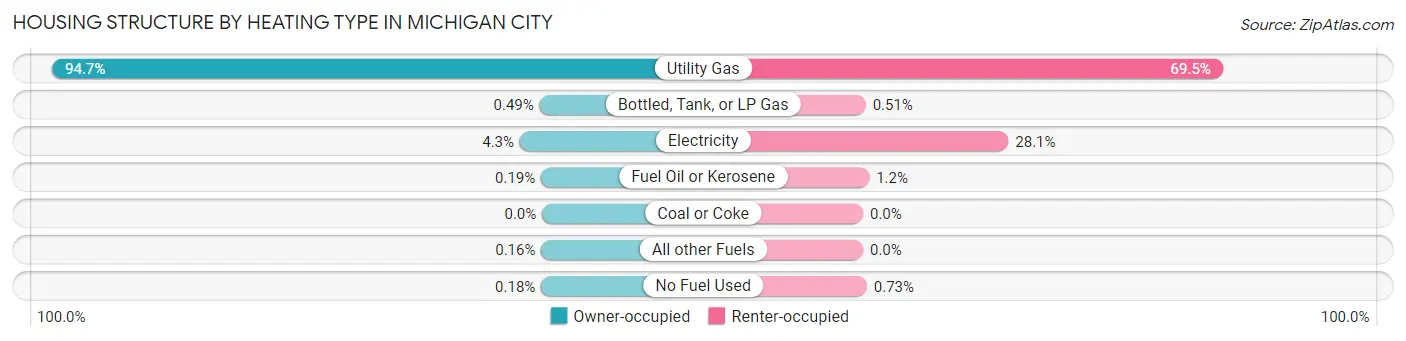
| Heating Type | Owner-occupied | Renter-occupied |
| Utility Gas | 6,964 (94.7%) | 3,511 (69.5%) |
| Bottled, Tank, or LP Gas | 36 (0.5%) | 26 (0.5%) |
| Electricity | 316 (4.3%) | 1,419 (28.1%) |
| Fuel Oil or Kerosene | 14 (0.2%) | 60 (1.2%) |
| Coal or Coke | 0 (0.0%) | 0 (0.0%) |
| All other Fuels | 12 (0.2%) | 0 (0.0%) |
| No Fuel Used | 13 (0.2%) | 37 (0.7%) |
| Total | 7,355 (100.0%) | 5,053 (100.0%) |
Household Vehicle Usage in Michigan City
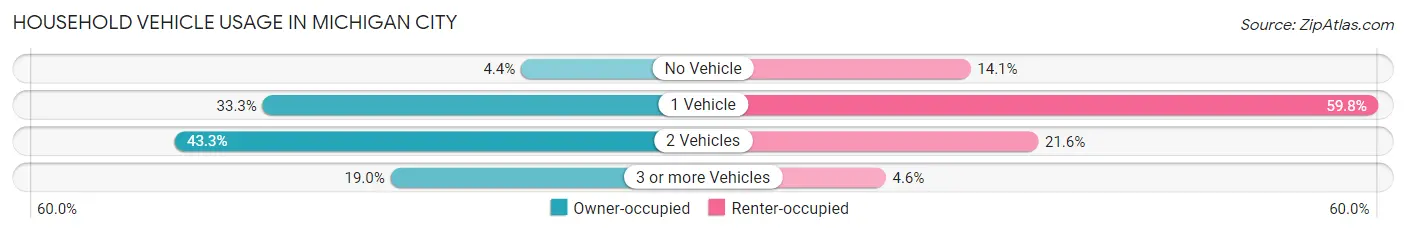
| Vehicles per Household | Owner-occupied | Renter-occupied |
| No Vehicle | 323 (4.4%) | 710 (14.1%) |
| 1 Vehicle | 2,452 (33.3%) | 3,020 (59.8%) |
| 2 Vehicles | 3,182 (43.3%) | 1,093 (21.6%) |
| 3 or more Vehicles | 1,398 (19.0%) | 230 (4.5%) |
| Total | 7,355 (100.0%) | 5,053 (100.0%) |
Real Estate & Mortgages in Michigan City
Real Estate and Mortgage Overview in Michigan City
| Characteristic | Without Mortgage | With Mortgage |
| Housing Units | 3,125 | 4,230 |
| Median Property Value | $98,500 | $127,900 |
| Median Household Income | $49,902 | $506 |
| Monthly Housing Costs | $454 | $33 |
| Real Estate Taxes | $1,067 | $85 |
Property Value by Mortgage Status in Michigan City
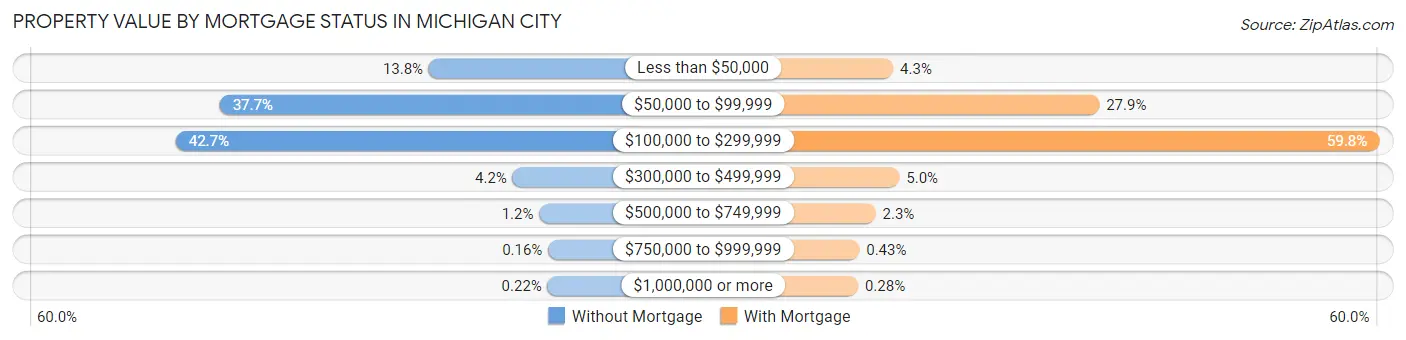
| Property Value | Without Mortgage | With Mortgage |
| Less than $50,000 | 431 (13.8%) | 182 (4.3%) |
| $50,000 to $99,999 | 1,178 (37.7%) | 1,178 (27.9%) |
| $100,000 to $299,999 | 1,335 (42.7%) | 2,531 (59.8%) |
| $300,000 to $499,999 | 132 (4.2%) | 212 (5.0%) |
| $500,000 to $749,999 | 37 (1.2%) | 97 (2.3%) |
| $750,000 to $999,999 | 5 (0.2%) | 18 (0.4%) |
| $1,000,000 or more | 7 (0.2%) | 12 (0.3%) |
| Total | 3,125 (100.0%) | 4,230 (100.0%) |
Household Income by Mortgage Status in Michigan City
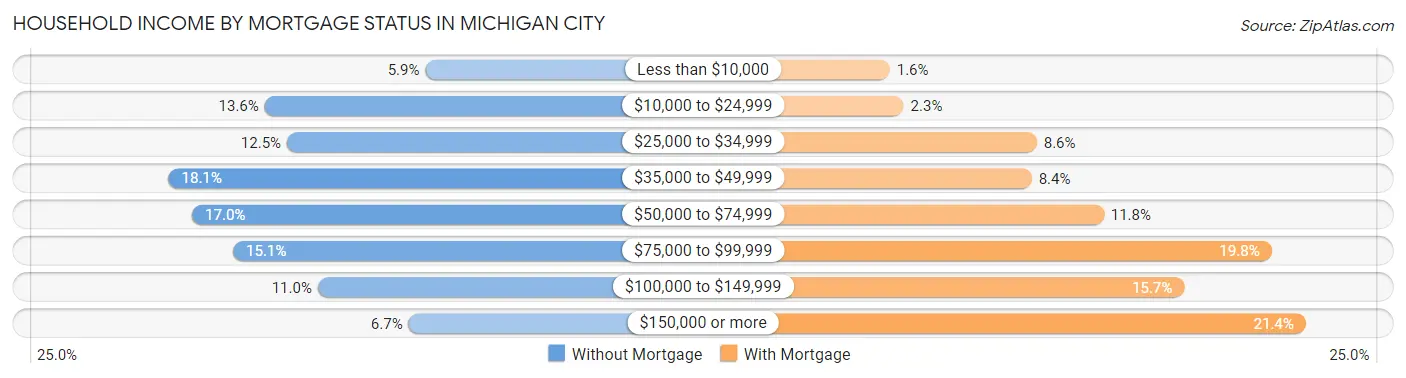
| Household Income | Without Mortgage | With Mortgage |
| Less than $10,000 | 185 (5.9%) | 69 (1.6%) |
| $10,000 to $24,999 | 424 (13.6%) | 97 (2.3%) |
| $25,000 to $34,999 | 391 (12.5%) | 365 (8.6%) |
| $35,000 to $49,999 | 567 (18.1%) | 355 (8.4%) |
| $50,000 to $74,999 | 532 (17.0%) | 500 (11.8%) |
| $75,000 to $99,999 | 471 (15.1%) | 838 (19.8%) |
| $100,000 to $149,999 | 345 (11.0%) | 662 (15.7%) |
| $150,000 or more | 210 (6.7%) | 907 (21.4%) |
| Total | 3,125 (100.0%) | 4,230 (100.0%) |
Property Value to Household Income Ratio in Michigan City
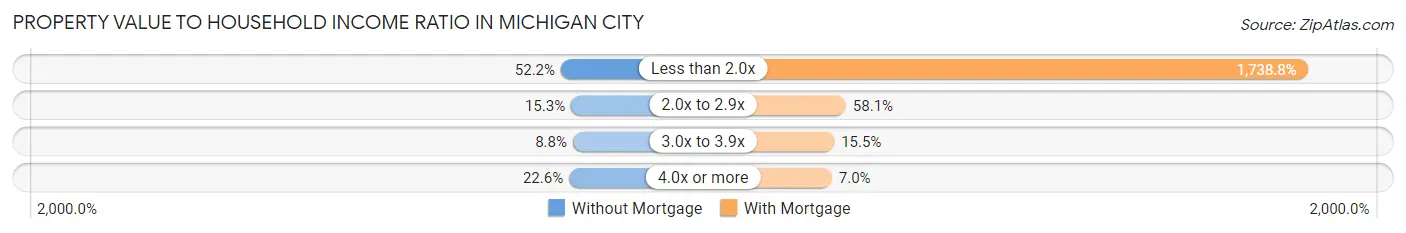
| Value-to-Income Ratio | Without Mortgage | With Mortgage |
| Less than 2.0x | 1,632 (52.2%) | 73,551 (1,738.8%) |
| 2.0x to 2.9x | 479 (15.3%) | 2,457 (58.1%) |
| 3.0x to 3.9x | 274 (8.8%) | 656 (15.5%) |
| 4.0x or more | 706 (22.6%) | 295 (7.0%) |
| Total | 3,125 (100.0%) | 4,230 (100.0%) |
Real Estate Taxes by Mortgage Status in Michigan City
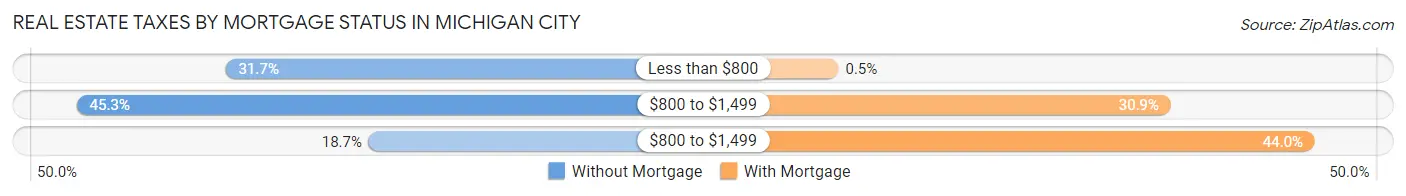
| Property Taxes | Without Mortgage | With Mortgage |
| Less than $800 | 989 (31.7%) | 21 (0.5%) |
| $800 to $1,499 | 1,414 (45.3%) | 1,305 (30.8%) |
| $800 to $1,499 | 583 (18.7%) | 1,861 (44.0%) |
| Total | 3,125 (100.0%) | 4,230 (100.0%) |
Health & Disability in Michigan City
Health Insurance Coverage by Age in Michigan City
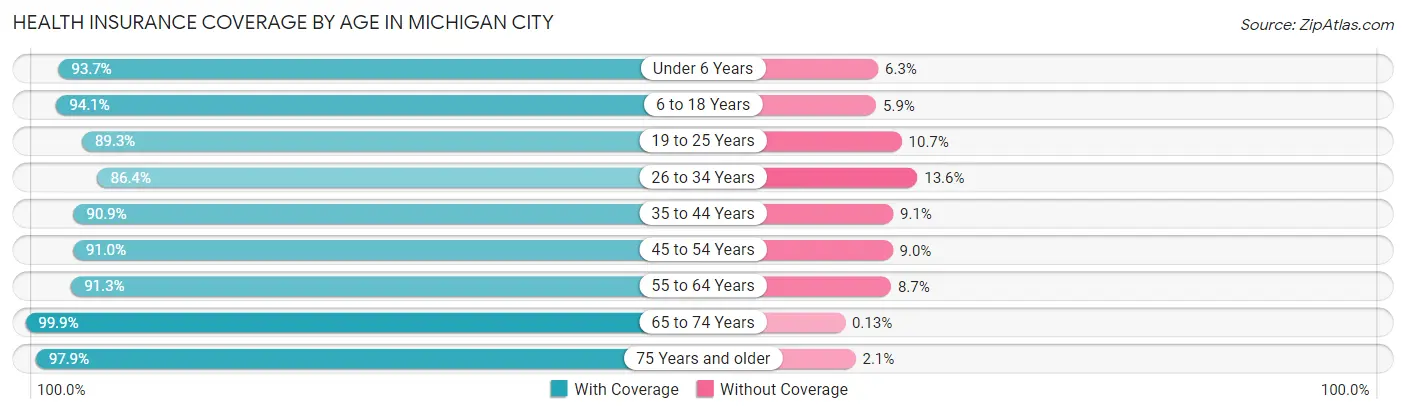
| Age Bracket | With Coverage | Without Coverage |
| Under 6 Years | 2,228 (93.7%) | 150 (6.3%) |
| 6 to 18 Years | 4,697 (94.1%) | 296 (5.9%) |
| 19 to 25 Years | 2,681 (89.3%) | 321 (10.7%) |
| 26 to 34 Years | 3,075 (86.4%) | 485 (13.6%) |
| 35 to 44 Years | 2,938 (90.9%) | 294 (9.1%) |
| 45 to 54 Years | 2,832 (91.0%) | 280 (9.0%) |
| 55 to 64 Years | 3,516 (91.3%) | 335 (8.7%) |
| 65 to 74 Years | 3,148 (99.9%) | 4 (0.1%) |
| 75 Years and older | 2,005 (97.9%) | 43 (2.1%) |
| Total | 27,120 (92.5%) | 2,208 (7.5%) |
Health Insurance Coverage by Citizenship Status in Michigan City
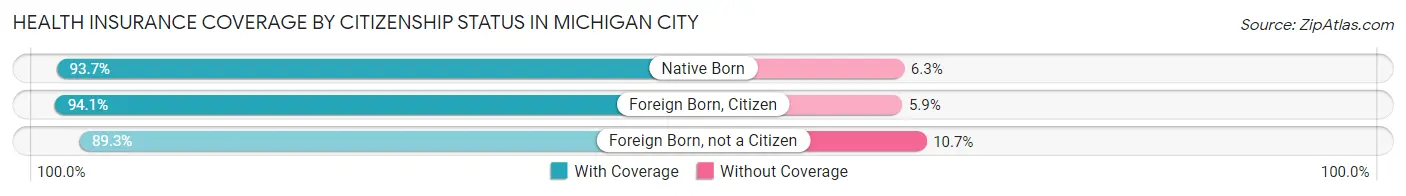
| Citizenship Status | With Coverage | Without Coverage |
| Native Born | 2,228 (93.7%) | 150 (6.3%) |
| Foreign Born, Citizen | 4,697 (94.1%) | 296 (5.9%) |
| Foreign Born, not a Citizen | 2,681 (89.3%) | 321 (10.7%) |
Health Insurance Coverage by Household Income in Michigan City
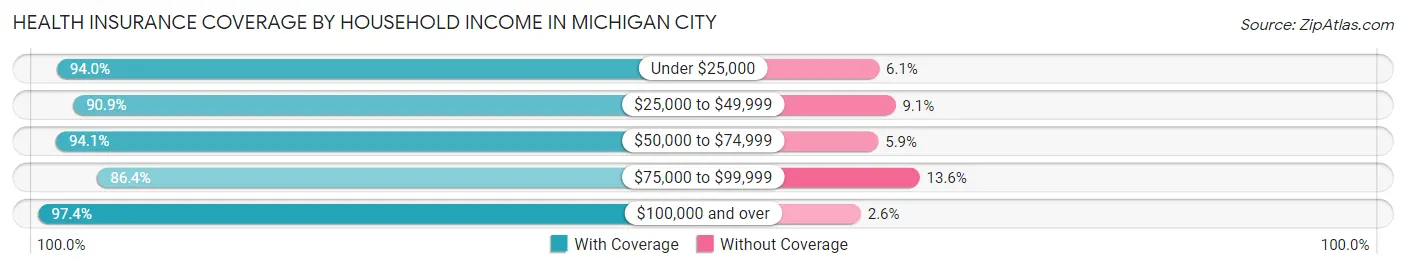
| Household Income | With Coverage | Without Coverage |
| Under $25,000 | 5,463 (94.0%) | 352 (6.0%) |
| $25,000 to $49,999 | 5,468 (90.9%) | 549 (9.1%) |
| $50,000 to $74,999 | 4,861 (94.1%) | 305 (5.9%) |
| $75,000 to $99,999 | 5,040 (86.4%) | 796 (13.6%) |
| $100,000 and over | 6,196 (97.4%) | 167 (2.6%) |
Public vs Private Health Insurance Coverage by Age in Michigan City
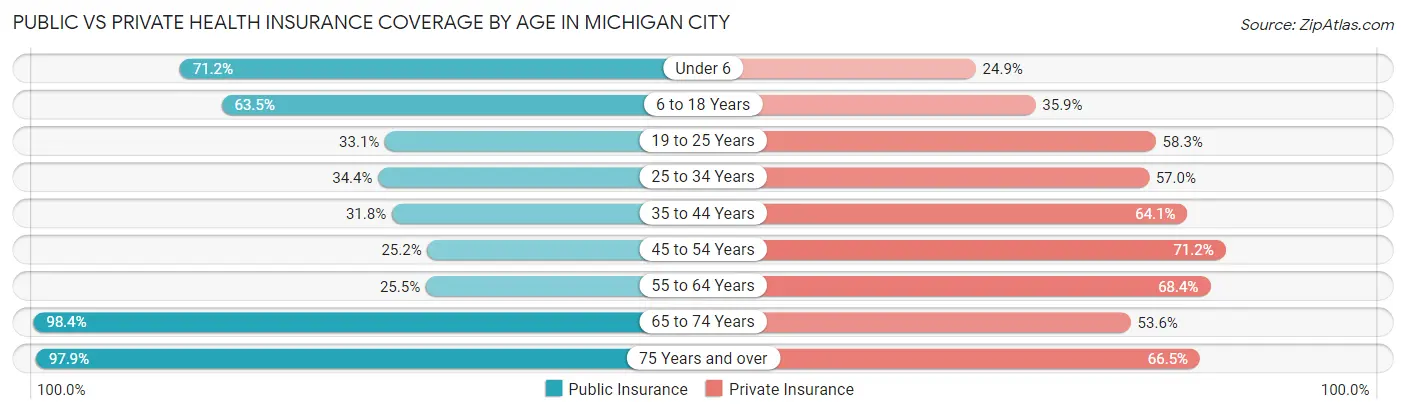
| Age Bracket | Public Insurance | Private Insurance |
| Under 6 | 1,693 (71.2%) | 591 (24.8%) |
| 6 to 18 Years | 3,168 (63.4%) | 1,794 (35.9%) |
| 19 to 25 Years | 993 (33.1%) | 1,749 (58.3%) |
| 25 to 34 Years | 1,223 (34.4%) | 2,028 (57.0%) |
| 35 to 44 Years | 1,028 (31.8%) | 2,073 (64.1%) |
| 45 to 54 Years | 785 (25.2%) | 2,216 (71.2%) |
| 55 to 64 Years | 982 (25.5%) | 2,633 (68.4%) |
| 65 to 74 Years | 3,101 (98.4%) | 1,690 (53.6%) |
| 75 Years and over | 2,005 (97.9%) | 1,361 (66.5%) |
| Total | 14,978 (51.1%) | 16,135 (55.0%) |
Disability Status by Sex by Age in Michigan City
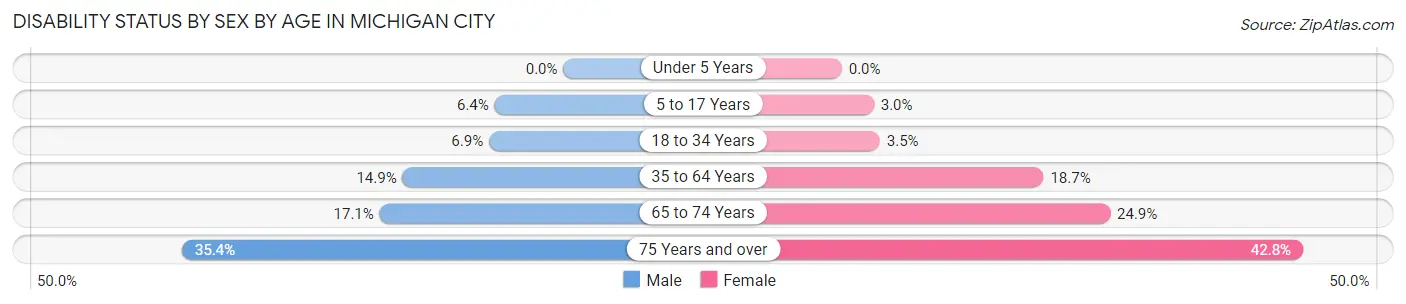
| Age Bracket | Male | Female |
| Under 5 Years | 0 (0.0%) | 0 (0.0%) |
| 5 to 17 Years | 169 (6.4%) | 71 (3.0%) |
| 18 to 34 Years | 251 (6.9%) | 117 (3.5%) |
| 35 to 64 Years | 699 (14.9%) | 1,032 (18.7%) |
| 65 to 74 Years | 247 (17.1%) | 424 (24.9%) |
| 75 Years and over | 251 (35.4%) | 573 (42.8%) |
Disability Class by Sex by Age in Michigan City
Disability Class: Hearing Difficulty
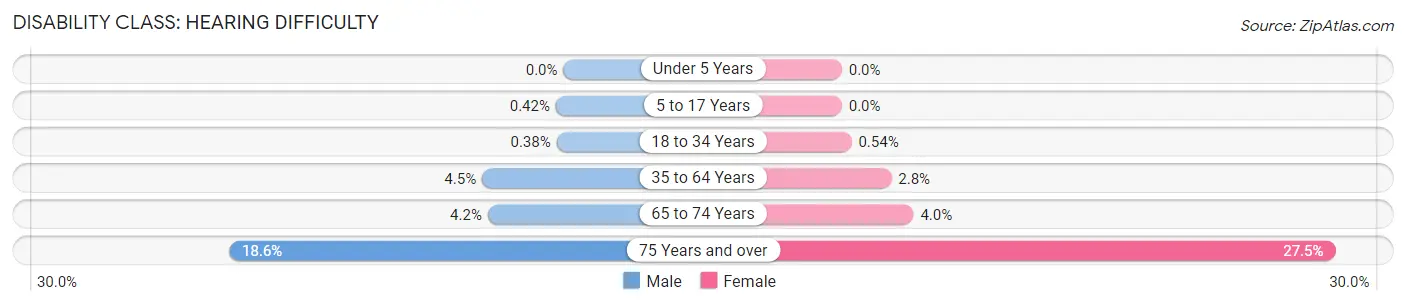
| Age Bracket | Male | Female |
| Under 5 Years | 0 (0.0%) | 0 (0.0%) |
| 5 to 17 Years | 11 (0.4%) | 0 (0.0%) |
| 18 to 34 Years | 14 (0.4%) | 18 (0.5%) |
| 35 to 64 Years | 212 (4.5%) | 152 (2.8%) |
| 65 to 74 Years | 61 (4.2%) | 68 (4.0%) |
| 75 Years and over | 132 (18.6%) | 368 (27.5%) |
Disability Class: Vision Difficulty
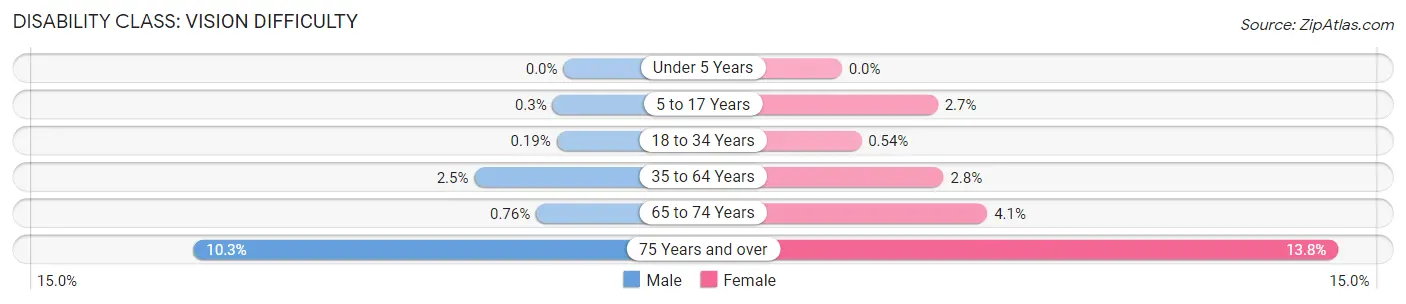
| Age Bracket | Male | Female |
| Under 5 Years | 0 (0.0%) | 0 (0.0%) |
| 5 to 17 Years | 8 (0.3%) | 64 (2.7%) |
| 18 to 34 Years | 7 (0.2%) | 18 (0.5%) |
| 35 to 64 Years | 116 (2.5%) | 156 (2.8%) |
| 65 to 74 Years | 11 (0.8%) | 69 (4.1%) |
| 75 Years and over | 73 (10.3%) | 185 (13.8%) |
Disability Class: Cognitive Difficulty
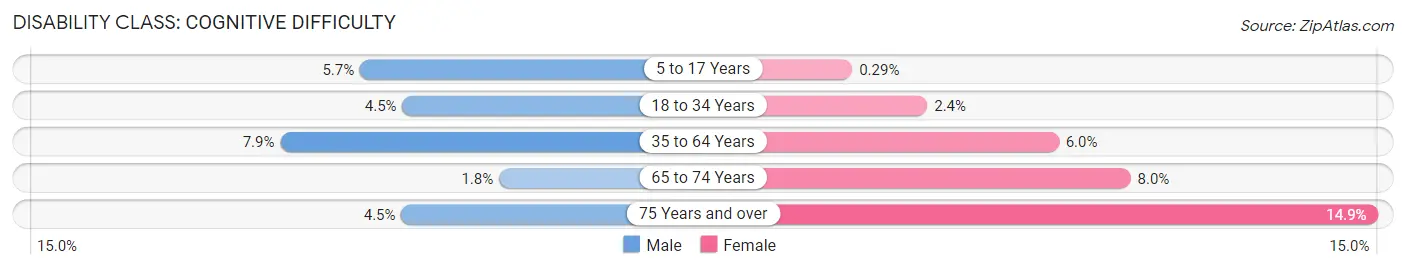
| Age Bracket | Male | Female |
| 5 to 17 Years | 150 (5.7%) | 7 (0.3%) |
| 18 to 34 Years | 163 (4.5%) | 79 (2.4%) |
| 35 to 64 Years | 369 (7.9%) | 333 (6.0%) |
| 65 to 74 Years | 26 (1.8%) | 137 (8.0%) |
| 75 Years and over | 32 (4.5%) | 200 (14.9%) |
Disability Class: Ambulatory Difficulty
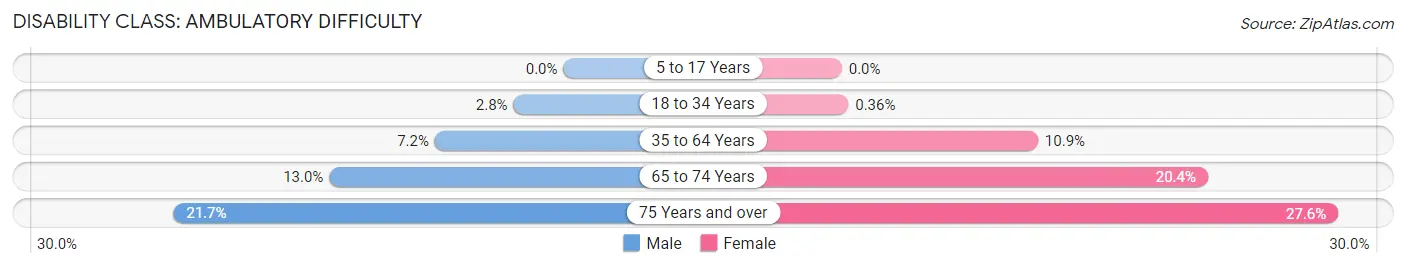
| Age Bracket | Male | Female |
| 5 to 17 Years | 0 (0.0%) | 0 (0.0%) |
| 18 to 34 Years | 101 (2.8%) | 12 (0.4%) |
| 35 to 64 Years | 335 (7.2%) | 602 (10.9%) |
| 65 to 74 Years | 189 (13.0%) | 347 (20.4%) |
| 75 Years and over | 154 (21.7%) | 370 (27.6%) |
Disability Class: Self-Care Difficulty
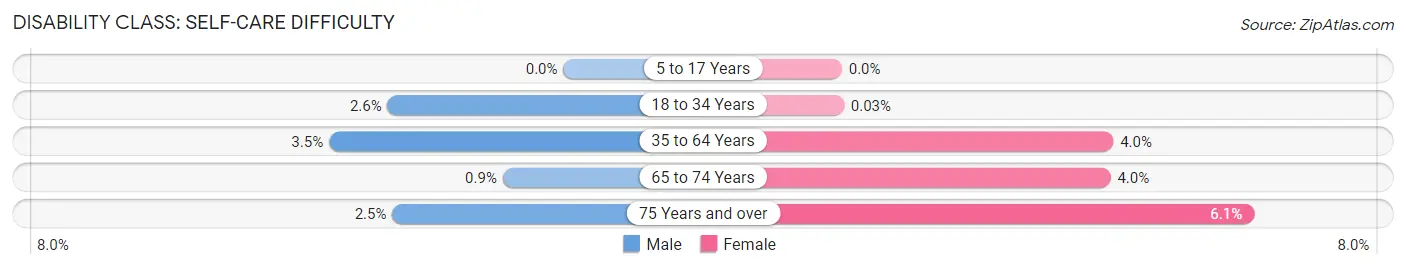
| Age Bracket | Male | Female |
| 5 to 17 Years | 0 (0.0%) | 0 (0.0%) |
| 18 to 34 Years | 95 (2.6%) | 1 (0.0%) |
| 35 to 64 Years | 163 (3.5%) | 222 (4.0%) |
| 65 to 74 Years | 13 (0.9%) | 68 (4.0%) |
| 75 Years and over | 18 (2.5%) | 82 (6.1%) |
Technology Access in Michigan City
Computing Device Access in Michigan City
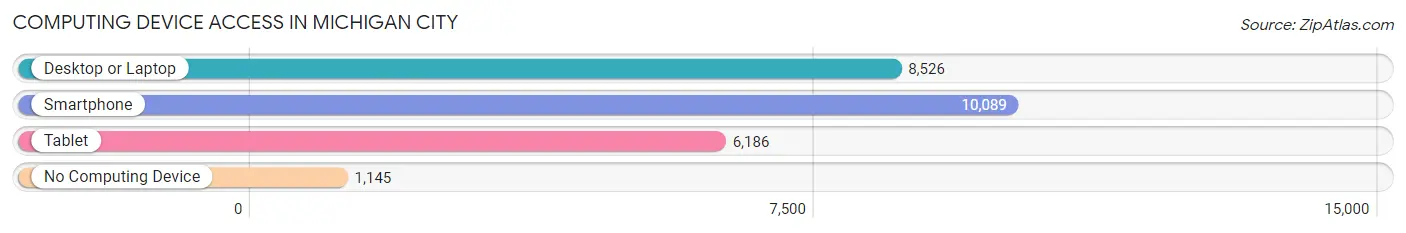
| Device Type | # Households | % Households |
| Desktop or Laptop | 8,526 | 68.7% |
| Smartphone | 10,089 | 81.3% |
| Tablet | 6,186 | 49.8% |
| No Computing Device | 1,145 | 9.2% |
| Total | 12,408 | 100.0% |
Internet Access in Michigan City
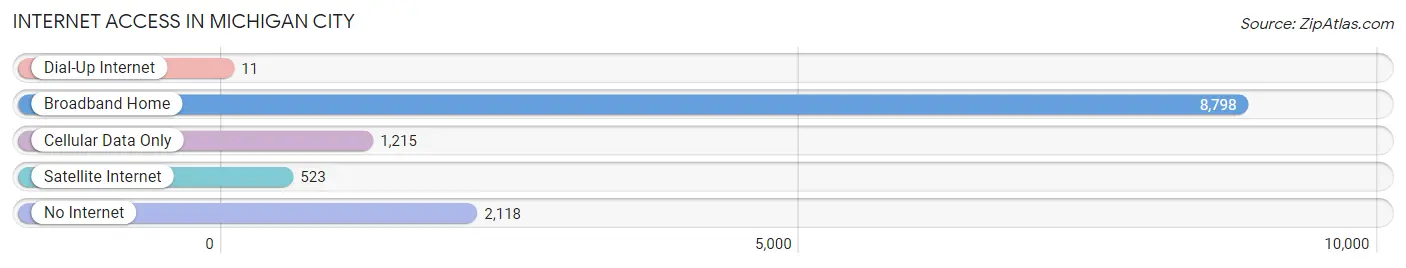
| Internet Type | # Households | % Households |
| Dial-Up Internet | 11 | 0.1% |
| Broadband Home | 8,798 | 70.9% |
| Cellular Data Only | 1,215 | 9.8% |
| Satellite Internet | 523 | 4.2% |
| No Internet | 2,118 | 17.1% |
| Total | 12,408 | 100.0% |
Michigan City Summary
Michigan City is a city in LaPorte County, Indiana, United States. It is located in the extreme northwest corner of the state, near the southern shore of Lake Michigan. The population was 31,479 at the 2010 census, making it the largest city in LaPorte County. Michigan City is noted for both its proximity to the Indiana Dunes National Park and for bordering Lake Michigan.
History
The area was originally inhabited by the Potawatomi Indians, who had a trading post in the area. The first non-indigenous settler in the area was William Burnett, who arrived in 1834. The town was platted in 1836 and was named after the nearby Michigan Road, which was the main route from Detroit to Chicago at the time.
Michigan City was incorporated as a town in 1836 and as a city in 1858. The city grew rapidly in the late 19th century, due to the development of the nearby Indiana Dunes and the construction of the Michigan Central Railroad. The city was a popular destination for tourists, and it became a major port for the Great Lakes region.
In the early 20th century, Michigan City became a major industrial center, with several steel mills and other factories. The city also became a major shipping port, with the construction of the Indiana Harbor and Ship Canal in the 1920s.
Geography
Michigan City is located at 41°42′N 86°53′W (41.7, -86.88). According to the 2010 census, the city has a total area of 22.855 square miles (59.2 km2), of which 21.59 square miles (55.9 km2) (or 94.7%) is land and 1.265 square miles (3.3 km2) (or 5.5%) is water.
The city is located on the southern shore of Lake Michigan, and is bordered by the Indiana Dunes National Park to the north. The city is also located near the Indiana-Illinois border, and is about 50 miles (80 km) east of Chicago.
Economy
Michigan City is a major industrial center, with several steel mills and other factories located in the city. The city is also a major shipping port, with the Indiana Harbor and Ship Canal providing access to the Great Lakes.
The city is also home to several tourist attractions, including the Indiana Dunes National Park, the Lighthouse Place Premium Outlets, and the Washington Park Zoo.
Demographics
As of the 2010 census, there were 31,479 people, 12,890 households, and 7,845 families residing in the city. The population density was 1,445.2 people per square mile (558.9/km2). There were 14,717 housing units at an average density of 683.3 per square mile (263.7/km2). The racial makeup of the city was 79.2% White, 11.2% African American, 0.4% Native American, 0.7% Asian, 5.2% from other races, and 3.3% from two or more races. Hispanic or Latino of any race were 11.3% of the population.
There were 12,890 households, out of which 28.2% had children under the age of 18 living with them, 40.2% were married couples living together, 15.7% had a female householder with no husband present, and 38.7% were non-families. 32.2% of all households were made up of individuals, and 11.7% had someone living alone who was 65 years of age or older. The average household size was 2.41 and the average family size was 3.03.
In the city, the population was spread out, with 24.2% under the age of 18, 9.2% from 18 to 24, 28.7% from 25 to 44, 22.7% from 45 to 64, and 15.2% who were 65 years of age or older. The median age was 36 years. For every 100 females, there were 93.2 males. For every 100 females age 18 and over, there were 89.2 males.
The median income for a household in the city was $35,902, and the median income for a family was $43,941. Males had a median income of $35,902 versus $25,865 for females. The per capita income for the city was $19,845. About 11.2% of families and 14.2% of the population were below the poverty line, including 20.2% of those under age 18 and 8.2% of those age 65 or over.
Common Questions
What is Per Capita Income in Michigan City?
Per Capita income in Michigan City is $27,120.
What is the Median Family Income in Michigan City?
Median Family Income in Michigan City is $68,608.
What is the Median Household income in Michigan City?
Median Household Income in Michigan City is $51,554.
What is Income or Wage Gap in Michigan City?
Income or Wage Gap in Michigan City is 21.9%.
Women in Michigan City earn 78.1 cents for every dollar earned by a man.
What is Family Income Deficit in Michigan City?
Family Income Deficit in Michigan City is $14,384.
Families that are below poverty line in Michigan City earn $14,384 less on average than the poverty threshold level.
What is Inequality or Gini Index in Michigan City?
Inequality or Gini Index in Michigan City is 0.45.
What is the Total Population of Michigan City?
Total Population of Michigan City is 31,983.
What is the Total Male Population of Michigan City?
Total Male Population of Michigan City is 16,637.
What is the Total Female Population of Michigan City?
Total Female Population of Michigan City is 15,346.
What is the Ratio of Males per 100 Females in Michigan City?
There are 108.41 Males per 100 Females in Michigan City.
What is the Ratio of Females per 100 Males in Michigan City?
There are 92.24 Females per 100 Males in Michigan City.
What is the Median Population Age in Michigan City?
Median Population Age in Michigan City is 38.2 Years.
What is the Average Family Size in Michigan City
Average Family Size in Michigan City is 3.2 People.
What is the Average Household Size in Michigan City
Average Household Size in Michigan City is 2.4 People.
How Large is the Labor Force in Michigan City?
There are 14,002 People in the Labor Forcein in Michigan City.
What is the Percentage of People in the Labor Force in Michigan City?
54.8% of People are in the Labor Force in Michigan City.
What is the Unemployment Rate in Michigan City?
Unemployment Rate in Michigan City is 7.1%.