Kingsford Heights, IN Map & Demographics
Kingsford Heights Map
Kingsford Heights Overview
$21,786
PER CAPITA INCOME
$53,775
AVG FAMILY INCOME
$54,387
AVG HOUSEHOLD INCOME
27.3%
WAGE / INCOME GAP [ % ]
72.7¢/ $1
WAGE / INCOME GAP [ $ ]
0.32
INEQUALITY / GINI INDEX
1,391
TOTAL POPULATION
674
MALE POPULATION
717
FEMALE POPULATION
94.00
MALES / 100 FEMALES
106.38
FEMALES / 100 MALES
33.8
MEDIAN AGE
2.8
AVG FAMILY SIZE
2.7
AVG HOUSEHOLD SIZE
614
LABOR FORCE [ PEOPLE ]
59.9%
PERCENT IN LABOR FORCE
2.2%
UNEMPLOYMENT RATE
Kingsford Heights Zip Codes
Kingsford Heights Area Codes
Income in Kingsford Heights
Income Overview in Kingsford Heights
Per Capita Income in Kingsford Heights is $21,786, while median incomes of families and households are $53,775 and $54,387 respectively.
| Characteristic | Number | Measure |
| Per Capita Income | 1,391 | $21,786 |
| Median Family Income | 416 | $53,775 |
| Mean Family Income | 416 | $61,500 |
| Median Household Income | 519 | $54,387 |
| Mean Household Income | 519 | $61,644 |
| Income Deficit | 416 | $0 |
| Wage / Income Gap (%) | 1,391 | 27.35% |
| Wage / Income Gap ($) | 1,391 | 72.65¢ per $1 |
| Gini / Inequality Index | 1,391 | 0.32 |
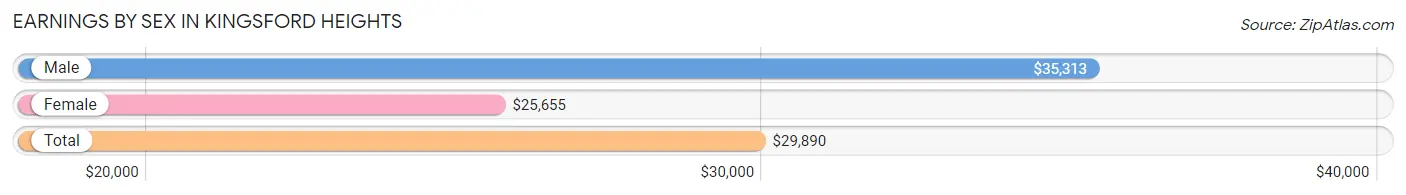
Earnings by Sex in Kingsford Heights
Average Earnings in Kingsford Heights are $29,890, $35,313 for men and $25,655 for women, a difference of 27.4%.
| Sex | Number | Average Earnings |
| Male | 333 (51.1%) | $35,313 |
| Female | 319 (48.9%) | $25,655 |
| Total | 652 (100.0%) | $29,890 |
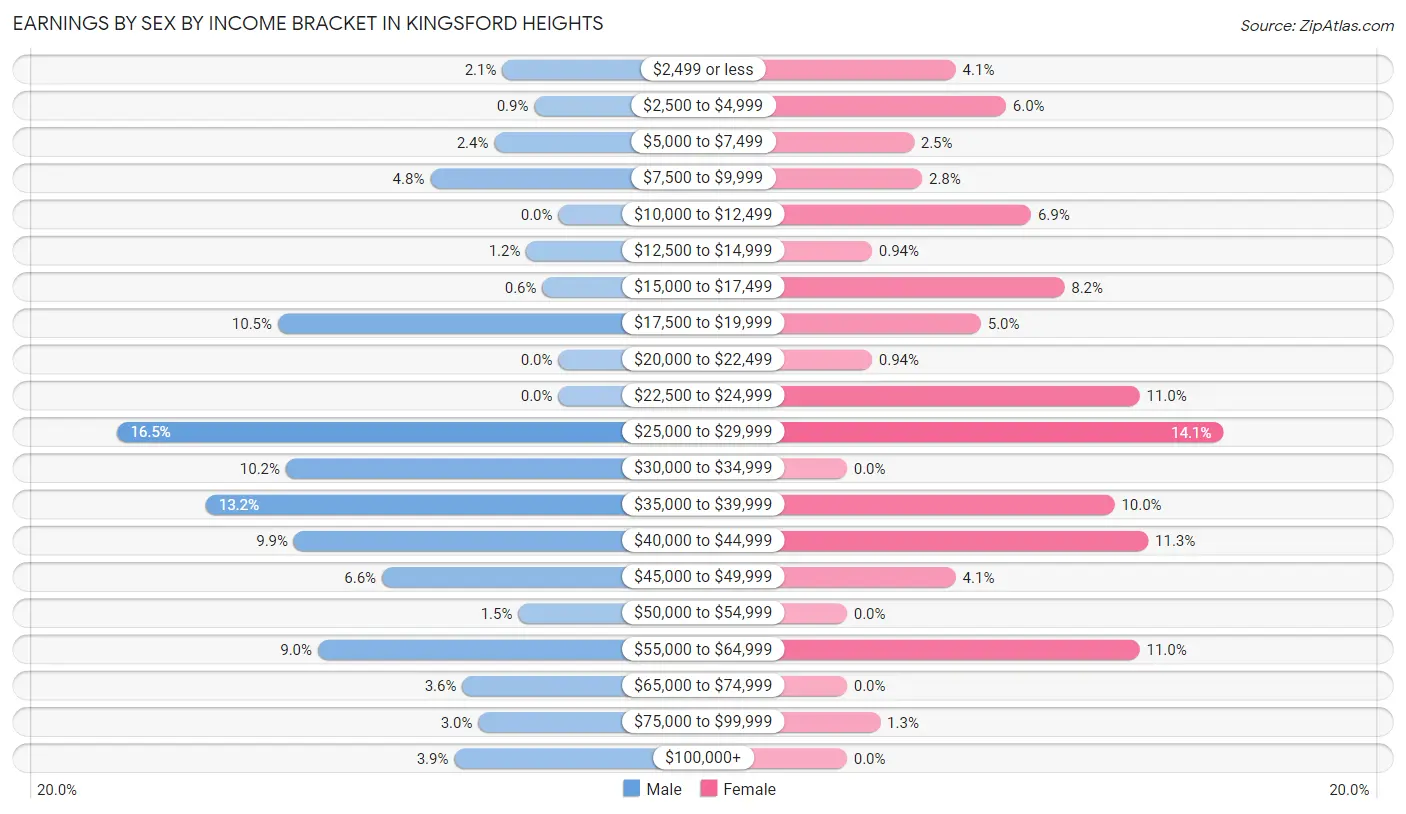
Earnings by Sex by Income Bracket in Kingsford Heights
The most common earnings brackets in Kingsford Heights are $25,000 to $29,999 for men (55 | 16.5%) and $25,000 to $29,999 for women (45 | 14.1%).
| Income | Male | Female |
| $2,499 or less | 7 (2.1%) | 13 (4.1%) |
| $2,500 to $4,999 | 3 (0.9%) | 19 (6.0%) |
| $5,000 to $7,499 | 8 (2.4%) | 8 (2.5%) |
| $7,500 to $9,999 | 16 (4.8%) | 9 (2.8%) |
| $10,000 to $12,499 | 0 (0.0%) | 22 (6.9%) |
| $12,500 to $14,999 | 4 (1.2%) | 3 (0.9%) |
| $15,000 to $17,499 | 2 (0.6%) | 26 (8.2%) |
| $17,500 to $19,999 | 35 (10.5%) | 16 (5.0%) |
| $20,000 to $22,499 | 0 (0.0%) | 3 (0.9%) |
| $22,500 to $24,999 | 0 (0.0%) | 35 (11.0%) |
| $25,000 to $29,999 | 55 (16.5%) | 45 (14.1%) |
| $30,000 to $34,999 | 34 (10.2%) | 0 (0.0%) |
| $35,000 to $39,999 | 44 (13.2%) | 32 (10.0%) |
| $40,000 to $44,999 | 33 (9.9%) | 36 (11.3%) |
| $45,000 to $49,999 | 22 (6.6%) | 13 (4.1%) |
| $50,000 to $54,999 | 5 (1.5%) | 0 (0.0%) |
| $55,000 to $64,999 | 30 (9.0%) | 35 (11.0%) |
| $65,000 to $74,999 | 12 (3.6%) | 0 (0.0%) |
| $75,000 to $99,999 | 10 (3.0%) | 4 (1.3%) |
| $100,000+ | 13 (3.9%) | 0 (0.0%) |
| Total | 333 (100.0%) | 319 (100.0%) |
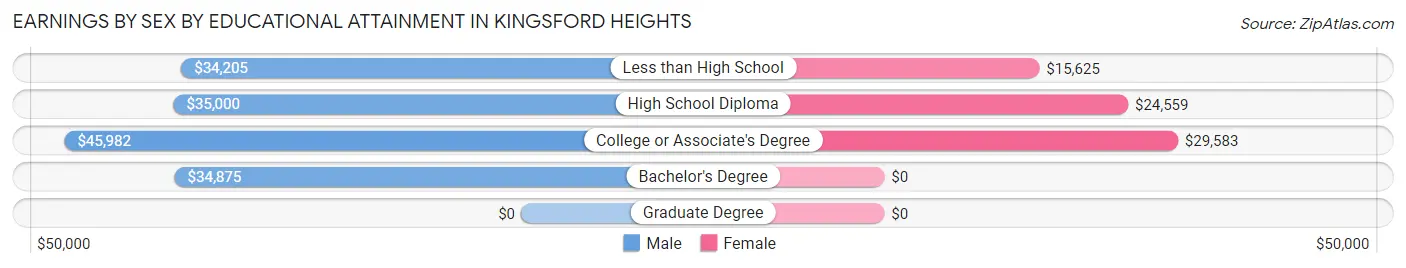
Earnings by Sex by Educational Attainment in Kingsford Heights
Average earnings in Kingsford Heights are $36,625 for men and $27,813 for women, a difference of 24.1%. Men with an educational attainment of college or associate's degree enjoy the highest average annual earnings of $45,982, while those with less than high school education earn the least with $34,205. Women with an educational attainment of college or associate's degree earn the most with the average annual earnings of $29,583, while those with less than high school education have the smallest earnings of $15,625.
| Educational Attainment | Male Income | Female Income |
| Less than High School | $34,205 | $15,625 |
| High School Diploma | $35,000 | $24,559 |
| College or Associate's Degree | $45,982 | $29,583 |
| Bachelor's Degree | $34,875 | $0 |
| Graduate Degree | - | - |
| Total | $36,625 | $27,813 |
Family Income in Kingsford Heights
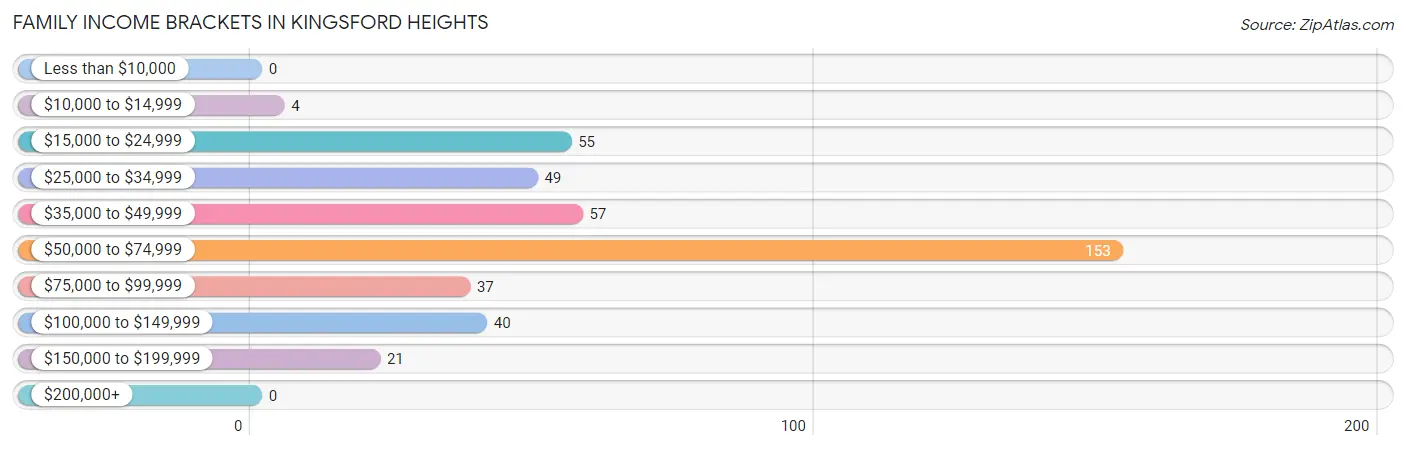
Family Income Brackets in Kingsford Heights
According to the Kingsford Heights family income data, there are 153 families falling into the $50,000 to $74,999 income range, which is the most common income bracket and makes up 36.8% of all families.
| Income Bracket | # Families | % Families |
| Less than $10,000 | 0 | 0.0% |
| $10,000 to $14,999 | 4 | 1.0% |
| $15,000 to $24,999 | 55 | 13.2% |
| $25,000 to $34,999 | 49 | 11.8% |
| $35,000 to $49,999 | 57 | 13.7% |
| $50,000 to $74,999 | 153 | 36.8% |
| $75,000 to $99,999 | 37 | 8.9% |
| $100,000 to $149,999 | 40 | 9.6% |
| $150,000 to $199,999 | 21 | 5.0% |
| $200,000+ | 0 | 0.0% |
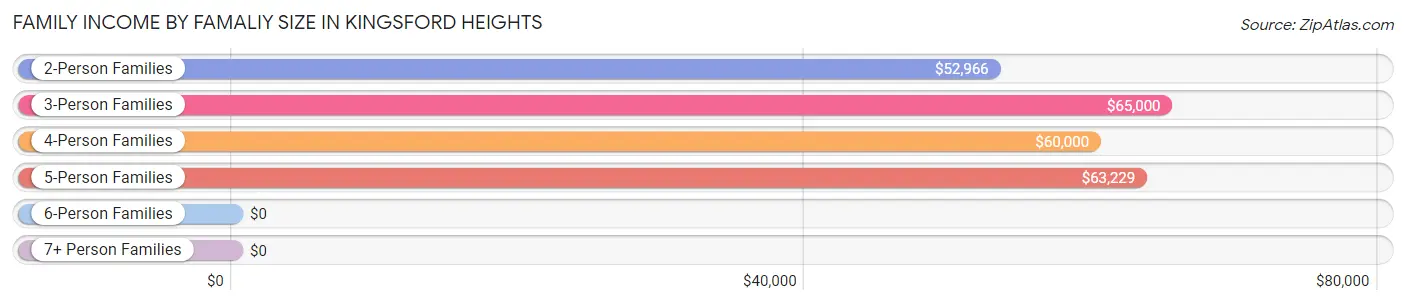
Family Income by Famaliy Size in Kingsford Heights
3-person families (94 | 22.6%) account for the highest median family income in Kingsford Heights with $65,000 per family, while 2-person families (239 | 57.5%) have the highest median income of $26,483 per family member.
| Income Bracket | # Families | Median Income |
| 2-Person Families | 239 (57.5%) | $52,966 |
| 3-Person Families | 94 (22.6%) | $65,000 |
| 4-Person Families | 30 (7.2%) | $60,000 |
| 5-Person Families | 41 (9.9%) | $63,229 |
| 6-Person Families | 9 (2.2%) | $0 |
| 7+ Person Families | 3 (0.7%) | $0 |
| Total | 416 (100.0%) | $53,775 |
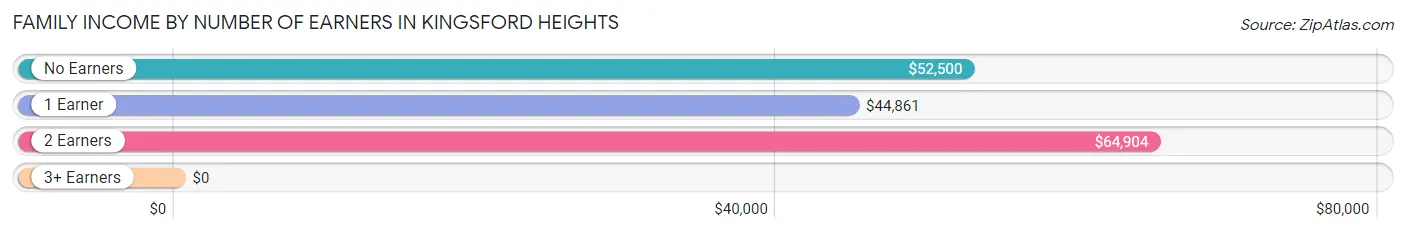
Family Income by Number of Earners in Kingsford Heights
| Number of Earners | # Families | Median Income |
| No Earners | 70 (16.8%) | $52,500 |
| 1 Earner | 208 (50.0%) | $44,861 |
| 2 Earners | 117 (28.1%) | $64,904 |
| 3+ Earners | 21 (5.1%) | $0 |
| Total | 416 (100.0%) | $53,775 |
Household Income in Kingsford Heights
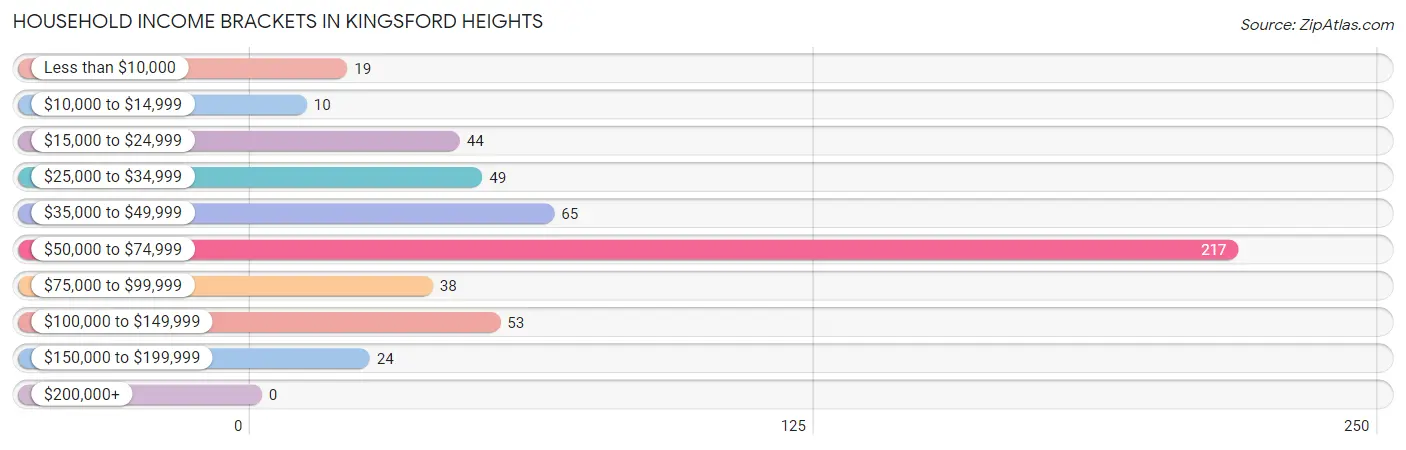
Household Income Brackets in Kingsford Heights
With 217 households falling in the category, the $50,000 to $74,999 income range is the most frequent in Kingsford Heights, accounting for 41.8% of all households.
| Income Bracket | # Households | % Households |
| Less than $10,000 | 19 | 3.7% |
| $10,000 to $14,999 | 10 | 1.9% |
| $15,000 to $24,999 | 44 | 8.5% |
| $25,000 to $34,999 | 49 | 9.4% |
| $35,000 to $49,999 | 65 | 12.5% |
| $50,000 to $74,999 | 217 | 41.8% |
| $75,000 to $99,999 | 38 | 7.3% |
| $100,000 to $149,999 | 53 | 10.2% |
| $150,000 to $199,999 | 24 | 4.6% |
| $200,000+ | 0 | 0.0% |
Household Income by Householder Age in Kingsford Heights
The median household income in Kingsford Heights is $54,387, with the highest median household income of $60,781 found in the 45 to 64 years age bracket for the primary householder. A total of 167 households (32.2%) fall into this category. Meanwhile, the 15 to 24 years age bracket for the primary householder has the lowest median household income of $42,500, with 16 households (3.1%) in this group.
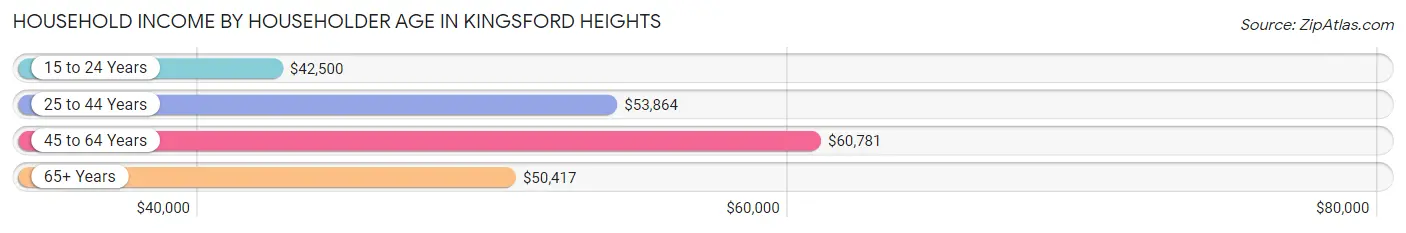
| Income Bracket | # Households | Median Income |
| 15 to 24 Years | 16 (3.1%) | $42,500 |
| 25 to 44 Years | 220 (42.4%) | $53,864 |
| 45 to 64 Years | 167 (32.2%) | $60,781 |
| 65+ Years | 116 (22.4%) | $50,417 |
| Total | 519 (100.0%) | $54,387 |
Poverty in Kingsford Heights
Income Below Poverty by Sex and Age in Kingsford Heights
With 17.3% poverty level for males and 11.5% for females among the residents of Kingsford Heights, 12 to 14 year old males and 18 to 24 year old females are the most vulnerable to poverty, with 3 males (100.0%) and 16 females (33.3%) in their respective age groups living below the poverty level.
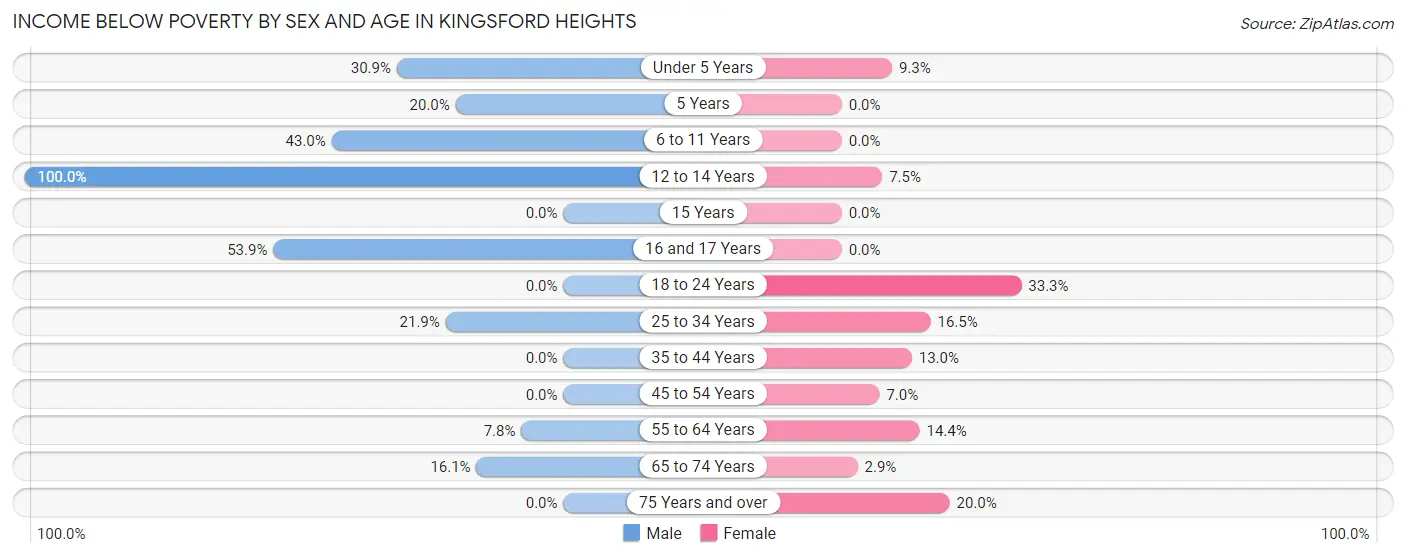
| Age Bracket | Male | Female |
| Under 5 Years | 17 (30.9%) | 7 (9.3%) |
| 5 Years | 3 (20.0%) | 0 (0.0%) |
| 6 to 11 Years | 37 (43.0%) | 0 (0.0%) |
| 12 to 14 Years | 3 (100.0%) | 3 (7.5%) |
| 15 Years | 0 (0.0%) | 0 (0.0%) |
| 16 and 17 Years | 14 (53.8%) | 0 (0.0%) |
| 18 to 24 Years | 0 (0.0%) | 16 (33.3%) |
| 25 to 34 Years | 26 (21.8%) | 15 (16.5%) |
| 35 to 44 Years | 0 (0.0%) | 10 (13.0%) |
| 45 to 54 Years | 0 (0.0%) | 7 (7.0%) |
| 55 to 64 Years | 5 (7.8%) | 14 (14.4%) |
| 65 to 74 Years | 10 (16.1%) | 2 (2.9%) |
| 75 Years and over | 0 (0.0%) | 7 (20.0%) |
| Total | 115 (17.3%) | 81 (11.5%) |
Income Above Poverty by Sex and Age in Kingsford Heights
According to the poverty statistics in Kingsford Heights, males aged 15 years and females aged 5 years are the age groups that are most secure financially, with 100.0% of males and 100.0% of females in these age groups living above the poverty line.
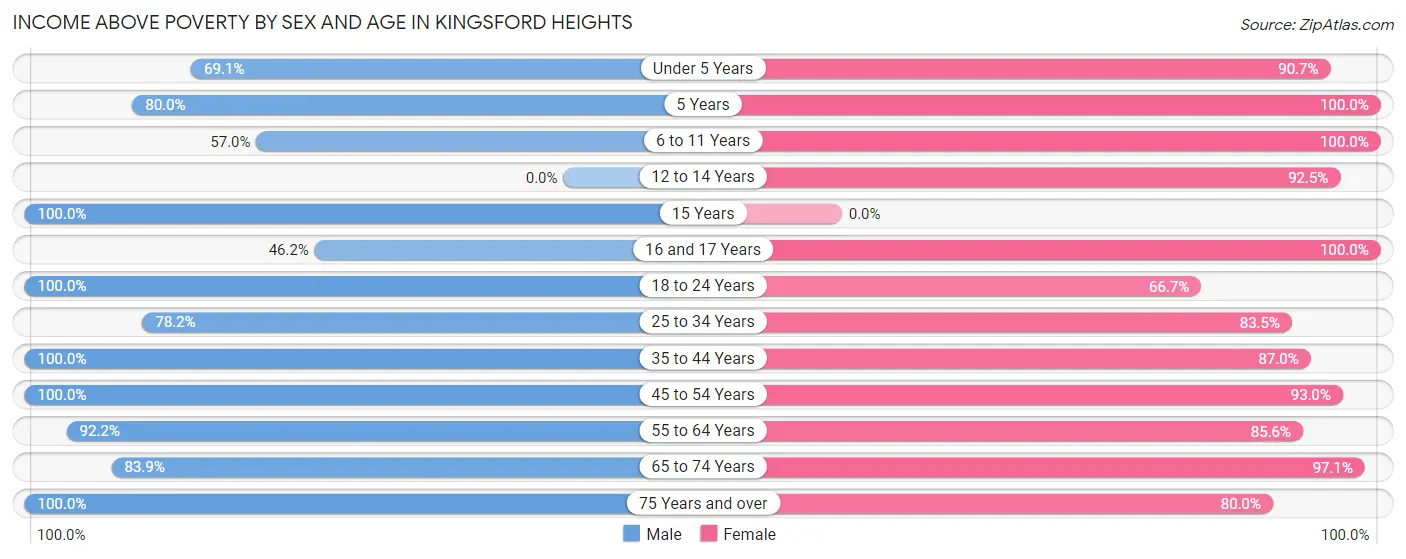
| Age Bracket | Male | Female |
| Under 5 Years | 38 (69.1%) | 68 (90.7%) |
| 5 Years | 12 (80.0%) | 14 (100.0%) |
| 6 to 11 Years | 49 (57.0%) | 42 (100.0%) |
| 12 to 14 Years | 0 (0.0%) | 37 (92.5%) |
| 15 Years | 14 (100.0%) | 0 (0.0%) |
| 16 and 17 Years | 12 (46.2%) | 17 (100.0%) |
| 18 to 24 Years | 29 (100.0%) | 32 (66.7%) |
| 25 to 34 Years | 93 (78.1%) | 76 (83.5%) |
| 35 to 44 Years | 100 (100.0%) | 67 (87.0%) |
| 45 to 54 Years | 66 (100.0%) | 93 (93.0%) |
| 55 to 64 Years | 59 (92.2%) | 83 (85.6%) |
| 65 to 74 Years | 52 (83.9%) | 66 (97.1%) |
| 75 Years and over | 26 (100.0%) | 28 (80.0%) |
| Total | 550 (82.7%) | 623 (88.5%) |
Income Below Poverty Among Married-Couple Families in Kingsford Heights
The poverty statistics for married-couple families in Kingsford Heights show that 1.9% or 5 of the total 266 families live below the poverty line. Families with 1 or 2 children have the highest poverty rate of 11.1%, comprising of 3 families. On the other hand, families with 3 or 4 children have the lowest poverty rate of 0.0%, which includes 0 families.
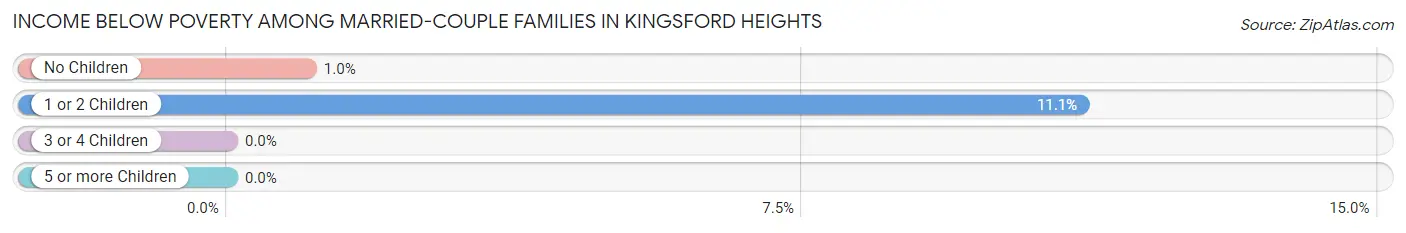
| Children | Above Poverty | Below Poverty |
| No Children | 192 (99.0%) | 2 (1.0%) |
| 1 or 2 Children | 24 (88.9%) | 3 (11.1%) |
| 3 or 4 Children | 45 (100.0%) | 0 (0.0%) |
| 5 or more Children | 0 (0.0%) | 0 (0.0%) |
| Total | 261 (98.1%) | 5 (1.9%) |
Income Below Poverty Among Single-Parent Households in Kingsford Heights
According to the poverty data in Kingsford Heights, 31.4% or 22 single-father households and 27.5% or 22 single-mother households are living below the poverty line. Among single-father households, those with 1 or 2 children have the highest poverty rate, with 22 households (32.4%) experiencing poverty. Likewise, among single-mother households, those with 3 or 4 children have the highest poverty rate, with 8 households (100.0%) falling below the poverty line.
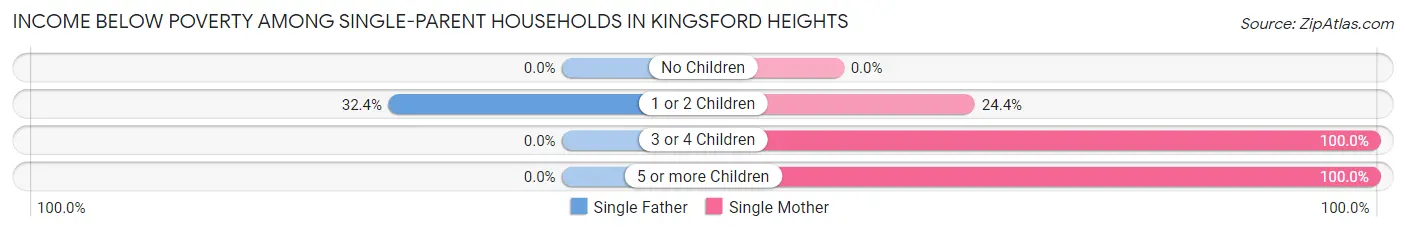
| Children | Single Father | Single Mother |
| No Children | 0 (0.0%) | 0 (0.0%) |
| 1 or 2 Children | 22 (32.4%) | 11 (24.4%) |
| 3 or 4 Children | 0 (0.0%) | 8 (100.0%) |
| 5 or more Children | 0 (0.0%) | 3 (100.0%) |
| Total | 22 (31.4%) | 22 (27.5%) |
Income Below Poverty Among Married-Couple vs Single-Parent Households in Kingsford Heights
The poverty data for Kingsford Heights shows that 5 of the married-couple family households (1.9%) and 44 of the single-parent households (29.3%) are living below the poverty level. Within the married-couple family households, those with 1 or 2 children have the highest poverty rate, with 3 households (11.1%) falling below the poverty line. Among the single-parent households, those with 3 or 4 children have the highest poverty rate, with 8 household (100.0%) living below poverty.
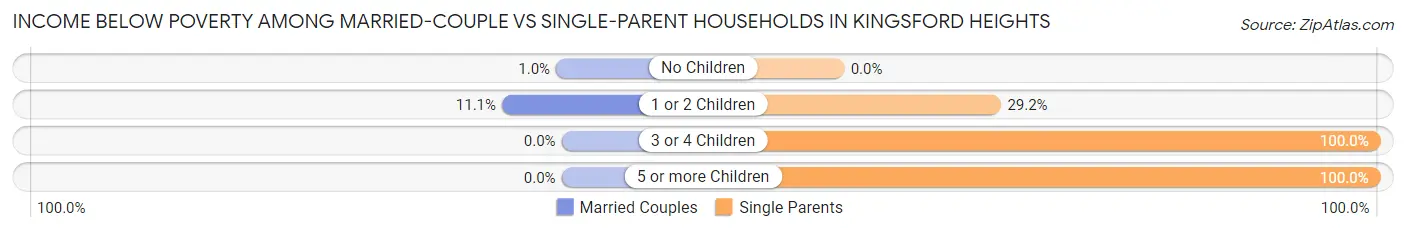
| Children | Married-Couple Families | Single-Parent Households |
| No Children | 2 (1.0%) | 0 (0.0%) |
| 1 or 2 Children | 3 (11.1%) | 33 (29.2%) |
| 3 or 4 Children | 0 (0.0%) | 8 (100.0%) |
| 5 or more Children | 0 (0.0%) | 3 (100.0%) |
| Total | 5 (1.9%) | 44 (29.3%) |
Race in Kingsford Heights
The most populous races in Kingsford Heights are White / Caucasian (1,123 | 80.7%), Two or more Races (128 | 9.2%), and Black / African American (99 | 7.1%).
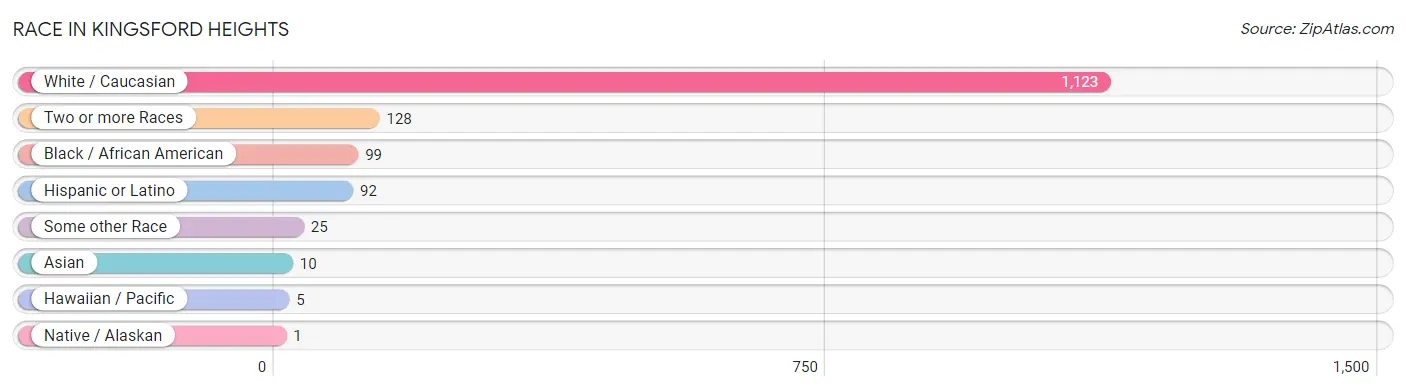
| Race | # Population | % Population |
| Asian | 10 | 0.7% |
| Black / African American | 99 | 7.1% |
| Hawaiian / Pacific | 5 | 0.4% |
| Hispanic or Latino | 92 | 6.6% |
| Native / Alaskan | 1 | 0.1% |
| White / Caucasian | 1,123 | 80.7% |
| Two or more Races | 128 | 9.2% |
| Some other Race | 25 | 1.8% |
| Total | 1,391 | 100.0% |
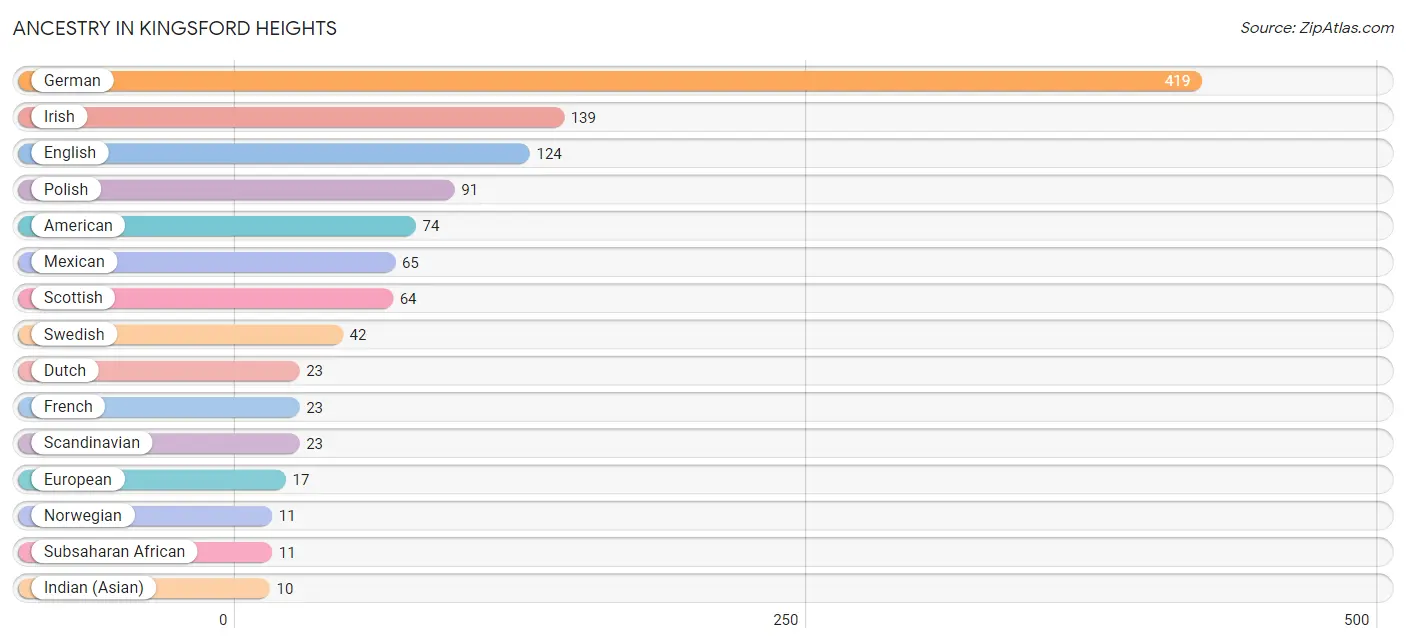
Ancestry in Kingsford Heights
The most populous ancestries reported in Kingsford Heights are German (419 | 30.1%), Irish (139 | 10.0%), English (124 | 8.9%), Polish (91 | 6.5%), and American (74 | 5.3%), together accounting for 60.9% of all Kingsford Heights residents.
| Ancestry | # Population | % Population |
| American | 74 | 5.3% |
| Burmese | 3 | 0.2% |
| Cape Verdean | 2 | 0.1% |
| Cherokee | 3 | 0.2% |
| Dutch | 23 | 1.7% |
| Eastern European | 7 | 0.5% |
| English | 124 | 8.9% |
| European | 17 | 1.2% |
| French | 23 | 1.7% |
| German | 419 | 30.1% |
| Guamanian / Chamorro | 5 | 0.4% |
| Hungarian | 3 | 0.2% |
| Indian (Asian) | 10 | 0.7% |
| Irish | 139 | 10.0% |
| Italian | 6 | 0.4% |
| Mexican | 65 | 4.7% |
| Mexican American Indian | 5 | 0.4% |
| Norwegian | 11 | 0.8% |
| Pennsylvania German | 3 | 0.2% |
| Polish | 91 | 6.5% |
| Scandinavian | 23 | 1.7% |
| Scotch-Irish | 3 | 0.2% |
| Scottish | 64 | 4.6% |
| Slavic | 8 | 0.6% |
| South African | 9 | 0.6% |
| Subsaharan African | 11 | 0.8% |
| Swedish | 42 | 3.0% | View All 27 Rows |
Immigrants in Kingsford Heights
The most numerous immigrant groups reported in Kingsford Heights came from Central America (28 | 2.0%), Latin America (28 | 2.0%), Mexico (28 | 2.0%), Asia (10 | 0.7%), and China (10 | 0.7%), together accounting for 7.5% of all Kingsford Heights residents.
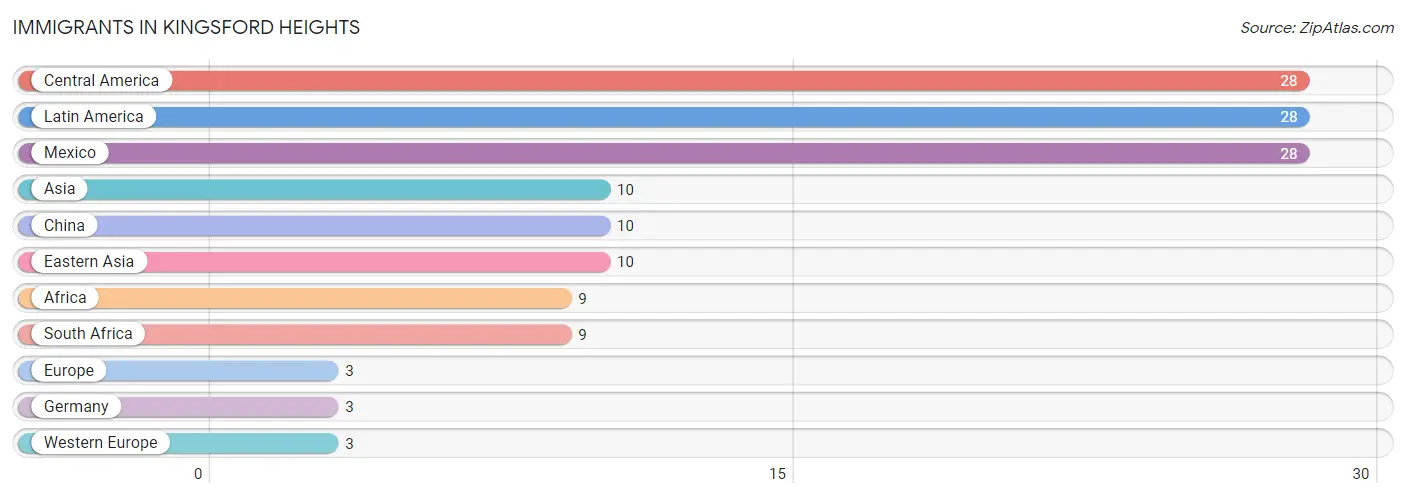
| Immigration Origin | # Population | % Population |
| Africa | 9 | 0.6% |
| Asia | 10 | 0.7% |
| Central America | 28 | 2.0% |
| China | 10 | 0.7% |
| Eastern Asia | 10 | 0.7% |
| Europe | 3 | 0.2% |
| Germany | 3 | 0.2% |
| Latin America | 28 | 2.0% |
| Mexico | 28 | 2.0% |
| South Africa | 9 | 0.6% |
| Western Europe | 3 | 0.2% | View All 11 Rows |
Sex and Age in Kingsford Heights
Sex and Age in Kingsford Heights
The most populous age groups in Kingsford Heights are 5 to 9 Years (95 | 14.1%) for men and Under 5 Years (83 | 11.6%) for women.
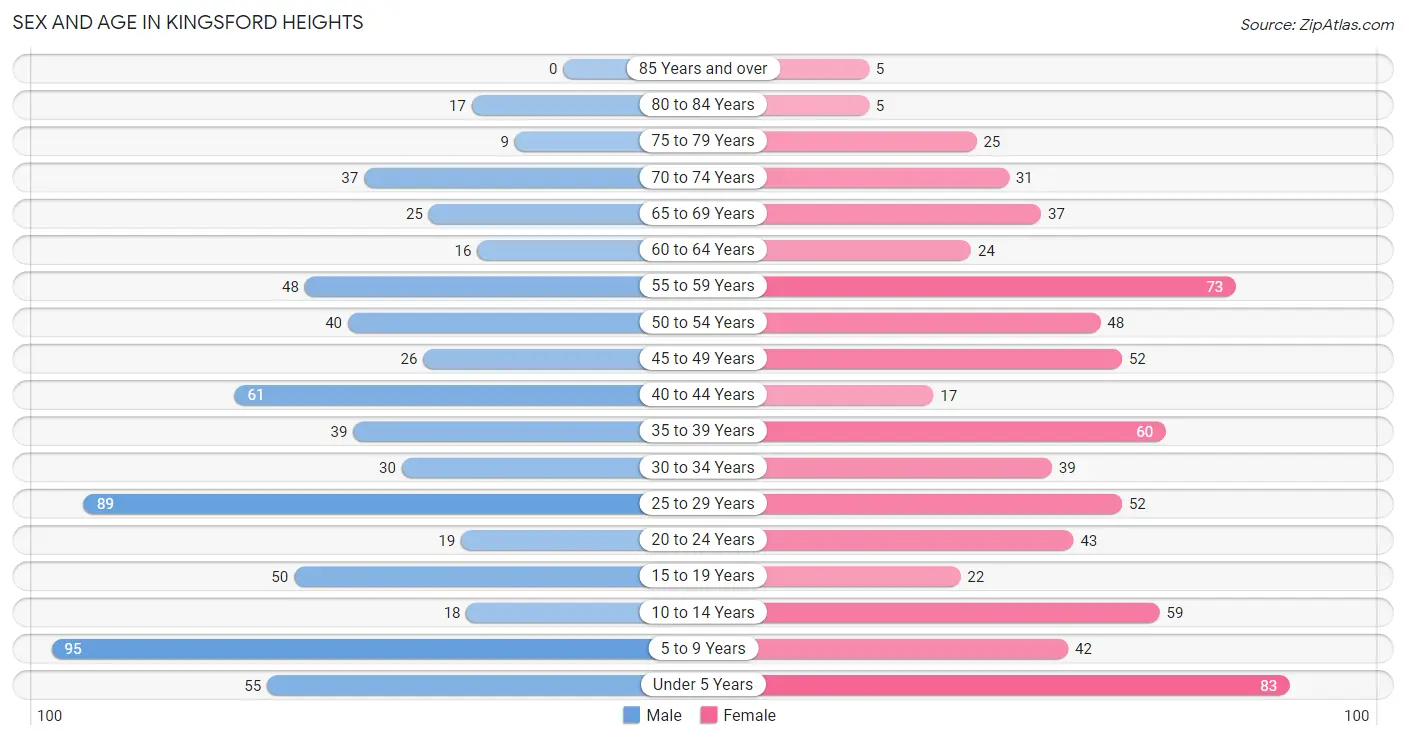
| Age Bracket | Male | Female |
| Under 5 Years | 55 (8.2%) | 83 (11.6%) |
| 5 to 9 Years | 95 (14.1%) | 42 (5.9%) |
| 10 to 14 Years | 18 (2.7%) | 59 (8.2%) |
| 15 to 19 Years | 50 (7.4%) | 22 (3.1%) |
| 20 to 24 Years | 19 (2.8%) | 43 (6.0%) |
| 25 to 29 Years | 89 (13.2%) | 52 (7.2%) |
| 30 to 34 Years | 30 (4.4%) | 39 (5.4%) |
| 35 to 39 Years | 39 (5.8%) | 60 (8.4%) |
| 40 to 44 Years | 61 (9.0%) | 17 (2.4%) |
| 45 to 49 Years | 26 (3.9%) | 52 (7.2%) |
| 50 to 54 Years | 40 (5.9%) | 48 (6.7%) |
| 55 to 59 Years | 48 (7.1%) | 73 (10.2%) |
| 60 to 64 Years | 16 (2.4%) | 24 (3.4%) |
| 65 to 69 Years | 25 (3.7%) | 37 (5.2%) |
| 70 to 74 Years | 37 (5.5%) | 31 (4.3%) |
| 75 to 79 Years | 9 (1.3%) | 25 (3.5%) |
| 80 to 84 Years | 17 (2.5%) | 5 (0.7%) |
| 85 Years and over | 0 (0.0%) | 5 (0.7%) |
| Total | 674 (100.0%) | 717 (100.0%) |
Families and Households in Kingsford Heights
Median Family Size in Kingsford Heights
The median family size in Kingsford Heights is 2.76 persons per family, with married-couple families (266 | 63.9%) accounting for the largest median family size of 2.91 persons per family. On the other hand, single male/father families (70 | 16.8%) represent the smallest median family size with 2.47 persons per family.
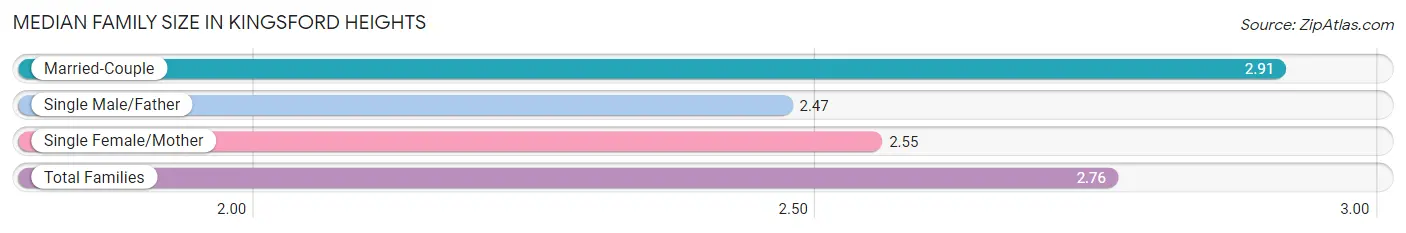
| Family Type | # Families | Family Size |
| Married-Couple | 266 (63.9%) | 2.91 |
| Single Male/Father | 70 (16.8%) | 2.47 |
| Single Female/Mother | 80 (19.2%) | 2.55 |
| Total Families | 416 (100.0%) | 2.76 |
Median Household Size in Kingsford Heights
The median household size in Kingsford Heights is 2.68 persons per household, with single male/father households (70 | 13.5%) accounting for the largest median household size of 3.4 persons per household. non-family households (103 | 19.9%) represent the smallest median household size with 1.44 persons per household.
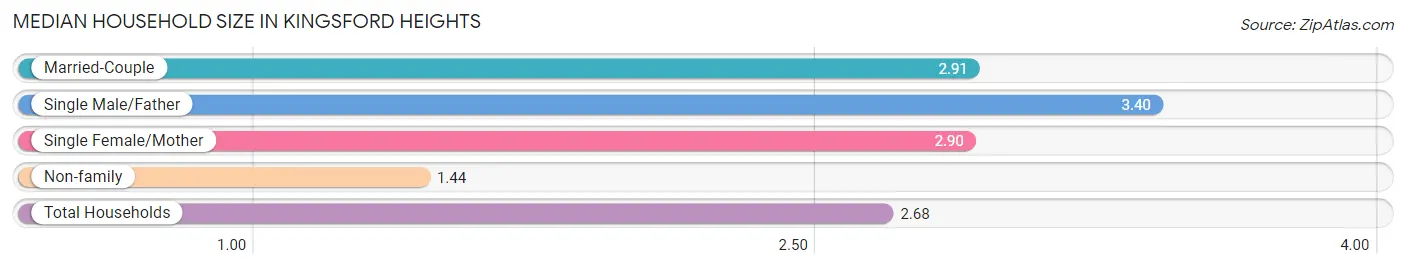
| Household Type | # Households | Household Size |
| Married-Couple | 266 (51.2%) | 2.91 |
| Single Male/Father | 70 (13.5%) | 3.40 |
| Single Female/Mother | 80 (15.4%) | 2.90 |
| Non-family | 103 (19.9%) | 1.44 |
| Total Households | 519 (100.0%) | 2.68 |
Household Size by Marriage Status in Kingsford Heights
Out of a total of 519 households in Kingsford Heights, 416 (80.1%) are family households, while 103 (19.9%) are nonfamily households. The most numerous type of family households are 2-person households, comprising 203, and the most common type of nonfamily households are 1-person households, comprising 76.
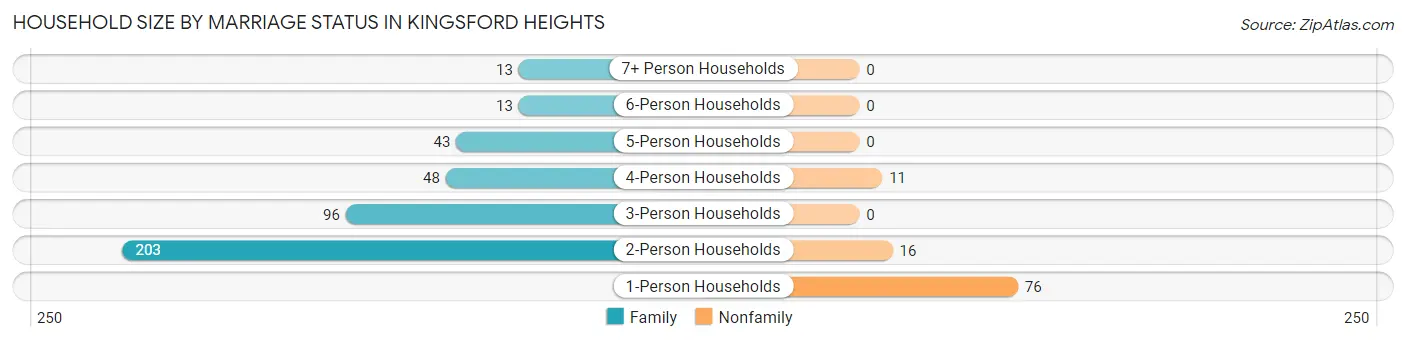
| Household Size | Family Households | Nonfamily Households |
| 1-Person Households | - | 76 (14.6%) |
| 2-Person Households | 203 (39.1%) | 16 (3.1%) |
| 3-Person Households | 96 (18.5%) | 0 (0.0%) |
| 4-Person Households | 48 (9.2%) | 11 (2.1%) |
| 5-Person Households | 43 (8.3%) | 0 (0.0%) |
| 6-Person Households | 13 (2.5%) | 0 (0.0%) |
| 7+ Person Households | 13 (2.5%) | 0 (0.0%) |
| Total | 416 (80.1%) | 103 (19.9%) |
Female Fertility in Kingsford Heights
Fertility by Age in Kingsford Heights
Average fertility rate in Kingsford Heights is 168.0 births per 1,000 women. Women in the age bracket of 20 to 34 years have the highest fertility rate with 246.0 births per 1,000 women. Women in the age bracket of 20 to 34 years acount for 68.8% of all women with births.
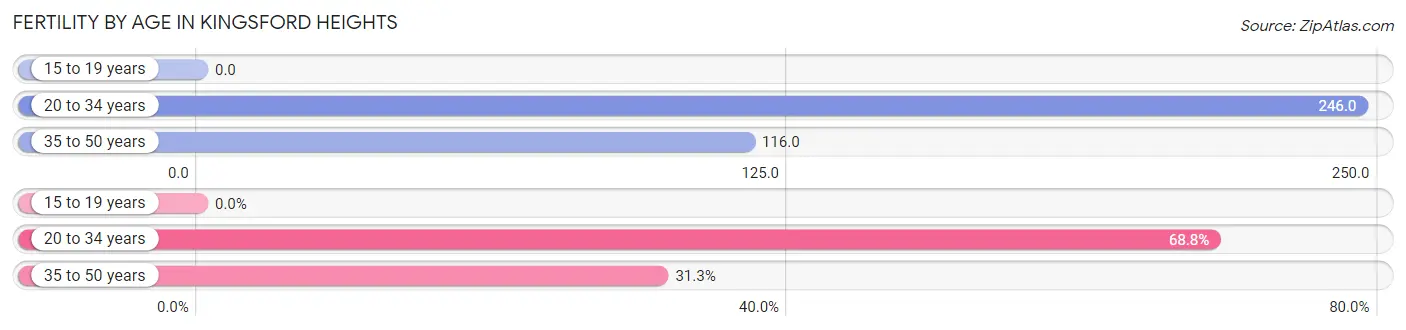
| Age Bracket | Women with Births | Births / 1,000 Women |
| 15 to 19 years | 0 (0.0%) | 0.0 |
| 20 to 34 years | 33 (68.8%) | 246.0 |
| 35 to 50 years | 15 (31.2%) | 116.0 |
| Total | 48 (100.0%) | 168.0 |
Fertility by Age by Marriage Status in Kingsford Heights
37.5% of women with births (48) in Kingsford Heights are married. The highest percentage of unmarried women with births falls into 20 to 34 years age bracket with 90.9% of them unmarried at the time of birth, while the lowest percentage of unmarried women with births belong to 35 to 50 years age bracket with 0.0% of them unmarried.
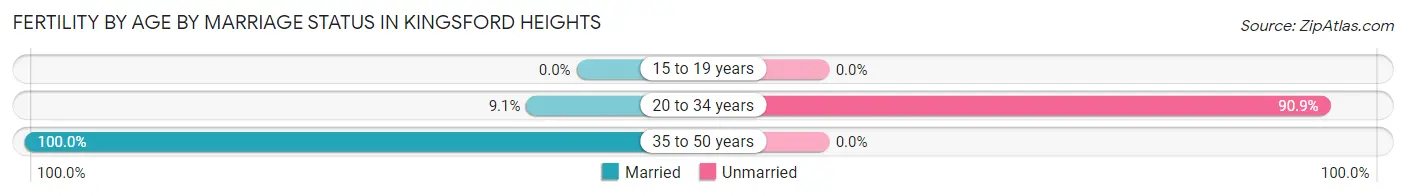
| Age Bracket | Married | Unmarried |
| 15 to 19 years | 0 (0.0%) | 0 (0.0%) |
| 20 to 34 years | 3 (9.1%) | 30 (90.9%) |
| 35 to 50 years | 15 (100.0%) | 0 (0.0%) |
| Total | 18 (37.5%) | 30 (62.5%) |
Fertility by Education in Kingsford Heights
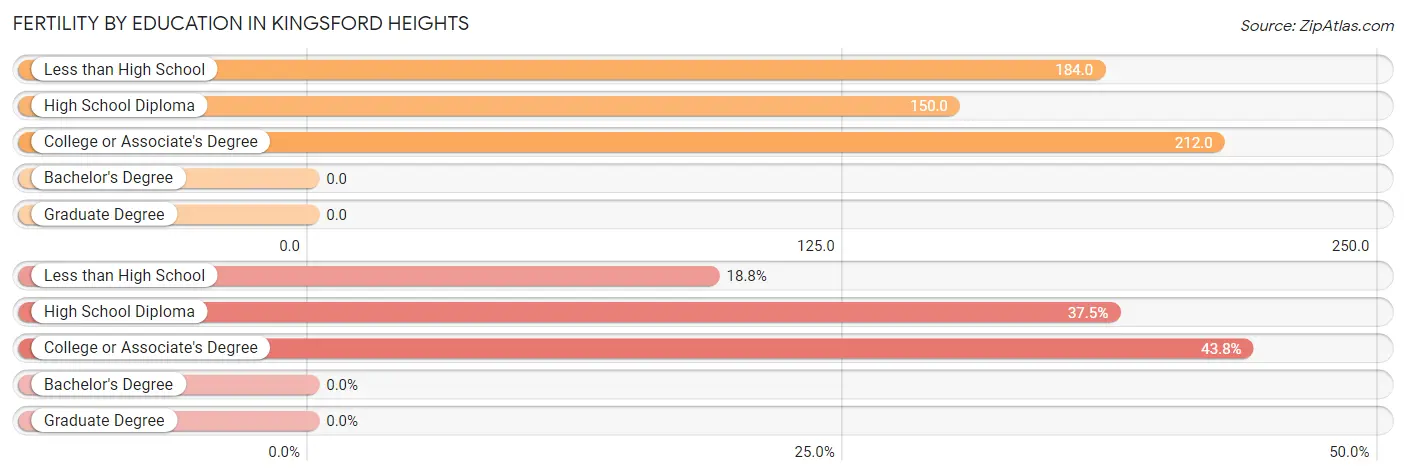
| Educational Attainment | Women with Births | Births / 1,000 Women |
| Less than High School | 9 (18.8%) | 184.0 |
| High School Diploma | 18 (37.5%) | 150.0 |
| College or Associate's Degree | 21 (43.8%) | 212.0 |
| Bachelor's Degree | 0 (0.0%) | 0.0 |
| Graduate Degree | 0 (0.0%) | 0.0 |
| Total | 48 (100.0%) | 168.0 |
Fertility by Education by Marriage Status in Kingsford Heights
62.5% of women with births in Kingsford Heights are unmarried. Women with the educational attainment of college or associate's degree are most likely to be married with 85.7% of them married at childbirth, while women with the educational attainment of less than high school are least likely to be married with 100.0% of them unmarried at childbirth.
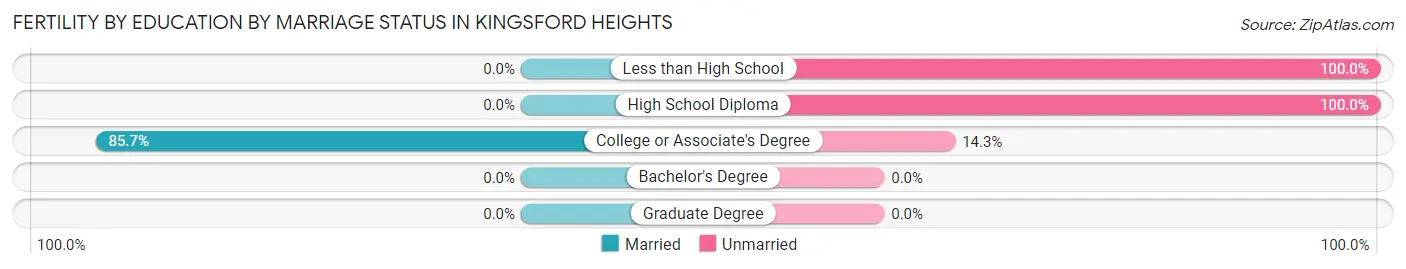
| Educational Attainment | Married | Unmarried |
| Less than High School | 0 (0.0%) | 9 (100.0%) |
| High School Diploma | 0 (0.0%) | 18 (100.0%) |
| College or Associate's Degree | 18 (85.7%) | 3 (14.3%) |
| Bachelor's Degree | 0 (0.0%) | 0 (0.0%) |
| Graduate Degree | 0 (0.0%) | 0 (0.0%) |
| Total | 18 (37.5%) | 30 (62.5%) |
Employment Characteristics in Kingsford Heights
Employment by Class of Employer in Kingsford Heights
Among the 592 employed individuals in Kingsford Heights, private company employees (475 | 80.2%), local government employees (35 | 5.9%), and not-for-profit organizations (29 | 4.9%) make up the most common classes of employment.
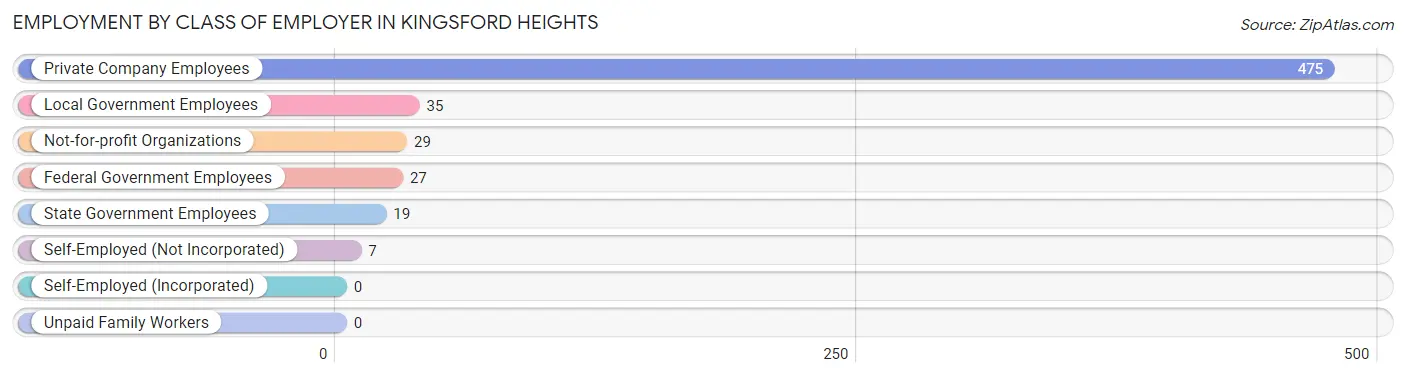
| Employer Class | # Employees | % Employees |
| Private Company Employees | 475 | 80.2% |
| Self-Employed (Incorporated) | 0 | 0.0% |
| Self-Employed (Not Incorporated) | 7 | 1.2% |
| Not-for-profit Organizations | 29 | 4.9% |
| Local Government Employees | 35 | 5.9% |
| State Government Employees | 19 | 3.2% |
| Federal Government Employees | 27 | 4.6% |
| Unpaid Family Workers | 0 | 0.0% |
| Total | 592 | 100.0% |
Employment Status by Age in Kingsford Heights
According to the labor force statistics for Kingsford Heights, out of the total population over 16 years of age (1,025), 59.9% or 614 individuals are in the labor force, with 2.2% or 14 of them unemployed. The age group with the highest labor force participation rate is 25 to 29 years, with 97.9% or 138 individuals in the labor force. Within the labor force, the 35 to 44 years age range has the highest percentage of unemployed individuals, with 6.5% or 10 of them being unemployed.
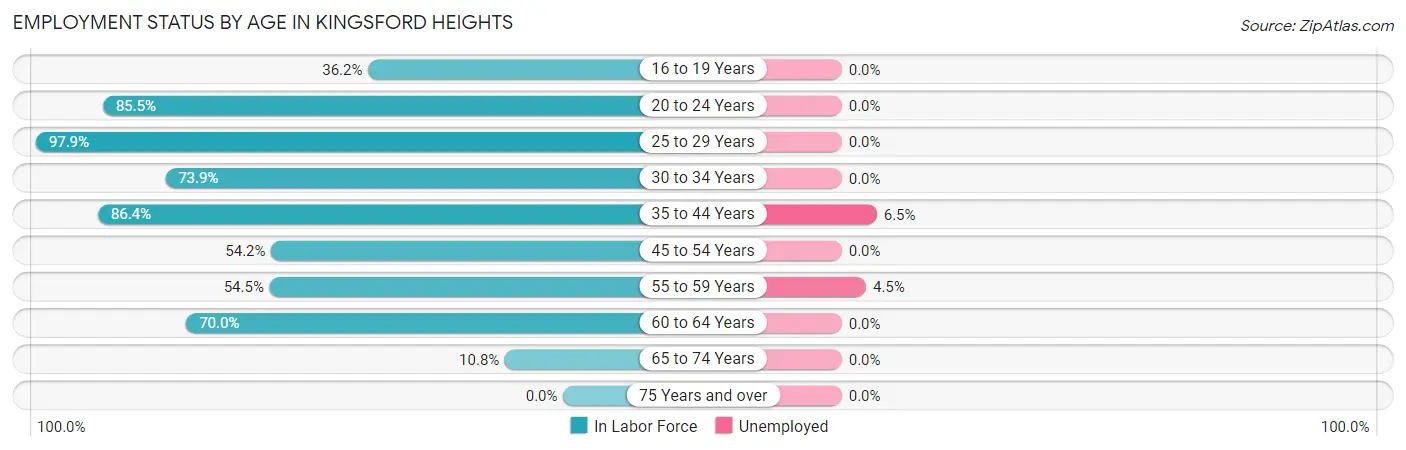
| Age Bracket | In Labor Force | Unemployed |
| 16 to 19 Years | 21 (36.2%) | 0 (0.0%) |
| 20 to 24 Years | 53 (85.5%) | 0 (0.0%) |
| 25 to 29 Years | 138 (97.9%) | 0 (0.0%) |
| 30 to 34 Years | 51 (73.9%) | 0 (0.0%) |
| 35 to 44 Years | 153 (86.4%) | 10 (6.5%) |
| 45 to 54 Years | 90 (54.2%) | 0 (0.0%) |
| 55 to 59 Years | 66 (54.5%) | 3 (4.5%) |
| 60 to 64 Years | 28 (70.0%) | 0 (0.0%) |
| 65 to 74 Years | 14 (10.8%) | 0 (0.0%) |
| 75 Years and over | 0 (0.0%) | 0 (0.0%) |
| Total | 614 (59.9%) | 14 (2.2%) |
Employment Status by Educational Attainment in Kingsford Heights
According to labor force statistics for Kingsford Heights, 73.7% of individuals (526) out of the total population between 25 and 64 years of age (714) are in the labor force, with 2.5% or 13 of them being unemployed. The group with the highest labor force participation rate are those with the educational attainment of bachelor's degree or higher, with 94.3% or 50 individuals in the labor force. Within the labor force, individuals with high school diploma education have the highest percentage of unemployment, with 4.3% or 10 of them being unemployed.
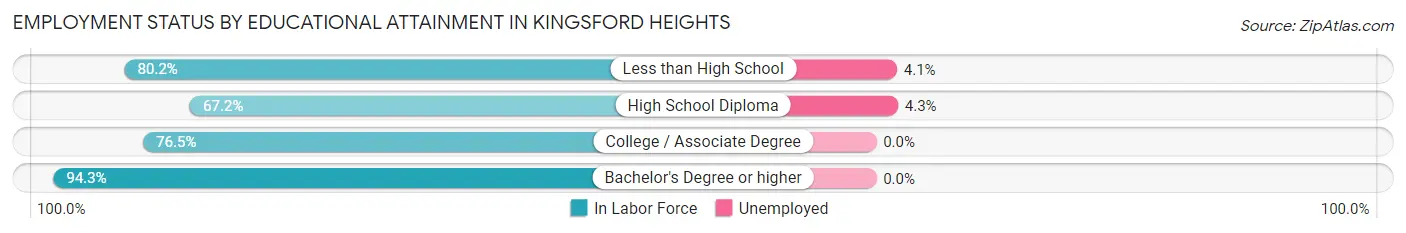
| Educational Attainment | In Labor Force | Unemployed |
| Less than High School | 73 (80.2%) | 4 (4.1%) |
| High School Diploma | 240 (67.2%) | 15 (4.3%) |
| College / Associate Degree | 163 (76.5%) | 0 (0.0%) |
| Bachelor's Degree or higher | 50 (94.3%) | 0 (0.0%) |
| Total | 526 (73.7%) | 18 (2.5%) |
Employment Occupations by Sex in Kingsford Heights
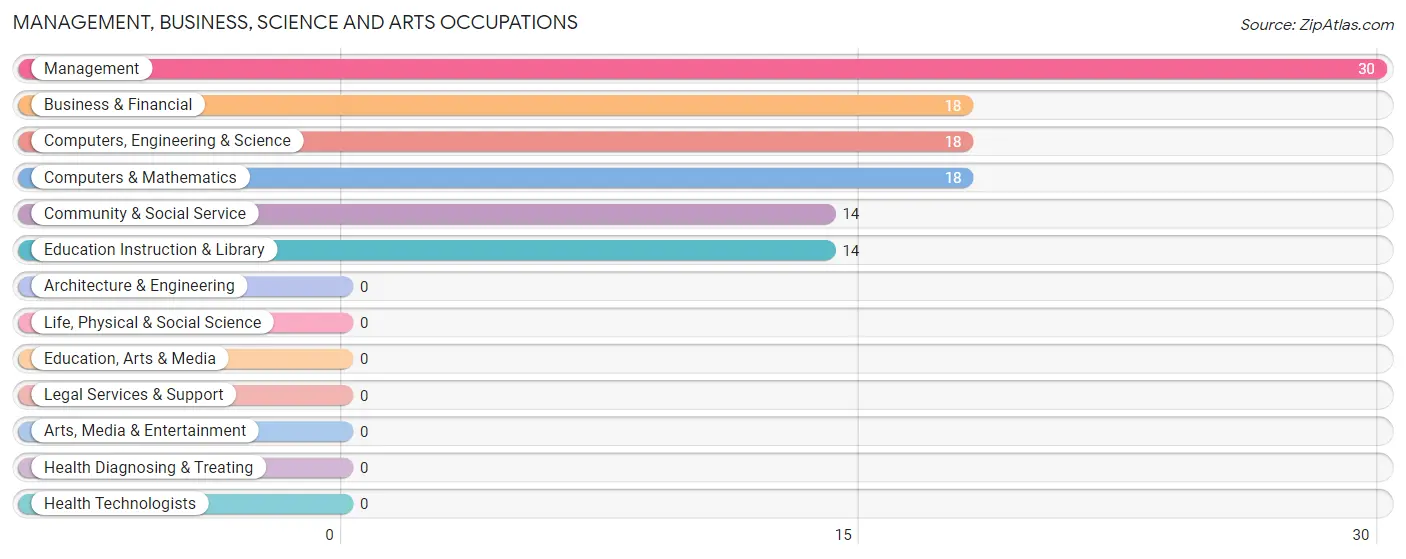
Management, Business, Science and Arts Occupations
The most common Management, Business, Science and Arts occupations in Kingsford Heights are Management (30 | 5.1%), Business & Financial (18 | 3.1%), Computers, Engineering & Science (18 | 3.1%), Computers & Mathematics (18 | 3.1%), and Community & Social Service (14 | 2.4%).
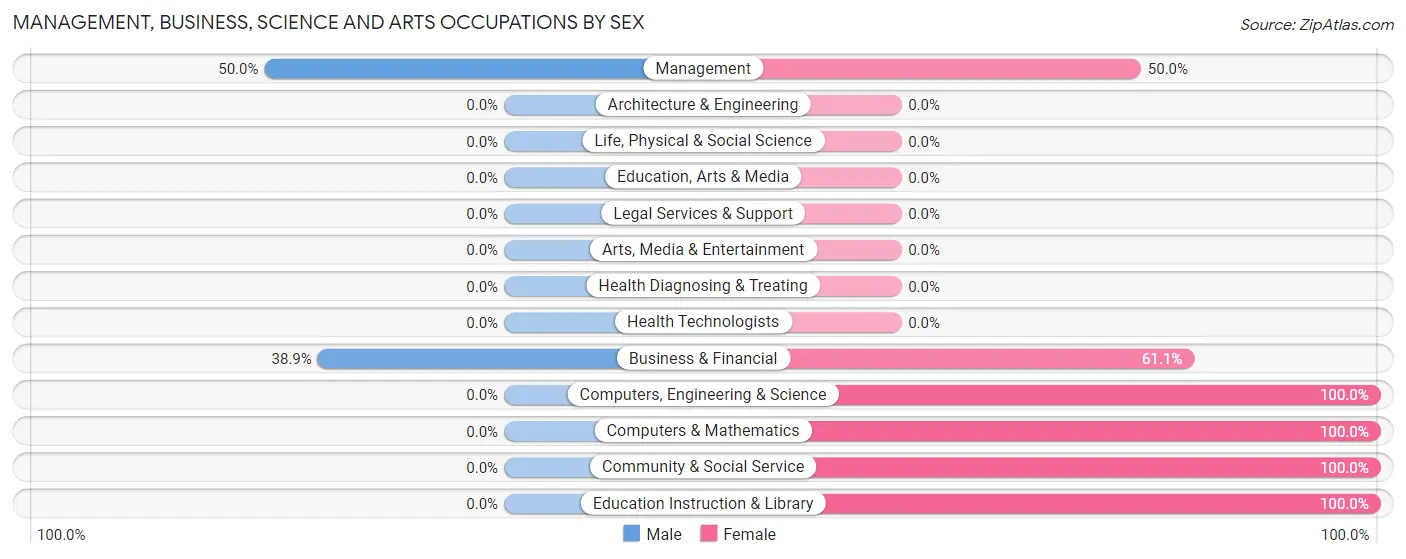
Management, Business, Science and Arts Occupations by Sex
Within the Management, Business, Science and Arts occupations in Kingsford Heights, the most male-oriented occupations are Management (50.0%), and Business & Financial (38.9%), while the most female-oriented occupations are Computers, Engineering & Science (100.0%), Computers & Mathematics (100.0%), and Community & Social Service (100.0%).
| Occupation | Male | Female |
| Management | 15 (50.0%) | 15 (50.0%) |
| Business & Financial | 7 (38.9%) | 11 (61.1%) |
| Computers, Engineering & Science | 0 (0.0%) | 18 (100.0%) |
| Computers & Mathematics | 0 (0.0%) | 18 (100.0%) |
| Architecture & Engineering | 0 (0.0%) | 0 (0.0%) |
| Life, Physical & Social Science | 0 (0.0%) | 0 (0.0%) |
| Community & Social Service | 0 (0.0%) | 14 (100.0%) |
| Education, Arts & Media | 0 (0.0%) | 0 (0.0%) |
| Legal Services & Support | 0 (0.0%) | 0 (0.0%) |
| Education Instruction & Library | 0 (0.0%) | 14 (100.0%) |
| Arts, Media & Entertainment | 0 (0.0%) | 0 (0.0%) |
| Health Diagnosing & Treating | 0 (0.0%) | 0 (0.0%) |
| Health Technologists | 0 (0.0%) | 0 (0.0%) |
| Total (Category) | 22 (27.5%) | 58 (72.5%) |
| Total (Overall) | 311 (52.9%) | 277 (47.1%) |
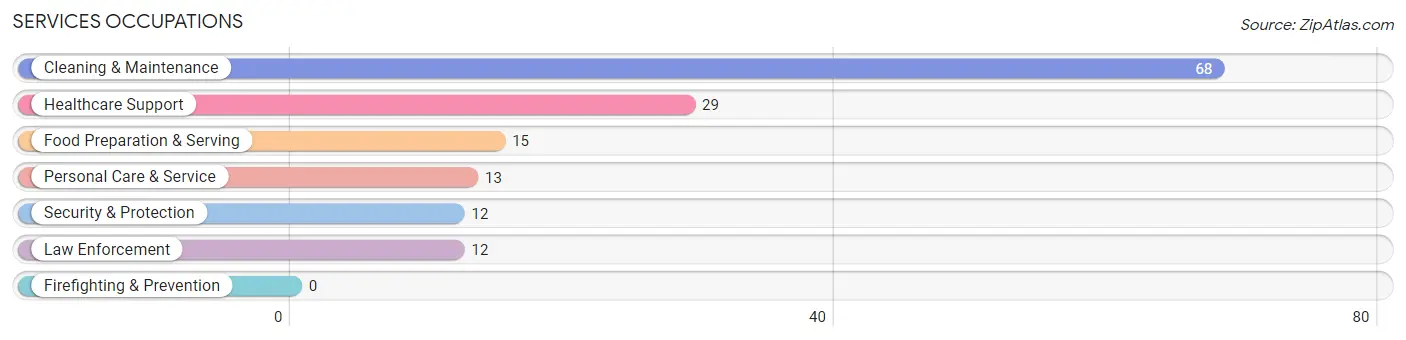
Services Occupations
The most common Services occupations in Kingsford Heights are Cleaning & Maintenance (68 | 11.6%), Healthcare Support (29 | 4.9%), Food Preparation & Serving (15 | 2.5%), Personal Care & Service (13 | 2.2%), and Security & Protection (12 | 2.0%).
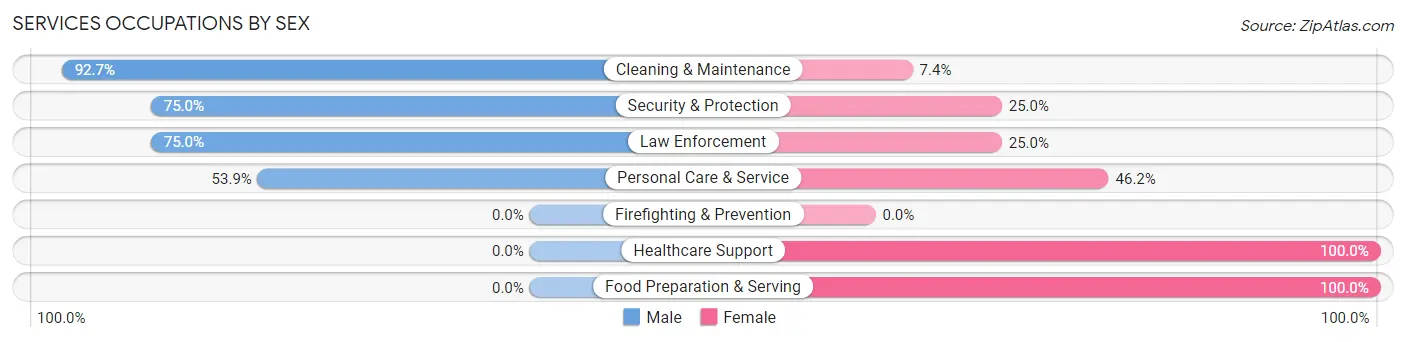
Services Occupations by Sex
Within the Services occupations in Kingsford Heights, the most male-oriented occupations are Cleaning & Maintenance (92.6%), Security & Protection (75.0%), and Law Enforcement (75.0%), while the most female-oriented occupations are Healthcare Support (100.0%), Food Preparation & Serving (100.0%), and Personal Care & Service (46.2%).
| Occupation | Male | Female |
| Healthcare Support | 0 (0.0%) | 29 (100.0%) |
| Security & Protection | 9 (75.0%) | 3 (25.0%) |
| Firefighting & Prevention | 0 (0.0%) | 0 (0.0%) |
| Law Enforcement | 9 (75.0%) | 3 (25.0%) |
| Food Preparation & Serving | 0 (0.0%) | 15 (100.0%) |
| Cleaning & Maintenance | 63 (92.6%) | 5 (7.3%) |
| Personal Care & Service | 7 (53.8%) | 6 (46.2%) |
| Total (Category) | 79 (57.7%) | 58 (42.3%) |
| Total (Overall) | 311 (52.9%) | 277 (47.1%) |
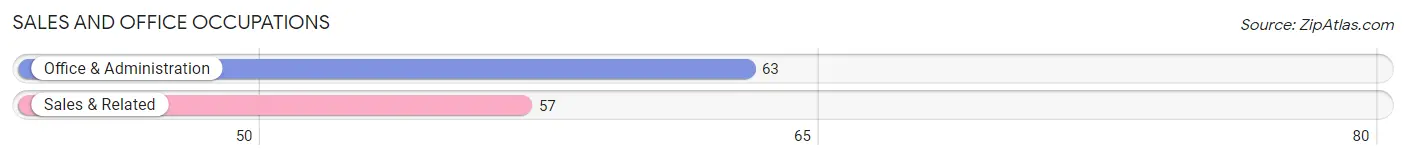
Sales and Office Occupations
The most common Sales and Office occupations in Kingsford Heights are Office & Administration (63 | 10.7%), and Sales & Related (57 | 9.7%).
Sales and Office Occupations by Sex
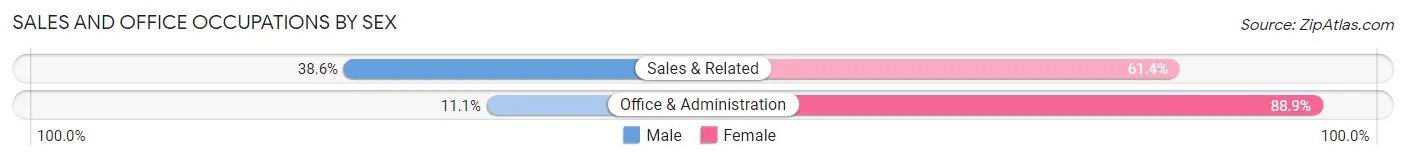
| Occupation | Male | Female |
| Sales & Related | 22 (38.6%) | 35 (61.4%) |
| Office & Administration | 7 (11.1%) | 56 (88.9%) |
| Total (Category) | 29 (24.2%) | 91 (75.8%) |
| Total (Overall) | 311 (52.9%) | 277 (47.1%) |
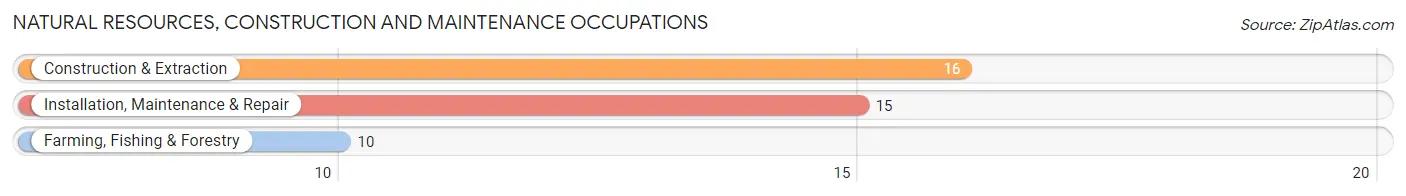
Natural Resources, Construction and Maintenance Occupations
The most common Natural Resources, Construction and Maintenance occupations in Kingsford Heights are Construction & Extraction (16 | 2.7%), Installation, Maintenance & Repair (15 | 2.5%), and Farming, Fishing & Forestry (10 | 1.7%).
Natural Resources, Construction and Maintenance Occupations by Sex
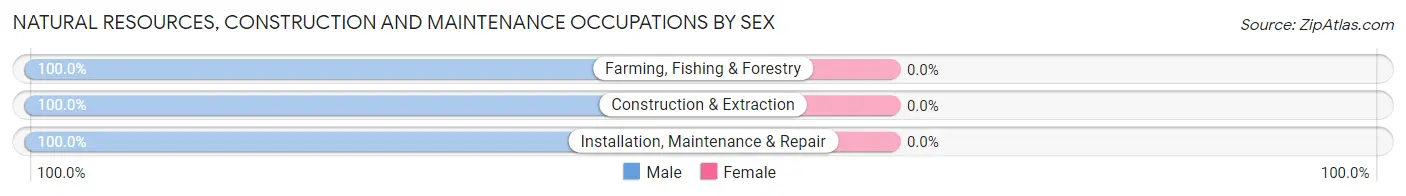
| Occupation | Male | Female |
| Farming, Fishing & Forestry | 10 (100.0%) | 0 (0.0%) |
| Construction & Extraction | 16 (100.0%) | 0 (0.0%) |
| Installation, Maintenance & Repair | 15 (100.0%) | 0 (0.0%) |
| Total (Category) | 41 (100.0%) | 0 (0.0%) |
| Total (Overall) | 311 (52.9%) | 277 (47.1%) |
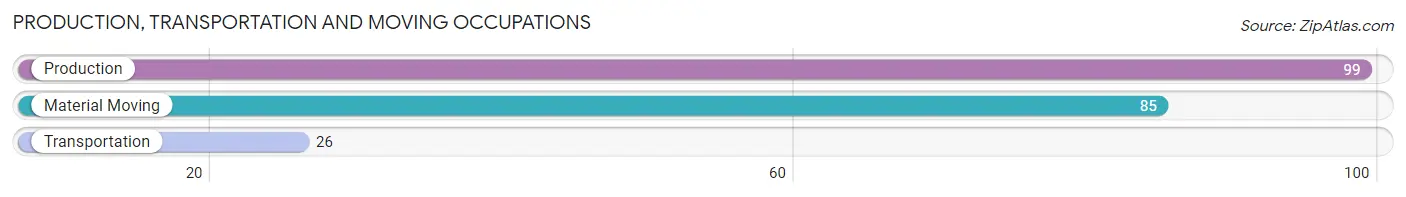
Production, Transportation and Moving Occupations
The most common Production, Transportation and Moving occupations in Kingsford Heights are Production (99 | 16.8%), Material Moving (85 | 14.5%), and Transportation (26 | 4.4%).
Production, Transportation and Moving Occupations by Sex
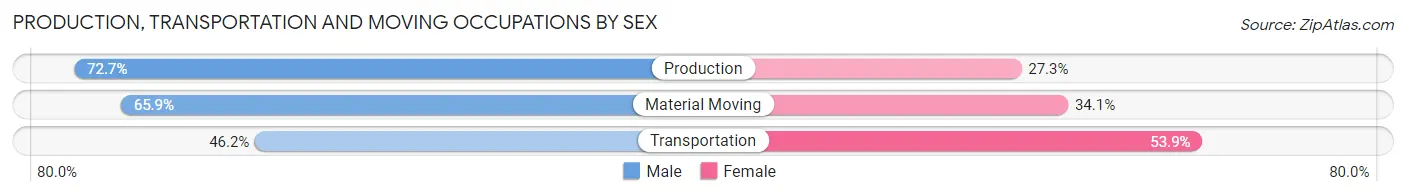
| Occupation | Male | Female |
| Production | 72 (72.7%) | 27 (27.3%) |
| Transportation | 12 (46.2%) | 14 (53.8%) |
| Material Moving | 56 (65.9%) | 29 (34.1%) |
| Total (Category) | 140 (66.7%) | 70 (33.3%) |
| Total (Overall) | 311 (52.9%) | 277 (47.1%) |
Employment Industries by Sex in Kingsford Heights
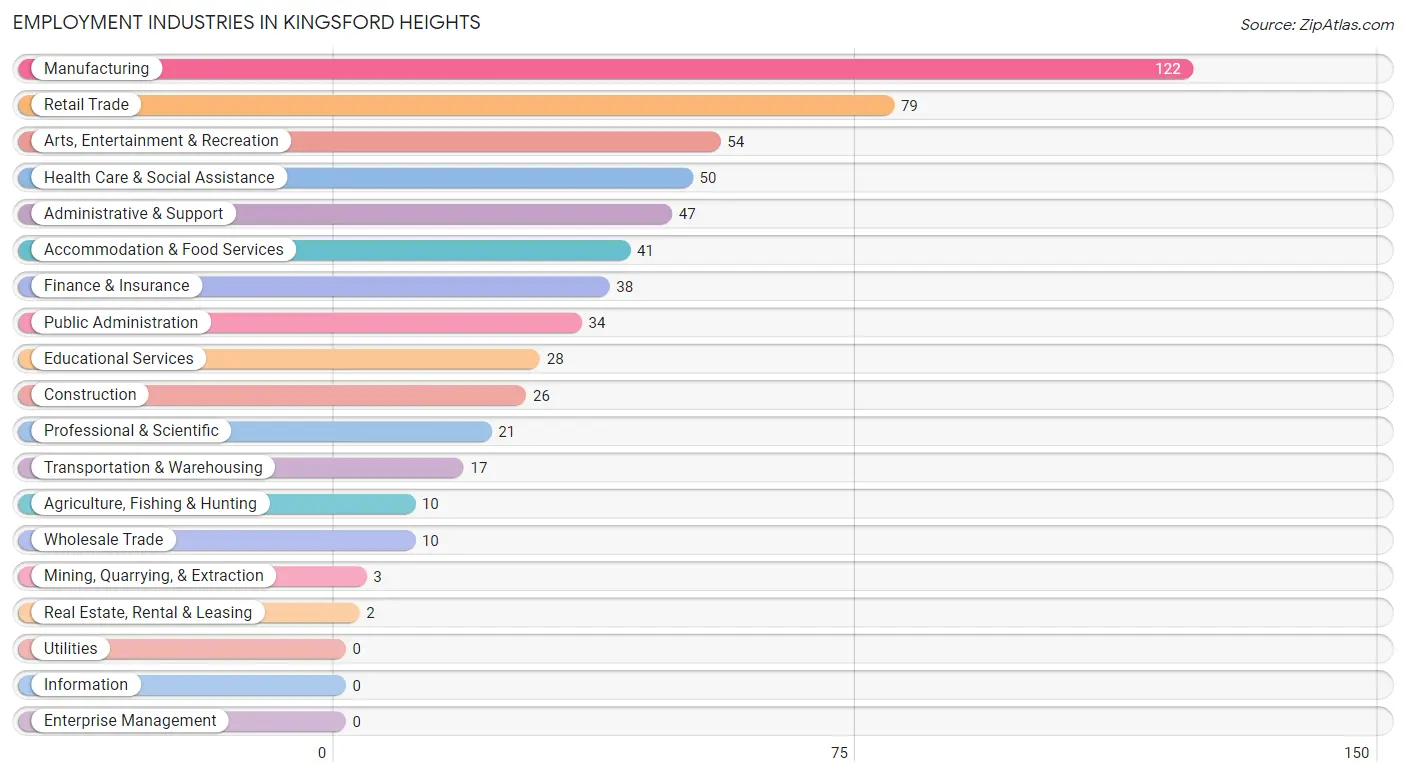
Employment Industries in Kingsford Heights
The major employment industries in Kingsford Heights include Manufacturing (122 | 20.7%), Retail Trade (79 | 13.4%), Arts, Entertainment & Recreation (54 | 9.2%), Health Care & Social Assistance (50 | 8.5%), and Administrative & Support (47 | 8.0%).
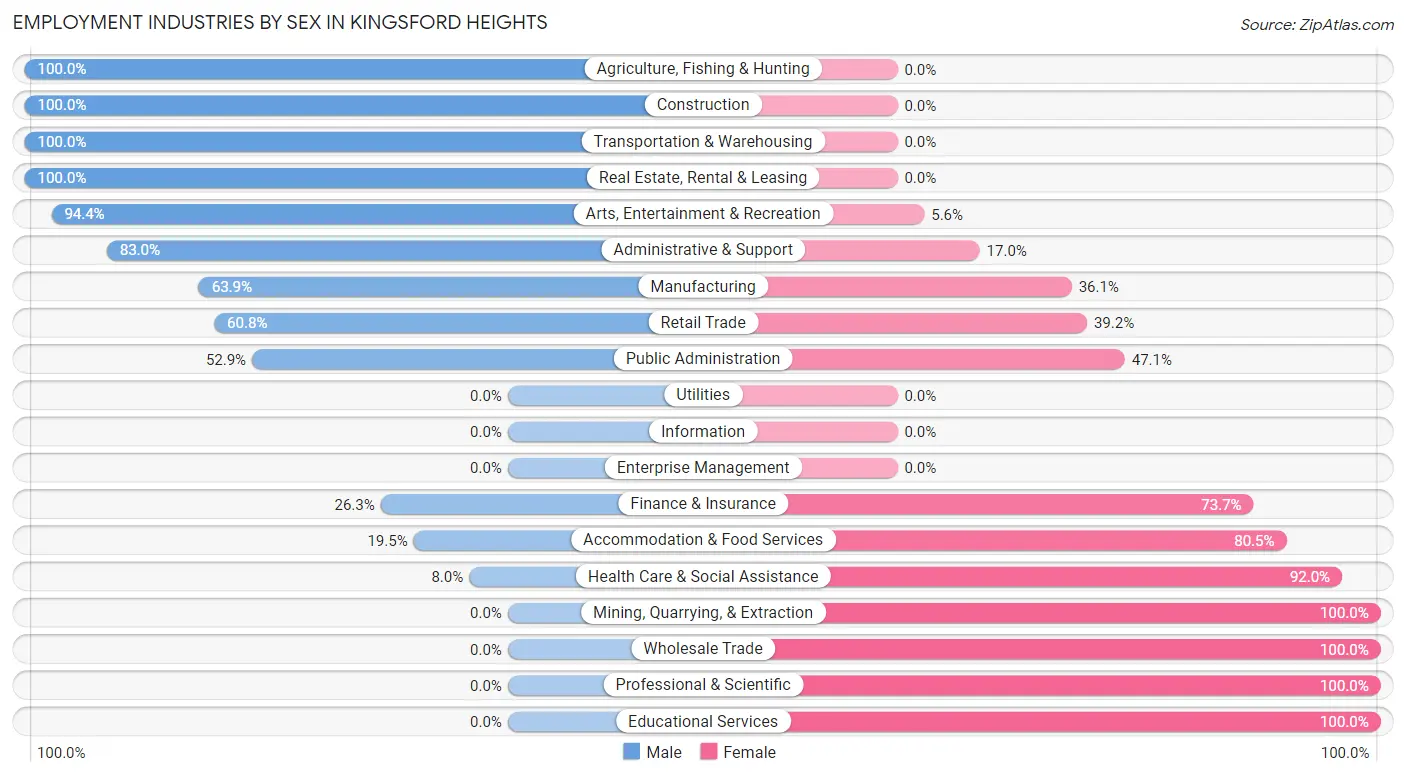
Employment Industries by Sex in Kingsford Heights
The Kingsford Heights industries that see more men than women are Agriculture, Fishing & Hunting (100.0%), Construction (100.0%), and Transportation & Warehousing (100.0%), whereas the industries that tend to have a higher number of women are Mining, Quarrying, & Extraction (100.0%), Wholesale Trade (100.0%), and Professional & Scientific (100.0%).
| Industry | Male | Female |
| Agriculture, Fishing & Hunting | 10 (100.0%) | 0 (0.0%) |
| Mining, Quarrying, & Extraction | 0 (0.0%) | 3 (100.0%) |
| Construction | 26 (100.0%) | 0 (0.0%) |
| Manufacturing | 78 (63.9%) | 44 (36.1%) |
| Wholesale Trade | 0 (0.0%) | 10 (100.0%) |
| Retail Trade | 48 (60.8%) | 31 (39.2%) |
| Transportation & Warehousing | 17 (100.0%) | 0 (0.0%) |
| Utilities | 0 (0.0%) | 0 (0.0%) |
| Information | 0 (0.0%) | 0 (0.0%) |
| Finance & Insurance | 10 (26.3%) | 28 (73.7%) |
| Real Estate, Rental & Leasing | 2 (100.0%) | 0 (0.0%) |
| Professional & Scientific | 0 (0.0%) | 21 (100.0%) |
| Enterprise Management | 0 (0.0%) | 0 (0.0%) |
| Administrative & Support | 39 (83.0%) | 8 (17.0%) |
| Educational Services | 0 (0.0%) | 28 (100.0%) |
| Health Care & Social Assistance | 4 (8.0%) | 46 (92.0%) |
| Arts, Entertainment & Recreation | 51 (94.4%) | 3 (5.6%) |
| Accommodation & Food Services | 8 (19.5%) | 33 (80.5%) |
| Public Administration | 18 (52.9%) | 16 (47.1%) |
| Total | 311 (52.9%) | 277 (47.1%) |
Education in Kingsford Heights
School Enrollment in Kingsford Heights
The most common levels of schooling among the 299 students in Kingsford Heights are elementary school (124 | 41.5%), high school (88 | 29.4%), and kindergarten (30 | 10.0%).
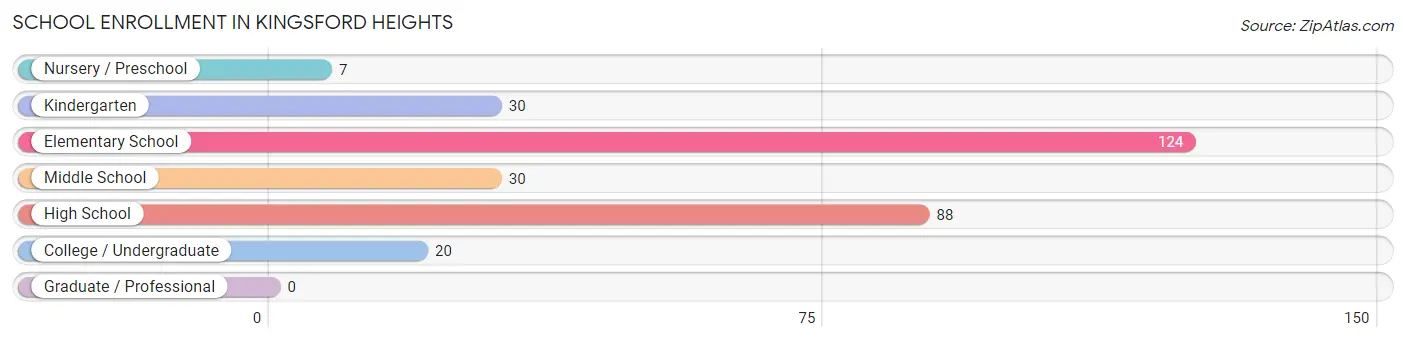
| School Level | # Students | % Students |
| Nursery / Preschool | 7 | 2.3% |
| Kindergarten | 30 | 10.0% |
| Elementary School | 124 | 41.5% |
| Middle School | 30 | 10.0% |
| High School | 88 | 29.4% |
| College / Undergraduate | 20 | 6.7% |
| Graduate / Professional | 0 | 0.0% |
| Total | 299 | 100.0% |
School Enrollment by Age by Funding Source in Kingsford Heights
Out of a total of 299 students who are enrolled in schools in Kingsford Heights, 32 (10.7%) attend a private institution, while the remaining 267 (89.3%) are enrolled in public schools. The age group of 5 to 9 year old has the highest likelihood of being enrolled in private schools, with 32 (23.9% in the age bracket) enrolled. Conversely, the age group of 3 to 4 year olds has the lowest likelihood of being enrolled in a private school, with 7 (100.0% in the age bracket) attending a public institution.
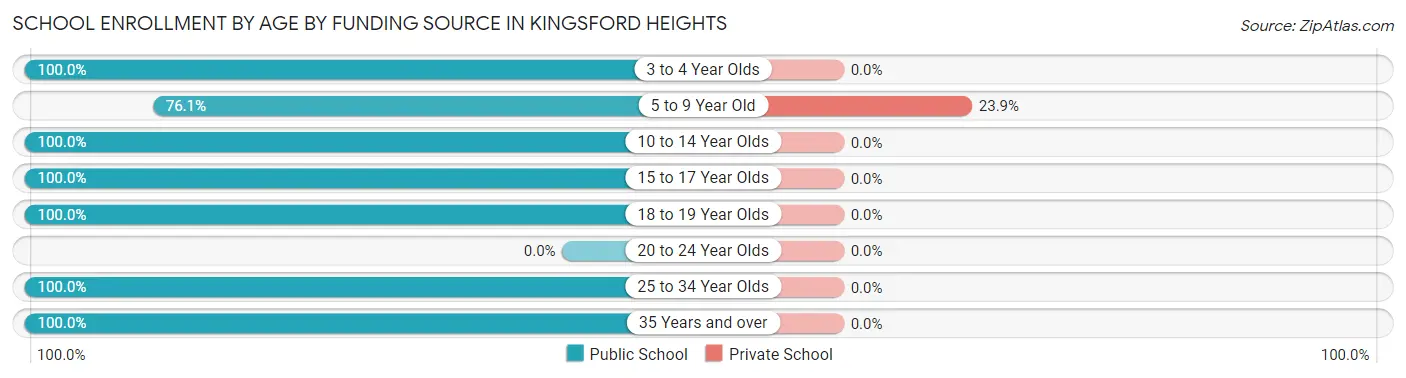
| Age Bracket | Public School | Private School |
| 3 to 4 Year Olds | 7 (100.0%) | 0 (0.0%) |
| 5 to 9 Year Old | 102 (76.1%) | 32 (23.9%) |
| 10 to 14 Year Olds | 74 (100.0%) | 0 (0.0%) |
| 15 to 17 Year Olds | 44 (100.0%) | 0 (0.0%) |
| 18 to 19 Year Olds | 15 (100.0%) | 0 (0.0%) |
| 20 to 24 Year Olds | 0 (0.0%) | 0 (0.0%) |
| 25 to 34 Year Olds | 17 (100.0%) | 0 (0.0%) |
| 35 Years and over | 8 (100.0%) | 0 (0.0%) |
| Total | 267 (89.3%) | 32 (10.7%) |
Educational Attainment by Field of Study in Kingsford Heights
Business (20 | 27.8%), computers & mathematics (12 | 16.7%), science & technology (10 | 13.9%), social sciences (9 | 12.5%), and liberal arts & history (9 | 12.5%) are the most common fields of study among 72 individuals in Kingsford Heights who have obtained a bachelor's degree or higher.
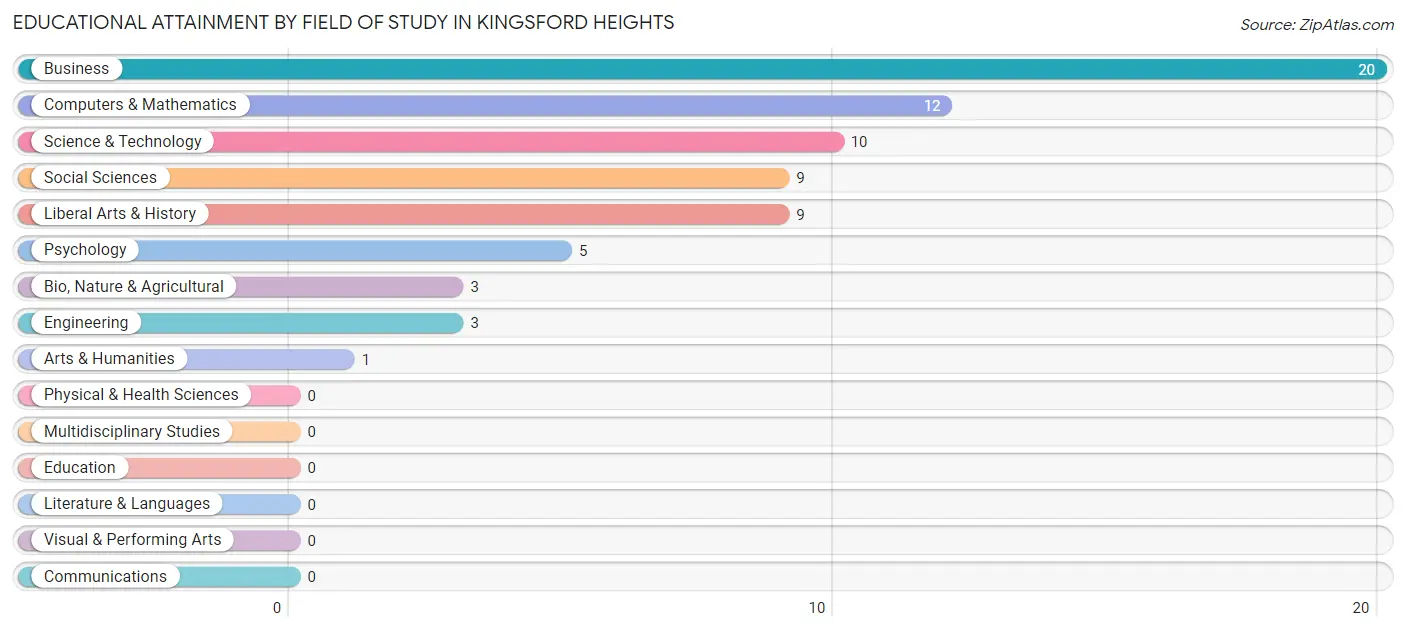
| Field of Study | # Graduates | % Graduates |
| Computers & Mathematics | 12 | 16.7% |
| Bio, Nature & Agricultural | 3 | 4.2% |
| Physical & Health Sciences | 0 | 0.0% |
| Psychology | 5 | 6.9% |
| Social Sciences | 9 | 12.5% |
| Engineering | 3 | 4.2% |
| Multidisciplinary Studies | 0 | 0.0% |
| Science & Technology | 10 | 13.9% |
| Business | 20 | 27.8% |
| Education | 0 | 0.0% |
| Literature & Languages | 0 | 0.0% |
| Liberal Arts & History | 9 | 12.5% |
| Visual & Performing Arts | 0 | 0.0% |
| Communications | 0 | 0.0% |
| Arts & Humanities | 1 | 1.4% |
| Total | 72 | 100.0% |
Transportation & Commute in Kingsford Heights
Vehicle Availability by Sex in Kingsford Heights
The most prevalent vehicle ownership categories in Kingsford Heights are males with 2 vehicles (143, accounting for 45.1%) and females with 2 vehicles (104, making up 52.0%).
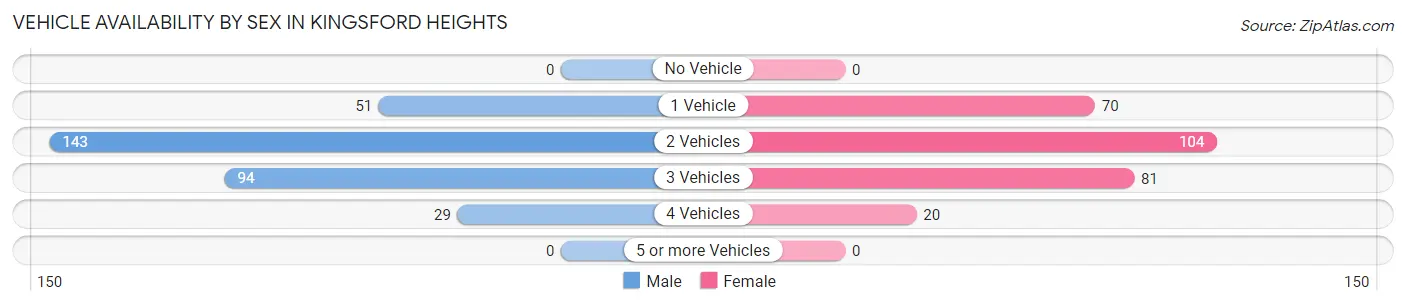
| Vehicles Available | Male | Female |
| No Vehicle | 0 (0.0%) | 0 (0.0%) |
| 1 Vehicle | 51 (16.1%) | 70 (25.5%) |
| 2 Vehicles | 143 (45.1%) | 104 (37.8%) |
| 3 Vehicles | 94 (29.6%) | 81 (29.4%) |
| 4 Vehicles | 29 (9.1%) | 20 (7.3%) |
| 5 or more Vehicles | 0 (0.0%) | 0 (0.0%) |
| Total | 317 (100.0%) | 275 (100.0%) |
Commute Time in Kingsford Heights
The most frequently occuring commute durations in Kingsford Heights are 30 to 34 minutes (191 commuters, 32.7%), 20 to 24 minutes (74 commuters, 12.7%), and 15 to 19 minutes (70 commuters, 12.0%).
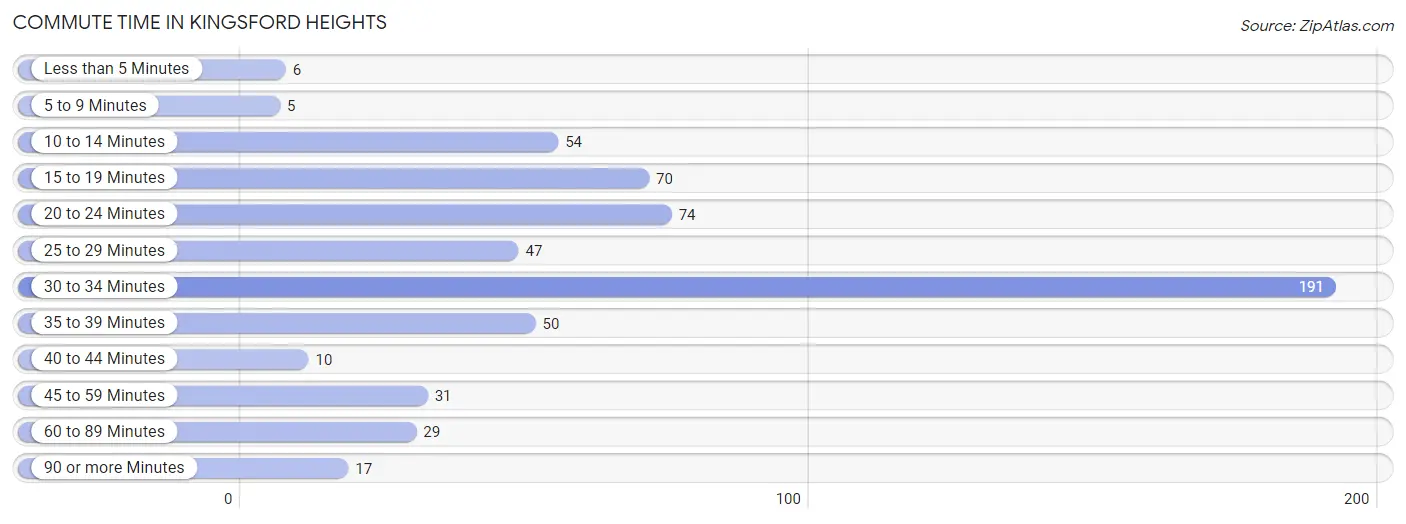
| Commute Time | # Commuters | % Commuters |
| Less than 5 Minutes | 6 | 1.0% |
| 5 to 9 Minutes | 5 | 0.9% |
| 10 to 14 Minutes | 54 | 9.2% |
| 15 to 19 Minutes | 70 | 12.0% |
| 20 to 24 Minutes | 74 | 12.7% |
| 25 to 29 Minutes | 47 | 8.1% |
| 30 to 34 Minutes | 191 | 32.7% |
| 35 to 39 Minutes | 50 | 8.6% |
| 40 to 44 Minutes | 10 | 1.7% |
| 45 to 59 Minutes | 31 | 5.3% |
| 60 to 89 Minutes | 29 | 5.0% |
| 90 or more Minutes | 17 | 2.9% |
Commute Time by Sex in Kingsford Heights
The most common commute times in Kingsford Heights are 30 to 34 minutes (110 commuters, 34.7%) for males and 30 to 34 minutes (81 commuters, 30.3%) for females.
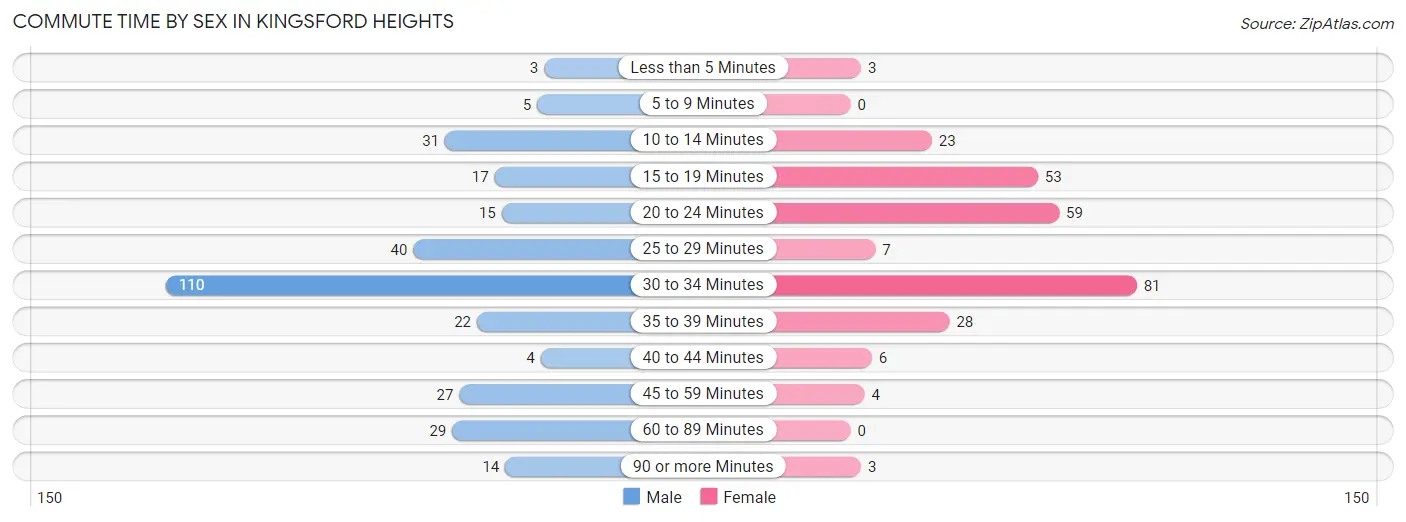
| Commute Time | Male | Female |
| Less than 5 Minutes | 3 (0.9%) | 3 (1.1%) |
| 5 to 9 Minutes | 5 (1.6%) | 0 (0.0%) |
| 10 to 14 Minutes | 31 (9.8%) | 23 (8.6%) |
| 15 to 19 Minutes | 17 (5.4%) | 53 (19.9%) |
| 20 to 24 Minutes | 15 (4.7%) | 59 (22.1%) |
| 25 to 29 Minutes | 40 (12.6%) | 7 (2.6%) |
| 30 to 34 Minutes | 110 (34.7%) | 81 (30.3%) |
| 35 to 39 Minutes | 22 (6.9%) | 28 (10.5%) |
| 40 to 44 Minutes | 4 (1.3%) | 6 (2.2%) |
| 45 to 59 Minutes | 27 (8.5%) | 4 (1.5%) |
| 60 to 89 Minutes | 29 (9.1%) | 0 (0.0%) |
| 90 or more Minutes | 14 (4.4%) | 3 (1.1%) |
Time of Departure to Work by Sex in Kingsford Heights
The most frequent times of departure to work in Kingsford Heights are 12:00 AM to 4:59 AM (106, 33.4%) for males and 5:00 AM to 5:29 AM (57, 21.3%) for females.
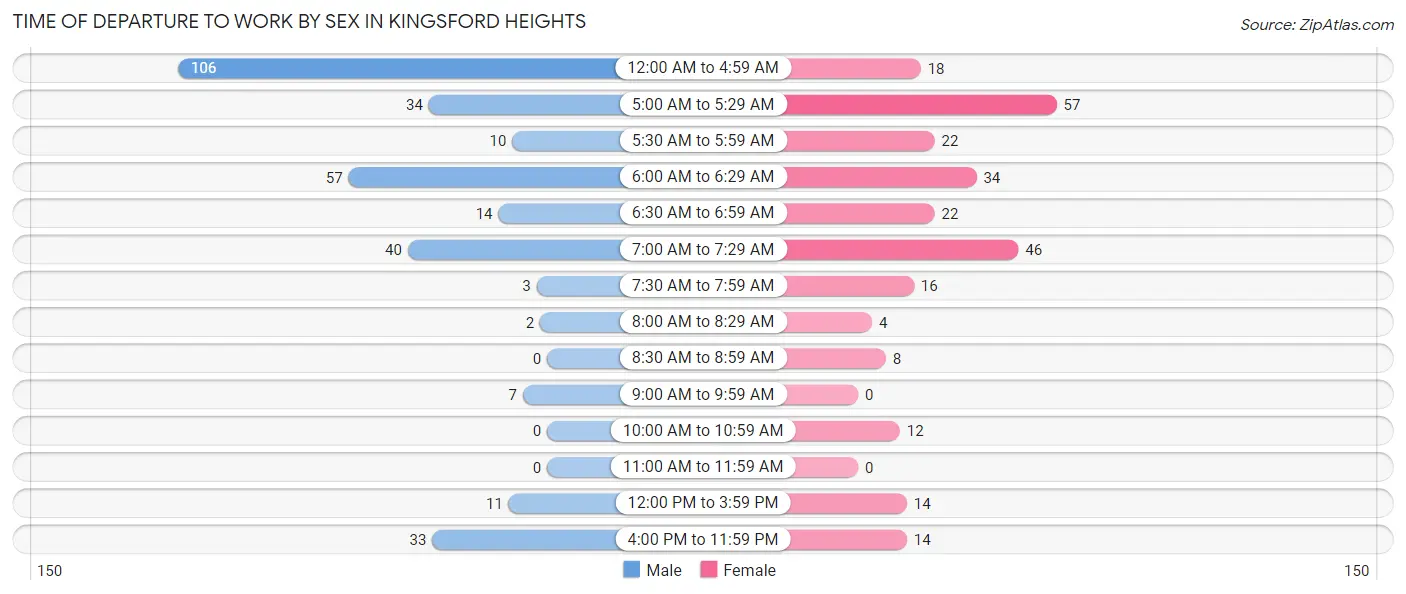
| Time of Departure | Male | Female |
| 12:00 AM to 4:59 AM | 106 (33.4%) | 18 (6.7%) |
| 5:00 AM to 5:29 AM | 34 (10.7%) | 57 (21.3%) |
| 5:30 AM to 5:59 AM | 10 (3.2%) | 22 (8.2%) |
| 6:00 AM to 6:29 AM | 57 (18.0%) | 34 (12.7%) |
| 6:30 AM to 6:59 AM | 14 (4.4%) | 22 (8.2%) |
| 7:00 AM to 7:29 AM | 40 (12.6%) | 46 (17.2%) |
| 7:30 AM to 7:59 AM | 3 (0.9%) | 16 (6.0%) |
| 8:00 AM to 8:29 AM | 2 (0.6%) | 4 (1.5%) |
| 8:30 AM to 8:59 AM | 0 (0.0%) | 8 (3.0%) |
| 9:00 AM to 9:59 AM | 7 (2.2%) | 0 (0.0%) |
| 10:00 AM to 10:59 AM | 0 (0.0%) | 12 (4.5%) |
| 11:00 AM to 11:59 AM | 0 (0.0%) | 0 (0.0%) |
| 12:00 PM to 3:59 PM | 11 (3.5%) | 14 (5.2%) |
| 4:00 PM to 11:59 PM | 33 (10.4%) | 14 (5.2%) |
| Total | 317 (100.0%) | 267 (100.0%) |
Housing Occupancy in Kingsford Heights
Occupancy by Ownership in Kingsford Heights
Of the total 519 dwellings in Kingsford Heights, owner-occupied units account for 298 (57.4%), while renter-occupied units make up 221 (42.6%).
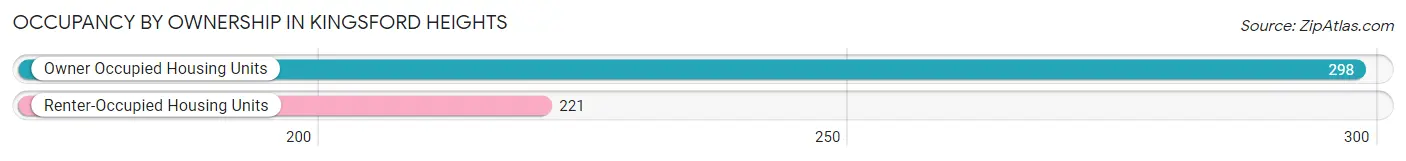
| Occupancy | # Housing Units | % Housing Units |
| Owner Occupied Housing Units | 298 | 57.4% |
| Renter-Occupied Housing Units | 221 | 42.6% |
| Total Occupied Housing Units | 519 | 100.0% |
Occupancy by Household Size in Kingsford Heights
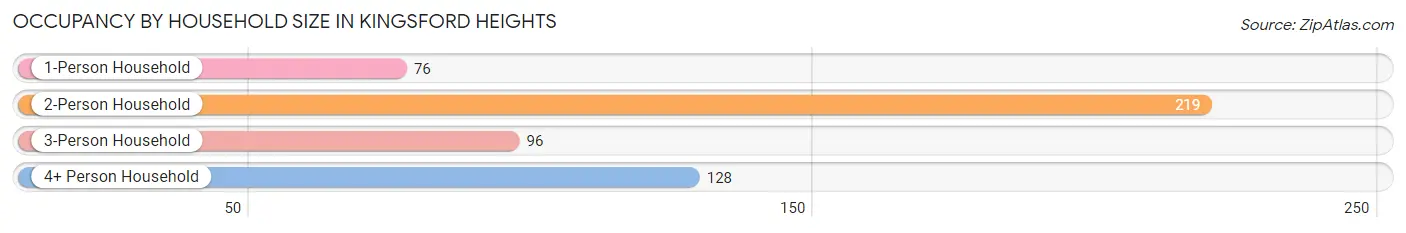
| Household Size | # Housing Units | % Housing Units |
| 1-Person Household | 76 | 14.6% |
| 2-Person Household | 219 | 42.2% |
| 3-Person Household | 96 | 18.5% |
| 4+ Person Household | 128 | 24.7% |
| Total Housing Units | 519 | 100.0% |
Occupancy by Ownership by Household Size in Kingsford Heights
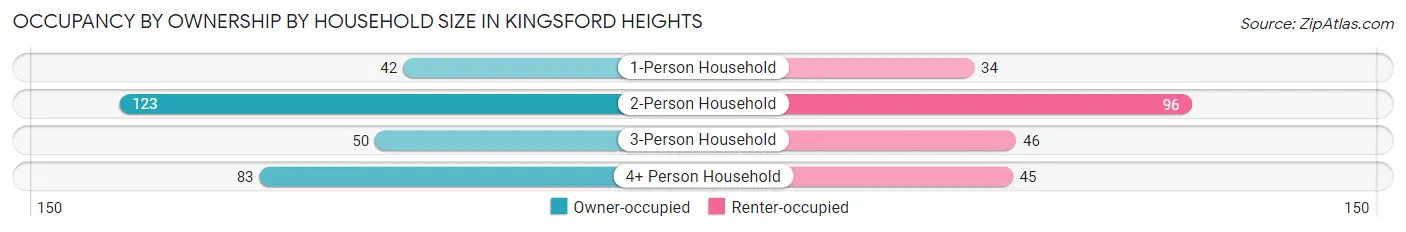
| Household Size | Owner-occupied | Renter-occupied |
| 1-Person Household | 42 (55.3%) | 34 (44.7%) |
| 2-Person Household | 123 (56.2%) | 96 (43.8%) |
| 3-Person Household | 50 (52.1%) | 46 (47.9%) |
| 4+ Person Household | 83 (64.8%) | 45 (35.2%) |
| Total Housing Units | 298 (57.4%) | 221 (42.6%) |
Occupancy by Educational Attainment in Kingsford Heights
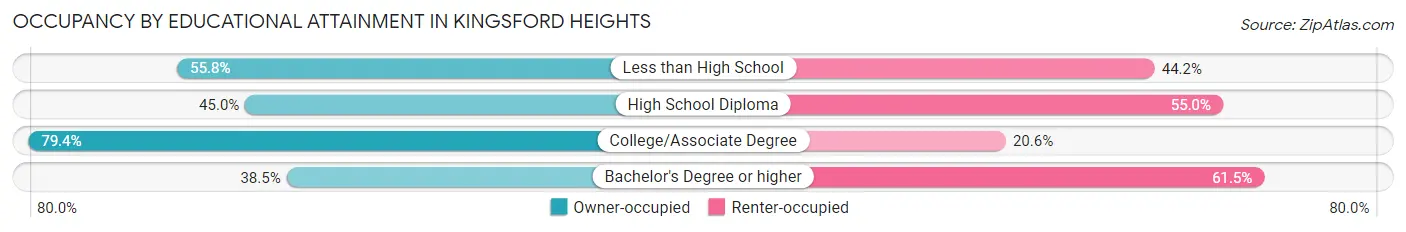
| Household Size | Owner-occupied | Renter-occupied |
| Less than High School | 48 (55.8%) | 38 (44.2%) |
| High School Diploma | 95 (45.0%) | 116 (55.0%) |
| College/Associate Degree | 135 (79.4%) | 35 (20.6%) |
| Bachelor's Degree or higher | 20 (38.5%) | 32 (61.5%) |
Occupancy by Age of Householder in Kingsford Heights
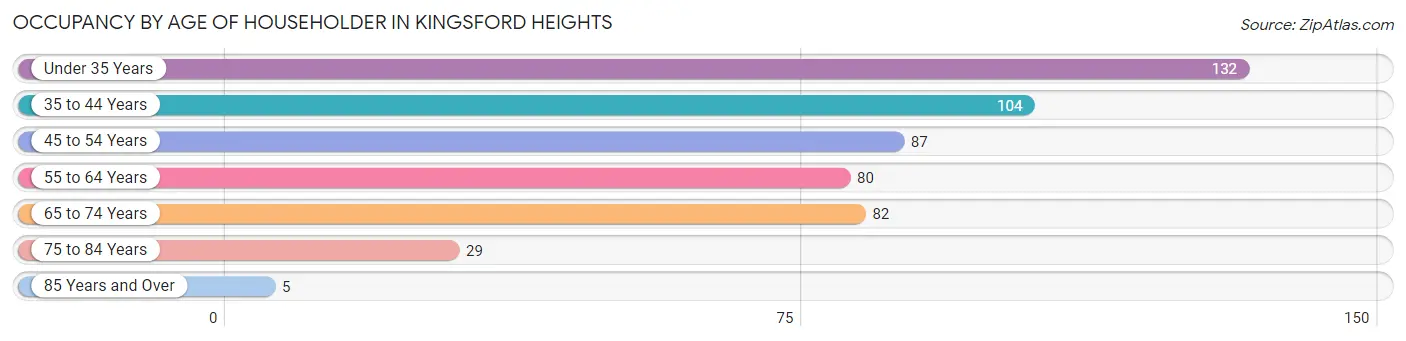
| Age Bracket | # Households | % Households |
| Under 35 Years | 132 | 25.4% |
| 35 to 44 Years | 104 | 20.0% |
| 45 to 54 Years | 87 | 16.8% |
| 55 to 64 Years | 80 | 15.4% |
| 65 to 74 Years | 82 | 15.8% |
| 75 to 84 Years | 29 | 5.6% |
| 85 Years and Over | 5 | 1.0% |
| Total | 519 | 100.0% |
Housing Finances in Kingsford Heights
Median Income by Occupancy in Kingsford Heights
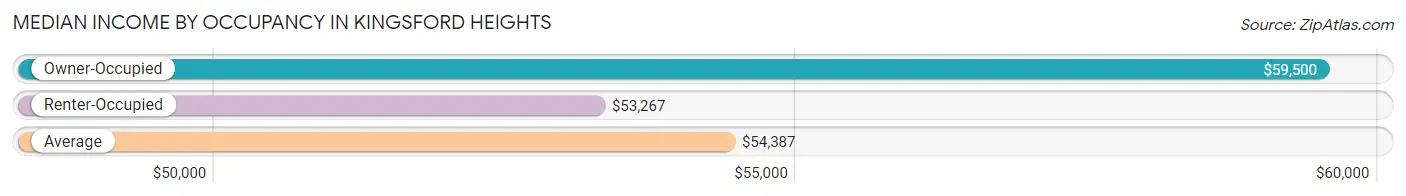
| Occupancy Type | # Households | Median Income |
| Owner-Occupied | 298 (57.4%) | $59,500 |
| Renter-Occupied | 221 (42.6%) | $53,267 |
| Average | 519 (100.0%) | $54,387 |
Occupancy by Householder Income Bracket in Kingsford Heights
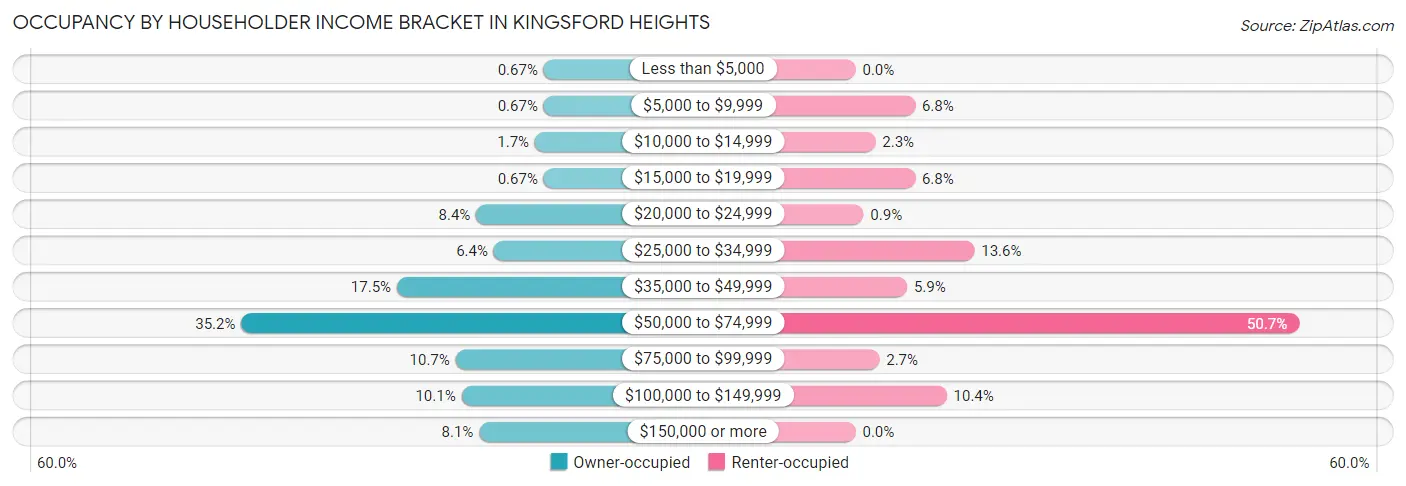
| Income Bracket | Owner-occupied | Renter-occupied |
| Less than $5,000 | 2 (0.7%) | 0 (0.0%) |
| $5,000 to $9,999 | 2 (0.7%) | 15 (6.8%) |
| $10,000 to $14,999 | 5 (1.7%) | 5 (2.3%) |
| $15,000 to $19,999 | 2 (0.7%) | 15 (6.8%) |
| $20,000 to $24,999 | 25 (8.4%) | 2 (0.9%) |
| $25,000 to $34,999 | 19 (6.4%) | 30 (13.6%) |
| $35,000 to $49,999 | 52 (17.4%) | 13 (5.9%) |
| $50,000 to $74,999 | 105 (35.2%) | 112 (50.7%) |
| $75,000 to $99,999 | 32 (10.7%) | 6 (2.7%) |
| $100,000 to $149,999 | 30 (10.1%) | 23 (10.4%) |
| $150,000 or more | 24 (8.1%) | 0 (0.0%) |
| Total | 298 (100.0%) | 221 (100.0%) |
Monthly Housing Cost Tiers in Kingsford Heights
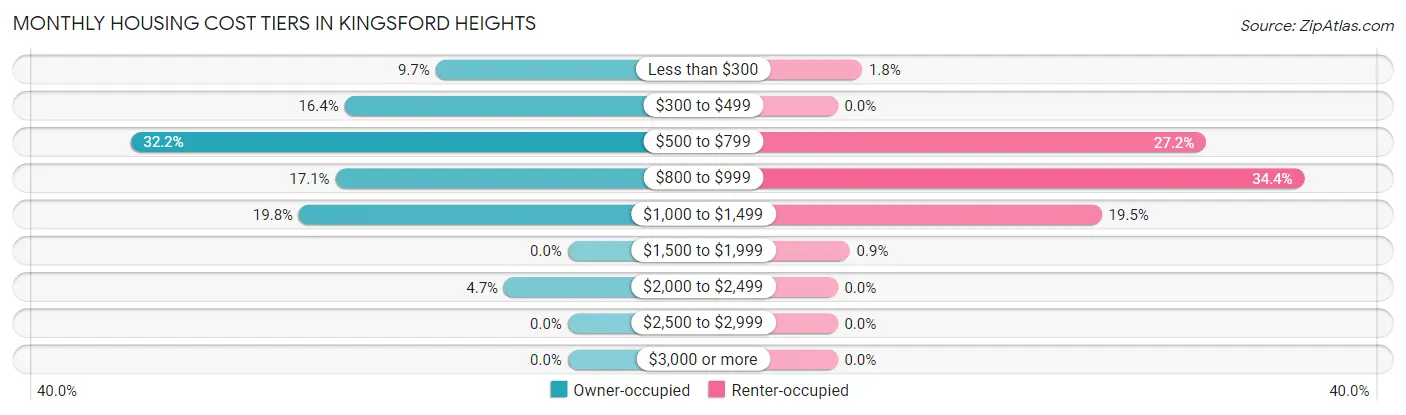
| Monthly Cost | Owner-occupied | Renter-occupied |
| Less than $300 | 29 (9.7%) | 4 (1.8%) |
| $300 to $499 | 49 (16.4%) | 0 (0.0%) |
| $500 to $799 | 96 (32.2%) | 60 (27.2%) |
| $800 to $999 | 51 (17.1%) | 76 (34.4%) |
| $1,000 to $1,499 | 59 (19.8%) | 43 (19.5%) |
| $1,500 to $1,999 | 0 (0.0%) | 2 (0.9%) |
| $2,000 to $2,499 | 14 (4.7%) | 0 (0.0%) |
| $2,500 to $2,999 | 0 (0.0%) | 0 (0.0%) |
| $3,000 or more | 0 (0.0%) | 0 (0.0%) |
| Total | 298 (100.0%) | 221 (100.0%) |
Physical Housing Characteristics in Kingsford Heights
Housing Structures in Kingsford Heights
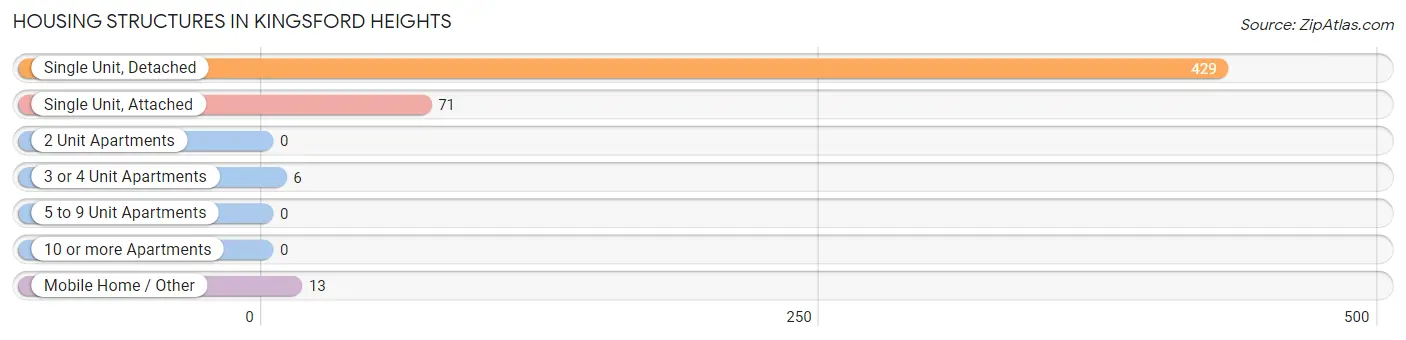
| Structure Type | # Housing Units | % Housing Units |
| Single Unit, Detached | 429 | 82.7% |
| Single Unit, Attached | 71 | 13.7% |
| 2 Unit Apartments | 0 | 0.0% |
| 3 or 4 Unit Apartments | 6 | 1.2% |
| 5 to 9 Unit Apartments | 0 | 0.0% |
| 10 or more Apartments | 0 | 0.0% |
| Mobile Home / Other | 13 | 2.5% |
| Total | 519 | 100.0% |
Housing Structures by Occupancy in Kingsford Heights
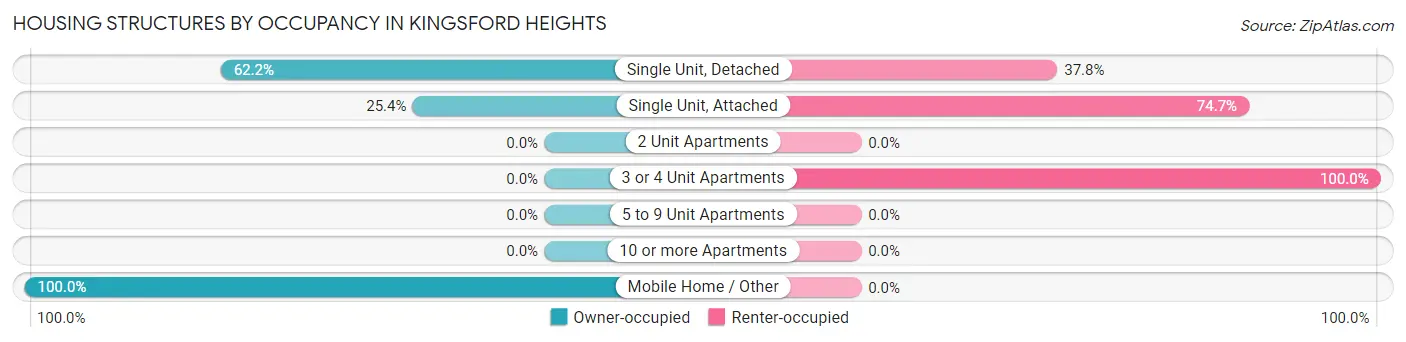
| Structure Type | Owner-occupied | Renter-occupied |
| Single Unit, Detached | 267 (62.2%) | 162 (37.8%) |
| Single Unit, Attached | 18 (25.4%) | 53 (74.7%) |
| 2 Unit Apartments | 0 (0.0%) | 0 (0.0%) |
| 3 or 4 Unit Apartments | 0 (0.0%) | 6 (100.0%) |
| 5 to 9 Unit Apartments | 0 (0.0%) | 0 (0.0%) |
| 10 or more Apartments | 0 (0.0%) | 0 (0.0%) |
| Mobile Home / Other | 13 (100.0%) | 0 (0.0%) |
| Total | 298 (57.4%) | 221 (42.6%) |
Housing Structures by Number of Rooms in Kingsford Heights
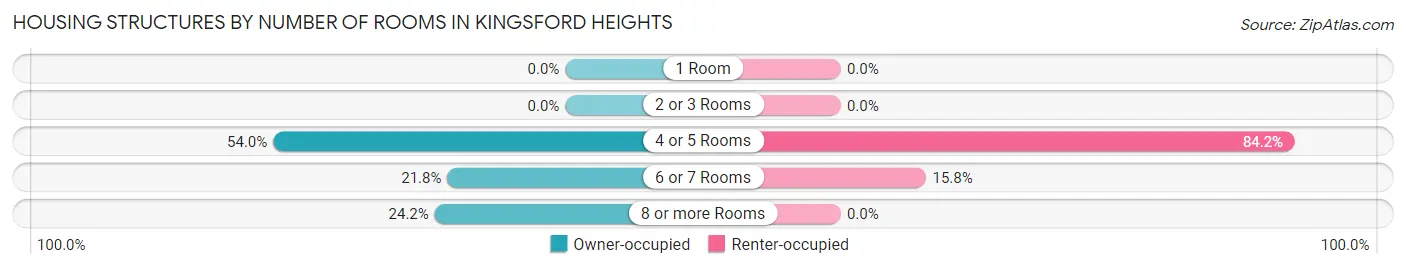
| Number of Rooms | Owner-occupied | Renter-occupied |
| 1 Room | 0 (0.0%) | 0 (0.0%) |
| 2 or 3 Rooms | 0 (0.0%) | 0 (0.0%) |
| 4 or 5 Rooms | 161 (54.0%) | 186 (84.2%) |
| 6 or 7 Rooms | 65 (21.8%) | 35 (15.8%) |
| 8 or more Rooms | 72 (24.2%) | 0 (0.0%) |
| Total | 298 (100.0%) | 221 (100.0%) |
Housing Structure by Heating Type in Kingsford Heights
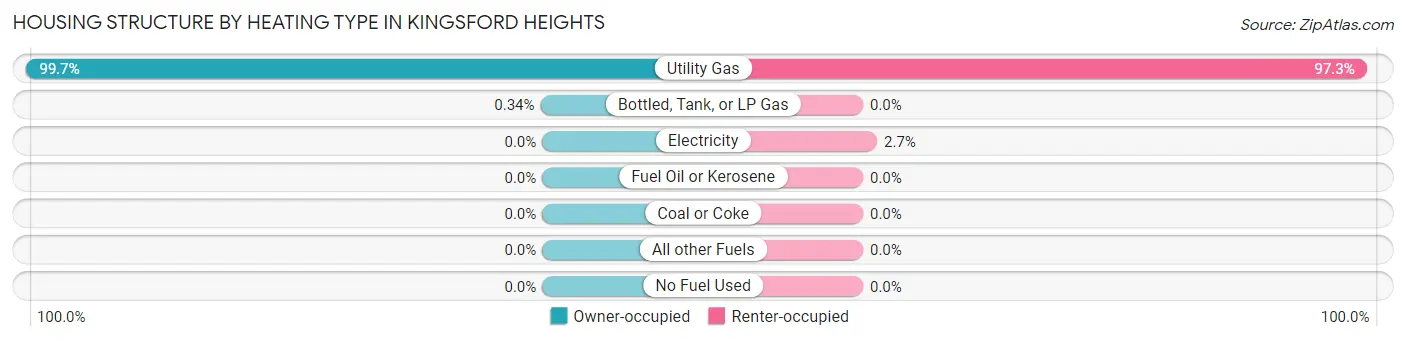
| Heating Type | Owner-occupied | Renter-occupied |
| Utility Gas | 297 (99.7%) | 215 (97.3%) |
| Bottled, Tank, or LP Gas | 1 (0.3%) | 0 (0.0%) |
| Electricity | 0 (0.0%) | 6 (2.7%) |
| Fuel Oil or Kerosene | 0 (0.0%) | 0 (0.0%) |
| Coal or Coke | 0 (0.0%) | 0 (0.0%) |
| All other Fuels | 0 (0.0%) | 0 (0.0%) |
| No Fuel Used | 0 (0.0%) | 0 (0.0%) |
| Total | 298 (100.0%) | 221 (100.0%) |
Household Vehicle Usage in Kingsford Heights
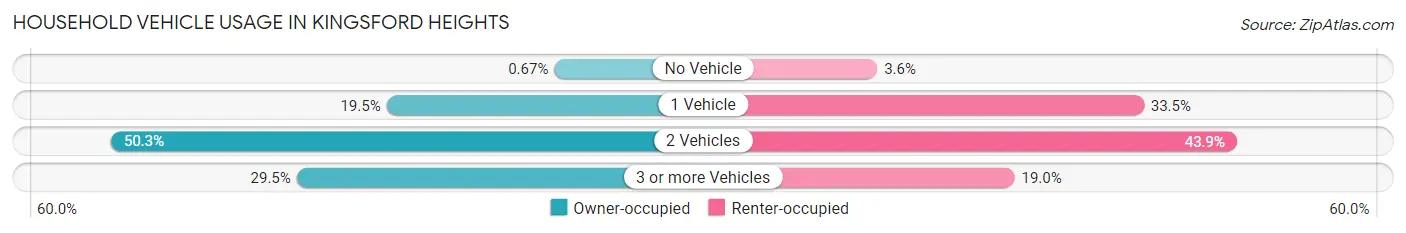
| Vehicles per Household | Owner-occupied | Renter-occupied |
| No Vehicle | 2 (0.7%) | 8 (3.6%) |
| 1 Vehicle | 58 (19.5%) | 74 (33.5%) |
| 2 Vehicles | 150 (50.3%) | 97 (43.9%) |
| 3 or more Vehicles | 88 (29.5%) | 42 (19.0%) |
| Total | 298 (100.0%) | 221 (100.0%) |
Real Estate & Mortgages in Kingsford Heights
Real Estate and Mortgage Overview in Kingsford Heights
| Characteristic | Without Mortgage | With Mortgage |
| Housing Units | 102 | 196 |
| Median Property Value | $85,000 | $87,000 |
| Median Household Income | $46,250 | $15 |
| Monthly Housing Costs | $356 | $0 |
| Real Estate Taxes | $871 | $3 |
Property Value by Mortgage Status in Kingsford Heights
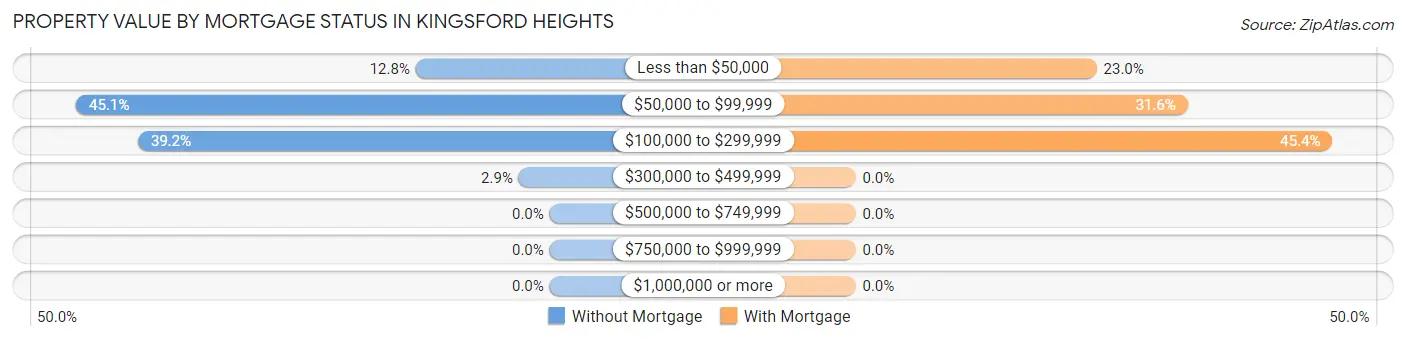
| Property Value | Without Mortgage | With Mortgage |
| Less than $50,000 | 13 (12.8%) | 45 (23.0%) |
| $50,000 to $99,999 | 46 (45.1%) | 62 (31.6%) |
| $100,000 to $299,999 | 40 (39.2%) | 89 (45.4%) |
| $300,000 to $499,999 | 3 (2.9%) | 0 (0.0%) |
| $500,000 to $749,999 | 0 (0.0%) | 0 (0.0%) |
| $750,000 to $999,999 | 0 (0.0%) | 0 (0.0%) |
| $1,000,000 or more | 0 (0.0%) | 0 (0.0%) |
| Total | 102 (100.0%) | 196 (100.0%) |
Household Income by Mortgage Status in Kingsford Heights
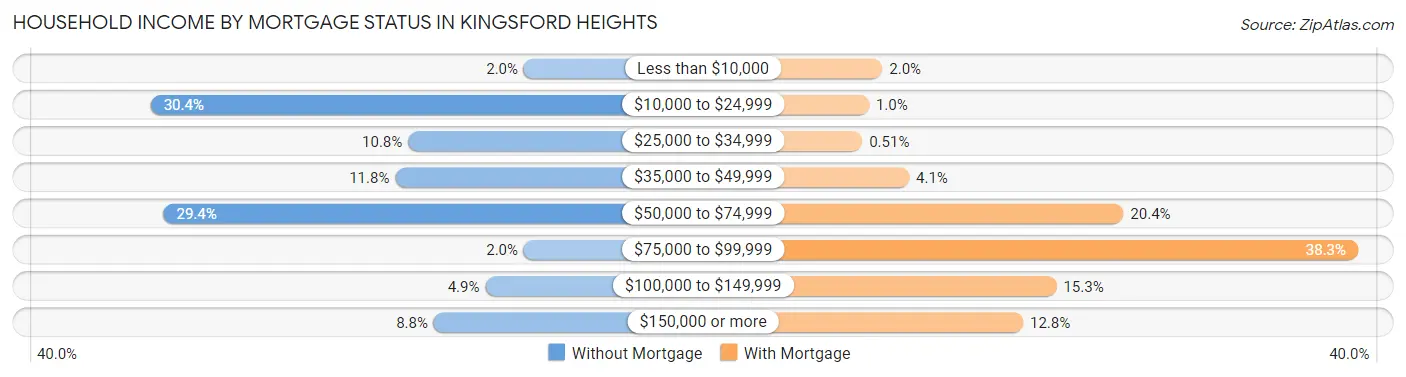
| Household Income | Without Mortgage | With Mortgage |
| Less than $10,000 | 2 (2.0%) | 4 (2.0%) |
| $10,000 to $24,999 | 31 (30.4%) | 2 (1.0%) |
| $25,000 to $34,999 | 11 (10.8%) | 1 (0.5%) |
| $35,000 to $49,999 | 12 (11.8%) | 8 (4.1%) |
| $50,000 to $74,999 | 30 (29.4%) | 40 (20.4%) |
| $75,000 to $99,999 | 2 (2.0%) | 75 (38.3%) |
| $100,000 to $149,999 | 5 (4.9%) | 30 (15.3%) |
| $150,000 or more | 9 (8.8%) | 25 (12.8%) |
| Total | 102 (100.0%) | 196 (100.0%) |
Property Value to Household Income Ratio in Kingsford Heights
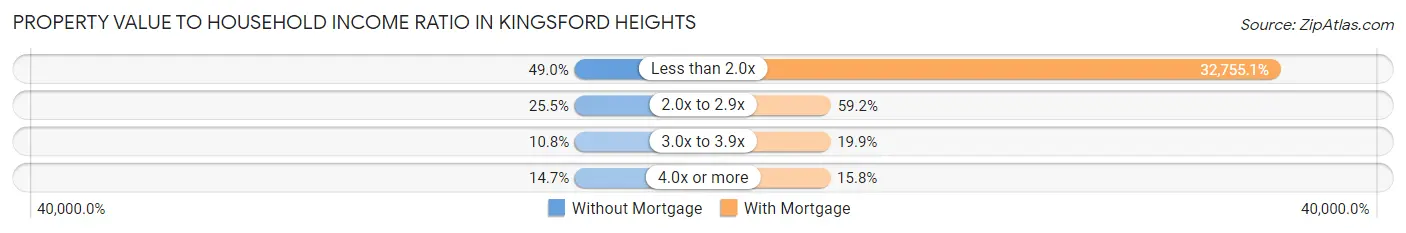
| Value-to-Income Ratio | Without Mortgage | With Mortgage |
| Less than 2.0x | 50 (49.0%) | 64,200 (32,755.1%) |
| 2.0x to 2.9x | 26 (25.5%) | 116 (59.2%) |
| 3.0x to 3.9x | 11 (10.8%) | 39 (19.9%) |
| 4.0x or more | 15 (14.7%) | 31 (15.8%) |
| Total | 102 (100.0%) | 196 (100.0%) |
Real Estate Taxes by Mortgage Status in Kingsford Heights
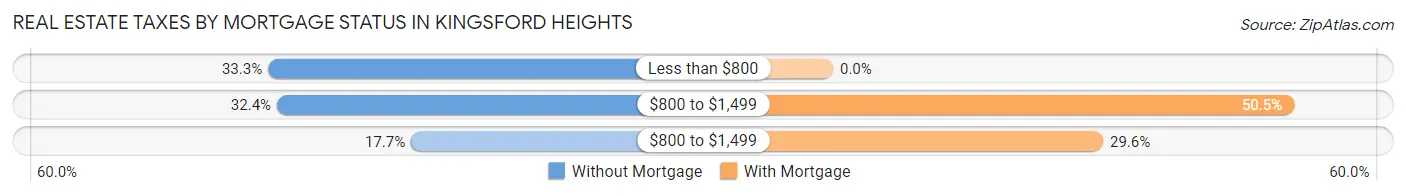
| Property Taxes | Without Mortgage | With Mortgage |
| Less than $800 | 34 (33.3%) | 0 (0.0%) |
| $800 to $1,499 | 33 (32.4%) | 99 (50.5%) |
| $800 to $1,499 | 18 (17.6%) | 58 (29.6%) |
| Total | 102 (100.0%) | 196 (100.0%) |
Health & Disability in Kingsford Heights
Health Insurance Coverage by Age in Kingsford Heights
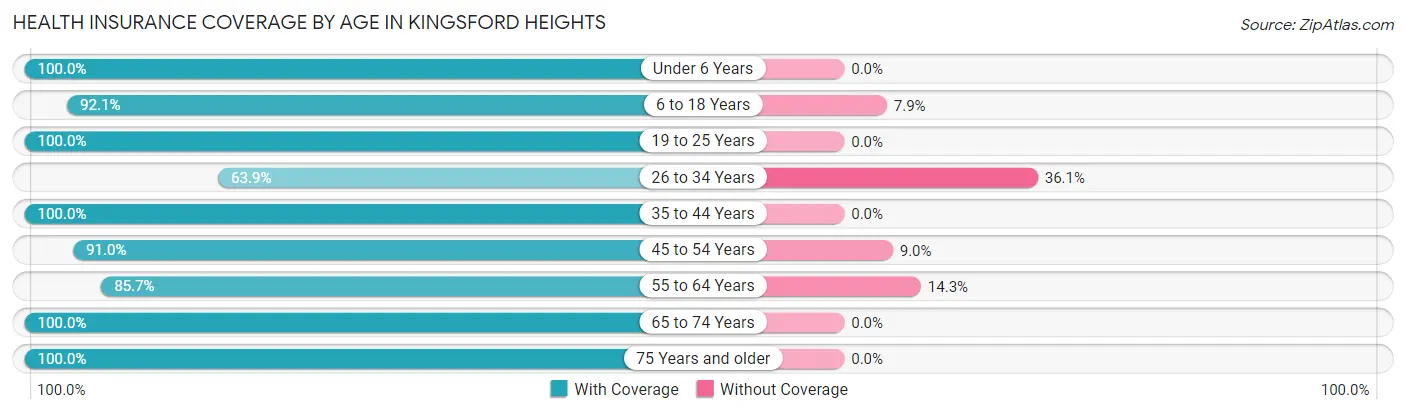
| Age Bracket | With Coverage | Without Coverage |
| Under 6 Years | 167 (100.0%) | 0 (0.0%) |
| 6 to 18 Years | 232 (92.1%) | 20 (7.9%) |
| 19 to 25 Years | 95 (100.0%) | 0 (0.0%) |
| 26 to 34 Years | 108 (63.9%) | 61 (36.1%) |
| 35 to 44 Years | 177 (100.0%) | 0 (0.0%) |
| 45 to 54 Years | 151 (91.0%) | 15 (9.0%) |
| 55 to 64 Years | 138 (85.7%) | 23 (14.3%) |
| 65 to 74 Years | 130 (100.0%) | 0 (0.0%) |
| 75 Years and older | 61 (100.0%) | 0 (0.0%) |
| Total | 1,259 (91.4%) | 119 (8.6%) |
Health Insurance Coverage by Citizenship Status in Kingsford Heights
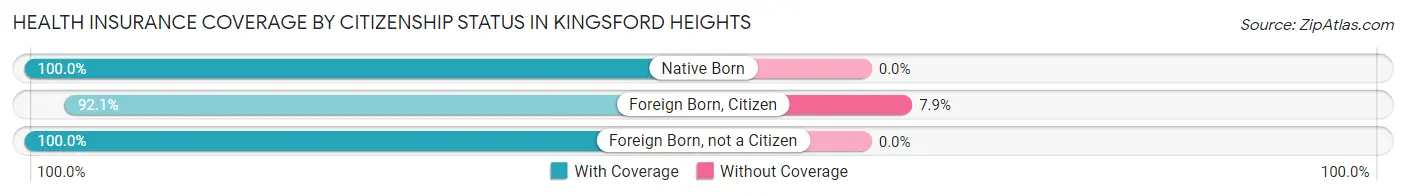
| Citizenship Status | With Coverage | Without Coverage |
| Native Born | 167 (100.0%) | 0 (0.0%) |
| Foreign Born, Citizen | 232 (92.1%) | 20 (7.9%) |
| Foreign Born, not a Citizen | 95 (100.0%) | 0 (0.0%) |
Health Insurance Coverage by Household Income in Kingsford Heights
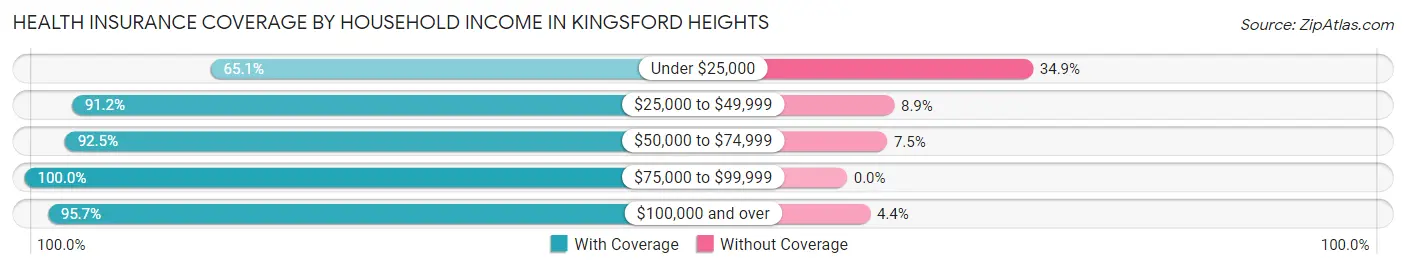
| Household Income | With Coverage | Without Coverage |
| Under $25,000 | 71 (65.1%) | 38 (34.9%) |
| $25,000 to $49,999 | 278 (91.1%) | 27 (8.8%) |
| $50,000 to $74,999 | 540 (92.5%) | 44 (7.5%) |
| $75,000 to $99,999 | 150 (100.0%) | 0 (0.0%) |
| $100,000 and over | 220 (95.7%) | 10 (4.3%) |
Public vs Private Health Insurance Coverage by Age in Kingsford Heights
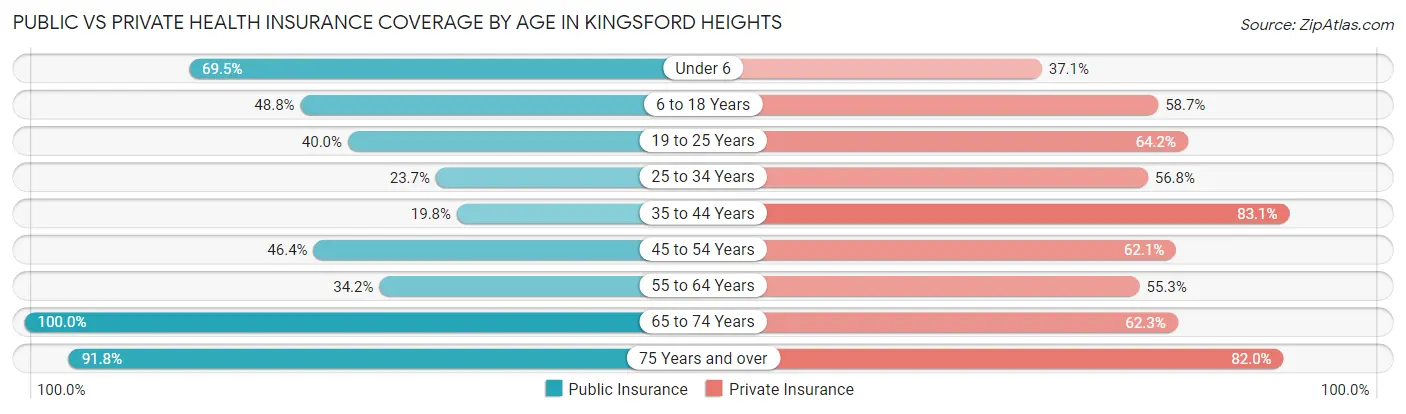
| Age Bracket | Public Insurance | Private Insurance |
| Under 6 | 116 (69.5%) | 62 (37.1%) |
| 6 to 18 Years | 123 (48.8%) | 148 (58.7%) |
| 19 to 25 Years | 38 (40.0%) | 61 (64.2%) |
| 25 to 34 Years | 40 (23.7%) | 96 (56.8%) |
| 35 to 44 Years | 35 (19.8%) | 147 (83.1%) |
| 45 to 54 Years | 77 (46.4%) | 103 (62.1%) |
| 55 to 64 Years | 55 (34.2%) | 89 (55.3%) |
| 65 to 74 Years | 130 (100.0%) | 81 (62.3%) |
| 75 Years and over | 56 (91.8%) | 50 (82.0%) |
| Total | 670 (48.6%) | 837 (60.7%) |
Disability Status by Sex by Age in Kingsford Heights
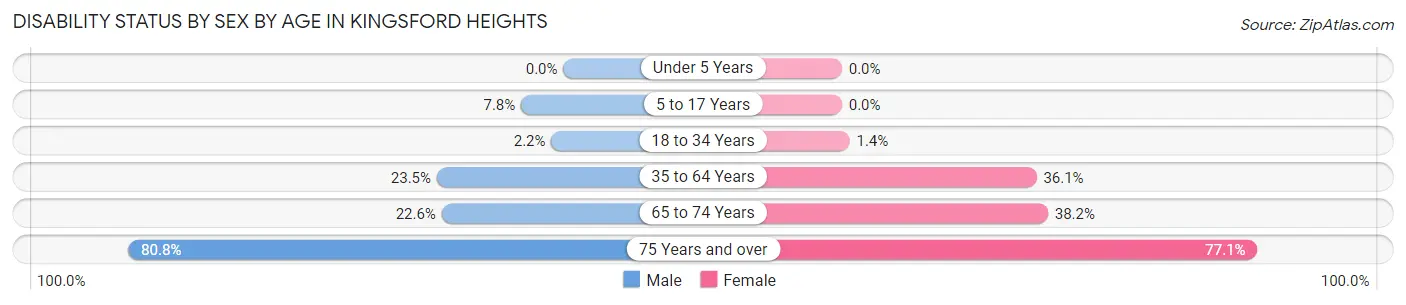
| Age Bracket | Male | Female |
| Under 5 Years | 0 (0.0%) | 0 (0.0%) |
| 5 to 17 Years | 12 (7.8%) | 0 (0.0%) |
| 18 to 34 Years | 3 (2.2%) | 2 (1.4%) |
| 35 to 64 Years | 54 (23.5%) | 99 (36.1%) |
| 65 to 74 Years | 14 (22.6%) | 26 (38.2%) |
| 75 Years and over | 21 (80.8%) | 27 (77.1%) |
Disability Class by Sex by Age in Kingsford Heights
Disability Class: Hearing Difficulty
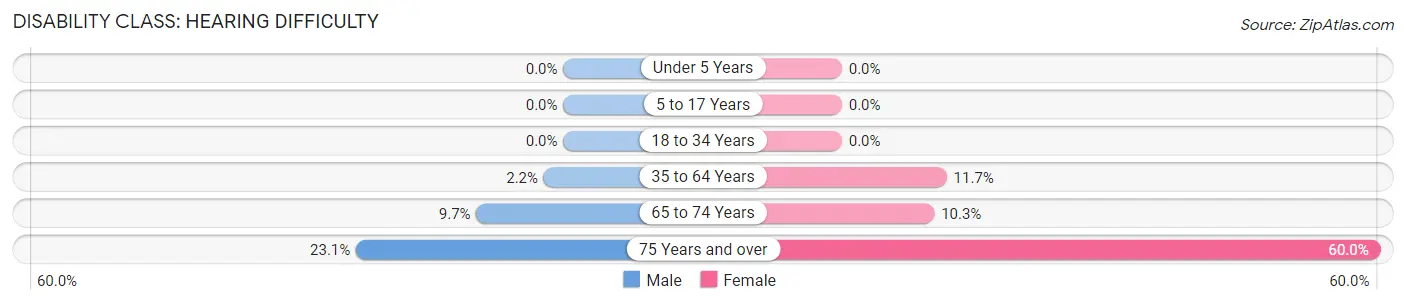
| Age Bracket | Male | Female |
| Under 5 Years | 0 (0.0%) | 0 (0.0%) |
| 5 to 17 Years | 0 (0.0%) | 0 (0.0%) |
| 18 to 34 Years | 0 (0.0%) | 0 (0.0%) |
| 35 to 64 Years | 5 (2.2%) | 32 (11.7%) |
| 65 to 74 Years | 6 (9.7%) | 7 (10.3%) |
| 75 Years and over | 6 (23.1%) | 21 (60.0%) |
Disability Class: Vision Difficulty
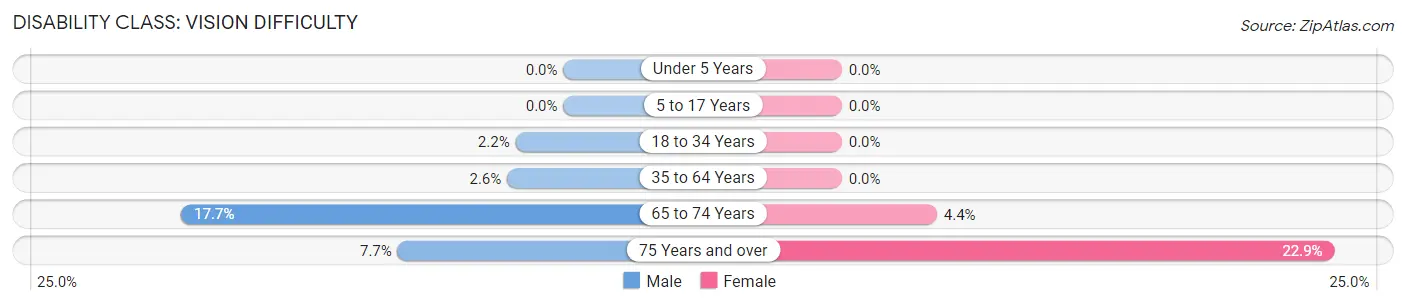
| Age Bracket | Male | Female |
| Under 5 Years | 0 (0.0%) | 0 (0.0%) |
| 5 to 17 Years | 0 (0.0%) | 0 (0.0%) |
| 18 to 34 Years | 3 (2.2%) | 0 (0.0%) |
| 35 to 64 Years | 6 (2.6%) | 0 (0.0%) |
| 65 to 74 Years | 11 (17.7%) | 3 (4.4%) |
| 75 Years and over | 2 (7.7%) | 8 (22.9%) |
Disability Class: Cognitive Difficulty
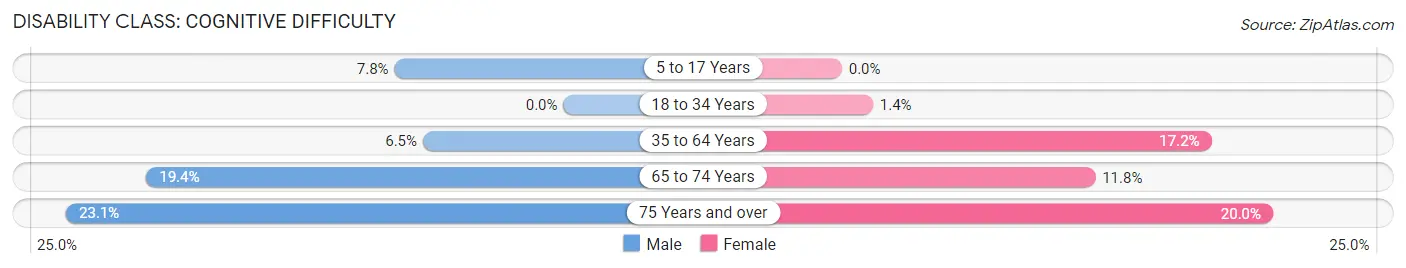
| Age Bracket | Male | Female |
| 5 to 17 Years | 12 (7.8%) | 0 (0.0%) |
| 18 to 34 Years | 0 (0.0%) | 2 (1.4%) |
| 35 to 64 Years | 15 (6.5%) | 47 (17.2%) |
| 65 to 74 Years | 12 (19.4%) | 8 (11.8%) |
| 75 Years and over | 6 (23.1%) | 7 (20.0%) |
Disability Class: Ambulatory Difficulty
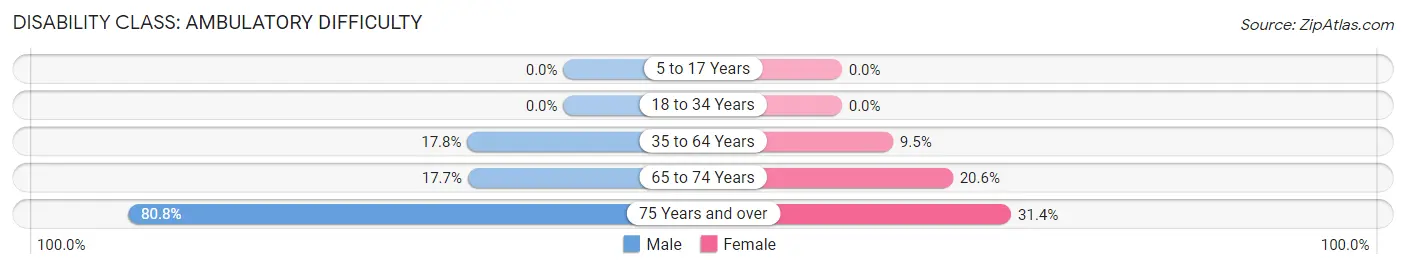
| Age Bracket | Male | Female |
| 5 to 17 Years | 0 (0.0%) | 0 (0.0%) |
| 18 to 34 Years | 0 (0.0%) | 0 (0.0%) |
| 35 to 64 Years | 41 (17.8%) | 26 (9.5%) |
| 65 to 74 Years | 11 (17.7%) | 14 (20.6%) |
| 75 Years and over | 21 (80.8%) | 11 (31.4%) |
Disability Class: Self-Care Difficulty
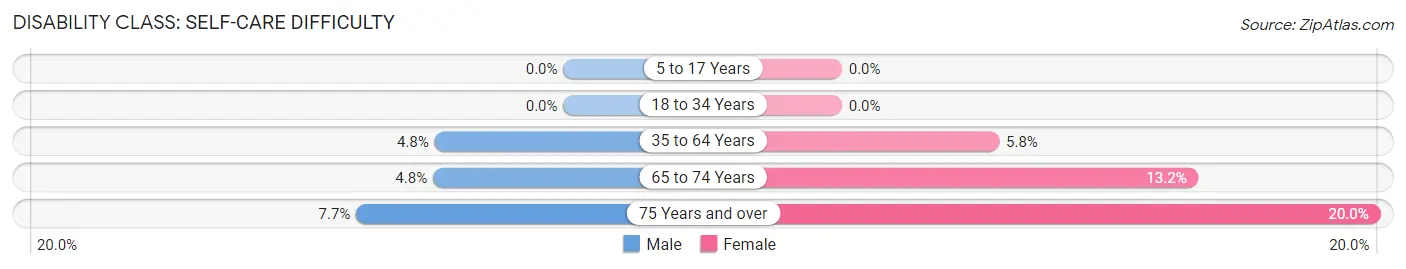
| Age Bracket | Male | Female |
| 5 to 17 Years | 0 (0.0%) | 0 (0.0%) |
| 18 to 34 Years | 0 (0.0%) | 0 (0.0%) |
| 35 to 64 Years | 11 (4.8%) | 16 (5.8%) |
| 65 to 74 Years | 3 (4.8%) | 9 (13.2%) |
| 75 Years and over | 2 (7.7%) | 7 (20.0%) |
Technology Access in Kingsford Heights
Computing Device Access in Kingsford Heights
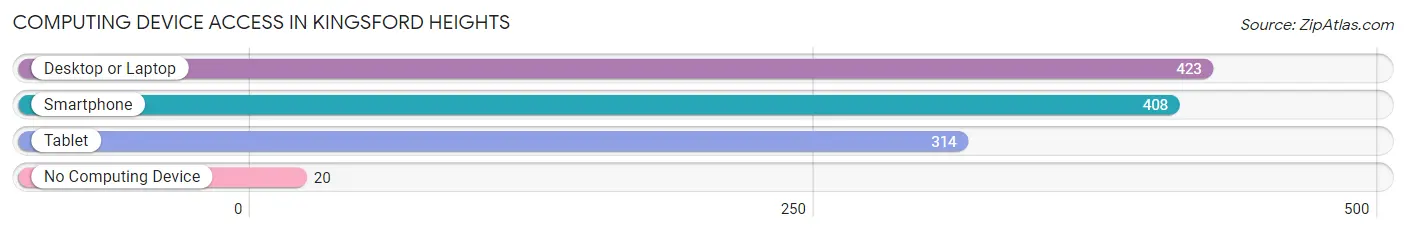
| Device Type | # Households | % Households |
| Desktop or Laptop | 423 | 81.5% |
| Smartphone | 408 | 78.6% |
| Tablet | 314 | 60.5% |
| No Computing Device | 20 | 3.8% |
| Total | 519 | 100.0% |
Internet Access in Kingsford Heights
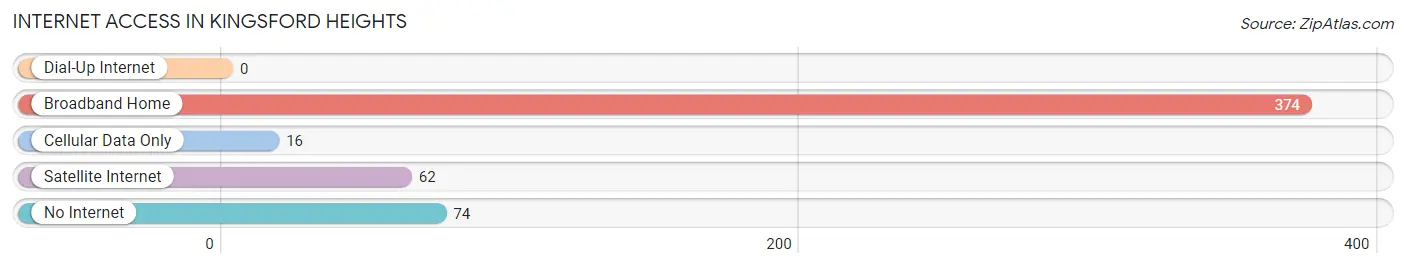
| Internet Type | # Households | % Households |
| Dial-Up Internet | 0 | 0.0% |
| Broadband Home | 374 | 72.1% |
| Cellular Data Only | 16 | 3.1% |
| Satellite Internet | 62 | 11.9% |
| No Internet | 74 | 14.3% |
| Total | 519 | 100.0% |
Kingsford Heights Summary
Introduction
Kingsford Heights is a small town located in LaPorte County, Indiana. It is situated in the northwest corner of the state, just south of the Michigan border. The town was founded in 1872 and has a population of approximately 1,500 people. The town is known for its small-town charm and its close proximity to Lake Michigan.
Geography
Kingsford Heights is located in the northwest corner of LaPorte County, Indiana. It is situated on the banks of the Little Calumet River, which flows into Lake Michigan. The town is surrounded by rolling hills and farmland, and is located just south of the Michigan border. The town is approximately 25 miles from the city of South Bend, Indiana, and is about an hour and a half drive from Chicago.
The town has a total area of 1.2 square miles, all of which is land. The town is located at an elevation of 645 feet above sea level. The climate in Kingsford Heights is classified as humid continental, with hot summers and cold winters.
History
Kingsford Heights was founded in 1872 by a group of settlers from Michigan. The town was named after the nearby Kingsford Iron Works, which was established in 1871. The town quickly grew and by the early 1900s, it had become a thriving community. The town was home to several businesses, including a sawmill, a grist mill, a blacksmith shop, and a general store.
In the early 1900s, the town was also home to a large number of immigrants from Europe, including Poles, Germans, and Italians. These immigrants brought with them their own culture and traditions, which still influence the town today.
Economy
The economy of Kingsford Heights is largely based on agriculture and manufacturing. The town is home to several small businesses, including a sawmill, a grist mill, a blacksmith shop, and a general store. The town is also home to several large manufacturing companies, including Kingsford Iron Works, which produces steel products.
The town is also home to several small farms, which produce a variety of crops, including corn, soybeans, and wheat. The town is also home to several wineries, which produce a variety of wines.
Demographics
As of the 2010 census, the population of Kingsford Heights was 1,500 people. The town is predominantly white, with a small percentage of African Americans, Hispanics, and Asians. The median household income in the town is $45,000, and the median home value is $125,000.
Conclusion
Kingsford Heights is a small town located in LaPorte County, Indiana. It is situated in the northwest corner of the state, just south of the Michigan border. The town was founded in 1872 and has a population of approximately 1,500 people. The town is known for its small-town charm and its close proximity to Lake Michigan. The economy of Kingsford Heights is largely based on agriculture and manufacturing, and the town is home to several small businesses and large manufacturing companies. The town is predominantly white, with a small percentage of African Americans, Hispanics, and Asians.
Common Questions
What is Per Capita Income in Kingsford Heights?
Per Capita income in Kingsford Heights is $21,786.
What is the Median Family Income in Kingsford Heights?
Median Family Income in Kingsford Heights is $53,775.
What is the Median Household income in Kingsford Heights?
Median Household Income in Kingsford Heights is $54,387.
What is Income or Wage Gap in Kingsford Heights?
Income or Wage Gap in Kingsford Heights is 27.3%.
Women in Kingsford Heights earn 72.7 cents for every dollar earned by a man.
What is Inequality or Gini Index in Kingsford Heights?
Inequality or Gini Index in Kingsford Heights is 0.32.
What is the Total Population of Kingsford Heights?
Total Population of Kingsford Heights is 1,391.
What is the Total Male Population of Kingsford Heights?
Total Male Population of Kingsford Heights is 674.
What is the Total Female Population of Kingsford Heights?
Total Female Population of Kingsford Heights is 717.
What is the Ratio of Males per 100 Females in Kingsford Heights?
There are 94.00 Males per 100 Females in Kingsford Heights.
What is the Ratio of Females per 100 Males in Kingsford Heights?
There are 106.38 Females per 100 Males in Kingsford Heights.
What is the Median Population Age in Kingsford Heights?
Median Population Age in Kingsford Heights is 33.8 Years.
What is the Average Family Size in Kingsford Heights
Average Family Size in Kingsford Heights is 2.8 People.
What is the Average Household Size in Kingsford Heights
Average Household Size in Kingsford Heights is 2.7 People.
How Large is the Labor Force in Kingsford Heights?
There are 614 People in the Labor Forcein in Kingsford Heights.
What is the Percentage of People in the Labor Force in Kingsford Heights?
59.9% of People are in the Labor Force in Kingsford Heights.
What is the Unemployment Rate in Kingsford Heights?
Unemployment Rate in Kingsford Heights is 2.2%.