Jonesville, IN Map & Demographics
Jonesville Map
Jonesville Overview
$31,158
PER CAPITA INCOME
$75,000
AVG FAMILY INCOME
$48,750
AVG HOUSEHOLD INCOME
26.4%
WAGE / INCOME GAP [ % ]
73.6¢/ $1
WAGE / INCOME GAP [ $ ]
0.40
INEQUALITY / GINI INDEX
196
TOTAL POPULATION
102
MALE POPULATION
94
FEMALE POPULATION
108.51
MALES / 100 FEMALES
92.16
FEMALES / 100 MALES
50.3
MEDIAN AGE
2.7
AVG FAMILY SIZE
2.2
AVG HOUSEHOLD SIZE
98
LABOR FORCE [ PEOPLE ]
58.3%
PERCENT IN LABOR FORCE
Jonesville Zip Codes
Jonesville Area Codes
Income in Jonesville
Income Overview in Jonesville
Per Capita Income in Jonesville is $31,158, while median incomes of families and households are $75,000 and $48,750 respectively.
| Characteristic | Number | Measure |
| Per Capita Income | 196 | $31,158 |
| Median Family Income | 52 | $75,000 |
| Mean Family Income | 52 | $74,490 |
| Median Household Income | 88 | $48,750 |
| Mean Household Income | 88 | $65,493 |
| Income Deficit | 52 | $0 |
| Wage / Income Gap (%) | 196 | 26.42% |
| Wage / Income Gap ($) | 196 | 73.58¢ per $1 |
| Gini / Inequality Index | 196 | 0.40 |
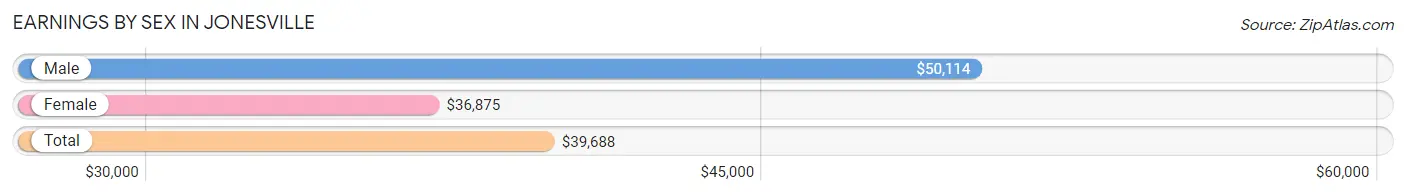
Earnings by Sex in Jonesville
Average Earnings in Jonesville are $39,688, $50,114 for men and $36,875 for women, a difference of 26.4%.
| Sex | Number | Average Earnings |
| Male | 67 (63.2%) | $50,114 |
| Female | 39 (36.8%) | $36,875 |
| Total | 106 (100.0%) | $39,688 |
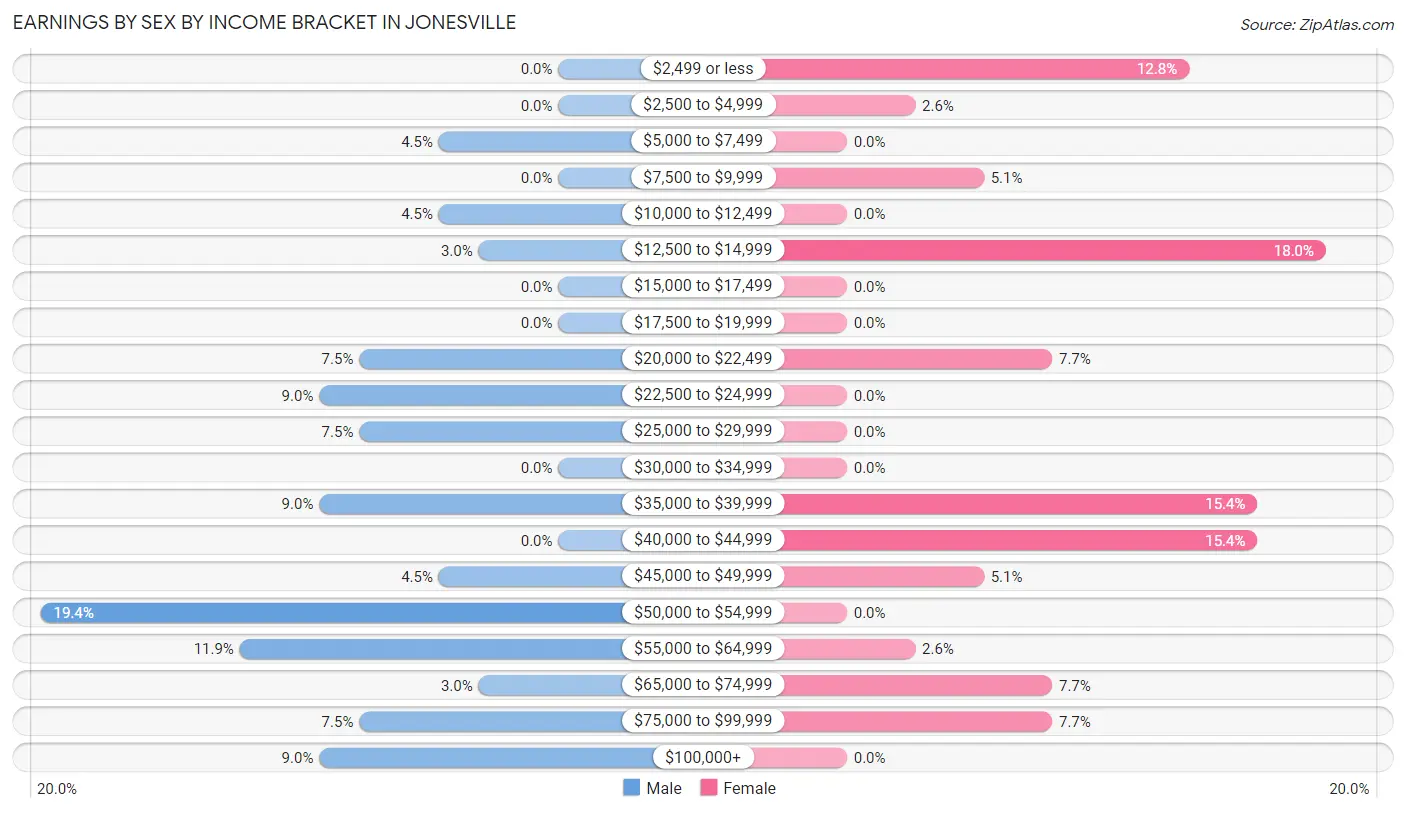
Earnings by Sex by Income Bracket in Jonesville
The most common earnings brackets in Jonesville are $50,000 to $54,999 for men (13 | 19.4%) and $12,500 to $14,999 for women (7 | 17.9%).
| Income | Male | Female |
| $2,499 or less | 0 (0.0%) | 5 (12.8%) |
| $2,500 to $4,999 | 0 (0.0%) | 1 (2.6%) |
| $5,000 to $7,499 | 3 (4.5%) | 0 (0.0%) |
| $7,500 to $9,999 | 0 (0.0%) | 2 (5.1%) |
| $10,000 to $12,499 | 3 (4.5%) | 0 (0.0%) |
| $12,500 to $14,999 | 2 (3.0%) | 7 (17.9%) |
| $15,000 to $17,499 | 0 (0.0%) | 0 (0.0%) |
| $17,500 to $19,999 | 0 (0.0%) | 0 (0.0%) |
| $20,000 to $22,499 | 5 (7.5%) | 3 (7.7%) |
| $22,500 to $24,999 | 6 (9.0%) | 0 (0.0%) |
| $25,000 to $29,999 | 5 (7.5%) | 0 (0.0%) |
| $30,000 to $34,999 | 0 (0.0%) | 0 (0.0%) |
| $35,000 to $39,999 | 6 (9.0%) | 6 (15.4%) |
| $40,000 to $44,999 | 0 (0.0%) | 6 (15.4%) |
| $45,000 to $49,999 | 3 (4.5%) | 2 (5.1%) |
| $50,000 to $54,999 | 13 (19.4%) | 0 (0.0%) |
| $55,000 to $64,999 | 8 (11.9%) | 1 (2.6%) |
| $65,000 to $74,999 | 2 (3.0%) | 3 (7.7%) |
| $75,000 to $99,999 | 5 (7.5%) | 3 (7.7%) |
| $100,000+ | 6 (9.0%) | 0 (0.0%) |
| Total | 67 (100.0%) | 39 (100.0%) |
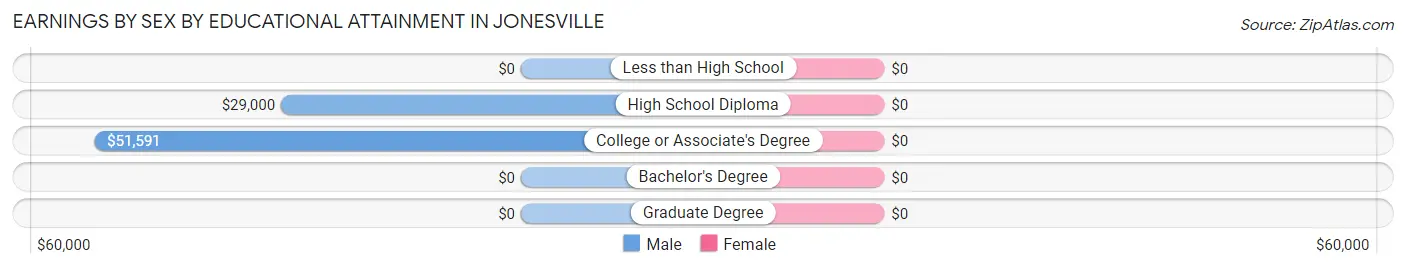
Earnings by Sex by Educational Attainment in Jonesville
| Educational Attainment | Male Income | Female Income |
| Less than High School | - | - |
| High School Diploma | $29,000 | $0 |
| College or Associate's Degree | $51,591 | $0 |
| Bachelor's Degree | - | - |
| Graduate Degree | - | - |
| Total | $50,568 | $38,125 |
Family Income in Jonesville
Family Income Brackets in Jonesville
According to the Jonesville family income data, there are 20 families falling into the $100,000 to $149,999 income range, which is the most common income bracket and makes up 38.5% of all families.
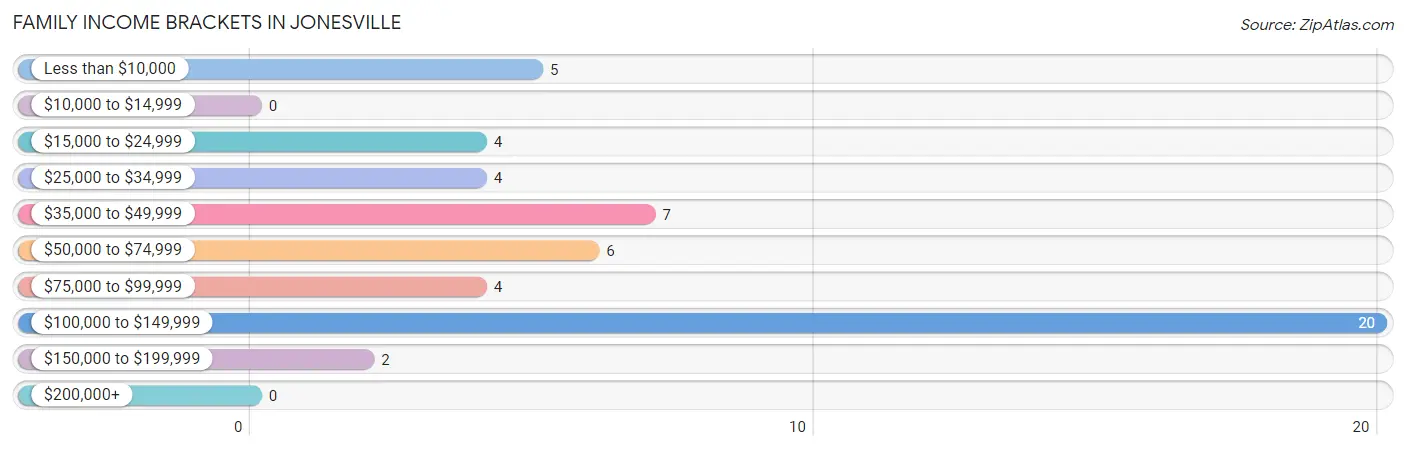
| Income Bracket | # Families | % Families |
| Less than $10,000 | 5 | 9.6% |
| $10,000 to $14,999 | 0 | 0.0% |
| $15,000 to $24,999 | 4 | 7.7% |
| $25,000 to $34,999 | 4 | 7.7% |
| $35,000 to $49,999 | 7 | 13.5% |
| $50,000 to $74,999 | 6 | 11.5% |
| $75,000 to $99,999 | 4 | 7.7% |
| $100,000 to $149,999 | 20 | 38.5% |
| $150,000 to $199,999 | 2 | 3.8% |
| $200,000+ | 0 | 0.0% |
Family Income by Famaliy Size in Jonesville
2-person families (38 | 73.1%) account for the highest median family income in Jonesville with $95,000 per family, while 2-person families (38 | 73.1%) have the highest median income of $47,500 per family member.
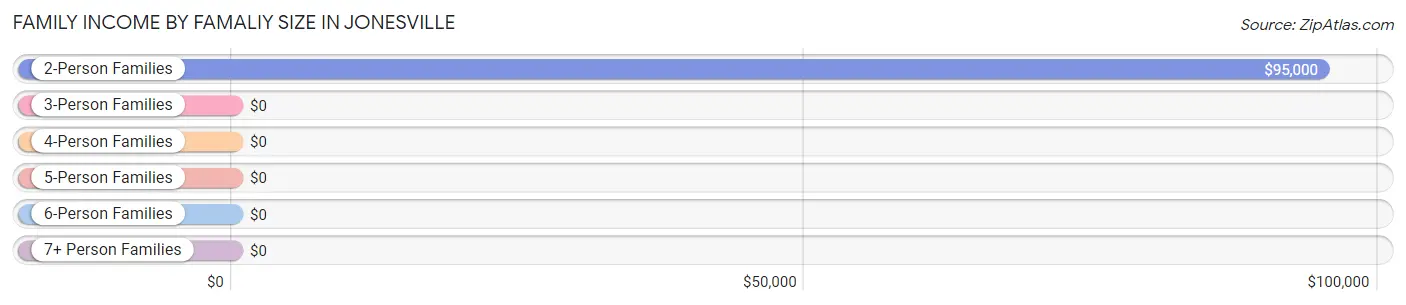
| Income Bracket | # Families | Median Income |
| 2-Person Families | 38 (73.1%) | $95,000 |
| 3-Person Families | 10 (19.2%) | $0 |
| 4-Person Families | 0 (0.0%) | $0 |
| 5-Person Families | 2 (3.8%) | $0 |
| 6-Person Families | 2 (3.8%) | $0 |
| 7+ Person Families | 0 (0.0%) | $0 |
| Total | 52 (100.0%) | $75,000 |
Family Income by Number of Earners in Jonesville
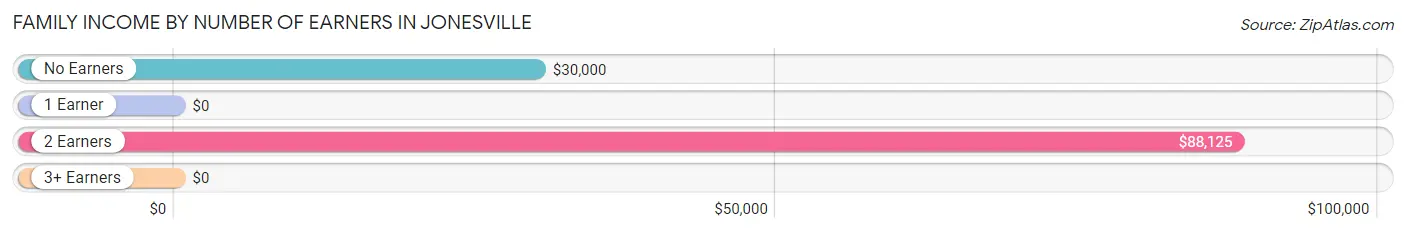
| Number of Earners | # Families | Median Income |
| No Earners | 8 (15.4%) | $30,000 |
| 1 Earner | 22 (42.3%) | $0 |
| 2 Earners | 19 (36.5%) | $88,125 |
| 3+ Earners | 3 (5.8%) | $0 |
| Total | 52 (100.0%) | $75,000 |
Household Income in Jonesville
Household Income Brackets in Jonesville
With 25 households falling in the category, the $100,000 to $149,999 income range is the most frequent in Jonesville, accounting for 28.4% of all households.
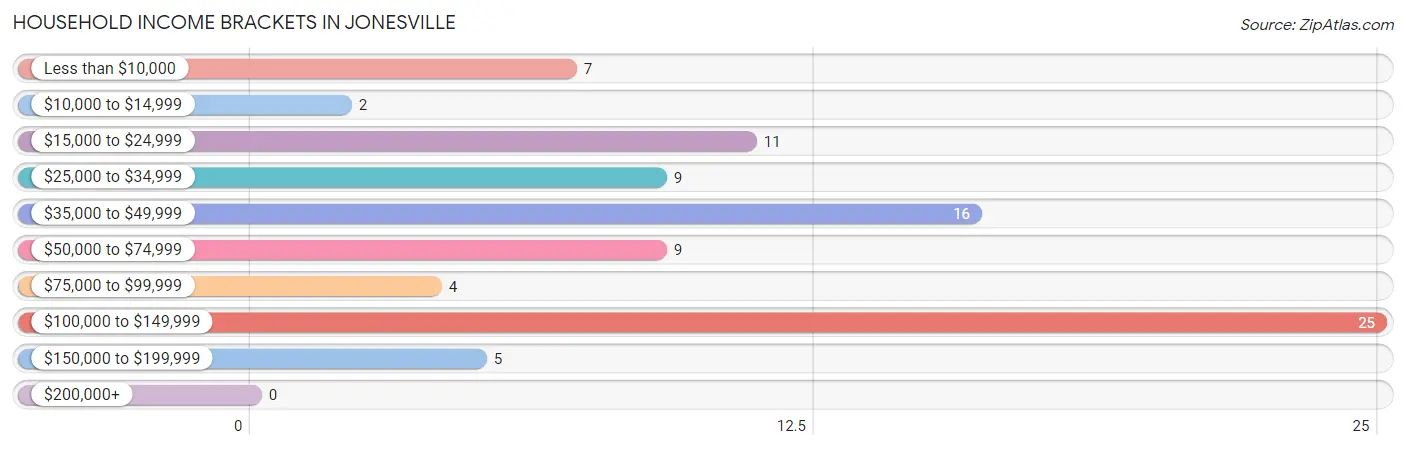
| Income Bracket | # Households | % Households |
| Less than $10,000 | 7 | 8.0% |
| $10,000 to $14,999 | 2 | 2.3% |
| $15,000 to $24,999 | 11 | 12.5% |
| $25,000 to $34,999 | 9 | 10.2% |
| $35,000 to $49,999 | 16 | 18.2% |
| $50,000 to $74,999 | 9 | 10.2% |
| $75,000 to $99,999 | 4 | 4.5% |
| $100,000 to $149,999 | 25 | 28.4% |
| $150,000 to $199,999 | 5 | 5.7% |
| $200,000+ | 0 | 0.0% |
Household Income by Householder Age in Jonesville
The median household income in Jonesville is $48,750, with the highest median household income of $48,125 found in the 45 to 64 years age bracket for the primary householder. A total of 63 households (71.6%) fall into this category.
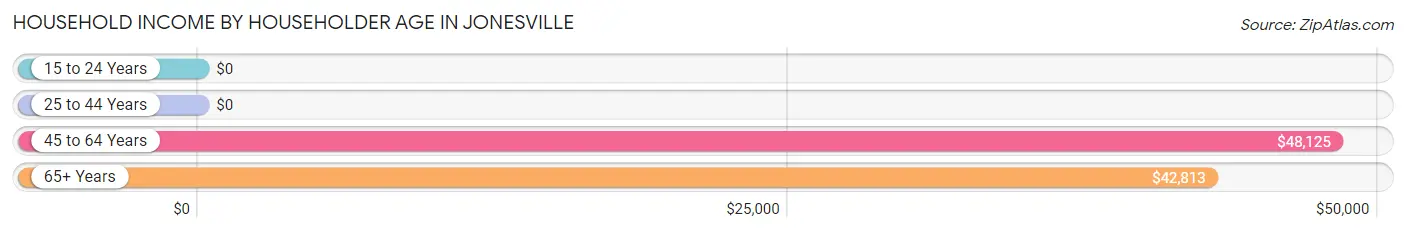
| Income Bracket | # Households | Median Income |
| 15 to 24 Years | 0 (0.0%) | $0 |
| 25 to 44 Years | 8 (9.1%) | $0 |
| 45 to 64 Years | 63 (71.6%) | $48,125 |
| 65+ Years | 17 (19.3%) | $42,813 |
| Total | 88 (100.0%) | $48,750 |
Poverty in Jonesville
Income Below Poverty by Sex and Age in Jonesville
With 15.7% poverty level for males and 16.5% for females among the residents of Jonesville, under 5 year old males and under 5 year old females are the most vulnerable to poverty, with 8 males (100.0%) and 5 females (100.0%) in their respective age groups living below the poverty level.
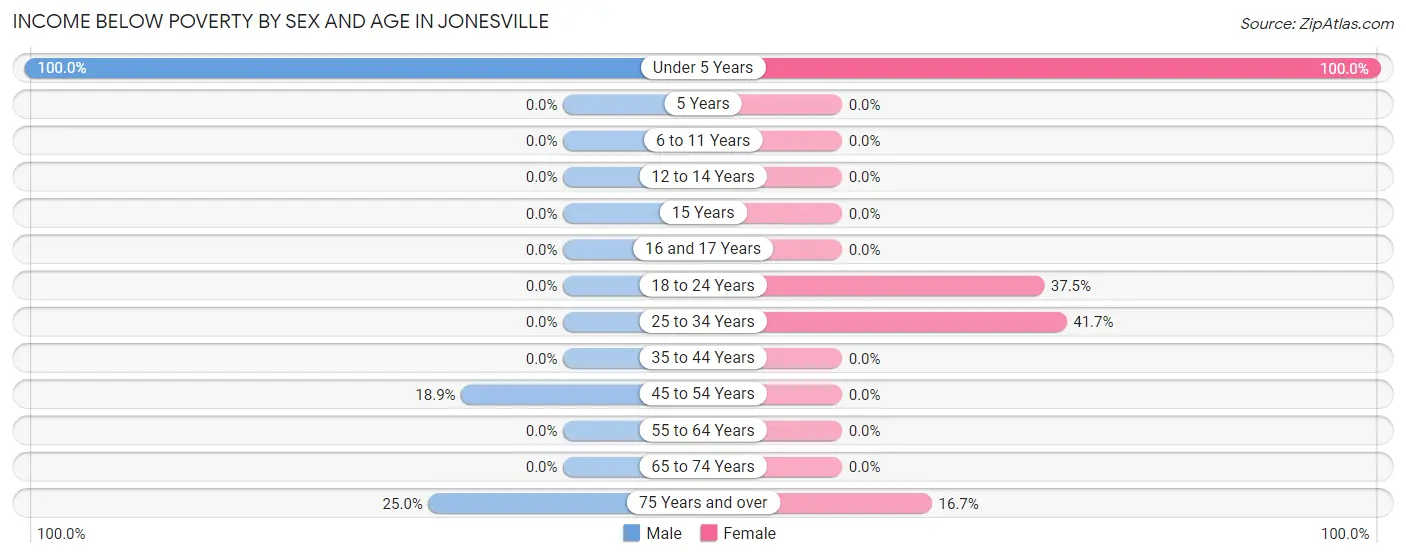
| Age Bracket | Male | Female |
| Under 5 Years | 8 (100.0%) | 5 (100.0%) |
| 5 Years | 0 (0.0%) | 0 (0.0%) |
| 6 to 11 Years | 0 (0.0%) | 0 (0.0%) |
| 12 to 14 Years | 0 (0.0%) | 0 (0.0%) |
| 15 Years | 0 (0.0%) | 0 (0.0%) |
| 16 and 17 Years | 0 (0.0%) | 0 (0.0%) |
| 18 to 24 Years | 0 (0.0%) | 3 (37.5%) |
| 25 to 34 Years | 0 (0.0%) | 5 (41.7%) |
| 35 to 44 Years | 0 (0.0%) | 0 (0.0%) |
| 45 to 54 Years | 7 (18.9%) | 0 (0.0%) |
| 55 to 64 Years | 0 (0.0%) | 0 (0.0%) |
| 65 to 74 Years | 0 (0.0%) | 0 (0.0%) |
| 75 Years and over | 1 (25.0%) | 2 (16.7%) |
| Total | 16 (15.7%) | 15 (16.5%) |
Income Above Poverty by Sex and Age in Jonesville
According to the poverty statistics in Jonesville, males aged 6 to 11 years and females aged 6 to 11 years are the age groups that are most secure financially, with 100.0% of males and 100.0% of females in these age groups living above the poverty line.
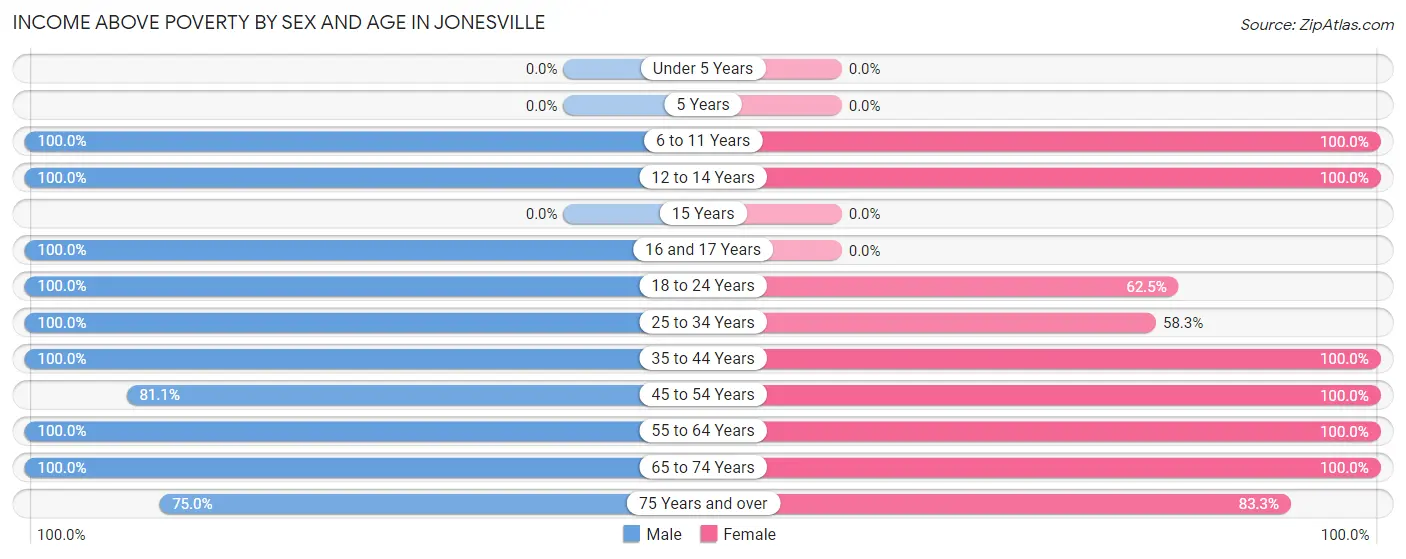
| Age Bracket | Male | Female |
| Under 5 Years | 0 (0.0%) | 0 (0.0%) |
| 5 Years | 0 (0.0%) | 0 (0.0%) |
| 6 to 11 Years | 5 (100.0%) | 2 (100.0%) |
| 12 to 14 Years | 1 (100.0%) | 4 (100.0%) |
| 15 Years | 0 (0.0%) | 0 (0.0%) |
| 16 and 17 Years | 4 (100.0%) | 0 (0.0%) |
| 18 to 24 Years | 4 (100.0%) | 5 (62.5%) |
| 25 to 34 Years | 6 (100.0%) | 7 (58.3%) |
| 35 to 44 Years | 9 (100.0%) | 2 (100.0%) |
| 45 to 54 Years | 30 (81.1%) | 15 (100.0%) |
| 55 to 64 Years | 20 (100.0%) | 13 (100.0%) |
| 65 to 74 Years | 4 (100.0%) | 18 (100.0%) |
| 75 Years and over | 3 (75.0%) | 10 (83.3%) |
| Total | 86 (84.3%) | 76 (83.5%) |
Income Below Poverty Among Married-Couple Families in Jonesville
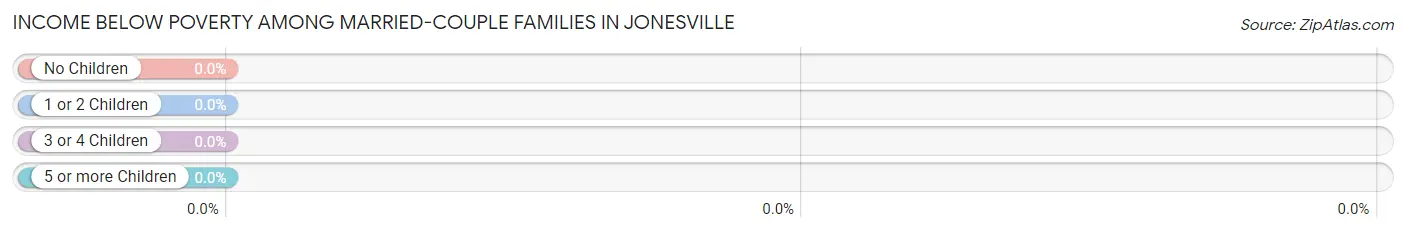
| Children | Above Poverty | Below Poverty |
| No Children | 22 (100.0%) | 0 (0.0%) |
| 1 or 2 Children | 0 (0.0%) | 0 (0.0%) |
| 3 or 4 Children | 2 (100.0%) | 0 (0.0%) |
| 5 or more Children | 0 (0.0%) | 0 (0.0%) |
| Total | 24 (100.0%) | 0 (0.0%) |
Income Below Poverty Among Single-Parent Households in Jonesville
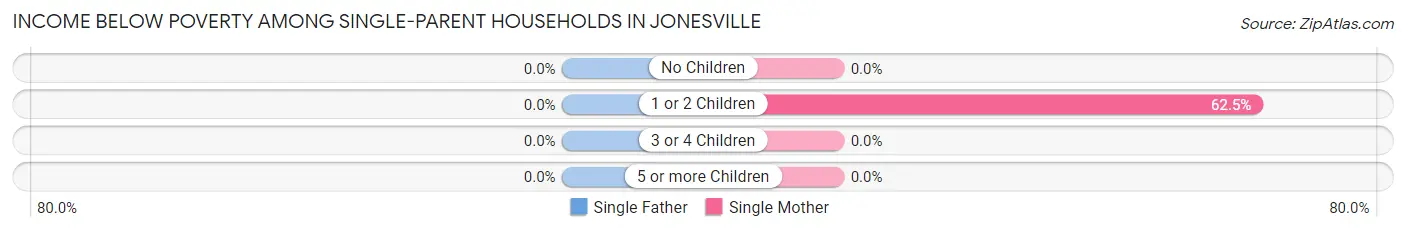
| Children | Single Father | Single Mother |
| No Children | 0 (0.0%) | 0 (0.0%) |
| 1 or 2 Children | 0 (0.0%) | 5 (62.5%) |
| 3 or 4 Children | 0 (0.0%) | 0 (0.0%) |
| 5 or more Children | 0 (0.0%) | 0 (0.0%) |
| Total | 0 (0.0%) | 5 (35.7%) |
Income Below Poverty Among Married-Couple vs Single-Parent Households in Jonesville
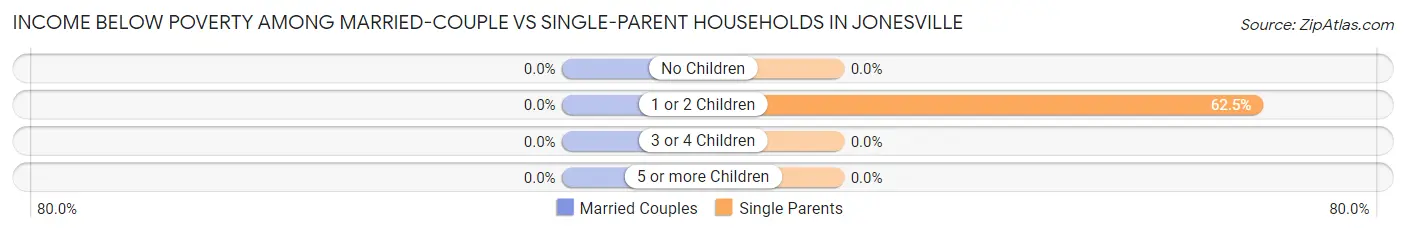
| Children | Married-Couple Families | Single-Parent Households |
| No Children | 0 (0.0%) | 0 (0.0%) |
| 1 or 2 Children | 0 (0.0%) | 5 (62.5%) |
| 3 or 4 Children | 0 (0.0%) | 0 (0.0%) |
| 5 or more Children | 0 (0.0%) | 0 (0.0%) |
| Total | 0 (0.0%) | 5 (17.9%) |
Race in Jonesville
The most populous races in Jonesville are White / Caucasian (188 | 95.9%), Hispanic or Latino (4 | 2.0%), and Two or more Races (4 | 2.0%).
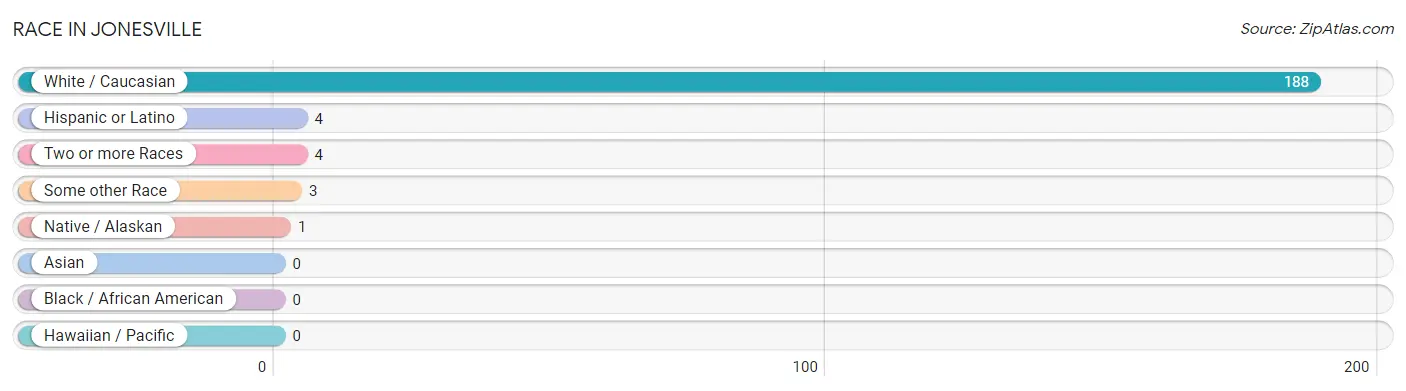
| Race | # Population | % Population |
| Asian | 0 | 0.0% |
| Black / African American | 0 | 0.0% |
| Hawaiian / Pacific | 0 | 0.0% |
| Hispanic or Latino | 4 | 2.0% |
| Native / Alaskan | 1 | 0.5% |
| White / Caucasian | 188 | 95.9% |
| Two or more Races | 4 | 2.0% |
| Some other Race | 3 | 1.5% |
| Total | 196 | 100.0% |
Ancestry in Jonesville
The most populous ancestries reported in Jonesville are German (40 | 20.4%), American (25 | 12.8%), Irish (20 | 10.2%), English (18 | 9.2%), and Polish (6 | 3.1%), together accounting for 55.6% of all Jonesville residents.
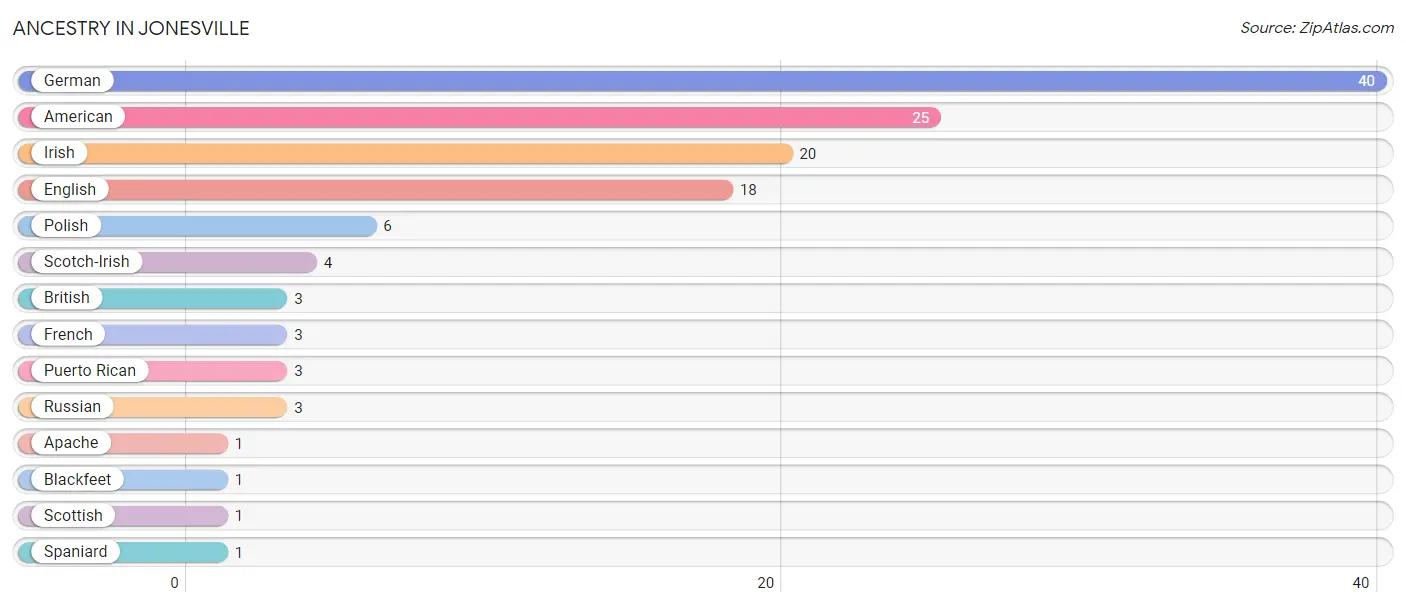
| Ancestry | # Population | % Population |
| American | 25 | 12.8% |
| Apache | 1 | 0.5% |
| Blackfeet | 1 | 0.5% |
| British | 3 | 1.5% |
| English | 18 | 9.2% |
| French | 3 | 1.5% |
| German | 40 | 20.4% |
| Irish | 20 | 10.2% |
| Polish | 6 | 3.1% |
| Puerto Rican | 3 | 1.5% |
| Russian | 3 | 1.5% |
| Scotch-Irish | 4 | 2.0% |
| Scottish | 1 | 0.5% |
| Spaniard | 1 | 0.5% | View All 14 Rows |
Immigrants in Jonesville

| Immigration Origin | # Population | % Population | View All 0 Rows |
Sex and Age in Jonesville
Sex and Age in Jonesville
The most populous age groups in Jonesville are 50 to 54 Years (27 | 26.5%) for men and 65 to 69 Years (16 | 17.0%) for women.
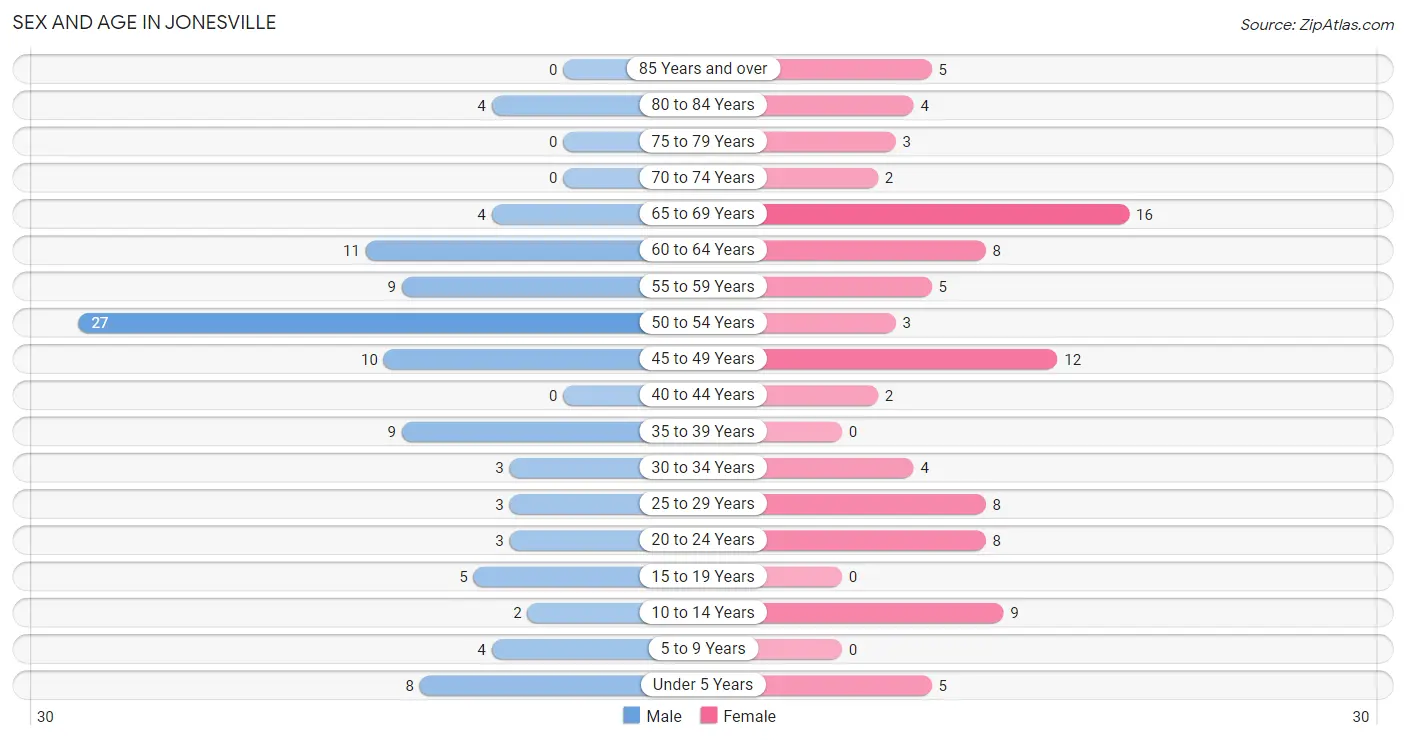
| Age Bracket | Male | Female |
| Under 5 Years | 8 (7.8%) | 5 (5.3%) |
| 5 to 9 Years | 4 (3.9%) | 0 (0.0%) |
| 10 to 14 Years | 2 (2.0%) | 9 (9.6%) |
| 15 to 19 Years | 5 (4.9%) | 0 (0.0%) |
| 20 to 24 Years | 3 (2.9%) | 8 (8.5%) |
| 25 to 29 Years | 3 (2.9%) | 8 (8.5%) |
| 30 to 34 Years | 3 (2.9%) | 4 (4.3%) |
| 35 to 39 Years | 9 (8.8%) | 0 (0.0%) |
| 40 to 44 Years | 0 (0.0%) | 2 (2.1%) |
| 45 to 49 Years | 10 (9.8%) | 12 (12.8%) |
| 50 to 54 Years | 27 (26.5%) | 3 (3.2%) |
| 55 to 59 Years | 9 (8.8%) | 5 (5.3%) |
| 60 to 64 Years | 11 (10.8%) | 8 (8.5%) |
| 65 to 69 Years | 4 (3.9%) | 16 (17.0%) |
| 70 to 74 Years | 0 (0.0%) | 2 (2.1%) |
| 75 to 79 Years | 0 (0.0%) | 3 (3.2%) |
| 80 to 84 Years | 4 (3.9%) | 4 (4.3%) |
| 85 Years and over | 0 (0.0%) | 5 (5.3%) |
| Total | 102 (100.0%) | 94 (100.0%) |
Families and Households in Jonesville
Median Family Size in Jonesville
The median family size in Jonesville is 2.71 persons per family, with single female/mother families (14 | 26.9%) accounting for the largest median family size of 3.64 persons per family. On the other hand, single male/father families (14 | 26.9%) represent the smallest median family size with 2.07 persons per family.
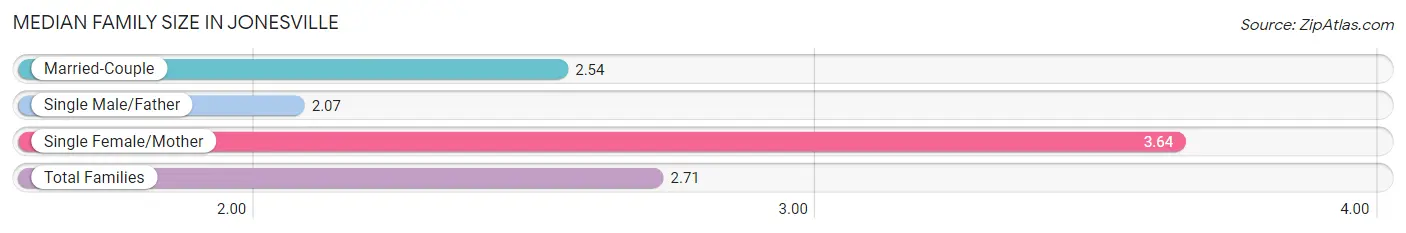
| Family Type | # Families | Family Size |
| Married-Couple | 24 (46.2%) | 2.54 |
| Single Male/Father | 14 (26.9%) | 2.07 |
| Single Female/Mother | 14 (26.9%) | 3.64 |
| Total Families | 52 (100.0%) | 2.71 |
Median Household Size in Jonesville
The median household size in Jonesville is 2.23 persons per household, with single female/mother households (14 | 15.9%) accounting for the largest median household size of 4.07 persons per household. non-family households (36 | 40.9%) represent the smallest median household size with 1.28 persons per household.
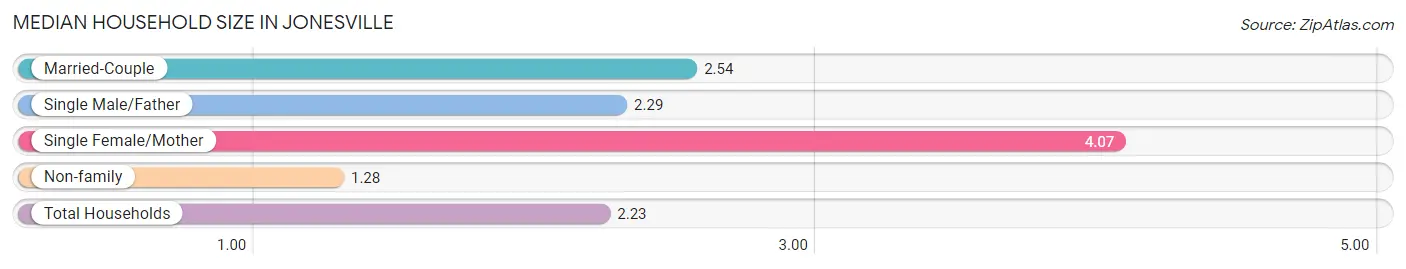
| Household Type | # Households | Household Size |
| Married-Couple | 24 (27.3%) | 2.54 |
| Single Male/Father | 14 (15.9%) | 2.29 |
| Single Female/Mother | 14 (15.9%) | 4.07 |
| Non-family | 36 (40.9%) | 1.28 |
| Total Households | 88 (100.0%) | 2.23 |
Household Size by Marriage Status in Jonesville
Out of a total of 88 households in Jonesville, 52 (59.1%) are family households, while 36 (40.9%) are nonfamily households. The most numerous type of family households are 2-person households, comprising 38, and the most common type of nonfamily households are 1-person households, comprising 28.
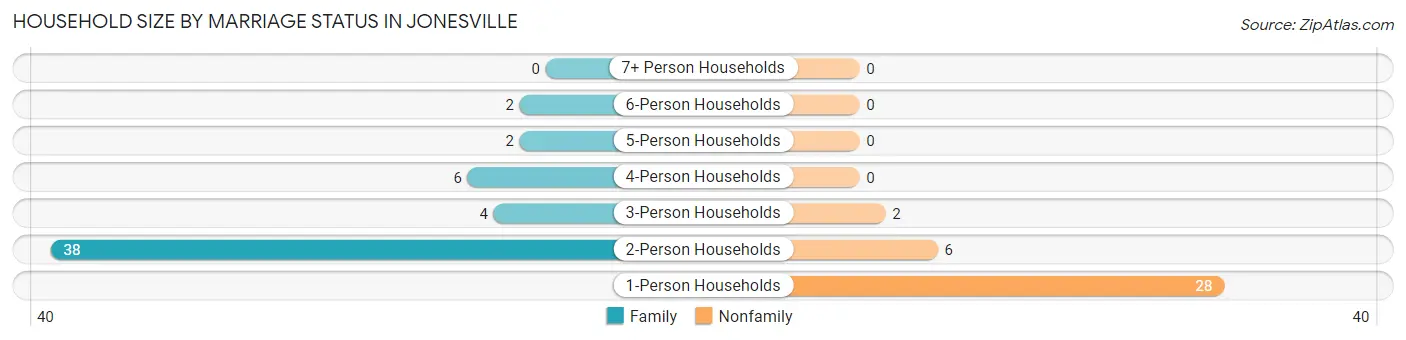
| Household Size | Family Households | Nonfamily Households |
| 1-Person Households | - | 28 (31.8%) |
| 2-Person Households | 38 (43.2%) | 6 (6.8%) |
| 3-Person Households | 4 (4.5%) | 2 (2.3%) |
| 4-Person Households | 6 (6.8%) | 0 (0.0%) |
| 5-Person Households | 2 (2.3%) | 0 (0.0%) |
| 6-Person Households | 2 (2.3%) | 0 (0.0%) |
| 7+ Person Households | 0 (0.0%) | 0 (0.0%) |
| Total | 52 (59.1%) | 36 (40.9%) |
Female Fertility in Jonesville
Fertility by Age in Jonesville
| Age Bracket | Women with Births | Births / 1,000 Women |
| 15 to 19 years | 0 (0.0%) | 0.0 |
| 20 to 34 years | 0 (0.0%) | 0.0 |
| 35 to 50 years | 0 (0.0%) | 0.0 |
| Total | 0 (0.0%) | 0.0 |
Fertility by Age by Marriage Status in Jonesville
| Age Bracket | Married | Unmarried |
| 15 to 19 years | 0 (0.0%) | 0 (0.0%) |
| 20 to 34 years | 0 (0.0%) | 0 (0.0%) |
| 35 to 50 years | 0 (0.0%) | 0 (0.0%) |
| Total | 0 (0.0%) | 0 (0.0%) |
Fertility by Education in Jonesville
| Educational Attainment | Women with Births | Births / 1,000 Women |
| Less than High School | 0 (0.0%) | 0.0 |
| High School Diploma | 0 (0.0%) | 0.0 |
| College or Associate's Degree | 0 (0.0%) | 0.0 |
| Bachelor's Degree | 0 (0.0%) | 0.0 |
| Graduate Degree | 0 (0.0%) | 0.0 |
| Total | 0 (0.0%) | 0.0 |
Fertility by Education by Marriage Status in Jonesville
| Educational Attainment | Married | Unmarried |
| Less than High School | 0 (0.0%) | 0 (0.0%) |
| High School Diploma | 0 (0.0%) | 0 (0.0%) |
| College or Associate's Degree | 0 (0.0%) | 0 (0.0%) |
| Bachelor's Degree | 0 (0.0%) | 0 (0.0%) |
| Graduate Degree | 0 (0.0%) | 0 (0.0%) |
| Total | 0 (0.0%) | 0 (0.0%) |
Employment Characteristics in Jonesville
Employment by Class of Employer in Jonesville
Among the 98 employed individuals in Jonesville, private company employees (74 | 75.5%), local government employees (12 | 12.2%), and self-employed (not incorporated) (7 | 7.1%) make up the most common classes of employment.
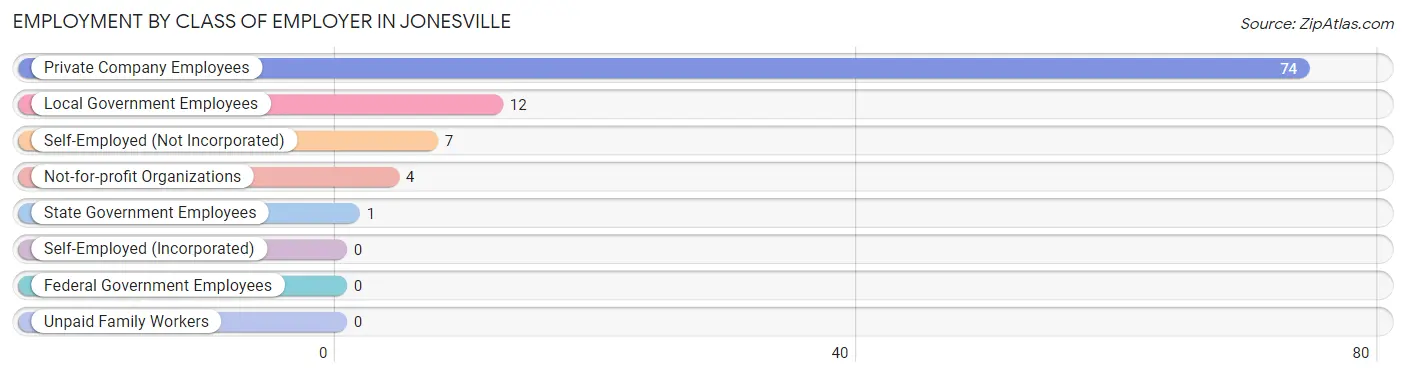
| Employer Class | # Employees | % Employees |
| Private Company Employees | 74 | 75.5% |
| Self-Employed (Incorporated) | 0 | 0.0% |
| Self-Employed (Not Incorporated) | 7 | 7.1% |
| Not-for-profit Organizations | 4 | 4.1% |
| Local Government Employees | 12 | 12.2% |
| State Government Employees | 1 | 1.0% |
| Federal Government Employees | 0 | 0.0% |
| Unpaid Family Workers | 0 | 0.0% |
| Total | 98 | 100.0% |
Employment Status by Age in Jonesville
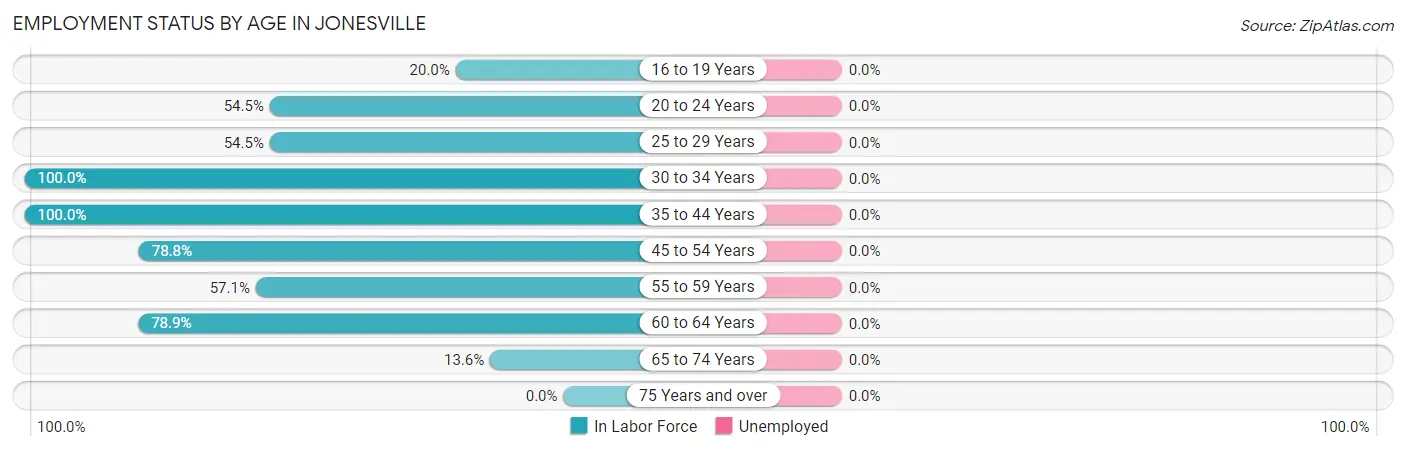
| Age Bracket | In Labor Force | Unemployed |
| 16 to 19 Years | 1 (20.0%) | 0 (0.0%) |
| 20 to 24 Years | 6 (54.5%) | 0 (0.0%) |
| 25 to 29 Years | 6 (54.5%) | 0 (0.0%) |
| 30 to 34 Years | 7 (100.0%) | 0 (0.0%) |
| 35 to 44 Years | 11 (100.0%) | 0 (0.0%) |
| 45 to 54 Years | 41 (78.8%) | 0 (0.0%) |
| 55 to 59 Years | 8 (57.1%) | 0 (0.0%) |
| 60 to 64 Years | 15 (78.9%) | 0 (0.0%) |
| 65 to 74 Years | 3 (13.6%) | 0 (0.0%) |
| 75 Years and over | 0 (0.0%) | 0 (0.0%) |
| Total | 98 (58.3%) | 0 (0.0%) |
Employment Status by Educational Attainment in Jonesville
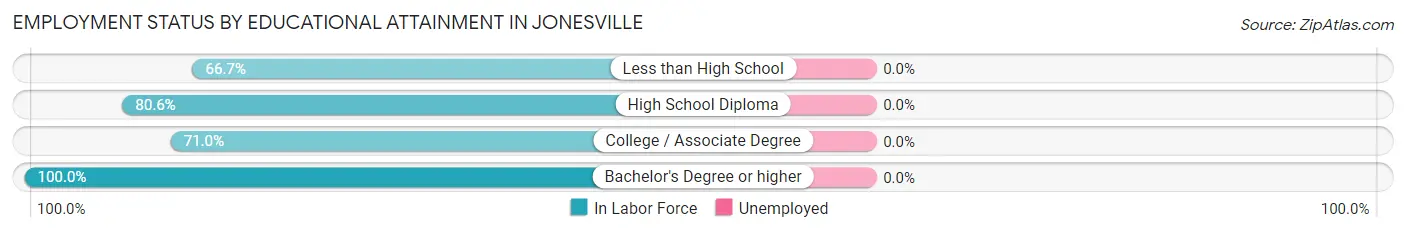
| Educational Attainment | In Labor Force | Unemployed |
| Less than High School | 10 (66.7%) | 0 (0.0%) |
| High School Diploma | 50 (80.6%) | 0 (0.0%) |
| College / Associate Degree | 22 (71.0%) | 0 (0.0%) |
| Bachelor's Degree or higher | 6 (100.0%) | 0 (0.0%) |
| Total | 88 (77.2%) | 0 (0.0%) |
Employment Occupations by Sex in Jonesville
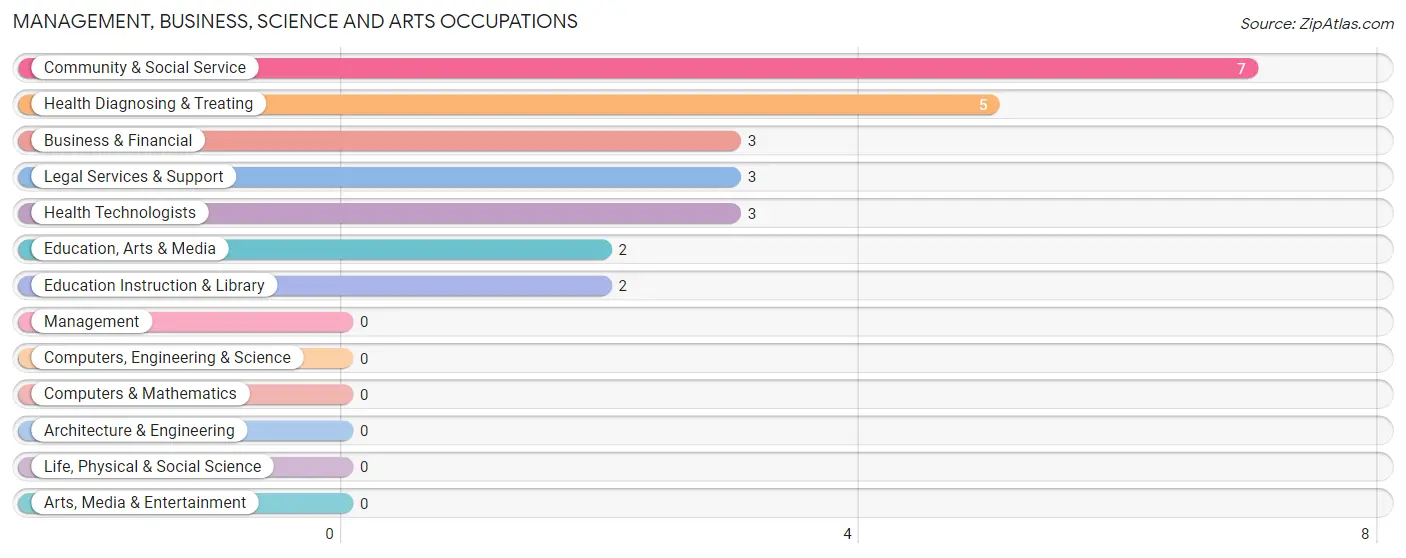
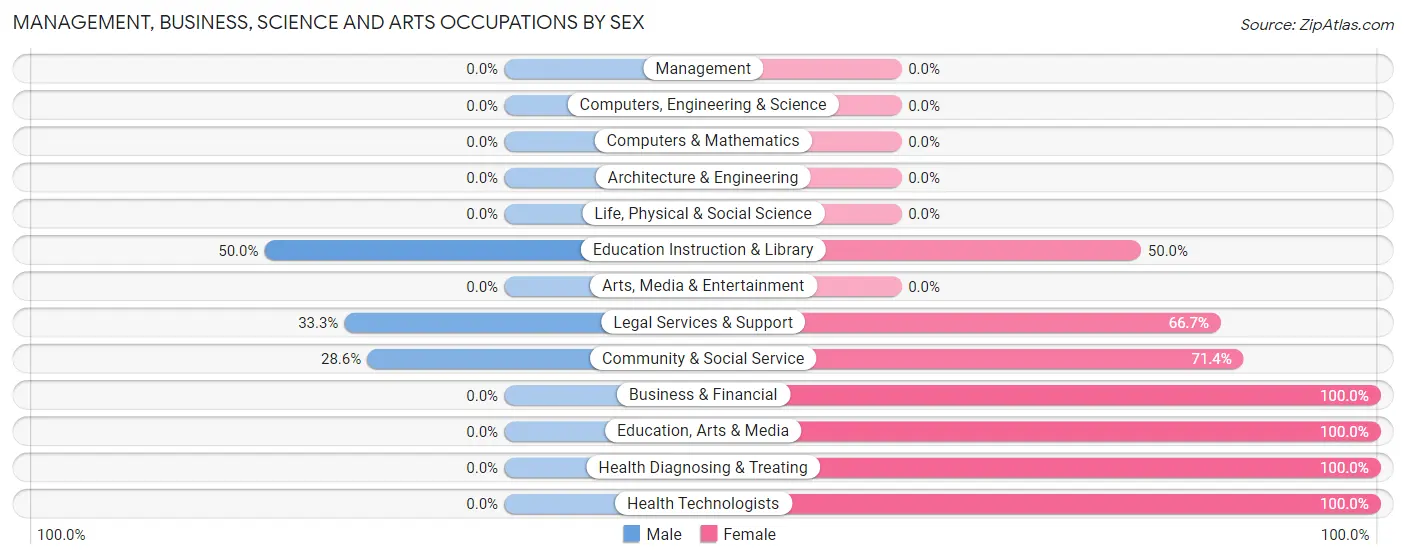
Management, Business, Science and Arts Occupations
The most common Management, Business, Science and Arts occupations in Jonesville are Community & Social Service (7 | 7.1%), Health Diagnosing & Treating (5 | 5.1%), Business & Financial (3 | 3.1%), Legal Services & Support (3 | 3.1%), and Health Technologists (3 | 3.1%).
Management, Business, Science and Arts Occupations by Sex
Within the Management, Business, Science and Arts occupations in Jonesville, the most male-oriented occupations are Education Instruction & Library (50.0%), Legal Services & Support (33.3%), and Community & Social Service (28.6%), while the most female-oriented occupations are Business & Financial (100.0%), Education, Arts & Media (100.0%), and Health Diagnosing & Treating (100.0%).
| Occupation | Male | Female |
| Management | 0 (0.0%) | 0 (0.0%) |
| Business & Financial | 0 (0.0%) | 3 (100.0%) |
| Computers, Engineering & Science | 0 (0.0%) | 0 (0.0%) |
| Computers & Mathematics | 0 (0.0%) | 0 (0.0%) |
| Architecture & Engineering | 0 (0.0%) | 0 (0.0%) |
| Life, Physical & Social Science | 0 (0.0%) | 0 (0.0%) |
| Community & Social Service | 2 (28.6%) | 5 (71.4%) |
| Education, Arts & Media | 0 (0.0%) | 2 (100.0%) |
| Legal Services & Support | 1 (33.3%) | 2 (66.7%) |
| Education Instruction & Library | 1 (50.0%) | 1 (50.0%) |
| Arts, Media & Entertainment | 0 (0.0%) | 0 (0.0%) |
| Health Diagnosing & Treating | 0 (0.0%) | 5 (100.0%) |
| Health Technologists | 0 (0.0%) | 3 (100.0%) |
| Total (Category) | 2 (13.3%) | 13 (86.7%) |
| Total (Overall) | 67 (68.4%) | 31 (31.6%) |
Services Occupations
The most common Services occupations in Jonesville are , and Cleaning & Maintenance (9 | 9.2%).
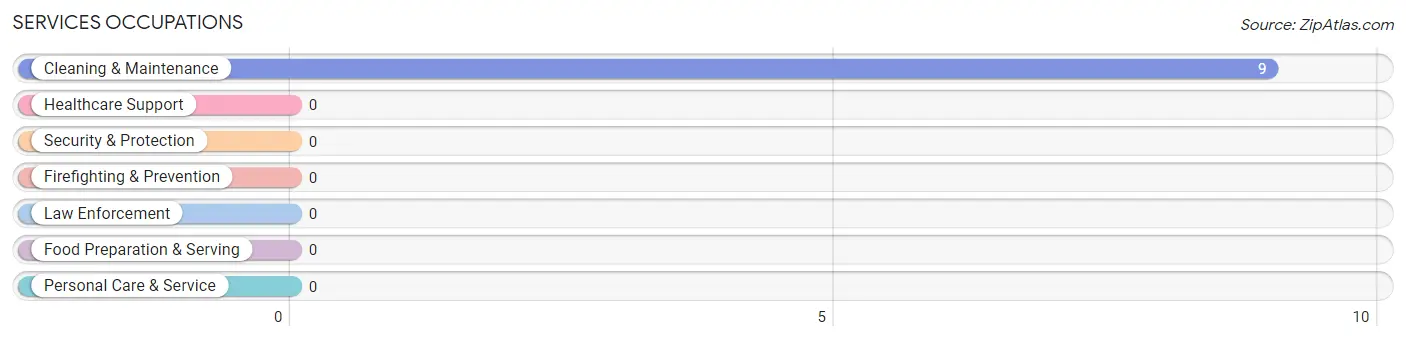
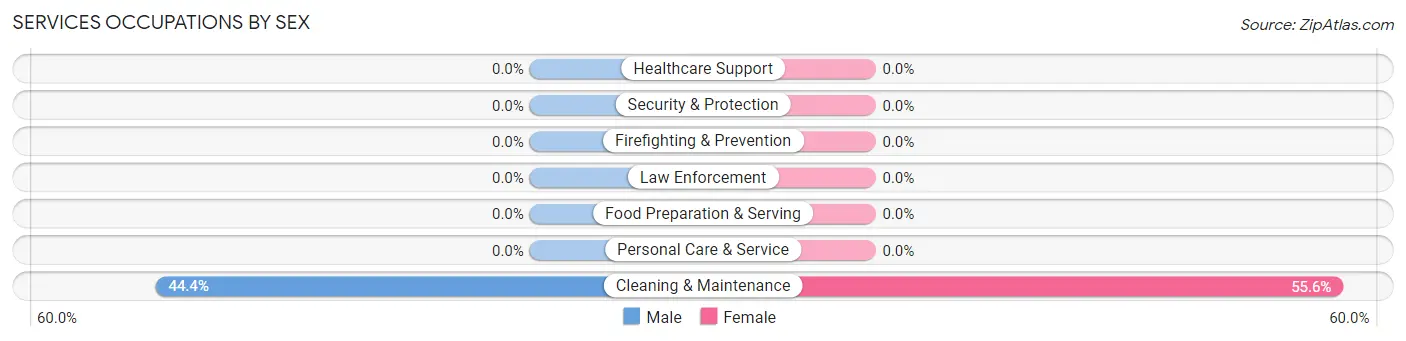
Services Occupations by Sex
| Occupation | Male | Female |
| Healthcare Support | 0 (0.0%) | 0 (0.0%) |
| Security & Protection | 0 (0.0%) | 0 (0.0%) |
| Firefighting & Prevention | 0 (0.0%) | 0 (0.0%) |
| Law Enforcement | 0 (0.0%) | 0 (0.0%) |
| Food Preparation & Serving | 0 (0.0%) | 0 (0.0%) |
| Cleaning & Maintenance | 4 (44.4%) | 5 (55.6%) |
| Personal Care & Service | 0 (0.0%) | 0 (0.0%) |
| Total (Category) | 4 (44.4%) | 5 (55.6%) |
| Total (Overall) | 67 (68.4%) | 31 (31.6%) |
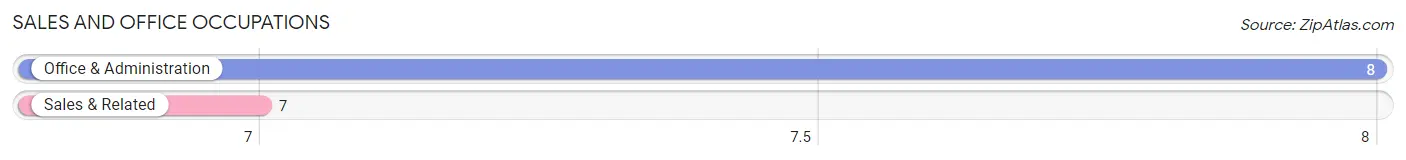
Sales and Office Occupations
The most common Sales and Office occupations in Jonesville are Office & Administration (8 | 8.2%), and Sales & Related (7 | 7.1%).
Sales and Office Occupations by Sex
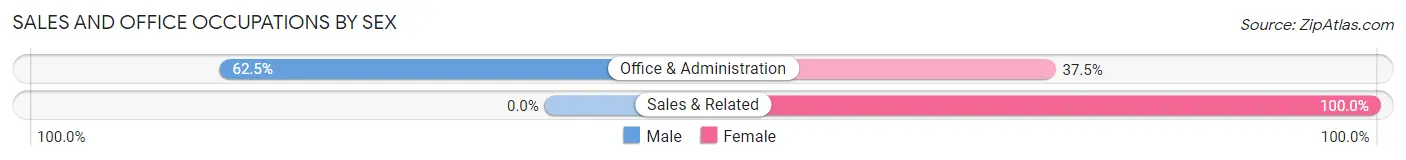
| Occupation | Male | Female |
| Sales & Related | 0 (0.0%) | 7 (100.0%) |
| Office & Administration | 5 (62.5%) | 3 (37.5%) |
| Total (Category) | 5 (33.3%) | 10 (66.7%) |
| Total (Overall) | 67 (68.4%) | 31 (31.6%) |
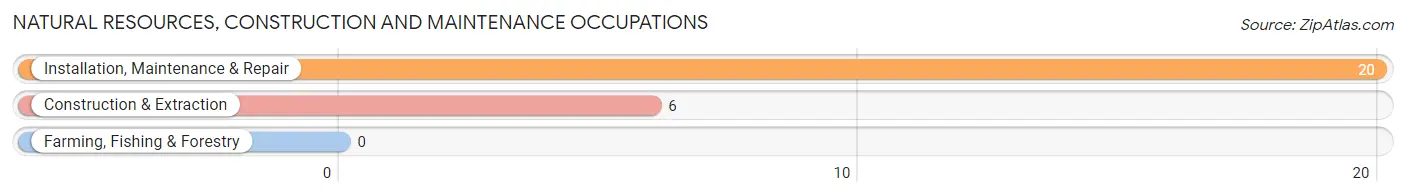
Natural Resources, Construction and Maintenance Occupations
The most common Natural Resources, Construction and Maintenance occupations in Jonesville are Installation, Maintenance & Repair (20 | 20.4%), and Construction & Extraction (6 | 6.1%).
Natural Resources, Construction and Maintenance Occupations by Sex
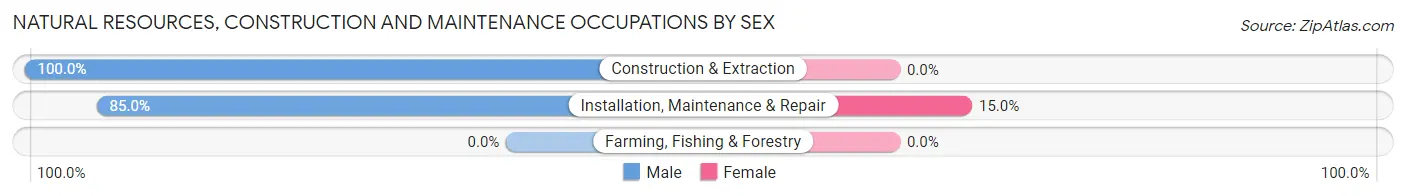
| Occupation | Male | Female |
| Farming, Fishing & Forestry | 0 (0.0%) | 0 (0.0%) |
| Construction & Extraction | 6 (100.0%) | 0 (0.0%) |
| Installation, Maintenance & Repair | 17 (85.0%) | 3 (15.0%) |
| Total (Category) | 23 (88.5%) | 3 (11.5%) |
| Total (Overall) | 67 (68.4%) | 31 (31.6%) |
Production, Transportation and Moving Occupations
The most common Production, Transportation and Moving occupations in Jonesville are Material Moving (16 | 16.3%), Production (10 | 10.2%), and Transportation (7 | 7.1%).
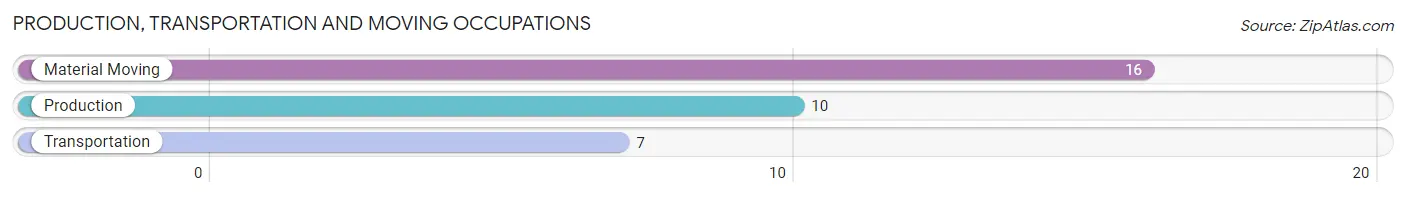
Production, Transportation and Moving Occupations by Sex
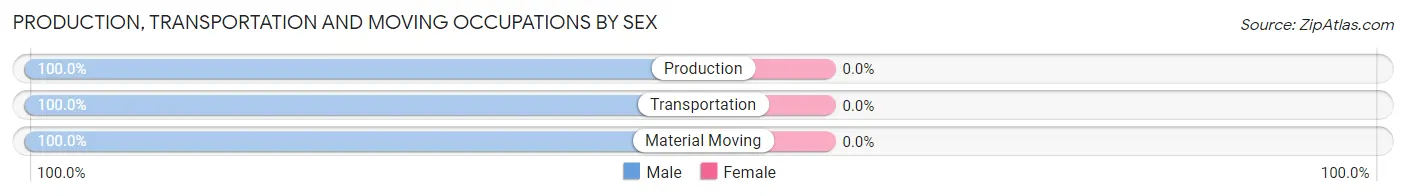
| Occupation | Male | Female |
| Production | 10 (100.0%) | 0 (0.0%) |
| Transportation | 7 (100.0%) | 0 (0.0%) |
| Material Moving | 16 (100.0%) | 0 (0.0%) |
| Total (Category) | 33 (100.0%) | 0 (0.0%) |
| Total (Overall) | 67 (68.4%) | 31 (31.6%) |
Employment Industries by Sex in Jonesville
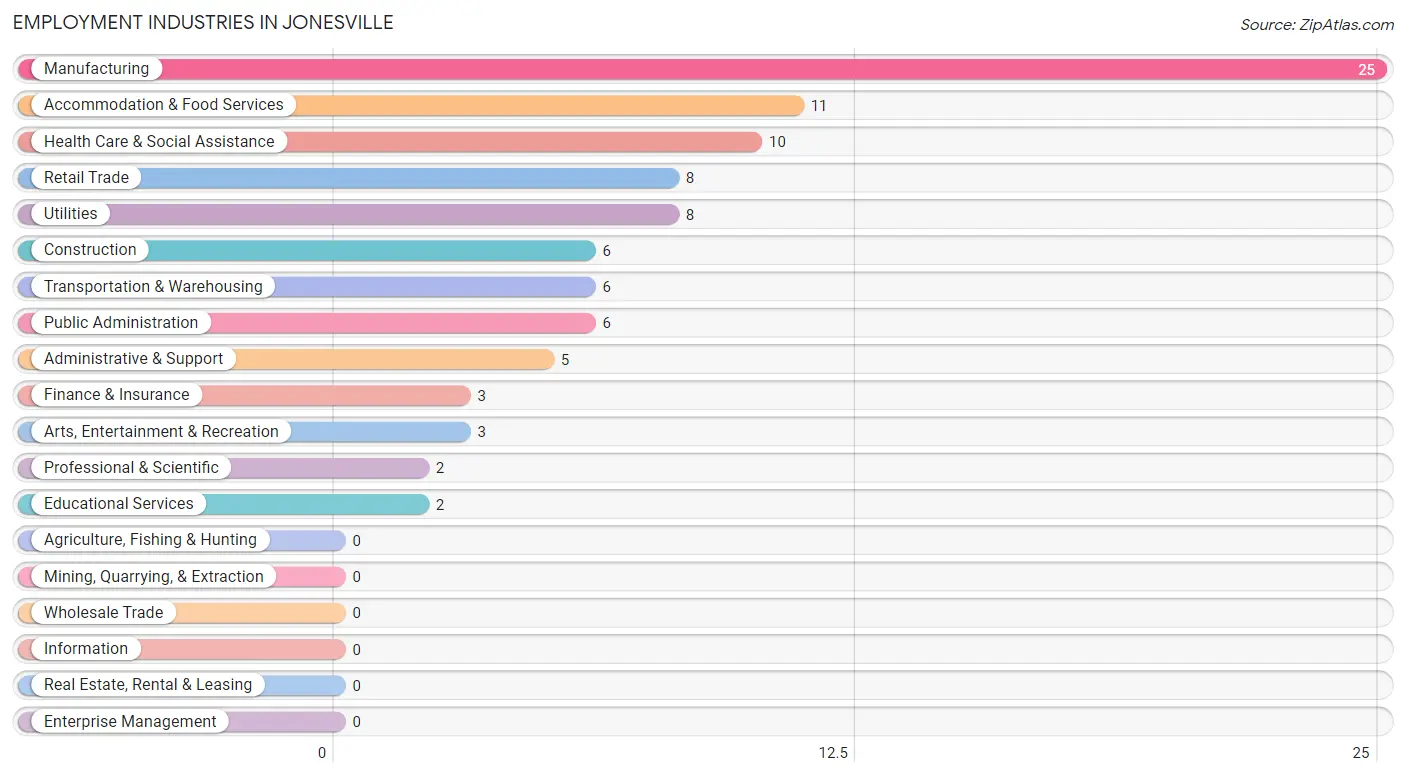
Employment Industries in Jonesville
The major employment industries in Jonesville include Manufacturing (25 | 25.5%), Accommodation & Food Services (11 | 11.2%), Health Care & Social Assistance (10 | 10.2%), Retail Trade (8 | 8.2%), and Utilities (8 | 8.2%).
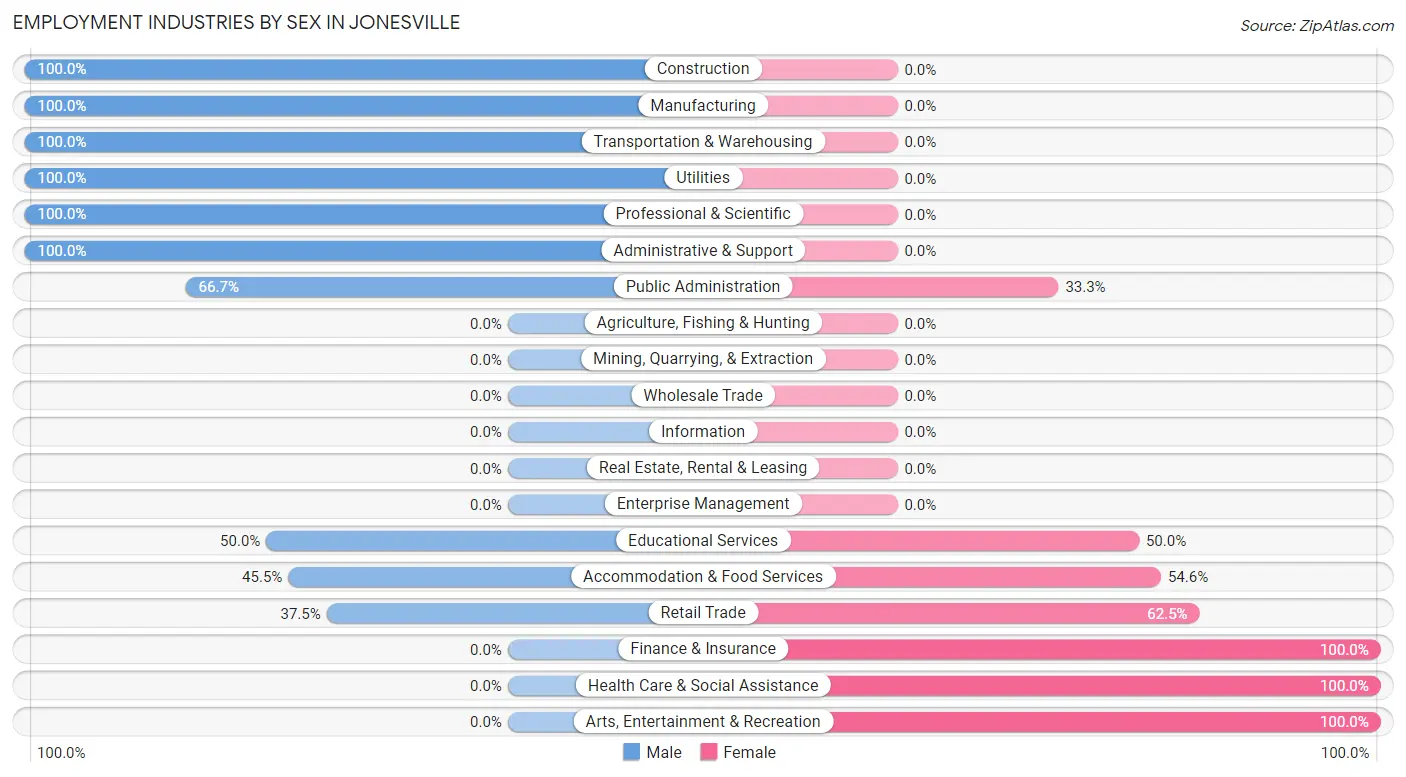
Employment Industries by Sex in Jonesville
The Jonesville industries that see more men than women are Construction (100.0%), Manufacturing (100.0%), and Transportation & Warehousing (100.0%), whereas the industries that tend to have a higher number of women are Finance & Insurance (100.0%), Health Care & Social Assistance (100.0%), and Arts, Entertainment & Recreation (100.0%).
| Industry | Male | Female |
| Agriculture, Fishing & Hunting | 0 (0.0%) | 0 (0.0%) |
| Mining, Quarrying, & Extraction | 0 (0.0%) | 0 (0.0%) |
| Construction | 6 (100.0%) | 0 (0.0%) |
| Manufacturing | 25 (100.0%) | 0 (0.0%) |
| Wholesale Trade | 0 (0.0%) | 0 (0.0%) |
| Retail Trade | 3 (37.5%) | 5 (62.5%) |
| Transportation & Warehousing | 6 (100.0%) | 0 (0.0%) |
| Utilities | 8 (100.0%) | 0 (0.0%) |
| Information | 0 (0.0%) | 0 (0.0%) |
| Finance & Insurance | 0 (0.0%) | 3 (100.0%) |
| Real Estate, Rental & Leasing | 0 (0.0%) | 0 (0.0%) |
| Professional & Scientific | 2 (100.0%) | 0 (0.0%) |
| Enterprise Management | 0 (0.0%) | 0 (0.0%) |
| Administrative & Support | 5 (100.0%) | 0 (0.0%) |
| Educational Services | 1 (50.0%) | 1 (50.0%) |
| Health Care & Social Assistance | 0 (0.0%) | 10 (100.0%) |
| Arts, Entertainment & Recreation | 0 (0.0%) | 3 (100.0%) |
| Accommodation & Food Services | 5 (45.5%) | 6 (54.5%) |
| Public Administration | 4 (66.7%) | 2 (33.3%) |
| Total | 67 (68.4%) | 31 (31.6%) |
Education in Jonesville
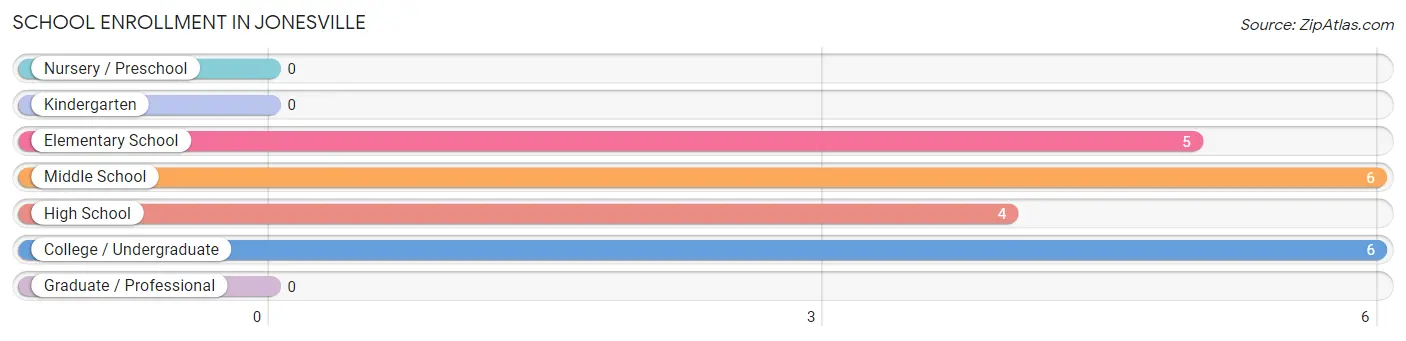
School Enrollment in Jonesville
The most common levels of schooling among the 21 students in Jonesville are middle school (6 | 28.6%), college / undergraduate (6 | 28.6%), and elementary school (5 | 23.8%).
| School Level | # Students | % Students |
| Nursery / Preschool | 0 | 0.0% |
| Kindergarten | 0 | 0.0% |
| Elementary School | 5 | 23.8% |
| Middle School | 6 | 28.6% |
| High School | 4 | 19.1% |
| College / Undergraduate | 6 | 28.6% |
| Graduate / Professional | 0 | 0.0% |
| Total | 21 | 100.0% |
School Enrollment by Age by Funding Source in Jonesville
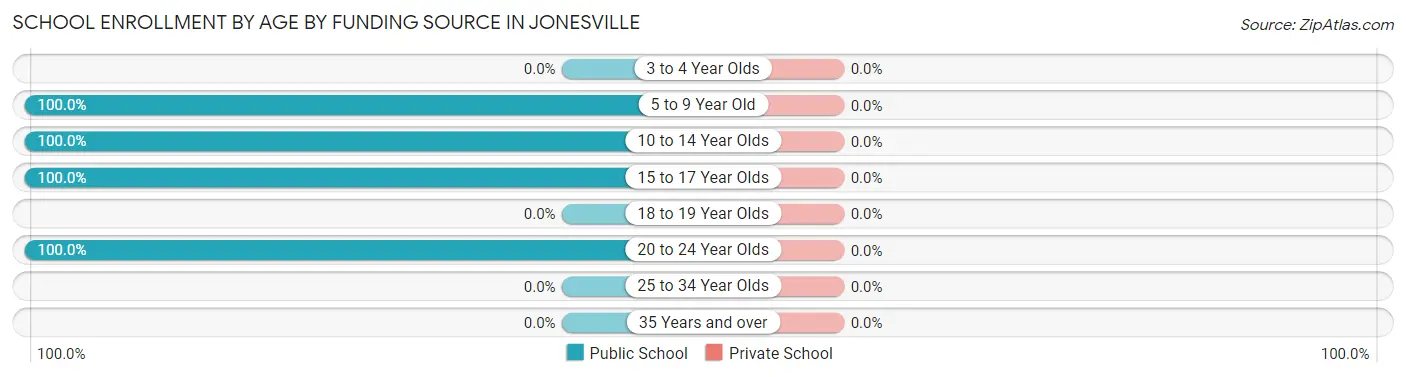
| Age Bracket | Public School | Private School |
| 3 to 4 Year Olds | 0 (0.0%) | 0 (0.0%) |
| 5 to 9 Year Old | 4 (100.0%) | 0 (0.0%) |
| 10 to 14 Year Olds | 7 (100.0%) | 0 (0.0%) |
| 15 to 17 Year Olds | 4 (100.0%) | 0 (0.0%) |
| 18 to 19 Year Olds | 0 (0.0%) | 0 (0.0%) |
| 20 to 24 Year Olds | 6 (100.0%) | 0 (0.0%) |
| 25 to 34 Year Olds | 0 (0.0%) | 0 (0.0%) |
| 35 Years and over | 0 (0.0%) | 0 (0.0%) |
| Total | 21 (100.0%) | 0 (0.0%) |
Educational Attainment by Field of Study in Jonesville
Education (4 | 33.3%), liberal arts & history (4 | 33.3%), science & technology (3 | 25.0%), and social sciences (1 | 8.3%) are the most common fields of study among 12 individuals in Jonesville who have obtained a bachelor's degree or higher.
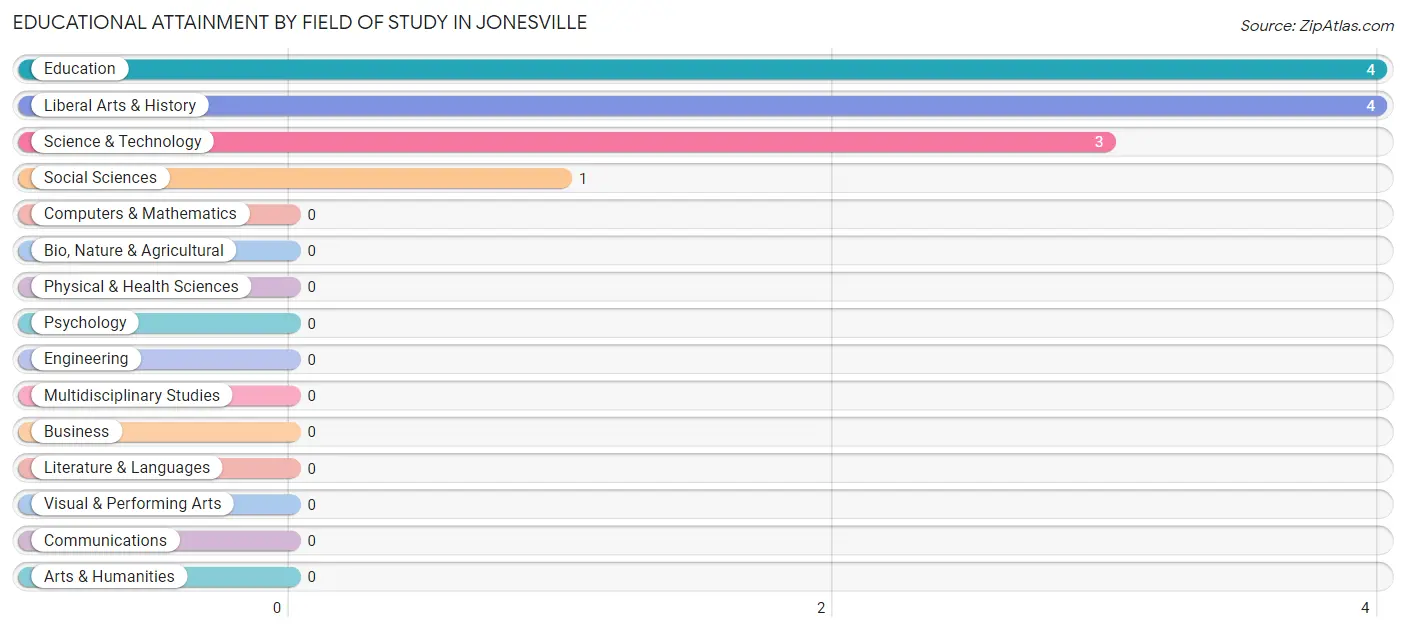
| Field of Study | # Graduates | % Graduates |
| Computers & Mathematics | 0 | 0.0% |
| Bio, Nature & Agricultural | 0 | 0.0% |
| Physical & Health Sciences | 0 | 0.0% |
| Psychology | 0 | 0.0% |
| Social Sciences | 1 | 8.3% |
| Engineering | 0 | 0.0% |
| Multidisciplinary Studies | 0 | 0.0% |
| Science & Technology | 3 | 25.0% |
| Business | 0 | 0.0% |
| Education | 4 | 33.3% |
| Literature & Languages | 0 | 0.0% |
| Liberal Arts & History | 4 | 33.3% |
| Visual & Performing Arts | 0 | 0.0% |
| Communications | 0 | 0.0% |
| Arts & Humanities | 0 | 0.0% |
| Total | 12 | 100.0% |
Transportation & Commute in Jonesville
Vehicle Availability by Sex in Jonesville
The most prevalent vehicle ownership categories in Jonesville are males with 3 vehicles (24, accounting for 35.8%) and females with 3 vehicles (9, making up 77.4%).
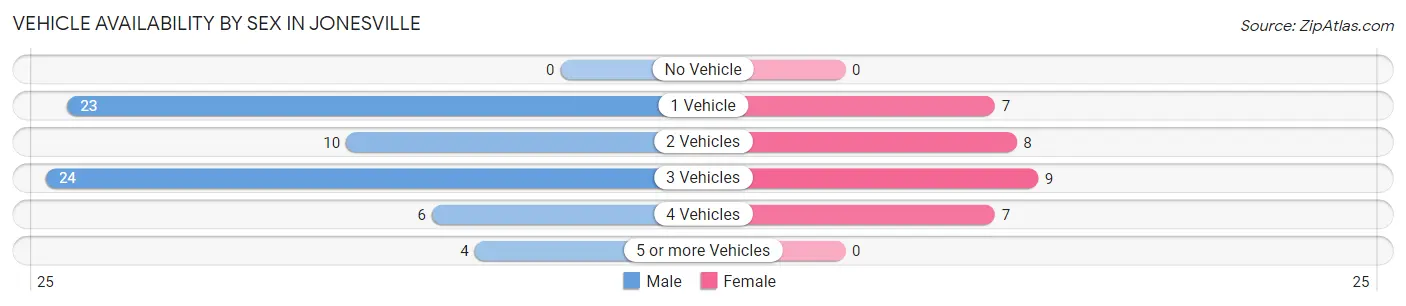
| Vehicles Available | Male | Female |
| No Vehicle | 0 (0.0%) | 0 (0.0%) |
| 1 Vehicle | 23 (34.3%) | 7 (22.6%) |
| 2 Vehicles | 10 (14.9%) | 8 (25.8%) |
| 3 Vehicles | 24 (35.8%) | 9 (29.0%) |
| 4 Vehicles | 6 (9.0%) | 7 (22.6%) |
| 5 or more Vehicles | 4 (6.0%) | 0 (0.0%) |
| Total | 67 (100.0%) | 31 (100.0%) |
Commute Time in Jonesville
The most frequently occuring commute durations in Jonesville are 20 to 24 minutes (32 commuters, 33.0%), 15 to 19 minutes (16 commuters, 16.5%), and 60 to 89 minutes (16 commuters, 16.5%).
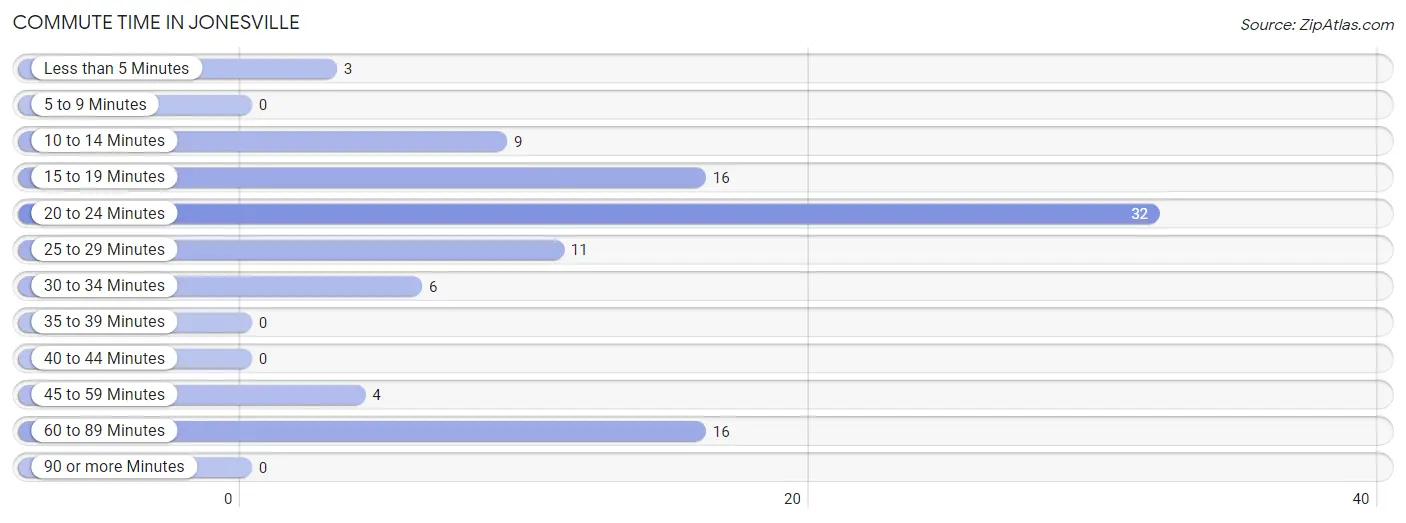
| Commute Time | # Commuters | % Commuters |
| Less than 5 Minutes | 3 | 3.1% |
| 5 to 9 Minutes | 0 | 0.0% |
| 10 to 14 Minutes | 9 | 9.3% |
| 15 to 19 Minutes | 16 | 16.5% |
| 20 to 24 Minutes | 32 | 33.0% |
| 25 to 29 Minutes | 11 | 11.3% |
| 30 to 34 Minutes | 6 | 6.2% |
| 35 to 39 Minutes | 0 | 0.0% |
| 40 to 44 Minutes | 0 | 0.0% |
| 45 to 59 Minutes | 4 | 4.1% |
| 60 to 89 Minutes | 16 | 16.5% |
| 90 or more Minutes | 0 | 0.0% |
Commute Time by Sex in Jonesville
The most common commute times in Jonesville are 20 to 24 minutes (23 commuters, 34.3%) for males and 20 to 24 minutes (9 commuters, 30.0%) for females.
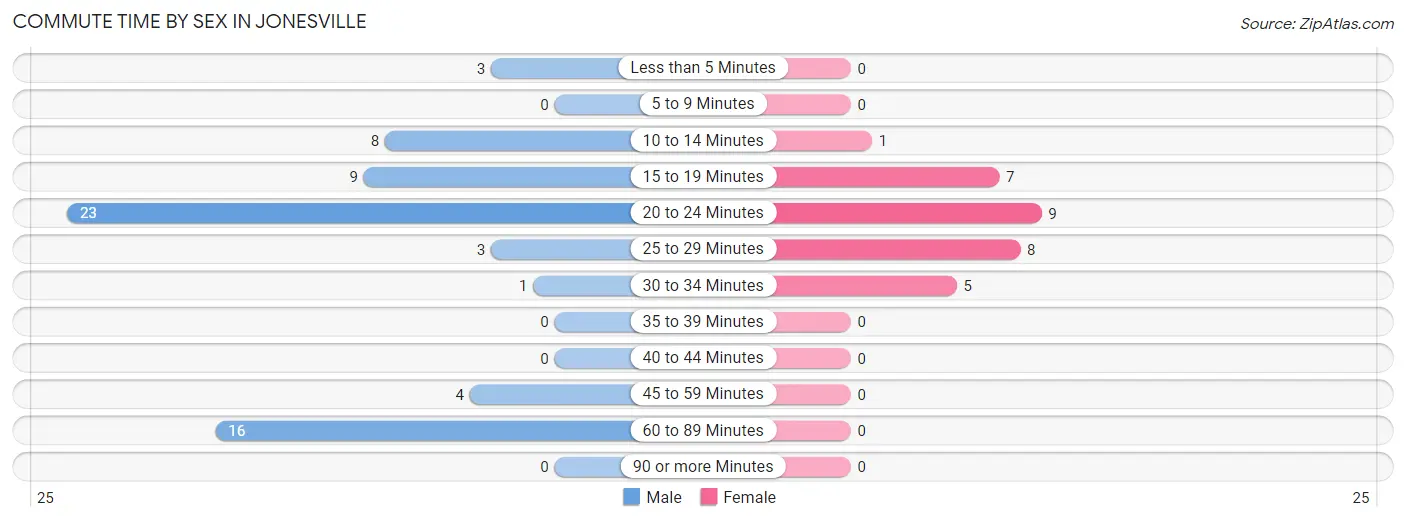
| Commute Time | Male | Female |
| Less than 5 Minutes | 3 (4.5%) | 0 (0.0%) |
| 5 to 9 Minutes | 0 (0.0%) | 0 (0.0%) |
| 10 to 14 Minutes | 8 (11.9%) | 1 (3.3%) |
| 15 to 19 Minutes | 9 (13.4%) | 7 (23.3%) |
| 20 to 24 Minutes | 23 (34.3%) | 9 (30.0%) |
| 25 to 29 Minutes | 3 (4.5%) | 8 (26.7%) |
| 30 to 34 Minutes | 1 (1.5%) | 5 (16.7%) |
| 35 to 39 Minutes | 0 (0.0%) | 0 (0.0%) |
| 40 to 44 Minutes | 0 (0.0%) | 0 (0.0%) |
| 45 to 59 Minutes | 4 (6.0%) | 0 (0.0%) |
| 60 to 89 Minutes | 16 (23.9%) | 0 (0.0%) |
| 90 or more Minutes | 0 (0.0%) | 0 (0.0%) |
Time of Departure to Work by Sex in Jonesville
The most frequent times of departure to work in Jonesville are 6:00 AM to 6:29 AM (22, 32.8%) for males and 6:30 AM to 6:59 AM (9, 30.0%) for females.
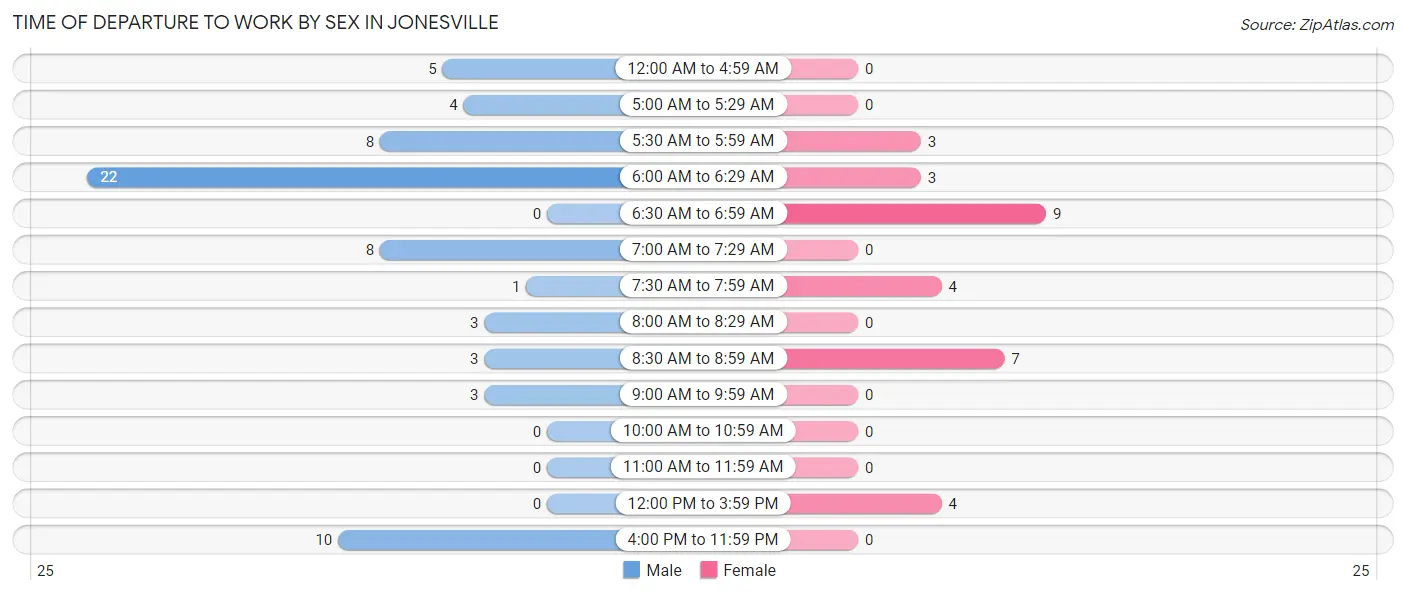
| Time of Departure | Male | Female |
| 12:00 AM to 4:59 AM | 5 (7.5%) | 0 (0.0%) |
| 5:00 AM to 5:29 AM | 4 (6.0%) | 0 (0.0%) |
| 5:30 AM to 5:59 AM | 8 (11.9%) | 3 (10.0%) |
| 6:00 AM to 6:29 AM | 22 (32.8%) | 3 (10.0%) |
| 6:30 AM to 6:59 AM | 0 (0.0%) | 9 (30.0%) |
| 7:00 AM to 7:29 AM | 8 (11.9%) | 0 (0.0%) |
| 7:30 AM to 7:59 AM | 1 (1.5%) | 4 (13.3%) |
| 8:00 AM to 8:29 AM | 3 (4.5%) | 0 (0.0%) |
| 8:30 AM to 8:59 AM | 3 (4.5%) | 7 (23.3%) |
| 9:00 AM to 9:59 AM | 3 (4.5%) | 0 (0.0%) |
| 10:00 AM to 10:59 AM | 0 (0.0%) | 0 (0.0%) |
| 11:00 AM to 11:59 AM | 0 (0.0%) | 0 (0.0%) |
| 12:00 PM to 3:59 PM | 0 (0.0%) | 4 (13.3%) |
| 4:00 PM to 11:59 PM | 10 (14.9%) | 0 (0.0%) |
| Total | 67 (100.0%) | 30 (100.0%) |
Housing Occupancy in Jonesville
Occupancy by Ownership in Jonesville
Of the total 88 dwellings in Jonesville, owner-occupied units account for 69 (78.4%), while renter-occupied units make up 19 (21.6%).
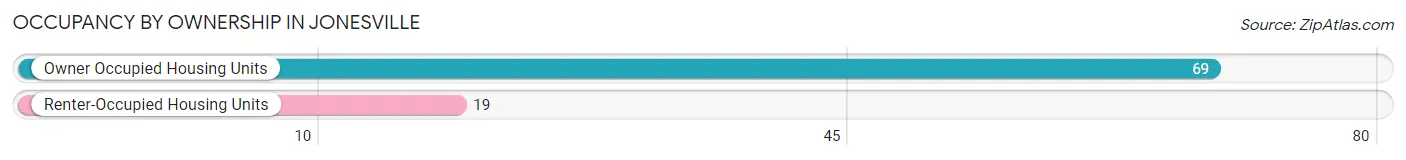
| Occupancy | # Housing Units | % Housing Units |
| Owner Occupied Housing Units | 69 | 78.4% |
| Renter-Occupied Housing Units | 19 | 21.6% |
| Total Occupied Housing Units | 88 | 100.0% |
Occupancy by Household Size in Jonesville

| Household Size | # Housing Units | % Housing Units |
| 1-Person Household | 28 | 31.8% |
| 2-Person Household | 44 | 50.0% |
| 3-Person Household | 6 | 6.8% |
| 4+ Person Household | 10 | 11.4% |
| Total Housing Units | 88 | 100.0% |
Occupancy by Ownership by Household Size in Jonesville
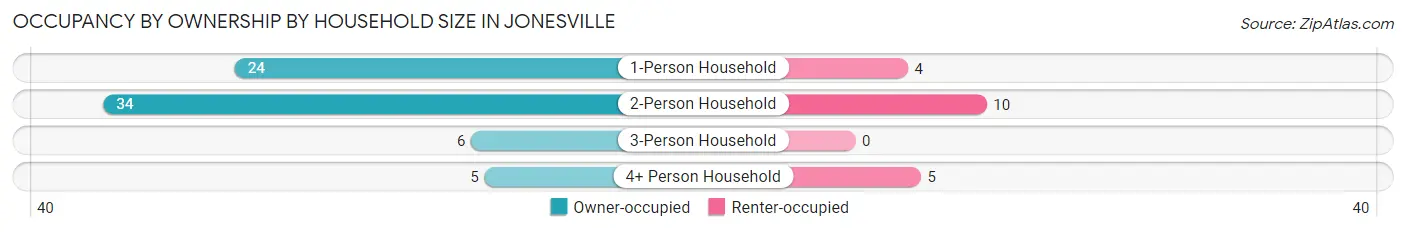
| Household Size | Owner-occupied | Renter-occupied |
| 1-Person Household | 24 (85.7%) | 4 (14.3%) |
| 2-Person Household | 34 (77.3%) | 10 (22.7%) |
| 3-Person Household | 6 (100.0%) | 0 (0.0%) |
| 4+ Person Household | 5 (50.0%) | 5 (50.0%) |
| Total Housing Units | 69 (78.4%) | 19 (21.6%) |
Occupancy by Educational Attainment in Jonesville
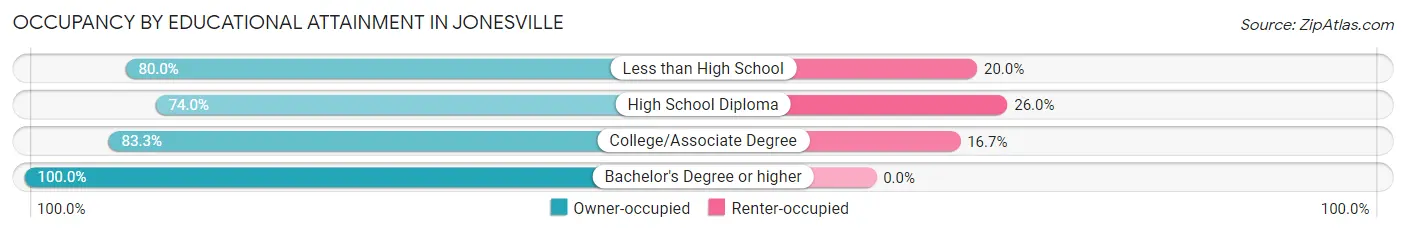
| Household Size | Owner-occupied | Renter-occupied |
| Less than High School | 4 (80.0%) | 1 (20.0%) |
| High School Diploma | 37 (74.0%) | 13 (26.0%) |
| College/Associate Degree | 25 (83.3%) | 5 (16.7%) |
| Bachelor's Degree or higher | 3 (100.0%) | 0 (0.0%) |
Occupancy by Age of Householder in Jonesville
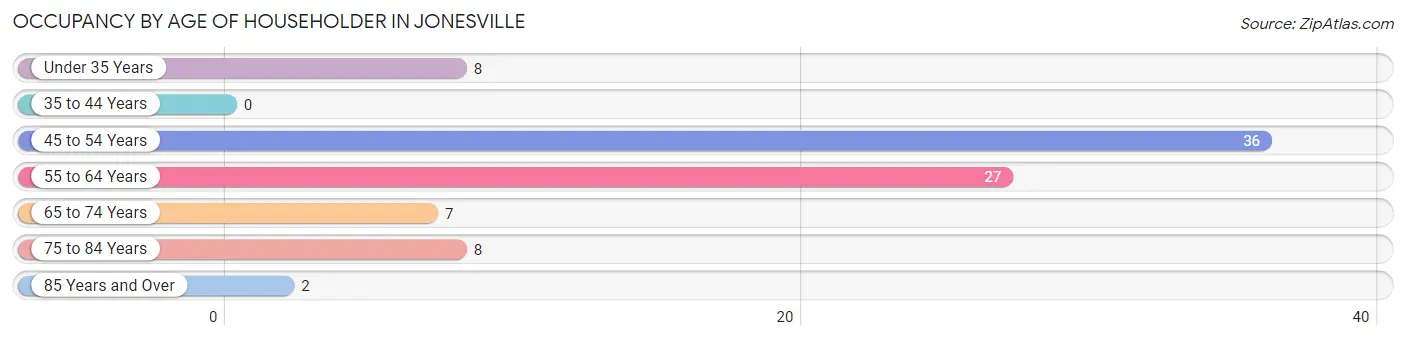
| Age Bracket | # Households | % Households |
| Under 35 Years | 8 | 9.1% |
| 35 to 44 Years | 0 | 0.0% |
| 45 to 54 Years | 36 | 40.9% |
| 55 to 64 Years | 27 | 30.7% |
| 65 to 74 Years | 7 | 8.0% |
| 75 to 84 Years | 8 | 9.1% |
| 85 Years and Over | 2 | 2.3% |
| Total | 88 | 100.0% |
Housing Finances in Jonesville
Median Income by Occupancy in Jonesville
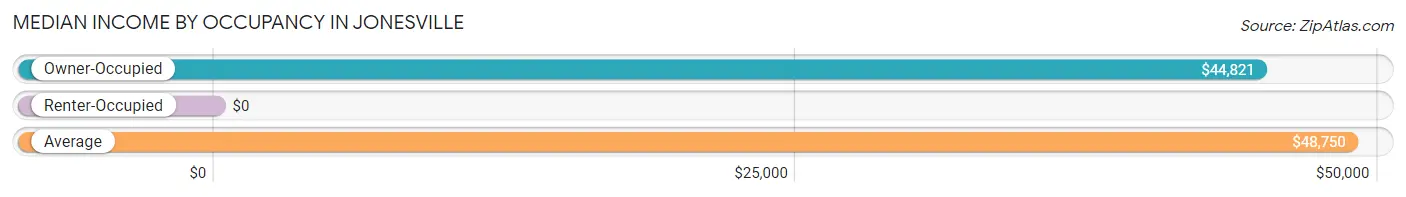
| Occupancy Type | # Households | Median Income |
| Owner-Occupied | 69 (78.4%) | $44,821 |
| Renter-Occupied | 19 (21.6%) | $0 |
| Average | 88 (100.0%) | $48,750 |
Occupancy by Householder Income Bracket in Jonesville
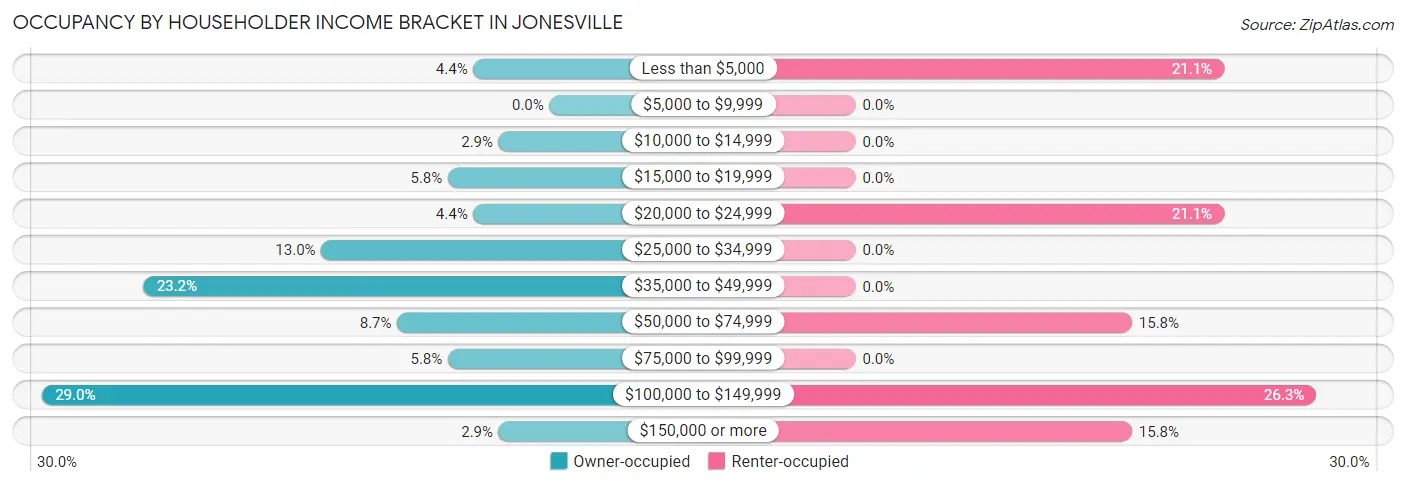
| Income Bracket | Owner-occupied | Renter-occupied |
| Less than $5,000 | 3 (4.3%) | 4 (21.0%) |
| $5,000 to $9,999 | 0 (0.0%) | 0 (0.0%) |
| $10,000 to $14,999 | 2 (2.9%) | 0 (0.0%) |
| $15,000 to $19,999 | 4 (5.8%) | 0 (0.0%) |
| $20,000 to $24,999 | 3 (4.3%) | 4 (21.0%) |
| $25,000 to $34,999 | 9 (13.0%) | 0 (0.0%) |
| $35,000 to $49,999 | 16 (23.2%) | 0 (0.0%) |
| $50,000 to $74,999 | 6 (8.7%) | 3 (15.8%) |
| $75,000 to $99,999 | 4 (5.8%) | 0 (0.0%) |
| $100,000 to $149,999 | 20 (29.0%) | 5 (26.3%) |
| $150,000 or more | 2 (2.9%) | 3 (15.8%) |
| Total | 69 (100.0%) | 19 (100.0%) |
Monthly Housing Cost Tiers in Jonesville
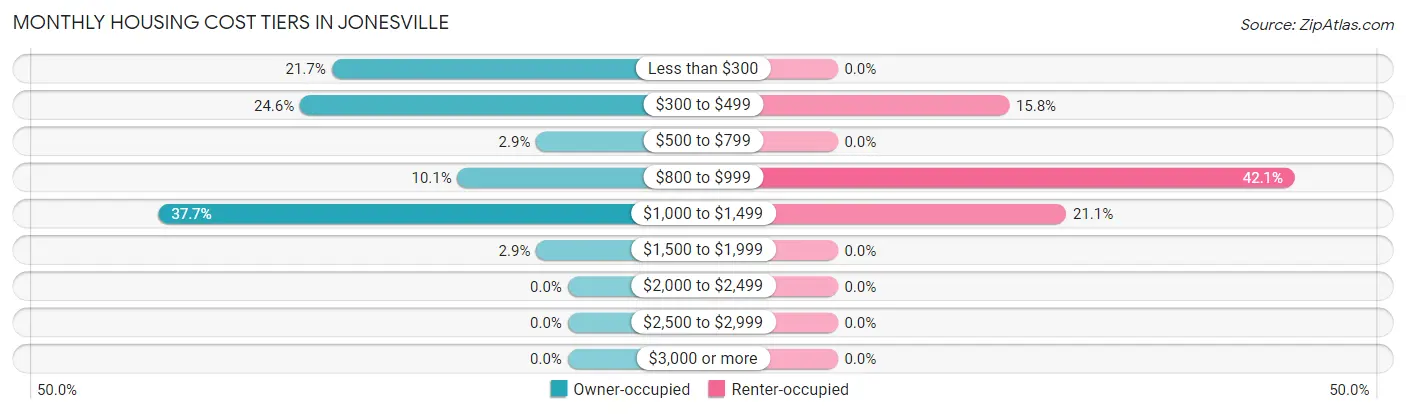
| Monthly Cost | Owner-occupied | Renter-occupied |
| Less than $300 | 15 (21.7%) | 0 (0.0%) |
| $300 to $499 | 17 (24.6%) | 3 (15.8%) |
| $500 to $799 | 2 (2.9%) | 0 (0.0%) |
| $800 to $999 | 7 (10.1%) | 8 (42.1%) |
| $1,000 to $1,499 | 26 (37.7%) | 4 (21.0%) |
| $1,500 to $1,999 | 2 (2.9%) | 0 (0.0%) |
| $2,000 to $2,499 | 0 (0.0%) | 0 (0.0%) |
| $2,500 to $2,999 | 0 (0.0%) | 0 (0.0%) |
| $3,000 or more | 0 (0.0%) | 0 (0.0%) |
| Total | 69 (100.0%) | 19 (100.0%) |
Physical Housing Characteristics in Jonesville
Housing Structures in Jonesville
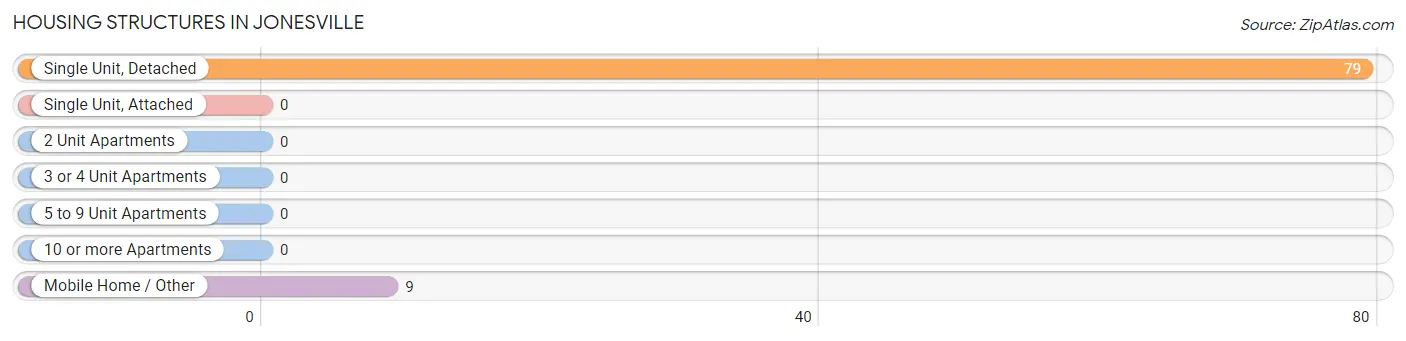
| Structure Type | # Housing Units | % Housing Units |
| Single Unit, Detached | 79 | 89.8% |
| Single Unit, Attached | 0 | 0.0% |
| 2 Unit Apartments | 0 | 0.0% |
| 3 or 4 Unit Apartments | 0 | 0.0% |
| 5 to 9 Unit Apartments | 0 | 0.0% |
| 10 or more Apartments | 0 | 0.0% |
| Mobile Home / Other | 9 | 10.2% |
| Total | 88 | 100.0% |
Housing Structures by Occupancy in Jonesville
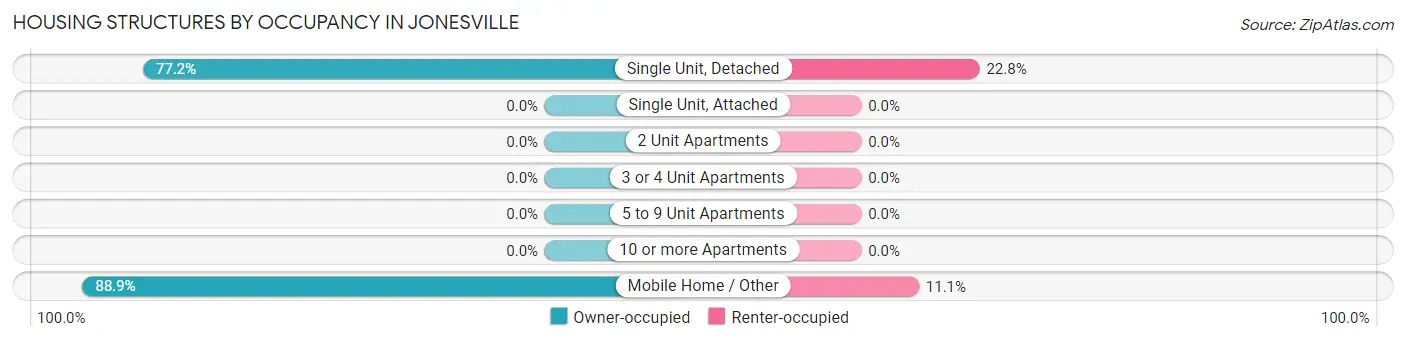
| Structure Type | Owner-occupied | Renter-occupied |
| Single Unit, Detached | 61 (77.2%) | 18 (22.8%) |
| Single Unit, Attached | 0 (0.0%) | 0 (0.0%) |
| 2 Unit Apartments | 0 (0.0%) | 0 (0.0%) |
| 3 or 4 Unit Apartments | 0 (0.0%) | 0 (0.0%) |
| 5 to 9 Unit Apartments | 0 (0.0%) | 0 (0.0%) |
| 10 or more Apartments | 0 (0.0%) | 0 (0.0%) |
| Mobile Home / Other | 8 (88.9%) | 1 (11.1%) |
| Total | 69 (78.4%) | 19 (21.6%) |
Housing Structures by Number of Rooms in Jonesville
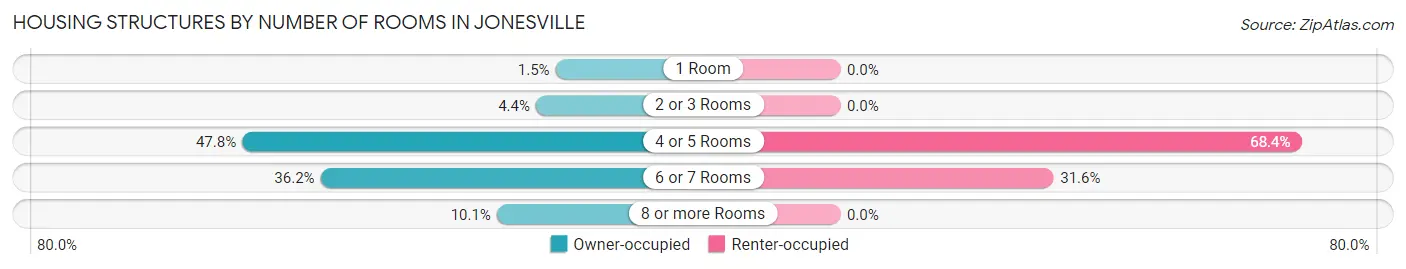
| Number of Rooms | Owner-occupied | Renter-occupied |
| 1 Room | 1 (1.5%) | 0 (0.0%) |
| 2 or 3 Rooms | 3 (4.3%) | 0 (0.0%) |
| 4 or 5 Rooms | 33 (47.8%) | 13 (68.4%) |
| 6 or 7 Rooms | 25 (36.2%) | 6 (31.6%) |
| 8 or more Rooms | 7 (10.1%) | 0 (0.0%) |
| Total | 69 (100.0%) | 19 (100.0%) |
Housing Structure by Heating Type in Jonesville
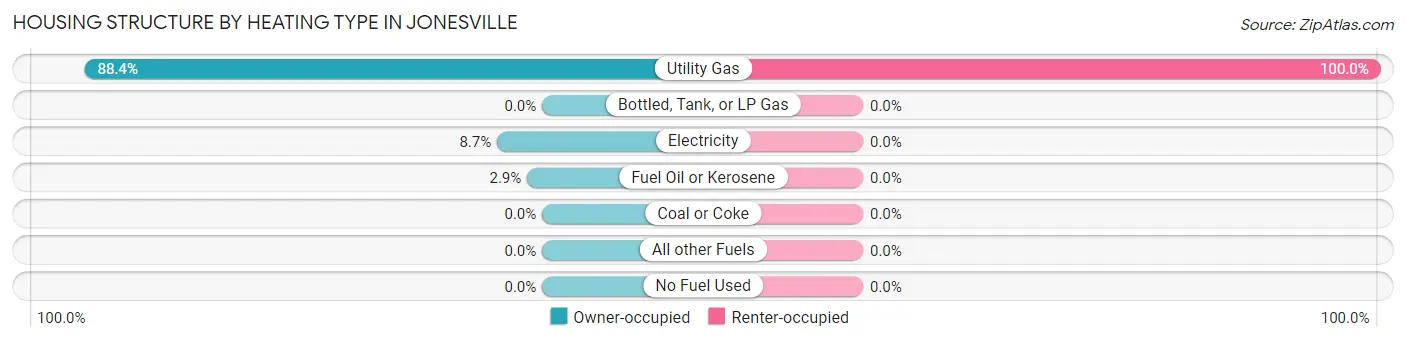
| Heating Type | Owner-occupied | Renter-occupied |
| Utility Gas | 61 (88.4%) | 19 (100.0%) |
| Bottled, Tank, or LP Gas | 0 (0.0%) | 0 (0.0%) |
| Electricity | 6 (8.7%) | 0 (0.0%) |
| Fuel Oil or Kerosene | 2 (2.9%) | 0 (0.0%) |
| Coal or Coke | 0 (0.0%) | 0 (0.0%) |
| All other Fuels | 0 (0.0%) | 0 (0.0%) |
| No Fuel Used | 0 (0.0%) | 0 (0.0%) |
| Total | 69 (100.0%) | 19 (100.0%) |
Household Vehicle Usage in Jonesville
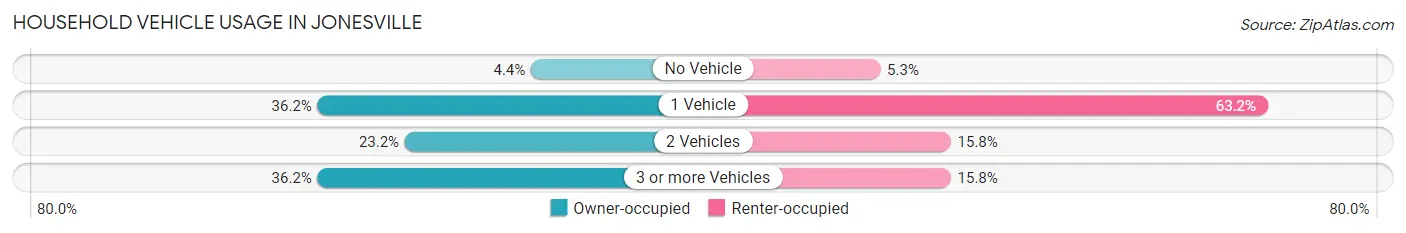
| Vehicles per Household | Owner-occupied | Renter-occupied |
| No Vehicle | 3 (4.3%) | 1 (5.3%) |
| 1 Vehicle | 25 (36.2%) | 12 (63.2%) |
| 2 Vehicles | 16 (23.2%) | 3 (15.8%) |
| 3 or more Vehicles | 25 (36.2%) | 3 (15.8%) |
| Total | 69 (100.0%) | 19 (100.0%) |
Real Estate & Mortgages in Jonesville
Real Estate and Mortgage Overview in Jonesville
| Characteristic | Without Mortgage | With Mortgage |
| Housing Units | 30 | 39 |
| Median Property Value | $95,500 | $133,900 |
| Median Household Income | $36,250 | $1 |
| Monthly Housing Costs | $275 | $0 |
| Real Estate Taxes | $378 | $9 |
Property Value by Mortgage Status in Jonesville
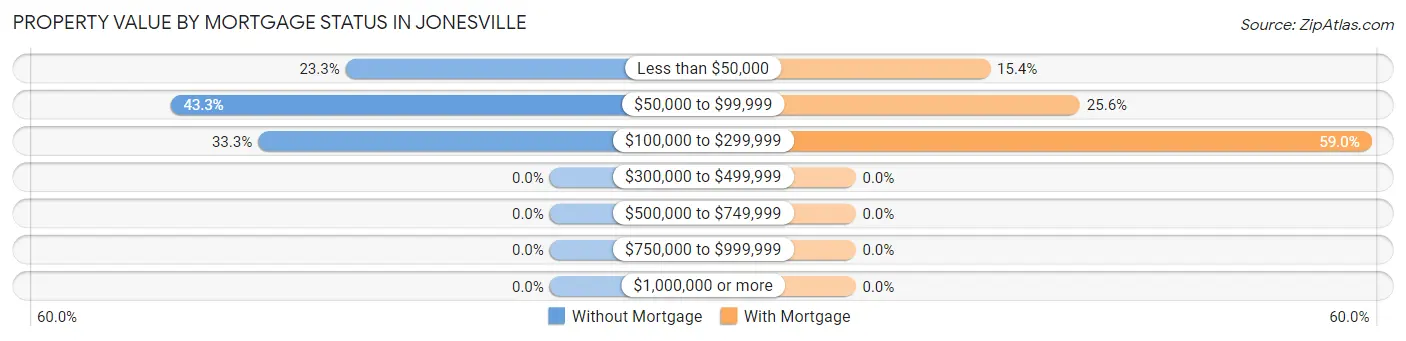
| Property Value | Without Mortgage | With Mortgage |
| Less than $50,000 | 7 (23.3%) | 6 (15.4%) |
| $50,000 to $99,999 | 13 (43.3%) | 10 (25.6%) |
| $100,000 to $299,999 | 10 (33.3%) | 23 (59.0%) |
| $300,000 to $499,999 | 0 (0.0%) | 0 (0.0%) |
| $500,000 to $749,999 | 0 (0.0%) | 0 (0.0%) |
| $750,000 to $999,999 | 0 (0.0%) | 0 (0.0%) |
| $1,000,000 or more | 0 (0.0%) | 0 (0.0%) |
| Total | 30 (100.0%) | 39 (100.0%) |
Household Income by Mortgage Status in Jonesville
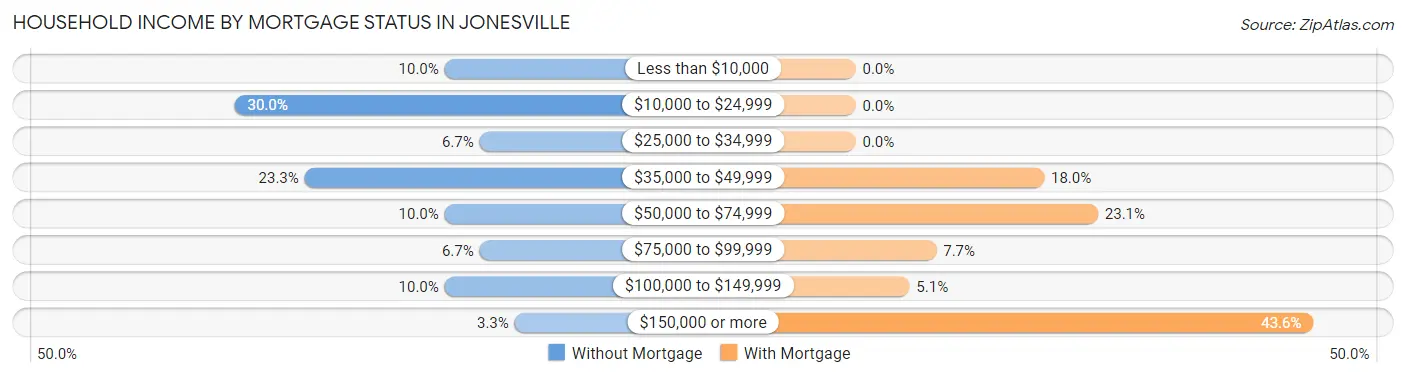
| Household Income | Without Mortgage | With Mortgage |
| Less than $10,000 | 3 (10.0%) | 0 (0.0%) |
| $10,000 to $24,999 | 9 (30.0%) | 0 (0.0%) |
| $25,000 to $34,999 | 2 (6.7%) | 0 (0.0%) |
| $35,000 to $49,999 | 7 (23.3%) | 7 (17.9%) |
| $50,000 to $74,999 | 3 (10.0%) | 9 (23.1%) |
| $75,000 to $99,999 | 2 (6.7%) | 3 (7.7%) |
| $100,000 to $149,999 | 3 (10.0%) | 2 (5.1%) |
| $150,000 or more | 1 (3.3%) | 17 (43.6%) |
| Total | 30 (100.0%) | 39 (100.0%) |
Property Value to Household Income Ratio in Jonesville
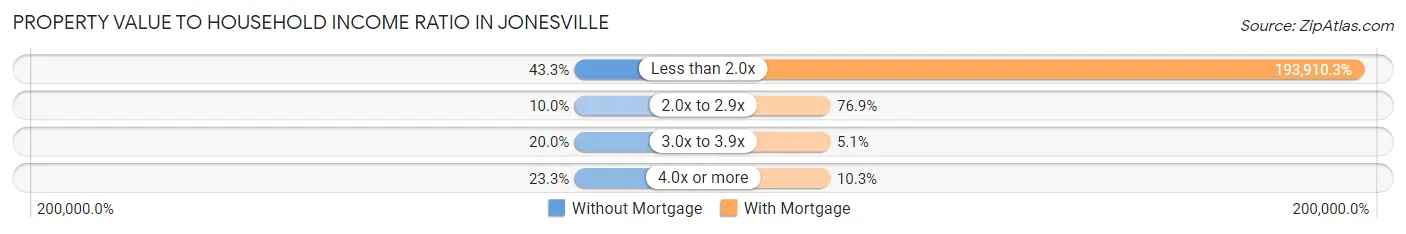
| Value-to-Income Ratio | Without Mortgage | With Mortgage |
| Less than 2.0x | 13 (43.3%) | 75,625 (193,910.3%) |
| 2.0x to 2.9x | 3 (10.0%) | 30 (76.9%) |
| 3.0x to 3.9x | 6 (20.0%) | 2 (5.1%) |
| 4.0x or more | 7 (23.3%) | 4 (10.3%) |
| Total | 30 (100.0%) | 39 (100.0%) |
Real Estate Taxes by Mortgage Status in Jonesville
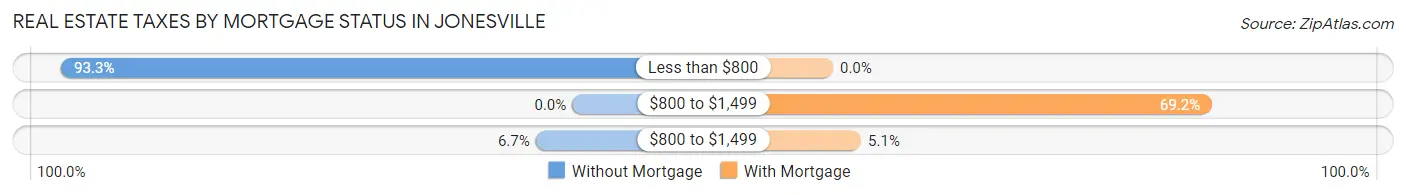
| Property Taxes | Without Mortgage | With Mortgage |
| Less than $800 | 28 (93.3%) | 0 (0.0%) |
| $800 to $1,499 | 0 (0.0%) | 27 (69.2%) |
| $800 to $1,499 | 2 (6.7%) | 2 (5.1%) |
| Total | 30 (100.0%) | 39 (100.0%) |
Health & Disability in Jonesville
Health Insurance Coverage by Age in Jonesville
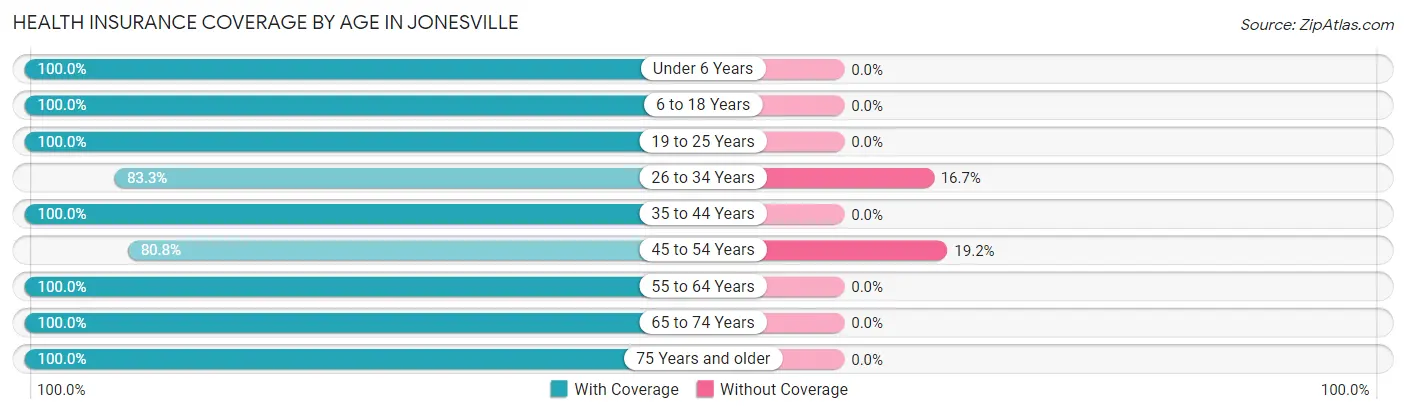
| Age Bracket | With Coverage | Without Coverage |
| Under 6 Years | 13 (100.0%) | 0 (0.0%) |
| 6 to 18 Years | 19 (100.0%) | 0 (0.0%) |
| 19 to 25 Years | 12 (100.0%) | 0 (0.0%) |
| 26 to 34 Years | 15 (83.3%) | 3 (16.7%) |
| 35 to 44 Years | 11 (100.0%) | 0 (0.0%) |
| 45 to 54 Years | 42 (80.8%) | 10 (19.2%) |
| 55 to 64 Years | 33 (100.0%) | 0 (0.0%) |
| 65 to 74 Years | 22 (100.0%) | 0 (0.0%) |
| 75 Years and older | 16 (100.0%) | 0 (0.0%) |
| Total | 183 (93.4%) | 13 (6.6%) |
Health Insurance Coverage by Citizenship Status in Jonesville
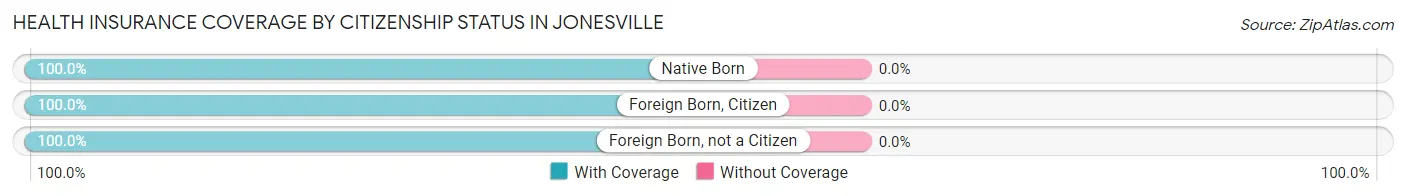
| Citizenship Status | With Coverage | Without Coverage |
| Native Born | 13 (100.0%) | 0 (0.0%) |
| Foreign Born, Citizen | 19 (100.0%) | 0 (0.0%) |
| Foreign Born, not a Citizen | 12 (100.0%) | 0 (0.0%) |
Health Insurance Coverage by Household Income in Jonesville
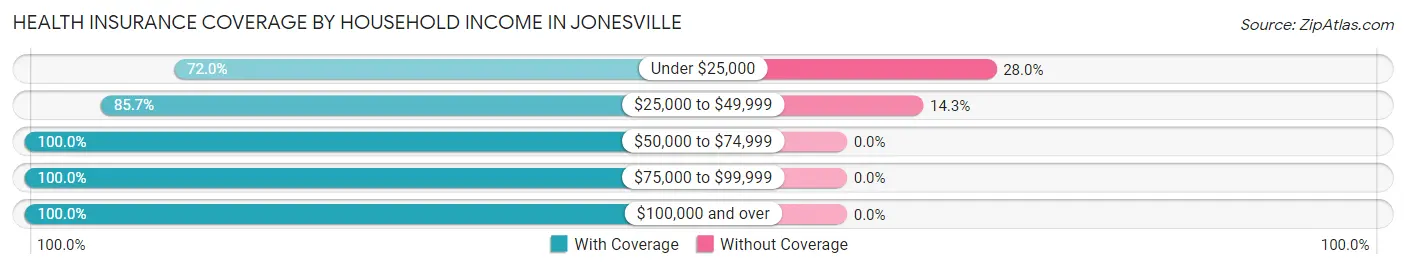
| Household Income | With Coverage | Without Coverage |
| Under $25,000 | 18 (72.0%) | 7 (28.0%) |
| $25,000 to $49,999 | 36 (85.7%) | 6 (14.3%) |
| $50,000 to $74,999 | 38 (100.0%) | 0 (0.0%) |
| $75,000 to $99,999 | 8 (100.0%) | 0 (0.0%) |
| $100,000 and over | 83 (100.0%) | 0 (0.0%) |
Public vs Private Health Insurance Coverage by Age in Jonesville
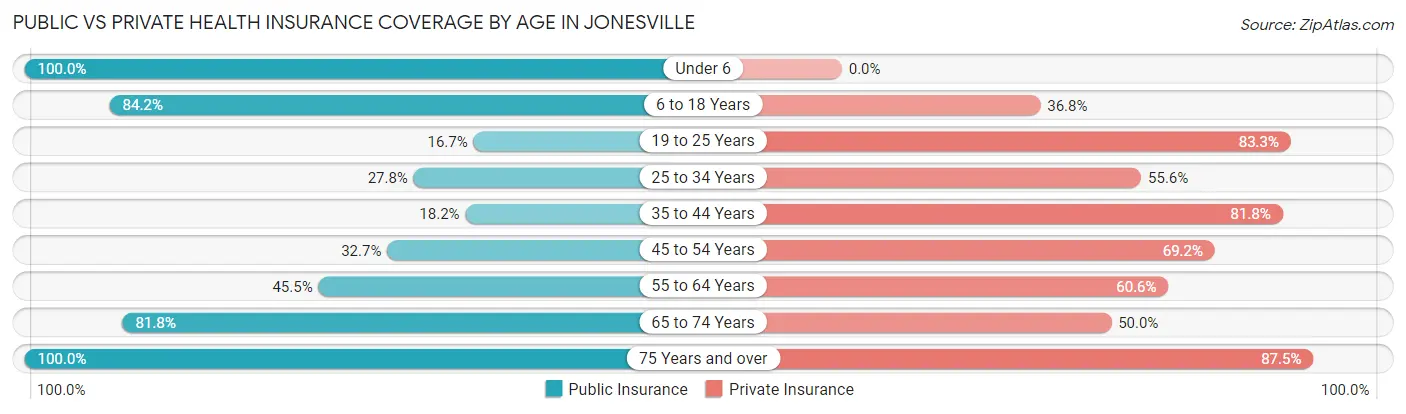
| Age Bracket | Public Insurance | Private Insurance |
| Under 6 | 13 (100.0%) | 0 (0.0%) |
| 6 to 18 Years | 16 (84.2%) | 7 (36.8%) |
| 19 to 25 Years | 2 (16.7%) | 10 (83.3%) |
| 25 to 34 Years | 5 (27.8%) | 10 (55.6%) |
| 35 to 44 Years | 2 (18.2%) | 9 (81.8%) |
| 45 to 54 Years | 17 (32.7%) | 36 (69.2%) |
| 55 to 64 Years | 15 (45.5%) | 20 (60.6%) |
| 65 to 74 Years | 18 (81.8%) | 11 (50.0%) |
| 75 Years and over | 16 (100.0%) | 14 (87.5%) |
| Total | 104 (53.1%) | 117 (59.7%) |
Disability Status by Sex by Age in Jonesville
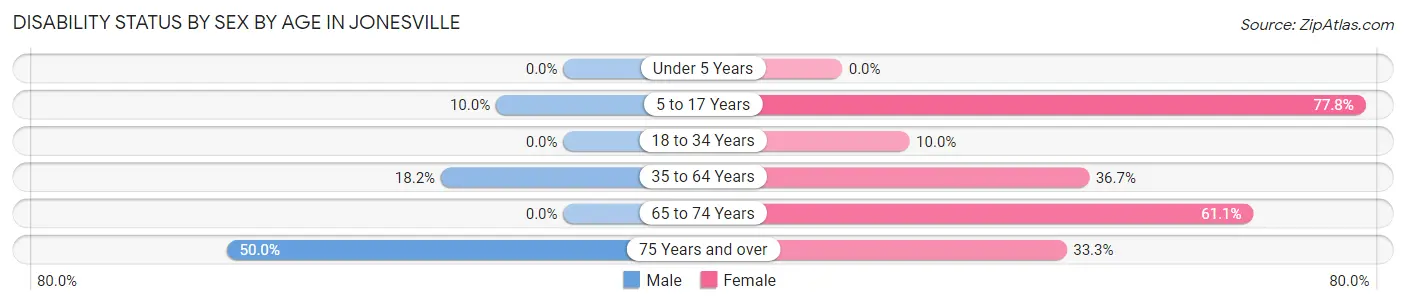
| Age Bracket | Male | Female |
| Under 5 Years | 0 (0.0%) | 0 (0.0%) |
| 5 to 17 Years | 1 (10.0%) | 7 (77.8%) |
| 18 to 34 Years | 0 (0.0%) | 2 (10.0%) |
| 35 to 64 Years | 12 (18.2%) | 11 (36.7%) |
| 65 to 74 Years | 0 (0.0%) | 11 (61.1%) |
| 75 Years and over | 2 (50.0%) | 4 (33.3%) |
Disability Class by Sex by Age in Jonesville
Disability Class: Hearing Difficulty
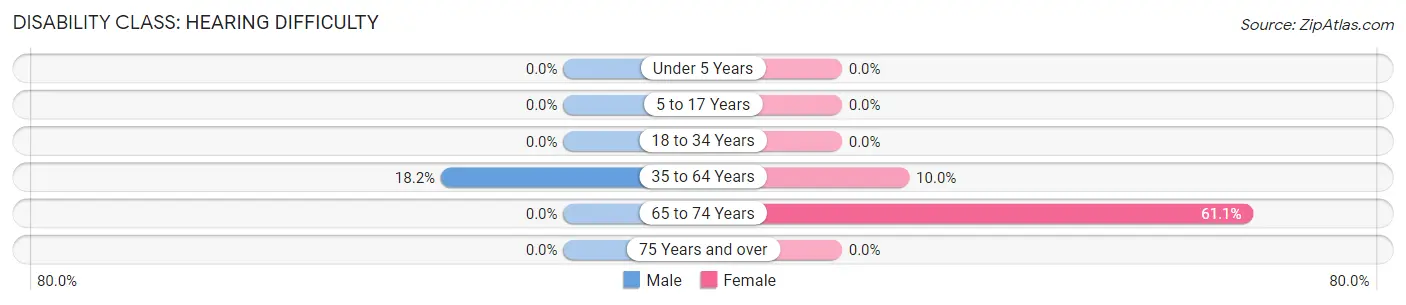
| Age Bracket | Male | Female |
| Under 5 Years | 0 (0.0%) | 0 (0.0%) |
| 5 to 17 Years | 0 (0.0%) | 0 (0.0%) |
| 18 to 34 Years | 0 (0.0%) | 0 (0.0%) |
| 35 to 64 Years | 12 (18.2%) | 3 (10.0%) |
| 65 to 74 Years | 0 (0.0%) | 11 (61.1%) |
| 75 Years and over | 0 (0.0%) | 0 (0.0%) |
Disability Class: Vision Difficulty
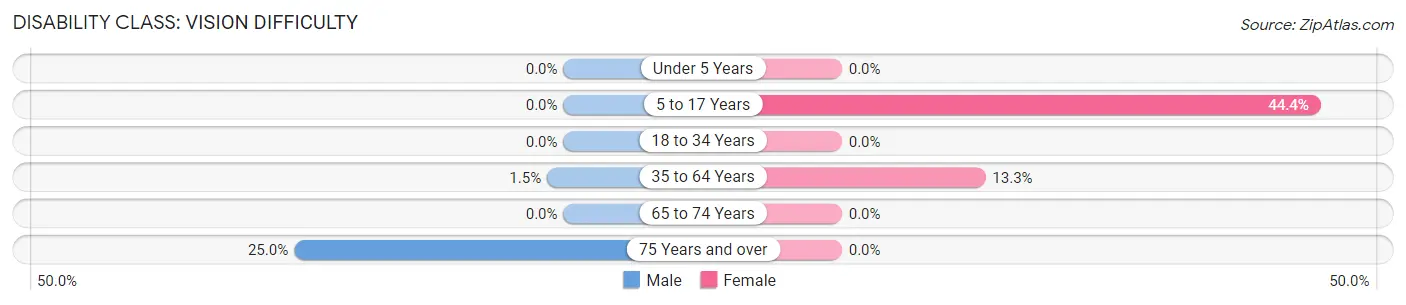
| Age Bracket | Male | Female |
| Under 5 Years | 0 (0.0%) | 0 (0.0%) |
| 5 to 17 Years | 0 (0.0%) | 4 (44.4%) |
| 18 to 34 Years | 0 (0.0%) | 0 (0.0%) |
| 35 to 64 Years | 1 (1.5%) | 4 (13.3%) |
| 65 to 74 Years | 0 (0.0%) | 0 (0.0%) |
| 75 Years and over | 1 (25.0%) | 0 (0.0%) |
Disability Class: Cognitive Difficulty
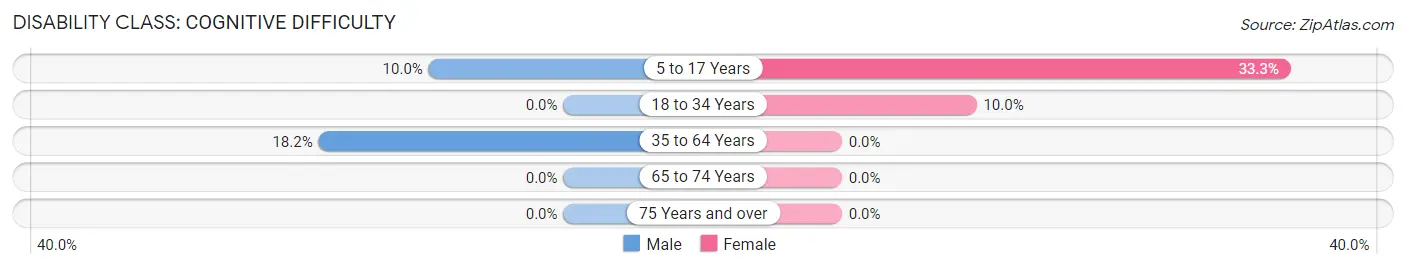
| Age Bracket | Male | Female |
| 5 to 17 Years | 1 (10.0%) | 3 (33.3%) |
| 18 to 34 Years | 0 (0.0%) | 2 (10.0%) |
| 35 to 64 Years | 12 (18.2%) | 0 (0.0%) |
| 65 to 74 Years | 0 (0.0%) | 0 (0.0%) |
| 75 Years and over | 0 (0.0%) | 0 (0.0%) |
Disability Class: Ambulatory Difficulty
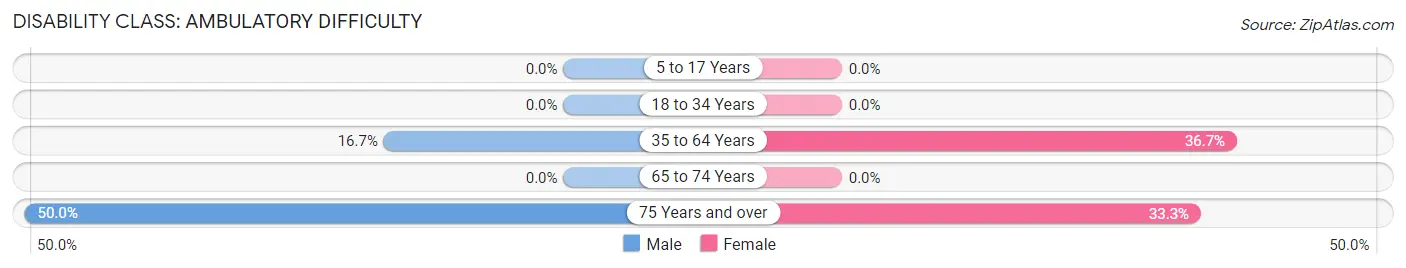
| Age Bracket | Male | Female |
| 5 to 17 Years | 0 (0.0%) | 0 (0.0%) |
| 18 to 34 Years | 0 (0.0%) | 0 (0.0%) |
| 35 to 64 Years | 11 (16.7%) | 11 (36.7%) |
| 65 to 74 Years | 0 (0.0%) | 0 (0.0%) |
| 75 Years and over | 2 (50.0%) | 4 (33.3%) |
Disability Class: Self-Care Difficulty
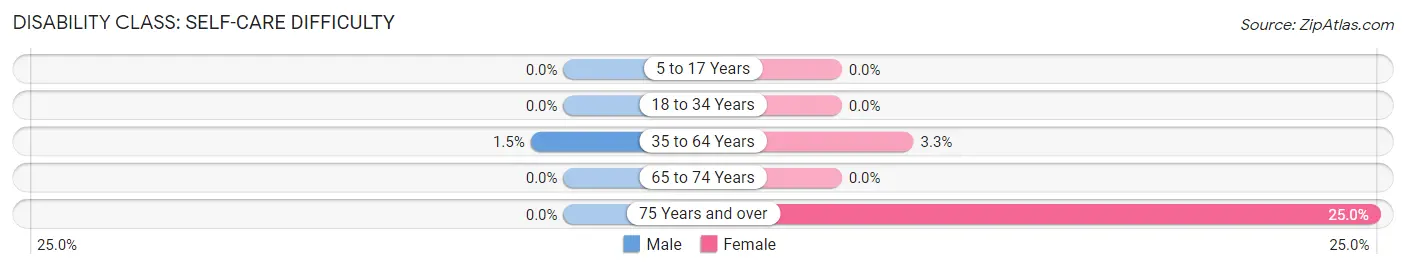
| Age Bracket | Male | Female |
| 5 to 17 Years | 0 (0.0%) | 0 (0.0%) |
| 18 to 34 Years | 0 (0.0%) | 0 (0.0%) |
| 35 to 64 Years | 1 (1.5%) | 1 (3.3%) |
| 65 to 74 Years | 0 (0.0%) | 0 (0.0%) |
| 75 Years and over | 0 (0.0%) | 3 (25.0%) |
Technology Access in Jonesville
Computing Device Access in Jonesville
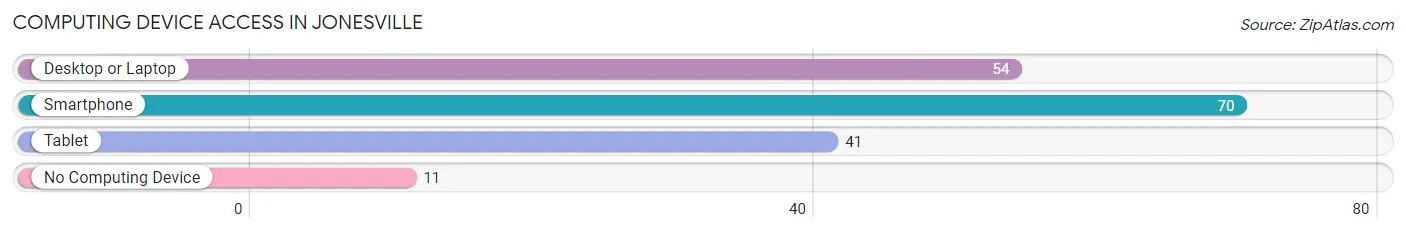
| Device Type | # Households | % Households |
| Desktop or Laptop | 54 | 61.4% |
| Smartphone | 70 | 79.5% |
| Tablet | 41 | 46.6% |
| No Computing Device | 11 | 12.5% |
| Total | 88 | 100.0% |
Internet Access in Jonesville
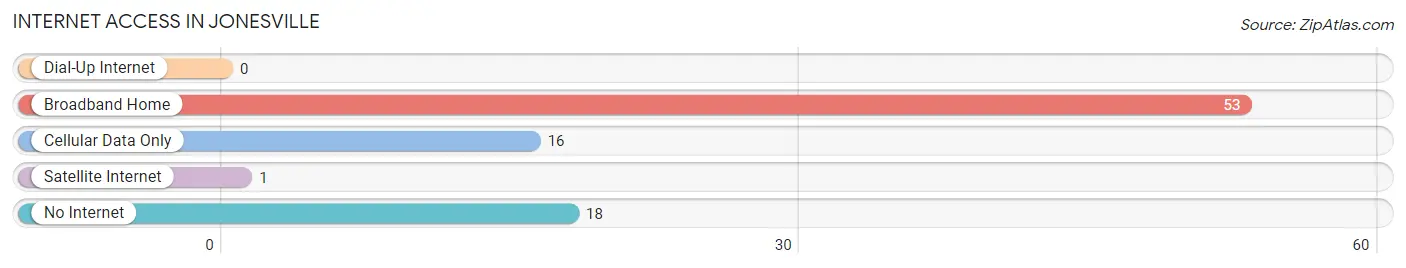
| Internet Type | # Households | % Households |
| Dial-Up Internet | 0 | 0.0% |
| Broadband Home | 53 | 60.2% |
| Cellular Data Only | 16 | 18.2% |
| Satellite Internet | 1 | 1.1% |
| No Internet | 18 | 20.4% |
| Total | 88 | 100.0% |
Jonesville Summary
Jonesville is a small town located in the state of Indiana, in the United States. It is situated in the southeastern part of the state, in the county of Bartholomew. The town has a population of around 1,000 people, and is part of the Columbus, Indiana metropolitan area.
History
Jonesville was founded in 1837 by William Jones, a settler from North Carolina. He purchased the land from the government and began to build a small settlement. The town was originally called Jonesville, after its founder, but was later changed to Jonesborough. The town was incorporated in 1845, and the name was changed back to Jonesville.
The town grew slowly over the years, and by the early 1900s, it had become a thriving agricultural community. The town was home to several businesses, including a general store, a blacksmith shop, and a sawmill. The town also had a post office, a bank, and a school.
In the late 1950s, the town began to experience a decline in population, as many of its residents moved away in search of better opportunities. The town was eventually annexed by the city of Columbus in 1967.
Geography
Jonesville is located in the southeastern part of Indiana, in the county of Bartholomew. The town is situated on the banks of the Flatrock River, and is surrounded by rolling hills and farmland. The town is located about 25 miles south of Indianapolis, and about 50 miles north of Louisville, Kentucky.
The climate in Jonesville is generally mild, with hot summers and cold winters. The average temperature in the summer is around 80 degrees Fahrenheit, and the average temperature in the winter is around 30 degrees Fahrenheit.
Economy
The economy of Jonesville is largely based on agriculture. The town is home to several farms, which produce a variety of crops, including corn, soybeans, and wheat. The town also has several small businesses, including a general store, a hardware store, and a restaurant.
The town is also home to several manufacturing companies, which produce a variety of products, including furniture, clothing, and automotive parts. The town is also home to several small businesses, including a gas station, a grocery store, and a pharmacy.
Demographics
As of the 2010 census, the population of Jonesville was 1,000 people. The racial makeup of the town was 97.2% White, 0.7% African American, 0.3% Native American, 0.2% Asian, and 1.6% from other races. The median household income in the town was $37,500, and the median family income was $45,000.
Conclusion
Jonesville is a small town located in the southeastern part of Indiana. The town has a population of around 1,000 people, and is part of the Columbus, Indiana metropolitan area. The town was founded in 1837 by William Jones, and has since grown into a thriving agricultural community. The town is home to several businesses, and is also home to several manufacturing companies. The town has a population that is mostly White, with a small percentage of African American, Native American, and Asian residents. The median household income in the town is $37,500, and the median family income is $45,000.
Common Questions
What is Per Capita Income in Jonesville?
Per Capita income in Jonesville is $31,158.
What is the Median Family Income in Jonesville?
Median Family Income in Jonesville is $75,000.
What is the Median Household income in Jonesville?
Median Household Income in Jonesville is $48,750.
What is Income or Wage Gap in Jonesville?
Income or Wage Gap in Jonesville is 26.4%.
Women in Jonesville earn 73.6 cents for every dollar earned by a man.
What is Inequality or Gini Index in Jonesville?
Inequality or Gini Index in Jonesville is 0.40.
What is the Total Population of Jonesville?
Total Population of Jonesville is 196.
What is the Total Male Population of Jonesville?
Total Male Population of Jonesville is 102.
What is the Total Female Population of Jonesville?
Total Female Population of Jonesville is 94.
What is the Ratio of Males per 100 Females in Jonesville?
There are 108.51 Males per 100 Females in Jonesville.
What is the Ratio of Females per 100 Males in Jonesville?
There are 92.16 Females per 100 Males in Jonesville.
What is the Median Population Age in Jonesville?
Median Population Age in Jonesville is 50.3 Years.
What is the Average Family Size in Jonesville
Average Family Size in Jonesville is 2.7 People.
What is the Average Household Size in Jonesville
Average Household Size in Jonesville is 2.2 People.
How Large is the Labor Force in Jonesville?
There are 98 People in the Labor Forcein in Jonesville.
What is the Percentage of People in the Labor Force in Jonesville?
58.3% of People are in the Labor Force in Jonesville.