Markleville, IN Map & Demographics
Markleville Map
Markleville Overview
$25,890
PER CAPITA INCOME
$82,321
AVG FAMILY INCOME
$74,167
AVG HOUSEHOLD INCOME
34.7%
WAGE / INCOME GAP [ % ]
65.3¢/ $1
WAGE / INCOME GAP [ $ ]
$13,979
FAMILY INCOME DEFICIT
0.33
INEQUALITY / GINI INDEX
611
TOTAL POPULATION
294
MALE POPULATION
317
FEMALE POPULATION
92.74
MALES / 100 FEMALES
107.82
FEMALES / 100 MALES
33.6
MEDIAN AGE
3.1
AVG FAMILY SIZE
2.9
AVG HOUSEHOLD SIZE
335
LABOR FORCE [ PEOPLE ]
75.3%
PERCENT IN LABOR FORCE
6.6%
UNEMPLOYMENT RATE
Markleville Zip Codes
Markleville Area Codes
Income in Markleville
Income Overview in Markleville
Per Capita Income in Markleville is $25,890, while median incomes of families and households are $82,321 and $74,167 respectively.
| Characteristic | Number | Measure |
| Per Capita Income | 611 | $25,890 |
| Median Family Income | 175 | $82,321 |
| Mean Family Income | 175 | $84,708 |
| Median Household Income | 214 | $74,167 |
| Mean Household Income | 214 | $76,992 |
| Income Deficit | 175 | $13,979 |
| Wage / Income Gap (%) | 611 | 34.66% |
| Wage / Income Gap ($) | 611 | 65.34¢ per $1 |
| Gini / Inequality Index | 611 | 0.33 |
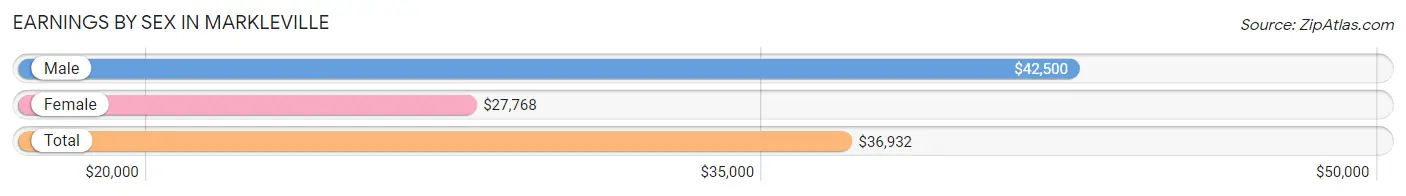
Earnings by Sex in Markleville
Average Earnings in Markleville are $36,932, $42,500 for men and $27,768 for women, a difference of 34.7%.
| Sex | Number | Average Earnings |
| Male | 174 (52.9%) | $42,500 |
| Female | 155 (47.1%) | $27,768 |
| Total | 329 (100.0%) | $36,932 |
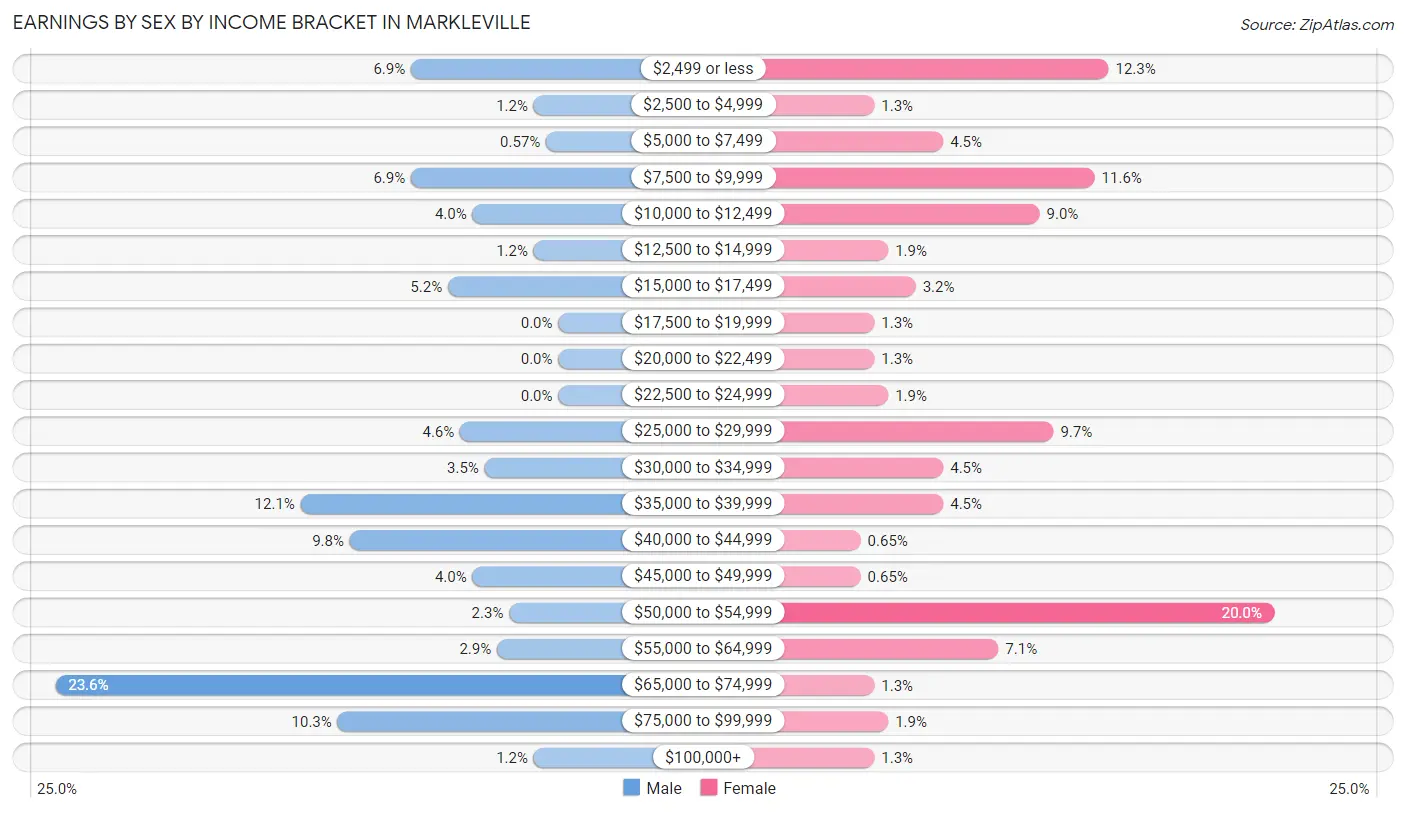
Earnings by Sex by Income Bracket in Markleville
The most common earnings brackets in Markleville are $65,000 to $74,999 for men (41 | 23.6%) and $50,000 to $54,999 for women (31 | 20.0%).
| Income | Male | Female |
| $2,499 or less | 12 (6.9%) | 19 (12.3%) |
| $2,500 to $4,999 | 2 (1.1%) | 2 (1.3%) |
| $5,000 to $7,499 | 1 (0.6%) | 7 (4.5%) |
| $7,500 to $9,999 | 12 (6.9%) | 18 (11.6%) |
| $10,000 to $12,499 | 7 (4.0%) | 14 (9.0%) |
| $12,500 to $14,999 | 2 (1.1%) | 3 (1.9%) |
| $15,000 to $17,499 | 9 (5.2%) | 5 (3.2%) |
| $17,500 to $19,999 | 0 (0.0%) | 2 (1.3%) |
| $20,000 to $22,499 | 0 (0.0%) | 2 (1.3%) |
| $22,500 to $24,999 | 0 (0.0%) | 3 (1.9%) |
| $25,000 to $29,999 | 8 (4.6%) | 15 (9.7%) |
| $30,000 to $34,999 | 6 (3.5%) | 7 (4.5%) |
| $35,000 to $39,999 | 21 (12.1%) | 7 (4.5%) |
| $40,000 to $44,999 | 17 (9.8%) | 1 (0.6%) |
| $45,000 to $49,999 | 7 (4.0%) | 1 (0.6%) |
| $50,000 to $54,999 | 4 (2.3%) | 31 (20.0%) |
| $55,000 to $64,999 | 5 (2.9%) | 11 (7.1%) |
| $65,000 to $74,999 | 41 (23.6%) | 2 (1.3%) |
| $75,000 to $99,999 | 18 (10.3%) | 3 (1.9%) |
| $100,000+ | 2 (1.1%) | 2 (1.3%) |
| Total | 174 (100.0%) | 155 (100.0%) |
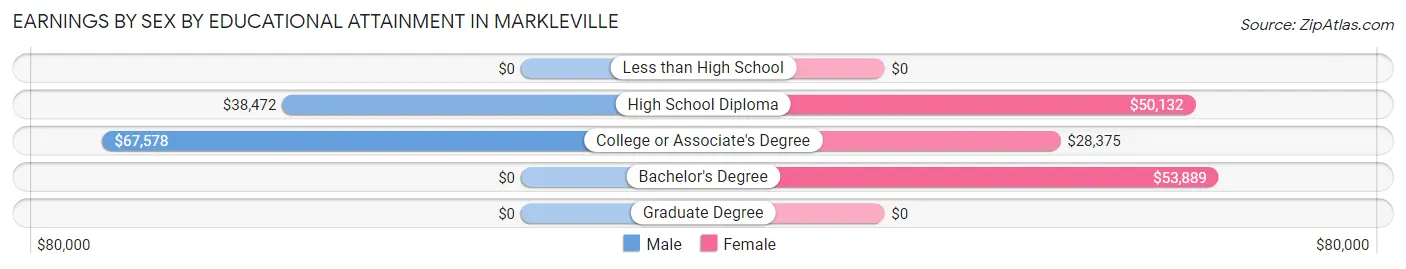
Earnings by Sex by Educational Attainment in Markleville
Average earnings in Markleville are $45,208 for men and $37,500 for women, a difference of 17.1%. Men with an educational attainment of college or associate's degree enjoy the highest average annual earnings of $67,578, while those with high school diploma education earn the least with $38,472. Women with an educational attainment of bachelor's degree earn the most with the average annual earnings of $53,889, while those with college or associate's degree education have the smallest earnings of $28,375.
| Educational Attainment | Male Income | Female Income |
| Less than High School | - | - |
| High School Diploma | $38,472 | $50,132 |
| College or Associate's Degree | $67,578 | $28,375 |
| Bachelor's Degree | - | - |
| Graduate Degree | - | - |
| Total | $45,208 | $37,500 |
Family Income in Markleville
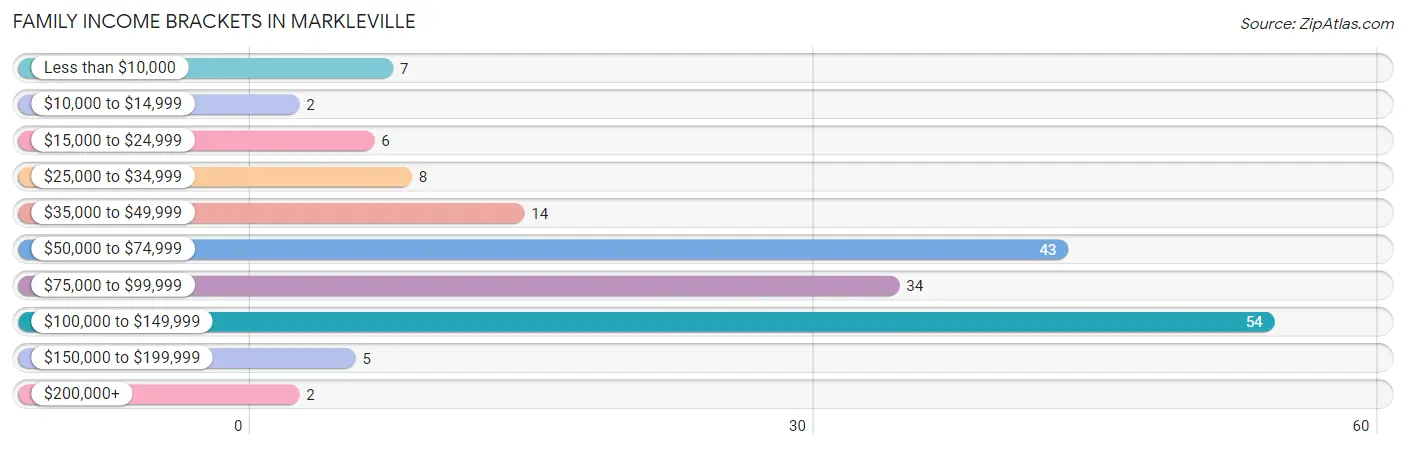
Family Income Brackets in Markleville
According to the Markleville family income data, there are 54 families falling into the $100,000 to $149,999 income range, which is the most common income bracket and makes up 30.9% of all families. Conversely, the $10,000 to $14,999 income bracket is the least frequent group with only 2 families (1.1%) belonging to this category.
| Income Bracket | # Families | % Families |
| Less than $10,000 | 7 | 4.0% |
| $10,000 to $14,999 | 2 | 1.1% |
| $15,000 to $24,999 | 6 | 3.4% |
| $25,000 to $34,999 | 8 | 4.6% |
| $35,000 to $49,999 | 14 | 8.0% |
| $50,000 to $74,999 | 43 | 24.6% |
| $75,000 to $99,999 | 34 | 19.4% |
| $100,000 to $149,999 | 54 | 30.9% |
| $150,000 to $199,999 | 5 | 2.9% |
| $200,000+ | 2 | 1.1% |
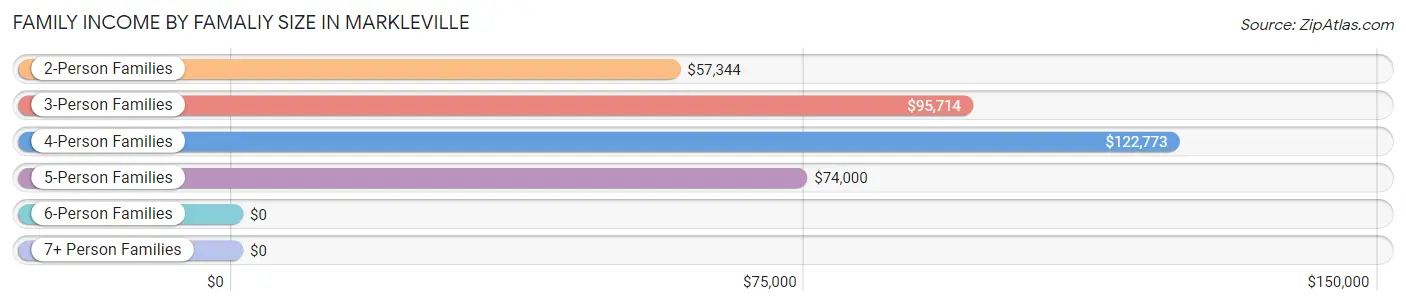
Family Income by Famaliy Size in Markleville
4-person families (57 | 32.6%) account for the highest median family income in Markleville with $122,773 per family, while 3-person families (18 | 10.3%) have the highest median income of $31,905 per family member.
| Income Bracket | # Families | Median Income |
| 2-Person Families | 77 (44.0%) | $57,344 |
| 3-Person Families | 18 (10.3%) | $95,714 |
| 4-Person Families | 57 (32.6%) | $122,773 |
| 5-Person Families | 20 (11.4%) | $74,000 |
| 6-Person Families | 0 (0.0%) | $0 |
| 7+ Person Families | 3 (1.7%) | $0 |
| Total | 175 (100.0%) | $82,321 |
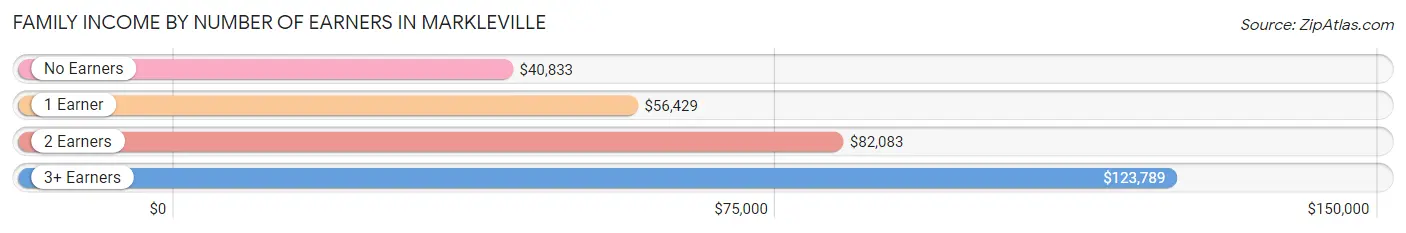
Family Income by Number of Earners in Markleville
The median family income in Markleville is $82,321, with families comprising 3+ earners (43) having the highest median family income of $123,789, while families with no earners (14) have the lowest median family income of $40,833, accounting for 24.6% and 8.0% of families, respectively.
| Number of Earners | # Families | Median Income |
| No Earners | 14 (8.0%) | $40,833 |
| 1 Earner | 64 (36.6%) | $56,429 |
| 2 Earners | 54 (30.9%) | $82,083 |
| 3+ Earners | 43 (24.6%) | $123,789 |
| Total | 175 (100.0%) | $82,321 |
Household Income in Markleville
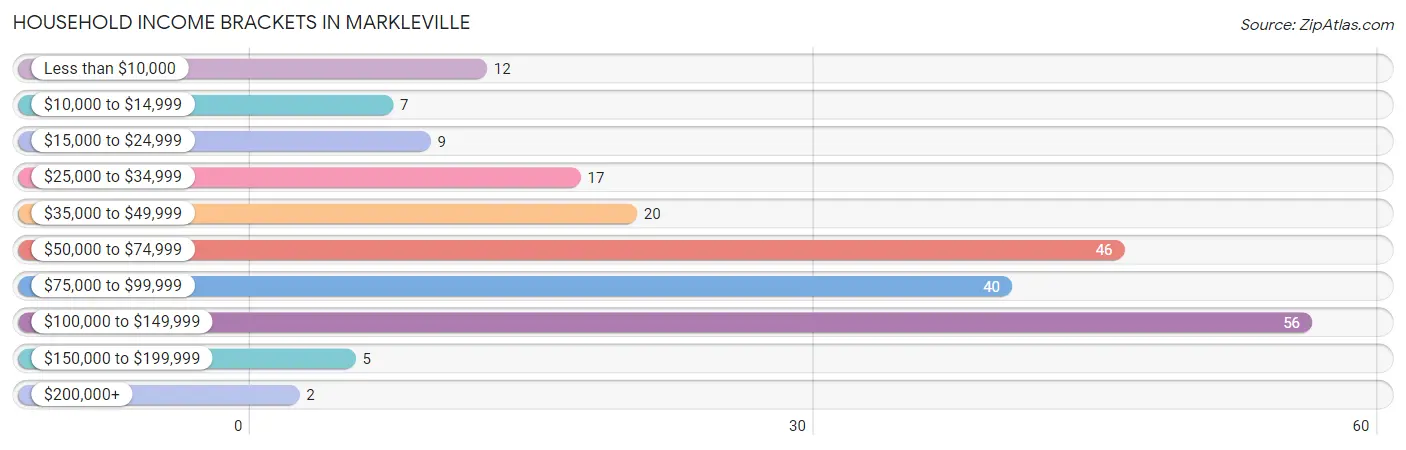
Household Income Brackets in Markleville
With 56 households falling in the category, the $100,000 to $149,999 income range is the most frequent in Markleville, accounting for 26.2% of all households. In contrast, only 2 households (0.9%) fall into the $200,000+ income bracket, making it the least populous group.
| Income Bracket | # Households | % Households |
| Less than $10,000 | 12 | 5.6% |
| $10,000 to $14,999 | 7 | 3.3% |
| $15,000 to $24,999 | 9 | 4.2% |
| $25,000 to $34,999 | 17 | 7.9% |
| $35,000 to $49,999 | 20 | 9.3% |
| $50,000 to $74,999 | 46 | 21.5% |
| $75,000 to $99,999 | 40 | 18.7% |
| $100,000 to $149,999 | 56 | 26.2% |
| $150,000 to $199,999 | 5 | 2.3% |
| $200,000+ | 2 | 0.9% |
Household Income by Householder Age in Markleville
The median household income in Markleville is $74,167, with the highest median household income of $98,906 found in the 45 to 64 years age bracket for the primary householder. A total of 83 households (38.8%) fall into this category. Meanwhile, the 15 to 24 years age bracket for the primary householder has the lowest median household income of $0, with 3 households (1.4%) in this group.
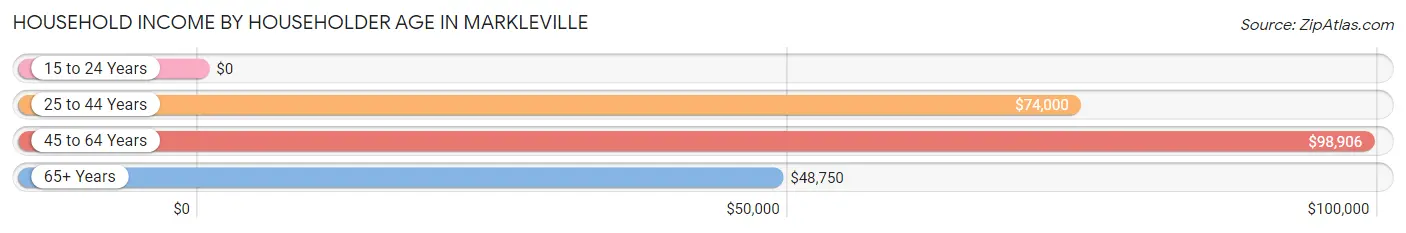
| Income Bracket | # Households | Median Income |
| 15 to 24 Years | 3 (1.4%) | $0 |
| 25 to 44 Years | 78 (36.4%) | $74,000 |
| 45 to 64 Years | 83 (38.8%) | $98,906 |
| 65+ Years | 50 (23.4%) | $48,750 |
| Total | 214 (100.0%) | $74,167 |
Poverty in Markleville
Income Below Poverty by Sex and Age in Markleville
With 10.9% poverty level for males and 12.9% for females among the residents of Markleville, 6 to 11 year old males and 12 to 14 year old females are the most vulnerable to poverty, with 7 males (41.2%) and 2 females (66.7%) in their respective age groups living below the poverty level.
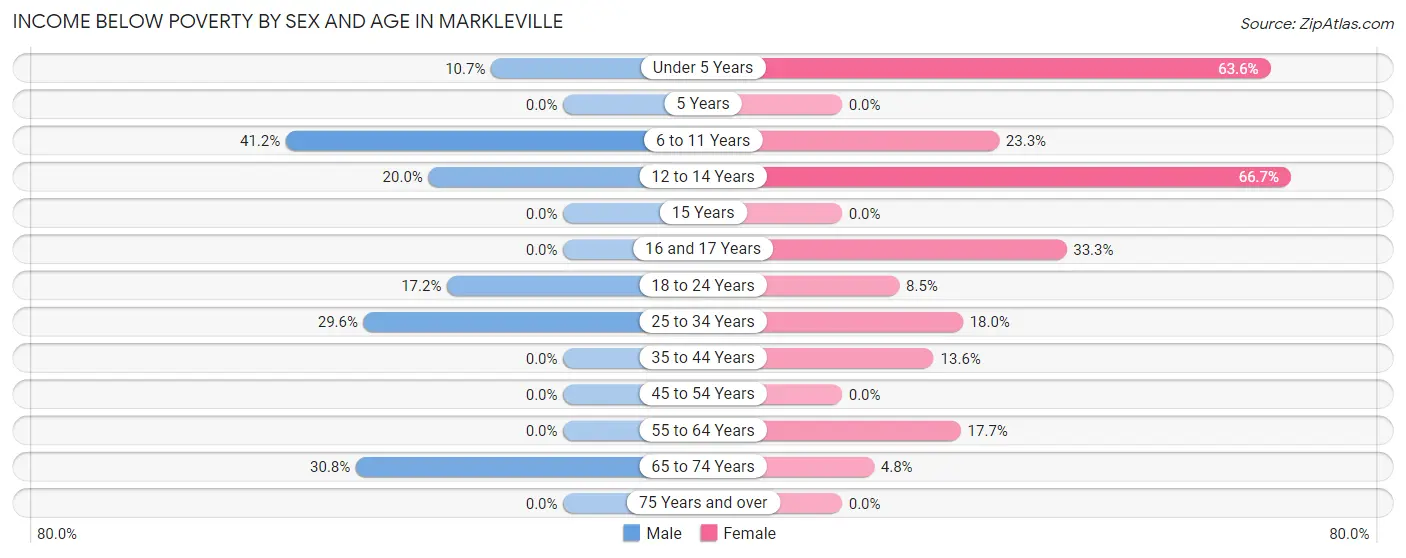
| Age Bracket | Male | Female |
| Under 5 Years | 3 (10.7%) | 7 (63.6%) |
| 5 Years | 0 (0.0%) | 0 (0.0%) |
| 6 to 11 Years | 7 (41.2%) | 7 (23.3%) |
| 12 to 14 Years | 1 (20.0%) | 2 (66.7%) |
| 15 Years | 0 (0.0%) | 0 (0.0%) |
| 16 and 17 Years | 0 (0.0%) | 2 (33.3%) |
| 18 to 24 Years | 5 (17.2%) | 4 (8.5%) |
| 25 to 34 Years | 8 (29.6%) | 7 (17.9%) |
| 35 to 44 Years | 0 (0.0%) | 3 (13.6%) |
| 45 to 54 Years | 0 (0.0%) | 0 (0.0%) |
| 55 to 64 Years | 0 (0.0%) | 6 (17.6%) |
| 65 to 74 Years | 8 (30.8%) | 1 (4.8%) |
| 75 Years and over | 0 (0.0%) | 0 (0.0%) |
| Total | 32 (10.9%) | 39 (12.9%) |
Income Above Poverty by Sex and Age in Markleville
According to the poverty statistics in Markleville, males aged 5 years and females aged 5 years are the age groups that are most secure financially, with 100.0% of males and 100.0% of females in these age groups living above the poverty line.
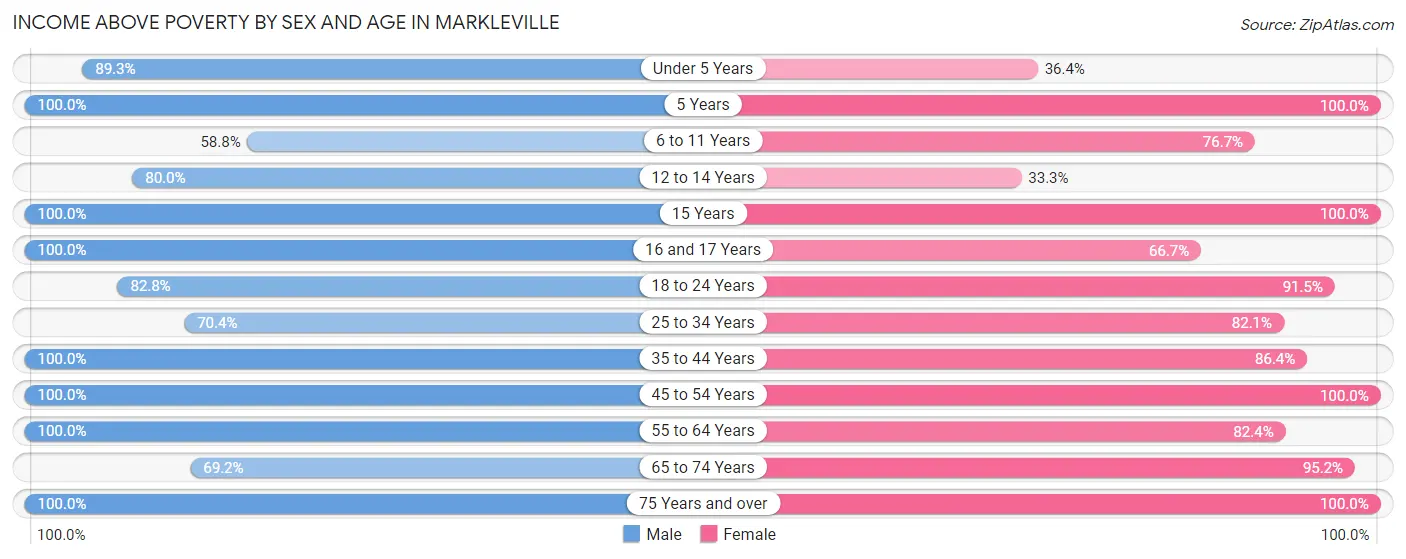
| Age Bracket | Male | Female |
| Under 5 Years | 25 (89.3%) | 4 (36.4%) |
| 5 Years | 11 (100.0%) | 4 (100.0%) |
| 6 to 11 Years | 10 (58.8%) | 23 (76.7%) |
| 12 to 14 Years | 4 (80.0%) | 1 (33.3%) |
| 15 Years | 9 (100.0%) | 34 (100.0%) |
| 16 and 17 Years | 5 (100.0%) | 4 (66.7%) |
| 18 to 24 Years | 24 (82.8%) | 43 (91.5%) |
| 25 to 34 Years | 19 (70.4%) | 32 (82.1%) |
| 35 to 44 Years | 37 (100.0%) | 19 (86.4%) |
| 45 to 54 Years | 66 (100.0%) | 29 (100.0%) |
| 55 to 64 Years | 18 (100.0%) | 28 (82.4%) |
| 65 to 74 Years | 18 (69.2%) | 20 (95.2%) |
| 75 Years and over | 16 (100.0%) | 23 (100.0%) |
| Total | 262 (89.1%) | 264 (87.1%) |
Income Below Poverty Among Married-Couple Families in Markleville
The poverty statistics for married-couple families in Markleville show that 6.9% or 9 of the total 130 families live below the poverty line. Families with 3 or 4 children have the highest poverty rate of 23.5%, comprising of 4 families. On the other hand, families with no children have the lowest poverty rate of 3.5%, which includes 2 families.
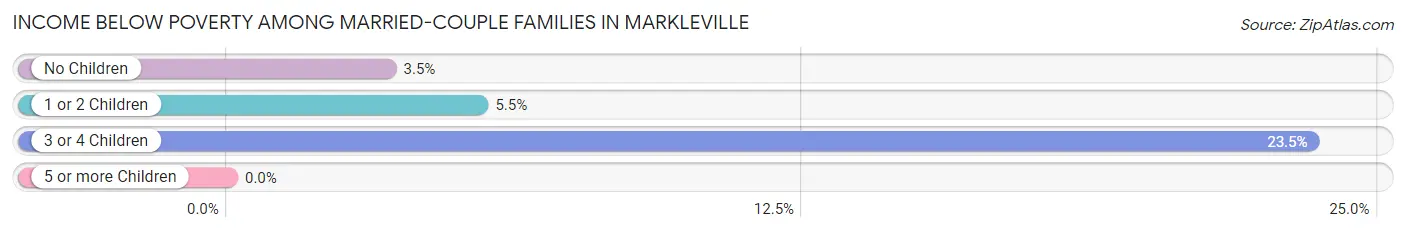
| Children | Above Poverty | Below Poverty |
| No Children | 56 (96.6%) | 2 (3.5%) |
| 1 or 2 Children | 52 (94.6%) | 3 (5.4%) |
| 3 or 4 Children | 13 (76.5%) | 4 (23.5%) |
| 5 or more Children | 0 (0.0%) | 0 (0.0%) |
| Total | 121 (93.1%) | 9 (6.9%) |
Income Below Poverty Among Single-Parent Households in Markleville
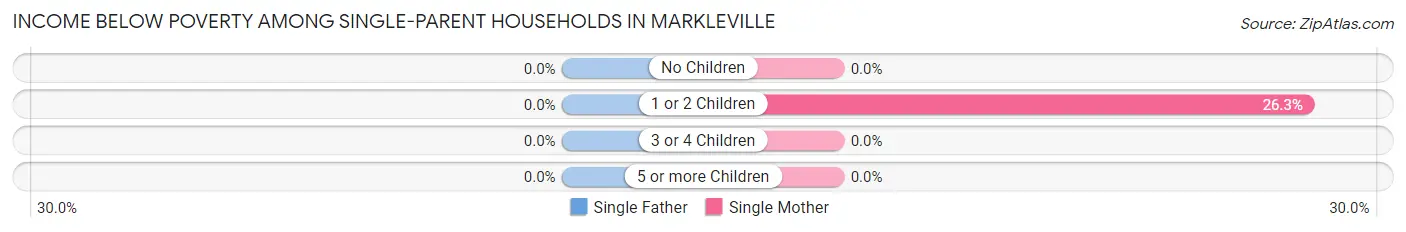
| Children | Single Father | Single Mother |
| No Children | 0 (0.0%) | 0 (0.0%) |
| 1 or 2 Children | 0 (0.0%) | 5 (26.3%) |
| 3 or 4 Children | 0 (0.0%) | 0 (0.0%) |
| 5 or more Children | 0 (0.0%) | 0 (0.0%) |
| Total | 0 (0.0%) | 5 (20.0%) |
Income Below Poverty Among Married-Couple vs Single-Parent Households in Markleville
The poverty data for Markleville shows that 9 of the married-couple family households (6.9%) and 5 of the single-parent households (11.1%) are living below the poverty level. Within the married-couple family households, those with 3 or 4 children have the highest poverty rate, with 4 households (23.5%) falling below the poverty line. Among the single-parent households, those with 1 or 2 children have the highest poverty rate, with 5 household (16.7%) living below poverty.
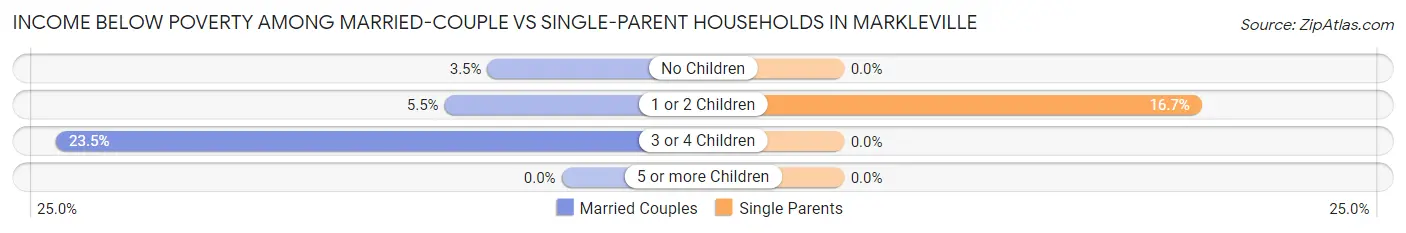
| Children | Married-Couple Families | Single-Parent Households |
| No Children | 2 (3.5%) | 0 (0.0%) |
| 1 or 2 Children | 3 (5.4%) | 5 (16.7%) |
| 3 or 4 Children | 4 (23.5%) | 0 (0.0%) |
| 5 or more Children | 0 (0.0%) | 0 (0.0%) |
| Total | 9 (6.9%) | 5 (11.1%) |
Race in Markleville
The most populous races in Markleville are White / Caucasian (581 | 95.1%), Hispanic or Latino (30 | 4.9%), and Two or more Races (18 | 2.9%).
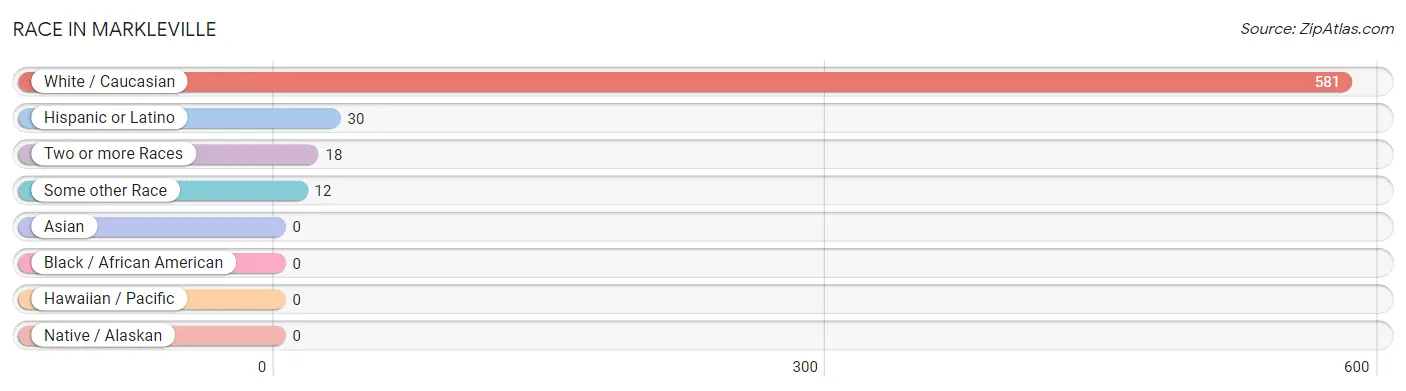
| Race | # Population | % Population |
| Asian | 0 | 0.0% |
| Black / African American | 0 | 0.0% |
| Hawaiian / Pacific | 0 | 0.0% |
| Hispanic or Latino | 30 | 4.9% |
| Native / Alaskan | 0 | 0.0% |
| White / Caucasian | 581 | 95.1% |
| Two or more Races | 18 | 2.9% |
| Some other Race | 12 | 2.0% |
| Total | 611 | 100.0% |
Ancestry in Markleville
The most populous ancestries reported in Markleville are English (143 | 23.4%), Irish (133 | 21.8%), German (87 | 14.2%), American (35 | 5.7%), and Italian (25 | 4.1%), together accounting for 69.2% of all Markleville residents.
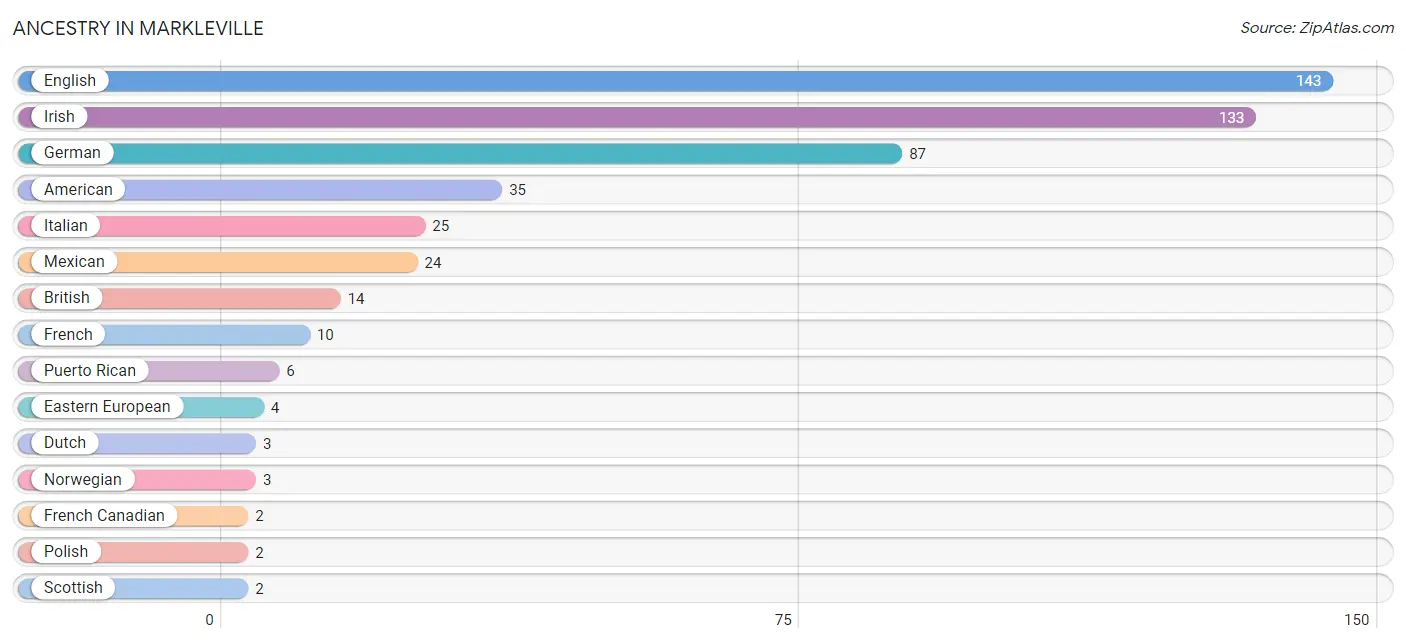
| Ancestry | # Population | % Population |
| American | 35 | 5.7% |
| British | 14 | 2.3% |
| Dutch | 3 | 0.5% |
| Eastern European | 4 | 0.6% |
| English | 143 | 23.4% |
| Finnish | 1 | 0.2% |
| French | 10 | 1.6% |
| French Canadian | 2 | 0.3% |
| German | 87 | 14.2% |
| Irish | 133 | 21.8% |
| Italian | 25 | 4.1% |
| Mexican | 24 | 3.9% |
| Norwegian | 3 | 0.5% |
| Polish | 2 | 0.3% |
| Puerto Rican | 6 | 1.0% |
| Scotch-Irish | 1 | 0.2% |
| Scottish | 2 | 0.3% |
| Swedish | 1 | 0.2% | View All 18 Rows |
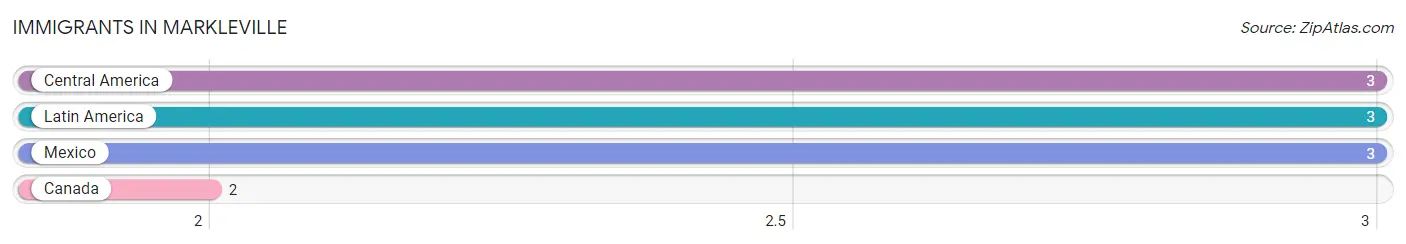
Immigrants in Markleville
The most numerous immigrant groups reported in Markleville came from Central America (3 | 0.5%), Latin America (3 | 0.5%), Mexico (3 | 0.5%), and Canada (2 | 0.3%), together accounting for 1.8% of all Markleville residents.
| Immigration Origin | # Population | % Population |
| Canada | 2 | 0.3% |
| Central America | 3 | 0.5% |
| Latin America | 3 | 0.5% |
| Mexico | 3 | 0.5% | View All 4 Rows |
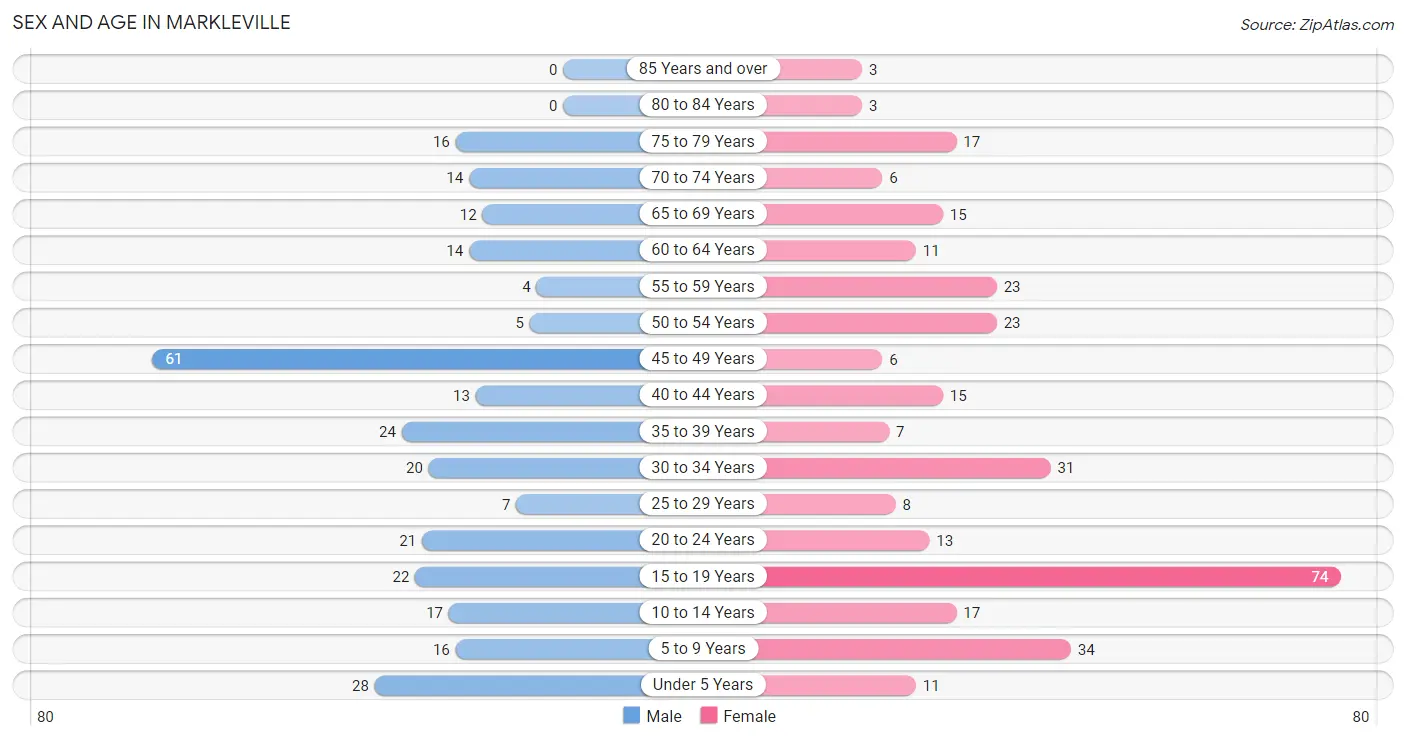
Sex and Age in Markleville
Sex and Age in Markleville
The most populous age groups in Markleville are 45 to 49 Years (61 | 20.7%) for men and 15 to 19 Years (74 | 23.3%) for women.
| Age Bracket | Male | Female |
| Under 5 Years | 28 (9.5%) | 11 (3.5%) |
| 5 to 9 Years | 16 (5.4%) | 34 (10.7%) |
| 10 to 14 Years | 17 (5.8%) | 17 (5.4%) |
| 15 to 19 Years | 22 (7.5%) | 74 (23.3%) |
| 20 to 24 Years | 21 (7.1%) | 13 (4.1%) |
| 25 to 29 Years | 7 (2.4%) | 8 (2.5%) |
| 30 to 34 Years | 20 (6.8%) | 31 (9.8%) |
| 35 to 39 Years | 24 (8.2%) | 7 (2.2%) |
| 40 to 44 Years | 13 (4.4%) | 15 (4.7%) |
| 45 to 49 Years | 61 (20.7%) | 6 (1.9%) |
| 50 to 54 Years | 5 (1.7%) | 23 (7.3%) |
| 55 to 59 Years | 4 (1.4%) | 23 (7.3%) |
| 60 to 64 Years | 14 (4.8%) | 11 (3.5%) |
| 65 to 69 Years | 12 (4.1%) | 15 (4.7%) |
| 70 to 74 Years | 14 (4.8%) | 6 (1.9%) |
| 75 to 79 Years | 16 (5.4%) | 17 (5.4%) |
| 80 to 84 Years | 0 (0.0%) | 3 (0.9%) |
| 85 Years and over | 0 (0.0%) | 3 (0.9%) |
| Total | 294 (100.0%) | 317 (100.0%) |
Families and Households in Markleville
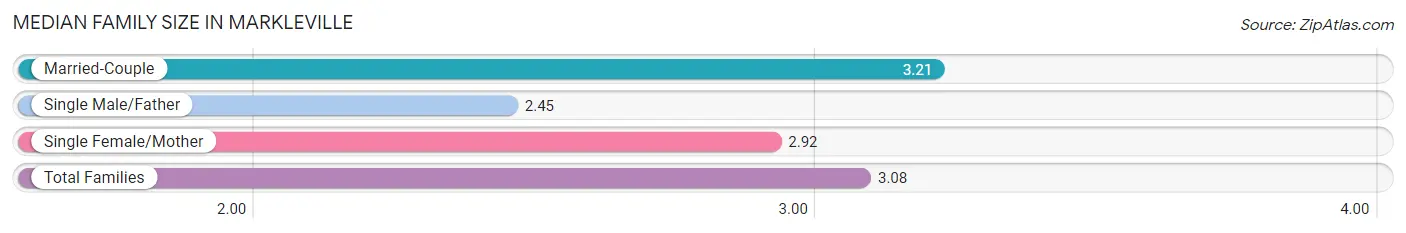
Median Family Size in Markleville
The median family size in Markleville is 3.08 persons per family, with married-couple families (130 | 74.3%) accounting for the largest median family size of 3.21 persons per family. On the other hand, single male/father families (20 | 11.4%) represent the smallest median family size with 2.45 persons per family.
| Family Type | # Families | Family Size |
| Married-Couple | 130 (74.3%) | 3.21 |
| Single Male/Father | 20 (11.4%) | 2.45 |
| Single Female/Mother | 25 (14.3%) | 2.92 |
| Total Families | 175 (100.0%) | 3.08 |
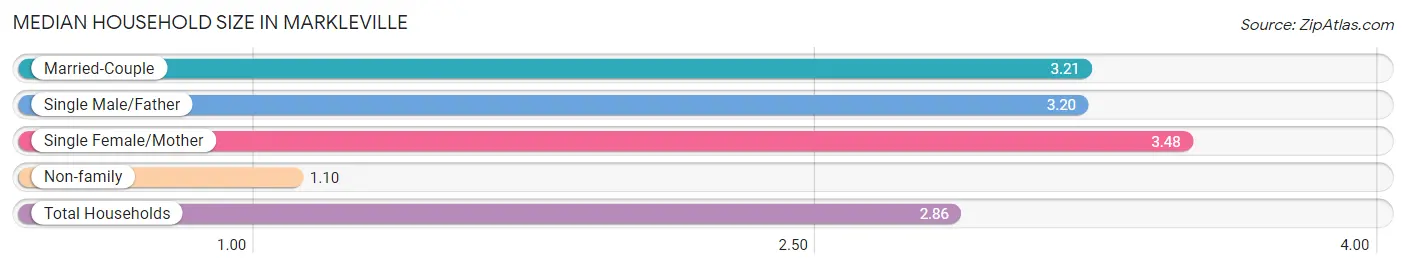
Median Household Size in Markleville
The median household size in Markleville is 2.86 persons per household, with single female/mother households (25 | 11.7%) accounting for the largest median household size of 3.48 persons per household. non-family households (39 | 18.2%) represent the smallest median household size with 1.10 persons per household.
| Household Type | # Households | Household Size |
| Married-Couple | 130 (60.8%) | 3.21 |
| Single Male/Father | 20 (9.3%) | 3.20 |
| Single Female/Mother | 25 (11.7%) | 3.48 |
| Non-family | 39 (18.2%) | 1.10 |
| Total Households | 214 (100.0%) | 2.86 |
Household Size by Marriage Status in Markleville
Out of a total of 214 households in Markleville, 175 (81.8%) are family households, while 39 (18.2%) are nonfamily households. The most numerous type of family households are 2-person households, comprising 64, and the most common type of nonfamily households are 1-person households, comprising 35.
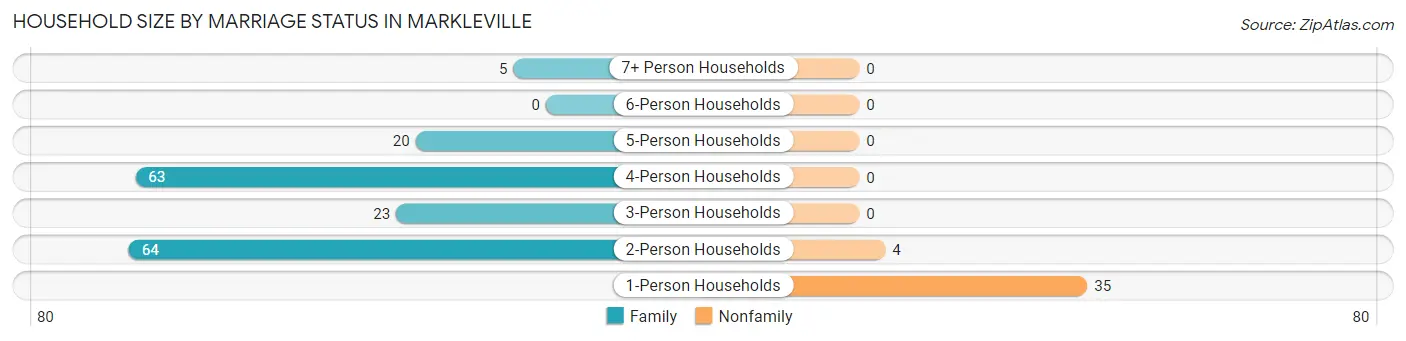
| Household Size | Family Households | Nonfamily Households |
| 1-Person Households | - | 35 (16.4%) |
| 2-Person Households | 64 (29.9%) | 4 (1.9%) |
| 3-Person Households | 23 (10.7%) | 0 (0.0%) |
| 4-Person Households | 63 (29.4%) | 0 (0.0%) |
| 5-Person Households | 20 (9.3%) | 0 (0.0%) |
| 6-Person Households | 0 (0.0%) | 0 (0.0%) |
| 7+ Person Households | 5 (2.3%) | 0 (0.0%) |
| Total | 175 (81.8%) | 39 (18.2%) |
Female Fertility in Markleville
Fertility by Age in Markleville
Average fertility rate in Markleville is 23.0 births per 1,000 women. Women in the age bracket of 35 to 50 years have the highest fertility rate with 43.0 births per 1,000 women. Women in the age bracket of 20 to 34 years acount for 50.0% of all women with births.
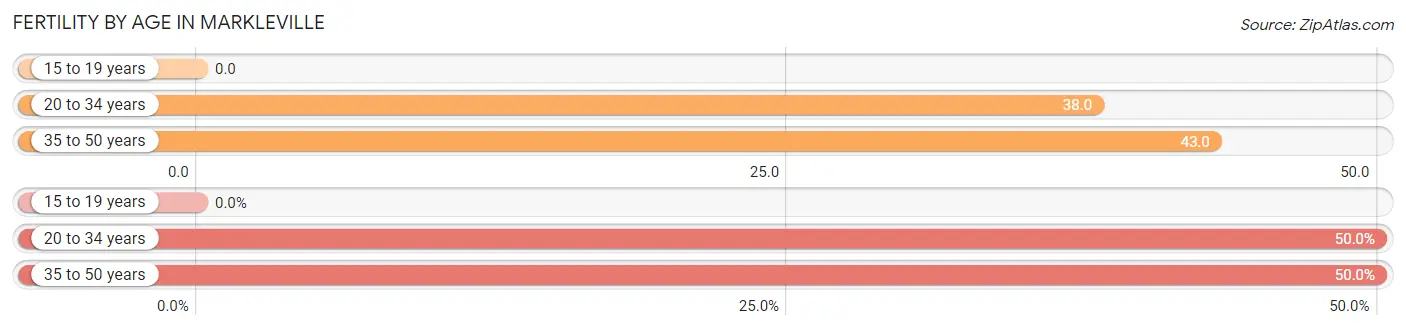
| Age Bracket | Women with Births | Births / 1,000 Women |
| 15 to 19 years | 0 (0.0%) | 0.0 |
| 20 to 34 years | 2 (50.0%) | 38.0 |
| 35 to 50 years | 2 (50.0%) | 43.0 |
| Total | 4 (100.0%) | 23.0 |
Fertility by Age by Marriage Status in Markleville
50.0% of women with births (4) in Markleville are married. The highest percentage of unmarried women with births falls into 20 to 34 years age bracket with 100.0% of them unmarried at the time of birth, while the lowest percentage of unmarried women with births belong to 35 to 50 years age bracket with 0.0% of them unmarried.
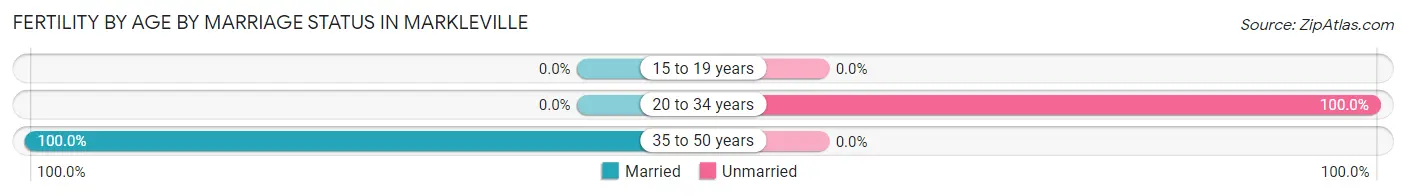
| Age Bracket | Married | Unmarried |
| 15 to 19 years | 0 (0.0%) | 0 (0.0%) |
| 20 to 34 years | 0 (0.0%) | 2 (100.0%) |
| 35 to 50 years | 2 (100.0%) | 0 (0.0%) |
| Total | 2 (50.0%) | 2 (50.0%) |
Fertility by Education in Markleville
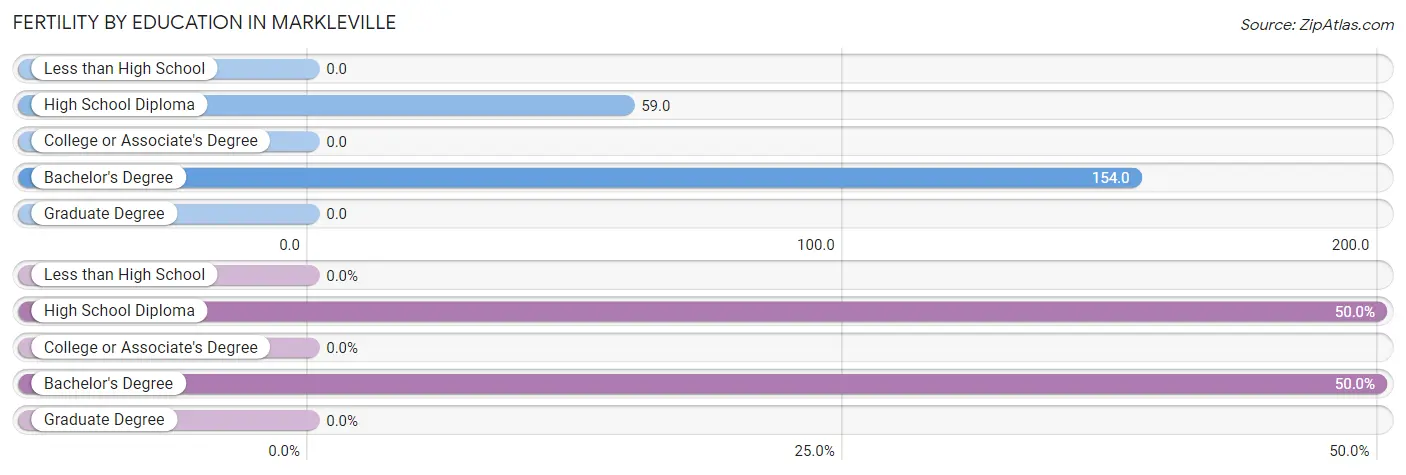
| Educational Attainment | Women with Births | Births / 1,000 Women |
| Less than High School | 0 (0.0%) | 0.0 |
| High School Diploma | 2 (50.0%) | 59.0 |
| College or Associate's Degree | 0 (0.0%) | 0.0 |
| Bachelor's Degree | 2 (50.0%) | 154.0 |
| Graduate Degree | 0 (0.0%) | 0.0 |
| Total | 4 (100.0%) | 23.0 |
Fertility by Education by Marriage Status in Markleville
50.0% of women with births in Markleville are unmarried. Women with the educational attainment of bachelor's degree are most likely to be married with 100.0% of them married at childbirth, while women with the educational attainment of high school diploma are least likely to be married with 100.0% of them unmarried at childbirth.
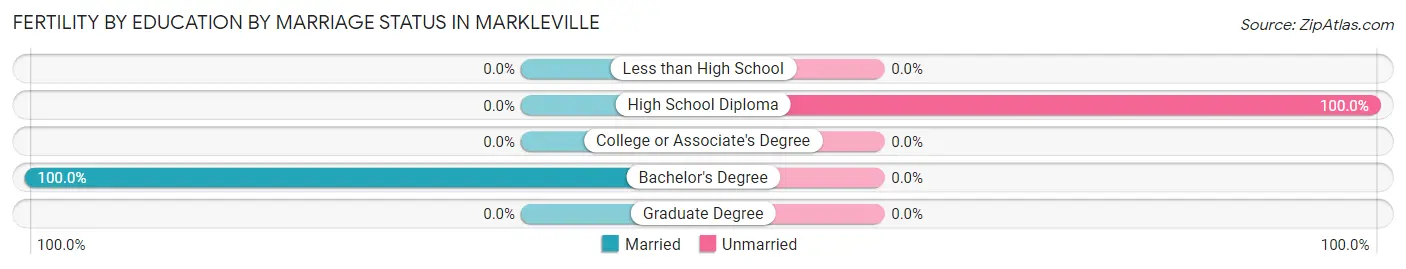
| Educational Attainment | Married | Unmarried |
| Less than High School | 0 (0.0%) | 0 (0.0%) |
| High School Diploma | 0 (0.0%) | 2 (100.0%) |
| College or Associate's Degree | 0 (0.0%) | 0 (0.0%) |
| Bachelor's Degree | 2 (100.0%) | 0 (0.0%) |
| Graduate Degree | 0 (0.0%) | 0 (0.0%) |
| Total | 2 (50.0%) | 2 (50.0%) |
Employment Characteristics in Markleville
Employment by Class of Employer in Markleville
Among the 289 employed individuals in Markleville, private company employees (222 | 76.8%), local government employees (41 | 14.2%), and not-for-profit organizations (11 | 3.8%) make up the most common classes of employment.
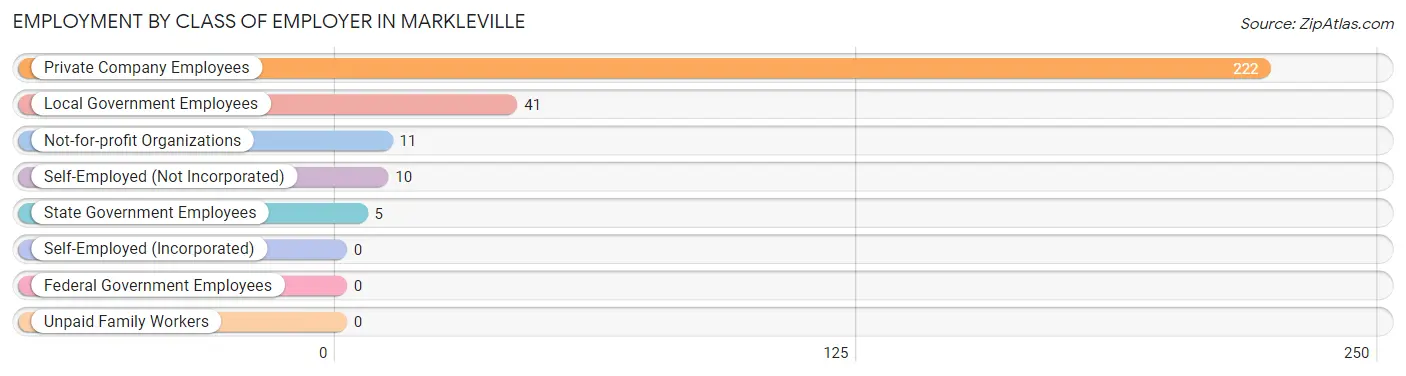
| Employer Class | # Employees | % Employees |
| Private Company Employees | 222 | 76.8% |
| Self-Employed (Incorporated) | 0 | 0.0% |
| Self-Employed (Not Incorporated) | 10 | 3.5% |
| Not-for-profit Organizations | 11 | 3.8% |
| Local Government Employees | 41 | 14.2% |
| State Government Employees | 5 | 1.7% |
| Federal Government Employees | 0 | 0.0% |
| Unpaid Family Workers | 0 | 0.0% |
| Total | 289 | 100.0% |
Employment Status by Age in Markleville
According to the labor force statistics for Markleville, out of the total population over 16 years of age (445), 75.3% or 335 individuals are in the labor force, with 6.6% or 22 of them unemployed. The age group with the highest labor force participation rate is 20 to 24 years, with 94.1% or 32 individuals in the labor force. Within the labor force, the 16 to 19 years age range has the highest percentage of unemployed individuals, with 29.3% or 12 of them being unemployed.
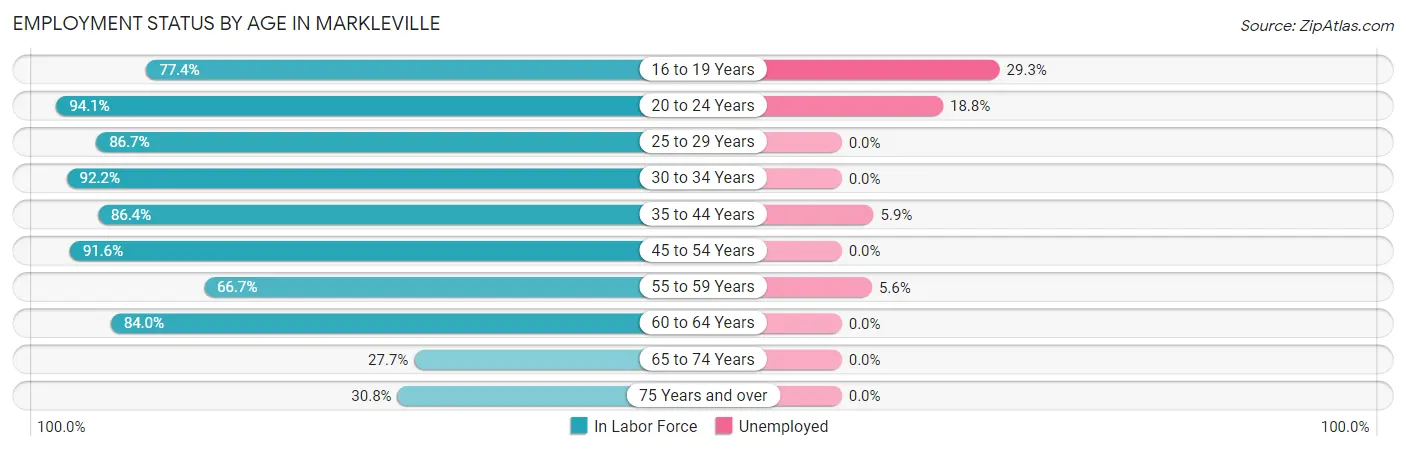
| Age Bracket | In Labor Force | Unemployed |
| 16 to 19 Years | 41 (77.4%) | 12 (29.3%) |
| 20 to 24 Years | 32 (94.1%) | 6 (18.8%) |
| 25 to 29 Years | 13 (86.7%) | 0 (0.0%) |
| 30 to 34 Years | 47 (92.2%) | 0 (0.0%) |
| 35 to 44 Years | 51 (86.4%) | 3 (5.9%) |
| 45 to 54 Years | 87 (91.6%) | 0 (0.0%) |
| 55 to 59 Years | 18 (66.7%) | 1 (5.6%) |
| 60 to 64 Years | 21 (84.0%) | 0 (0.0%) |
| 65 to 74 Years | 13 (27.7%) | 0 (0.0%) |
| 75 Years and over | 12 (30.8%) | 0 (0.0%) |
| Total | 335 (75.3%) | 22 (6.6%) |
Employment Status by Educational Attainment in Markleville
According to labor force statistics for Markleville, 87.1% of individuals (237) out of the total population between 25 and 64 years of age (272) are in the labor force, with 1.7% or 4 of them being unemployed. The group with the highest labor force participation rate are those with the educational attainment of college / associate degree, with 98.4% or 120 individuals in the labor force. Within the labor force, individuals with college / associate degree education have the highest percentage of unemployment, with 2.5% or 3 of them being unemployed.
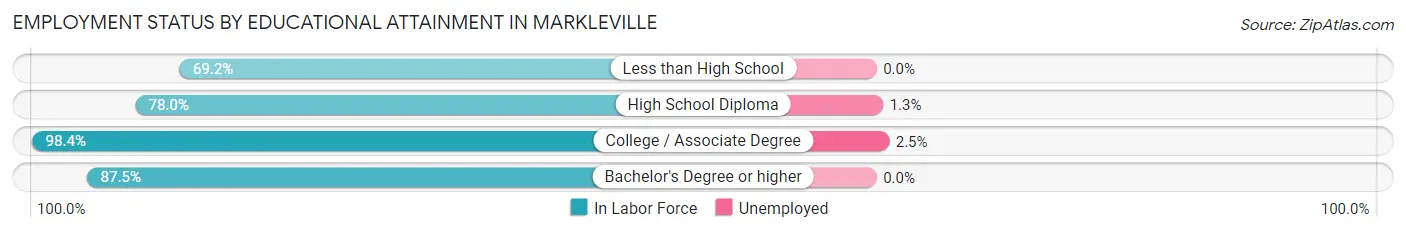
| Educational Attainment | In Labor Force | Unemployed |
| Less than High School | 18 (69.2%) | 0 (0.0%) |
| High School Diploma | 78 (78.0%) | 1 (1.3%) |
| College / Associate Degree | 120 (98.4%) | 3 (2.5%) |
| Bachelor's Degree or higher | 21 (87.5%) | 0 (0.0%) |
| Total | 237 (87.1%) | 5 (1.7%) |
Employment Occupations by Sex in Markleville
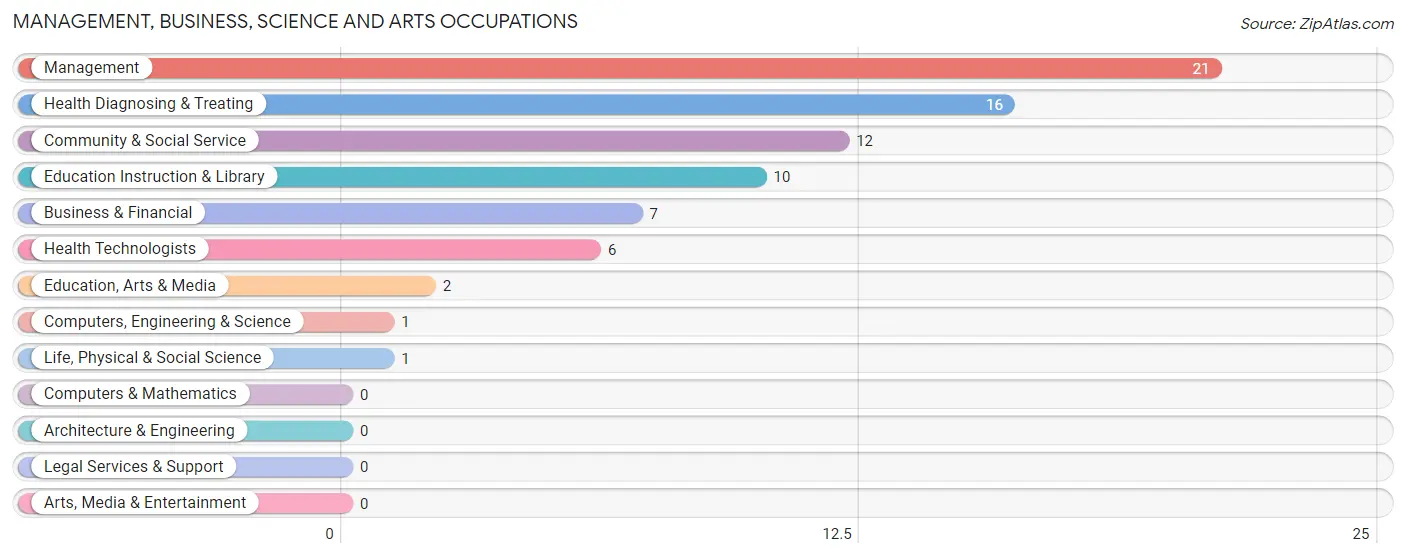
Management, Business, Science and Arts Occupations
The most common Management, Business, Science and Arts occupations in Markleville are Management (21 | 6.7%), Health Diagnosing & Treating (16 | 5.1%), Community & Social Service (12 | 3.8%), Education Instruction & Library (10 | 3.2%), and Business & Financial (7 | 2.2%).
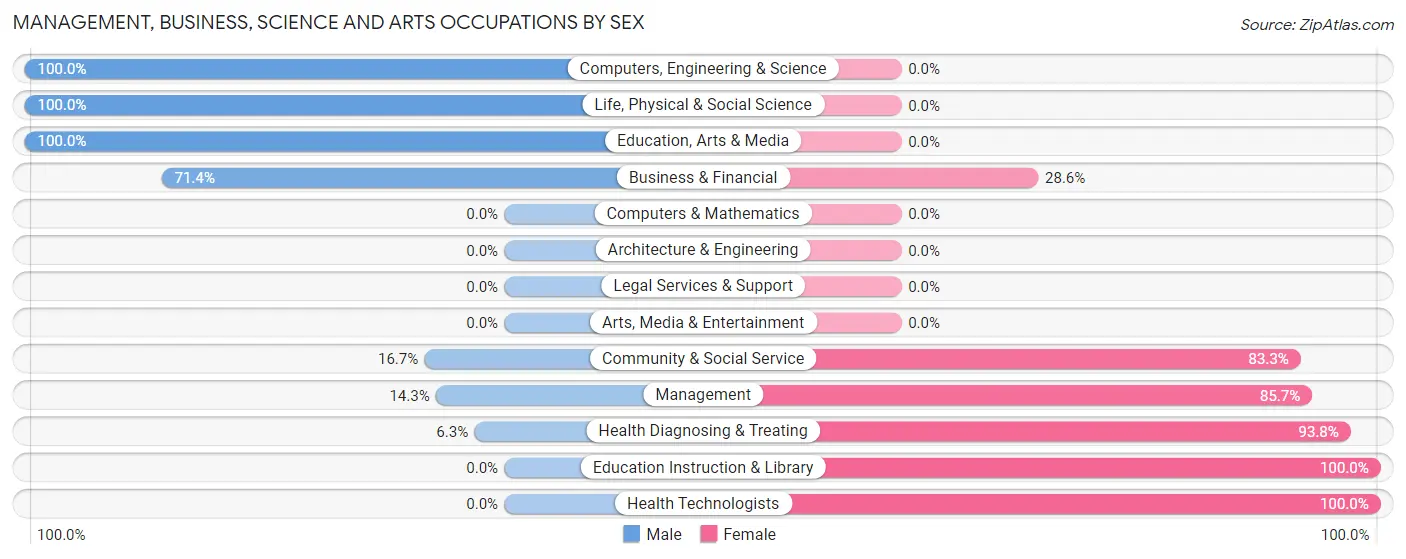
Management, Business, Science and Arts Occupations by Sex
Within the Management, Business, Science and Arts occupations in Markleville, the most male-oriented occupations are Computers, Engineering & Science (100.0%), Life, Physical & Social Science (100.0%), and Education, Arts & Media (100.0%), while the most female-oriented occupations are Education Instruction & Library (100.0%), Health Technologists (100.0%), and Health Diagnosing & Treating (93.8%).
| Occupation | Male | Female |
| Management | 3 (14.3%) | 18 (85.7%) |
| Business & Financial | 5 (71.4%) | 2 (28.6%) |
| Computers, Engineering & Science | 1 (100.0%) | 0 (0.0%) |
| Computers & Mathematics | 0 (0.0%) | 0 (0.0%) |
| Architecture & Engineering | 0 (0.0%) | 0 (0.0%) |
| Life, Physical & Social Science | 1 (100.0%) | 0 (0.0%) |
| Community & Social Service | 2 (16.7%) | 10 (83.3%) |
| Education, Arts & Media | 2 (100.0%) | 0 (0.0%) |
| Legal Services & Support | 0 (0.0%) | 0 (0.0%) |
| Education Instruction & Library | 0 (0.0%) | 10 (100.0%) |
| Arts, Media & Entertainment | 0 (0.0%) | 0 (0.0%) |
| Health Diagnosing & Treating | 1 (6.2%) | 15 (93.8%) |
| Health Technologists | 0 (0.0%) | 6 (100.0%) |
| Total (Category) | 12 (21.0%) | 45 (78.9%) |
| Total (Overall) | 167 (53.3%) | 146 (46.7%) |
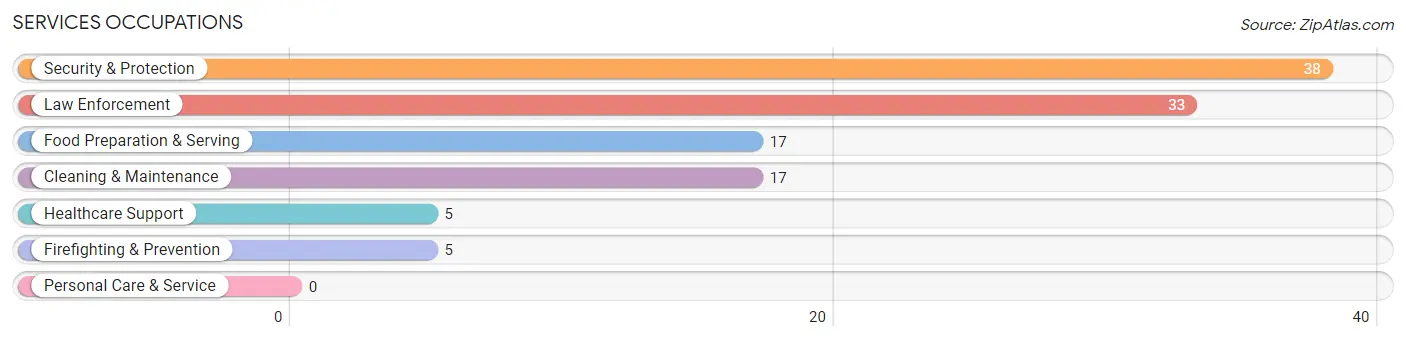
Services Occupations
The most common Services occupations in Markleville are Security & Protection (38 | 12.1%), Law Enforcement (33 | 10.5%), Food Preparation & Serving (17 | 5.4%), Cleaning & Maintenance (17 | 5.4%), and Healthcare Support (5 | 1.6%).
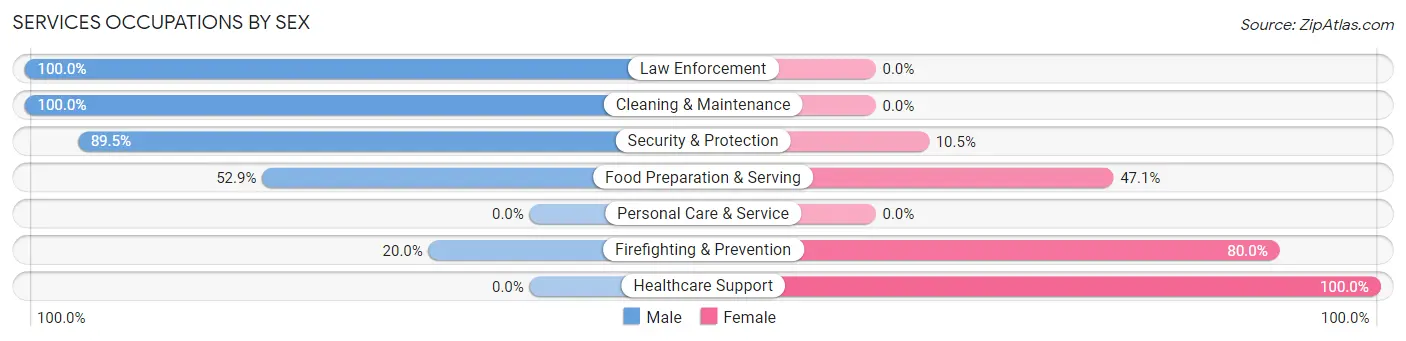
Services Occupations by Sex
Within the Services occupations in Markleville, the most male-oriented occupations are Law Enforcement (100.0%), Cleaning & Maintenance (100.0%), and Security & Protection (89.5%), while the most female-oriented occupations are Healthcare Support (100.0%), Firefighting & Prevention (80.0%), and Food Preparation & Serving (47.1%).
| Occupation | Male | Female |
| Healthcare Support | 0 (0.0%) | 5 (100.0%) |
| Security & Protection | 34 (89.5%) | 4 (10.5%) |
| Firefighting & Prevention | 1 (20.0%) | 4 (80.0%) |
| Law Enforcement | 33 (100.0%) | 0 (0.0%) |
| Food Preparation & Serving | 9 (52.9%) | 8 (47.1%) |
| Cleaning & Maintenance | 17 (100.0%) | 0 (0.0%) |
| Personal Care & Service | 0 (0.0%) | 0 (0.0%) |
| Total (Category) | 60 (77.9%) | 17 (22.1%) |
| Total (Overall) | 167 (53.3%) | 146 (46.7%) |
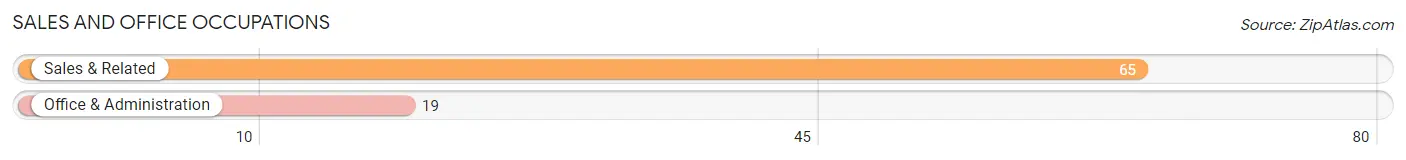
Sales and Office Occupations
The most common Sales and Office occupations in Markleville are Sales & Related (65 | 20.8%), and Office & Administration (19 | 6.1%).
Sales and Office Occupations by Sex
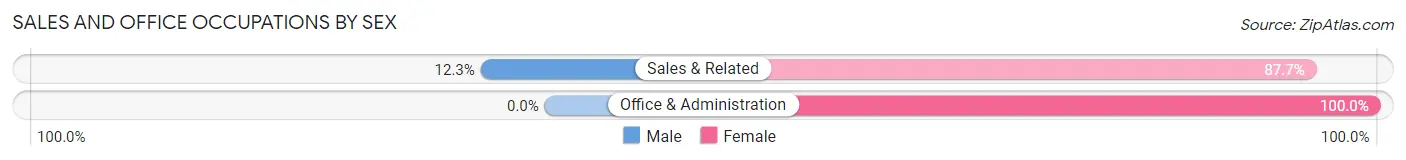
| Occupation | Male | Female |
| Sales & Related | 8 (12.3%) | 57 (87.7%) |
| Office & Administration | 0 (0.0%) | 19 (100.0%) |
| Total (Category) | 8 (9.5%) | 76 (90.5%) |
| Total (Overall) | 167 (53.3%) | 146 (46.7%) |
Natural Resources, Construction and Maintenance Occupations
The most common Natural Resources, Construction and Maintenance occupations in Markleville are Construction & Extraction (31 | 9.9%), and Installation, Maintenance & Repair (19 | 6.1%).

Natural Resources, Construction and Maintenance Occupations by Sex

| Occupation | Male | Female |
| Farming, Fishing & Forestry | 0 (0.0%) | 0 (0.0%) |
| Construction & Extraction | 30 (96.8%) | 1 (3.2%) |
| Installation, Maintenance & Repair | 19 (100.0%) | 0 (0.0%) |
| Total (Category) | 49 (98.0%) | 1 (2.0%) |
| Total (Overall) | 167 (53.3%) | 146 (46.7%) |
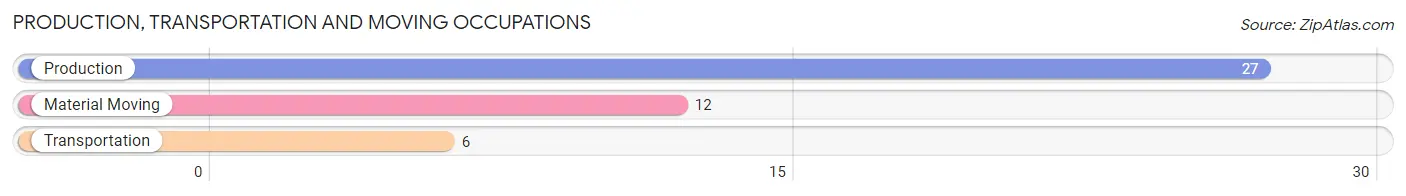
Production, Transportation and Moving Occupations
The most common Production, Transportation and Moving occupations in Markleville are Production (27 | 8.6%), Material Moving (12 | 3.8%), and Transportation (6 | 1.9%).
Production, Transportation and Moving Occupations by Sex
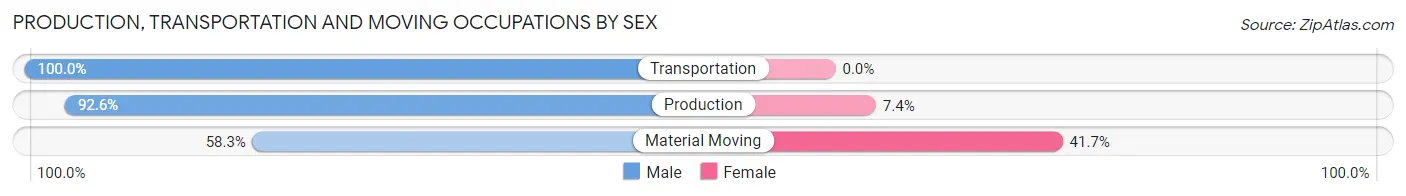
| Occupation | Male | Female |
| Production | 25 (92.6%) | 2 (7.4%) |
| Transportation | 6 (100.0%) | 0 (0.0%) |
| Material Moving | 7 (58.3%) | 5 (41.7%) |
| Total (Category) | 38 (84.4%) | 7 (15.6%) |
| Total (Overall) | 167 (53.3%) | 146 (46.7%) |
Employment Industries by Sex in Markleville
Employment Industries in Markleville
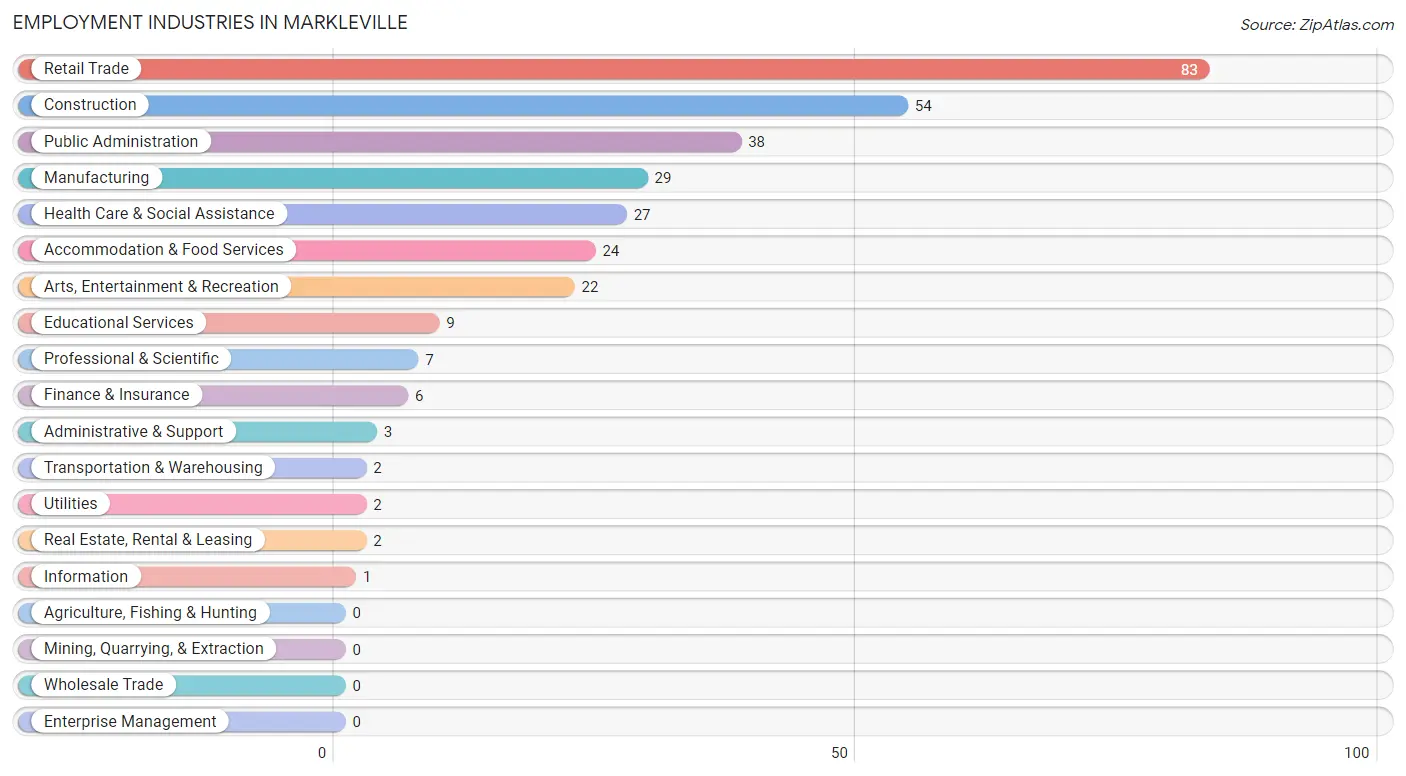
The major employment industries in Markleville include Retail Trade (83 | 26.5%), Construction (54 | 17.2%), Public Administration (38 | 12.1%), Manufacturing (29 | 9.3%), and Health Care & Social Assistance (27 | 8.6%).
Employment Industries by Sex in Markleville
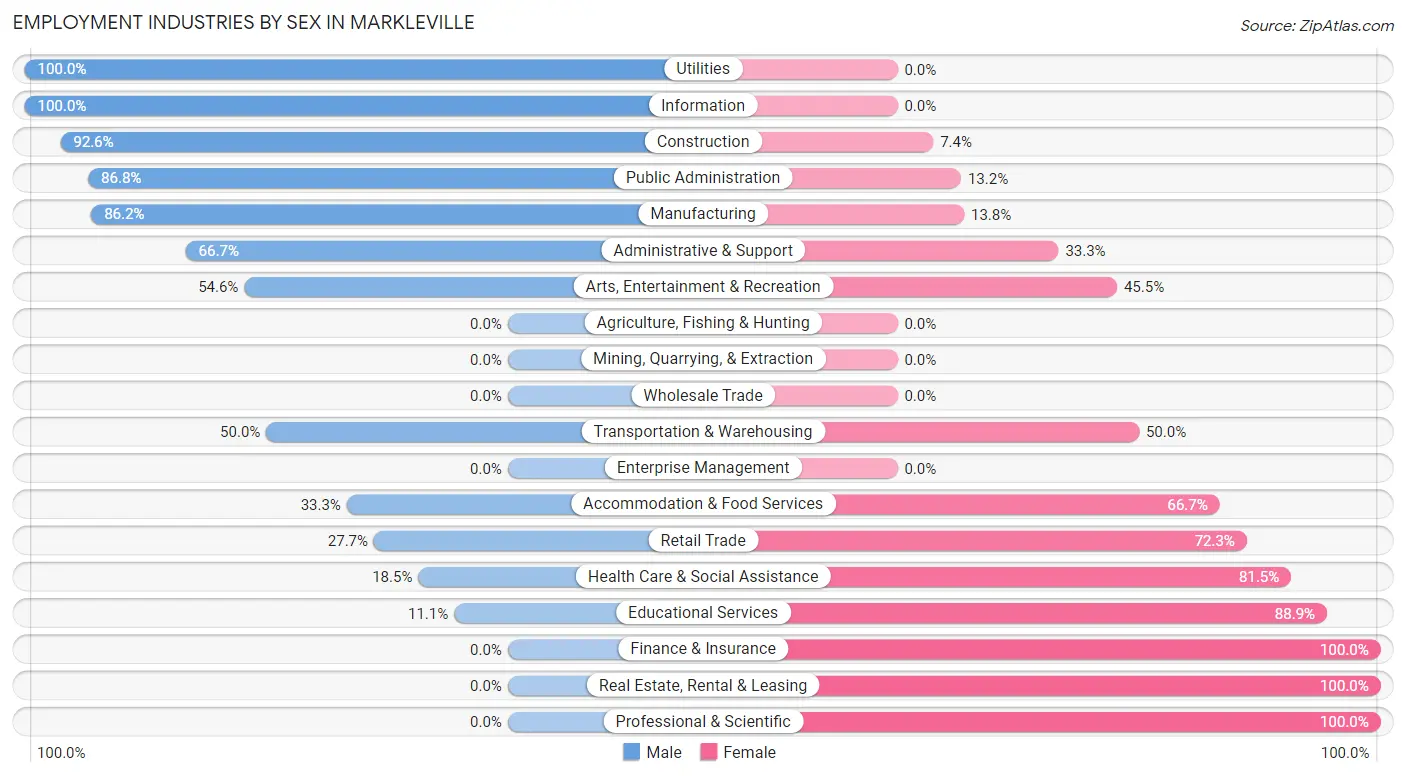
The Markleville industries that see more men than women are Utilities (100.0%), Information (100.0%), and Construction (92.6%), whereas the industries that tend to have a higher number of women are Finance & Insurance (100.0%), Real Estate, Rental & Leasing (100.0%), and Professional & Scientific (100.0%).
| Industry | Male | Female |
| Agriculture, Fishing & Hunting | 0 (0.0%) | 0 (0.0%) |
| Mining, Quarrying, & Extraction | 0 (0.0%) | 0 (0.0%) |
| Construction | 50 (92.6%) | 4 (7.4%) |
| Manufacturing | 25 (86.2%) | 4 (13.8%) |
| Wholesale Trade | 0 (0.0%) | 0 (0.0%) |
| Retail Trade | 23 (27.7%) | 60 (72.3%) |
| Transportation & Warehousing | 1 (50.0%) | 1 (50.0%) |
| Utilities | 2 (100.0%) | 0 (0.0%) |
| Information | 1 (100.0%) | 0 (0.0%) |
| Finance & Insurance | 0 (0.0%) | 6 (100.0%) |
| Real Estate, Rental & Leasing | 0 (0.0%) | 2 (100.0%) |
| Professional & Scientific | 0 (0.0%) | 7 (100.0%) |
| Enterprise Management | 0 (0.0%) | 0 (0.0%) |
| Administrative & Support | 2 (66.7%) | 1 (33.3%) |
| Educational Services | 1 (11.1%) | 8 (88.9%) |
| Health Care & Social Assistance | 5 (18.5%) | 22 (81.5%) |
| Arts, Entertainment & Recreation | 12 (54.5%) | 10 (45.5%) |
| Accommodation & Food Services | 8 (33.3%) | 16 (66.7%) |
| Public Administration | 33 (86.8%) | 5 (13.2%) |
| Total | 167 (53.3%) | 146 (46.7%) |
Education in Markleville
School Enrollment in Markleville
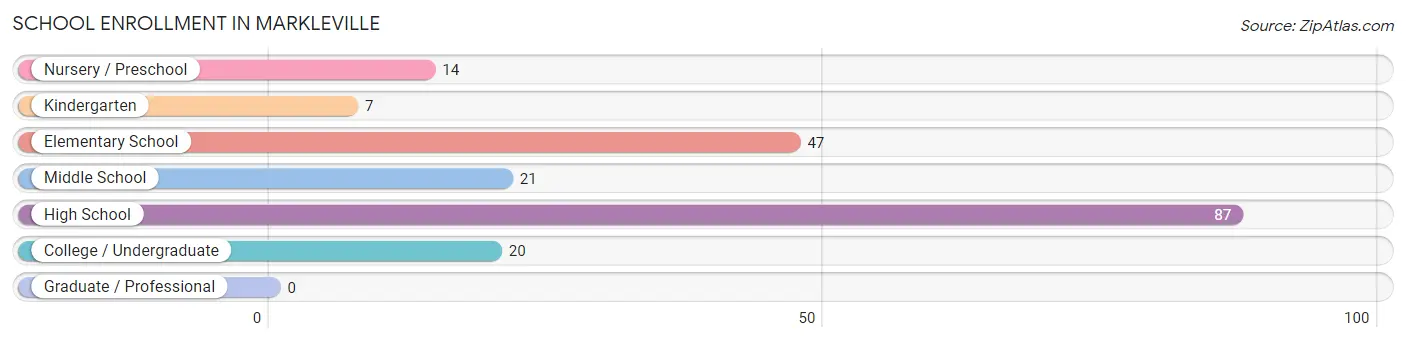
The most common levels of schooling among the 196 students in Markleville are high school (87 | 44.4%), elementary school (47 | 24.0%), and middle school (21 | 10.7%).
| School Level | # Students | % Students |
| Nursery / Preschool | 14 | 7.1% |
| Kindergarten | 7 | 3.6% |
| Elementary School | 47 | 24.0% |
| Middle School | 21 | 10.7% |
| High School | 87 | 44.4% |
| College / Undergraduate | 20 | 10.2% |
| Graduate / Professional | 0 | 0.0% |
| Total | 196 | 100.0% |
School Enrollment by Age by Funding Source in Markleville
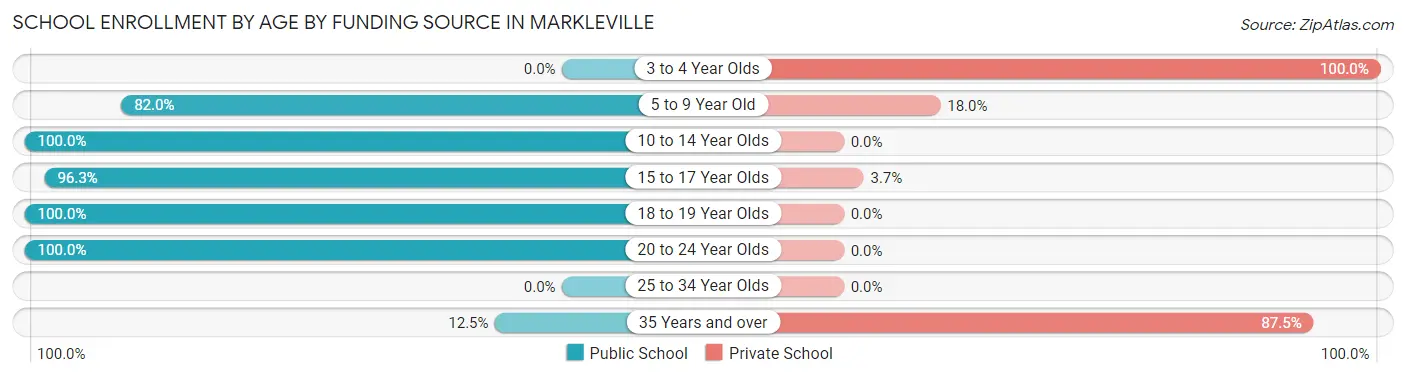
Out of a total of 196 students who are enrolled in schools in Markleville, 23 (11.7%) attend a private institution, while the remaining 173 (88.3%) are enrolled in public schools. The age group of 3 to 4 year olds has the highest likelihood of being enrolled in private schools, with 5 (100.0% in the age bracket) enrolled. Conversely, the age group of 10 to 14 year olds has the lowest likelihood of being enrolled in a private school, with 34 (100.0% in the age bracket) attending a public institution.
| Age Bracket | Public School | Private School |
| 3 to 4 Year Olds | 0 (0.0%) | 5 (100.0%) |
| 5 to 9 Year Old | 41 (82.0%) | 9 (18.0%) |
| 10 to 14 Year Olds | 34 (100.0%) | 0 (0.0%) |
| 15 to 17 Year Olds | 52 (96.3%) | 2 (3.7%) |
| 18 to 19 Year Olds | 39 (100.0%) | 0 (0.0%) |
| 20 to 24 Year Olds | 6 (100.0%) | 0 (0.0%) |
| 25 to 34 Year Olds | 0 (0.0%) | 0 (0.0%) |
| 35 Years and over | 1 (12.5%) | 7 (87.5%) |
| Total | 173 (88.3%) | 23 (11.7%) |
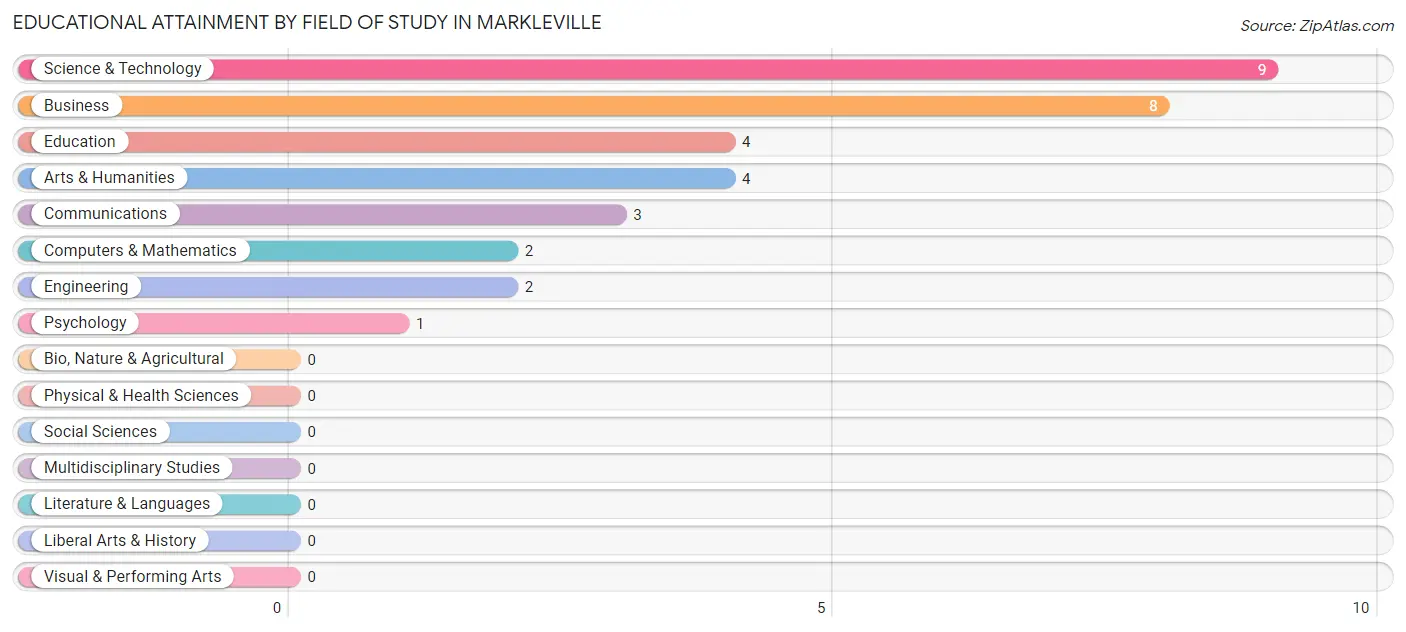
Educational Attainment by Field of Study in Markleville
Science & technology (9 | 27.3%), business (8 | 24.2%), education (4 | 12.1%), arts & humanities (4 | 12.1%), and communications (3 | 9.1%) are the most common fields of study among 33 individuals in Markleville who have obtained a bachelor's degree or higher.
| Field of Study | # Graduates | % Graduates |
| Computers & Mathematics | 2 | 6.1% |
| Bio, Nature & Agricultural | 0 | 0.0% |
| Physical & Health Sciences | 0 | 0.0% |
| Psychology | 1 | 3.0% |
| Social Sciences | 0 | 0.0% |
| Engineering | 2 | 6.1% |
| Multidisciplinary Studies | 0 | 0.0% |
| Science & Technology | 9 | 27.3% |
| Business | 8 | 24.2% |
| Education | 4 | 12.1% |
| Literature & Languages | 0 | 0.0% |
| Liberal Arts & History | 0 | 0.0% |
| Visual & Performing Arts | 0 | 0.0% |
| Communications | 3 | 9.1% |
| Arts & Humanities | 4 | 12.1% |
| Total | 33 | 100.0% |
Transportation & Commute in Markleville
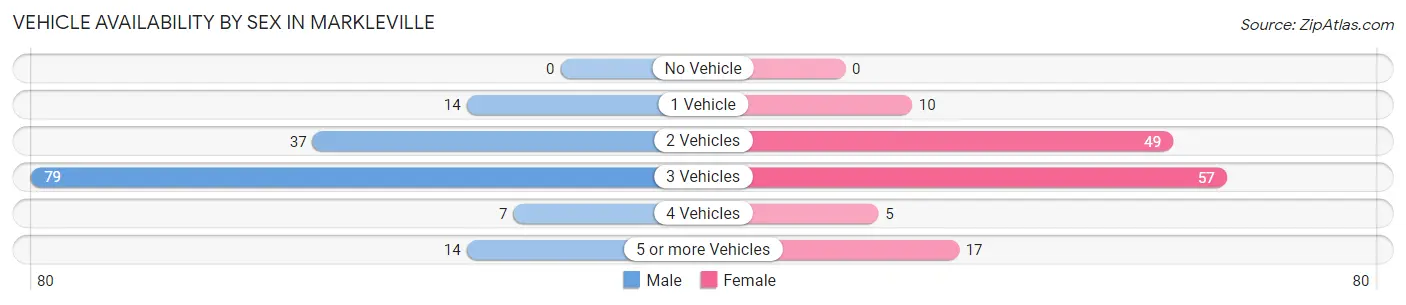
Vehicle Availability by Sex in Markleville
The most prevalent vehicle ownership categories in Markleville are males with 3 vehicles (79, accounting for 52.3%) and females with 3 vehicles (57, making up 57.3%).
| Vehicles Available | Male | Female |
| No Vehicle | 0 (0.0%) | 0 (0.0%) |
| 1 Vehicle | 14 (9.3%) | 10 (7.2%) |
| 2 Vehicles | 37 (24.5%) | 49 (35.5%) |
| 3 Vehicles | 79 (52.3%) | 57 (41.3%) |
| 4 Vehicles | 7 (4.6%) | 5 (3.6%) |
| 5 or more Vehicles | 14 (9.3%) | 17 (12.3%) |
| Total | 151 (100.0%) | 138 (100.0%) |
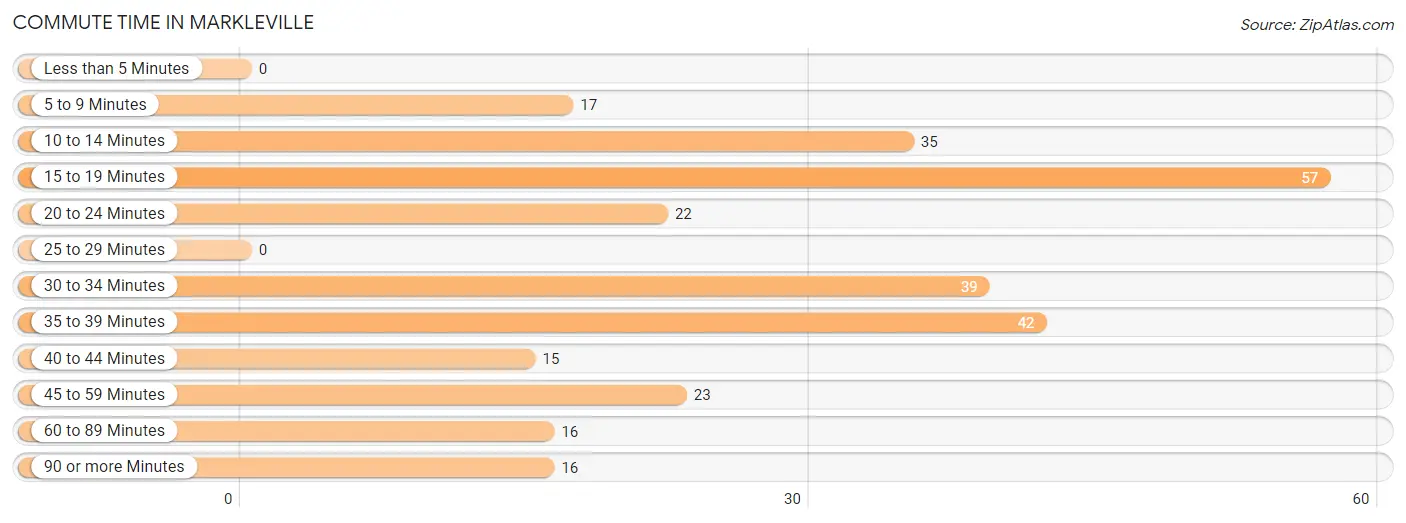
Commute Time in Markleville
The most frequently occuring commute durations in Markleville are 15 to 19 minutes (57 commuters, 20.2%), 35 to 39 minutes (42 commuters, 14.9%), and 30 to 34 minutes (39 commuters, 13.8%).
| Commute Time | # Commuters | % Commuters |
| Less than 5 Minutes | 0 | 0.0% |
| 5 to 9 Minutes | 17 | 6.0% |
| 10 to 14 Minutes | 35 | 12.4% |
| 15 to 19 Minutes | 57 | 20.2% |
| 20 to 24 Minutes | 22 | 7.8% |
| 25 to 29 Minutes | 0 | 0.0% |
| 30 to 34 Minutes | 39 | 13.8% |
| 35 to 39 Minutes | 42 | 14.9% |
| 40 to 44 Minutes | 15 | 5.3% |
| 45 to 59 Minutes | 23 | 8.2% |
| 60 to 89 Minutes | 16 | 5.7% |
| 90 or more Minutes | 16 | 5.7% |
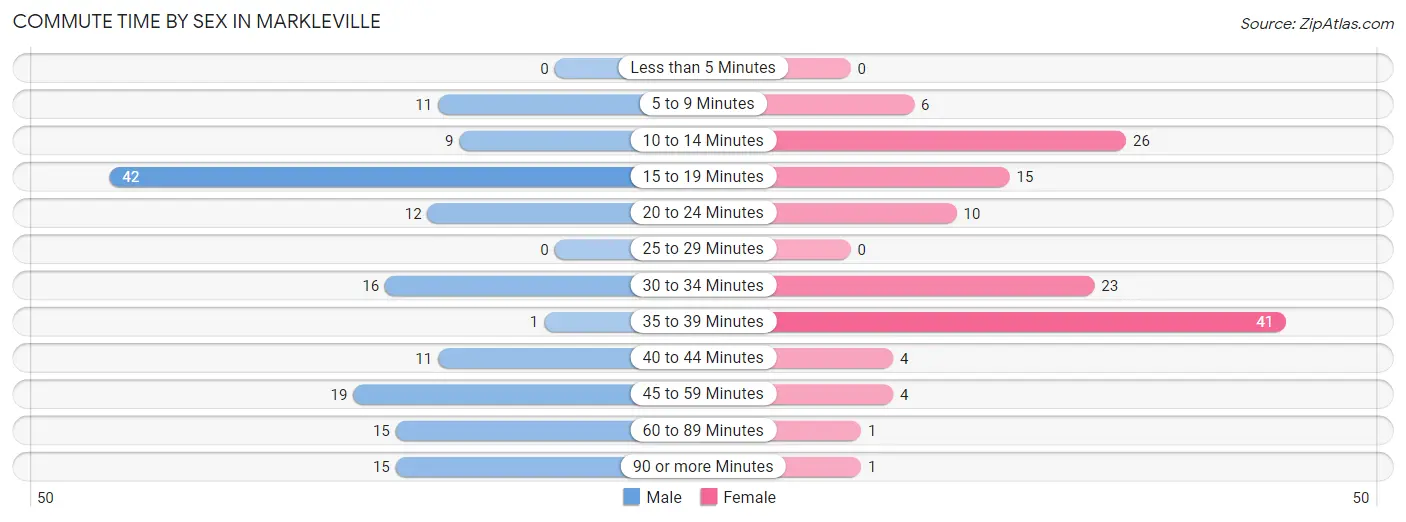
Commute Time by Sex in Markleville
The most common commute times in Markleville are 15 to 19 minutes (42 commuters, 27.8%) for males and 35 to 39 minutes (41 commuters, 31.3%) for females.
| Commute Time | Male | Female |
| Less than 5 Minutes | 0 (0.0%) | 0 (0.0%) |
| 5 to 9 Minutes | 11 (7.3%) | 6 (4.6%) |
| 10 to 14 Minutes | 9 (6.0%) | 26 (19.9%) |
| 15 to 19 Minutes | 42 (27.8%) | 15 (11.5%) |
| 20 to 24 Minutes | 12 (8.0%) | 10 (7.6%) |
| 25 to 29 Minutes | 0 (0.0%) | 0 (0.0%) |
| 30 to 34 Minutes | 16 (10.6%) | 23 (17.6%) |
| 35 to 39 Minutes | 1 (0.7%) | 41 (31.3%) |
| 40 to 44 Minutes | 11 (7.3%) | 4 (3.0%) |
| 45 to 59 Minutes | 19 (12.6%) | 4 (3.0%) |
| 60 to 89 Minutes | 15 (9.9%) | 1 (0.8%) |
| 90 or more Minutes | 15 (9.9%) | 1 (0.8%) |
Time of Departure to Work by Sex in Markleville
The most frequent times of departure to work in Markleville are 4:00 PM to 11:59 PM (38, 25.2%) for males and 8:00 AM to 8:29 AM (41, 31.3%) for females.
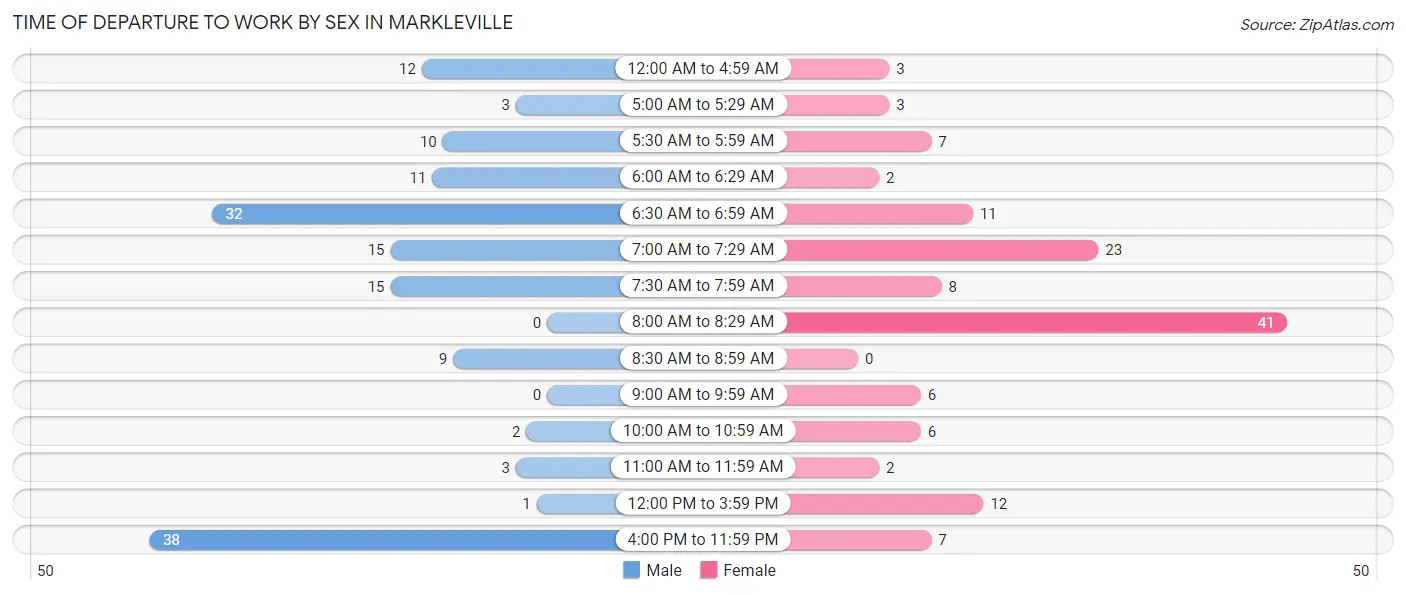
| Time of Departure | Male | Female |
| 12:00 AM to 4:59 AM | 12 (8.0%) | 3 (2.3%) |
| 5:00 AM to 5:29 AM | 3 (2.0%) | 3 (2.3%) |
| 5:30 AM to 5:59 AM | 10 (6.6%) | 7 (5.3%) |
| 6:00 AM to 6:29 AM | 11 (7.3%) | 2 (1.5%) |
| 6:30 AM to 6:59 AM | 32 (21.2%) | 11 (8.4%) |
| 7:00 AM to 7:29 AM | 15 (9.9%) | 23 (17.6%) |
| 7:30 AM to 7:59 AM | 15 (9.9%) | 8 (6.1%) |
| 8:00 AM to 8:29 AM | 0 (0.0%) | 41 (31.3%) |
| 8:30 AM to 8:59 AM | 9 (6.0%) | 0 (0.0%) |
| 9:00 AM to 9:59 AM | 0 (0.0%) | 6 (4.6%) |
| 10:00 AM to 10:59 AM | 2 (1.3%) | 6 (4.6%) |
| 11:00 AM to 11:59 AM | 3 (2.0%) | 2 (1.5%) |
| 12:00 PM to 3:59 PM | 1 (0.7%) | 12 (9.2%) |
| 4:00 PM to 11:59 PM | 38 (25.2%) | 7 (5.3%) |
| Total | 151 (100.0%) | 131 (100.0%) |
Housing Occupancy in Markleville
Occupancy by Ownership in Markleville
Of the total 214 dwellings in Markleville, owner-occupied units account for 181 (84.6%), while renter-occupied units make up 33 (15.4%).
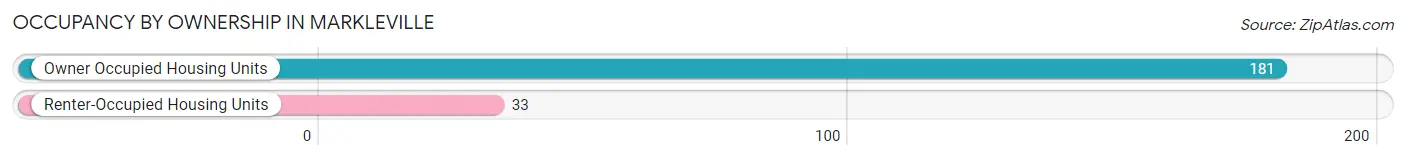
| Occupancy | # Housing Units | % Housing Units |
| Owner Occupied Housing Units | 181 | 84.6% |
| Renter-Occupied Housing Units | 33 | 15.4% |
| Total Occupied Housing Units | 214 | 100.0% |
Occupancy by Household Size in Markleville
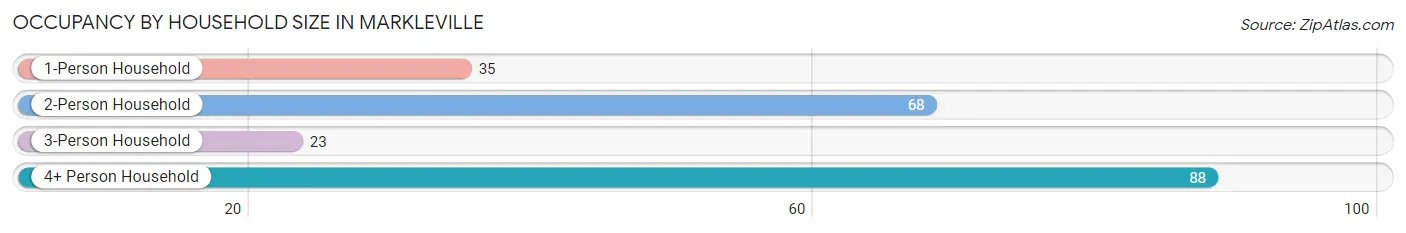
| Household Size | # Housing Units | % Housing Units |
| 1-Person Household | 35 | 16.4% |
| 2-Person Household | 68 | 31.8% |
| 3-Person Household | 23 | 10.7% |
| 4+ Person Household | 88 | 41.1% |
| Total Housing Units | 214 | 100.0% |
Occupancy by Ownership by Household Size in Markleville
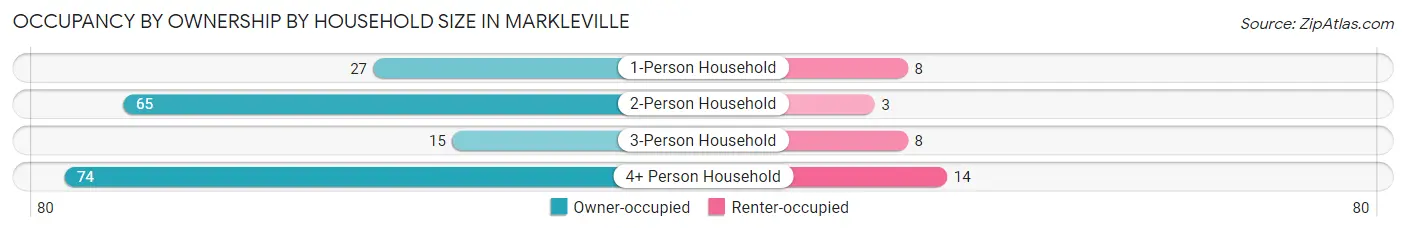
| Household Size | Owner-occupied | Renter-occupied |
| 1-Person Household | 27 (77.1%) | 8 (22.9%) |
| 2-Person Household | 65 (95.6%) | 3 (4.4%) |
| 3-Person Household | 15 (65.2%) | 8 (34.8%) |
| 4+ Person Household | 74 (84.1%) | 14 (15.9%) |
| Total Housing Units | 181 (84.6%) | 33 (15.4%) |
Occupancy by Educational Attainment in Markleville
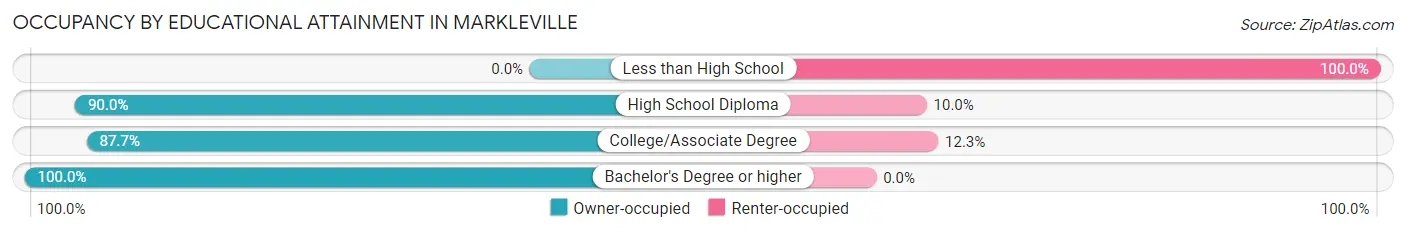
| Household Size | Owner-occupied | Renter-occupied |
| Less than High School | 0 (0.0%) | 12 (100.0%) |
| High School Diploma | 63 (90.0%) | 7 (10.0%) |
| College/Associate Degree | 100 (87.7%) | 14 (12.3%) |
| Bachelor's Degree or higher | 18 (100.0%) | 0 (0.0%) |
Occupancy by Age of Householder in Markleville
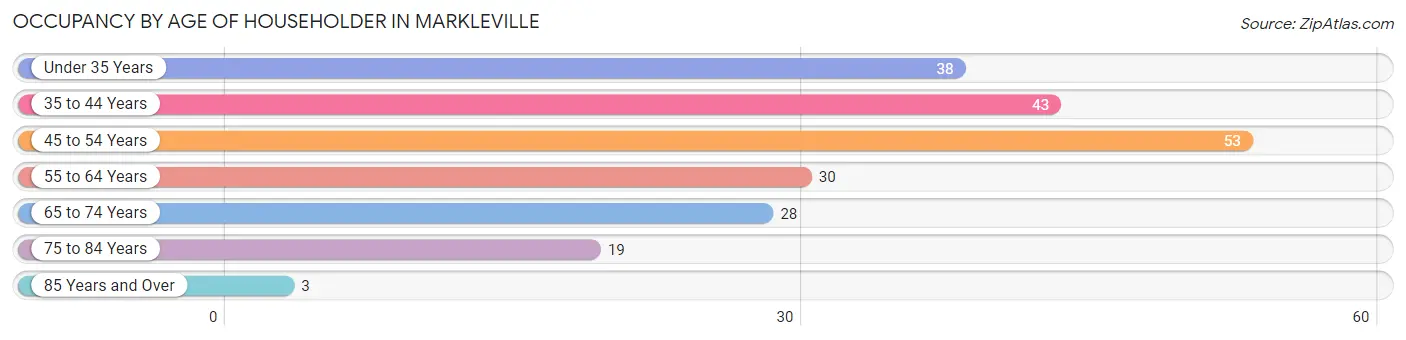
| Age Bracket | # Households | % Households |
| Under 35 Years | 38 | 17.8% |
| 35 to 44 Years | 43 | 20.1% |
| 45 to 54 Years | 53 | 24.8% |
| 55 to 64 Years | 30 | 14.0% |
| 65 to 74 Years | 28 | 13.1% |
| 75 to 84 Years | 19 | 8.9% |
| 85 Years and Over | 3 | 1.4% |
| Total | 214 | 100.0% |
Housing Finances in Markleville
Median Income by Occupancy in Markleville
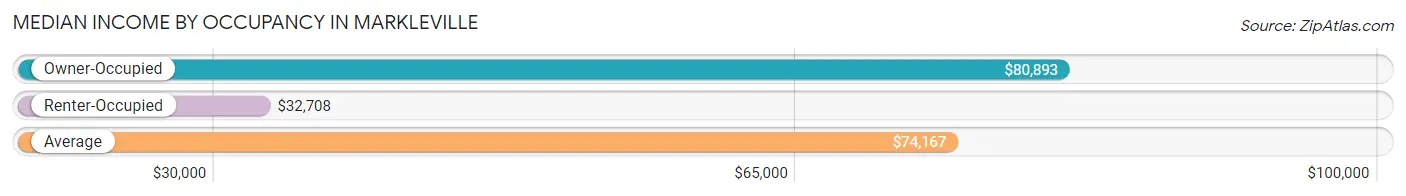
| Occupancy Type | # Households | Median Income |
| Owner-Occupied | 181 (84.6%) | $80,893 |
| Renter-Occupied | 33 (15.4%) | $32,708 |
| Average | 214 (100.0%) | $74,167 |
Occupancy by Householder Income Bracket in Markleville
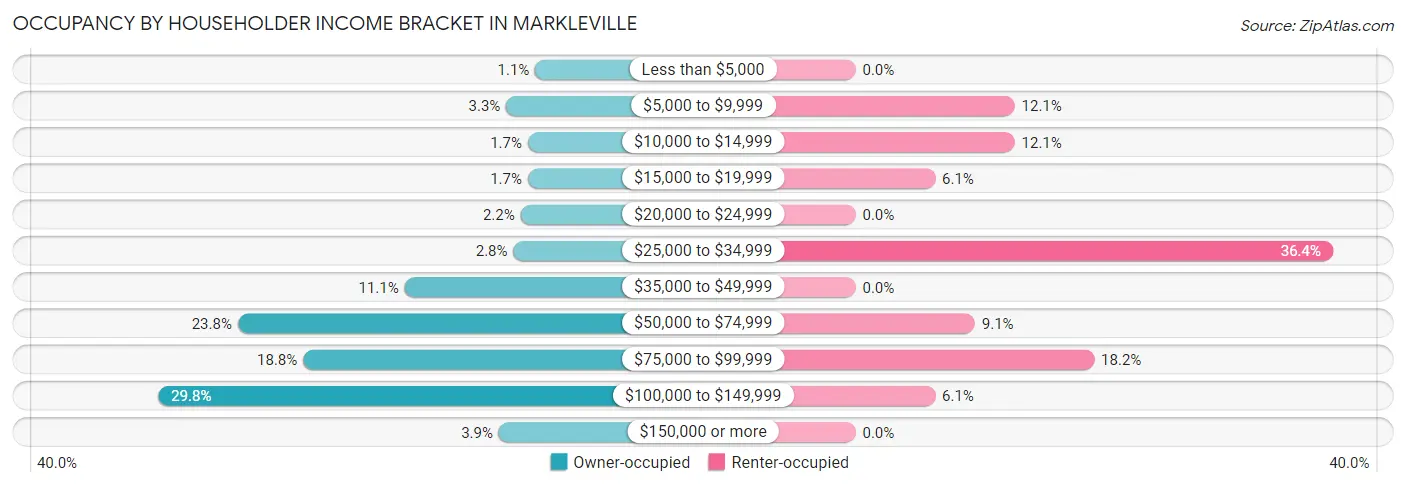
| Income Bracket | Owner-occupied | Renter-occupied |
| Less than $5,000 | 2 (1.1%) | 0 (0.0%) |
| $5,000 to $9,999 | 6 (3.3%) | 4 (12.1%) |
| $10,000 to $14,999 | 3 (1.7%) | 4 (12.1%) |
| $15,000 to $19,999 | 3 (1.7%) | 2 (6.1%) |
| $20,000 to $24,999 | 4 (2.2%) | 0 (0.0%) |
| $25,000 to $34,999 | 5 (2.8%) | 12 (36.4%) |
| $35,000 to $49,999 | 20 (11.1%) | 0 (0.0%) |
| $50,000 to $74,999 | 43 (23.8%) | 3 (9.1%) |
| $75,000 to $99,999 | 34 (18.8%) | 6 (18.2%) |
| $100,000 to $149,999 | 54 (29.8%) | 2 (6.1%) |
| $150,000 or more | 7 (3.9%) | 0 (0.0%) |
| Total | 181 (100.0%) | 33 (100.0%) |
Monthly Housing Cost Tiers in Markleville
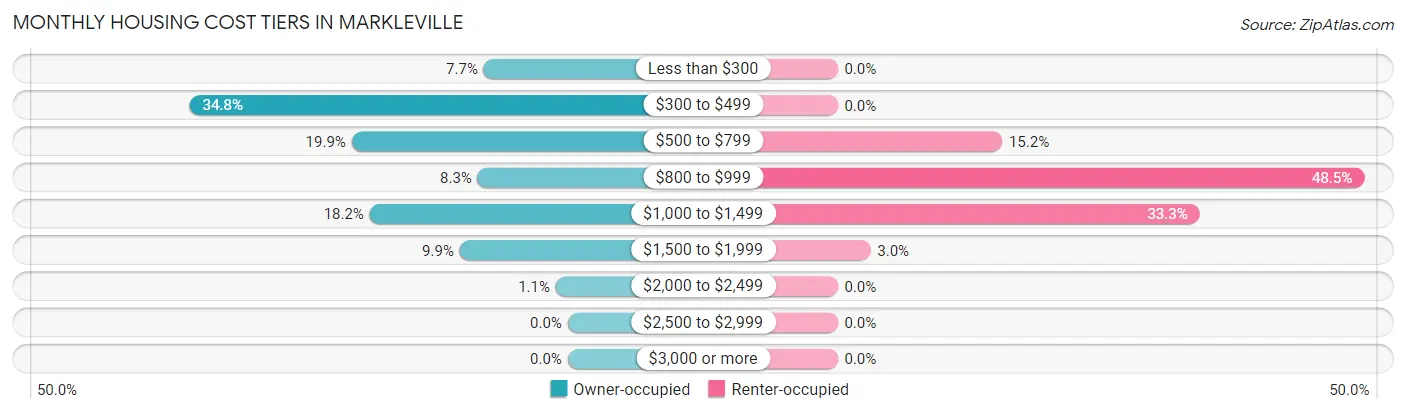
| Monthly Cost | Owner-occupied | Renter-occupied |
| Less than $300 | 14 (7.7%) | 0 (0.0%) |
| $300 to $499 | 63 (34.8%) | 0 (0.0%) |
| $500 to $799 | 36 (19.9%) | 5 (15.1%) |
| $800 to $999 | 15 (8.3%) | 16 (48.5%) |
| $1,000 to $1,499 | 33 (18.2%) | 11 (33.3%) |
| $1,500 to $1,999 | 18 (9.9%) | 1 (3.0%) |
| $2,000 to $2,499 | 2 (1.1%) | 0 (0.0%) |
| $2,500 to $2,999 | 0 (0.0%) | 0 (0.0%) |
| $3,000 or more | 0 (0.0%) | 0 (0.0%) |
| Total | 181 (100.0%) | 33 (100.0%) |
Physical Housing Characteristics in Markleville
Housing Structures in Markleville
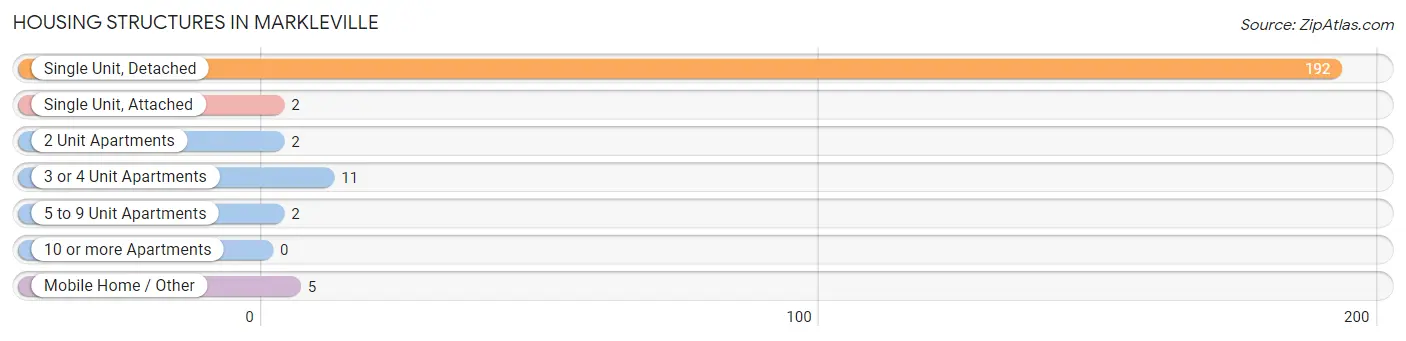
| Structure Type | # Housing Units | % Housing Units |
| Single Unit, Detached | 192 | 89.7% |
| Single Unit, Attached | 2 | 0.9% |
| 2 Unit Apartments | 2 | 0.9% |
| 3 or 4 Unit Apartments | 11 | 5.1% |
| 5 to 9 Unit Apartments | 2 | 0.9% |
| 10 or more Apartments | 0 | 0.0% |
| Mobile Home / Other | 5 | 2.3% |
| Total | 214 | 100.0% |
Housing Structures by Occupancy in Markleville
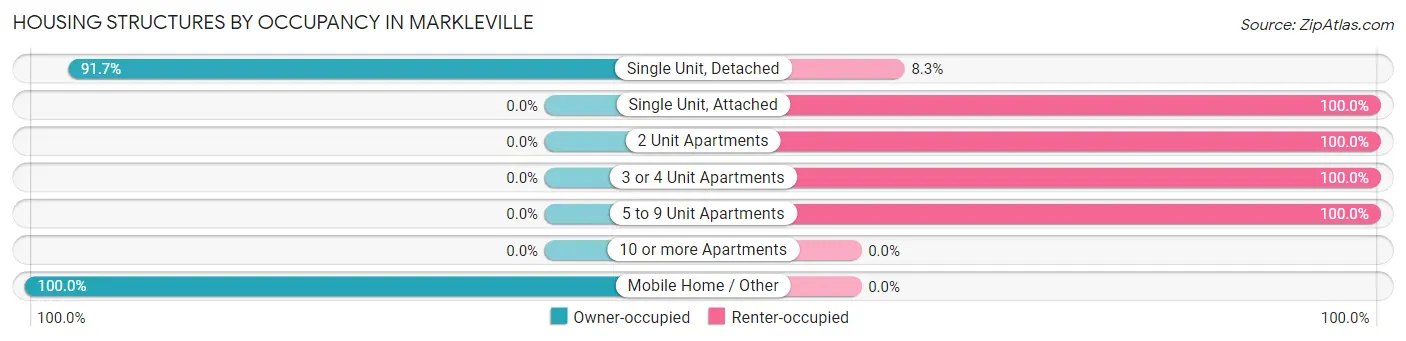
| Structure Type | Owner-occupied | Renter-occupied |
| Single Unit, Detached | 176 (91.7%) | 16 (8.3%) |
| Single Unit, Attached | 0 (0.0%) | 2 (100.0%) |
| 2 Unit Apartments | 0 (0.0%) | 2 (100.0%) |
| 3 or 4 Unit Apartments | 0 (0.0%) | 11 (100.0%) |
| 5 to 9 Unit Apartments | 0 (0.0%) | 2 (100.0%) |
| 10 or more Apartments | 0 (0.0%) | 0 (0.0%) |
| Mobile Home / Other | 5 (100.0%) | 0 (0.0%) |
| Total | 181 (84.6%) | 33 (15.4%) |
Housing Structures by Number of Rooms in Markleville
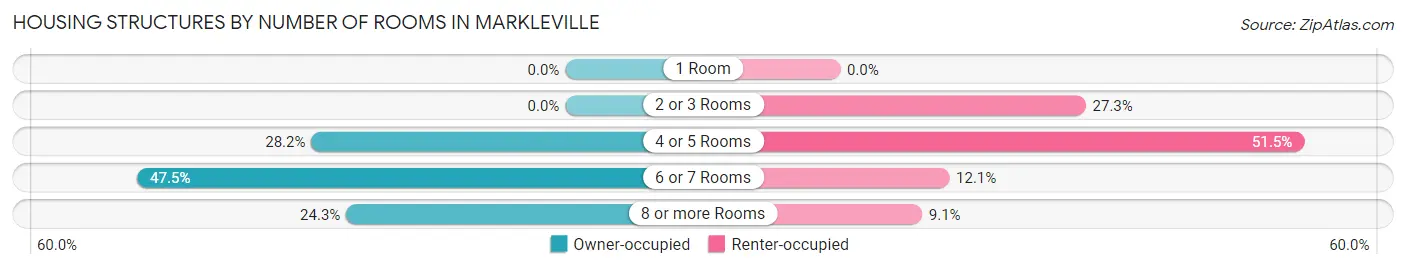
| Number of Rooms | Owner-occupied | Renter-occupied |
| 1 Room | 0 (0.0%) | 0 (0.0%) |
| 2 or 3 Rooms | 0 (0.0%) | 9 (27.3%) |
| 4 or 5 Rooms | 51 (28.2%) | 17 (51.5%) |
| 6 or 7 Rooms | 86 (47.5%) | 4 (12.1%) |
| 8 or more Rooms | 44 (24.3%) | 3 (9.1%) |
| Total | 181 (100.0%) | 33 (100.0%) |
Housing Structure by Heating Type in Markleville
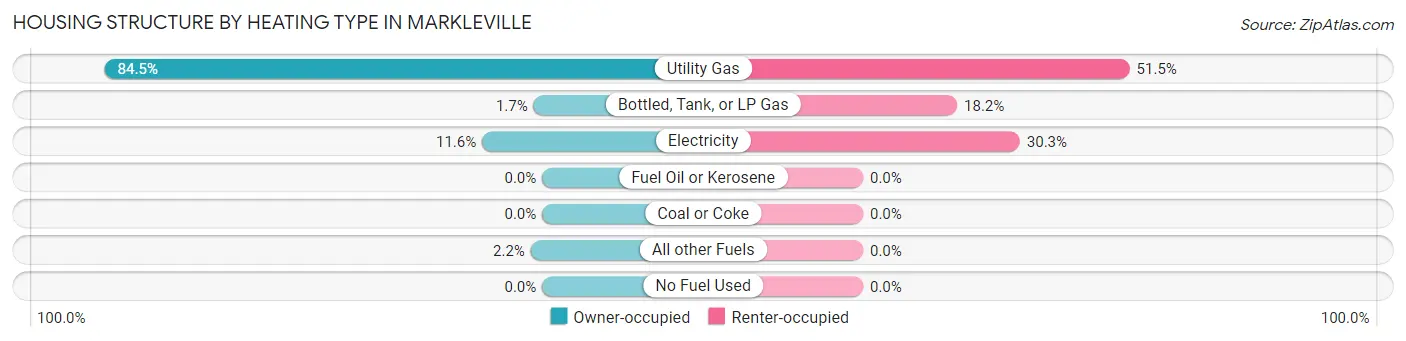
| Heating Type | Owner-occupied | Renter-occupied |
| Utility Gas | 153 (84.5%) | 17 (51.5%) |
| Bottled, Tank, or LP Gas | 3 (1.7%) | 6 (18.2%) |
| Electricity | 21 (11.6%) | 10 (30.3%) |
| Fuel Oil or Kerosene | 0 (0.0%) | 0 (0.0%) |
| Coal or Coke | 0 (0.0%) | 0 (0.0%) |
| All other Fuels | 4 (2.2%) | 0 (0.0%) |
| No Fuel Used | 0 (0.0%) | 0 (0.0%) |
| Total | 181 (100.0%) | 33 (100.0%) |
Household Vehicle Usage in Markleville
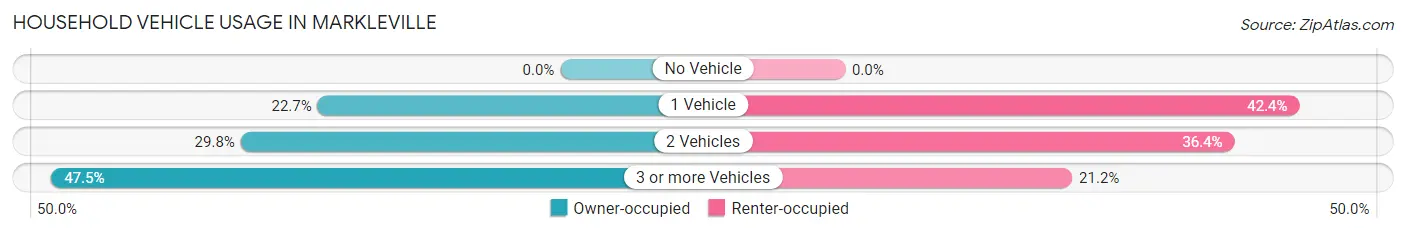
| Vehicles per Household | Owner-occupied | Renter-occupied |
| No Vehicle | 0 (0.0%) | 0 (0.0%) |
| 1 Vehicle | 41 (22.7%) | 14 (42.4%) |
| 2 Vehicles | 54 (29.8%) | 12 (36.4%) |
| 3 or more Vehicles | 86 (47.5%) | 7 (21.2%) |
| Total | 181 (100.0%) | 33 (100.0%) |
Real Estate & Mortgages in Markleville
Real Estate and Mortgage Overview in Markleville
| Characteristic | Without Mortgage | With Mortgage |
| Housing Units | 42 | 139 |
| Median Property Value | $116,700 | $142,700 |
| Median Household Income | $55,938 | $4 |
| Monthly Housing Costs | $438 | $0 |
| Real Estate Taxes | $873 | $0 |
Property Value by Mortgage Status in Markleville
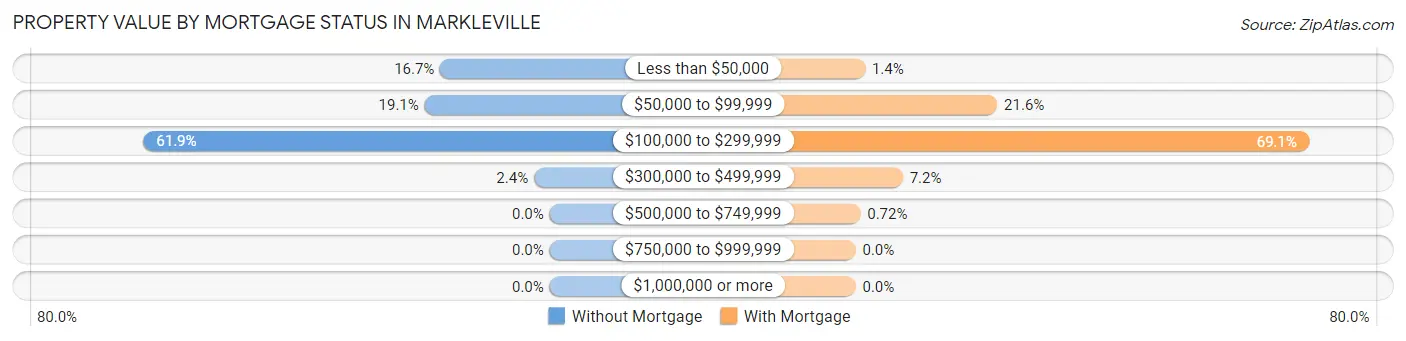
| Property Value | Without Mortgage | With Mortgage |
| Less than $50,000 | 7 (16.7%) | 2 (1.4%) |
| $50,000 to $99,999 | 8 (19.1%) | 30 (21.6%) |
| $100,000 to $299,999 | 26 (61.9%) | 96 (69.1%) |
| $300,000 to $499,999 | 1 (2.4%) | 10 (7.2%) |
| $500,000 to $749,999 | 0 (0.0%) | 1 (0.7%) |
| $750,000 to $999,999 | 0 (0.0%) | 0 (0.0%) |
| $1,000,000 or more | 0 (0.0%) | 0 (0.0%) |
| Total | 42 (100.0%) | 139 (100.0%) |
Household Income by Mortgage Status in Markleville
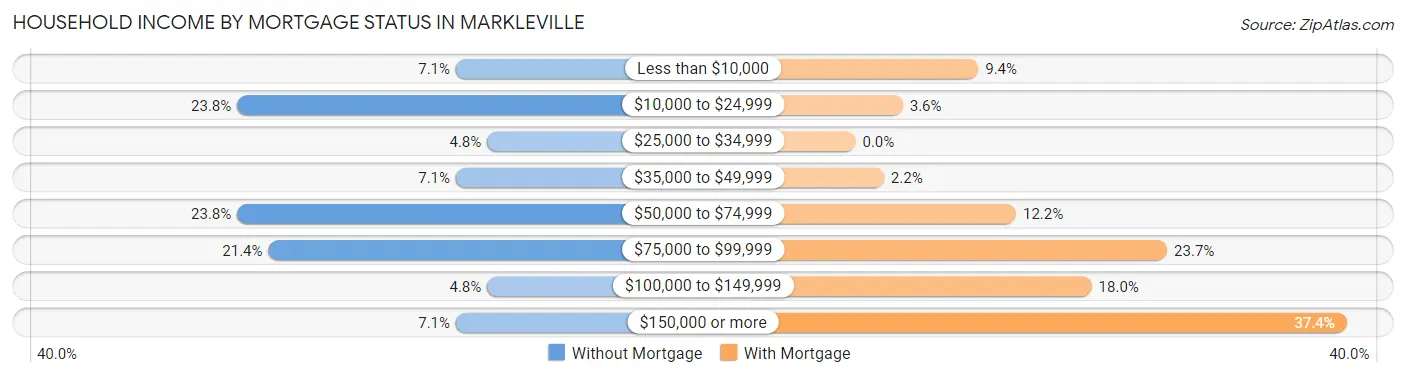
| Household Income | Without Mortgage | With Mortgage |
| Less than $10,000 | 3 (7.1%) | 13 (9.3%) |
| $10,000 to $24,999 | 10 (23.8%) | 5 (3.6%) |
| $25,000 to $34,999 | 2 (4.8%) | 0 (0.0%) |
| $35,000 to $49,999 | 3 (7.1%) | 3 (2.2%) |
| $50,000 to $74,999 | 10 (23.8%) | 17 (12.2%) |
| $75,000 to $99,999 | 9 (21.4%) | 33 (23.7%) |
| $100,000 to $149,999 | 2 (4.8%) | 25 (18.0%) |
| $150,000 or more | 3 (7.1%) | 52 (37.4%) |
| Total | 42 (100.0%) | 139 (100.0%) |
Property Value to Household Income Ratio in Markleville
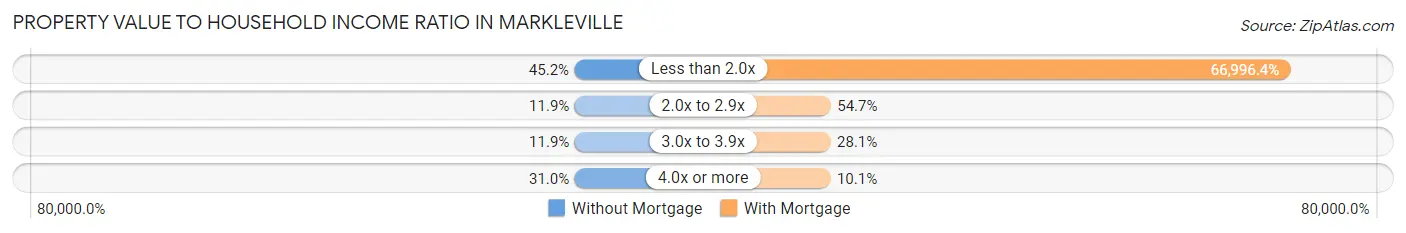
| Value-to-Income Ratio | Without Mortgage | With Mortgage |
| Less than 2.0x | 19 (45.2%) | 93,125 (66,996.4%) |
| 2.0x to 2.9x | 5 (11.9%) | 76 (54.7%) |
| 3.0x to 3.9x | 5 (11.9%) | 39 (28.1%) |
| 4.0x or more | 13 (30.9%) | 14 (10.1%) |
| Total | 42 (100.0%) | 139 (100.0%) |
Real Estate Taxes by Mortgage Status in Markleville
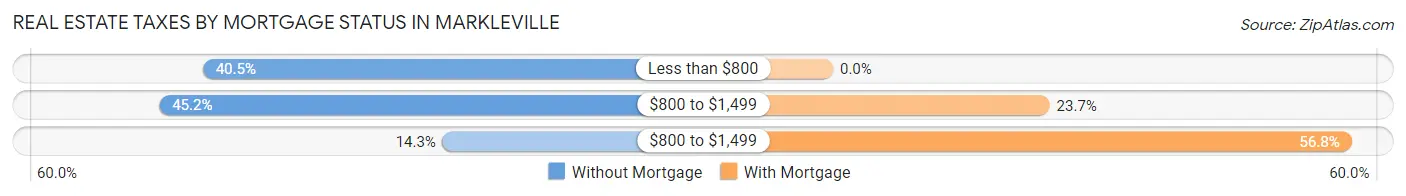
| Property Taxes | Without Mortgage | With Mortgage |
| Less than $800 | 17 (40.5%) | 0 (0.0%) |
| $800 to $1,499 | 19 (45.2%) | 33 (23.7%) |
| $800 to $1,499 | 6 (14.3%) | 79 (56.8%) |
| Total | 42 (100.0%) | 139 (100.0%) |
Health & Disability in Markleville
Health Insurance Coverage by Age in Markleville
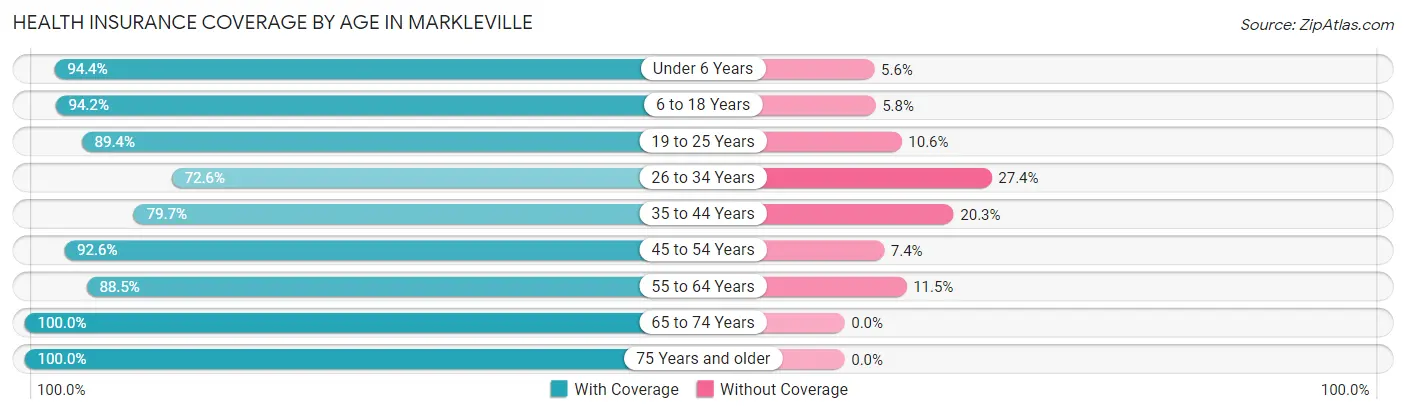
| Age Bracket | With Coverage | Without Coverage |
| Under 6 Years | 51 (94.4%) | 3 (5.6%) |
| 6 to 18 Years | 147 (94.2%) | 9 (5.8%) |
| 19 to 25 Years | 42 (89.4%) | 5 (10.6%) |
| 26 to 34 Years | 45 (72.6%) | 17 (27.4%) |
| 35 to 44 Years | 47 (79.7%) | 12 (20.3%) |
| 45 to 54 Years | 88 (92.6%) | 7 (7.4%) |
| 55 to 64 Years | 46 (88.5%) | 6 (11.5%) |
| 65 to 74 Years | 47 (100.0%) | 0 (0.0%) |
| 75 Years and older | 39 (100.0%) | 0 (0.0%) |
| Total | 552 (90.3%) | 59 (9.7%) |
Health Insurance Coverage by Citizenship Status in Markleville
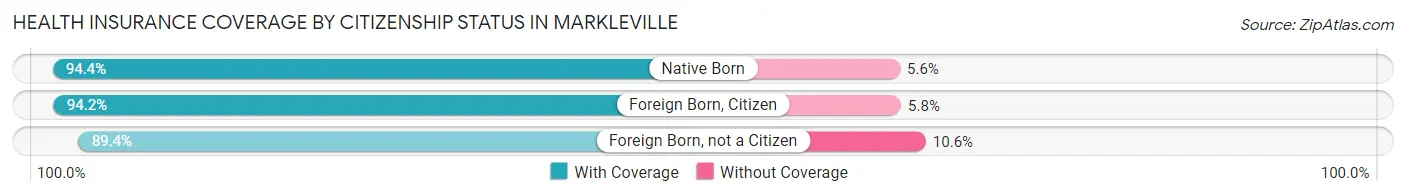
| Citizenship Status | With Coverage | Without Coverage |
| Native Born | 51 (94.4%) | 3 (5.6%) |
| Foreign Born, Citizen | 147 (94.2%) | 9 (5.8%) |
| Foreign Born, not a Citizen | 42 (89.4%) | 5 (10.6%) |
Health Insurance Coverage by Household Income in Markleville
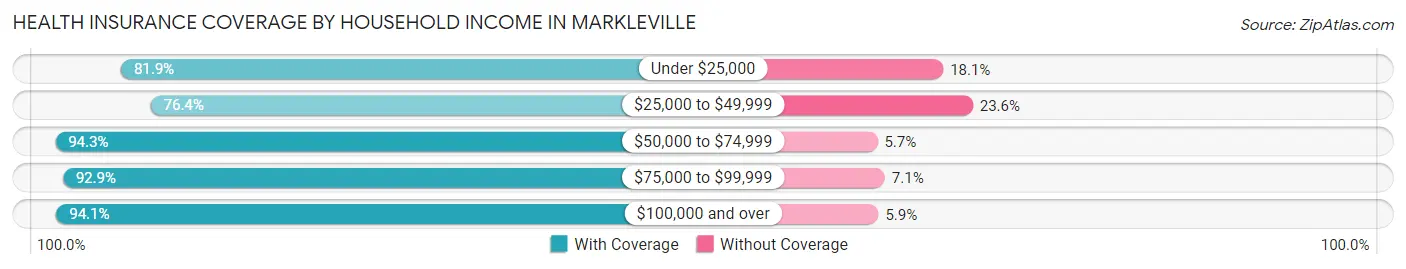
| Household Income | With Coverage | Without Coverage |
| Under $25,000 | 59 (81.9%) | 13 (18.1%) |
| $25,000 to $49,999 | 55 (76.4%) | 17 (23.6%) |
| $50,000 to $74,999 | 115 (94.3%) | 7 (5.7%) |
| $75,000 to $99,999 | 117 (92.9%) | 9 (7.1%) |
| $100,000 and over | 206 (94.1%) | 13 (5.9%) |
Public vs Private Health Insurance Coverage by Age in Markleville
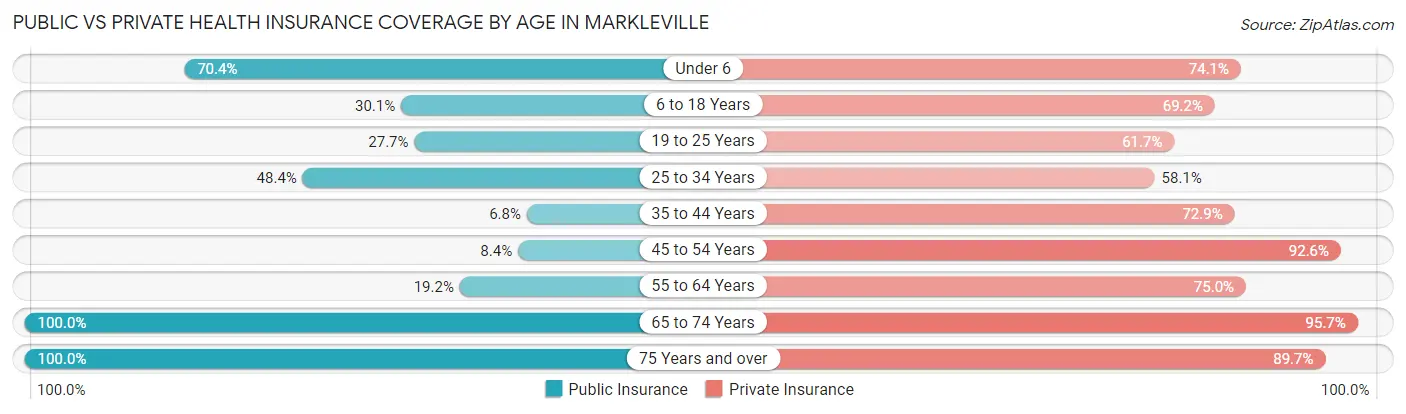
| Age Bracket | Public Insurance | Private Insurance |
| Under 6 | 38 (70.4%) | 40 (74.1%) |
| 6 to 18 Years | 47 (30.1%) | 108 (69.2%) |
| 19 to 25 Years | 13 (27.7%) | 29 (61.7%) |
| 25 to 34 Years | 30 (48.4%) | 36 (58.1%) |
| 35 to 44 Years | 4 (6.8%) | 43 (72.9%) |
| 45 to 54 Years | 8 (8.4%) | 88 (92.6%) |
| 55 to 64 Years | 10 (19.2%) | 39 (75.0%) |
| 65 to 74 Years | 47 (100.0%) | 45 (95.7%) |
| 75 Years and over | 39 (100.0%) | 35 (89.7%) |
| Total | 236 (38.6%) | 463 (75.8%) |
Disability Status by Sex by Age in Markleville
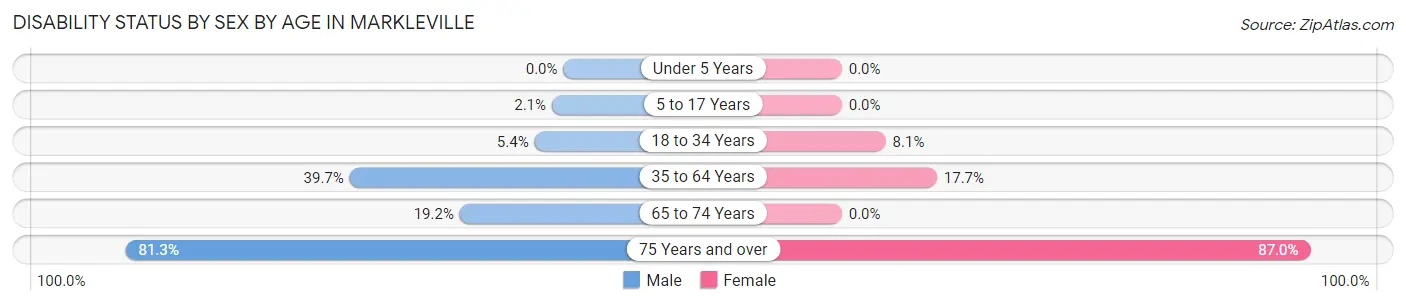
| Age Bracket | Male | Female |
| Under 5 Years | 0 (0.0%) | 0 (0.0%) |
| 5 to 17 Years | 1 (2.1%) | 0 (0.0%) |
| 18 to 34 Years | 3 (5.4%) | 7 (8.1%) |
| 35 to 64 Years | 48 (39.7%) | 15 (17.6%) |
| 65 to 74 Years | 5 (19.2%) | 0 (0.0%) |
| 75 Years and over | 13 (81.2%) | 20 (87.0%) |
Disability Class by Sex by Age in Markleville
Disability Class: Hearing Difficulty
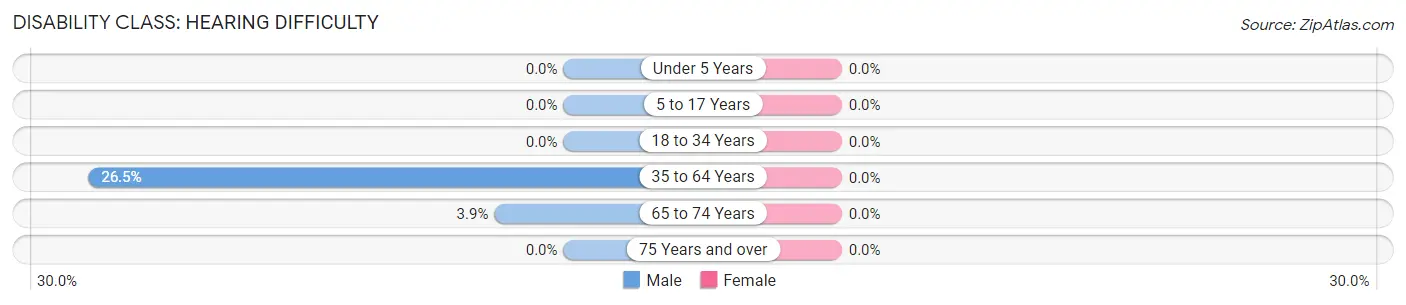
| Age Bracket | Male | Female |
| Under 5 Years | 0 (0.0%) | 0 (0.0%) |
| 5 to 17 Years | 0 (0.0%) | 0 (0.0%) |
| 18 to 34 Years | 0 (0.0%) | 0 (0.0%) |
| 35 to 64 Years | 32 (26.5%) | 0 (0.0%) |
| 65 to 74 Years | 1 (3.8%) | 0 (0.0%) |
| 75 Years and over | 0 (0.0%) | 0 (0.0%) |
Disability Class: Vision Difficulty
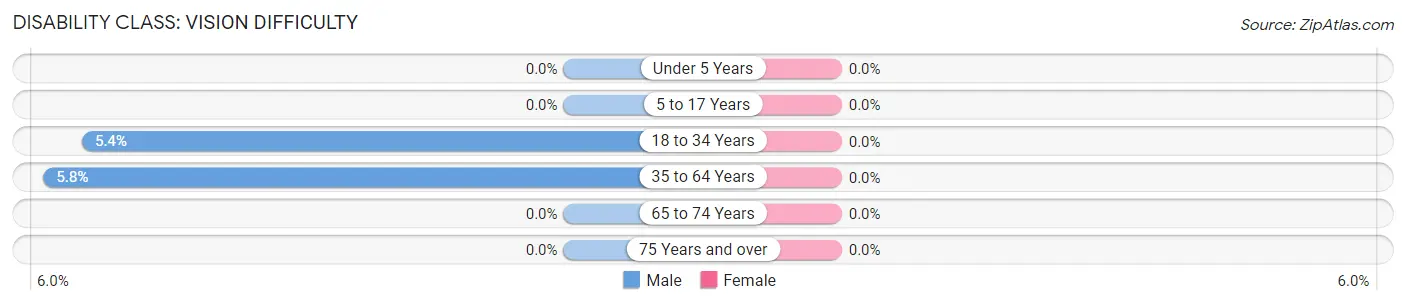
| Age Bracket | Male | Female |
| Under 5 Years | 0 (0.0%) | 0 (0.0%) |
| 5 to 17 Years | 0 (0.0%) | 0 (0.0%) |
| 18 to 34 Years | 3 (5.4%) | 0 (0.0%) |
| 35 to 64 Years | 7 (5.8%) | 0 (0.0%) |
| 65 to 74 Years | 0 (0.0%) | 0 (0.0%) |
| 75 Years and over | 0 (0.0%) | 0 (0.0%) |
Disability Class: Cognitive Difficulty
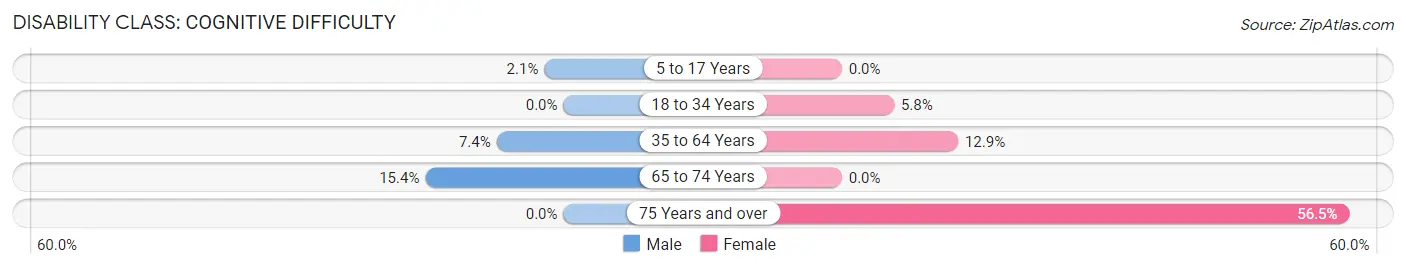
| Age Bracket | Male | Female |
| 5 to 17 Years | 1 (2.1%) | 0 (0.0%) |
| 18 to 34 Years | 0 (0.0%) | 5 (5.8%) |
| 35 to 64 Years | 9 (7.4%) | 11 (12.9%) |
| 65 to 74 Years | 4 (15.4%) | 0 (0.0%) |
| 75 Years and over | 0 (0.0%) | 13 (56.5%) |
Disability Class: Ambulatory Difficulty
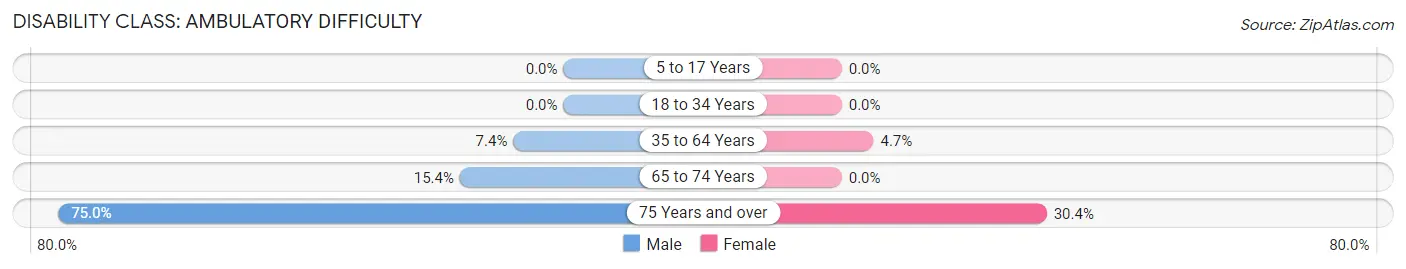
| Age Bracket | Male | Female |
| 5 to 17 Years | 0 (0.0%) | 0 (0.0%) |
| 18 to 34 Years | 0 (0.0%) | 0 (0.0%) |
| 35 to 64 Years | 9 (7.4%) | 4 (4.7%) |
| 65 to 74 Years | 4 (15.4%) | 0 (0.0%) |
| 75 Years and over | 12 (75.0%) | 7 (30.4%) |
Disability Class: Self-Care Difficulty
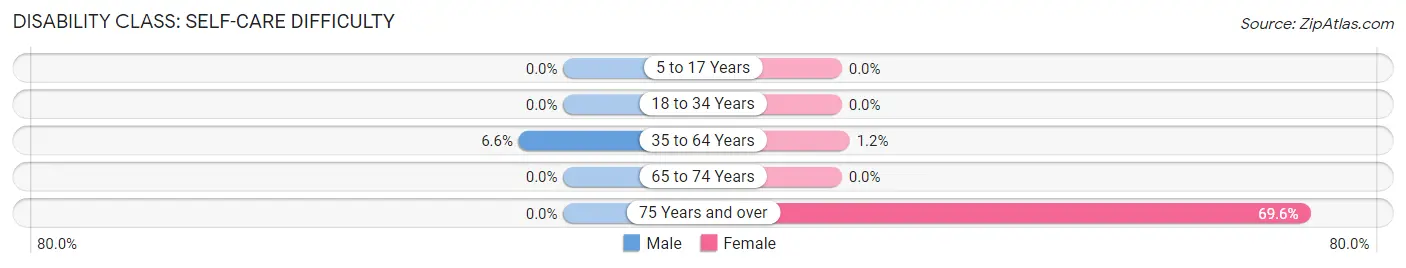
| Age Bracket | Male | Female |
| 5 to 17 Years | 0 (0.0%) | 0 (0.0%) |
| 18 to 34 Years | 0 (0.0%) | 0 (0.0%) |
| 35 to 64 Years | 8 (6.6%) | 1 (1.2%) |
| 65 to 74 Years | 0 (0.0%) | 0 (0.0%) |
| 75 Years and over | 0 (0.0%) | 16 (69.6%) |
Technology Access in Markleville
Computing Device Access in Markleville
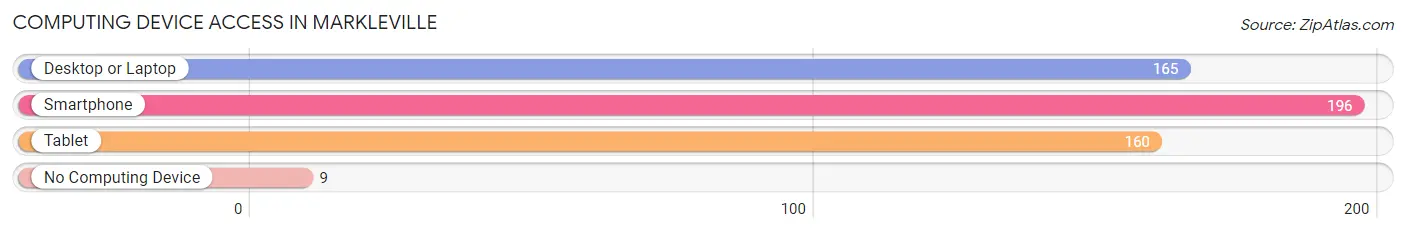
| Device Type | # Households | % Households |
| Desktop or Laptop | 165 | 77.1% |
| Smartphone | 196 | 91.6% |
| Tablet | 160 | 74.8% |
| No Computing Device | 9 | 4.2% |
| Total | 214 | 100.0% |
Internet Access in Markleville
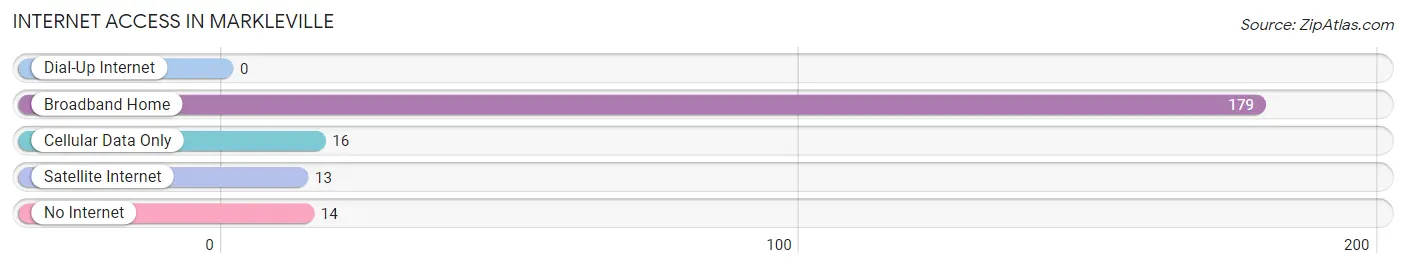
| Internet Type | # Households | % Households |
| Dial-Up Internet | 0 | 0.0% |
| Broadband Home | 179 | 83.6% |
| Cellular Data Only | 16 | 7.5% |
| Satellite Internet | 13 | 6.1% |
| No Internet | 14 | 6.5% |
| Total | 214 | 100.0% |
Markleville Summary
Markleville, Indiana is a small town located in Madison County, Indiana. It is situated in the east-central part of the state, about 25 miles northeast of Indianapolis. The town was founded in 1837 and named after the Markle family, who were early settlers in the area. As of the 2010 census, the population of Markleville was 1,046.
Geography
Markleville is located at 39°51'25"N 85°45'45"W (39.856944, -85.762500). It is situated in the east-central part of the state, about 25 miles northeast of Indianapolis. The town is located in the White River Valley, which is part of the Central Till Plains region of Indiana. The town is surrounded by rolling hills and farmland. The nearest major city is Anderson, which is about 15 miles to the south.
Climate
Markleville has a humid continental climate, with hot summers and cold winters. The average annual temperature is around 54°F (12°C). The average high temperature in the summer is around 86°F (30°C), and the average low temperature in the winter is around 24°F (-4°C). The average annual precipitation is around 40 inches (101 cm).
Demographics
As of the 2010 census, the population of Markleville was 1,046. The racial makeup of the town was 97.2% White, 0.7% African American, 0.2% Native American, 0.3% Asian, 0.2% from other races, and 1.5% from two or more races. Hispanic or Latino of any race were 0.7% of the population.
Economy
Markleville is a small, rural town with a primarily agricultural economy. The town is home to several small businesses, including a grocery store, a hardware store, and a few restaurants. The town is also home to a few manufacturing companies, including a plastics manufacturer and a metal fabrication company.
The town is also home to a few farms, which produce corn, soybeans, and hay. The town is also home to a few wineries, which produce a variety of wines.
History
Markleville was founded in 1837 and named after the Markle family, who were early settlers in the area. The town was originally a farming community, and the first post office was established in 1838.
In the late 19th century, the town began to grow and develop. The first school was built in 1876, and the first bank was established in 1883. The town was incorporated in 1891.
In the early 20th century, the town continued to grow and develop. The first telephone service was established in 1906, and the first electric service was established in 1910. The town also had a newspaper, the Markleville Herald, which was published from 1910 to 1915.
In the late 20th century, the town continued to grow and develop. The first sewer system was installed in the 1970s, and the first water treatment plant was built in the 1980s. The town also had a library, which was built in the 1990s.
Today, Markleville is a small, rural town with a primarily agricultural economy. The town is home to several small businesses, including a grocery store, a hardware store, and a few restaurants. The town is also home to a few manufacturing companies, including a plastics manufacturer and a metal fabrication company. The town is also home to a few farms, which produce corn, soybeans, and hay. The town is also home to a few wineries, which produce a variety of wines.
Common Questions
What is Per Capita Income in Markleville?
Per Capita income in Markleville is $25,890.
What is the Median Family Income in Markleville?
Median Family Income in Markleville is $82,321.
What is the Median Household income in Markleville?
Median Household Income in Markleville is $74,167.
What is Income or Wage Gap in Markleville?
Income or Wage Gap in Markleville is 34.7%.
Women in Markleville earn 65.3 cents for every dollar earned by a man.
What is Family Income Deficit in Markleville?
Family Income Deficit in Markleville is $13,979.
Families that are below poverty line in Markleville earn $13,979 less on average than the poverty threshold level.
What is Inequality or Gini Index in Markleville?
Inequality or Gini Index in Markleville is 0.33.
What is the Total Population of Markleville?
Total Population of Markleville is 611.
What is the Total Male Population of Markleville?
Total Male Population of Markleville is 294.
What is the Total Female Population of Markleville?
Total Female Population of Markleville is 317.
What is the Ratio of Males per 100 Females in Markleville?
There are 92.74 Males per 100 Females in Markleville.
What is the Ratio of Females per 100 Males in Markleville?
There are 107.82 Females per 100 Males in Markleville.
What is the Median Population Age in Markleville?
Median Population Age in Markleville is 33.6 Years.
What is the Average Family Size in Markleville
Average Family Size in Markleville is 3.1 People.
What is the Average Household Size in Markleville
Average Household Size in Markleville is 2.9 People.
How Large is the Labor Force in Markleville?
There are 335 People in the Labor Forcein in Markleville.
What is the Percentage of People in the Labor Force in Markleville?
75.3% of People are in the Labor Force in Markleville.
What is the Unemployment Rate in Markleville?
Unemployment Rate in Markleville is 6.6%.