Jacumba, CA Map & Demographics
Jacumba Map
Jacumba Overview
$22,361
PER CAPITA INCOME
50.0%
WAGE / INCOME GAP [ % ]
50.0¢/ $1
WAGE / INCOME GAP [ $ ]
0.44
INEQUALITY / GINI INDEX
857
TOTAL POPULATION
516
MALE POPULATION
341
FEMALE POPULATION
151.32
MALES / 100 FEMALES
66.09
FEMALES / 100 MALES
62.4
MEDIAN AGE
2.8
AVG FAMILY SIZE
2.5
AVG HOUSEHOLD SIZE
421
LABOR FORCE [ PEOPLE ]
49.1%
PERCENT IN LABOR FORCE
20.9%
UNEMPLOYMENT RATE
Jacumba Zip Codes
Jacumba Area Codes
Income in Jacumba
Income Overview in Jacumba
| Characteristic | Number | Measure |
| Per Capita Income | 857 | $22,361 |
| Median Family Income | 271 | $0 |
| Mean Family Income | 271 | $49,700 |
| Median Household Income | 345 | $0 |
| Mean Household Income | 345 | $50,180 |
| Income Deficit | 271 | $0 |
| Wage / Income Gap (%) | 857 | 50.00% |
| Wage / Income Gap ($) | 857 | 50.00¢ per $1 |
| Gini / Inequality Index | 857 | 0.44 |
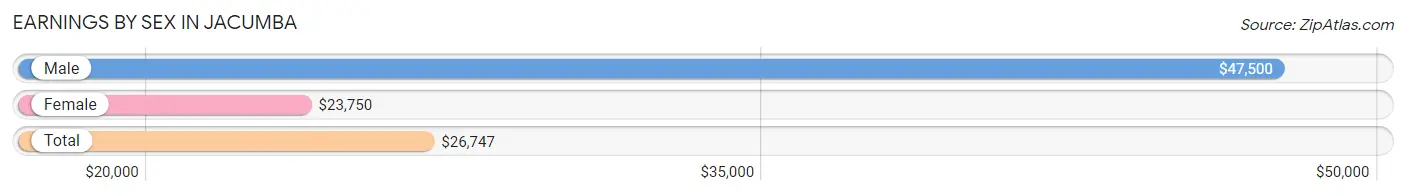
Earnings by Sex in Jacumba
Average Earnings in Jacumba are $26,747, $47,500 for men and $23,750 for women, a difference of 50.0%.
| Sex | Number | Average Earnings |
| Male | 242 (57.5%) | $47,500 |
| Female | 179 (42.5%) | $23,750 |
| Total | 421 (100.0%) | $26,747 |
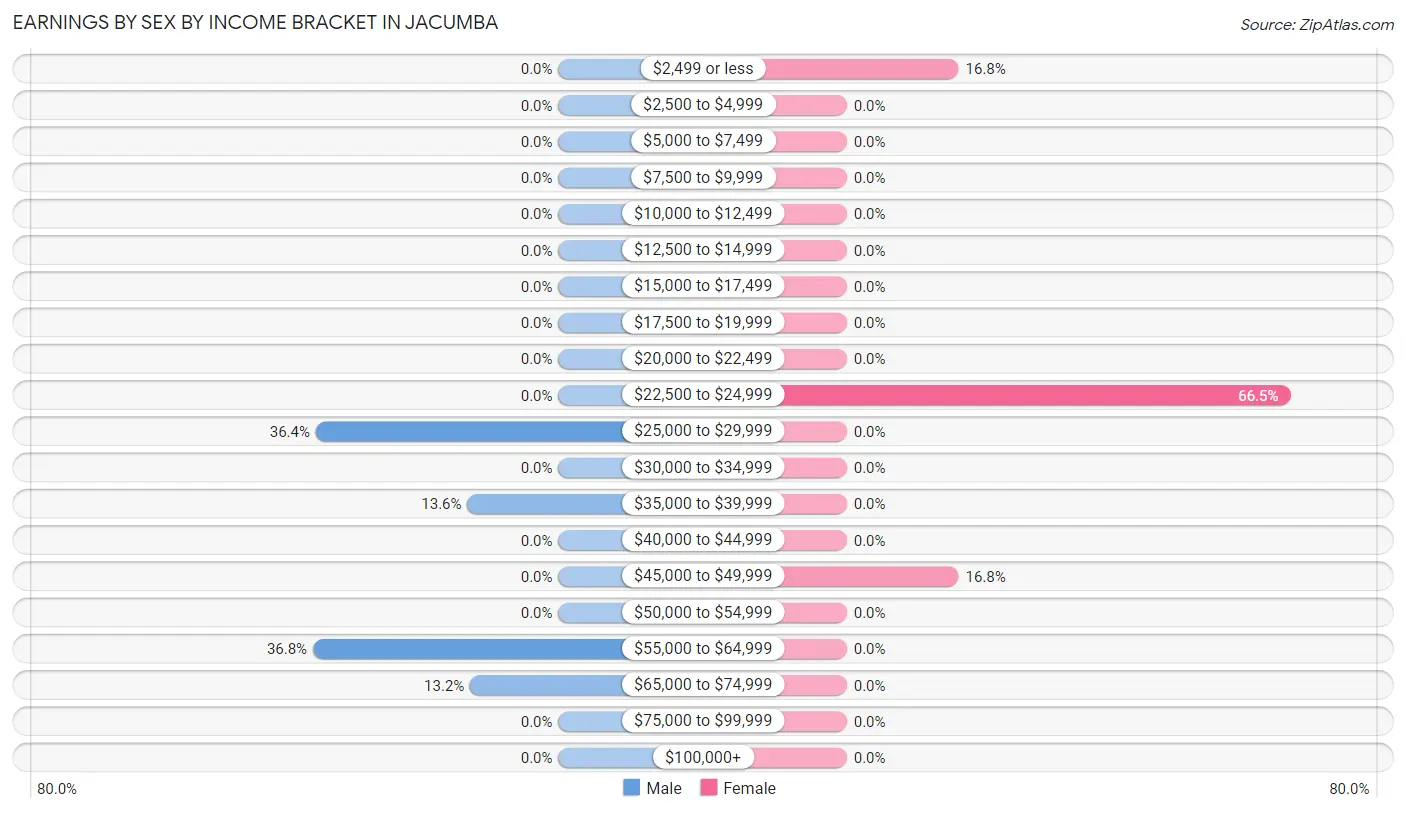
Earnings by Sex by Income Bracket in Jacumba
The most common earnings brackets in Jacumba are $55,000 to $64,999 for men (89 | 36.8%) and $22,500 to $24,999 for women (119 | 66.5%).
| Income | Male | Female |
| $2,499 or less | 0 (0.0%) | 30 (16.8%) |
| $2,500 to $4,999 | 0 (0.0%) | 0 (0.0%) |
| $5,000 to $7,499 | 0 (0.0%) | 0 (0.0%) |
| $7,500 to $9,999 | 0 (0.0%) | 0 (0.0%) |
| $10,000 to $12,499 | 0 (0.0%) | 0 (0.0%) |
| $12,500 to $14,999 | 0 (0.0%) | 0 (0.0%) |
| $15,000 to $17,499 | 0 (0.0%) | 0 (0.0%) |
| $17,500 to $19,999 | 0 (0.0%) | 0 (0.0%) |
| $20,000 to $22,499 | 0 (0.0%) | 0 (0.0%) |
| $22,500 to $24,999 | 0 (0.0%) | 119 (66.5%) |
| $25,000 to $29,999 | 88 (36.4%) | 0 (0.0%) |
| $30,000 to $34,999 | 0 (0.0%) | 0 (0.0%) |
| $35,000 to $39,999 | 33 (13.6%) | 0 (0.0%) |
| $40,000 to $44,999 | 0 (0.0%) | 0 (0.0%) |
| $45,000 to $49,999 | 0 (0.0%) | 30 (16.8%) |
| $50,000 to $54,999 | 0 (0.0%) | 0 (0.0%) |
| $55,000 to $64,999 | 89 (36.8%) | 0 (0.0%) |
| $65,000 to $74,999 | 32 (13.2%) | 0 (0.0%) |
| $75,000 to $99,999 | 0 (0.0%) | 0 (0.0%) |
| $100,000+ | 0 (0.0%) | 0 (0.0%) |
| Total | 242 (100.0%) | 179 (100.0%) |
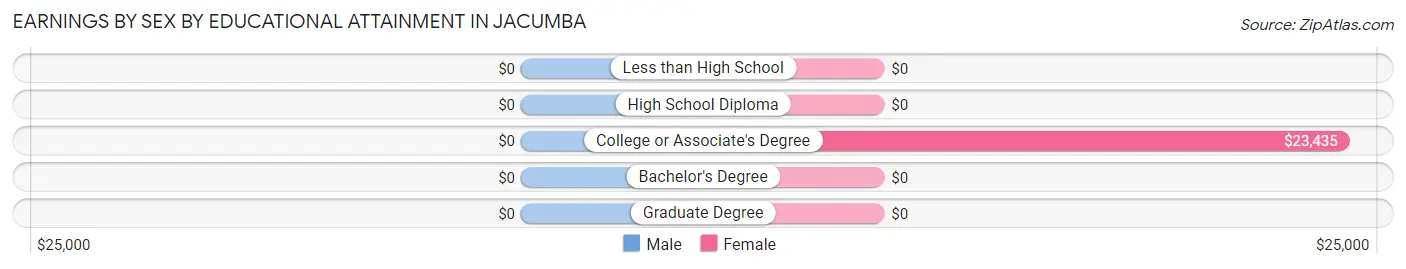
Earnings by Sex by Educational Attainment in Jacumba
| Educational Attainment | Male Income | Female Income |
| Less than High School | - | - |
| High School Diploma | - | - |
| College or Associate's Degree | - | - |
| Bachelor's Degree | - | - |
| Graduate Degree | - | - |
| Total | $56,236 | $23,750 |
Family Income in Jacumba
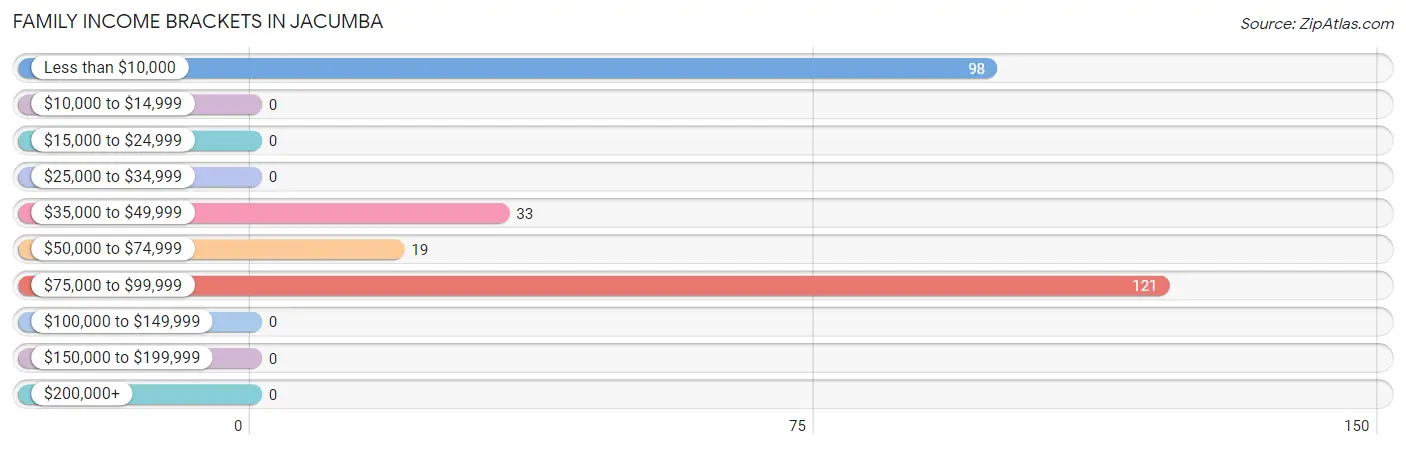
Family Income Brackets in Jacumba
According to the Jacumba family income data, there are 121 families falling into the $75,000 to $99,999 income range, which is the most common income bracket and makes up 44.7% of all families.
| Income Bracket | # Families | % Families |
| Less than $10,000 | 98 | 36.2% |
| $10,000 to $14,999 | 0 | 0.0% |
| $15,000 to $24,999 | 0 | 0.0% |
| $25,000 to $34,999 | 0 | 0.0% |
| $35,000 to $49,999 | 33 | 12.2% |
| $50,000 to $74,999 | 19 | 7.0% |
| $75,000 to $99,999 | 121 | 44.6% |
| $100,000 to $149,999 | 0 | 0.0% |
| $150,000 to $199,999 | 0 | 0.0% |
| $200,000+ | 0 | 0.0% |
Family Income by Famaliy Size in Jacumba
| Income Bracket | # Families | Median Income |
| 2-Person Families | 239 (88.2%) | $0 |
| 3-Person Families | 32 (11.8%) | $0 |
| 4-Person Families | 0 (0.0%) | $0 |
| 5-Person Families | 0 (0.0%) | $0 |
| 6-Person Families | 0 (0.0%) | $0 |
| 7+ Person Families | 0 (0.0%) | $0 |
| Total | 271 (100.0%) | $0 |
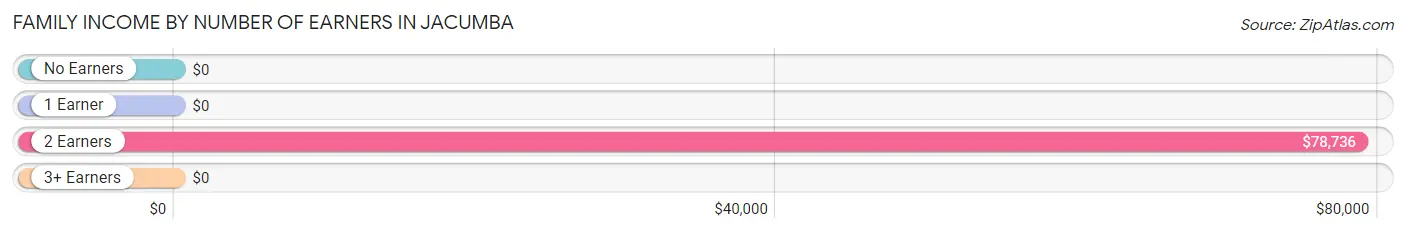
Family Income by Number of Earners in Jacumba
| Number of Earners | # Families | Median Income |
| No Earners | 98 (36.2%) | $0 |
| 1 Earner | 19 (7.0%) | $0 |
| 2 Earners | 154 (56.8%) | $78,736 |
| 3+ Earners | 0 (0.0%) | $0 |
| Total | 271 (100.0%) | $0 |
Household Income in Jacumba
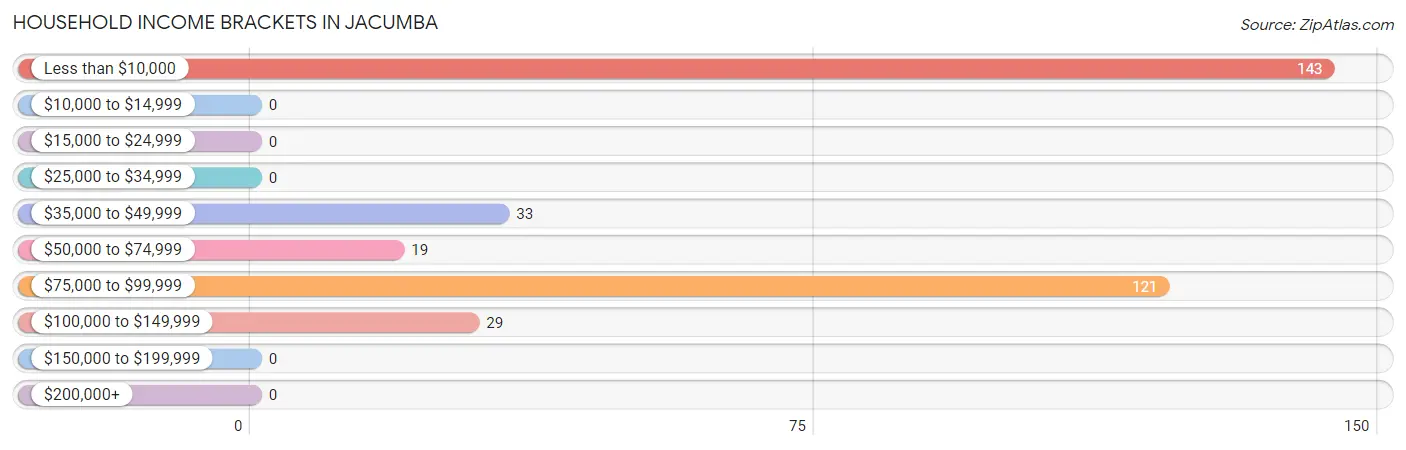
Household Income Brackets in Jacumba
With 143 households falling in the category, the less than $10,000 income range is the most frequent in Jacumba, accounting for 41.4% of all households.
| Income Bracket | # Households | % Households |
| Less than $10,000 | 143 | 41.4% |
| $10,000 to $14,999 | 0 | 0.0% |
| $15,000 to $24,999 | 0 | 0.0% |
| $25,000 to $34,999 | 0 | 0.0% |
| $35,000 to $49,999 | 33 | 9.6% |
| $50,000 to $74,999 | 19 | 5.5% |
| $75,000 to $99,999 | 121 | 35.1% |
| $100,000 to $149,999 | 29 | 8.4% |
| $150,000 to $199,999 | 0 | 0.0% |
| $200,000+ | 0 | 0.0% |
Household Income by Householder Age in Jacumba
The median household income in Jacumba is $0, with the highest median household income of $79,143 found in the 45 to 64 years age bracket for the primary householder. A total of 183 households (53.0%) fall into this category.
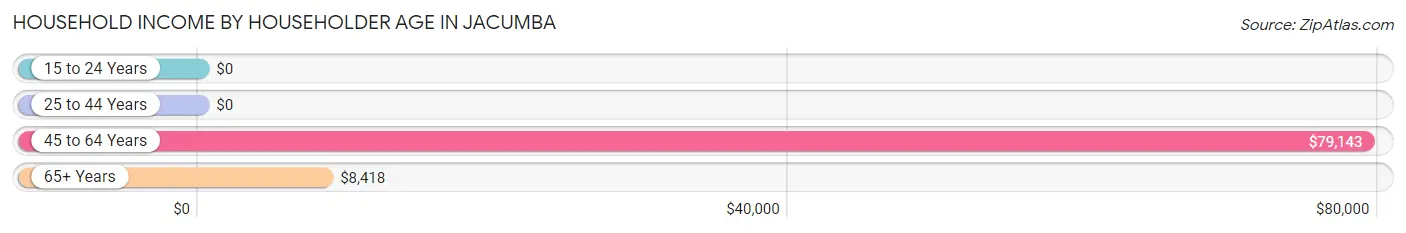
| Income Bracket | # Households | Median Income |
| 15 to 24 Years | 0 (0.0%) | $0 |
| 25 to 44 Years | 0 (0.0%) | $0 |
| 45 to 64 Years | 183 (53.0%) | $79,143 |
| 65+ Years | 162 (47.0%) | $8,418 |
| Total | 345 (100.0%) | $0 |
Poverty in Jacumba
Income Below Poverty by Sex and Age in Jacumba
With 41.1% poverty level for males and 41.9% for females among the residents of Jacumba, 55 to 64 year old males and 65 to 74 year old females are the most vulnerable to poverty, with 212 males (64.2%) and 143 females (88.3%) in their respective age groups living below the poverty level.
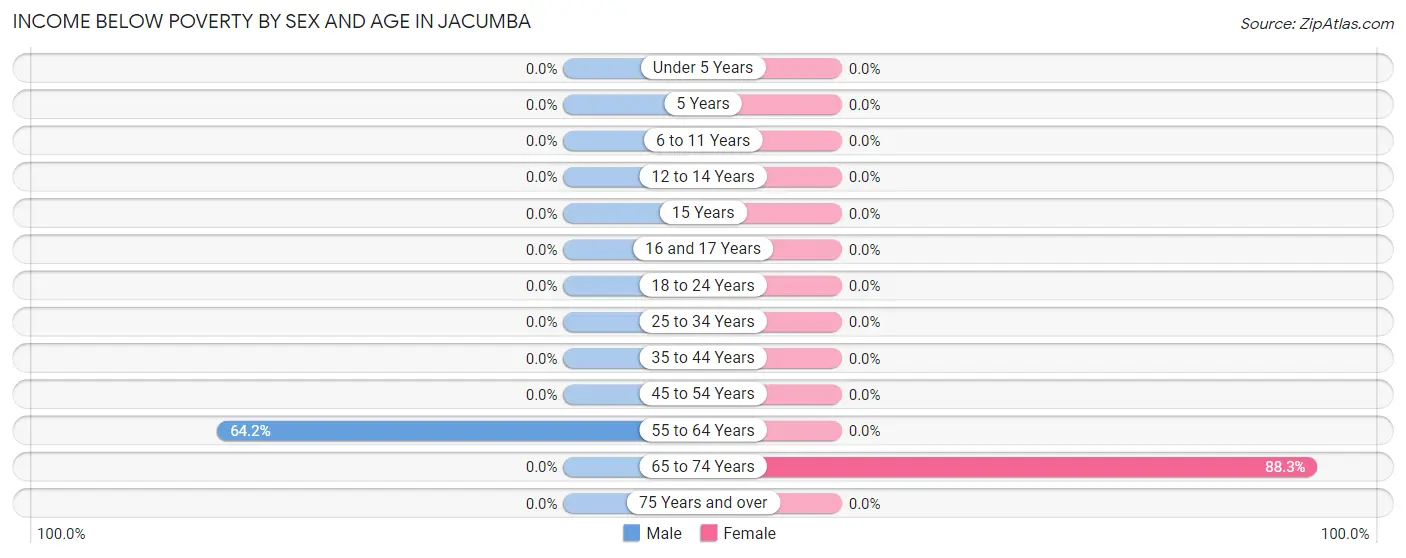
| Age Bracket | Male | Female |
| Under 5 Years | 0 (0.0%) | 0 (0.0%) |
| 5 Years | 0 (0.0%) | 0 (0.0%) |
| 6 to 11 Years | 0 (0.0%) | 0 (0.0%) |
| 12 to 14 Years | 0 (0.0%) | 0 (0.0%) |
| 15 Years | 0 (0.0%) | 0 (0.0%) |
| 16 and 17 Years | 0 (0.0%) | 0 (0.0%) |
| 18 to 24 Years | 0 (0.0%) | 0 (0.0%) |
| 25 to 34 Years | 0 (0.0%) | 0 (0.0%) |
| 35 to 44 Years | 0 (0.0%) | 0 (0.0%) |
| 45 to 54 Years | 0 (0.0%) | 0 (0.0%) |
| 55 to 64 Years | 212 (64.2%) | 0 (0.0%) |
| 65 to 74 Years | 0 (0.0%) | 143 (88.3%) |
| 75 Years and over | 0 (0.0%) | 0 (0.0%) |
| Total | 212 (41.1%) | 143 (41.9%) |
Income Above Poverty by Sex and Age in Jacumba
According to the poverty statistics in Jacumba, males aged 16 and 17 years and females aged 35 to 44 years are the age groups that are most secure financially, with 100.0% of males and 100.0% of females in these age groups living above the poverty line.
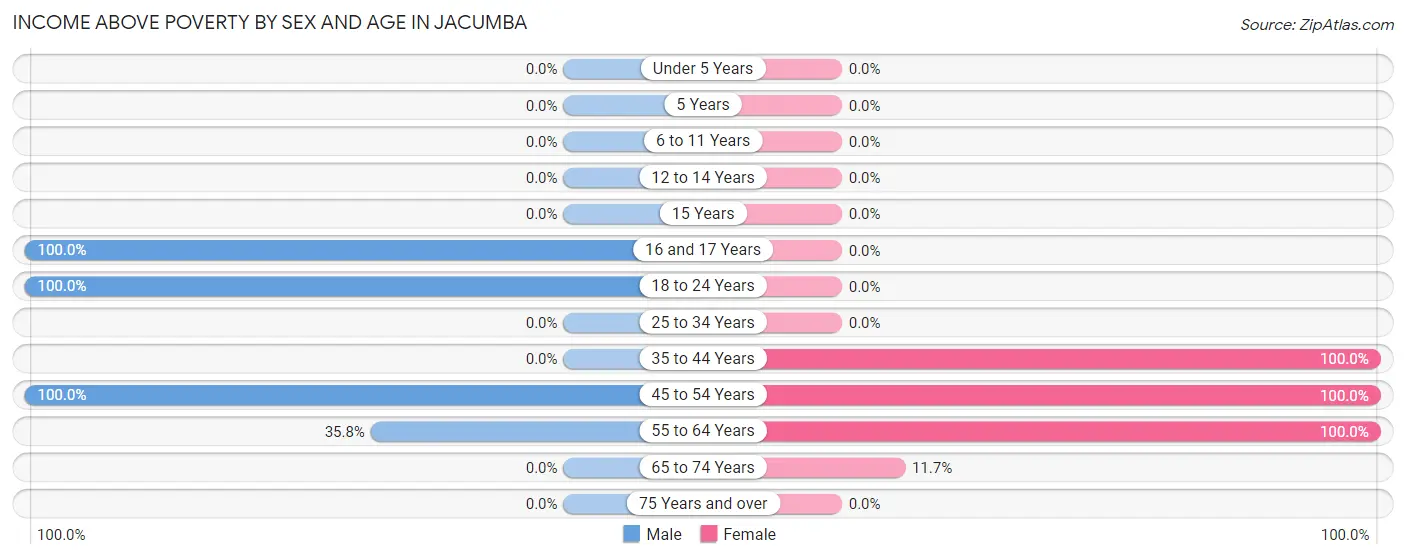
| Age Bracket | Male | Female |
| Under 5 Years | 0 (0.0%) | 0 (0.0%) |
| 5 Years | 0 (0.0%) | 0 (0.0%) |
| 6 to 11 Years | 0 (0.0%) | 0 (0.0%) |
| 12 to 14 Years | 0 (0.0%) | 0 (0.0%) |
| 15 Years | 0 (0.0%) | 0 (0.0%) |
| 16 and 17 Years | 33 (100.0%) | 0 (0.0%) |
| 18 to 24 Years | 88 (100.0%) | 0 (0.0%) |
| 25 to 34 Years | 0 (0.0%) | 0 (0.0%) |
| 35 to 44 Years | 0 (0.0%) | 30 (100.0%) |
| 45 to 54 Years | 65 (100.0%) | 30 (100.0%) |
| 55 to 64 Years | 118 (35.8%) | 119 (100.0%) |
| 65 to 74 Years | 0 (0.0%) | 19 (11.7%) |
| 75 Years and over | 0 (0.0%) | 0 (0.0%) |
| Total | 304 (58.9%) | 198 (58.1%) |
Income Below Poverty Among Married-Couple Families in Jacumba
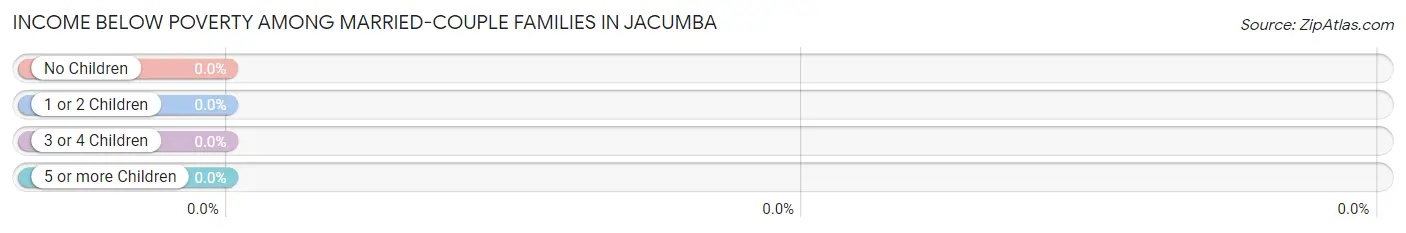
| Children | Above Poverty | Below Poverty |
| No Children | 122 (100.0%) | 0 (0.0%) |
| 1 or 2 Children | 32 (100.0%) | 0 (0.0%) |
| 3 or 4 Children | 0 (0.0%) | 0 (0.0%) |
| 5 or more Children | 0 (0.0%) | 0 (0.0%) |
| Total | 154 (100.0%) | 0 (0.0%) |
Income Below Poverty Among Single-Parent Households in Jacumba
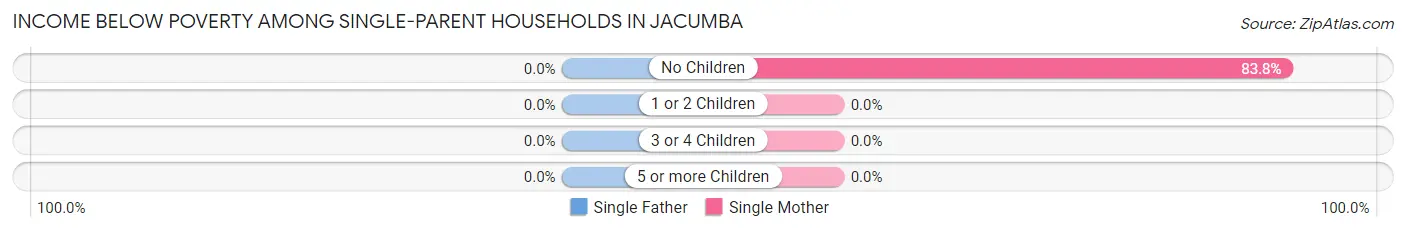
| Children | Single Father | Single Mother |
| No Children | 0 (0.0%) | 98 (83.8%) |
| 1 or 2 Children | 0 (0.0%) | 0 (0.0%) |
| 3 or 4 Children | 0 (0.0%) | 0 (0.0%) |
| 5 or more Children | 0 (0.0%) | 0 (0.0%) |
| Total | 0 (0.0%) | 98 (83.8%) |
Income Below Poverty Among Married-Couple vs Single-Parent Households in Jacumba
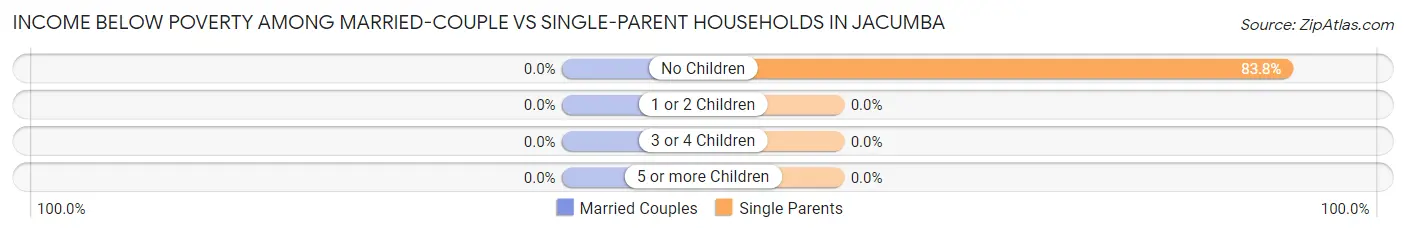
| Children | Married-Couple Families | Single-Parent Households |
| No Children | 0 (0.0%) | 98 (83.8%) |
| 1 or 2 Children | 0 (0.0%) | 0 (0.0%) |
| 3 or 4 Children | 0 (0.0%) | 0 (0.0%) |
| 5 or more Children | 0 (0.0%) | 0 (0.0%) |
| Total | 0 (0.0%) | 98 (83.8%) |
Race in Jacumba
The most populous races in Jacumba are White / Caucasian (769 | 89.7%), Hispanic or Latino (435 | 50.8%), and Two or more Races (88 | 10.3%).
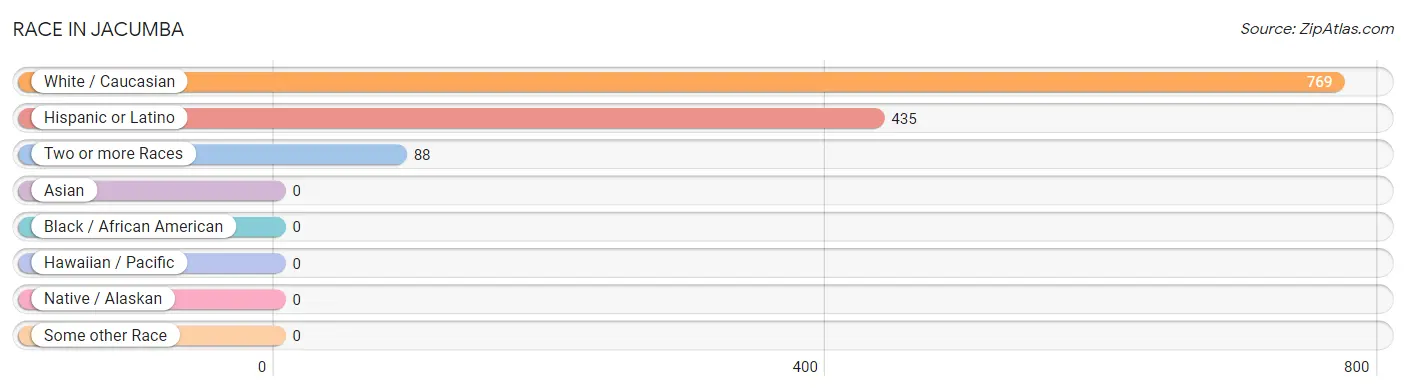
| Race | # Population | % Population |
| Asian | 0 | 0.0% |
| Black / African American | 0 | 0.0% |
| Hawaiian / Pacific | 0 | 0.0% |
| Hispanic or Latino | 435 | 50.8% |
| Native / Alaskan | 0 | 0.0% |
| White / Caucasian | 769 | 89.7% |
| Two or more Races | 88 | 10.3% |
| Some other Race | 0 | 0.0% |
| Total | 857 | 100.0% |
Ancestry in Jacumba
The most populous ancestries reported in Jacumba are Mexican (435 | 50.8%), English (232 | 27.1%), Irish (137 | 16.0%), Italian (89 | 10.4%), and German (63 | 7.3%), together accounting for 111.6% of all Jacumba residents.
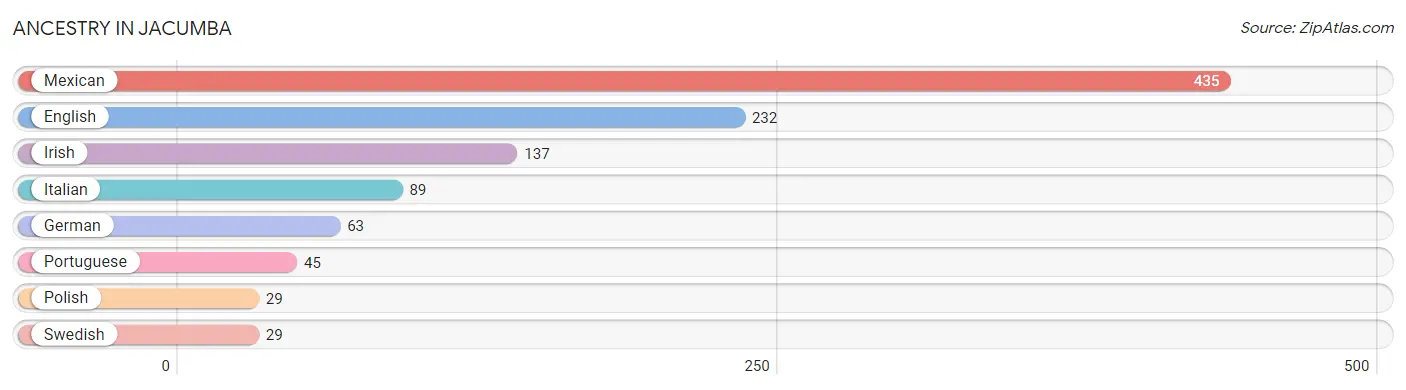
| Ancestry | # Population | % Population |
| English | 232 | 27.1% |
| German | 63 | 7.3% |
| Irish | 137 | 16.0% |
| Italian | 89 | 10.4% |
| Mexican | 435 | 50.8% |
| Polish | 29 | 3.4% |
| Portuguese | 45 | 5.2% |
| Swedish | 29 | 3.4% | View All 8 Rows |
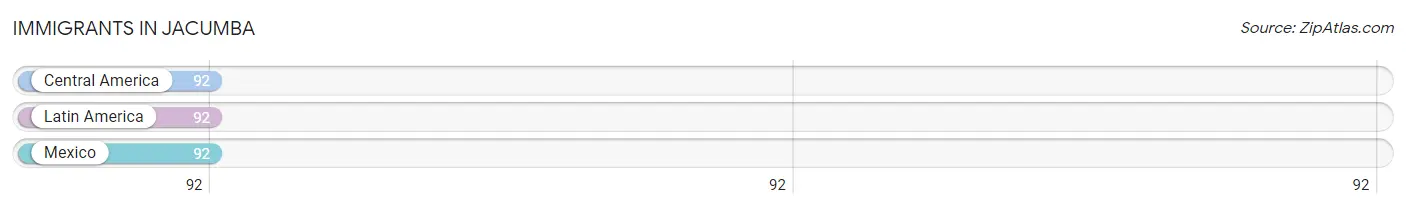
Immigrants in Jacumba
The most numerous immigrant groups reported in Jacumba came from Central America (92 | 10.7%), Latin America (92 | 10.7%), and Mexico (92 | 10.7%), together accounting for 32.2% of all Jacumba residents.
| Immigration Origin | # Population | % Population |
| Central America | 92 | 10.7% |
| Latin America | 92 | 10.7% |
| Mexico | 92 | 10.7% | View All 3 Rows |
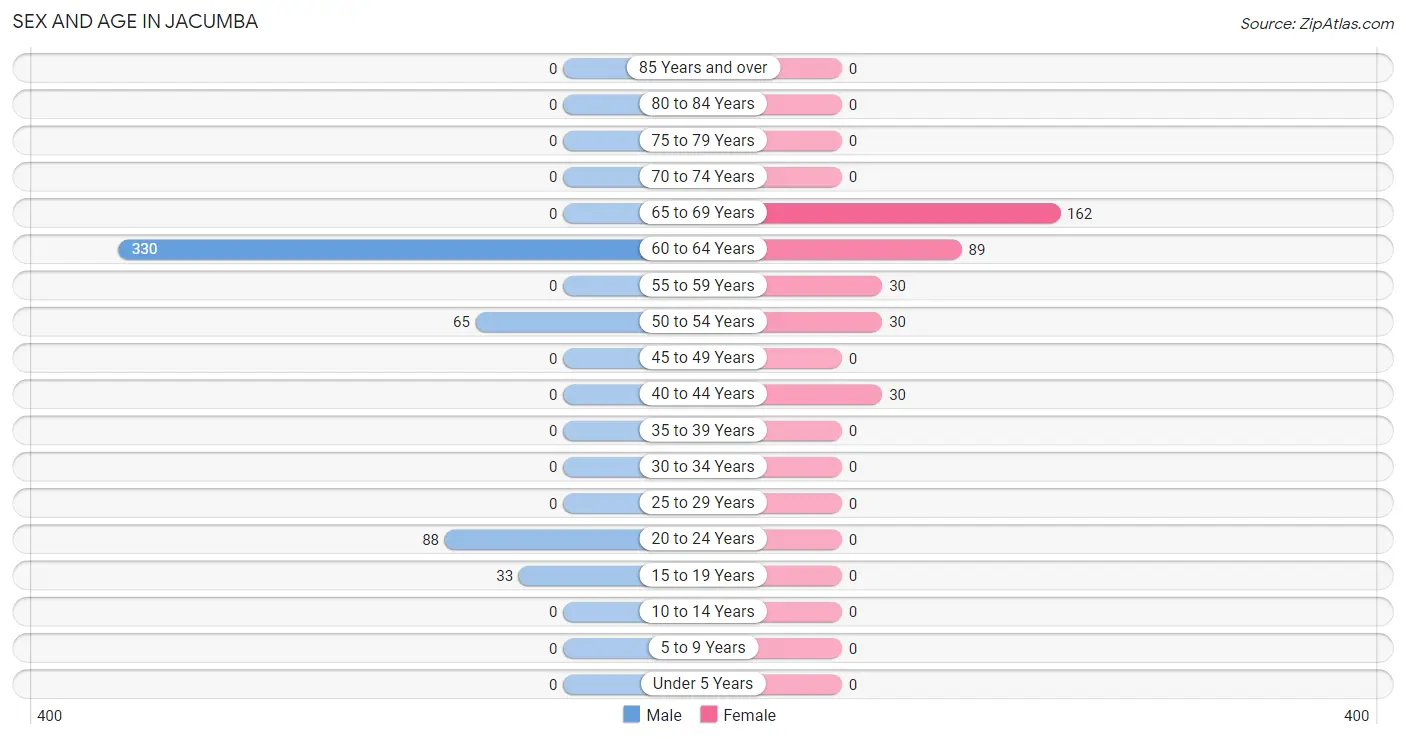
Sex and Age in Jacumba
Sex and Age in Jacumba
The most populous age groups in Jacumba are 60 to 64 Years (330 | 63.9%) for men and 65 to 69 Years (162 | 47.5%) for women.
| Age Bracket | Male | Female |
| Under 5 Years | 0 (0.0%) | 0 (0.0%) |
| 5 to 9 Years | 0 (0.0%) | 0 (0.0%) |
| 10 to 14 Years | 0 (0.0%) | 0 (0.0%) |
| 15 to 19 Years | 33 (6.4%) | 0 (0.0%) |
| 20 to 24 Years | 88 (17.1%) | 0 (0.0%) |
| 25 to 29 Years | 0 (0.0%) | 0 (0.0%) |
| 30 to 34 Years | 0 (0.0%) | 0 (0.0%) |
| 35 to 39 Years | 0 (0.0%) | 0 (0.0%) |
| 40 to 44 Years | 0 (0.0%) | 30 (8.8%) |
| 45 to 49 Years | 0 (0.0%) | 0 (0.0%) |
| 50 to 54 Years | 65 (12.6%) | 30 (8.8%) |
| 55 to 59 Years | 0 (0.0%) | 30 (8.8%) |
| 60 to 64 Years | 330 (63.9%) | 89 (26.1%) |
| 65 to 69 Years | 0 (0.0%) | 162 (47.5%) |
| 70 to 74 Years | 0 (0.0%) | 0 (0.0%) |
| 75 to 79 Years | 0 (0.0%) | 0 (0.0%) |
| 80 to 84 Years | 0 (0.0%) | 0 (0.0%) |
| 85 Years and over | 0 (0.0%) | 0 (0.0%) |
| Total | 516 (100.0%) | 341 (100.0%) |
Families and Households in Jacumba
Median Family Size in Jacumba
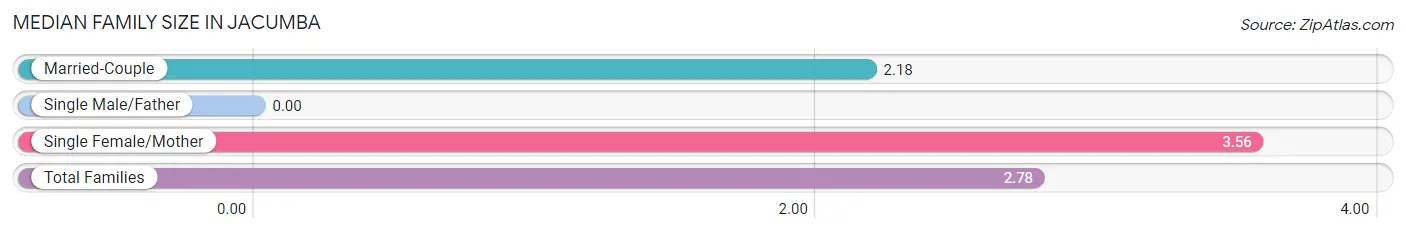
| Family Type | # Families | Family Size |
| Married-Couple | 154 (56.8%) | 2.18 |
| Single Male/Father | 0 (0.0%) | - |
| Single Female/Mother | 117 (43.2%) | 3.56 |
| Total Families | 271 (100.0%) | 2.78 |
Median Household Size in Jacumba
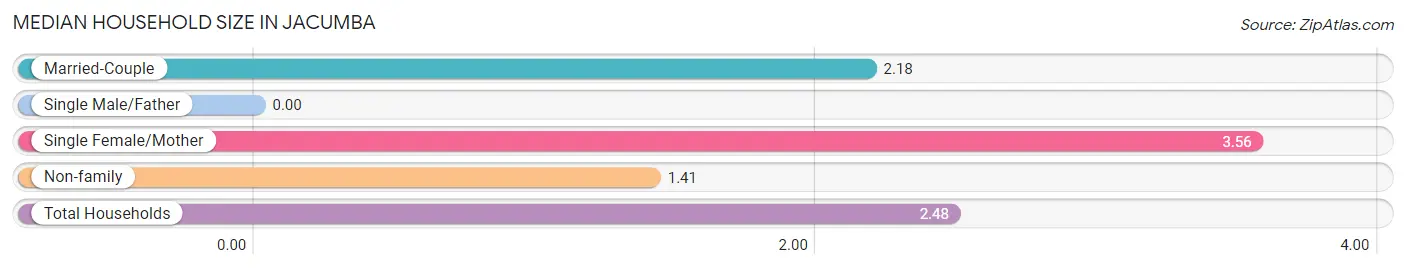
| Household Type | # Households | Household Size |
| Married-Couple | 154 (44.6%) | 2.18 |
| Single Male/Father | 0 (0.0%) | - |
| Single Female/Mother | 117 (33.9%) | 3.56 |
| Non-family | 74 (21.4%) | 1.41 |
| Total Households | 345 (100.0%) | 2.48 |
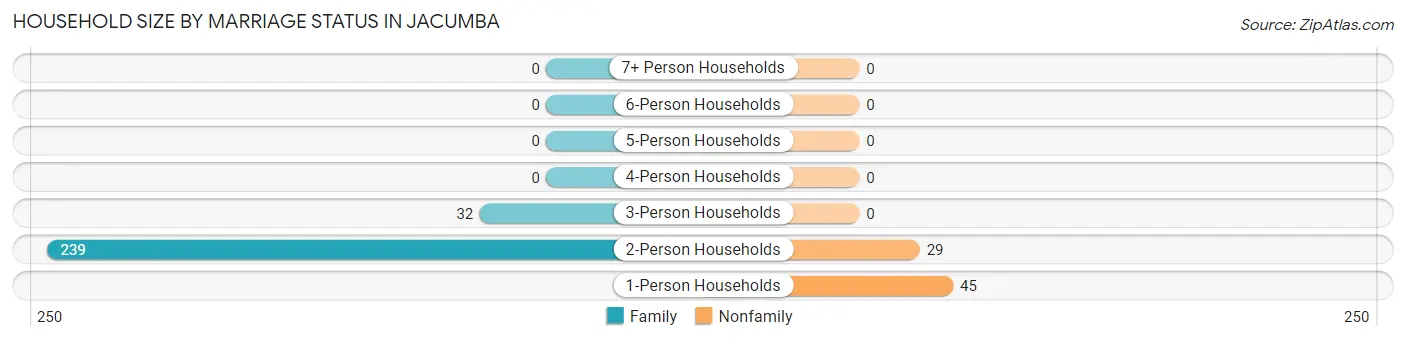
Household Size by Marriage Status in Jacumba
Out of a total of 345 households in Jacumba, 271 (78.5%) are family households, while 74 (21.4%) are nonfamily households. The most numerous type of family households are 2-person households, comprising 239, and the most common type of nonfamily households are 1-person households, comprising 45.
| Household Size | Family Households | Nonfamily Households |
| 1-Person Households | - | 45 (13.0%) |
| 2-Person Households | 239 (69.3%) | 29 (8.4%) |
| 3-Person Households | 32 (9.3%) | 0 (0.0%) |
| 4-Person Households | 0 (0.0%) | 0 (0.0%) |
| 5-Person Households | 0 (0.0%) | 0 (0.0%) |
| 6-Person Households | 0 (0.0%) | 0 (0.0%) |
| 7+ Person Households | 0 (0.0%) | 0 (0.0%) |
| Total | 271 (78.5%) | 74 (21.4%) |
Female Fertility in Jacumba
Fertility by Age in Jacumba
| Age Bracket | Women with Births | Births / 1,000 Women |
| 15 to 19 years | 0 (0.0%) | 0.0 |
| 20 to 34 years | 0 (0.0%) | 0.0 |
| 35 to 50 years | 0 (0.0%) | 0.0 |
| Total | 0 (0.0%) | 0.0 |
Fertility by Age by Marriage Status in Jacumba
| Age Bracket | Married | Unmarried |
| 15 to 19 years | 0 (0.0%) | 0 (0.0%) |
| 20 to 34 years | 0 (0.0%) | 0 (0.0%) |
| 35 to 50 years | 0 (0.0%) | 0 (0.0%) |
| Total | 0 (0.0%) | 0 (0.0%) |
Fertility by Education in Jacumba
| Educational Attainment | Women with Births | Births / 1,000 Women |
| Less than High School | 0 (0.0%) | 0.0 |
| High School Diploma | 0 (0.0%) | 0.0 |
| College or Associate's Degree | 0 (0.0%) | 0.0 |
| Bachelor's Degree | 0 (0.0%) | 0.0 |
| Graduate Degree | 0 (0.0%) | 0.0 |
| Total | 0 (0.0%) | 0.0 |
Fertility by Education by Marriage Status in Jacumba
| Educational Attainment | Married | Unmarried |
| Less than High School | 0 (0.0%) | 0 (0.0%) |
| High School Diploma | 0 (0.0%) | 0 (0.0%) |
| College or Associate's Degree | 0 (0.0%) | 0 (0.0%) |
| Bachelor's Degree | 0 (0.0%) | 0 (0.0%) |
| Graduate Degree | 0 (0.0%) | 0 (0.0%) |
| Total | 0 (0.0%) | 0 (0.0%) |
Employment Characteristics in Jacumba
Employment by Class of Employer in Jacumba
Among the 300 employed individuals in Jacumba, private company employees (181 | 60.3%), and not-for-profit organizations (119 | 39.7%) make up the most common classes of employment.
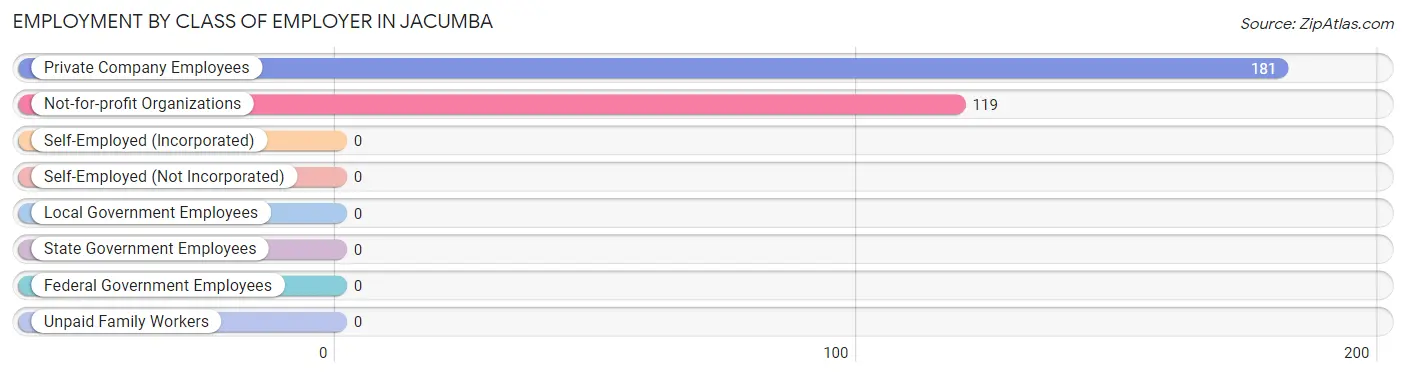
| Employer Class | # Employees | % Employees |
| Private Company Employees | 181 | 60.3% |
| Self-Employed (Incorporated) | 0 | 0.0% |
| Self-Employed (Not Incorporated) | 0 | 0.0% |
| Not-for-profit Organizations | 119 | 39.7% |
| Local Government Employees | 0 | 0.0% |
| State Government Employees | 0 | 0.0% |
| Federal Government Employees | 0 | 0.0% |
| Unpaid Family Workers | 0 | 0.0% |
| Total | 300 | 100.0% |
Employment Status by Age in Jacumba
According to the labor force statistics for Jacumba, out of the total population over 16 years of age (857), 49.1% or 421 individuals are in the labor force, with 20.9% or 88 of them unemployed. The age group with the highest labor force participation rate is 20 to 24 years, with 100.0% or 88 individuals in the labor force. Within the labor force, the 20 to 24 years age range has the highest percentage of unemployed individuals, with 100.0% or 88 of them being unemployed.
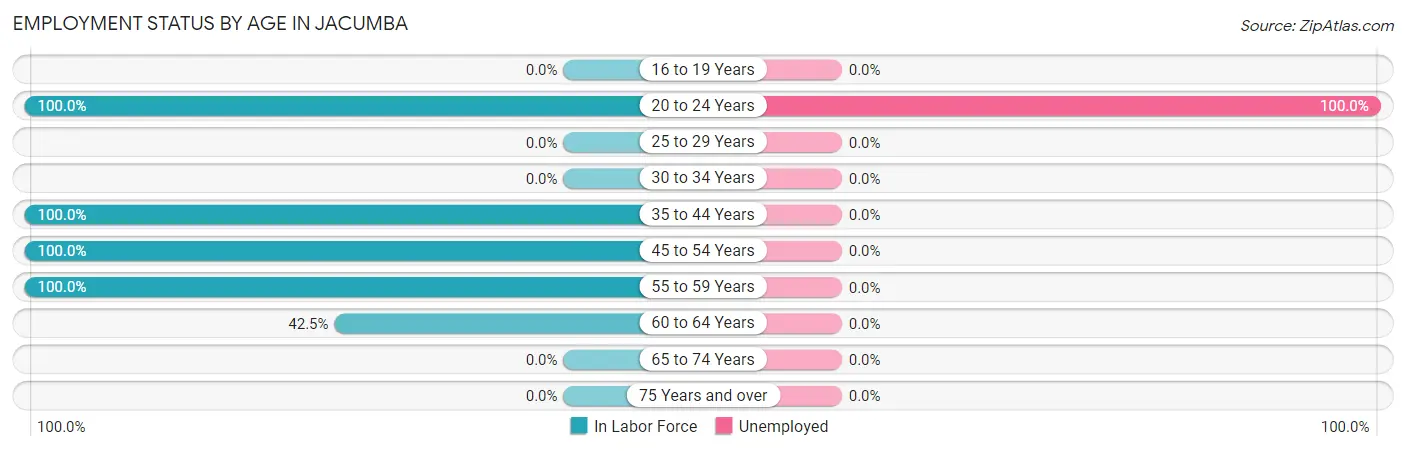
| Age Bracket | In Labor Force | Unemployed |
| 16 to 19 Years | 0 (0.0%) | 0 (0.0%) |
| 20 to 24 Years | 88 (100.0%) | 88 (100.0%) |
| 25 to 29 Years | 0 (0.0%) | 0 (0.0%) |
| 30 to 34 Years | 0 (0.0%) | 0 (0.0%) |
| 35 to 44 Years | 30 (100.0%) | 0 (0.0%) |
| 45 to 54 Years | 95 (100.0%) | 0 (0.0%) |
| 55 to 59 Years | 30 (100.0%) | 0 (0.0%) |
| 60 to 64 Years | 178 (42.5%) | 0 (0.0%) |
| 65 to 74 Years | 0 (0.0%) | 0 (0.0%) |
| 75 Years and over | 0 (0.0%) | 0 (0.0%) |
| Total | 421 (49.1%) | 88 (20.9%) |
Employment Status by Educational Attainment in Jacumba
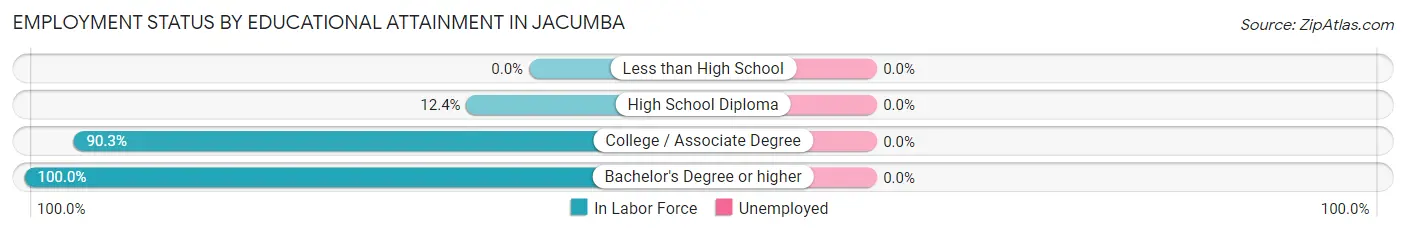
| Educational Attainment | In Labor Force | Unemployed |
| Less than High School | 0 (0.0%) | 0 (0.0%) |
| High School Diploma | 30 (12.4%) | 0 (0.0%) |
| College / Associate Degree | 270 (90.3%) | 0 (0.0%) |
| Bachelor's Degree or higher | 33 (100.0%) | 0 (0.0%) |
| Total | 333 (58.0%) | 0 (0.0%) |
Employment Occupations by Sex in Jacumba
Management, Business, Science and Arts Occupations
The most common Management, Business, Science and Arts occupations in Jacumba are Computers, Engineering & Science (33 | 9.9%), Life, Physical & Social Science (33 | 9.9%), and Health Diagnosing & Treating (32 | 9.6%).
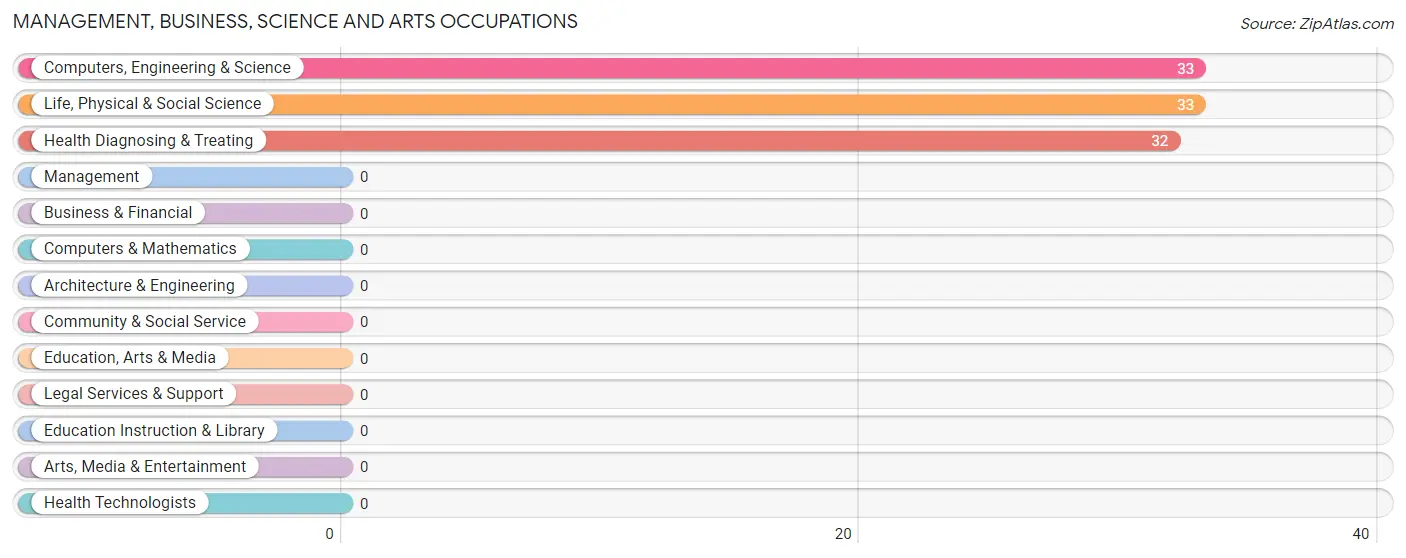
Management, Business, Science and Arts Occupations by Sex
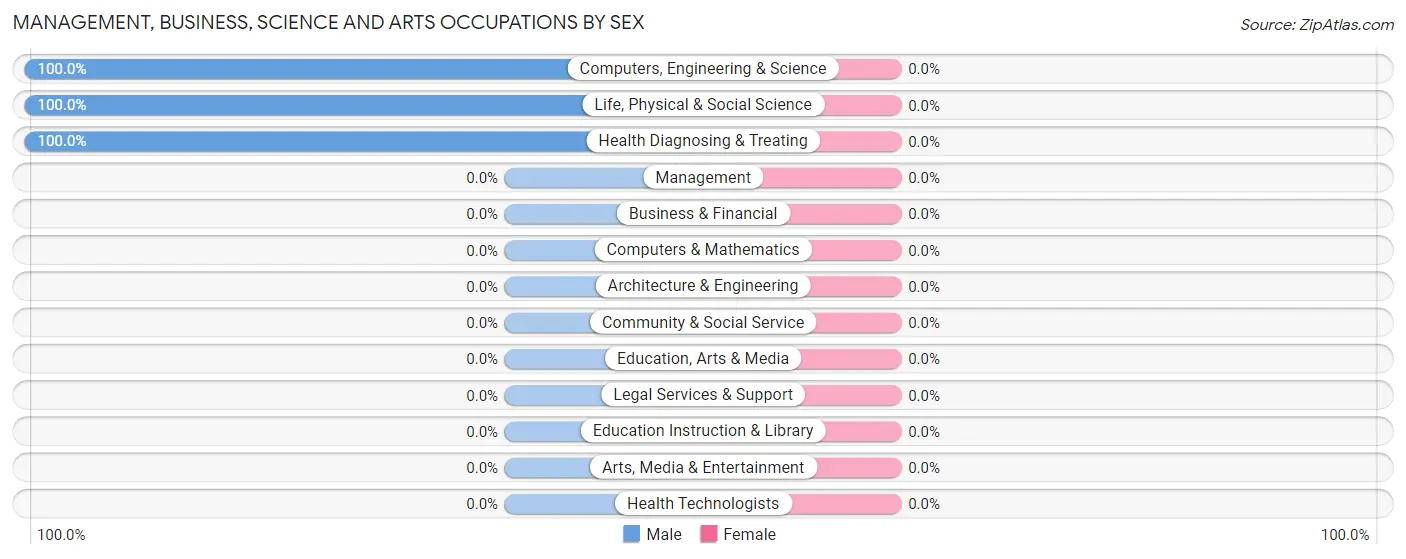
| Occupation | Male | Female |
| Management | 0 (0.0%) | 0 (0.0%) |
| Business & Financial | 0 (0.0%) | 0 (0.0%) |
| Computers, Engineering & Science | 33 (100.0%) | 0 (0.0%) |
| Computers & Mathematics | 0 (0.0%) | 0 (0.0%) |
| Architecture & Engineering | 0 (0.0%) | 0 (0.0%) |
| Life, Physical & Social Science | 33 (100.0%) | 0 (0.0%) |
| Community & Social Service | 0 (0.0%) | 0 (0.0%) |
| Education, Arts & Media | 0 (0.0%) | 0 (0.0%) |
| Legal Services & Support | 0 (0.0%) | 0 (0.0%) |
| Education Instruction & Library | 0 (0.0%) | 0 (0.0%) |
| Arts, Media & Entertainment | 0 (0.0%) | 0 (0.0%) |
| Health Diagnosing & Treating | 32 (100.0%) | 0 (0.0%) |
| Health Technologists | 0 (0.0%) | 0 (0.0%) |
| Total (Category) | 65 (100.0%) | 0 (0.0%) |
| Total (Overall) | 154 (46.3%) | 179 (53.7%) |
Services Occupations
The most common Services occupations in Jacumba are , and Healthcare Support (30 | 9.0%).
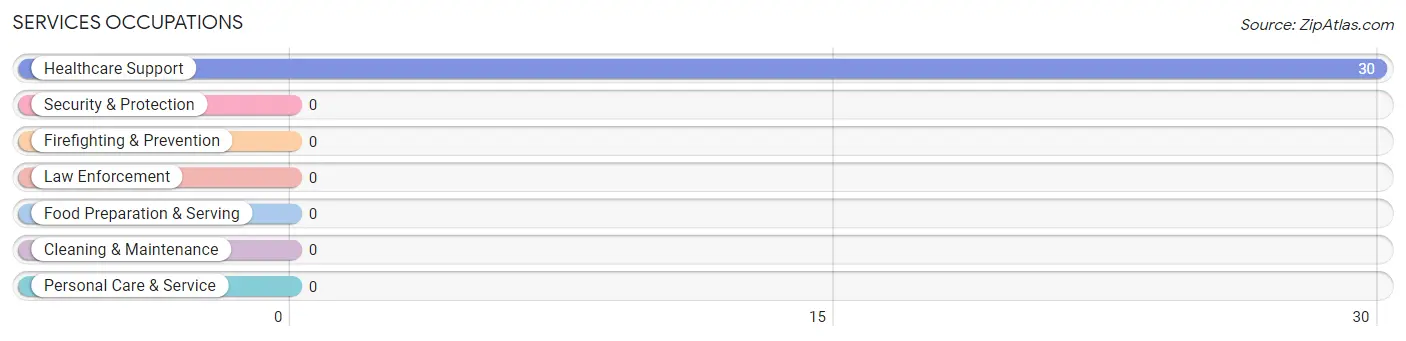
Services Occupations by Sex
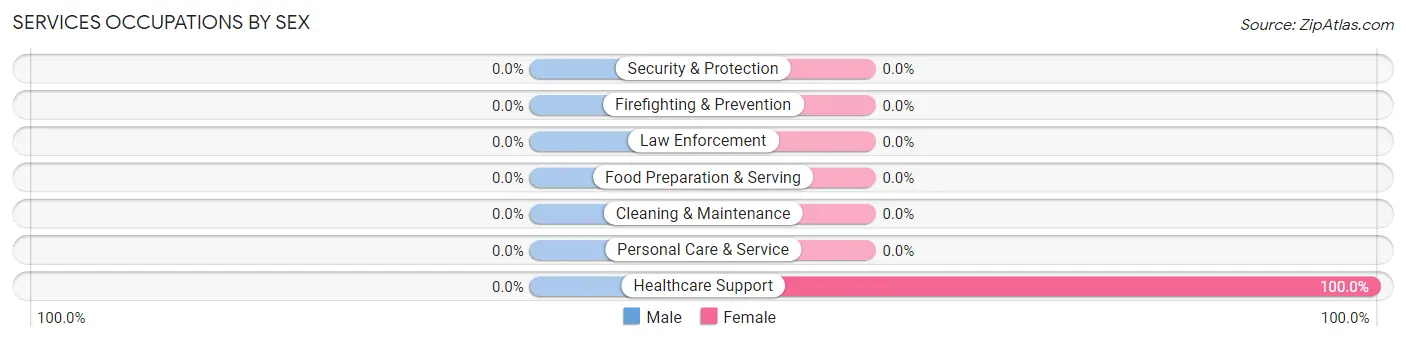
| Occupation | Male | Female |
| Healthcare Support | 0 (0.0%) | 30 (100.0%) |
| Security & Protection | 0 (0.0%) | 0 (0.0%) |
| Firefighting & Prevention | 0 (0.0%) | 0 (0.0%) |
| Law Enforcement | 0 (0.0%) | 0 (0.0%) |
| Food Preparation & Serving | 0 (0.0%) | 0 (0.0%) |
| Cleaning & Maintenance | 0 (0.0%) | 0 (0.0%) |
| Personal Care & Service | 0 (0.0%) | 0 (0.0%) |
| Total (Category) | 0 (0.0%) | 30 (100.0%) |
| Total (Overall) | 154 (46.3%) | 179 (53.7%) |
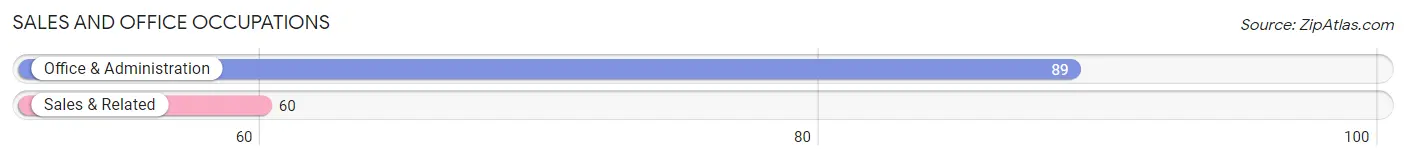
Sales and Office Occupations
The most common Sales and Office occupations in Jacumba are Office & Administration (89 | 26.7%), and Sales & Related (60 | 18.0%).
Sales and Office Occupations by Sex
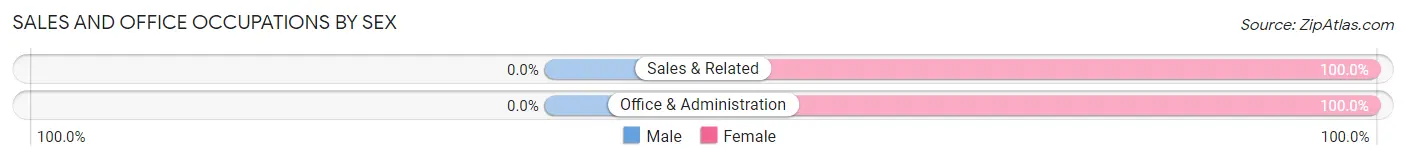
| Occupation | Male | Female |
| Sales & Related | 0 (0.0%) | 60 (100.0%) |
| Office & Administration | 0 (0.0%) | 89 (100.0%) |
| Total (Category) | 0 (0.0%) | 149 (100.0%) |
| Total (Overall) | 154 (46.3%) | 179 (53.7%) |
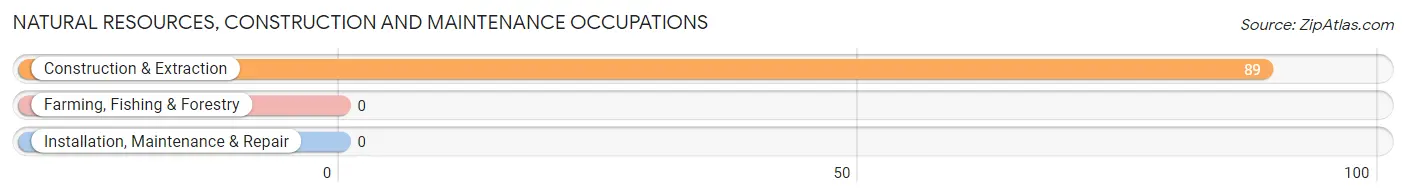
Natural Resources, Construction and Maintenance Occupations
The most common Natural Resources, Construction and Maintenance occupations in Jacumba are , and Construction & Extraction (89 | 26.7%).
Natural Resources, Construction and Maintenance Occupations by Sex
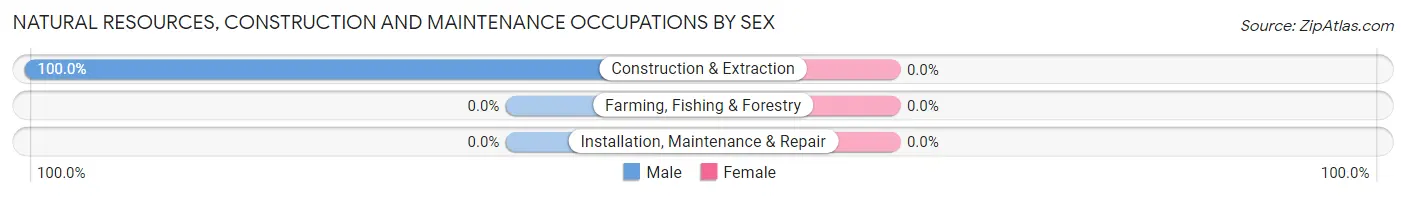
| Occupation | Male | Female |
| Farming, Fishing & Forestry | 0 (0.0%) | 0 (0.0%) |
| Construction & Extraction | 89 (100.0%) | 0 (0.0%) |
| Installation, Maintenance & Repair | 0 (0.0%) | 0 (0.0%) |
| Total (Category) | 89 (100.0%) | 0 (0.0%) |
| Total (Overall) | 154 (46.3%) | 179 (53.7%) |
Production, Transportation and Moving Occupations
Production, Transportation and Moving Occupations by Sex
| Occupation | Male | Female |
| Production | 0 (0.0%) | 0 (0.0%) |
| Transportation | 0 (0.0%) | 0 (0.0%) |
| Material Moving | 0 (0.0%) | 0 (0.0%) |
| Total (Category) | 0 (0.0%) | 0 (0.0%) |
| Total (Overall) | 154 (46.3%) | 179 (53.7%) |
Employment Industries by Sex in Jacumba
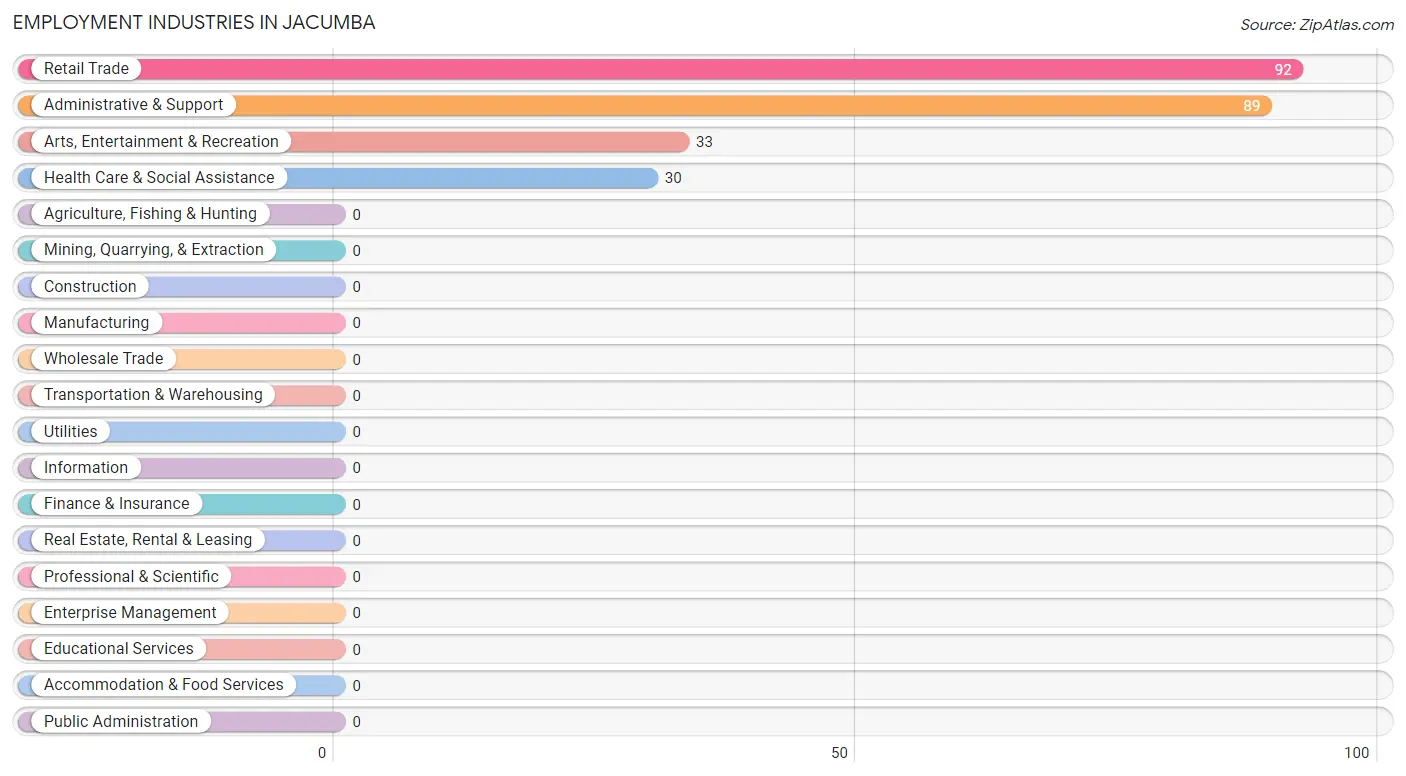
Employment Industries in Jacumba
The major employment industries in Jacumba include Retail Trade (92 | 27.6%), Administrative & Support (89 | 26.7%), Arts, Entertainment & Recreation (33 | 9.9%), and Health Care & Social Assistance (30 | 9.0%).
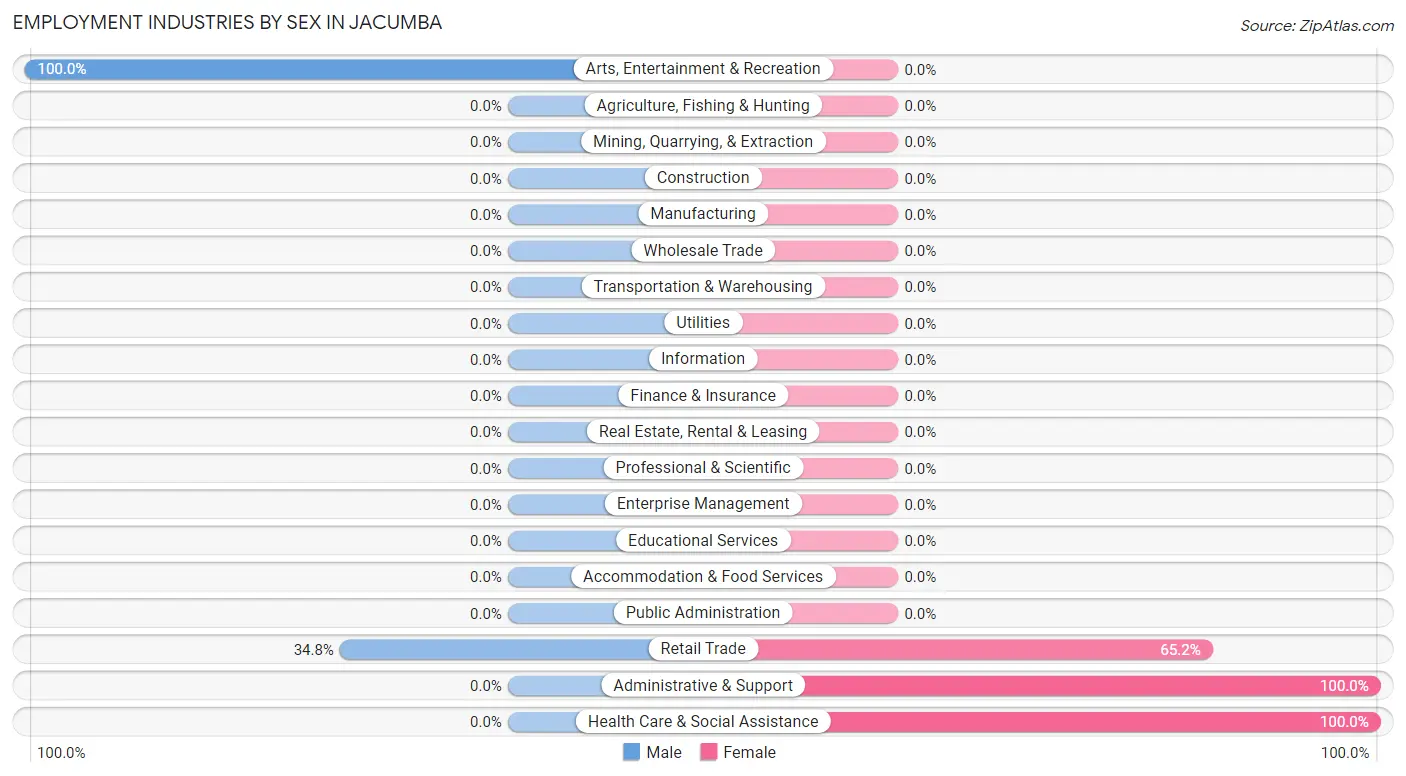
Employment Industries by Sex in Jacumba
The Jacumba industries that see more men than women are Arts, Entertainment & Recreation (100.0%), and Retail Trade (34.8%), whereas the industries that tend to have a higher number of women are Administrative & Support (100.0%), Health Care & Social Assistance (100.0%), and Retail Trade (65.2%).
| Industry | Male | Female |
| Agriculture, Fishing & Hunting | 0 (0.0%) | 0 (0.0%) |
| Mining, Quarrying, & Extraction | 0 (0.0%) | 0 (0.0%) |
| Construction | 0 (0.0%) | 0 (0.0%) |
| Manufacturing | 0 (0.0%) | 0 (0.0%) |
| Wholesale Trade | 0 (0.0%) | 0 (0.0%) |
| Retail Trade | 32 (34.8%) | 60 (65.2%) |
| Transportation & Warehousing | 0 (0.0%) | 0 (0.0%) |
| Utilities | 0 (0.0%) | 0 (0.0%) |
| Information | 0 (0.0%) | 0 (0.0%) |
| Finance & Insurance | 0 (0.0%) | 0 (0.0%) |
| Real Estate, Rental & Leasing | 0 (0.0%) | 0 (0.0%) |
| Professional & Scientific | 0 (0.0%) | 0 (0.0%) |
| Enterprise Management | 0 (0.0%) | 0 (0.0%) |
| Administrative & Support | 0 (0.0%) | 89 (100.0%) |
| Educational Services | 0 (0.0%) | 0 (0.0%) |
| Health Care & Social Assistance | 0 (0.0%) | 30 (100.0%) |
| Arts, Entertainment & Recreation | 33 (100.0%) | 0 (0.0%) |
| Accommodation & Food Services | 0 (0.0%) | 0 (0.0%) |
| Public Administration | 0 (0.0%) | 0 (0.0%) |
| Total | 154 (46.3%) | 179 (53.7%) |
Education in Jacumba
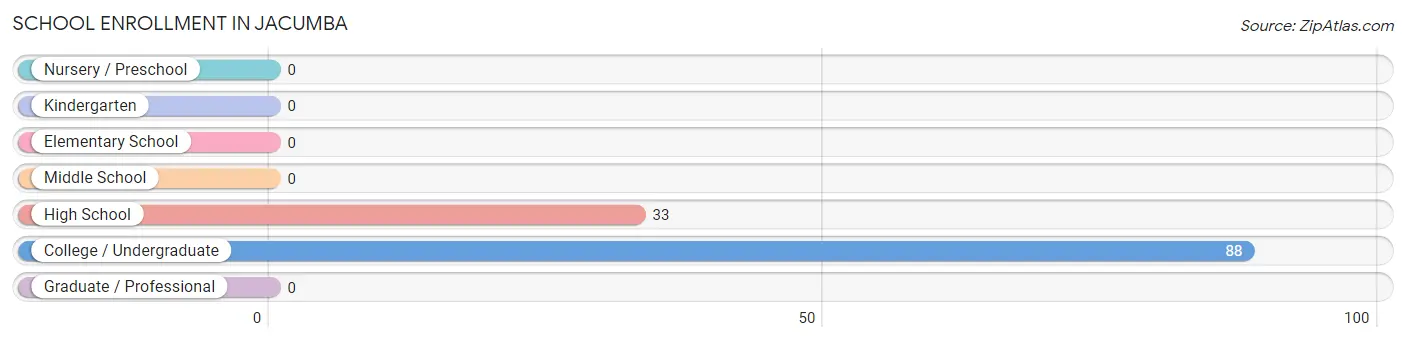
School Enrollment in Jacumba
The most common levels of schooling among the 121 students in Jacumba are college / undergraduate (88 | 72.7%), and high school (33 | 27.3%).
| School Level | # Students | % Students |
| Nursery / Preschool | 0 | 0.0% |
| Kindergarten | 0 | 0.0% |
| Elementary School | 0 | 0.0% |
| Middle School | 0 | 0.0% |
| High School | 33 | 27.3% |
| College / Undergraduate | 88 | 72.7% |
| Graduate / Professional | 0 | 0.0% |
| Total | 121 | 100.0% |
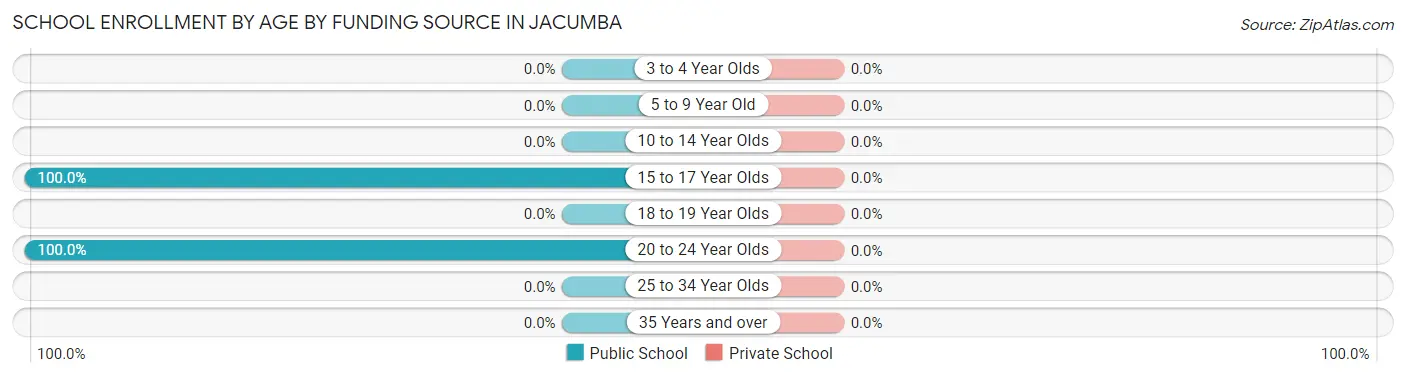
School Enrollment by Age by Funding Source in Jacumba
| Age Bracket | Public School | Private School |
| 3 to 4 Year Olds | 0 (0.0%) | 0 (0.0%) |
| 5 to 9 Year Old | 0 (0.0%) | 0 (0.0%) |
| 10 to 14 Year Olds | 0 (0.0%) | 0 (0.0%) |
| 15 to 17 Year Olds | 33 (100.0%) | 0 (0.0%) |
| 18 to 19 Year Olds | 0 (0.0%) | 0 (0.0%) |
| 20 to 24 Year Olds | 88 (100.0%) | 0 (0.0%) |
| 25 to 34 Year Olds | 0 (0.0%) | 0 (0.0%) |
| 35 Years and over | 0 (0.0%) | 0 (0.0%) |
| Total | 121 (100.0%) | 0 (0.0%) |
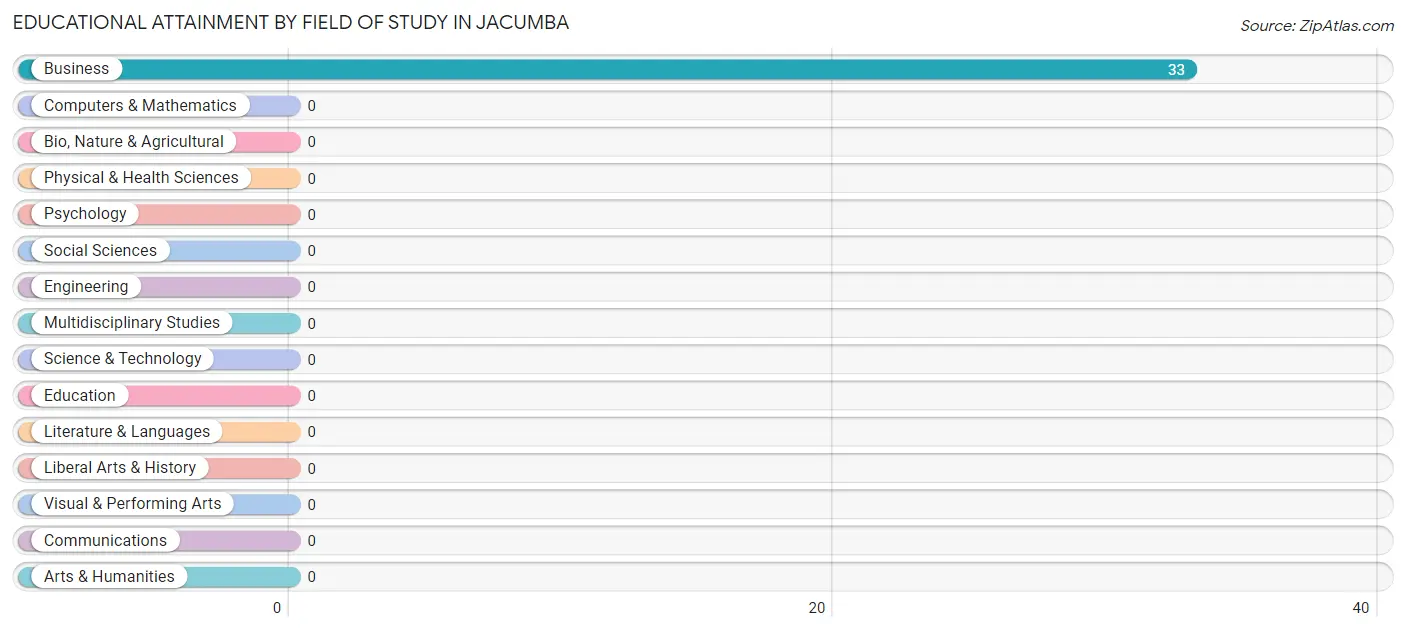
Educational Attainment by Field of Study in Jacumba
, and business (33 | 100.0%) are the most common fields of study among 33 individuals in Jacumba who have obtained a bachelor's degree or higher.
| Field of Study | # Graduates | % Graduates |
| Computers & Mathematics | 0 | 0.0% |
| Bio, Nature & Agricultural | 0 | 0.0% |
| Physical & Health Sciences | 0 | 0.0% |
| Psychology | 0 | 0.0% |
| Social Sciences | 0 | 0.0% |
| Engineering | 0 | 0.0% |
| Multidisciplinary Studies | 0 | 0.0% |
| Science & Technology | 0 | 0.0% |
| Business | 33 | 100.0% |
| Education | 0 | 0.0% |
| Literature & Languages | 0 | 0.0% |
| Liberal Arts & History | 0 | 0.0% |
| Visual & Performing Arts | 0 | 0.0% |
| Communications | 0 | 0.0% |
| Arts & Humanities | 0 | 0.0% |
| Total | 33 | 100.0% |
Transportation & Commute in Jacumba
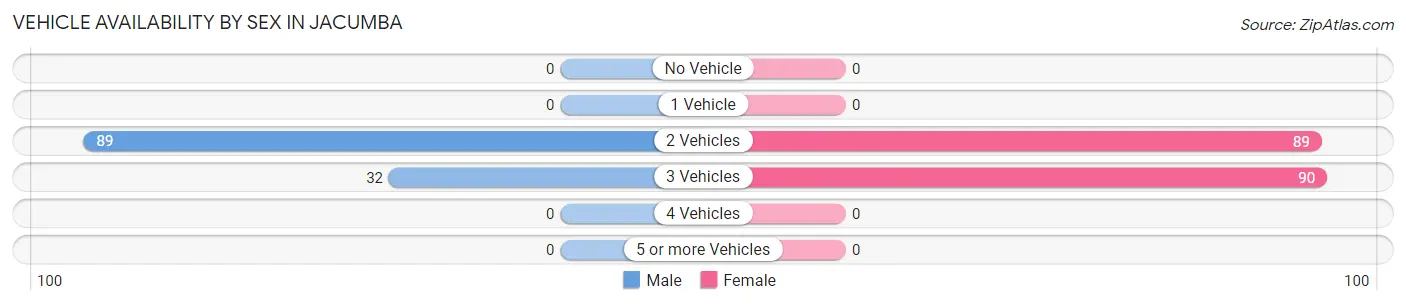
Vehicle Availability by Sex in Jacumba
The most prevalent vehicle ownership categories in Jacumba are males with 2 vehicles (89, accounting for 73.6%) and females with 2 vehicles (89, making up 49.7%).
| Vehicles Available | Male | Female |
| No Vehicle | 0 (0.0%) | 0 (0.0%) |
| 1 Vehicle | 0 (0.0%) | 0 (0.0%) |
| 2 Vehicles | 89 (73.6%) | 89 (49.7%) |
| 3 Vehicles | 32 (26.5%) | 90 (50.3%) |
| 4 Vehicles | 0 (0.0%) | 0 (0.0%) |
| 5 or more Vehicles | 0 (0.0%) | 0 (0.0%) |
| Total | 121 (100.0%) | 179 (100.0%) |
Commute Time in Jacumba
The most frequently occuring commute durations in Jacumba are 60 to 89 minutes (89 commuters, 42.2%), 45 to 59 minutes (62 commuters, 29.4%), and 90 or more minutes (60 commuters, 28.4%).
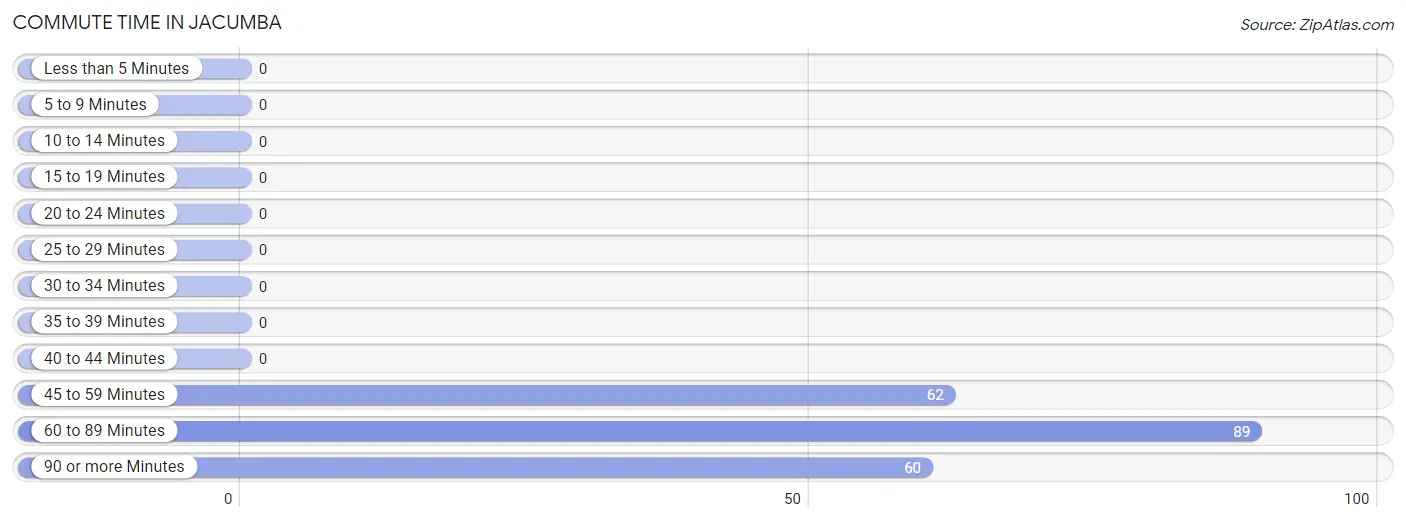
| Commute Time | # Commuters | % Commuters |
| Less than 5 Minutes | 0 | 0.0% |
| 5 to 9 Minutes | 0 | 0.0% |
| 10 to 14 Minutes | 0 | 0.0% |
| 15 to 19 Minutes | 0 | 0.0% |
| 20 to 24 Minutes | 0 | 0.0% |
| 25 to 29 Minutes | 0 | 0.0% |
| 30 to 34 Minutes | 0 | 0.0% |
| 35 to 39 Minutes | 0 | 0.0% |
| 40 to 44 Minutes | 0 | 0.0% |
| 45 to 59 Minutes | 62 | 29.4% |
| 60 to 89 Minutes | 89 | 42.2% |
| 90 or more Minutes | 60 | 28.4% |
Commute Time by Sex in Jacumba
The most common commute times in Jacumba are 60 to 89 minutes (89 commuters, 73.6%) for males and 90 or more minutes (60 commuters, 66.7%) for females.
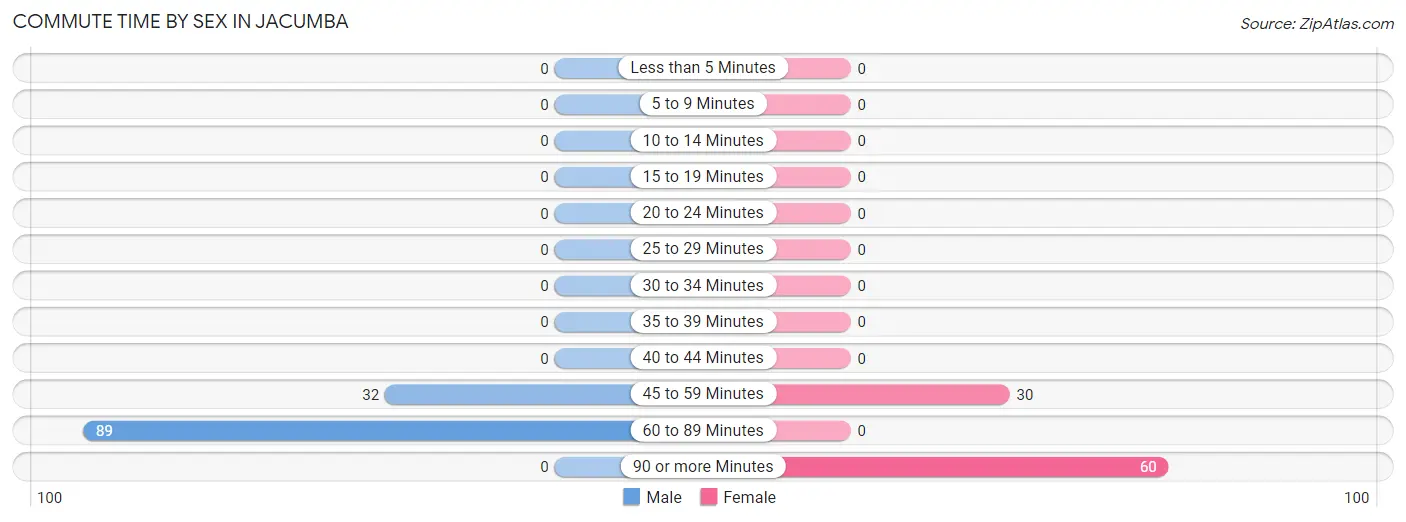
| Commute Time | Male | Female |
| Less than 5 Minutes | 0 (0.0%) | 0 (0.0%) |
| 5 to 9 Minutes | 0 (0.0%) | 0 (0.0%) |
| 10 to 14 Minutes | 0 (0.0%) | 0 (0.0%) |
| 15 to 19 Minutes | 0 (0.0%) | 0 (0.0%) |
| 20 to 24 Minutes | 0 (0.0%) | 0 (0.0%) |
| 25 to 29 Minutes | 0 (0.0%) | 0 (0.0%) |
| 30 to 34 Minutes | 0 (0.0%) | 0 (0.0%) |
| 35 to 39 Minutes | 0 (0.0%) | 0 (0.0%) |
| 40 to 44 Minutes | 0 (0.0%) | 0 (0.0%) |
| 45 to 59 Minutes | 32 (26.5%) | 30 (33.3%) |
| 60 to 89 Minutes | 89 (73.6%) | 0 (0.0%) |
| 90 or more Minutes | 0 (0.0%) | 60 (66.7%) |
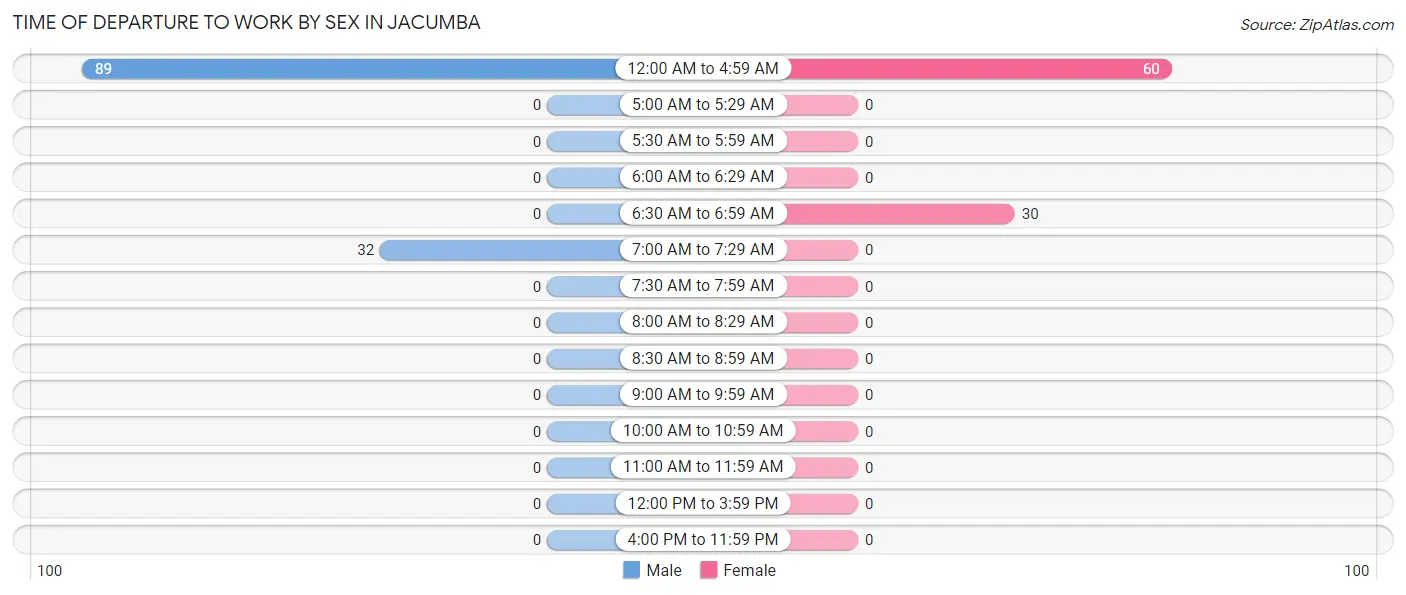
Time of Departure to Work by Sex in Jacumba
The most frequent times of departure to work in Jacumba are 12:00 AM to 4:59 AM (89, 73.6%) for males and 12:00 AM to 4:59 AM (60, 66.7%) for females.
| Time of Departure | Male | Female |
| 12:00 AM to 4:59 AM | 89 (73.6%) | 60 (66.7%) |
| 5:00 AM to 5:29 AM | 0 (0.0%) | 0 (0.0%) |
| 5:30 AM to 5:59 AM | 0 (0.0%) | 0 (0.0%) |
| 6:00 AM to 6:29 AM | 0 (0.0%) | 0 (0.0%) |
| 6:30 AM to 6:59 AM | 0 (0.0%) | 30 (33.3%) |
| 7:00 AM to 7:29 AM | 32 (26.5%) | 0 (0.0%) |
| 7:30 AM to 7:59 AM | 0 (0.0%) | 0 (0.0%) |
| 8:00 AM to 8:29 AM | 0 (0.0%) | 0 (0.0%) |
| 8:30 AM to 8:59 AM | 0 (0.0%) | 0 (0.0%) |
| 9:00 AM to 9:59 AM | 0 (0.0%) | 0 (0.0%) |
| 10:00 AM to 10:59 AM | 0 (0.0%) | 0 (0.0%) |
| 11:00 AM to 11:59 AM | 0 (0.0%) | 0 (0.0%) |
| 12:00 PM to 3:59 PM | 0 (0.0%) | 0 (0.0%) |
| 4:00 PM to 11:59 PM | 0 (0.0%) | 0 (0.0%) |
| Total | 121 (100.0%) | 90 (100.0%) |
Housing Occupancy in Jacumba
Occupancy by Ownership in Jacumba
Of the total 345 dwellings in Jacumba, owner-occupied units account for 183 (53.0%), while renter-occupied units make up 162 (47.0%).
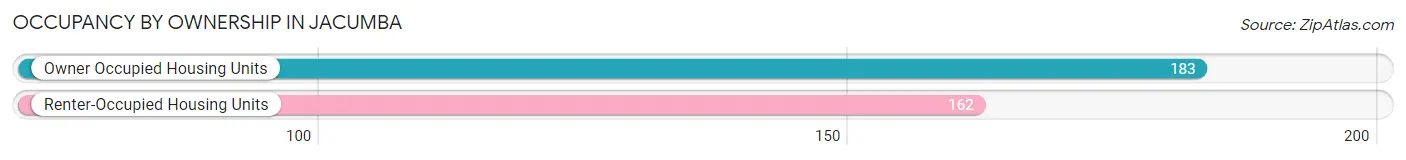
| Occupancy | # Housing Units | % Housing Units |
| Owner Occupied Housing Units | 183 | 53.0% |
| Renter-Occupied Housing Units | 162 | 47.0% |
| Total Occupied Housing Units | 345 | 100.0% |
Occupancy by Household Size in Jacumba
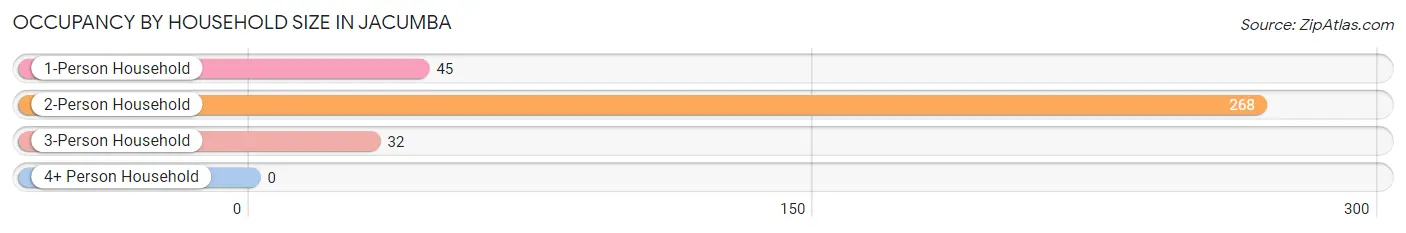
| Household Size | # Housing Units | % Housing Units |
| 1-Person Household | 45 | 13.0% |
| 2-Person Household | 268 | 77.7% |
| 3-Person Household | 32 | 9.3% |
| 4+ Person Household | 0 | 0.0% |
| Total Housing Units | 345 | 100.0% |
Occupancy by Ownership by Household Size in Jacumba
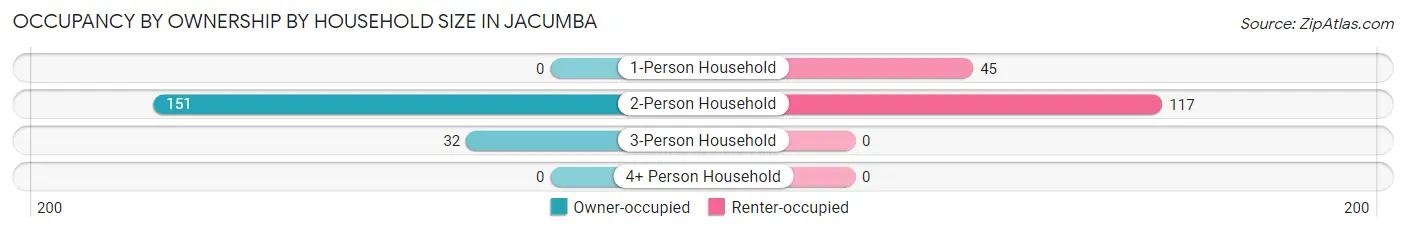
| Household Size | Owner-occupied | Renter-occupied |
| 1-Person Household | 0 (0.0%) | 45 (100.0%) |
| 2-Person Household | 151 (56.3%) | 117 (43.7%) |
| 3-Person Household | 32 (100.0%) | 0 (0.0%) |
| 4+ Person Household | 0 (0.0%) | 0 (0.0%) |
| Total Housing Units | 183 (53.0%) | 162 (47.0%) |
Occupancy by Educational Attainment in Jacumba
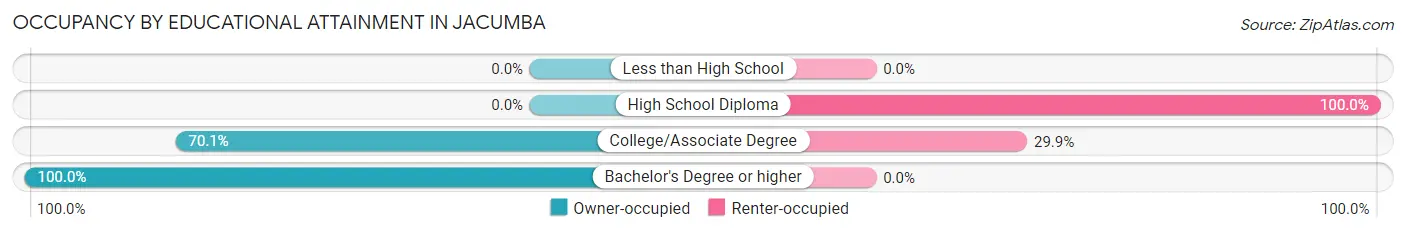
| Household Size | Owner-occupied | Renter-occupied |
| Less than High School | 0 (0.0%) | 0 (0.0%) |
| High School Diploma | 0 (0.0%) | 98 (100.0%) |
| College/Associate Degree | 150 (70.1%) | 64 (29.9%) |
| Bachelor's Degree or higher | 33 (100.0%) | 0 (0.0%) |
Occupancy by Age of Householder in Jacumba
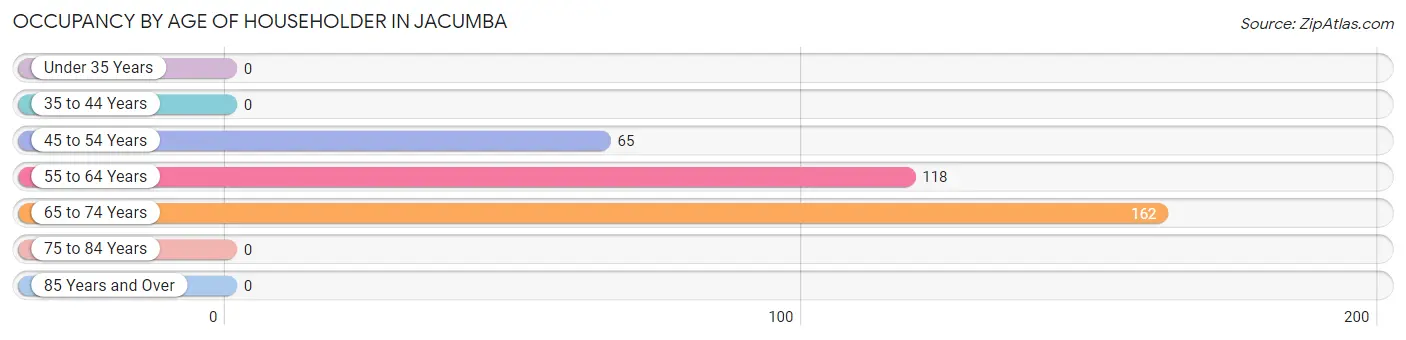
| Age Bracket | # Households | % Households |
| Under 35 Years | 0 | 0.0% |
| 35 to 44 Years | 0 | 0.0% |
| 45 to 54 Years | 65 | 18.8% |
| 55 to 64 Years | 118 | 34.2% |
| 65 to 74 Years | 162 | 47.0% |
| 75 to 84 Years | 0 | 0.0% |
| 85 Years and Over | 0 | 0.0% |
| Total | 345 | 100.0% |
Housing Finances in Jacumba
Median Income by Occupancy in Jacumba
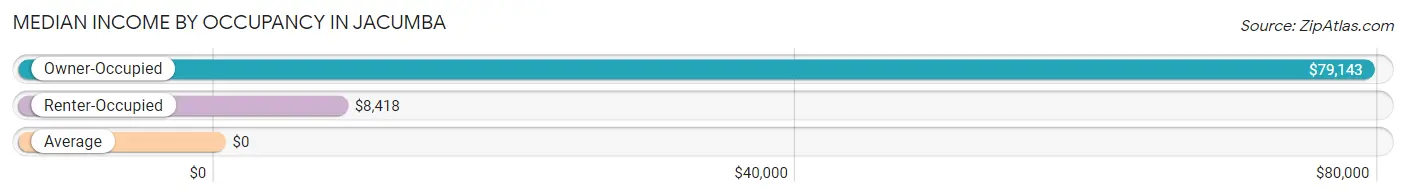
| Occupancy Type | # Households | Median Income |
| Owner-Occupied | 183 (53.0%) | $79,143 |
| Renter-Occupied | 162 (47.0%) | $8,418 |
| Average | 345 (100.0%) | $0 |
Occupancy by Householder Income Bracket in Jacumba
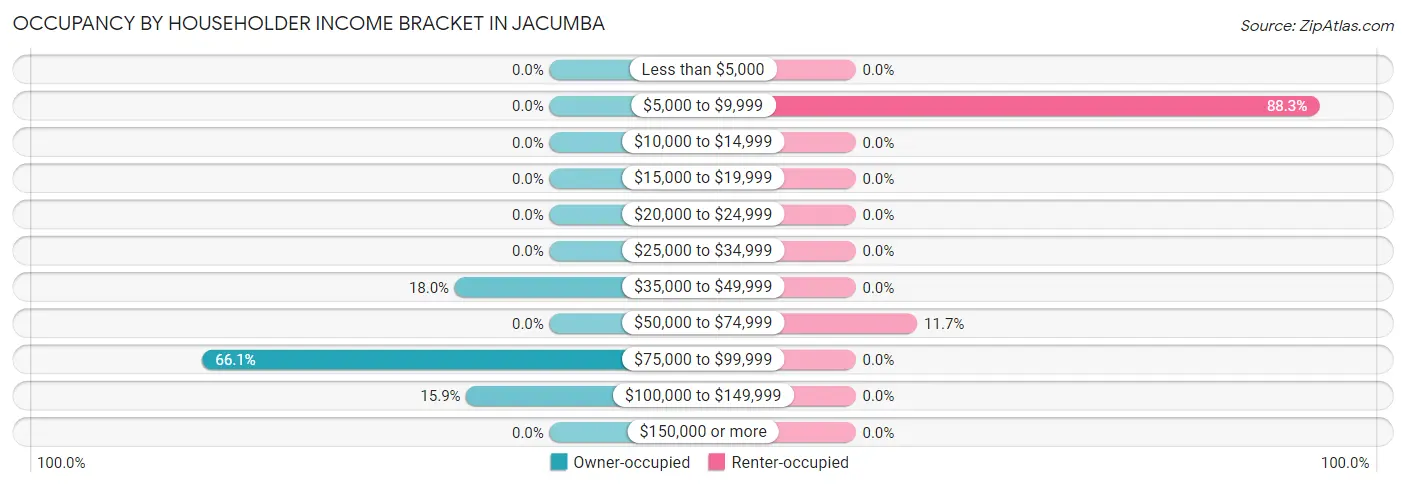
| Income Bracket | Owner-occupied | Renter-occupied |
| Less than $5,000 | 0 (0.0%) | 0 (0.0%) |
| $5,000 to $9,999 | 0 (0.0%) | 143 (88.3%) |
| $10,000 to $14,999 | 0 (0.0%) | 0 (0.0%) |
| $15,000 to $19,999 | 0 (0.0%) | 0 (0.0%) |
| $20,000 to $24,999 | 0 (0.0%) | 0 (0.0%) |
| $25,000 to $34,999 | 0 (0.0%) | 0 (0.0%) |
| $35,000 to $49,999 | 33 (18.0%) | 0 (0.0%) |
| $50,000 to $74,999 | 0 (0.0%) | 19 (11.7%) |
| $75,000 to $99,999 | 121 (66.1%) | 0 (0.0%) |
| $100,000 to $149,999 | 29 (15.9%) | 0 (0.0%) |
| $150,000 or more | 0 (0.0%) | 0 (0.0%) |
| Total | 183 (100.0%) | 162 (100.0%) |
Monthly Housing Cost Tiers in Jacumba
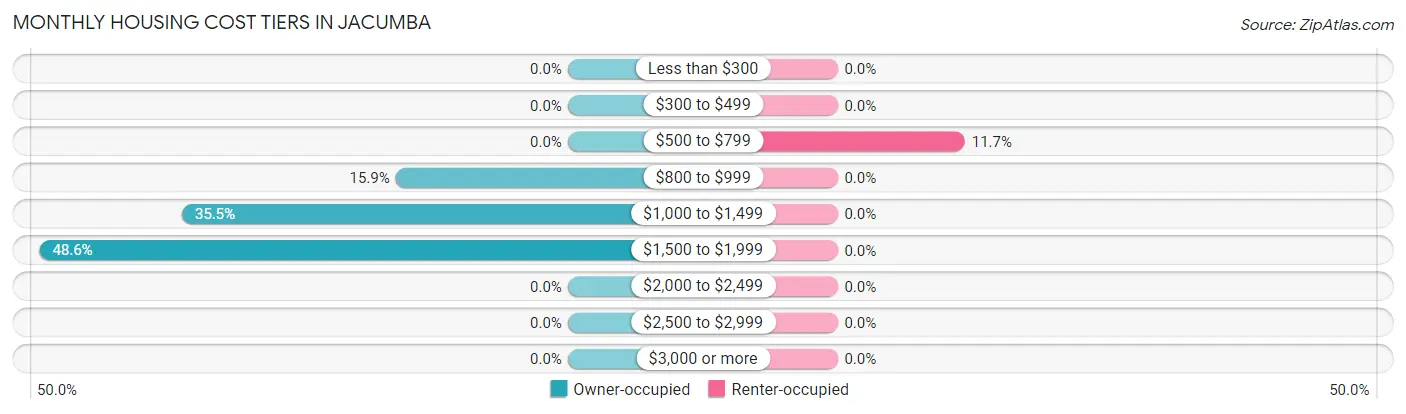
| Monthly Cost | Owner-occupied | Renter-occupied |
| Less than $300 | 0 (0.0%) | 0 (0.0%) |
| $300 to $499 | 0 (0.0%) | 0 (0.0%) |
| $500 to $799 | 0 (0.0%) | 19 (11.7%) |
| $800 to $999 | 29 (15.9%) | 0 (0.0%) |
| $1,000 to $1,499 | 65 (35.5%) | 0 (0.0%) |
| $1,500 to $1,999 | 89 (48.6%) | 0 (0.0%) |
| $2,000 to $2,499 | 0 (0.0%) | 0 (0.0%) |
| $2,500 to $2,999 | 0 (0.0%) | 0 (0.0%) |
| $3,000 or more | 0 (0.0%) | 0 (0.0%) |
| Total | 183 (100.0%) | 162 (100.0%) |
Physical Housing Characteristics in Jacumba
Housing Structures in Jacumba
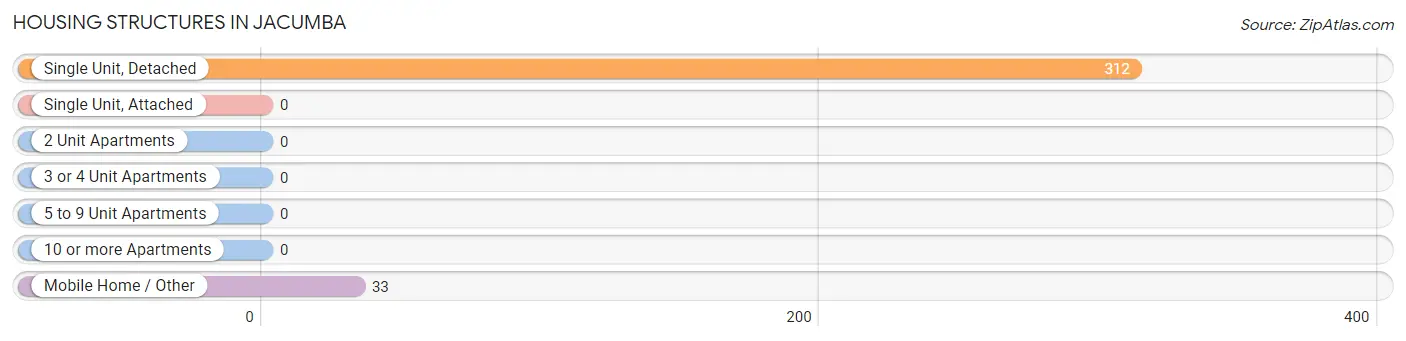
| Structure Type | # Housing Units | % Housing Units |
| Single Unit, Detached | 312 | 90.4% |
| Single Unit, Attached | 0 | 0.0% |
| 2 Unit Apartments | 0 | 0.0% |
| 3 or 4 Unit Apartments | 0 | 0.0% |
| 5 to 9 Unit Apartments | 0 | 0.0% |
| 10 or more Apartments | 0 | 0.0% |
| Mobile Home / Other | 33 | 9.6% |
| Total | 345 | 100.0% |
Housing Structures by Occupancy in Jacumba
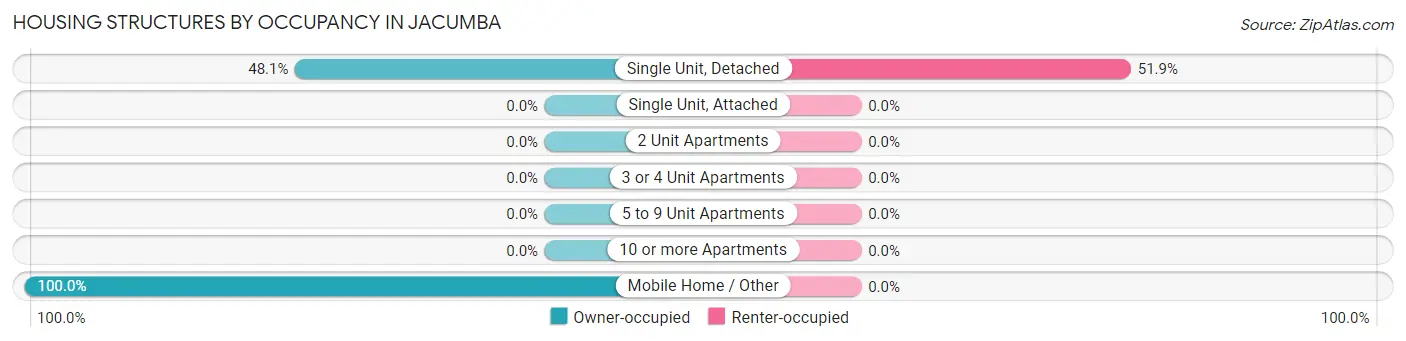
| Structure Type | Owner-occupied | Renter-occupied |
| Single Unit, Detached | 150 (48.1%) | 162 (51.9%) |
| Single Unit, Attached | 0 (0.0%) | 0 (0.0%) |
| 2 Unit Apartments | 0 (0.0%) | 0 (0.0%) |
| 3 or 4 Unit Apartments | 0 (0.0%) | 0 (0.0%) |
| 5 to 9 Unit Apartments | 0 (0.0%) | 0 (0.0%) |
| 10 or more Apartments | 0 (0.0%) | 0 (0.0%) |
| Mobile Home / Other | 33 (100.0%) | 0 (0.0%) |
| Total | 183 (53.0%) | 162 (47.0%) |
Housing Structures by Number of Rooms in Jacumba
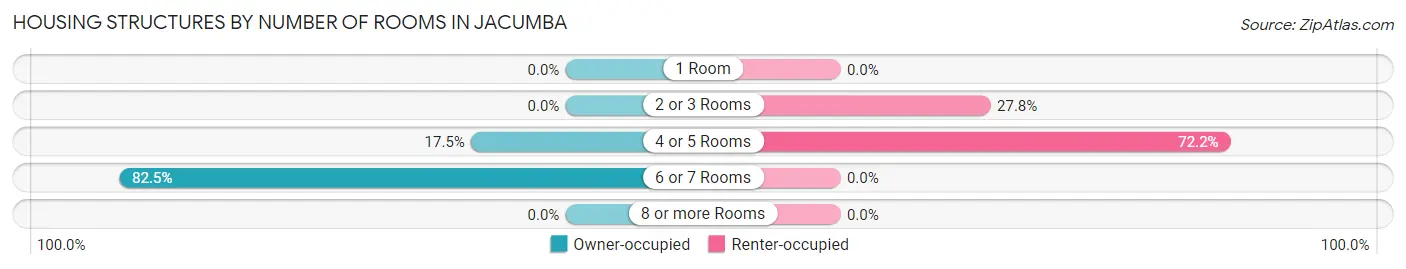
| Number of Rooms | Owner-occupied | Renter-occupied |
| 1 Room | 0 (0.0%) | 0 (0.0%) |
| 2 or 3 Rooms | 0 (0.0%) | 45 (27.8%) |
| 4 or 5 Rooms | 32 (17.5%) | 117 (72.2%) |
| 6 or 7 Rooms | 151 (82.5%) | 0 (0.0%) |
| 8 or more Rooms | 0 (0.0%) | 0 (0.0%) |
| Total | 183 (100.0%) | 162 (100.0%) |
Housing Structure by Heating Type in Jacumba
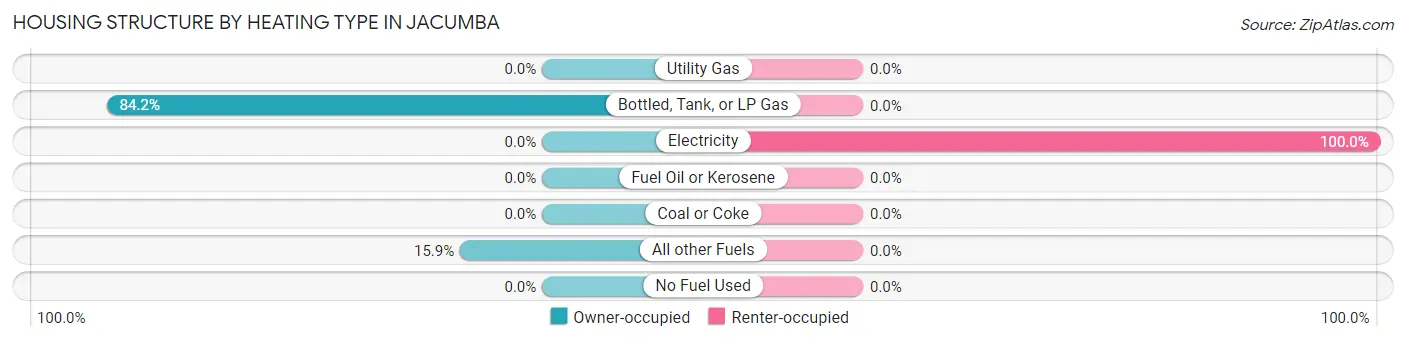
| Heating Type | Owner-occupied | Renter-occupied |
| Utility Gas | 0 (0.0%) | 0 (0.0%) |
| Bottled, Tank, or LP Gas | 154 (84.2%) | 0 (0.0%) |
| Electricity | 0 (0.0%) | 162 (100.0%) |
| Fuel Oil or Kerosene | 0 (0.0%) | 0 (0.0%) |
| Coal or Coke | 0 (0.0%) | 0 (0.0%) |
| All other Fuels | 29 (15.9%) | 0 (0.0%) |
| No Fuel Used | 0 (0.0%) | 0 (0.0%) |
| Total | 183 (100.0%) | 162 (100.0%) |
Household Vehicle Usage in Jacumba
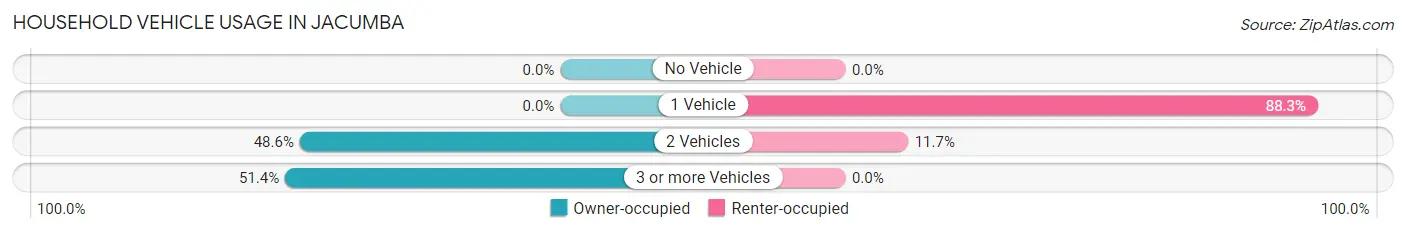
| Vehicles per Household | Owner-occupied | Renter-occupied |
| No Vehicle | 0 (0.0%) | 0 (0.0%) |
| 1 Vehicle | 0 (0.0%) | 143 (88.3%) |
| 2 Vehicles | 89 (48.6%) | 19 (11.7%) |
| 3 or more Vehicles | 94 (51.4%) | 0 (0.0%) |
| Total | 183 (100.0%) | 162 (100.0%) |
Real Estate & Mortgages in Jacumba
Real Estate and Mortgage Overview in Jacumba
| Characteristic | Without Mortgage | With Mortgage |
| Housing Units | 61 | 122 |
| Median Property Value | - | - |
| Median Household Income | - | - |
| Monthly Housing Costs | - | - |
| Real Estate Taxes | - | - |
Property Value by Mortgage Status in Jacumba
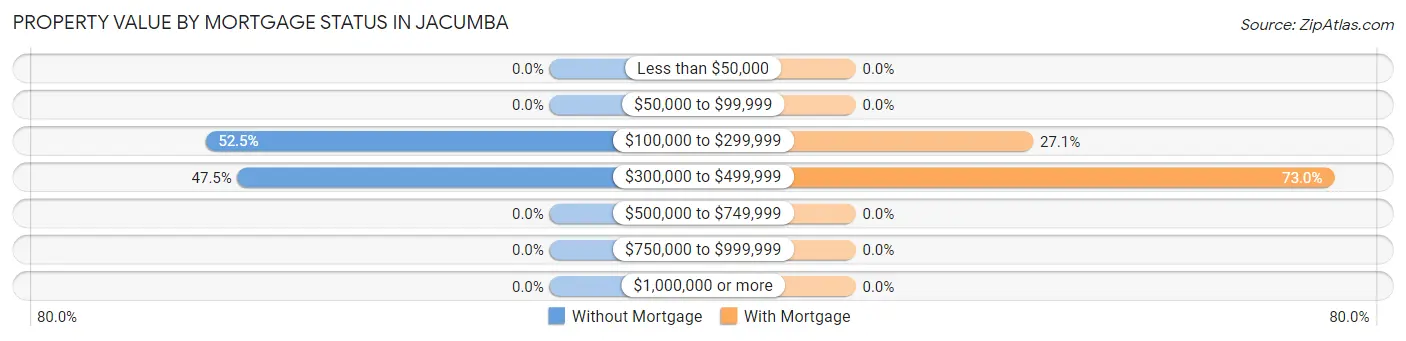
| Property Value | Without Mortgage | With Mortgage |
| Less than $50,000 | 0 (0.0%) | 0 (0.0%) |
| $50,000 to $99,999 | 0 (0.0%) | 0 (0.0%) |
| $100,000 to $299,999 | 32 (52.5%) | 33 (27.1%) |
| $300,000 to $499,999 | 29 (47.5%) | 89 (73.0%) |
| $500,000 to $749,999 | 0 (0.0%) | 0 (0.0%) |
| $750,000 to $999,999 | 0 (0.0%) | 0 (0.0%) |
| $1,000,000 or more | 0 (0.0%) | 0 (0.0%) |
| Total | 61 (100.0%) | 122 (100.0%) |
Household Income by Mortgage Status in Jacumba
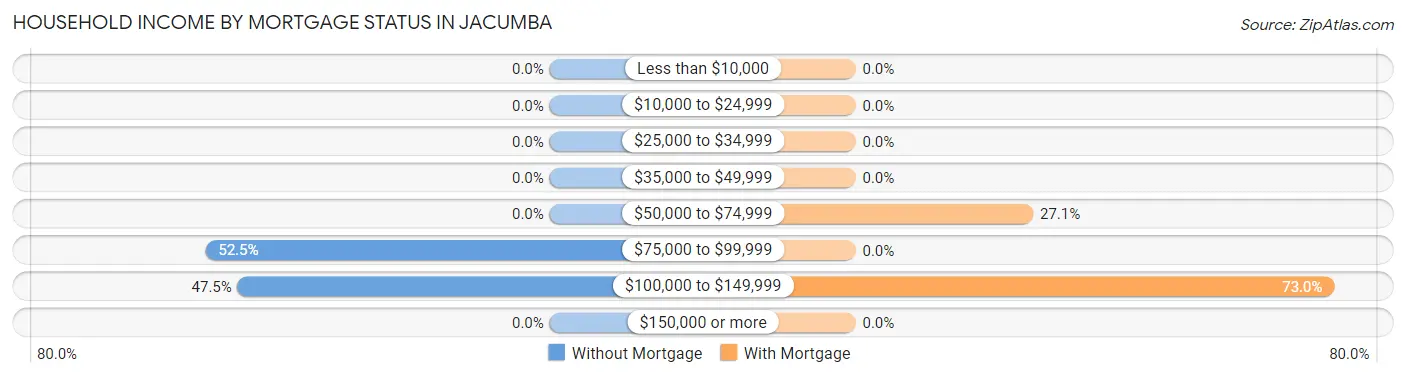
| Household Income | Without Mortgage | With Mortgage |
| Less than $10,000 | 0 (0.0%) | 0 (0.0%) |
| $10,000 to $24,999 | 0 (0.0%) | 0 (0.0%) |
| $25,000 to $34,999 | 0 (0.0%) | 0 (0.0%) |
| $35,000 to $49,999 | 0 (0.0%) | 0 (0.0%) |
| $50,000 to $74,999 | 0 (0.0%) | 33 (27.1%) |
| $75,000 to $99,999 | 32 (52.5%) | 0 (0.0%) |
| $100,000 to $149,999 | 29 (47.5%) | 89 (73.0%) |
| $150,000 or more | 0 (0.0%) | 0 (0.0%) |
| Total | 61 (100.0%) | 122 (100.0%) |
Property Value to Household Income Ratio in Jacumba
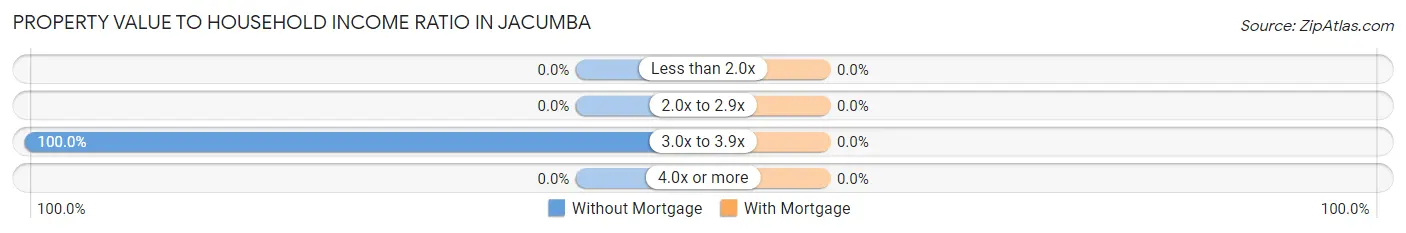
| Value-to-Income Ratio | Without Mortgage | With Mortgage |
| Less than 2.0x | 0 (0.0%) | 0 (0.0%) |
| 2.0x to 2.9x | 0 (0.0%) | 0 (0.0%) |
| 3.0x to 3.9x | 61 (100.0%) | 0 (0.0%) |
| 4.0x or more | 0 (0.0%) | 0 (0.0%) |
| Total | 61 (100.0%) | 122 (100.0%) |
Real Estate Taxes by Mortgage Status in Jacumba
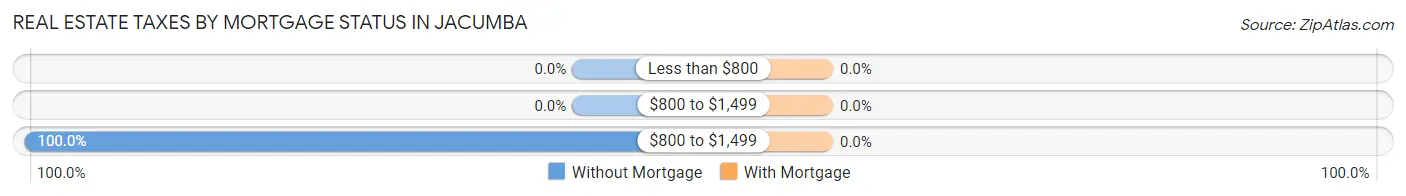
| Property Taxes | Without Mortgage | With Mortgage |
| Less than $800 | 0 (0.0%) | 0 (0.0%) |
| $800 to $1,499 | 0 (0.0%) | 0 (0.0%) |
| $800 to $1,499 | 61 (100.0%) | 0 (0.0%) |
| Total | 61 (100.0%) | 122 (100.0%) |
Health & Disability in Jacumba
Health Insurance Coverage by Age in Jacumba
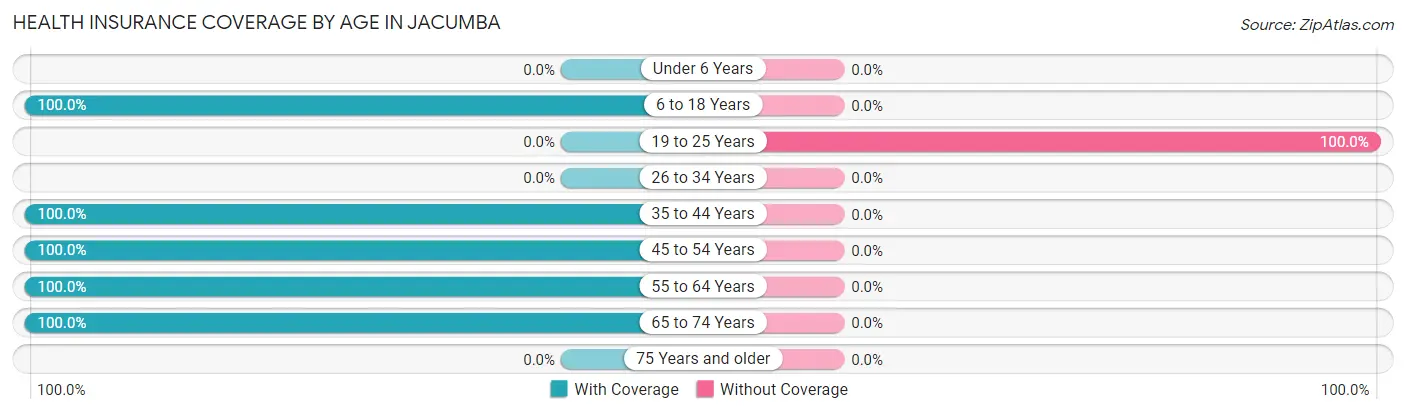
| Age Bracket | With Coverage | Without Coverage |
| Under 6 Years | 0 (0.0%) | 0 (0.0%) |
| 6 to 18 Years | 33 (100.0%) | 0 (0.0%) |
| 19 to 25 Years | 0 (0.0%) | 88 (100.0%) |
| 26 to 34 Years | 0 (0.0%) | 0 (0.0%) |
| 35 to 44 Years | 30 (100.0%) | 0 (0.0%) |
| 45 to 54 Years | 95 (100.0%) | 0 (0.0%) |
| 55 to 64 Years | 449 (100.0%) | 0 (0.0%) |
| 65 to 74 Years | 162 (100.0%) | 0 (0.0%) |
| 75 Years and older | 0 (0.0%) | 0 (0.0%) |
| Total | 769 (89.7%) | 88 (10.3%) |
Health Insurance Coverage by Citizenship Status in Jacumba
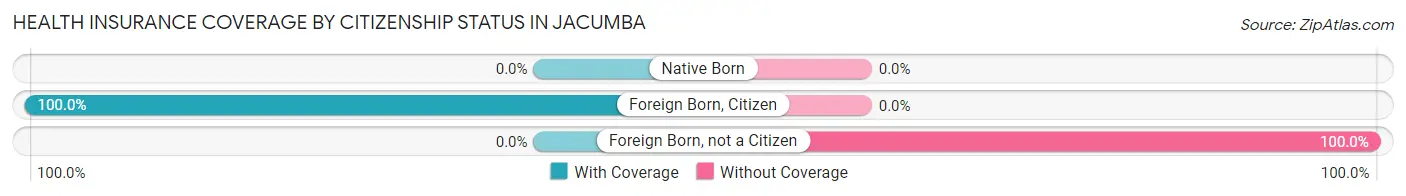
| Citizenship Status | With Coverage | Without Coverage |
| Native Born | 0 (0.0%) | 0 (0.0%) |
| Foreign Born, Citizen | 33 (100.0%) | 0 (0.0%) |
| Foreign Born, not a Citizen | 0 (0.0%) | 88 (100.0%) |
Health Insurance Coverage by Household Income in Jacumba
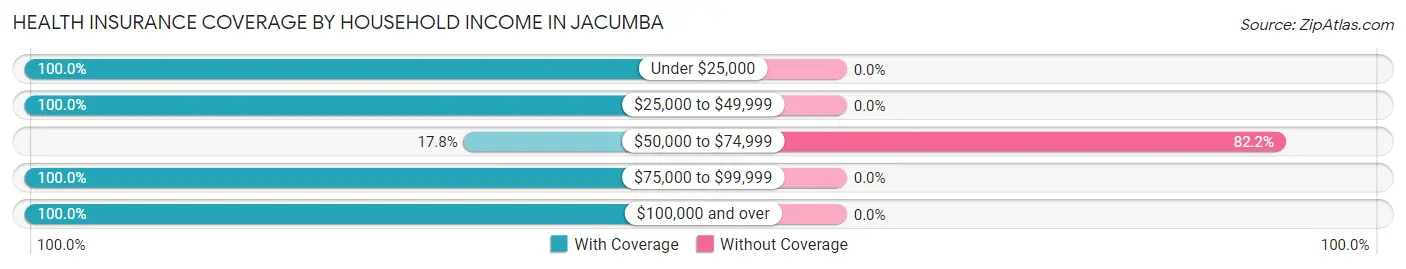
| Household Income | With Coverage | Without Coverage |
| Under $25,000 | 355 (100.0%) | 0 (0.0%) |
| $25,000 to $49,999 | 63 (100.0%) | 0 (0.0%) |
| $50,000 to $74,999 | 19 (17.8%) | 88 (82.2%) |
| $75,000 to $99,999 | 273 (100.0%) | 0 (0.0%) |
| $100,000 and over | 59 (100.0%) | 0 (0.0%) |
Public vs Private Health Insurance Coverage by Age in Jacumba
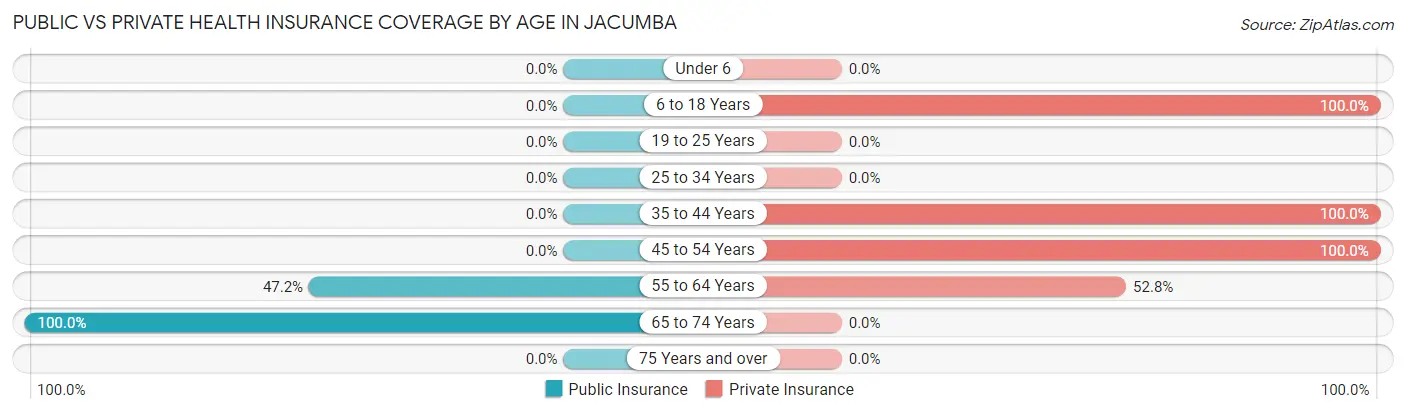
| Age Bracket | Public Insurance | Private Insurance |
| Under 6 | 0 (0.0%) | 0 (0.0%) |
| 6 to 18 Years | 0 (0.0%) | 33 (100.0%) |
| 19 to 25 Years | 0 (0.0%) | 0 (0.0%) |
| 25 to 34 Years | 0 (0.0%) | 0 (0.0%) |
| 35 to 44 Years | 0 (0.0%) | 30 (100.0%) |
| 45 to 54 Years | 0 (0.0%) | 95 (100.0%) |
| 55 to 64 Years | 212 (47.2%) | 237 (52.8%) |
| 65 to 74 Years | 162 (100.0%) | 0 (0.0%) |
| 75 Years and over | 0 (0.0%) | 0 (0.0%) |
| Total | 374 (43.6%) | 395 (46.1%) |
Disability Status by Sex by Age in Jacumba
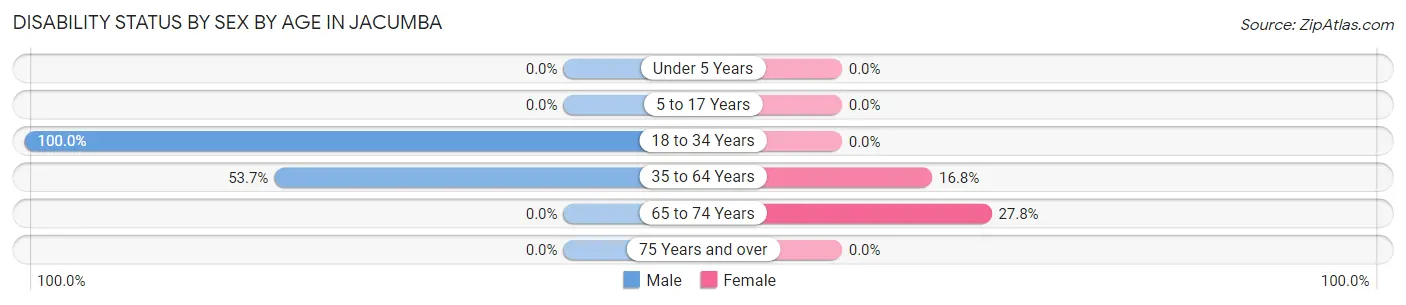
| Age Bracket | Male | Female |
| Under 5 Years | 0 (0.0%) | 0 (0.0%) |
| 5 to 17 Years | 0 (0.0%) | 0 (0.0%) |
| 18 to 34 Years | 88 (100.0%) | 0 (0.0%) |
| 35 to 64 Years | 212 (53.7%) | 30 (16.8%) |
| 65 to 74 Years | 0 (0.0%) | 45 (27.8%) |
| 75 Years and over | 0 (0.0%) | 0 (0.0%) |
Disability Class by Sex by Age in Jacumba
Disability Class: Hearing Difficulty
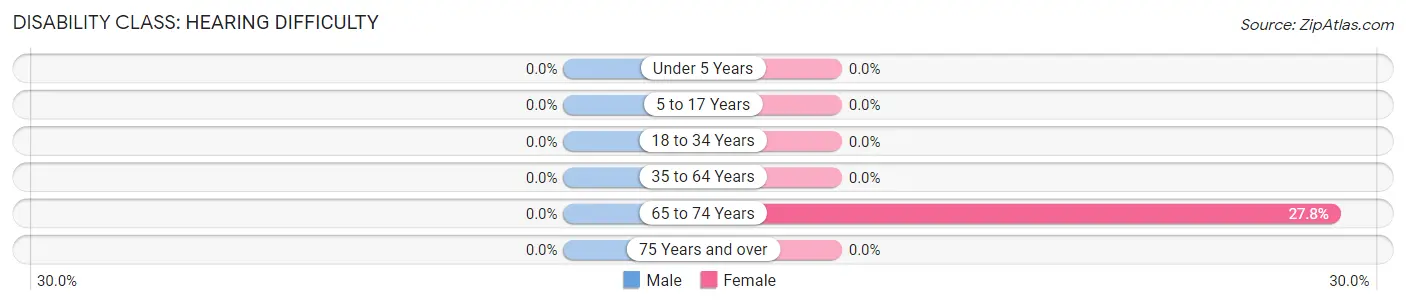
| Age Bracket | Male | Female |
| Under 5 Years | 0 (0.0%) | 0 (0.0%) |
| 5 to 17 Years | 0 (0.0%) | 0 (0.0%) |
| 18 to 34 Years | 0 (0.0%) | 0 (0.0%) |
| 35 to 64 Years | 0 (0.0%) | 0 (0.0%) |
| 65 to 74 Years | 0 (0.0%) | 45 (27.8%) |
| 75 Years and over | 0 (0.0%) | 0 (0.0%) |
Disability Class: Vision Difficulty
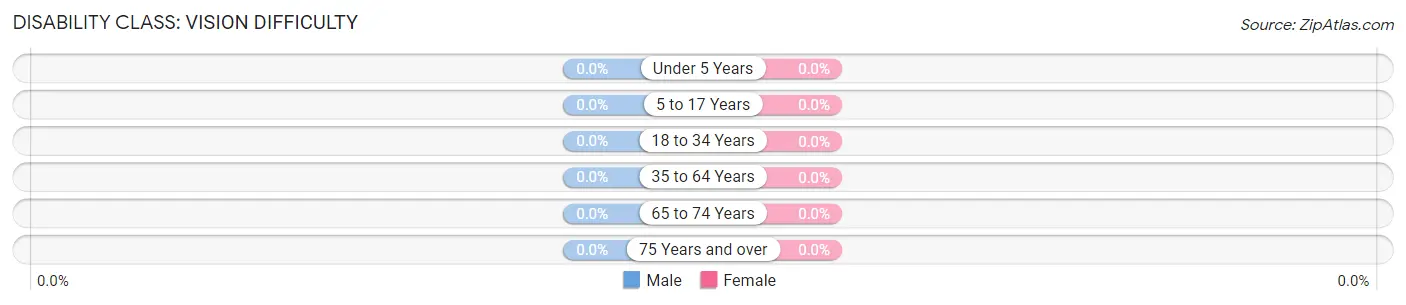
| Age Bracket | Male | Female |
| Under 5 Years | 0 (0.0%) | 0 (0.0%) |
| 5 to 17 Years | 0 (0.0%) | 0 (0.0%) |
| 18 to 34 Years | 0 (0.0%) | 0 (0.0%) |
| 35 to 64 Years | 0 (0.0%) | 0 (0.0%) |
| 65 to 74 Years | 0 (0.0%) | 0 (0.0%) |
| 75 Years and over | 0 (0.0%) | 0 (0.0%) |
Disability Class: Cognitive Difficulty
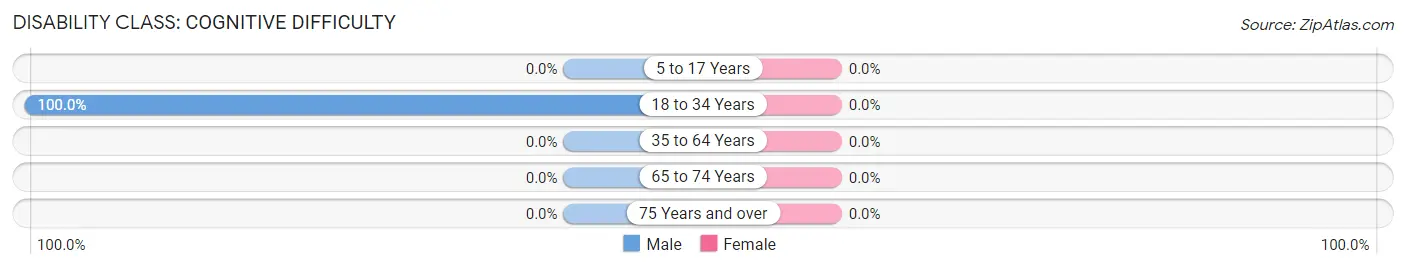
| Age Bracket | Male | Female |
| 5 to 17 Years | 0 (0.0%) | 0 (0.0%) |
| 18 to 34 Years | 88 (100.0%) | 0 (0.0%) |
| 35 to 64 Years | 0 (0.0%) | 0 (0.0%) |
| 65 to 74 Years | 0 (0.0%) | 0 (0.0%) |
| 75 Years and over | 0 (0.0%) | 0 (0.0%) |
Disability Class: Ambulatory Difficulty
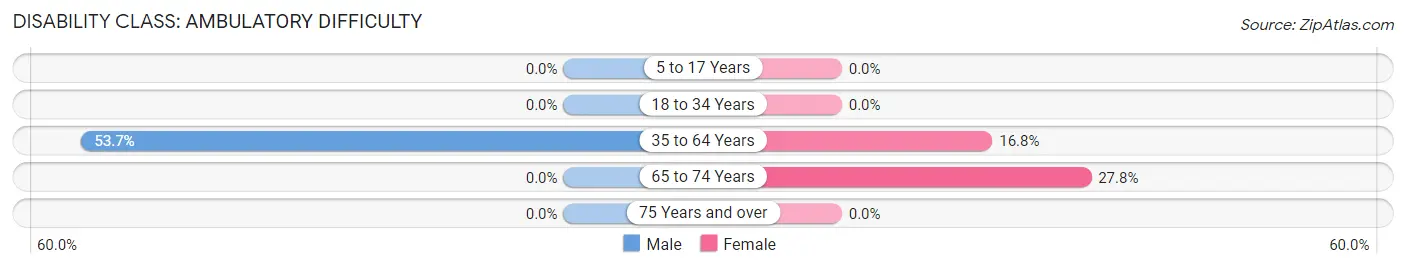
| Age Bracket | Male | Female |
| 5 to 17 Years | 0 (0.0%) | 0 (0.0%) |
| 18 to 34 Years | 0 (0.0%) | 0 (0.0%) |
| 35 to 64 Years | 212 (53.7%) | 30 (16.8%) |
| 65 to 74 Years | 0 (0.0%) | 45 (27.8%) |
| 75 Years and over | 0 (0.0%) | 0 (0.0%) |
Disability Class: Self-Care Difficulty
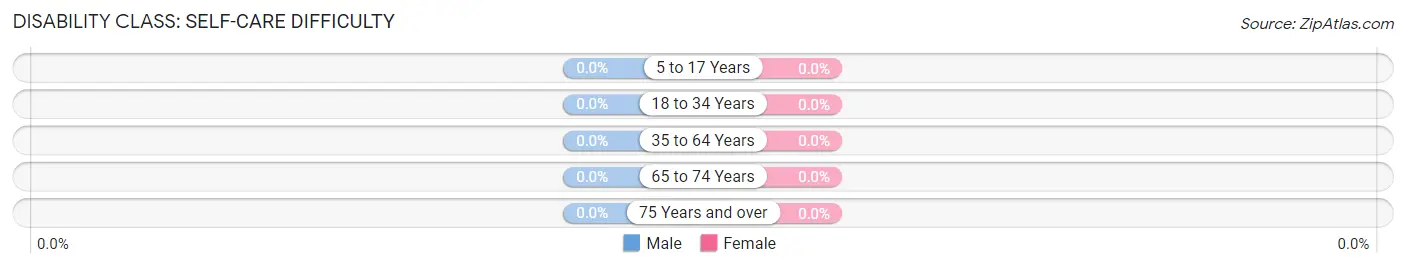
| Age Bracket | Male | Female |
| 5 to 17 Years | 0 (0.0%) | 0 (0.0%) |
| 18 to 34 Years | 0 (0.0%) | 0 (0.0%) |
| 35 to 64 Years | 0 (0.0%) | 0 (0.0%) |
| 65 to 74 Years | 0 (0.0%) | 0 (0.0%) |
| 75 Years and over | 0 (0.0%) | 0 (0.0%) |
Technology Access in Jacumba
Computing Device Access in Jacumba
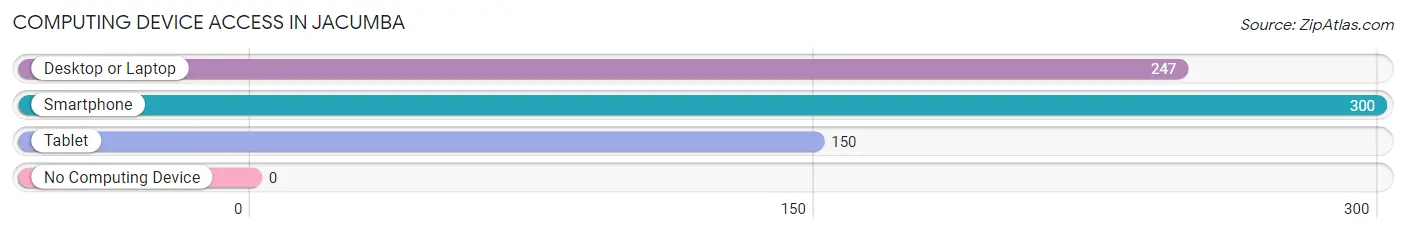
| Device Type | # Households | % Households |
| Desktop or Laptop | 247 | 71.6% |
| Smartphone | 300 | 87.0% |
| Tablet | 150 | 43.5% |
| No Computing Device | 0 | 0.0% |
| Total | 345 | 100.0% |
Internet Access in Jacumba
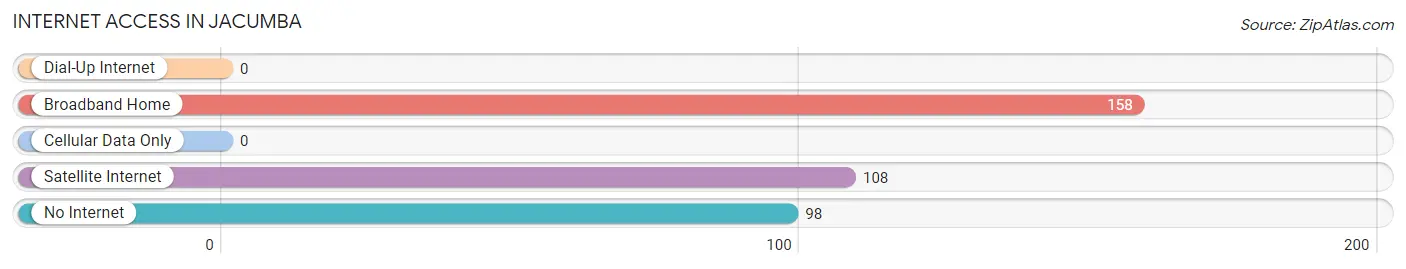
| Internet Type | # Households | % Households |
| Dial-Up Internet | 0 | 0.0% |
| Broadband Home | 158 | 45.8% |
| Cellular Data Only | 0 | 0.0% |
| Satellite Internet | 108 | 31.3% |
| No Internet | 98 | 28.4% |
| Total | 345 | 100.0% |
Jacumba Summary
Jacumba, California is a small unincorporated community located in San Diego County, California. It is situated in the Jacumba Mountains, approximately 30 miles east of San Diego. The town is located on the U.S.-Mexico border, and is home to a population of approximately 500 people.
History
Jacumba was originally inhabited by the Kumeyaay people, who were the original inhabitants of the area. The Kumeyaay were hunter-gatherers who lived in the area for thousands of years before the arrival of Europeans. The first Europeans to settle in the area were Spanish missionaries, who established a mission in the area in 1774. The mission was abandoned in 1821, and the area was later settled by American settlers in the late 19th century.
The town of Jacumba was founded in 1912 by the Southern Pacific Railroad, which built a railroad line through the area. The town was named after the nearby Jacumba Mountains, which were named after the Kumeyaay word for “place of the dead”. The town grew rapidly in the early 20th century, and by the 1930s it had become a popular tourist destination.
Geography
Jacumba is located in the Jacumba Mountains, which are part of the Peninsular Ranges of Southern California. The town is situated at an elevation of 2,890 feet, and is surrounded by the Anza-Borrego Desert State Park. The town is located on the U.S.-Mexico border, and is approximately 30 miles east of San Diego.
The climate in Jacumba is semi-arid, with hot summers and mild winters. The average annual temperature is 68°F, and the average annual precipitation is 8.5 inches.
Economy
The economy of Jacumba is largely based on tourism. The town is a popular destination for outdoor activities such as camping, hiking, and off-roading. The town is also home to a number of art galleries, restaurants, and shops.
The town is also home to a number of small businesses, including a gas station, a post office, and a grocery store. The town is also home to a number of small manufacturing businesses, including a furniture factory and a metal fabrication shop.
Demographics
As of the 2010 census, the population of Jacumba was 498. The racial makeup of the town was 75.2% White, 0.2% African American, 0.4% Native American, 0.2% Asian, 0.2% Pacific Islander, 22.2% from other races, and 1.8% from two or more races. Hispanic or Latino of any race were 44.2% of the population.
The median household income in Jacumba was $31,250, and the median family income was $35,417. The per capita income for the town was $14,945. About 18.2% of families and 22.2% of the population were below the poverty line, including 33.3% of those under age 18 and 10.0% of those age 65 or over.
Common Questions
What is Per Capita Income in Jacumba?
Per Capita income in Jacumba is $22,361.
What is Income or Wage Gap in Jacumba?
Income or Wage Gap in Jacumba is 50.0%.
Women in Jacumba earn 50.0 cents for every dollar earned by a man.
What is Inequality or Gini Index in Jacumba?
Inequality or Gini Index in Jacumba is 0.44.
What is the Total Population of Jacumba?
Total Population of Jacumba is 857.
What is the Total Male Population of Jacumba?
Total Male Population of Jacumba is 516.
What is the Total Female Population of Jacumba?
Total Female Population of Jacumba is 341.
What is the Ratio of Males per 100 Females in Jacumba?
There are 151.32 Males per 100 Females in Jacumba.
What is the Ratio of Females per 100 Males in Jacumba?
There are 66.09 Females per 100 Males in Jacumba.
What is the Median Population Age in Jacumba?
Median Population Age in Jacumba is 62.4 Years.
What is the Average Family Size in Jacumba
Average Family Size in Jacumba is 2.8 People.
What is the Average Household Size in Jacumba
Average Household Size in Jacumba is 2.5 People.
How Large is the Labor Force in Jacumba?
There are 421 People in the Labor Forcein in Jacumba.
What is the Percentage of People in the Labor Force in Jacumba?
49.1% of People are in the Labor Force in Jacumba.
What is the Unemployment Rate in Jacumba?
Unemployment Rate in Jacumba is 20.9%.