Zip Codes with the Highest Percentage of Households with Income Below $10,000 in San Jose, CA
RELATED REPORTS & OPTIONS
Household Income | $0-10k
San Jose
Compare Zip Codes
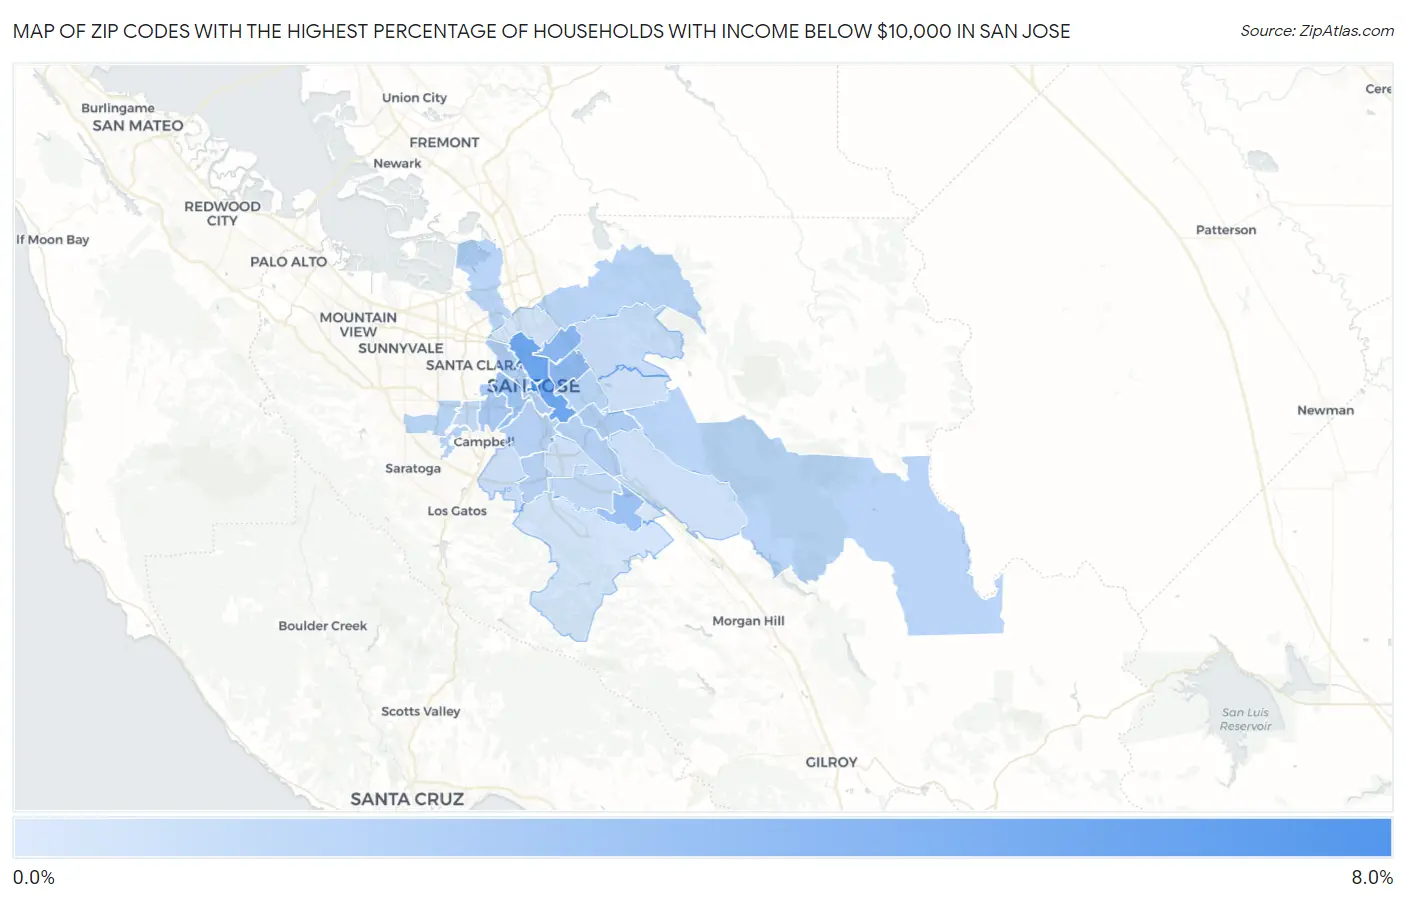
Map of Zip Codes with the Highest Percentage of Households with Income Below $10,000 in San Jose
0.90%
7.8%
Zip Codes with the Highest Percentage of Households with Income Below $10,000 in San Jose, CA
| Zip Code | Households with Income < $10k | vs State | vs National | |
| 1. | 95113 | 7.8% | 4.4%(+3.40)#266 | 4.9%(+2.90)#5,887 |
| 2. | 95112 | 6.0% | 4.4%(+1.60)#431 | 4.9%(+1.10)#8,955 |
| 3. | 95133 | 4.6% | 4.4%(+0.200)#678 | 4.9%(-0.300)#13,028 |
| 4. | 95116 | 4.5% | 4.4%(+0.100)#694 | 4.9%(-0.400)#13,318 |
| 5. | 95119 | 3.8% | 4.4%(-0.600)#889 | 4.9%(-1.10)#16,127 |
| 6. | 95126 | 3.7% | 4.4%(-0.700)#902 | 4.9%(-1.20)#16,403 |
| 7. | 95128 | 3.2% | 4.4%(-1.20)#1,071 | 4.9%(-1.70)#18,495 |
| 8. | 95121 | 2.9% | 4.4%(-1.50)#1,164 | 4.9%(-2.00)#19,808 |
| 9. | 95110 | 2.9% | 4.4%(-1.50)#1,177 | 4.9%(-2.00)#19,883 |
| 10. | 95111 | 2.7% | 4.4%(-1.70)#1,211 | 4.9%(-2.20)#20,643 |
| 11. | 95125 | 2.6% | 4.4%(-1.80)#1,235 | 4.9%(-2.30)#21,050 |
| 12. | 95118 | 2.6% | 4.4%(-1.80)#1,240 | 4.9%(-2.30)#21,094 |
| 13. | 95122 | 2.5% | 4.4%(-1.90)#1,256 | 4.9%(-2.40)#21,533 |
| 14. | 95135 | 2.5% | 4.4%(-1.90)#1,270 | 4.9%(-2.40)#21,609 |
| 15. | 95132 | 2.4% | 4.4%(-2.00)#1,284 | 4.9%(-2.50)#21,998 |
| 16. | 95129 | 2.4% | 4.4%(-2.00)#1,286 | 4.9%(-2.50)#22,000 |
| 17. | 95134 | 2.4% | 4.4%(-2.00)#1,288 | 4.9%(-2.50)#22,026 |
| 18. | 95130 | 2.4% | 4.4%(-2.00)#1,295 | 4.9%(-2.50)#22,108 |
| 19. | 95123 | 2.0% | 4.4%(-2.40)#1,368 | 4.9%(-2.90)#23,553 |
| 20. | 95117 | 2.0% | 4.4%(-2.40)#1,376 | 4.9%(-2.90)#23,613 |
| 21. | 95127 | 1.8% | 4.4%(-2.60)#1,408 | 4.9%(-3.10)#24,323 |
| 22. | 95124 | 1.6% | 4.4%(-2.80)#1,442 | 4.9%(-3.30)#25,052 |
| 23. | 95136 | 1.5% | 4.4%(-2.90)#1,455 | 4.9%(-3.40)#25,392 |
| 24. | 95148 | 1.5% | 4.4%(-2.90)#1,456 | 4.9%(-3.40)#25,393 |
| 25. | 95138 | 1.5% | 4.4%(-2.90)#1,458 | 4.9%(-3.40)#25,440 |
| 26. | 95131 | 1.4% | 4.4%(-3.00)#1,467 | 4.9%(-3.50)#25,712 |
| 27. | 95120 | 1.3% | 4.4%(-3.10)#1,472 | 4.9%(-3.60)#26,001 |
| 28. | 95139 | 0.90% | 4.4%(-3.50)#1,513 | 4.9%(-4.00)#27,067 |
1
Common Questions
What are the Top 10 Zip Codes with the Highest Percentage of Households with Income Below $10,000 in San Jose, CA?
Top 10 Zip Codes with the Highest Percentage of Households with Income Below $10,000 in San Jose, CA are:
What zip code has the Highest Percentage of Households with Income Below $10,000 in San Jose, CA?
95113 has the Highest Percentage of Households with Income Below $10,000 in San Jose, CA with 7.8%.
What is the Percentage of Households with Income Below $10,000 in San Jose, CA?
Percentage of Households with Income Below $10,000 in San Jose is 2.7%.
What is the Percentage of Households with Income Below $10,000 in California?
Percentage of Households with Income Below $10,000 in California is 4.4%.
What is the Percentage of Households with Income Below $10,000 in the United States?
Percentage of Households with Income Below $10,000 in the United States is 4.9%.