Davenport, CA Map & Demographics
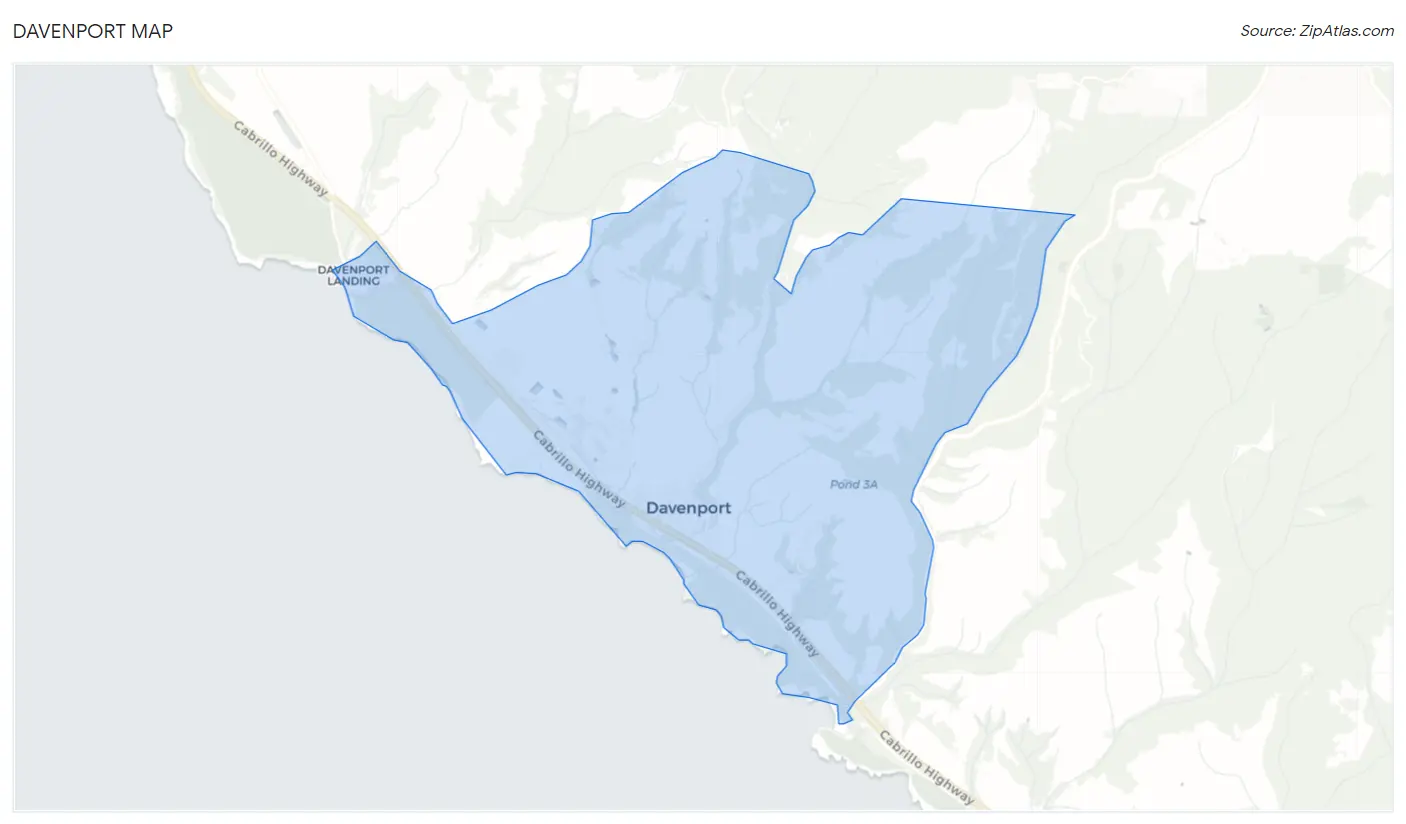
Davenport Map
Davenport Overview
$25,452
PER CAPITA INCOME
$78,819
AVG FAMILY INCOME
$65,855
AVG HOUSEHOLD INCOME
49.5%
WAGE / INCOME GAP [ % ]
50.5¢/ $1
WAGE / INCOME GAP [ $ ]
0.51
INEQUALITY / GINI INDEX
650
TOTAL POPULATION
344
MALE POPULATION
306
FEMALE POPULATION
112.42
MALES / 100 FEMALES
88.95
FEMALES / 100 MALES
32.4
MEDIAN AGE
4.7
AVG FAMILY SIZE
3.5
AVG HOUSEHOLD SIZE
274
LABOR FORCE [ PEOPLE ]
58.2%
PERCENT IN LABOR FORCE
10.2%
UNEMPLOYMENT RATE
Davenport Zip Codes
Davenport Area Codes
Income in Davenport
Income Overview in Davenport
Per Capita Income in Davenport is $25,452, while median incomes of families and households are $78,819 and $65,855 respectively.
| Characteristic | Number | Measure |
| Per Capita Income | 650 | $25,452 |
| Median Family Income | 117 | $78,819 |
| Mean Family Income | 117 | $115,821 |
| Median Household Income | 169 | $65,855 |
| Mean Household Income | 169 | $90,207 |
| Income Deficit | 117 | $0 |
| Wage / Income Gap (%) | 650 | 49.47% |
| Wage / Income Gap ($) | 650 | 50.53¢ per $1 |
| Gini / Inequality Index | 650 | 0.51 |
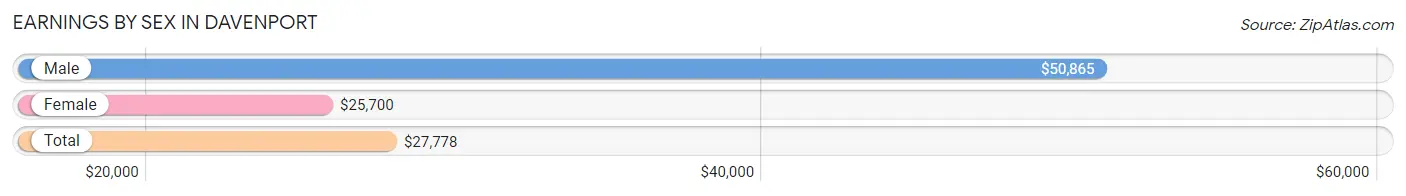
Earnings by Sex in Davenport
Average Earnings in Davenport are $27,778, $50,865 for men and $25,700 for women, a difference of 49.5%.
| Sex | Number | Average Earnings |
| Male | 140 (48.3%) | $50,865 |
| Female | 150 (51.7%) | $25,700 |
| Total | 290 (100.0%) | $27,778 |
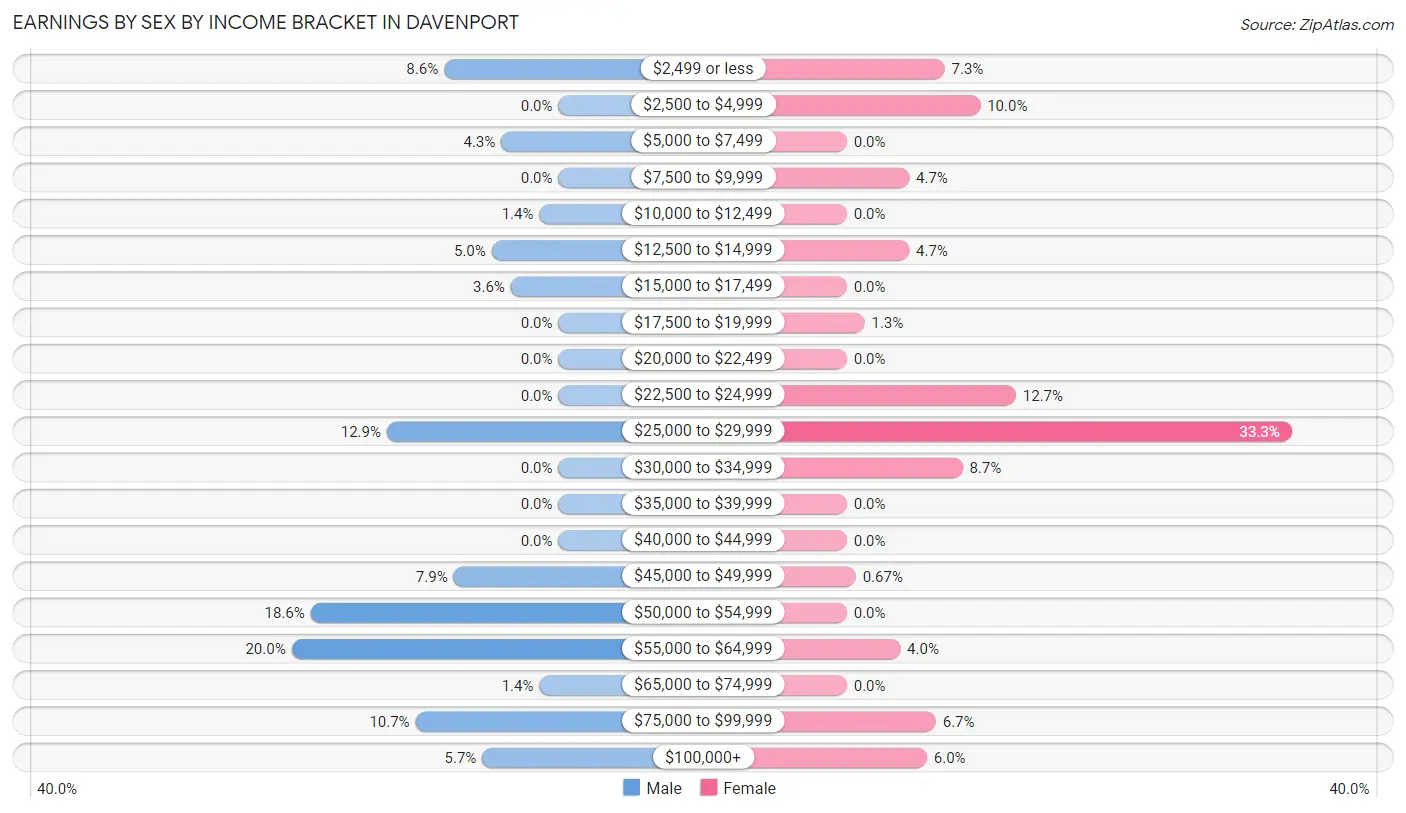
Earnings by Sex by Income Bracket in Davenport
The most common earnings brackets in Davenport are $55,000 to $64,999 for men (28 | 20.0%) and $25,000 to $29,999 for women (50 | 33.3%).
| Income | Male | Female |
| $2,499 or less | 12 (8.6%) | 11 (7.3%) |
| $2,500 to $4,999 | 0 (0.0%) | 15 (10.0%) |
| $5,000 to $7,499 | 6 (4.3%) | 0 (0.0%) |
| $7,500 to $9,999 | 0 (0.0%) | 7 (4.7%) |
| $10,000 to $12,499 | 2 (1.4%) | 0 (0.0%) |
| $12,500 to $14,999 | 7 (5.0%) | 7 (4.7%) |
| $15,000 to $17,499 | 5 (3.6%) | 0 (0.0%) |
| $17,500 to $19,999 | 0 (0.0%) | 2 (1.3%) |
| $20,000 to $22,499 | 0 (0.0%) | 0 (0.0%) |
| $22,500 to $24,999 | 0 (0.0%) | 19 (12.7%) |
| $25,000 to $29,999 | 18 (12.9%) | 50 (33.3%) |
| $30,000 to $34,999 | 0 (0.0%) | 13 (8.7%) |
| $35,000 to $39,999 | 0 (0.0%) | 0 (0.0%) |
| $40,000 to $44,999 | 0 (0.0%) | 0 (0.0%) |
| $45,000 to $49,999 | 11 (7.9%) | 1 (0.7%) |
| $50,000 to $54,999 | 26 (18.6%) | 0 (0.0%) |
| $55,000 to $64,999 | 28 (20.0%) | 6 (4.0%) |
| $65,000 to $74,999 | 2 (1.4%) | 0 (0.0%) |
| $75,000 to $99,999 | 15 (10.7%) | 10 (6.7%) |
| $100,000+ | 8 (5.7%) | 9 (6.0%) |
| Total | 140 (100.0%) | 150 (100.0%) |
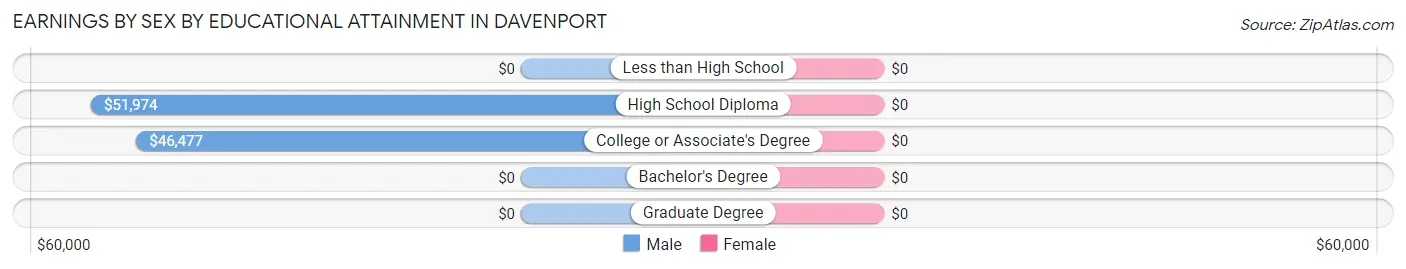
Earnings by Sex by Educational Attainment in Davenport
| Educational Attainment | Male Income | Female Income |
| Less than High School | - | - |
| High School Diploma | $51,974 | $0 |
| College or Associate's Degree | $46,477 | $0 |
| Bachelor's Degree | - | - |
| Graduate Degree | - | - |
| Total | $51,106 | $25,875 |
Family Income in Davenport
Family Income Brackets in Davenport
According to the Davenport family income data, there are 28 families falling into the $50,000 to $74,999 income range, which is the most common income bracket and makes up 23.9% of all families.
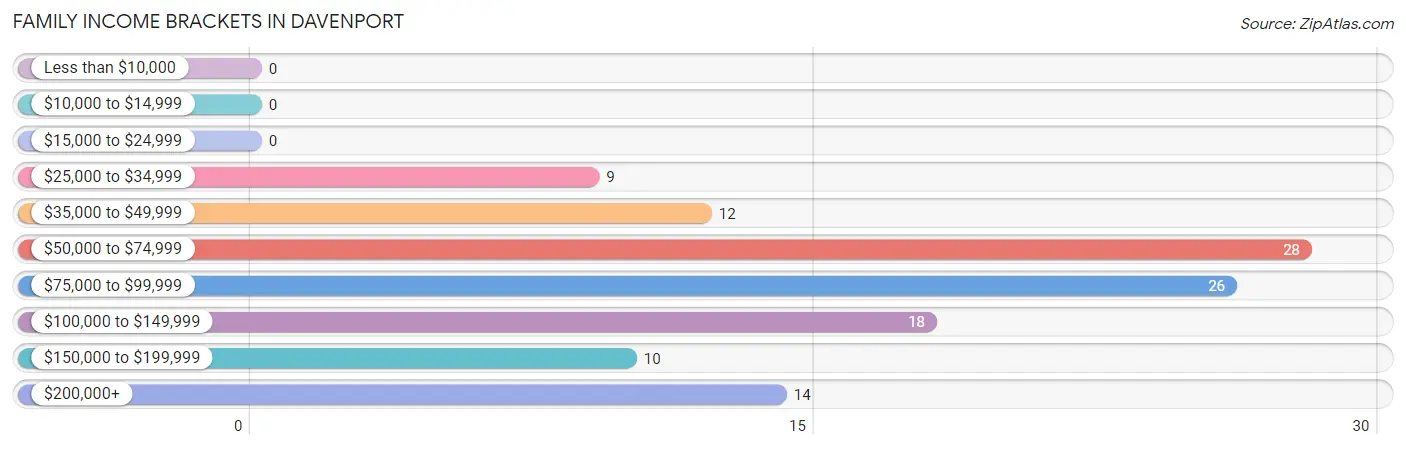
| Income Bracket | # Families | % Families |
| Less than $10,000 | 0 | 0.0% |
| $10,000 to $14,999 | 0 | 0.0% |
| $15,000 to $24,999 | 0 | 0.0% |
| $25,000 to $34,999 | 9 | 7.7% |
| $35,000 to $49,999 | 12 | 10.3% |
| $50,000 to $74,999 | 28 | 23.9% |
| $75,000 to $99,999 | 26 | 22.2% |
| $100,000 to $149,999 | 18 | 15.4% |
| $150,000 to $199,999 | 10 | 8.5% |
| $200,000+ | 14 | 12.0% |
Family Income by Famaliy Size in Davenport
2-person families (28 | 23.9%) account for the highest median family income in Davenport with $145,357 per family, while 2-person families (28 | 23.9%) have the highest median income of $72,678 per family member.
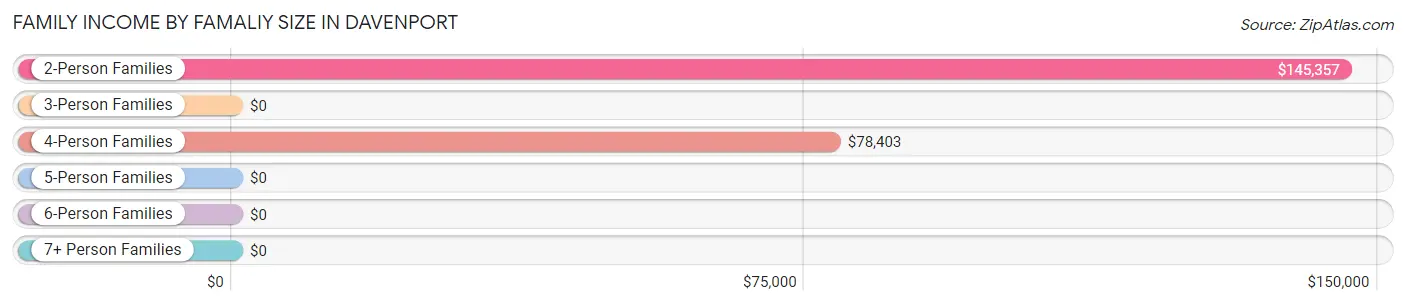
| Income Bracket | # Families | Median Income |
| 2-Person Families | 28 (23.9%) | $145,357 |
| 3-Person Families | 16 (13.7%) | $0 |
| 4-Person Families | 41 (35.0%) | $78,403 |
| 5-Person Families | 0 (0.0%) | $0 |
| 6-Person Families | 18 (15.4%) | $0 |
| 7+ Person Families | 14 (12.0%) | $0 |
| Total | 117 (100.0%) | $78,819 |
Family Income by Number of Earners in Davenport
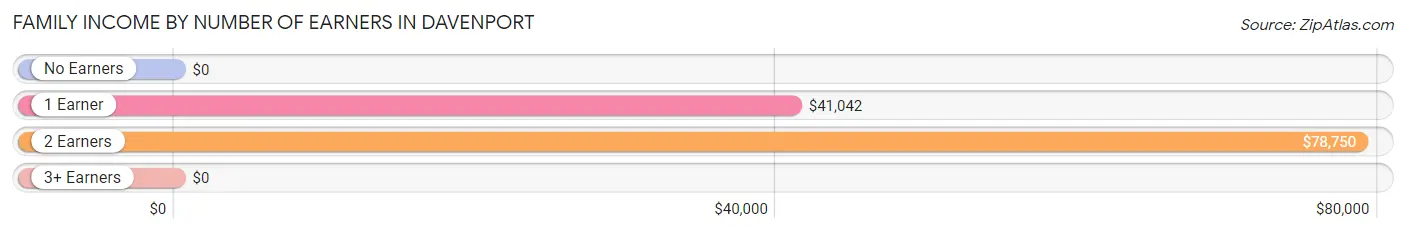
| Number of Earners | # Families | Median Income |
| No Earners | 9 (7.7%) | $0 |
| 1 Earner | 23 (19.7%) | $41,042 |
| 2 Earners | 74 (63.2%) | $78,750 |
| 3+ Earners | 11 (9.4%) | $0 |
| Total | 117 (100.0%) | $78,819 |
Household Income in Davenport
Household Income Brackets in Davenport
With 39 households falling in the category, the $50,000 to $74,999 income range is the most frequent in Davenport, accounting for 23.1% of all households.
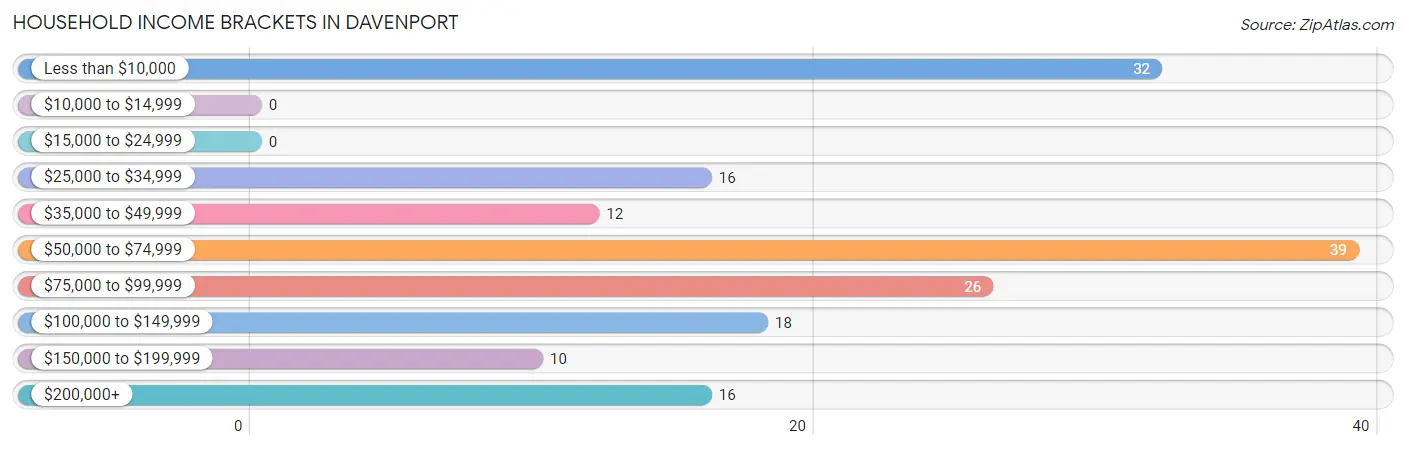
| Income Bracket | # Households | % Households |
| Less than $10,000 | 32 | 18.9% |
| $10,000 to $14,999 | 0 | 0.0% |
| $15,000 to $24,999 | 0 | 0.0% |
| $25,000 to $34,999 | 16 | 9.5% |
| $35,000 to $49,999 | 12 | 7.1% |
| $50,000 to $74,999 | 39 | 23.1% |
| $75,000 to $99,999 | 26 | 15.4% |
| $100,000 to $149,999 | 18 | 10.7% |
| $150,000 to $199,999 | 10 | 5.9% |
| $200,000+ | 16 | 9.5% |
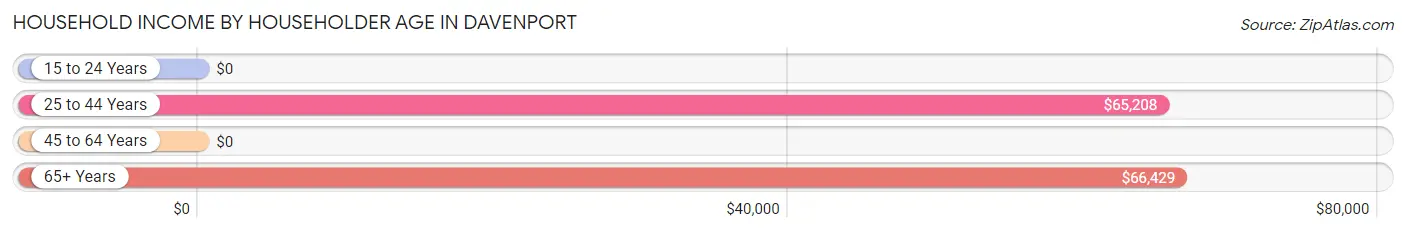
Household Income by Householder Age in Davenport
The median household income in Davenport is $65,855, with the highest median household income of $66,429 found in the 65+ years age bracket for the primary householder. A total of 46 households (27.2%) fall into this category.
| Income Bracket | # Households | Median Income |
| 15 to 24 Years | 0 (0.0%) | $0 |
| 25 to 44 Years | 44 (26.0%) | $65,208 |
| 45 to 64 Years | 79 (46.8%) | $0 |
| 65+ Years | 46 (27.2%) | $66,429 |
| Total | 169 (100.0%) | $65,855 |
Poverty in Davenport
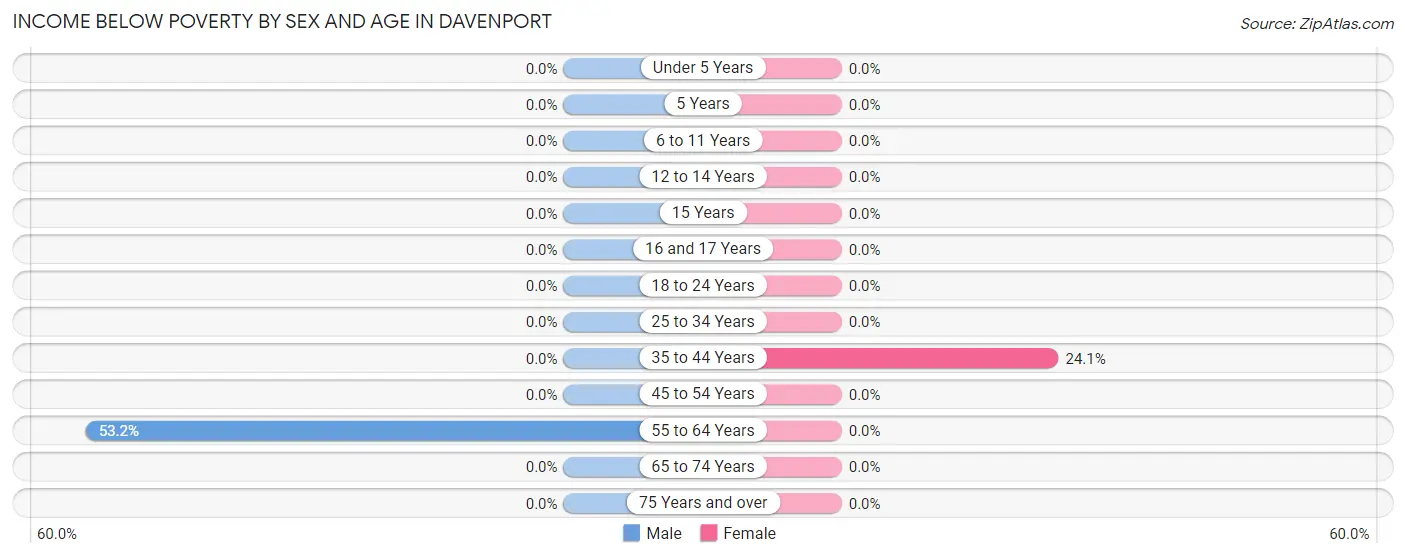
Income Below Poverty by Sex and Age in Davenport
With 7.3% poverty level for males and 2.3% for females among the residents of Davenport, 55 to 64 year old males and 35 to 44 year old females are the most vulnerable to poverty, with 25 males (53.2%) and 7 females (24.1%) in their respective age groups living below the poverty level.
| Age Bracket | Male | Female |
| Under 5 Years | 0 (0.0%) | 0 (0.0%) |
| 5 Years | 0 (0.0%) | 0 (0.0%) |
| 6 to 11 Years | 0 (0.0%) | 0 (0.0%) |
| 12 to 14 Years | 0 (0.0%) | 0 (0.0%) |
| 15 Years | 0 (0.0%) | 0 (0.0%) |
| 16 and 17 Years | 0 (0.0%) | 0 (0.0%) |
| 18 to 24 Years | 0 (0.0%) | 0 (0.0%) |
| 25 to 34 Years | 0 (0.0%) | 0 (0.0%) |
| 35 to 44 Years | 0 (0.0%) | 7 (24.1%) |
| 45 to 54 Years | 0 (0.0%) | 0 (0.0%) |
| 55 to 64 Years | 25 (53.2%) | 0 (0.0%) |
| 65 to 74 Years | 0 (0.0%) | 0 (0.0%) |
| 75 Years and over | 0 (0.0%) | 0 (0.0%) |
| Total | 25 (7.3%) | 7 (2.3%) |
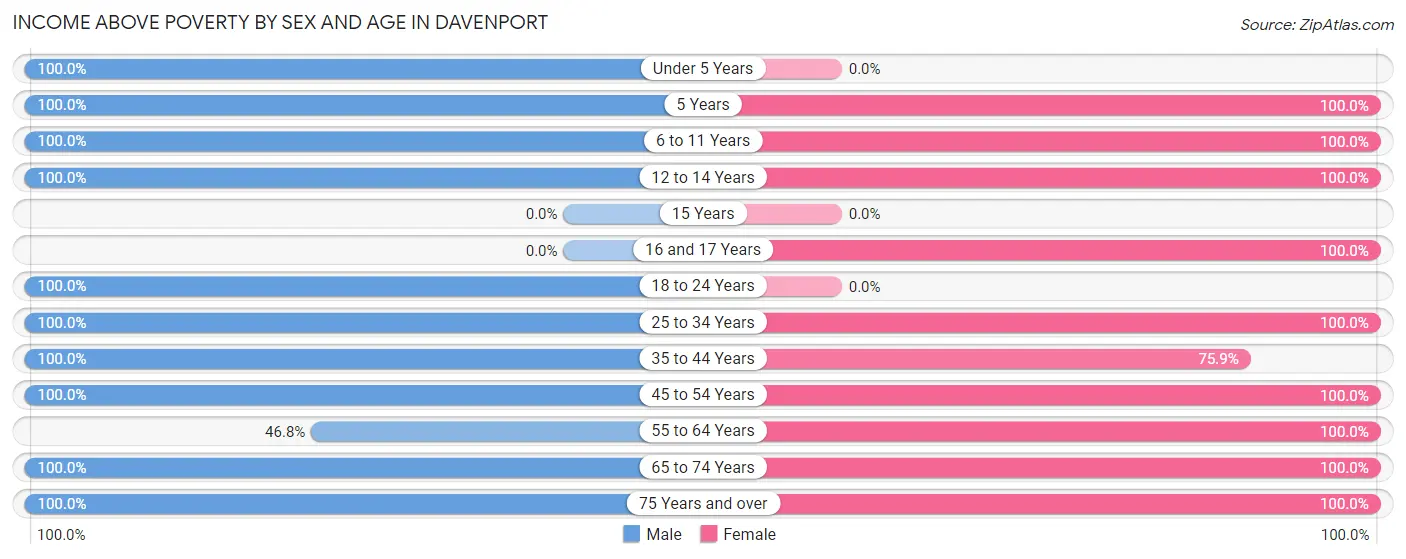
Income Above Poverty by Sex and Age in Davenport
According to the poverty statistics in Davenport, males aged under 5 years and females aged 5 years are the age groups that are most secure financially, with 100.0% of males and 100.0% of females in these age groups living above the poverty line.
| Age Bracket | Male | Female |
| Under 5 Years | 24 (100.0%) | 0 (0.0%) |
| 5 Years | 21 (100.0%) | 3 (100.0%) |
| 6 to 11 Years | 32 (100.0%) | 58 (100.0%) |
| 12 to 14 Years | 23 (100.0%) | 18 (100.0%) |
| 15 Years | 0 (0.0%) | 0 (0.0%) |
| 16 and 17 Years | 0 (0.0%) | 22 (100.0%) |
| 18 to 24 Years | 25 (100.0%) | 0 (0.0%) |
| 25 to 34 Years | 64 (100.0%) | 77 (100.0%) |
| 35 to 44 Years | 35 (100.0%) | 22 (75.9%) |
| 45 to 54 Years | 41 (100.0%) | 26 (100.0%) |
| 55 to 64 Years | 22 (46.8%) | 24 (100.0%) |
| 65 to 74 Years | 21 (100.0%) | 38 (100.0%) |
| 75 Years and over | 11 (100.0%) | 11 (100.0%) |
| Total | 319 (92.7%) | 299 (97.7%) |
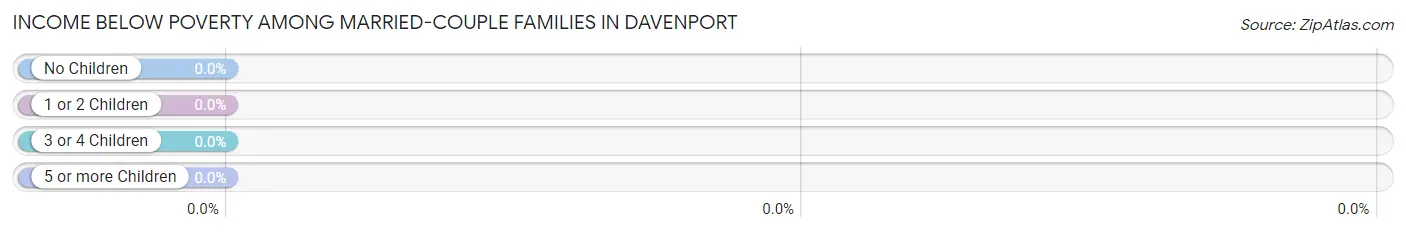
Income Below Poverty Among Married-Couple Families in Davenport
| Children | Above Poverty | Below Poverty |
| No Children | 43 (100.0%) | 0 (0.0%) |
| 1 or 2 Children | 28 (100.0%) | 0 (0.0%) |
| 3 or 4 Children | 18 (100.0%) | 0 (0.0%) |
| 5 or more Children | 9 (100.0%) | 0 (0.0%) |
| Total | 98 (100.0%) | 0 (0.0%) |
Income Below Poverty Among Single-Parent Households in Davenport
| Children | Single Father | Single Mother |
| No Children | 0 (0.0%) | 0 (0.0%) |
| 1 or 2 Children | 0 (0.0%) | 0 (0.0%) |
| 3 or 4 Children | 0 (0.0%) | 0 (0.0%) |
| 5 or more Children | 0 (0.0%) | 0 (0.0%) |
| Total | 0 (0.0%) | 0 (0.0%) |
Income Below Poverty Among Married-Couple vs Single-Parent Households in Davenport
| Children | Married-Couple Families | Single-Parent Households |
| No Children | 0 (0.0%) | 0 (0.0%) |
| 1 or 2 Children | 0 (0.0%) | 0 (0.0%) |
| 3 or 4 Children | 0 (0.0%) | 0 (0.0%) |
| 5 or more Children | 0 (0.0%) | 0 (0.0%) |
| Total | 0 (0.0%) | 0 (0.0%) |
Race in Davenport
The most populous races in Davenport are Hispanic or Latino (451 | 69.4%), White / Caucasian (286 | 44.0%), and Two or more Races (161 | 24.8%).
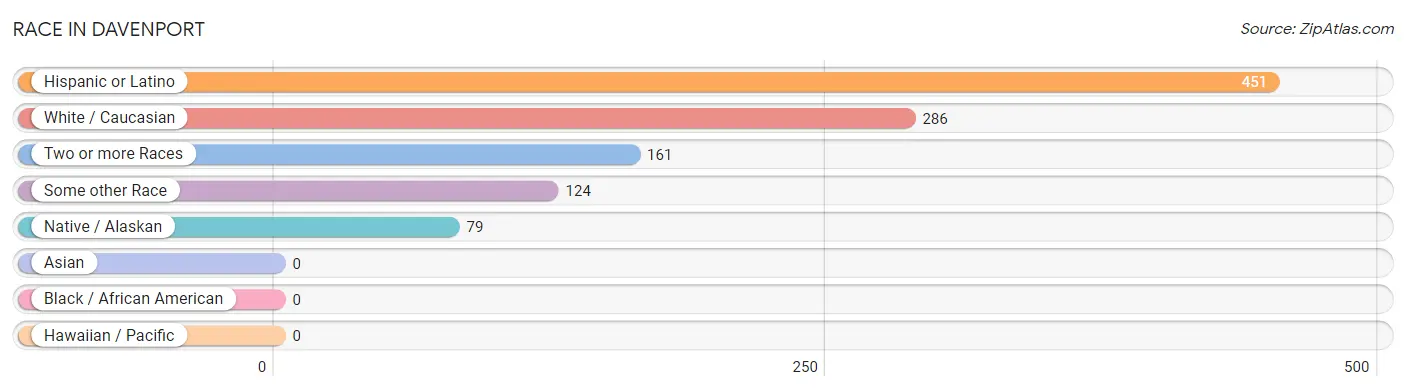
| Race | # Population | % Population |
| Asian | 0 | 0.0% |
| Black / African American | 0 | 0.0% |
| Hawaiian / Pacific | 0 | 0.0% |
| Hispanic or Latino | 451 | 69.4% |
| Native / Alaskan | 79 | 12.1% |
| White / Caucasian | 286 | 44.0% |
| Two or more Races | 161 | 24.8% |
| Some other Race | 124 | 19.1% |
| Total | 650 | 100.0% |
Ancestry in Davenport
The most populous ancestries reported in Davenport are Mexican (362 | 55.7%), Central American (83 | 12.8%), Salvadoran (83 | 12.8%), Mexican American Indian (79 | 12.1%), and Korean (32 | 4.9%), together accounting for 98.3% of all Davenport residents.
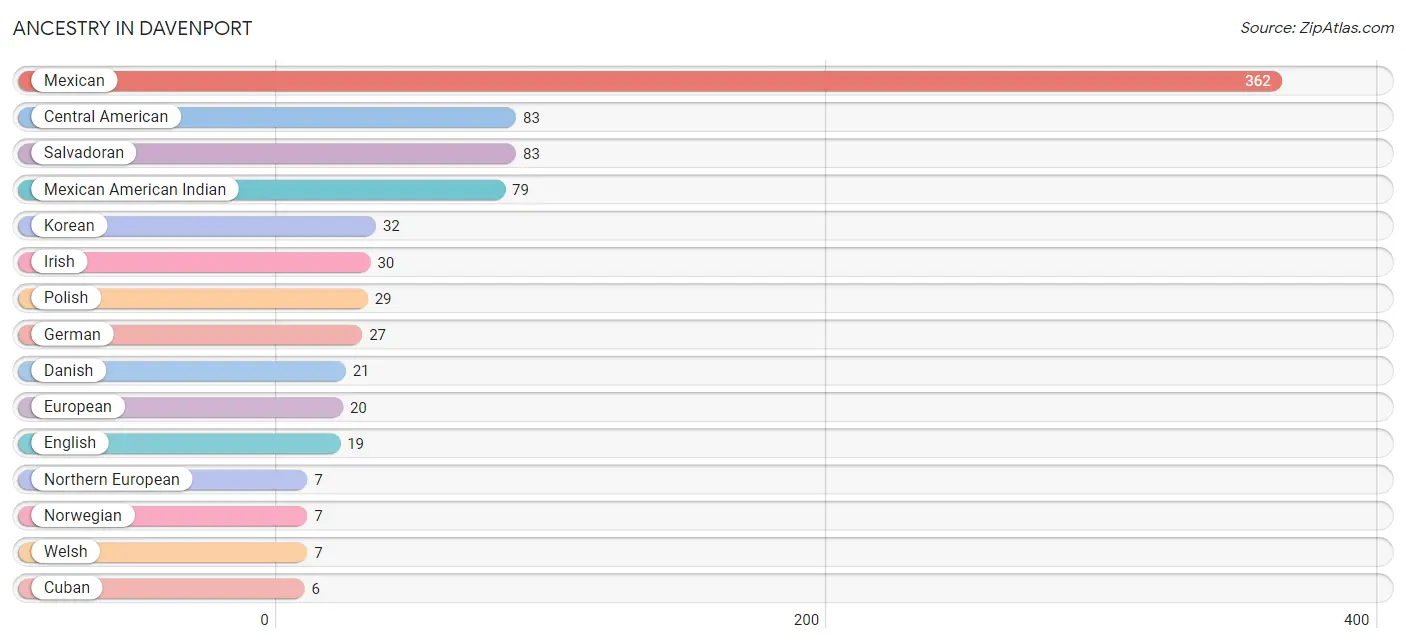
| Ancestry | # Population | % Population |
| American | 5 | 0.8% |
| Central American | 83 | 12.8% |
| Cuban | 6 | 0.9% |
| Danish | 21 | 3.2% |
| Eastern European | 6 | 0.9% |
| English | 19 | 2.9% |
| European | 20 | 3.1% |
| German | 27 | 4.2% |
| Irish | 30 | 4.6% |
| Italian | 6 | 0.9% |
| Korean | 32 | 4.9% |
| Mexican | 362 | 55.7% |
| Mexican American Indian | 79 | 12.1% |
| Northern European | 7 | 1.1% |
| Norwegian | 7 | 1.1% |
| Polish | 29 | 4.5% |
| Salvadoran | 83 | 12.8% |
| Scottish | 2 | 0.3% |
| Welsh | 7 | 1.1% | View All 19 Rows |
Immigrants in Davenport
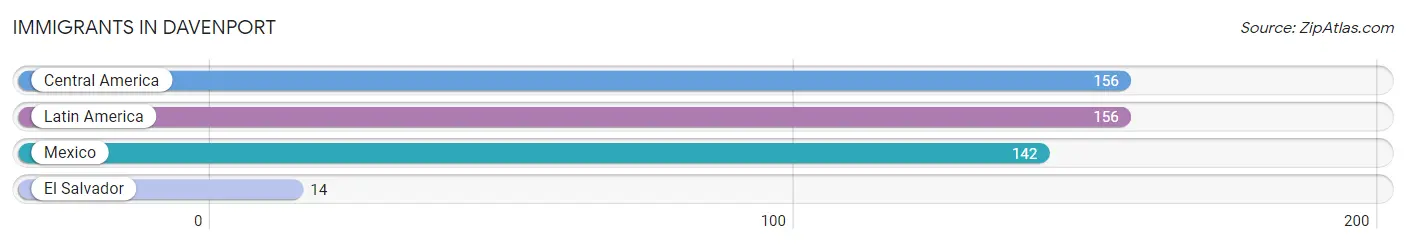
The most numerous immigrant groups reported in Davenport came from Central America (156 | 24.0%), Latin America (156 | 24.0%), Mexico (142 | 21.8%), and El Salvador (14 | 2.1%), together accounting for 72.0% of all Davenport residents.
| Immigration Origin | # Population | % Population |
| Central America | 156 | 24.0% |
| El Salvador | 14 | 2.1% |
| Latin America | 156 | 24.0% |
| Mexico | 142 | 21.8% | View All 4 Rows |
Sex and Age in Davenport
Sex and Age in Davenport
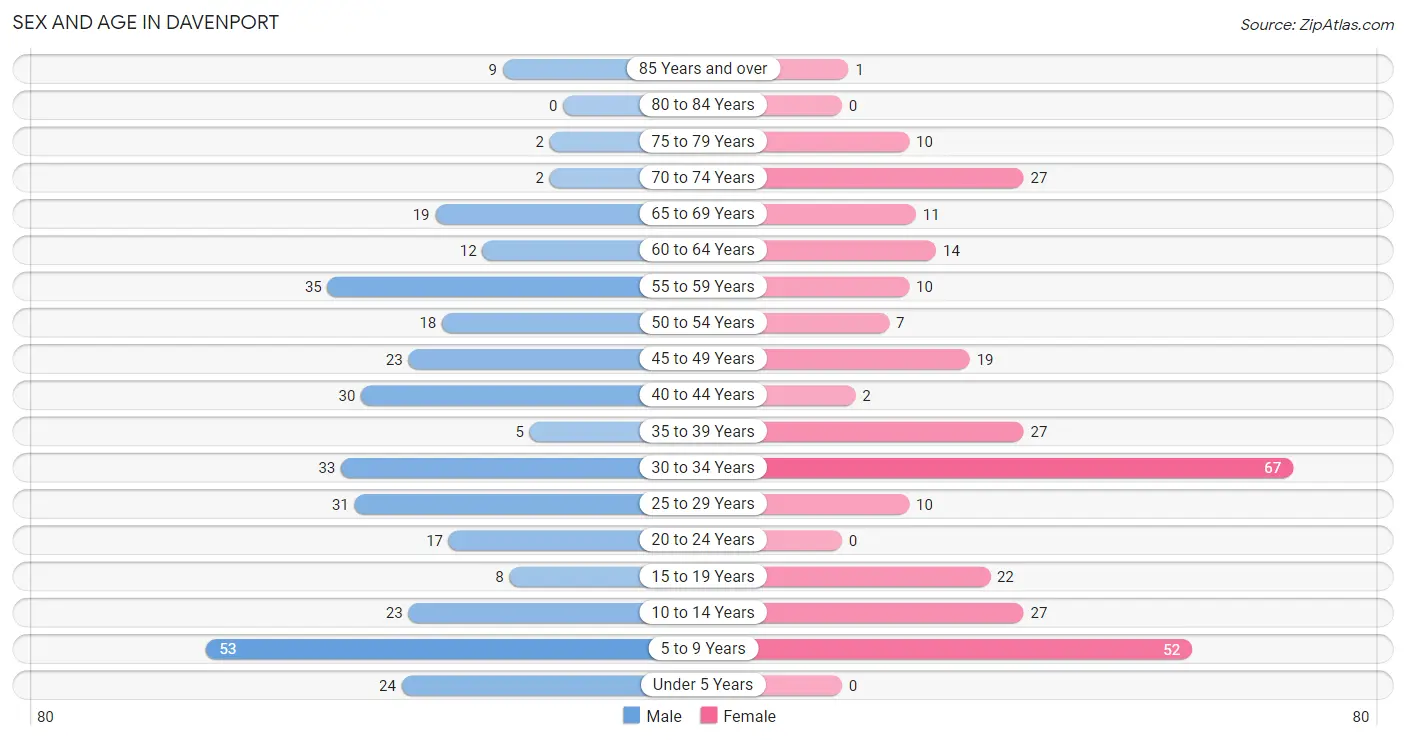
The most populous age groups in Davenport are 5 to 9 Years (53 | 15.4%) for men and 30 to 34 Years (67 | 21.9%) for women.
| Age Bracket | Male | Female |
| Under 5 Years | 24 (7.0%) | 0 (0.0%) |
| 5 to 9 Years | 53 (15.4%) | 52 (17.0%) |
| 10 to 14 Years | 23 (6.7%) | 27 (8.8%) |
| 15 to 19 Years | 8 (2.3%) | 22 (7.2%) |
| 20 to 24 Years | 17 (4.9%) | 0 (0.0%) |
| 25 to 29 Years | 31 (9.0%) | 10 (3.3%) |
| 30 to 34 Years | 33 (9.6%) | 67 (21.9%) |
| 35 to 39 Years | 5 (1.5%) | 27 (8.8%) |
| 40 to 44 Years | 30 (8.7%) | 2 (0.6%) |
| 45 to 49 Years | 23 (6.7%) | 19 (6.2%) |
| 50 to 54 Years | 18 (5.2%) | 7 (2.3%) |
| 55 to 59 Years | 35 (10.2%) | 10 (3.3%) |
| 60 to 64 Years | 12 (3.5%) | 14 (4.6%) |
| 65 to 69 Years | 19 (5.5%) | 11 (3.6%) |
| 70 to 74 Years | 2 (0.6%) | 27 (8.8%) |
| 75 to 79 Years | 2 (0.6%) | 10 (3.3%) |
| 80 to 84 Years | 0 (0.0%) | 0 (0.0%) |
| 85 Years and over | 9 (2.6%) | 1 (0.3%) |
| Total | 344 (100.0%) | 306 (100.0%) |
Families and Households in Davenport
Median Family Size in Davenport
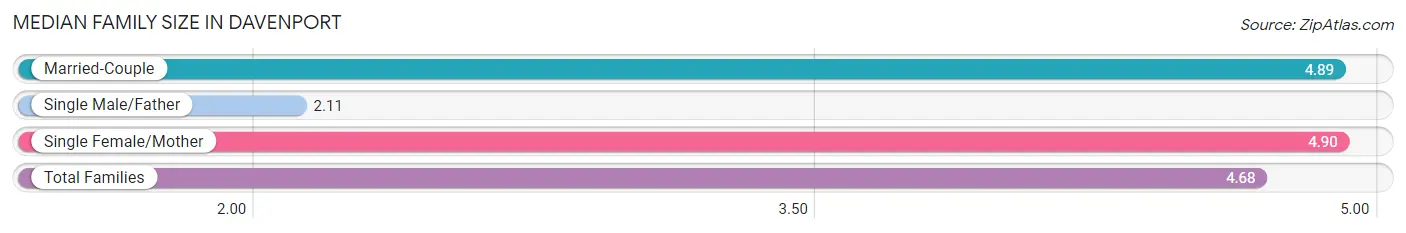
The median family size in Davenport is 4.68 persons per family, with single female/mother families (10 | 8.6%) accounting for the largest median family size of 4.9 persons per family. On the other hand, single male/father families (9 | 7.7%) represent the smallest median family size with 2.11 persons per family.
| Family Type | # Families | Family Size |
| Married-Couple | 98 (83.8%) | 4.89 |
| Single Male/Father | 9 (7.7%) | 2.11 |
| Single Female/Mother | 10 (8.6%) | 4.90 |
| Total Families | 117 (100.0%) | 4.68 |
Median Household Size in Davenport
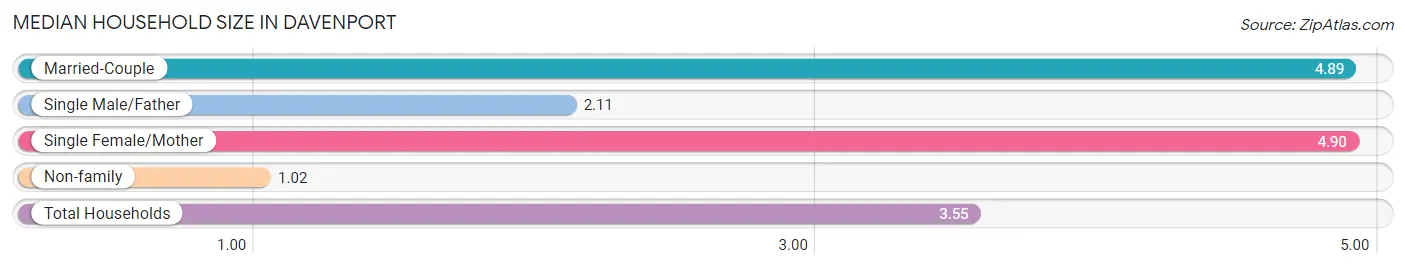
The median household size in Davenport is 3.55 persons per household, with single female/mother households (10 | 5.9%) accounting for the largest median household size of 4.9 persons per household. non-family households (52 | 30.8%) represent the smallest median household size with 1.02 persons per household.
| Household Type | # Households | Household Size |
| Married-Couple | 98 (58.0%) | 4.89 |
| Single Male/Father | 9 (5.3%) | 2.11 |
| Single Female/Mother | 10 (5.9%) | 4.90 |
| Non-family | 52 (30.8%) | 1.02 |
| Total Households | 169 (100.0%) | 3.55 |
Household Size by Marriage Status in Davenport
Out of a total of 169 households in Davenport, 117 (69.2%) are family households, while 52 (30.8%) are nonfamily households. The most numerous type of family households are 4-person households, comprising 41, and the most common type of nonfamily households are 1-person households, comprising 50.
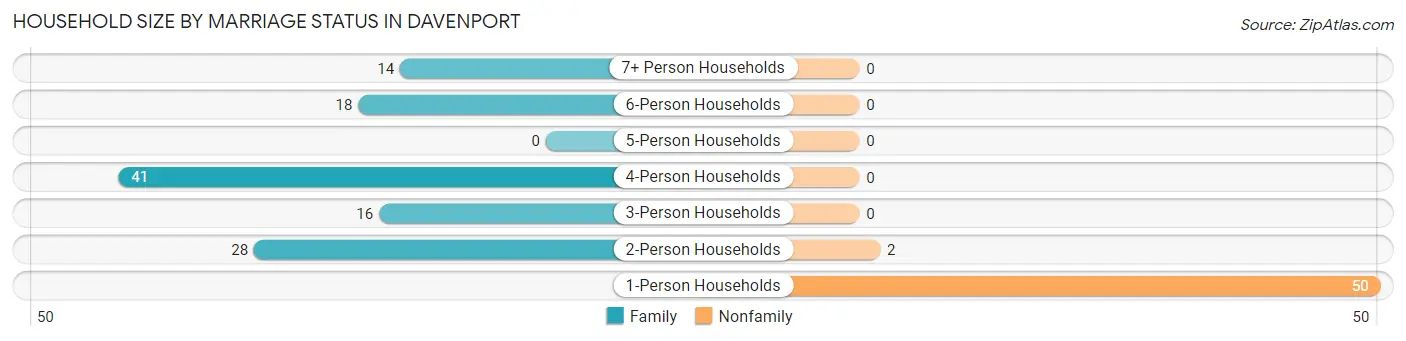
| Household Size | Family Households | Nonfamily Households |
| 1-Person Households | - | 50 (29.6%) |
| 2-Person Households | 28 (16.6%) | 2 (1.2%) |
| 3-Person Households | 16 (9.5%) | 0 (0.0%) |
| 4-Person Households | 41 (24.3%) | 0 (0.0%) |
| 5-Person Households | 0 (0.0%) | 0 (0.0%) |
| 6-Person Households | 18 (10.6%) | 0 (0.0%) |
| 7+ Person Households | 14 (8.3%) | 0 (0.0%) |
| Total | 117 (69.2%) | 52 (30.8%) |
Female Fertility in Davenport
Fertility by Age in Davenport
| Age Bracket | Women with Births | Births / 1,000 Women |
| 15 to 19 years | 0 (0.0%) | 0.0 |
| 20 to 34 years | 0 (0.0%) | 0.0 |
| 35 to 50 years | 0 (0.0%) | 0.0 |
| Total | 0 (0.0%) | 0.0 |
Fertility by Age by Marriage Status in Davenport
| Age Bracket | Married | Unmarried |
| 15 to 19 years | 0 (0.0%) | 0 (0.0%) |
| 20 to 34 years | 0 (0.0%) | 0 (0.0%) |
| 35 to 50 years | 0 (0.0%) | 0 (0.0%) |
| Total | 0 (0.0%) | 0 (0.0%) |
Fertility by Education in Davenport
| Educational Attainment | Women with Births | Births / 1,000 Women |
| Less than High School | 0 (0.0%) | 0.0 |
| High School Diploma | 0 (0.0%) | 0.0 |
| College or Associate's Degree | 0 (0.0%) | 0.0 |
| Bachelor's Degree | 0 (0.0%) | 0.0 |
| Graduate Degree | 0 (0.0%) | 0.0 |
| Total | 0 (0.0%) | 0.0 |
Fertility by Education by Marriage Status in Davenport
| Educational Attainment | Married | Unmarried |
| Less than High School | 0 (0.0%) | 0 (0.0%) |
| High School Diploma | 0 (0.0%) | 0 (0.0%) |
| College or Associate's Degree | 0 (0.0%) | 0 (0.0%) |
| Bachelor's Degree | 0 (0.0%) | 0 (0.0%) |
| Graduate Degree | 0 (0.0%) | 0 (0.0%) |
| Total | 0 (0.0%) | 0 (0.0%) |
Employment Characteristics in Davenport
Employment by Class of Employer in Davenport
Among the 239 employed individuals in Davenport, private company employees (170 | 71.1%), not-for-profit organizations (22 | 9.2%), and state government employees (14 | 5.9%) make up the most common classes of employment.
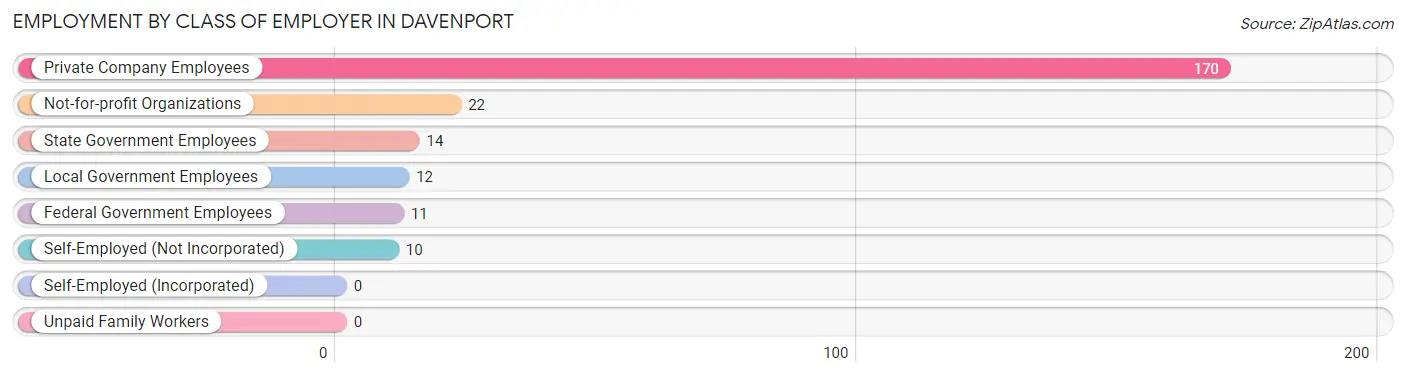
| Employer Class | # Employees | % Employees |
| Private Company Employees | 170 | 71.1% |
| Self-Employed (Incorporated) | 0 | 0.0% |
| Self-Employed (Not Incorporated) | 10 | 4.2% |
| Not-for-profit Organizations | 22 | 9.2% |
| Local Government Employees | 12 | 5.0% |
| State Government Employees | 14 | 5.9% |
| Federal Government Employees | 11 | 4.6% |
| Unpaid Family Workers | 0 | 0.0% |
| Total | 239 | 100.0% |
Employment Status by Age in Davenport
According to the labor force statistics for Davenport, out of the total population over 16 years of age (471), 58.2% or 274 individuals are in the labor force, with 10.2% or 28 of them unemployed. The age group with the highest labor force participation rate is 20 to 24 years, with 100.0% or 17 individuals in the labor force. Within the labor force, the 20 to 24 years age range has the highest percentage of unemployed individuals, with 70.6% or 12 of them being unemployed.
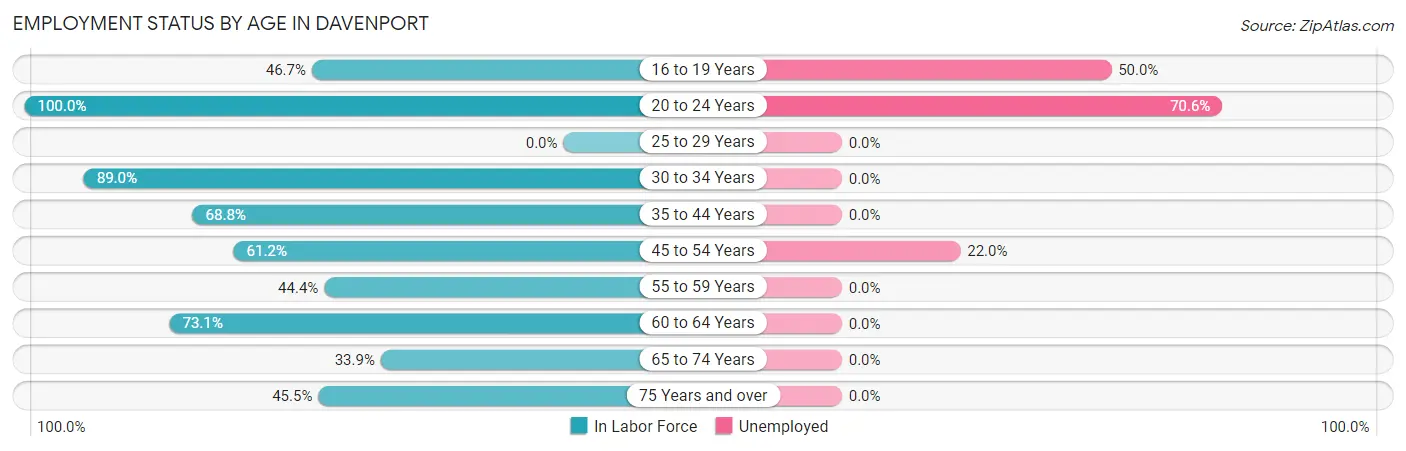
| Age Bracket | In Labor Force | Unemployed |
| 16 to 19 Years | 14 (46.7%) | 7 (50.0%) |
| 20 to 24 Years | 17 (100.0%) | 12 (70.6%) |
| 25 to 29 Years | 0 (0.0%) | 0 (0.0%) |
| 30 to 34 Years | 89 (89.0%) | 0 (0.0%) |
| 35 to 44 Years | 44 (68.8%) | 0 (0.0%) |
| 45 to 54 Years | 41 (61.2%) | 9 (22.0%) |
| 55 to 59 Years | 20 (44.4%) | 0 (0.0%) |
| 60 to 64 Years | 19 (73.1%) | 0 (0.0%) |
| 65 to 74 Years | 20 (33.9%) | 0 (0.0%) |
| 75 Years and over | 10 (45.5%) | 0 (0.0%) |
| Total | 274 (58.2%) | 28 (10.2%) |
Employment Status by Educational Attainment in Davenport
According to labor force statistics for Davenport, 62.1% of individuals (213) out of the total population between 25 and 64 years of age (343) are in the labor force, with 4.2% or 9 of them being unemployed. The group with the highest labor force participation rate are those with the educational attainment of college / associate degree, with 86.7% or 98 individuals in the labor force. Within the labor force, individuals with college / associate degree education have the highest percentage of unemployment, with 9.2% or 9 of them being unemployed.
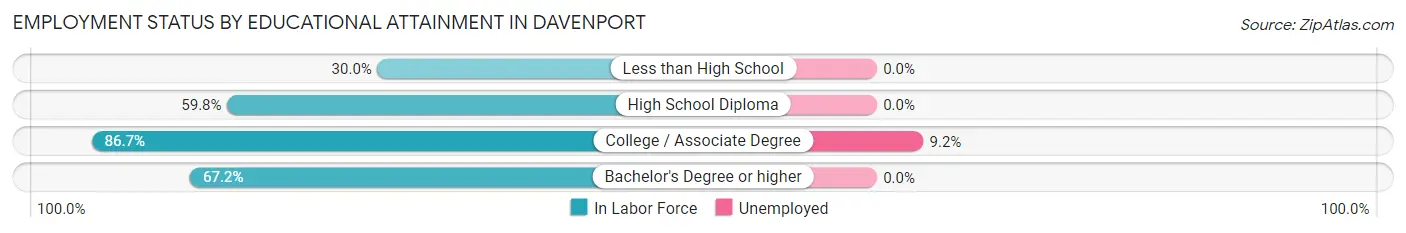
| Educational Attainment | In Labor Force | Unemployed |
| Less than High School | 27 (30.0%) | 0 (0.0%) |
| High School Diploma | 49 (59.8%) | 0 (0.0%) |
| College / Associate Degree | 98 (86.7%) | 10 (9.2%) |
| Bachelor's Degree or higher | 39 (67.2%) | 0 (0.0%) |
| Total | 213 (62.1%) | 14 (4.2%) |
Employment Occupations by Sex in Davenport
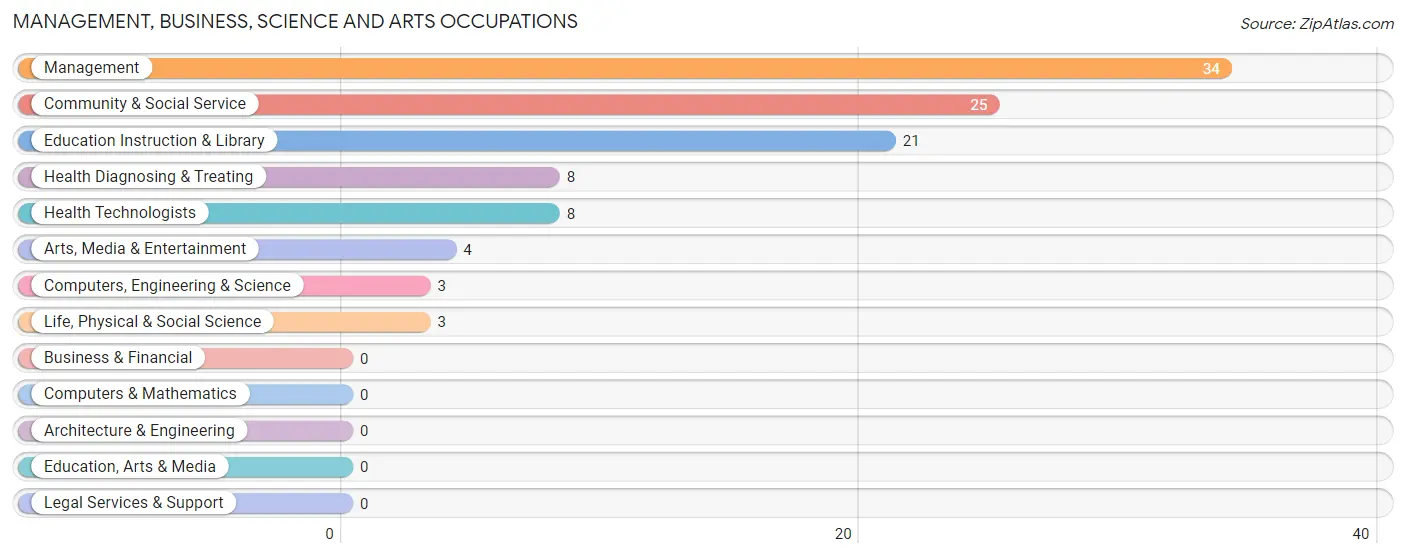
Management, Business, Science and Arts Occupations
The most common Management, Business, Science and Arts occupations in Davenport are Management (34 | 13.8%), Community & Social Service (25 | 10.2%), Education Instruction & Library (21 | 8.5%), Health Diagnosing & Treating (8 | 3.3%), and Health Technologists (8 | 3.3%).
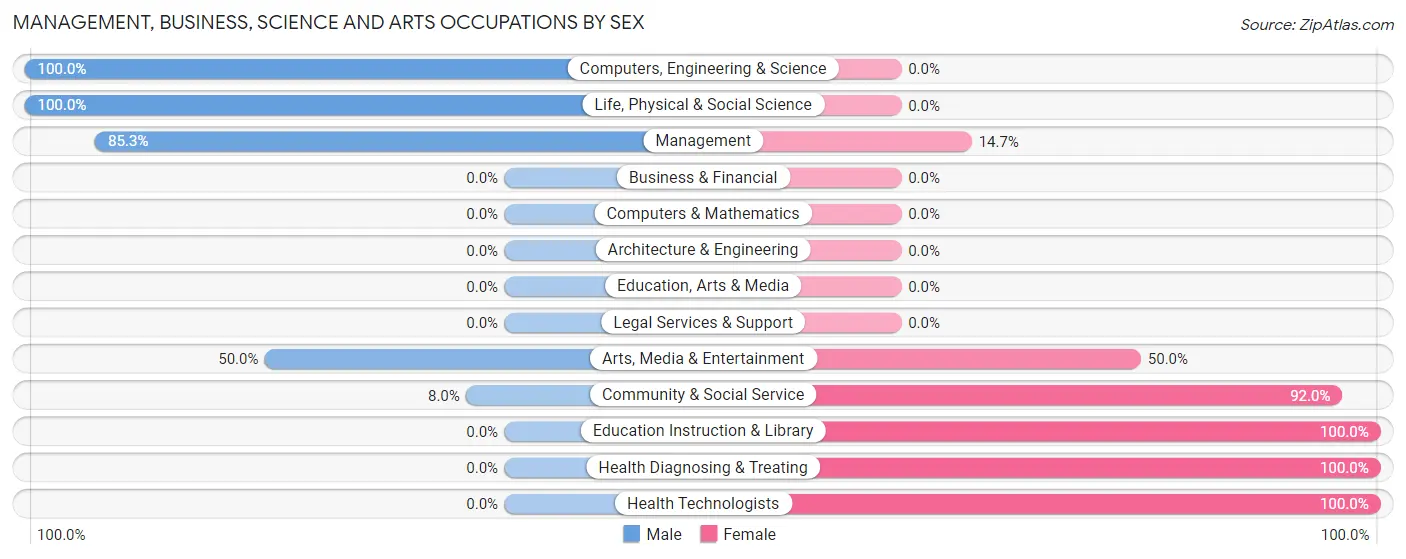
Management, Business, Science and Arts Occupations by Sex
Within the Management, Business, Science and Arts occupations in Davenport, the most male-oriented occupations are Computers, Engineering & Science (100.0%), Life, Physical & Social Science (100.0%), and Management (85.3%), while the most female-oriented occupations are Education Instruction & Library (100.0%), Health Diagnosing & Treating (100.0%), and Health Technologists (100.0%).
| Occupation | Male | Female |
| Management | 29 (85.3%) | 5 (14.7%) |
| Business & Financial | 0 (0.0%) | 0 (0.0%) |
| Computers, Engineering & Science | 3 (100.0%) | 0 (0.0%) |
| Computers & Mathematics | 0 (0.0%) | 0 (0.0%) |
| Architecture & Engineering | 0 (0.0%) | 0 (0.0%) |
| Life, Physical & Social Science | 3 (100.0%) | 0 (0.0%) |
| Community & Social Service | 2 (8.0%) | 23 (92.0%) |
| Education, Arts & Media | 0 (0.0%) | 0 (0.0%) |
| Legal Services & Support | 0 (0.0%) | 0 (0.0%) |
| Education Instruction & Library | 0 (0.0%) | 21 (100.0%) |
| Arts, Media & Entertainment | 2 (50.0%) | 2 (50.0%) |
| Health Diagnosing & Treating | 0 (0.0%) | 8 (100.0%) |
| Health Technologists | 0 (0.0%) | 8 (100.0%) |
| Total (Category) | 34 (48.6%) | 36 (51.4%) |
| Total (Overall) | 122 (49.6%) | 124 (50.4%) |
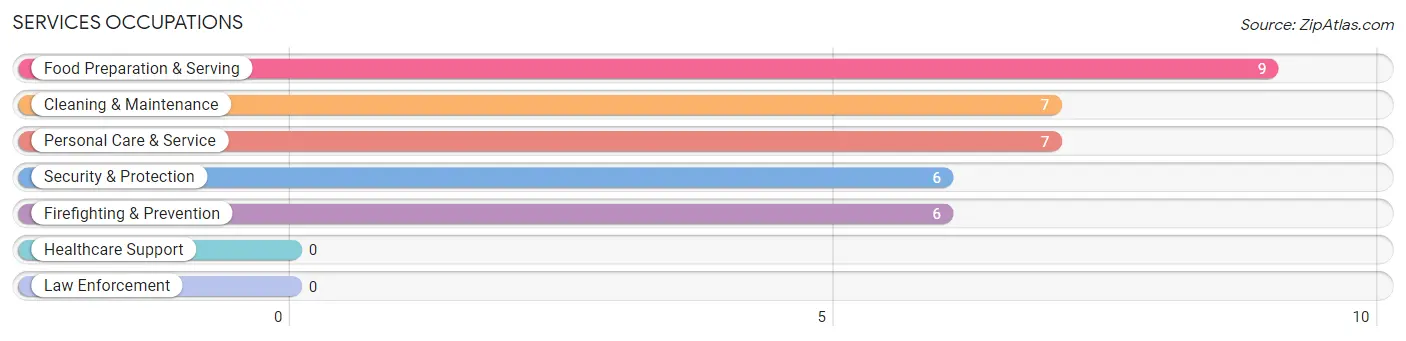
Services Occupations
The most common Services occupations in Davenport are Food Preparation & Serving (9 | 3.7%), Cleaning & Maintenance (7 | 2.9%), Personal Care & Service (7 | 2.9%), Security & Protection (6 | 2.4%), and Firefighting & Prevention (6 | 2.4%).
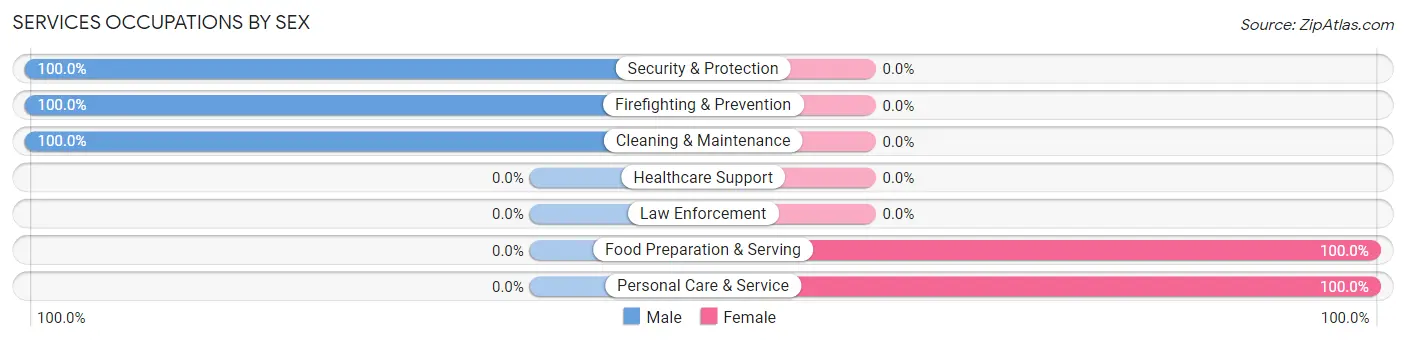
Services Occupations by Sex
Within the Services occupations in Davenport, the most male-oriented occupations are Security & Protection (100.0%), Firefighting & Prevention (100.0%), and Cleaning & Maintenance (100.0%), while the most female-oriented occupations are Food Preparation & Serving (100.0%), and Personal Care & Service (100.0%).
| Occupation | Male | Female |
| Healthcare Support | 0 (0.0%) | 0 (0.0%) |
| Security & Protection | 6 (100.0%) | 0 (0.0%) |
| Firefighting & Prevention | 6 (100.0%) | 0 (0.0%) |
| Law Enforcement | 0 (0.0%) | 0 (0.0%) |
| Food Preparation & Serving | 0 (0.0%) | 9 (100.0%) |
| Cleaning & Maintenance | 7 (100.0%) | 0 (0.0%) |
| Personal Care & Service | 0 (0.0%) | 7 (100.0%) |
| Total (Category) | 13 (44.8%) | 16 (55.2%) |
| Total (Overall) | 122 (49.6%) | 124 (50.4%) |
Sales and Office Occupations
The most common Sales and Office occupations in Davenport are Sales & Related (66 | 26.8%), and Office & Administration (9 | 3.7%).
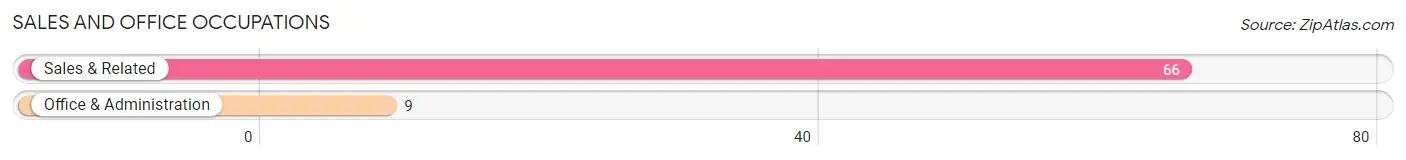
Sales and Office Occupations by Sex
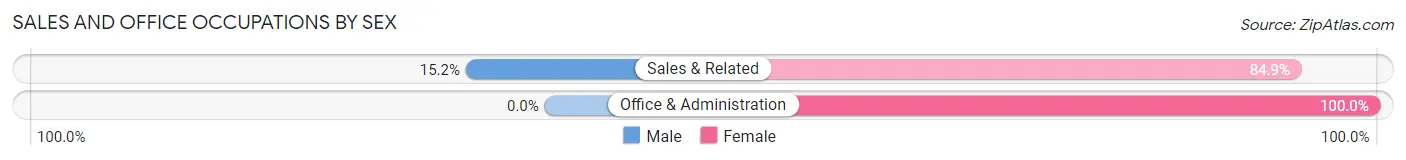
| Occupation | Male | Female |
| Sales & Related | 10 (15.1%) | 56 (84.9%) |
| Office & Administration | 0 (0.0%) | 9 (100.0%) |
| Total (Category) | 10 (13.3%) | 65 (86.7%) |
| Total (Overall) | 122 (49.6%) | 124 (50.4%) |
Natural Resources, Construction and Maintenance Occupations
The most common Natural Resources, Construction and Maintenance occupations in Davenport are Construction & Extraction (26 | 10.6%), and Farming, Fishing & Forestry (18 | 7.3%).
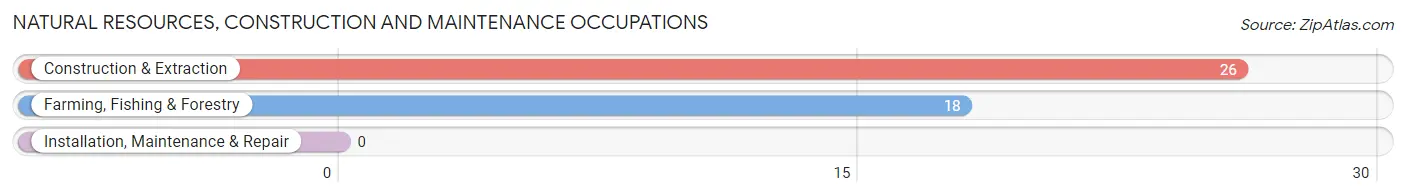
Natural Resources, Construction and Maintenance Occupations by Sex
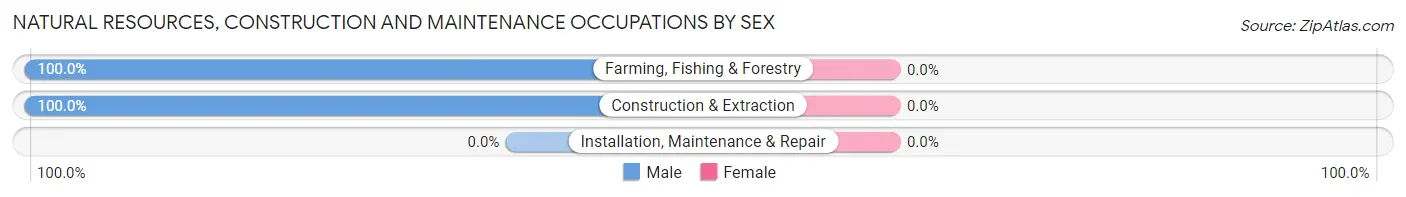
| Occupation | Male | Female |
| Farming, Fishing & Forestry | 18 (100.0%) | 0 (0.0%) |
| Construction & Extraction | 26 (100.0%) | 0 (0.0%) |
| Installation, Maintenance & Repair | 0 (0.0%) | 0 (0.0%) |
| Total (Category) | 44 (100.0%) | 0 (0.0%) |
| Total (Overall) | 122 (49.6%) | 124 (50.4%) |
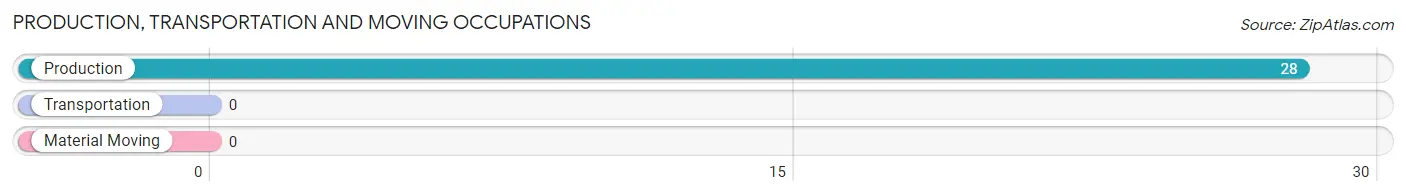
Production, Transportation and Moving Occupations
The most common Production, Transportation and Moving occupations in Davenport are , and Production (28 | 11.4%).
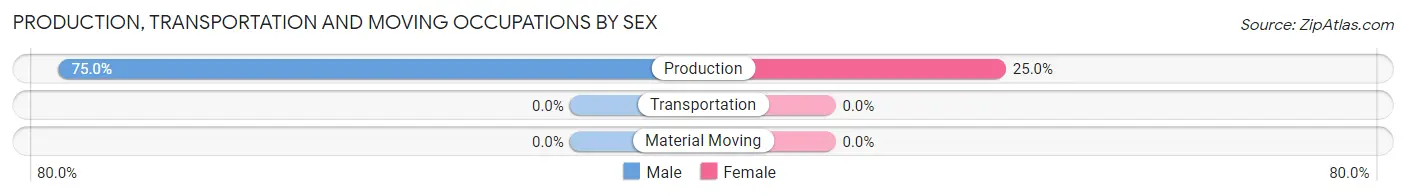
Production, Transportation and Moving Occupations by Sex
| Occupation | Male | Female |
| Production | 21 (75.0%) | 7 (25.0%) |
| Transportation | 0 (0.0%) | 0 (0.0%) |
| Material Moving | 0 (0.0%) | 0 (0.0%) |
| Total (Category) | 21 (75.0%) | 7 (25.0%) |
| Total (Overall) | 122 (49.6%) | 124 (50.4%) |
Employment Industries by Sex in Davenport
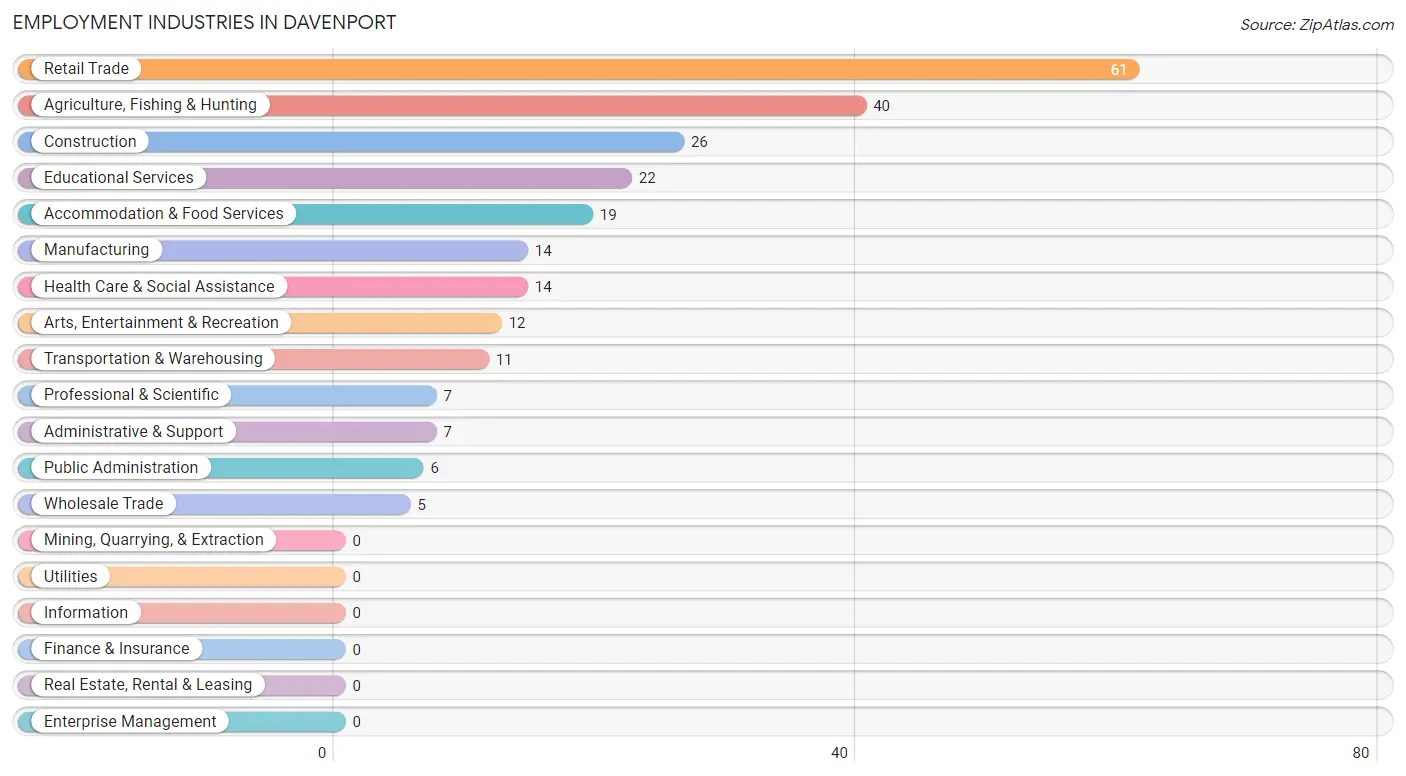
Employment Industries in Davenport
The major employment industries in Davenport include Retail Trade (61 | 24.8%), Agriculture, Fishing & Hunting (40 | 16.3%), Construction (26 | 10.6%), Educational Services (22 | 8.9%), and Accommodation & Food Services (19 | 7.7%).
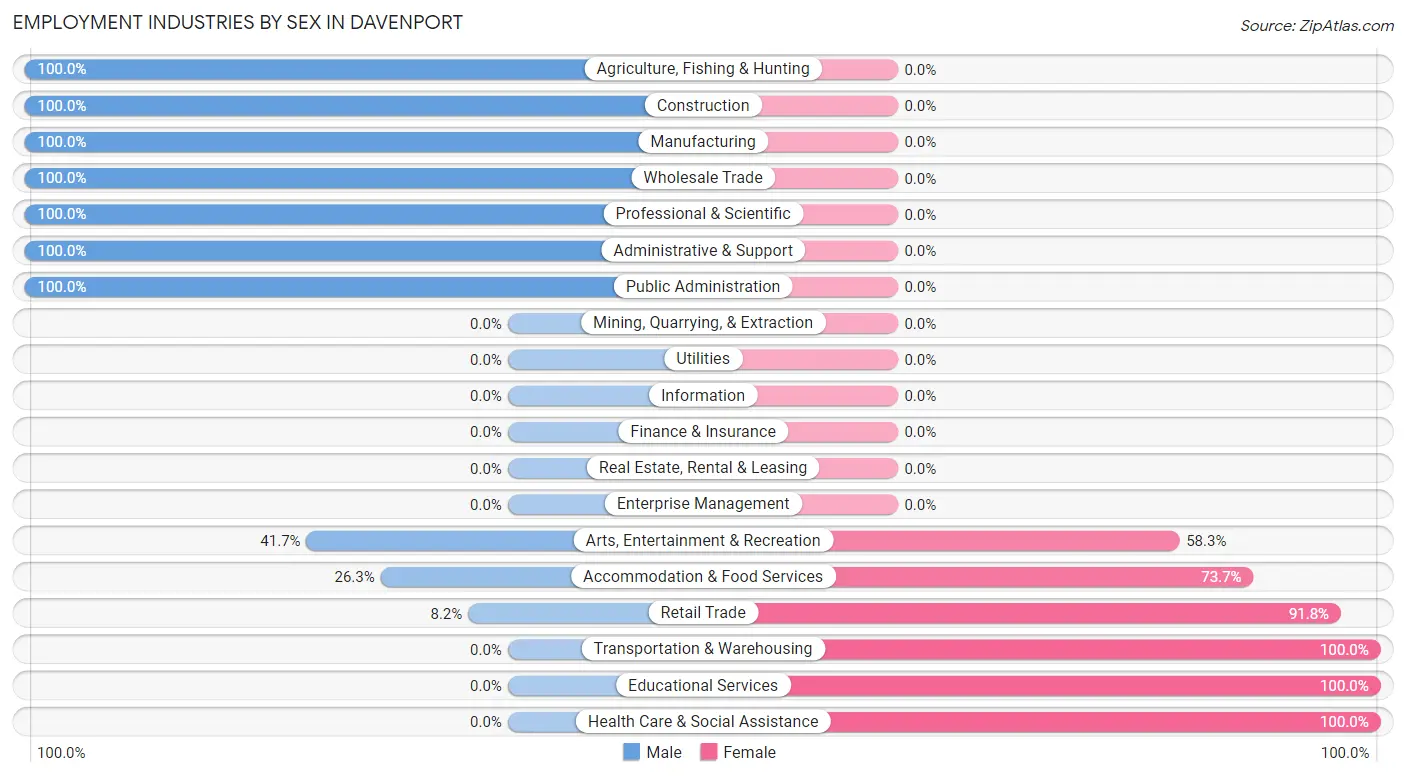
Employment Industries by Sex in Davenport
The Davenport industries that see more men than women are Agriculture, Fishing & Hunting (100.0%), Construction (100.0%), and Manufacturing (100.0%), whereas the industries that tend to have a higher number of women are Transportation & Warehousing (100.0%), Educational Services (100.0%), and Health Care & Social Assistance (100.0%).
| Industry | Male | Female |
| Agriculture, Fishing & Hunting | 40 (100.0%) | 0 (0.0%) |
| Mining, Quarrying, & Extraction | 0 (0.0%) | 0 (0.0%) |
| Construction | 26 (100.0%) | 0 (0.0%) |
| Manufacturing | 14 (100.0%) | 0 (0.0%) |
| Wholesale Trade | 5 (100.0%) | 0 (0.0%) |
| Retail Trade | 5 (8.2%) | 56 (91.8%) |
| Transportation & Warehousing | 0 (0.0%) | 11 (100.0%) |
| Utilities | 0 (0.0%) | 0 (0.0%) |
| Information | 0 (0.0%) | 0 (0.0%) |
| Finance & Insurance | 0 (0.0%) | 0 (0.0%) |
| Real Estate, Rental & Leasing | 0 (0.0%) | 0 (0.0%) |
| Professional & Scientific | 7 (100.0%) | 0 (0.0%) |
| Enterprise Management | 0 (0.0%) | 0 (0.0%) |
| Administrative & Support | 7 (100.0%) | 0 (0.0%) |
| Educational Services | 0 (0.0%) | 22 (100.0%) |
| Health Care & Social Assistance | 0 (0.0%) | 14 (100.0%) |
| Arts, Entertainment & Recreation | 5 (41.7%) | 7 (58.3%) |
| Accommodation & Food Services | 5 (26.3%) | 14 (73.7%) |
| Public Administration | 6 (100.0%) | 0 (0.0%) |
| Total | 122 (49.6%) | 124 (50.4%) |
Education in Davenport
School Enrollment in Davenport
The most common levels of schooling among the 209 students in Davenport are elementary school (90 | 43.1%), high school (39 | 18.7%), and middle school (32 | 15.3%).
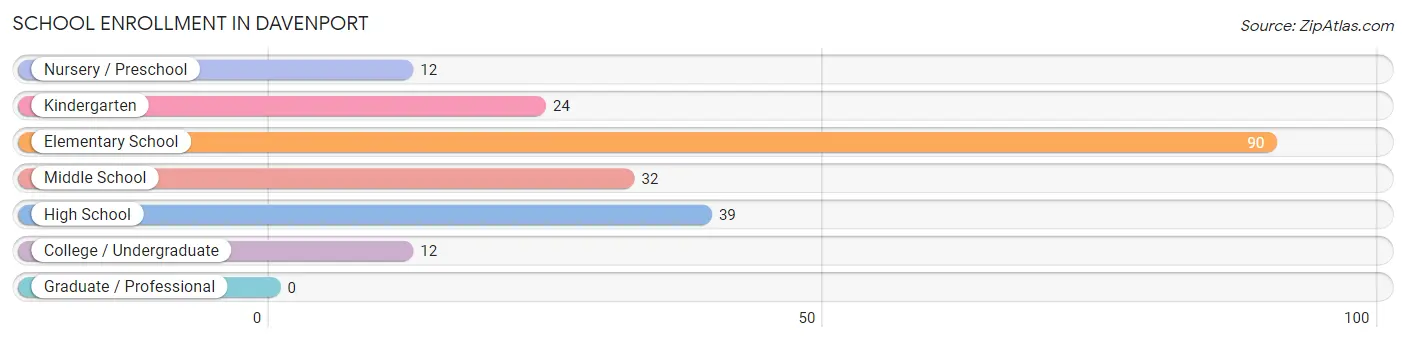
| School Level | # Students | % Students |
| Nursery / Preschool | 12 | 5.7% |
| Kindergarten | 24 | 11.5% |
| Elementary School | 90 | 43.1% |
| Middle School | 32 | 15.3% |
| High School | 39 | 18.7% |
| College / Undergraduate | 12 | 5.7% |
| Graduate / Professional | 0 | 0.0% |
| Total | 209 | 100.0% |
School Enrollment by Age by Funding Source in Davenport
Out of a total of 209 students who are enrolled in schools in Davenport, 20 (9.6%) attend a private institution, while the remaining 189 (90.4%) are enrolled in public schools. The age group of 3 to 4 year olds has the highest likelihood of being enrolled in private schools, with 12 (100.0% in the age bracket) enrolled. Conversely, the age group of 5 to 9 year old has the lowest likelihood of being enrolled in a private school, with 105 (100.0% in the age bracket) attending a public institution.
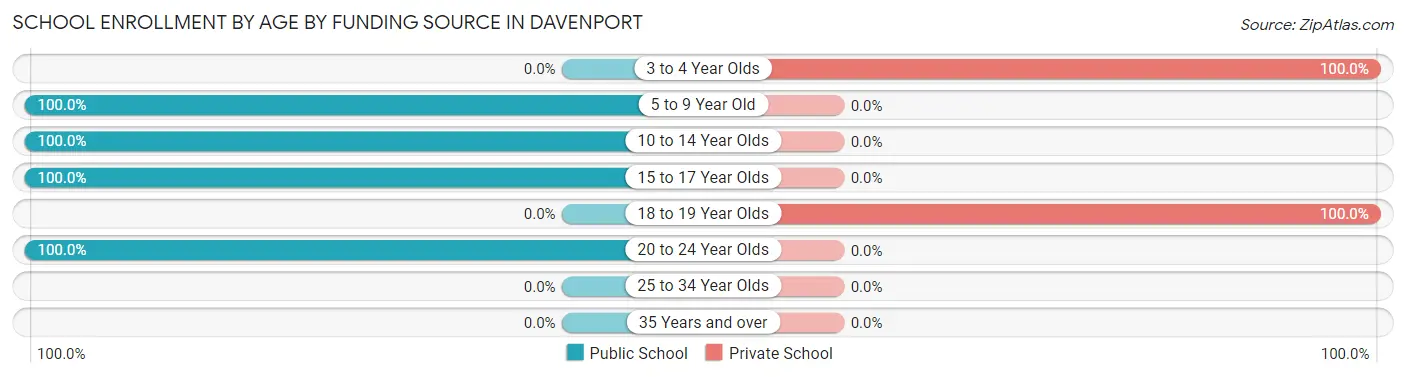
| Age Bracket | Public School | Private School |
| 3 to 4 Year Olds | 0 (0.0%) | 12 (100.0%) |
| 5 to 9 Year Old | 105 (100.0%) | 0 (0.0%) |
| 10 to 14 Year Olds | 50 (100.0%) | 0 (0.0%) |
| 15 to 17 Year Olds | 22 (100.0%) | 0 (0.0%) |
| 18 to 19 Year Olds | 0 (0.0%) | 8 (100.0%) |
| 20 to 24 Year Olds | 12 (100.0%) | 0 (0.0%) |
| 25 to 34 Year Olds | 0 (0.0%) | 0 (0.0%) |
| 35 Years and over | 0 (0.0%) | 0 (0.0%) |
| Total | 189 (90.4%) | 20 (9.6%) |
Educational Attainment by Field of Study in Davenport
Social sciences (26 | 30.6%), liberal arts & history (22 | 25.9%), visual & performing arts (18 | 21.2%), psychology (9 | 10.6%), and business (4 | 4.7%) are the most common fields of study among 85 individuals in Davenport who have obtained a bachelor's degree or higher.
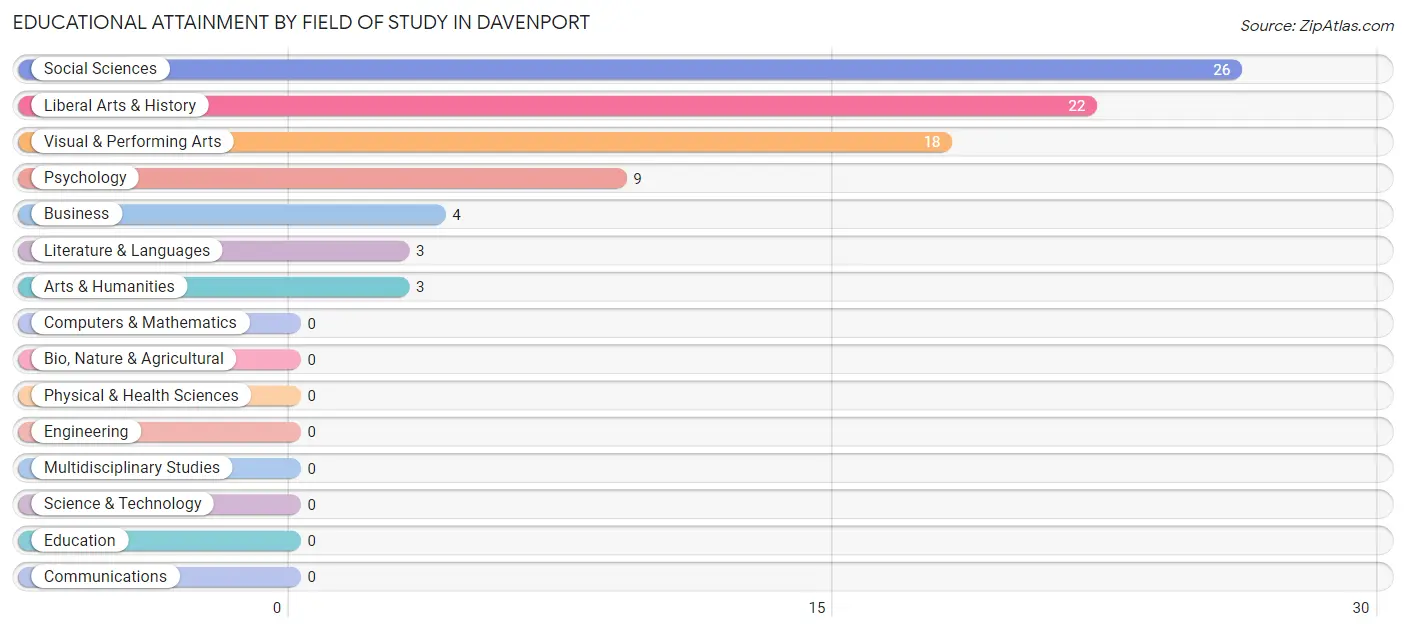
| Field of Study | # Graduates | % Graduates |
| Computers & Mathematics | 0 | 0.0% |
| Bio, Nature & Agricultural | 0 | 0.0% |
| Physical & Health Sciences | 0 | 0.0% |
| Psychology | 9 | 10.6% |
| Social Sciences | 26 | 30.6% |
| Engineering | 0 | 0.0% |
| Multidisciplinary Studies | 0 | 0.0% |
| Science & Technology | 0 | 0.0% |
| Business | 4 | 4.7% |
| Education | 0 | 0.0% |
| Literature & Languages | 3 | 3.5% |
| Liberal Arts & History | 22 | 25.9% |
| Visual & Performing Arts | 18 | 21.2% |
| Communications | 0 | 0.0% |
| Arts & Humanities | 3 | 3.5% |
| Total | 85 | 100.0% |
Transportation & Commute in Davenport
Vehicle Availability by Sex in Davenport
The most prevalent vehicle ownership categories in Davenport are males with 2 vehicles (87, accounting for 71.3%) and females with 2 vehicles (13, making up 129.8%).
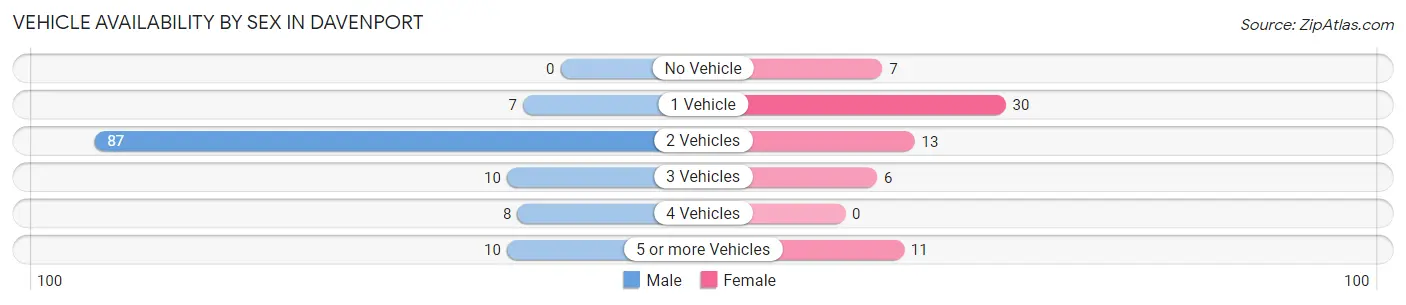
| Vehicles Available | Male | Female |
| No Vehicle | 0 (0.0%) | 7 (10.4%) |
| 1 Vehicle | 7 (5.7%) | 30 (44.8%) |
| 2 Vehicles | 87 (71.3%) | 13 (19.4%) |
| 3 Vehicles | 10 (8.2%) | 6 (9.0%) |
| 4 Vehicles | 8 (6.6%) | 0 (0.0%) |
| 5 or more Vehicles | 10 (8.2%) | 11 (16.4%) |
| Total | 122 (100.0%) | 67 (100.0%) |
Commute Time in Davenport
The most frequently occuring commute durations in Davenport are 20 to 24 minutes (70 commuters, 32.1%), 5 to 9 minutes (45 commuters, 20.6%), and 15 to 19 minutes (26 commuters, 11.9%).
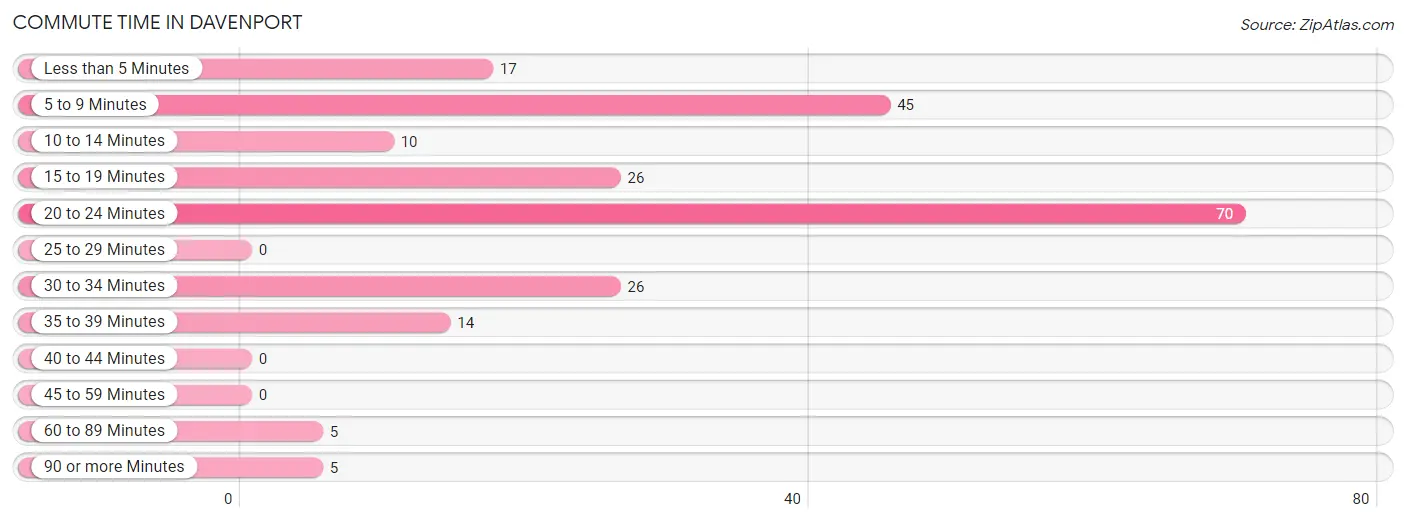
| Commute Time | # Commuters | % Commuters |
| Less than 5 Minutes | 17 | 7.8% |
| 5 to 9 Minutes | 45 | 20.6% |
| 10 to 14 Minutes | 10 | 4.6% |
| 15 to 19 Minutes | 26 | 11.9% |
| 20 to 24 Minutes | 70 | 32.1% |
| 25 to 29 Minutes | 0 | 0.0% |
| 30 to 34 Minutes | 26 | 11.9% |
| 35 to 39 Minutes | 14 | 6.4% |
| 40 to 44 Minutes | 0 | 0.0% |
| 45 to 59 Minutes | 0 | 0.0% |
| 60 to 89 Minutes | 5 | 2.3% |
| 90 or more Minutes | 5 | 2.3% |
Commute Time by Sex in Davenport
The most common commute times in Davenport are 5 to 9 minutes (37 commuters, 34.6%) for males and 20 to 24 minutes (63 commuters, 56.8%) for females.
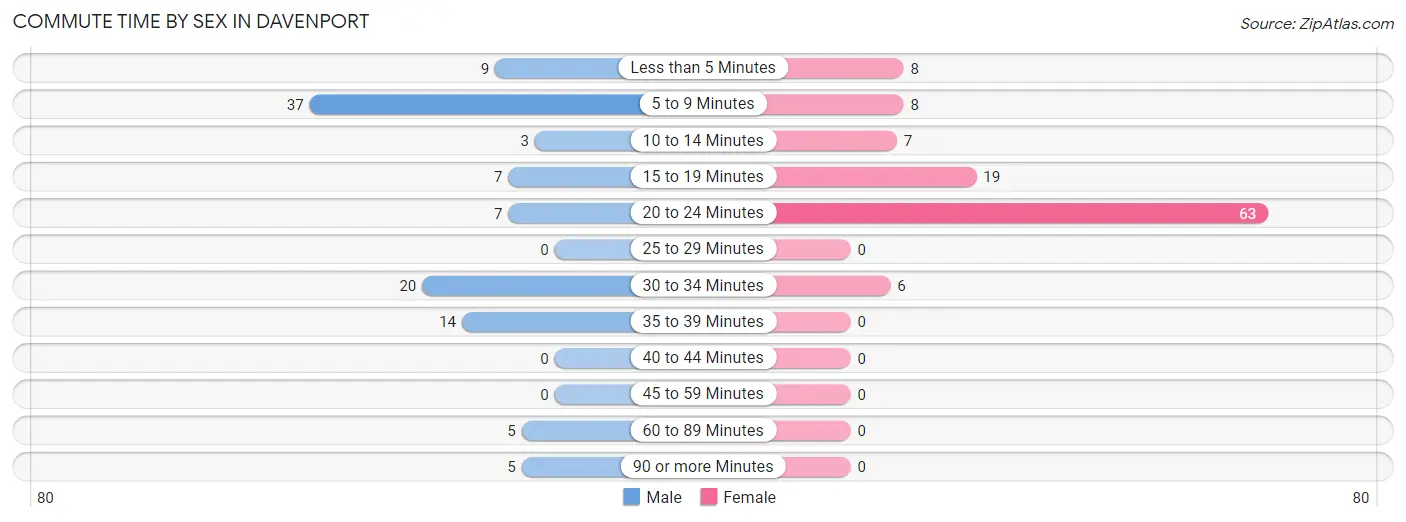
| Commute Time | Male | Female |
| Less than 5 Minutes | 9 (8.4%) | 8 (7.2%) |
| 5 to 9 Minutes | 37 (34.6%) | 8 (7.2%) |
| 10 to 14 Minutes | 3 (2.8%) | 7 (6.3%) |
| 15 to 19 Minutes | 7 (6.5%) | 19 (17.1%) |
| 20 to 24 Minutes | 7 (6.5%) | 63 (56.8%) |
| 25 to 29 Minutes | 0 (0.0%) | 0 (0.0%) |
| 30 to 34 Minutes | 20 (18.7%) | 6 (5.4%) |
| 35 to 39 Minutes | 14 (13.1%) | 0 (0.0%) |
| 40 to 44 Minutes | 0 (0.0%) | 0 (0.0%) |
| 45 to 59 Minutes | 0 (0.0%) | 0 (0.0%) |
| 60 to 89 Minutes | 5 (4.7%) | 0 (0.0%) |
| 90 or more Minutes | 5 (4.7%) | 0 (0.0%) |
Time of Departure to Work by Sex in Davenport
The most frequent times of departure to work in Davenport are 8:00 AM to 8:29 AM (46, 43.0%) for males and 5:00 AM to 5:29 AM (50, 45.1%) for females.
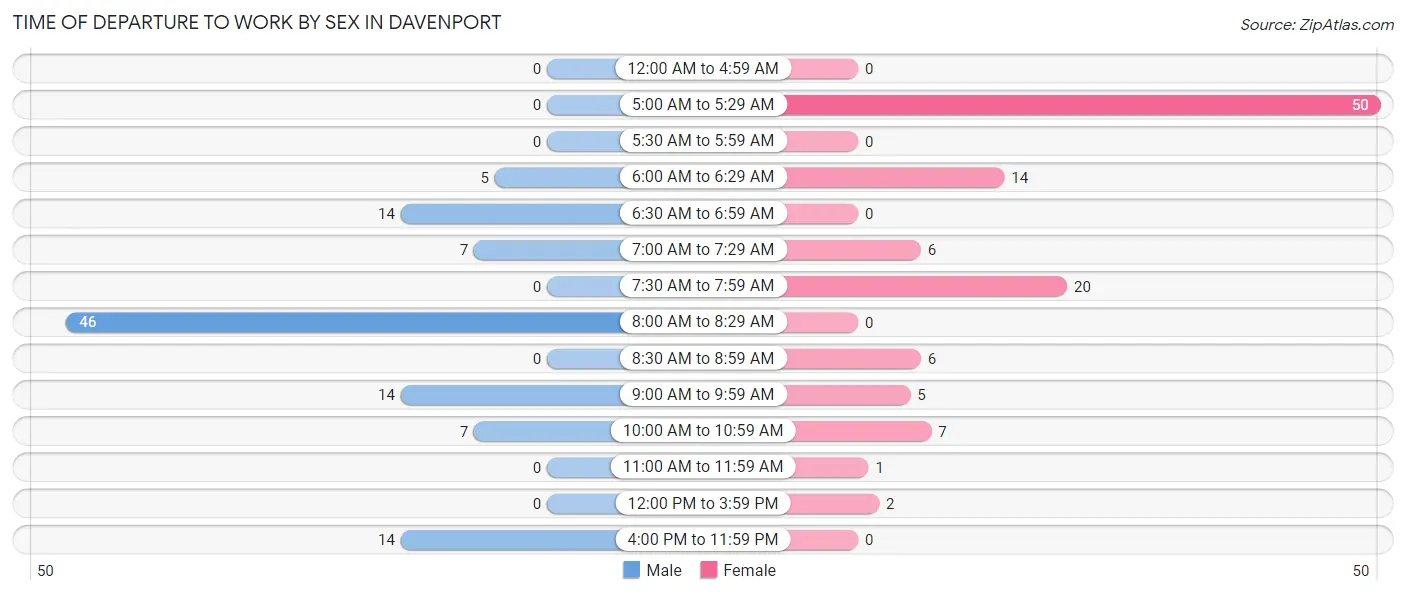
| Time of Departure | Male | Female |
| 12:00 AM to 4:59 AM | 0 (0.0%) | 0 (0.0%) |
| 5:00 AM to 5:29 AM | 0 (0.0%) | 50 (45.1%) |
| 5:30 AM to 5:59 AM | 0 (0.0%) | 0 (0.0%) |
| 6:00 AM to 6:29 AM | 5 (4.7%) | 14 (12.6%) |
| 6:30 AM to 6:59 AM | 14 (13.1%) | 0 (0.0%) |
| 7:00 AM to 7:29 AM | 7 (6.5%) | 6 (5.4%) |
| 7:30 AM to 7:59 AM | 0 (0.0%) | 20 (18.0%) |
| 8:00 AM to 8:29 AM | 46 (43.0%) | 0 (0.0%) |
| 8:30 AM to 8:59 AM | 0 (0.0%) | 6 (5.4%) |
| 9:00 AM to 9:59 AM | 14 (13.1%) | 5 (4.5%) |
| 10:00 AM to 10:59 AM | 7 (6.5%) | 7 (6.3%) |
| 11:00 AM to 11:59 AM | 0 (0.0%) | 1 (0.9%) |
| 12:00 PM to 3:59 PM | 0 (0.0%) | 2 (1.8%) |
| 4:00 PM to 11:59 PM | 14 (13.1%) | 0 (0.0%) |
| Total | 107 (100.0%) | 111 (100.0%) |
Housing Occupancy in Davenport
Occupancy by Ownership in Davenport
Of the total 169 dwellings in Davenport, owner-occupied units account for 61 (36.1%), while renter-occupied units make up 108 (63.9%).
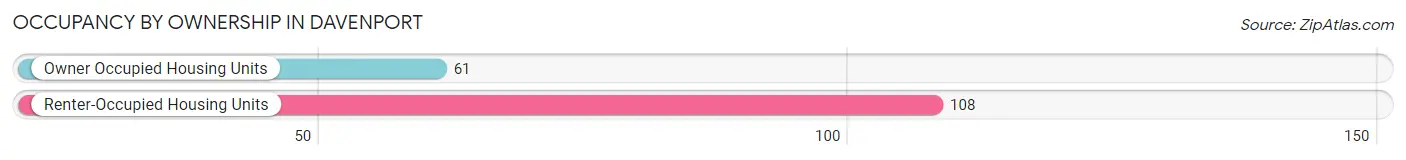
| Occupancy | # Housing Units | % Housing Units |
| Owner Occupied Housing Units | 61 | 36.1% |
| Renter-Occupied Housing Units | 108 | 63.9% |
| Total Occupied Housing Units | 169 | 100.0% |
Occupancy by Household Size in Davenport
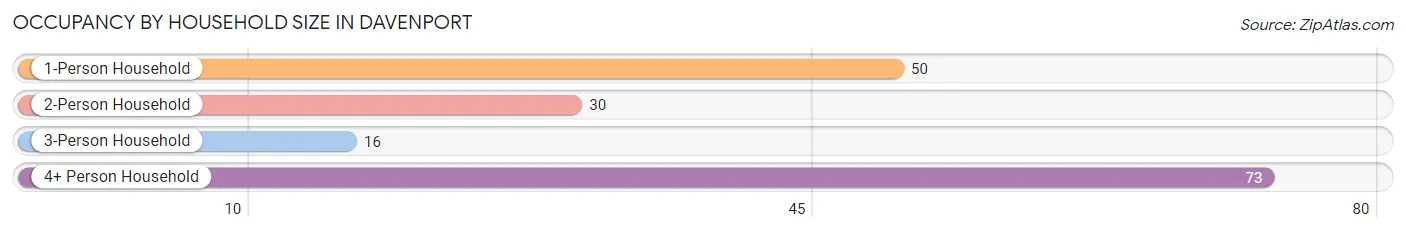
| Household Size | # Housing Units | % Housing Units |
| 1-Person Household | 50 | 29.6% |
| 2-Person Household | 30 | 17.7% |
| 3-Person Household | 16 | 9.5% |
| 4+ Person Household | 73 | 43.2% |
| Total Housing Units | 169 | 100.0% |
Occupancy by Ownership by Household Size in Davenport
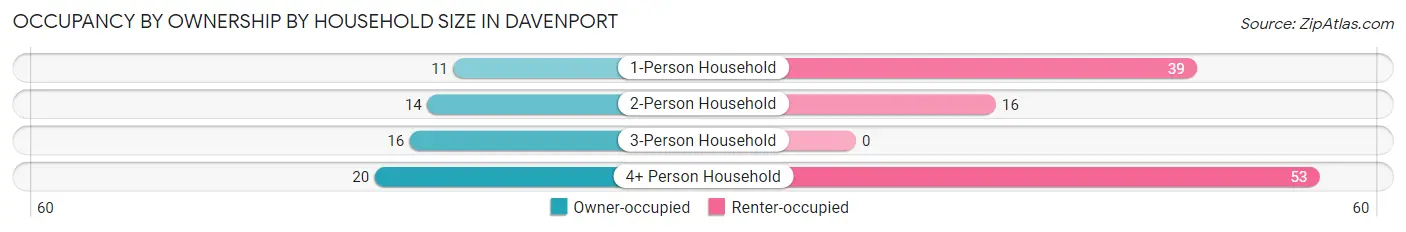
| Household Size | Owner-occupied | Renter-occupied |
| 1-Person Household | 11 (22.0%) | 39 (78.0%) |
| 2-Person Household | 14 (46.7%) | 16 (53.3%) |
| 3-Person Household | 16 (100.0%) | 0 (0.0%) |
| 4+ Person Household | 20 (27.4%) | 53 (72.6%) |
| Total Housing Units | 61 (36.1%) | 108 (63.9%) |
Occupancy by Educational Attainment in Davenport
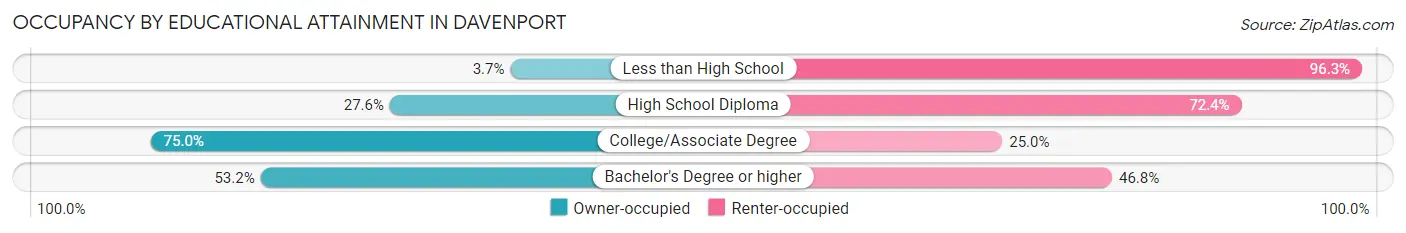
| Household Size | Owner-occupied | Renter-occupied |
| Less than High School | 2 (3.7%) | 52 (96.3%) |
| High School Diploma | 8 (27.6%) | 21 (72.4%) |
| College/Associate Degree | 18 (75.0%) | 6 (25.0%) |
| Bachelor's Degree or higher | 33 (53.2%) | 29 (46.8%) |
Occupancy by Age of Householder in Davenport
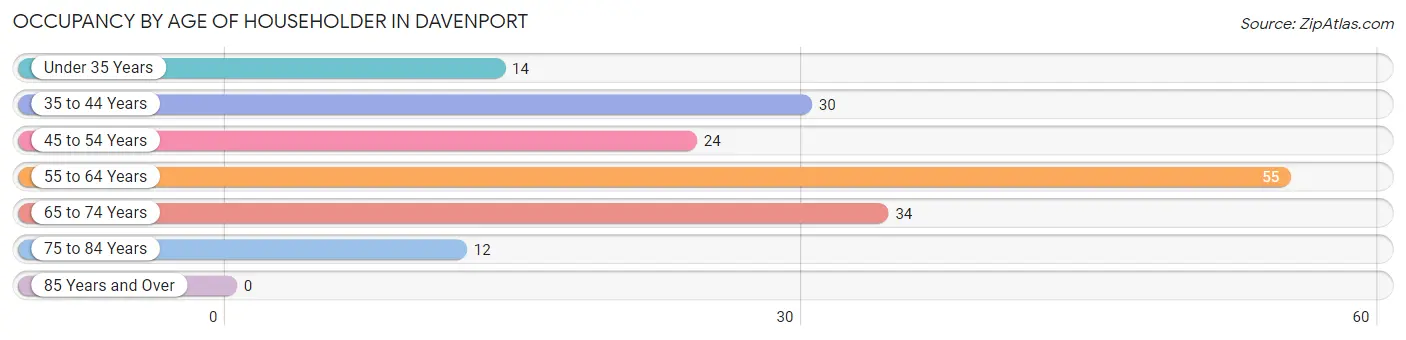
| Age Bracket | # Households | % Households |
| Under 35 Years | 14 | 8.3% |
| 35 to 44 Years | 30 | 17.7% |
| 45 to 54 Years | 24 | 14.2% |
| 55 to 64 Years | 55 | 32.5% |
| 65 to 74 Years | 34 | 20.1% |
| 75 to 84 Years | 12 | 7.1% |
| 85 Years and Over | 0 | 0.0% |
| Total | 169 | 100.0% |
Housing Finances in Davenport
Median Income by Occupancy in Davenport
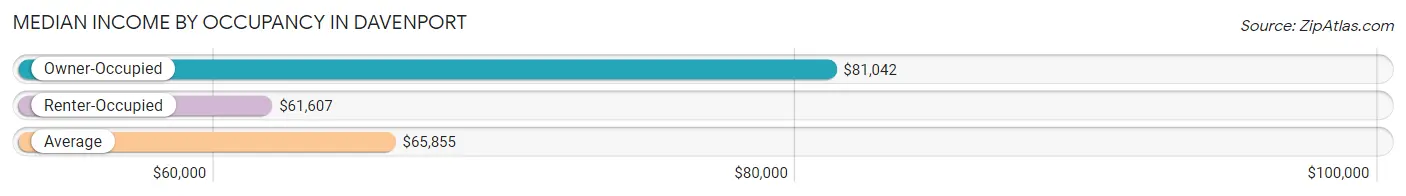
| Occupancy Type | # Households | Median Income |
| Owner-Occupied | 61 (36.1%) | $81,042 |
| Renter-Occupied | 108 (63.9%) | $61,607 |
| Average | 169 (100.0%) | $65,855 |
Occupancy by Householder Income Bracket in Davenport
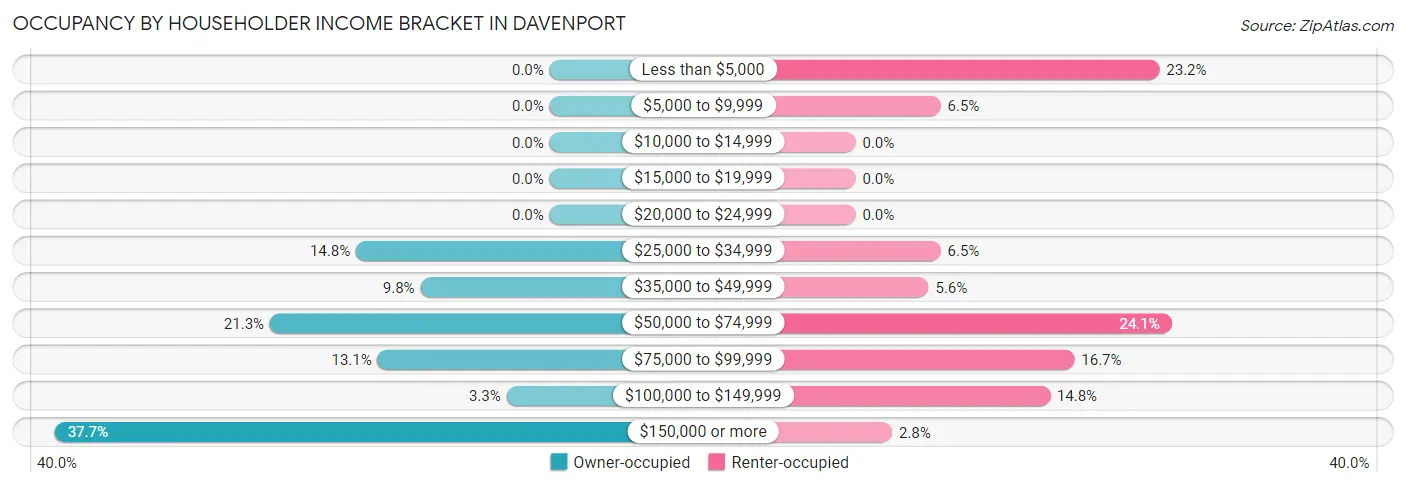
| Income Bracket | Owner-occupied | Renter-occupied |
| Less than $5,000 | 0 (0.0%) | 25 (23.2%) |
| $5,000 to $9,999 | 0 (0.0%) | 7 (6.5%) |
| $10,000 to $14,999 | 0 (0.0%) | 0 (0.0%) |
| $15,000 to $19,999 | 0 (0.0%) | 0 (0.0%) |
| $20,000 to $24,999 | 0 (0.0%) | 0 (0.0%) |
| $25,000 to $34,999 | 9 (14.7%) | 7 (6.5%) |
| $35,000 to $49,999 | 6 (9.8%) | 6 (5.6%) |
| $50,000 to $74,999 | 13 (21.3%) | 26 (24.1%) |
| $75,000 to $99,999 | 8 (13.1%) | 18 (16.7%) |
| $100,000 to $149,999 | 2 (3.3%) | 16 (14.8%) |
| $150,000 or more | 23 (37.7%) | 3 (2.8%) |
| Total | 61 (100.0%) | 108 (100.0%) |
Monthly Housing Cost Tiers in Davenport
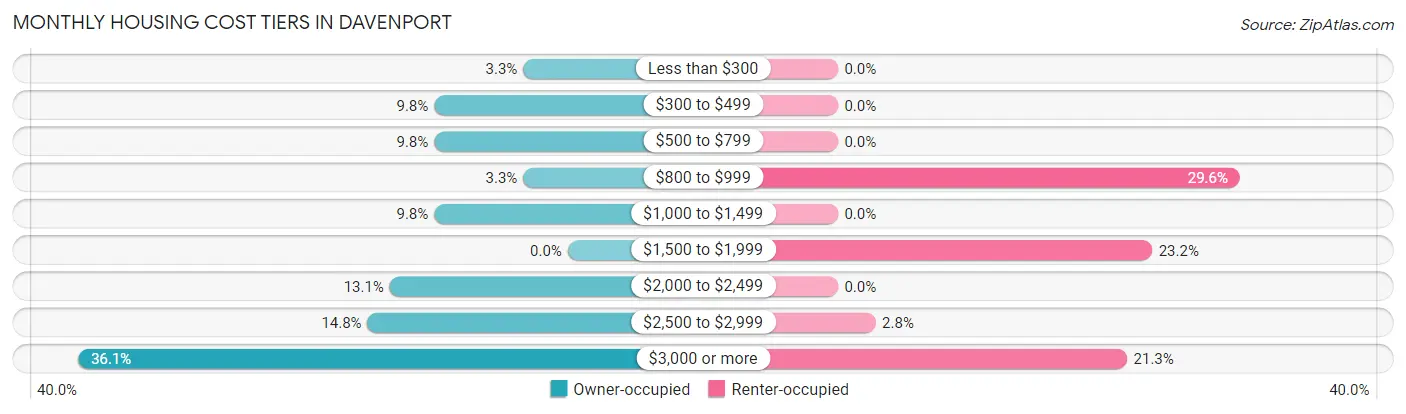
| Monthly Cost | Owner-occupied | Renter-occupied |
| Less than $300 | 2 (3.3%) | 0 (0.0%) |
| $300 to $499 | 6 (9.8%) | 0 (0.0%) |
| $500 to $799 | 6 (9.8%) | 0 (0.0%) |
| $800 to $999 | 2 (3.3%) | 32 (29.6%) |
| $1,000 to $1,499 | 6 (9.8%) | 0 (0.0%) |
| $1,500 to $1,999 | 0 (0.0%) | 25 (23.2%) |
| $2,000 to $2,499 | 8 (13.1%) | 0 (0.0%) |
| $2,500 to $2,999 | 9 (14.7%) | 3 (2.8%) |
| $3,000 or more | 22 (36.1%) | 23 (21.3%) |
| Total | 61 (100.0%) | 108 (100.0%) |
Physical Housing Characteristics in Davenport
Housing Structures in Davenport
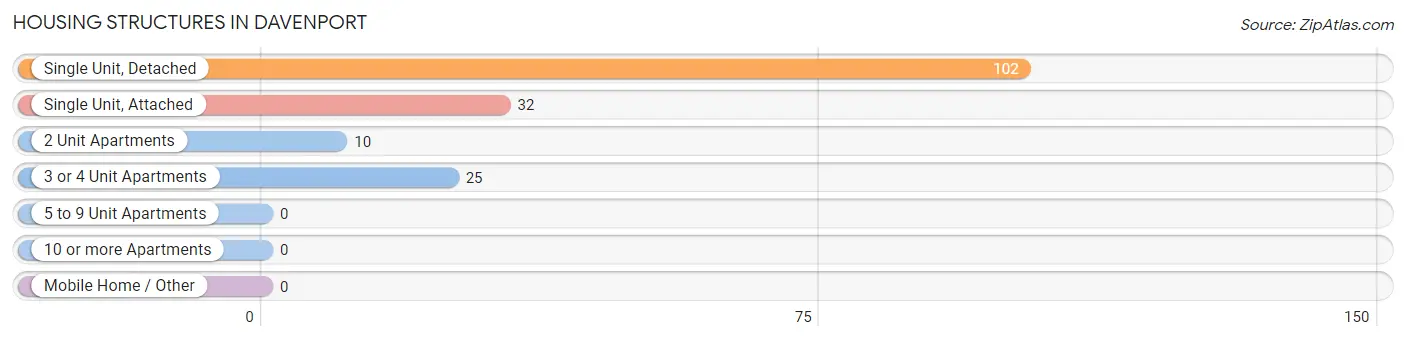
| Structure Type | # Housing Units | % Housing Units |
| Single Unit, Detached | 102 | 60.4% |
| Single Unit, Attached | 32 | 18.9% |
| 2 Unit Apartments | 10 | 5.9% |
| 3 or 4 Unit Apartments | 25 | 14.8% |
| 5 to 9 Unit Apartments | 0 | 0.0% |
| 10 or more Apartments | 0 | 0.0% |
| Mobile Home / Other | 0 | 0.0% |
| Total | 169 | 100.0% |
Housing Structures by Occupancy in Davenport
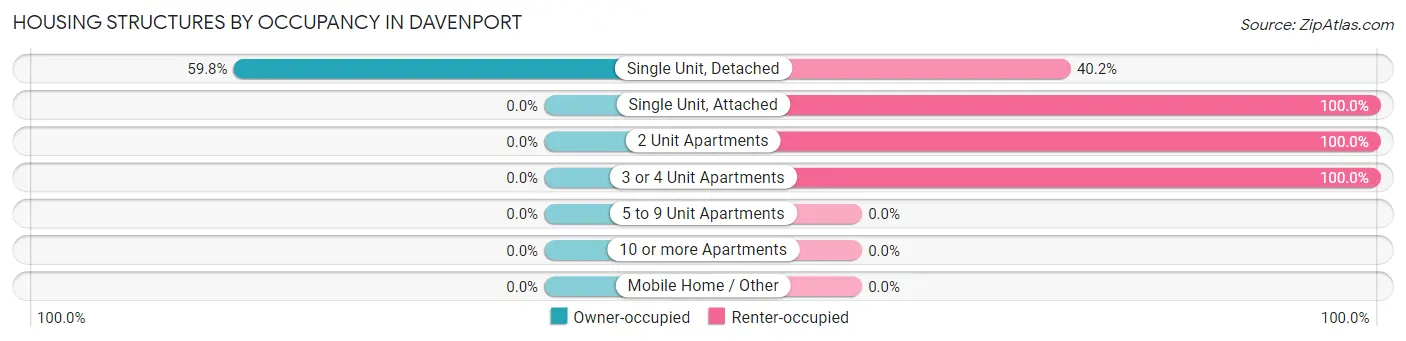
| Structure Type | Owner-occupied | Renter-occupied |
| Single Unit, Detached | 61 (59.8%) | 41 (40.2%) |
| Single Unit, Attached | 0 (0.0%) | 32 (100.0%) |
| 2 Unit Apartments | 0 (0.0%) | 10 (100.0%) |
| 3 or 4 Unit Apartments | 0 (0.0%) | 25 (100.0%) |
| 5 to 9 Unit Apartments | 0 (0.0%) | 0 (0.0%) |
| 10 or more Apartments | 0 (0.0%) | 0 (0.0%) |
| Mobile Home / Other | 0 (0.0%) | 0 (0.0%) |
| Total | 61 (36.1%) | 108 (63.9%) |
Housing Structures by Number of Rooms in Davenport
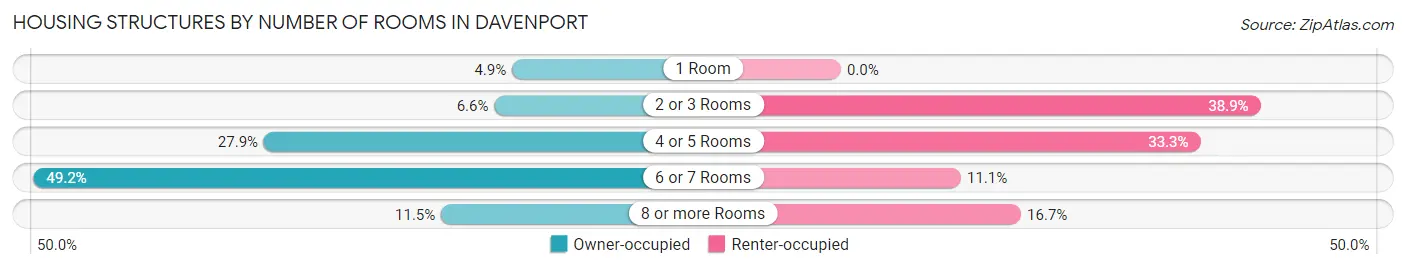
| Number of Rooms | Owner-occupied | Renter-occupied |
| 1 Room | 3 (4.9%) | 0 (0.0%) |
| 2 or 3 Rooms | 4 (6.6%) | 42 (38.9%) |
| 4 or 5 Rooms | 17 (27.9%) | 36 (33.3%) |
| 6 or 7 Rooms | 30 (49.2%) | 12 (11.1%) |
| 8 or more Rooms | 7 (11.5%) | 18 (16.7%) |
| Total | 61 (100.0%) | 108 (100.0%) |
Housing Structure by Heating Type in Davenport
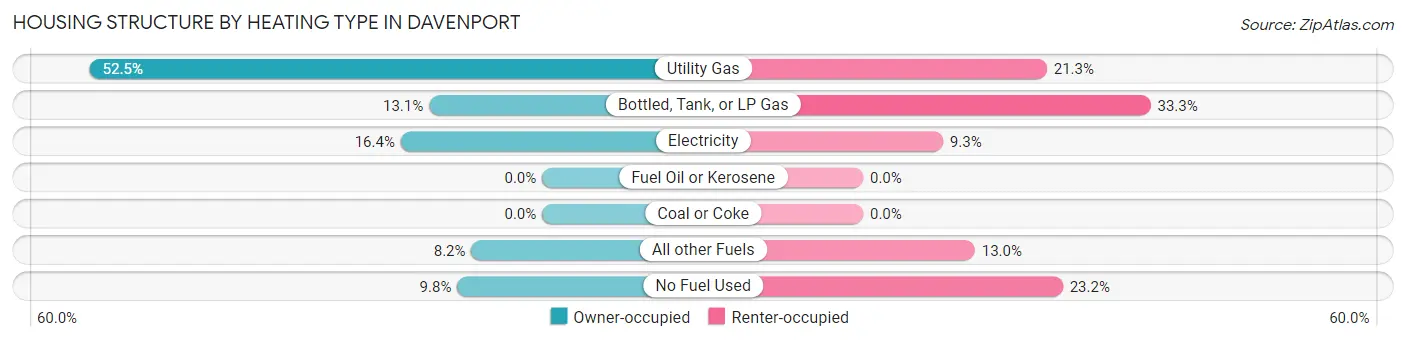
| Heating Type | Owner-occupied | Renter-occupied |
| Utility Gas | 32 (52.5%) | 23 (21.3%) |
| Bottled, Tank, or LP Gas | 8 (13.1%) | 36 (33.3%) |
| Electricity | 10 (16.4%) | 10 (9.3%) |
| Fuel Oil or Kerosene | 0 (0.0%) | 0 (0.0%) |
| Coal or Coke | 0 (0.0%) | 0 (0.0%) |
| All other Fuels | 5 (8.2%) | 14 (13.0%) |
| No Fuel Used | 6 (9.8%) | 25 (23.2%) |
| Total | 61 (100.0%) | 108 (100.0%) |
Household Vehicle Usage in Davenport
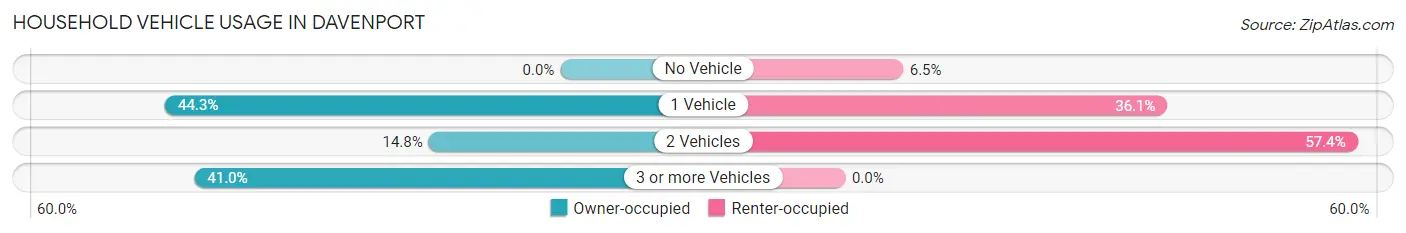
| Vehicles per Household | Owner-occupied | Renter-occupied |
| No Vehicle | 0 (0.0%) | 7 (6.5%) |
| 1 Vehicle | 27 (44.3%) | 39 (36.1%) |
| 2 Vehicles | 9 (14.7%) | 62 (57.4%) |
| 3 or more Vehicles | 25 (41.0%) | 0 (0.0%) |
| Total | 61 (100.0%) | 108 (100.0%) |
Real Estate & Mortgages in Davenport
Real Estate and Mortgage Overview in Davenport
| Characteristic | Without Mortgage | With Mortgage |
| Housing Units | 25 | 36 |
| Median Property Value | - | - |
| Median Household Income | $41,458 | $17 |
| Monthly Housing Costs | $675 | $22 |
| Real Estate Taxes | - | - |
Property Value by Mortgage Status in Davenport
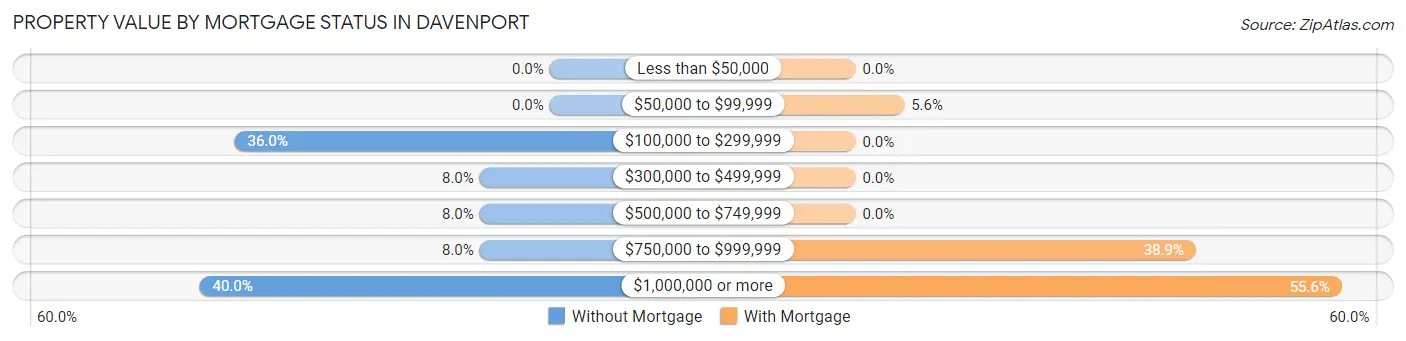
| Property Value | Without Mortgage | With Mortgage |
| Less than $50,000 | 0 (0.0%) | 0 (0.0%) |
| $50,000 to $99,999 | 0 (0.0%) | 2 (5.6%) |
| $100,000 to $299,999 | 9 (36.0%) | 0 (0.0%) |
| $300,000 to $499,999 | 2 (8.0%) | 0 (0.0%) |
| $500,000 to $749,999 | 2 (8.0%) | 0 (0.0%) |
| $750,000 to $999,999 | 2 (8.0%) | 14 (38.9%) |
| $1,000,000 or more | 10 (40.0%) | 20 (55.6%) |
| Total | 25 (100.0%) | 36 (100.0%) |
Household Income by Mortgage Status in Davenport
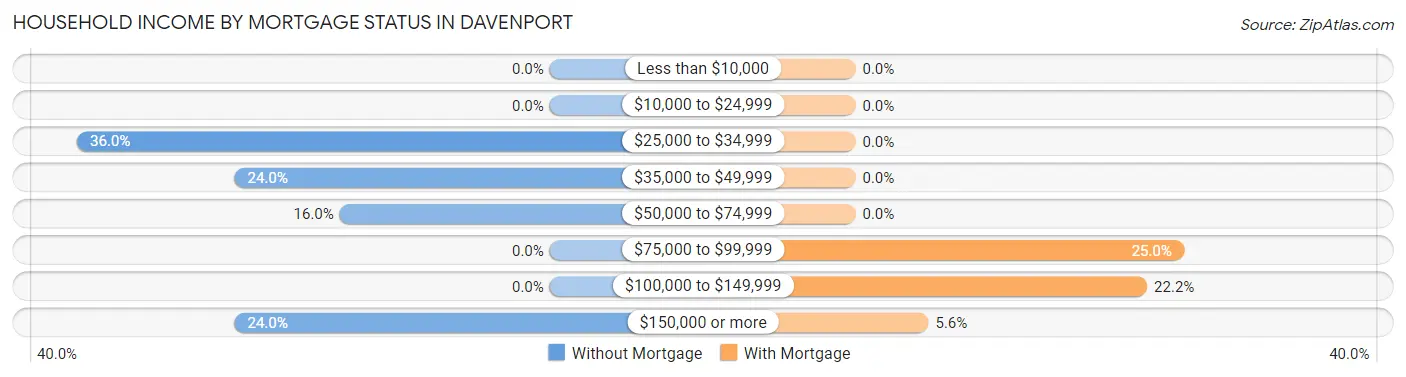
| Household Income | Without Mortgage | With Mortgage |
| Less than $10,000 | 0 (0.0%) | 0 (0.0%) |
| $10,000 to $24,999 | 0 (0.0%) | 0 (0.0%) |
| $25,000 to $34,999 | 9 (36.0%) | 0 (0.0%) |
| $35,000 to $49,999 | 6 (24.0%) | 0 (0.0%) |
| $50,000 to $74,999 | 4 (16.0%) | 0 (0.0%) |
| $75,000 to $99,999 | 0 (0.0%) | 9 (25.0%) |
| $100,000 to $149,999 | 0 (0.0%) | 8 (22.2%) |
| $150,000 or more | 6 (24.0%) | 2 (5.6%) |
| Total | 25 (100.0%) | 36 (100.0%) |
Property Value to Household Income Ratio in Davenport
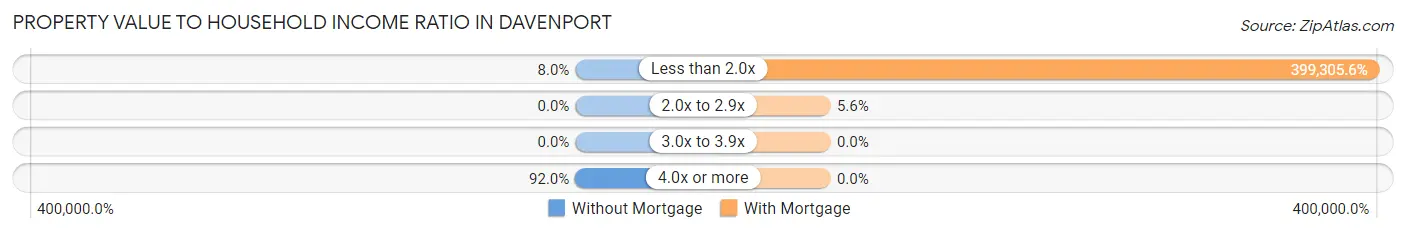
| Value-to-Income Ratio | Without Mortgage | With Mortgage |
| Less than 2.0x | 2 (8.0%) | 143,750 (399,305.6%) |
| 2.0x to 2.9x | 0 (0.0%) | 2 (5.6%) |
| 3.0x to 3.9x | 0 (0.0%) | 0 (0.0%) |
| 4.0x or more | 23 (92.0%) | 0 (0.0%) |
| Total | 25 (100.0%) | 36 (100.0%) |
Real Estate Taxes by Mortgage Status in Davenport
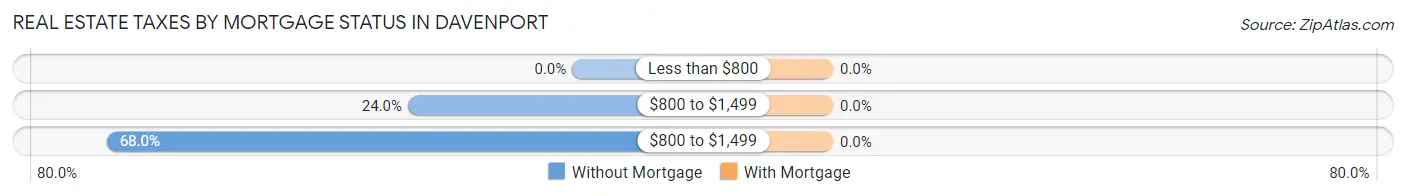
| Property Taxes | Without Mortgage | With Mortgage |
| Less than $800 | 0 (0.0%) | 0 (0.0%) |
| $800 to $1,499 | 6 (24.0%) | 0 (0.0%) |
| $800 to $1,499 | 17 (68.0%) | 0 (0.0%) |
| Total | 25 (100.0%) | 36 (100.0%) |
Health & Disability in Davenport
Health Insurance Coverage by Age in Davenport
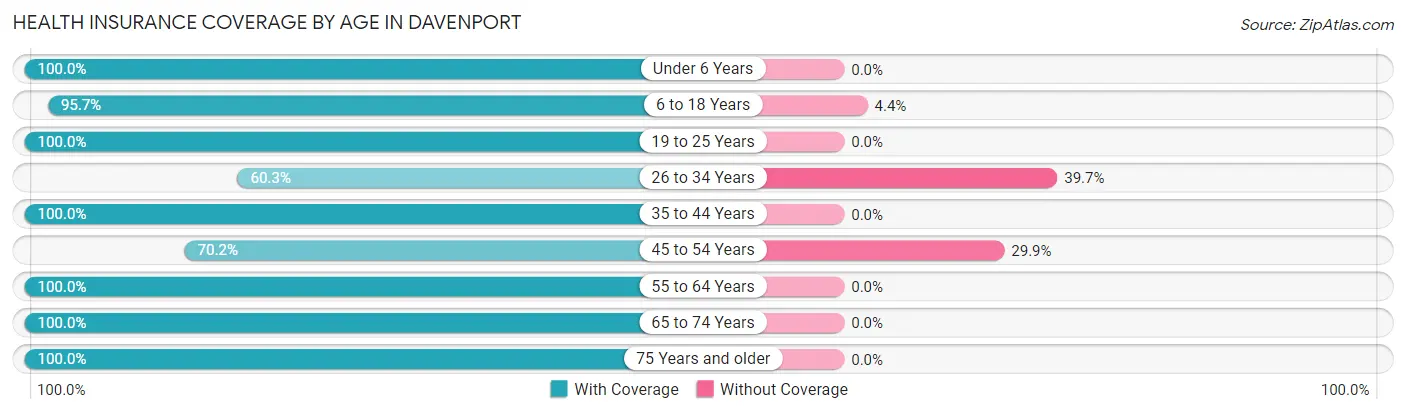
| Age Bracket | With Coverage | Without Coverage |
| Under 6 Years | 48 (100.0%) | 0 (0.0%) |
| 6 to 18 Years | 154 (95.7%) | 7 (4.3%) |
| 19 to 25 Years | 17 (100.0%) | 0 (0.0%) |
| 26 to 34 Years | 85 (60.3%) | 56 (39.7%) |
| 35 to 44 Years | 64 (100.0%) | 0 (0.0%) |
| 45 to 54 Years | 47 (70.2%) | 20 (29.8%) |
| 55 to 64 Years | 71 (100.0%) | 0 (0.0%) |
| 65 to 74 Years | 59 (100.0%) | 0 (0.0%) |
| 75 Years and older | 22 (100.0%) | 0 (0.0%) |
| Total | 567 (87.2%) | 83 (12.8%) |
Health Insurance Coverage by Citizenship Status in Davenport
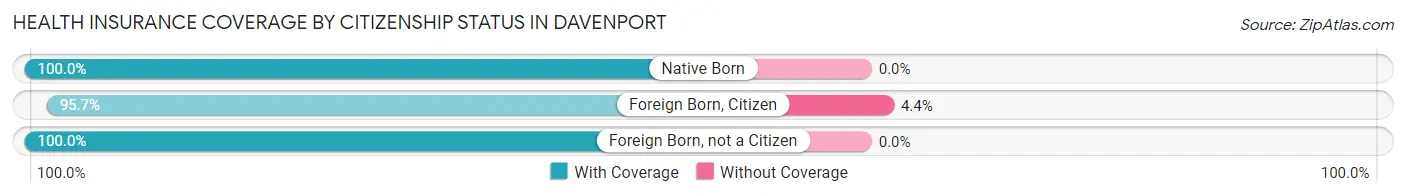
| Citizenship Status | With Coverage | Without Coverage |
| Native Born | 48 (100.0%) | 0 (0.0%) |
| Foreign Born, Citizen | 154 (95.7%) | 7 (4.3%) |
| Foreign Born, not a Citizen | 17 (100.0%) | 0 (0.0%) |
Health Insurance Coverage by Household Income in Davenport
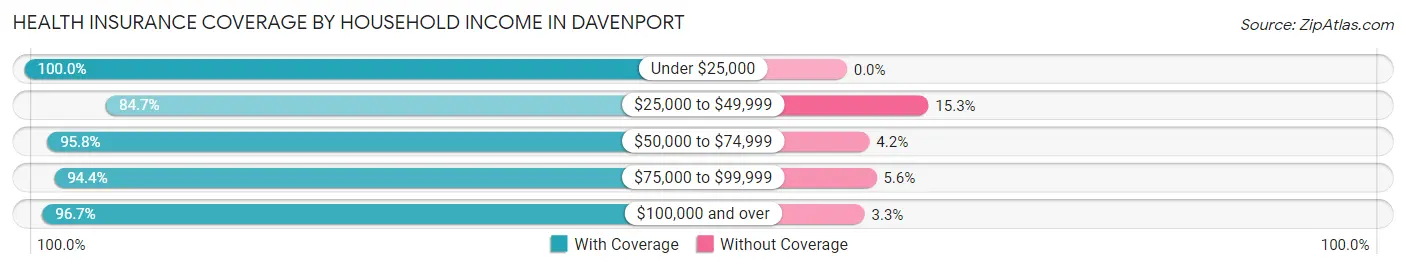
| Household Income | With Coverage | Without Coverage |
| Under $25,000 | 32 (100.0%) | 0 (0.0%) |
| $25,000 to $49,999 | 72 (84.7%) | 13 (15.3%) |
| $50,000 to $74,999 | 158 (95.8%) | 7 (4.2%) |
| $75,000 to $99,999 | 102 (94.4%) | 6 (5.6%) |
| $100,000 and over | 203 (96.7%) | 7 (3.3%) |
Public vs Private Health Insurance Coverage by Age in Davenport
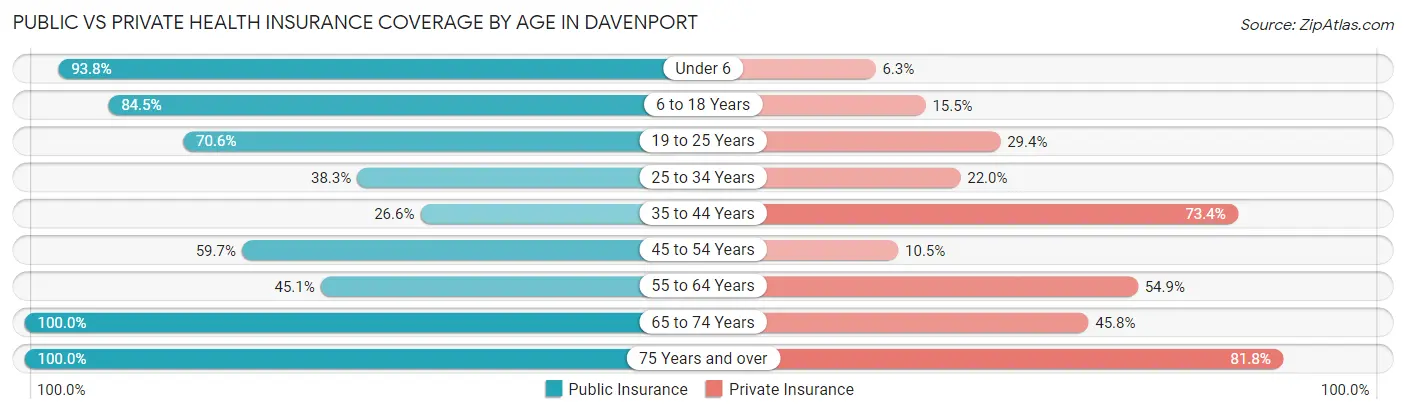
| Age Bracket | Public Insurance | Private Insurance |
| Under 6 | 45 (93.8%) | 3 (6.2%) |
| 6 to 18 Years | 136 (84.5%) | 25 (15.5%) |
| 19 to 25 Years | 12 (70.6%) | 5 (29.4%) |
| 25 to 34 Years | 54 (38.3%) | 31 (22.0%) |
| 35 to 44 Years | 17 (26.6%) | 47 (73.4%) |
| 45 to 54 Years | 40 (59.7%) | 7 (10.4%) |
| 55 to 64 Years | 32 (45.1%) | 39 (54.9%) |
| 65 to 74 Years | 59 (100.0%) | 27 (45.8%) |
| 75 Years and over | 22 (100.0%) | 18 (81.8%) |
| Total | 417 (64.1%) | 202 (31.1%) |
Disability Status by Sex by Age in Davenport
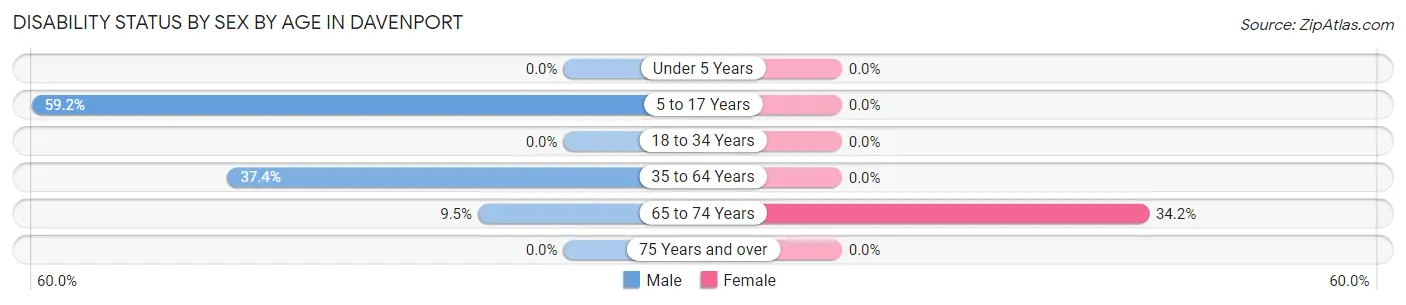
| Age Bracket | Male | Female |
| Under 5 Years | 0 (0.0%) | 0 (0.0%) |
| 5 to 17 Years | 45 (59.2%) | 0 (0.0%) |
| 18 to 34 Years | 0 (0.0%) | 0 (0.0%) |
| 35 to 64 Years | 46 (37.4%) | 0 (0.0%) |
| 65 to 74 Years | 2 (9.5%) | 13 (34.2%) |
| 75 Years and over | 0 (0.0%) | 0 (0.0%) |
Disability Class by Sex by Age in Davenport
Disability Class: Hearing Difficulty
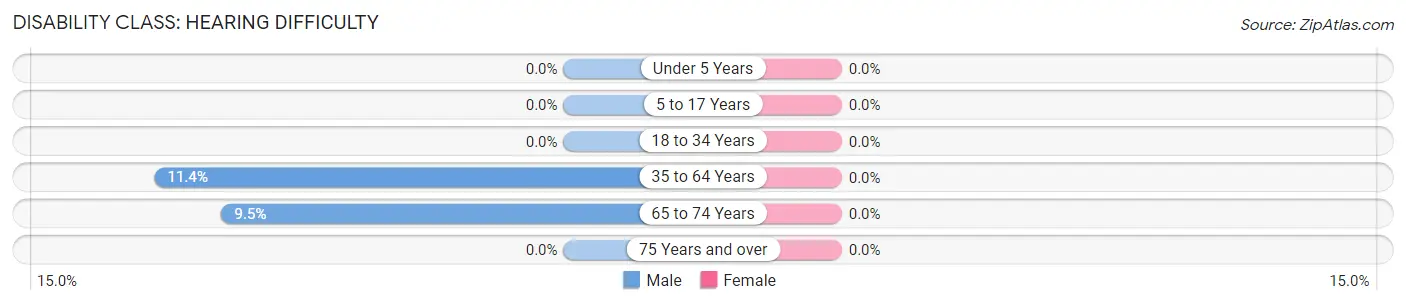
| Age Bracket | Male | Female |
| Under 5 Years | 0 (0.0%) | 0 (0.0%) |
| 5 to 17 Years | 0 (0.0%) | 0 (0.0%) |
| 18 to 34 Years | 0 (0.0%) | 0 (0.0%) |
| 35 to 64 Years | 14 (11.4%) | 0 (0.0%) |
| 65 to 74 Years | 2 (9.5%) | 0 (0.0%) |
| 75 Years and over | 0 (0.0%) | 0 (0.0%) |
Disability Class: Vision Difficulty
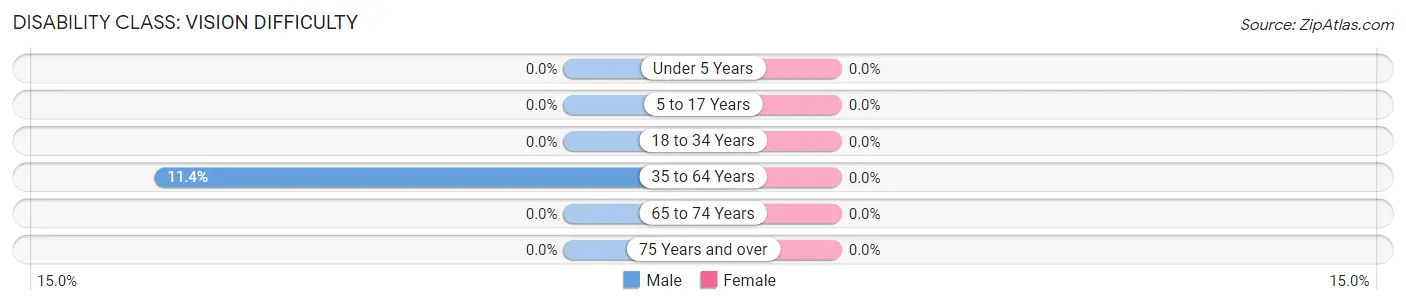
| Age Bracket | Male | Female |
| Under 5 Years | 0 (0.0%) | 0 (0.0%) |
| 5 to 17 Years | 0 (0.0%) | 0 (0.0%) |
| 18 to 34 Years | 0 (0.0%) | 0 (0.0%) |
| 35 to 64 Years | 14 (11.4%) | 0 (0.0%) |
| 65 to 74 Years | 0 (0.0%) | 0 (0.0%) |
| 75 Years and over | 0 (0.0%) | 0 (0.0%) |
Disability Class: Cognitive Difficulty
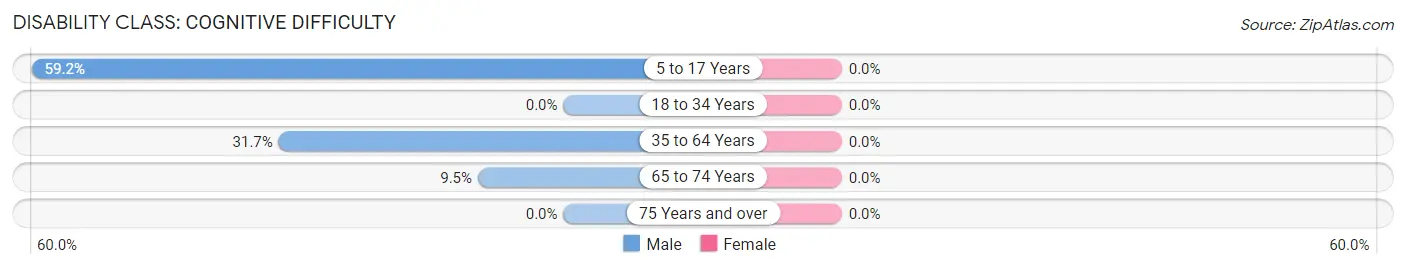
| Age Bracket | Male | Female |
| 5 to 17 Years | 45 (59.2%) | 0 (0.0%) |
| 18 to 34 Years | 0 (0.0%) | 0 (0.0%) |
| 35 to 64 Years | 39 (31.7%) | 0 (0.0%) |
| 65 to 74 Years | 2 (9.5%) | 0 (0.0%) |
| 75 Years and over | 0 (0.0%) | 0 (0.0%) |
Disability Class: Ambulatory Difficulty
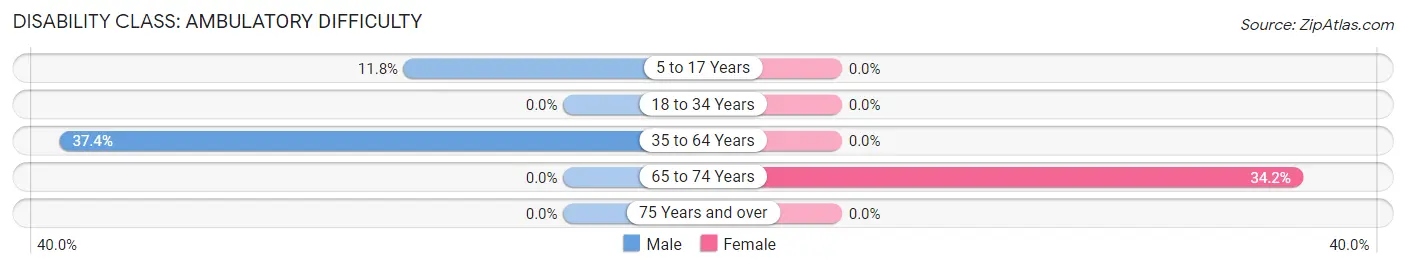
| Age Bracket | Male | Female |
| 5 to 17 Years | 9 (11.8%) | 0 (0.0%) |
| 18 to 34 Years | 0 (0.0%) | 0 (0.0%) |
| 35 to 64 Years | 46 (37.4%) | 0 (0.0%) |
| 65 to 74 Years | 0 (0.0%) | 13 (34.2%) |
| 75 Years and over | 0 (0.0%) | 0 (0.0%) |
Disability Class: Self-Care Difficulty
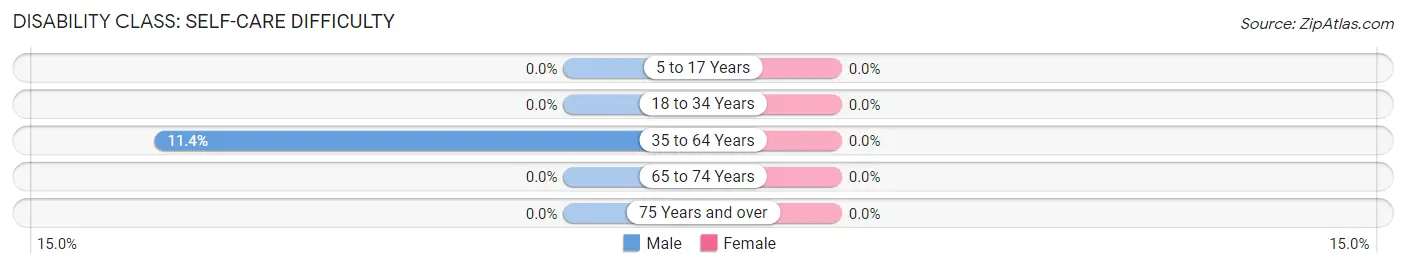
| Age Bracket | Male | Female |
| 5 to 17 Years | 0 (0.0%) | 0 (0.0%) |
| 18 to 34 Years | 0 (0.0%) | 0 (0.0%) |
| 35 to 64 Years | 14 (11.4%) | 0 (0.0%) |
| 65 to 74 Years | 0 (0.0%) | 0 (0.0%) |
| 75 Years and over | 0 (0.0%) | 0 (0.0%) |
Technology Access in Davenport
Computing Device Access in Davenport
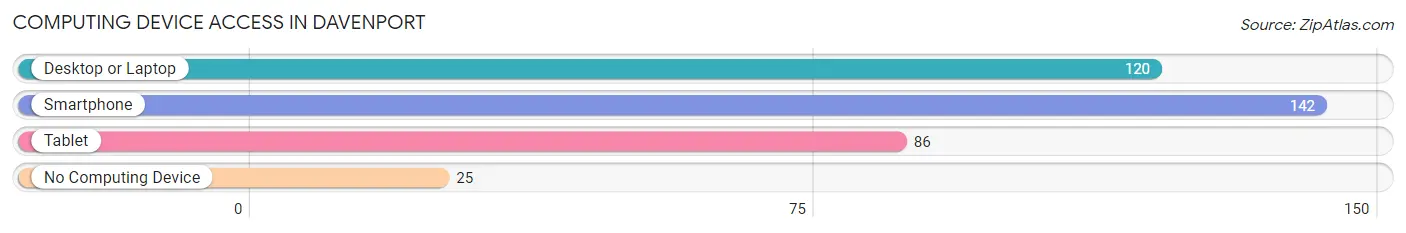
| Device Type | # Households | % Households |
| Desktop or Laptop | 120 | 71.0% |
| Smartphone | 142 | 84.0% |
| Tablet | 86 | 50.9% |
| No Computing Device | 25 | 14.8% |
| Total | 169 | 100.0% |
Internet Access in Davenport
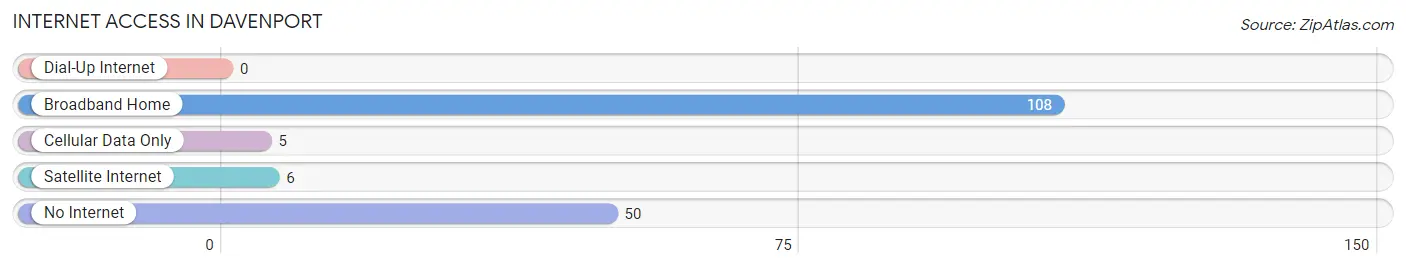
| Internet Type | # Households | % Households |
| Dial-Up Internet | 0 | 0.0% |
| Broadband Home | 108 | 63.9% |
| Cellular Data Only | 5 | 3.0% |
| Satellite Internet | 6 | 3.5% |
| No Internet | 50 | 29.6% |
| Total | 169 | 100.0% |
Davenport Summary
Davenport is a small unincorporated community located in Santa Cruz County, California. It is situated on the coast of the Pacific Ocean, approximately 20 miles south of Santa Cruz and 40 miles north of Monterey. The population of Davenport was estimated to be around 500 in 2000.
History
Davenport was founded in 1867 by William Davenport, a former whaler from Maine. He purchased the land from the local Native Americans and established a whaling station. The whaling station was successful for a few years, but eventually the whaling industry declined and the station was abandoned.
In the late 19th century, Davenport became a popular tourist destination. The town was known for its beautiful beaches and scenic views of the Pacific Ocean. In the early 20th century, Davenport became a popular spot for artists and writers, who were drawn to the area’s natural beauty.
Geography
Davenport is located on the coast of the Pacific Ocean, approximately 20 miles south of Santa Cruz and 40 miles north of Monterey. The town is situated on a bluff overlooking the ocean, and is surrounded by rolling hills and redwood forests. The climate in Davenport is mild and temperate, with average temperatures ranging from the mid-50s to the mid-70s.
Economy
The economy of Davenport is largely based on tourism. The town is home to several small businesses, including restaurants, cafes, and art galleries. The town also has a small fishing industry, and is known for its fresh seafood.
Demographics
The population of Davenport was estimated to be around 500 in 2000. The town is predominantly white, with a small Hispanic population. The median household income in Davenport is approximately $50,000. The town has a low crime rate and is considered to be a safe place to live.
Conclusion
Davenport is a small unincorporated community located in Santa Cruz County, California. It is situated on the coast of the Pacific Ocean, approximately 20 miles south of Santa Cruz and 40 miles north of Monterey. The population of Davenport was estimated to be around 500 in 2000. The town is known for its beautiful beaches and scenic views of the Pacific Ocean, and its economy is largely based on tourism. The town is predominantly white, with a small Hispanic population, and has a median household income of approximately $50,000. Davenport is considered to be a safe place to live, with a low crime rate.
Common Questions
What is Per Capita Income in Davenport?
Per Capita income in Davenport is $25,452.
What is the Median Family Income in Davenport?
Median Family Income in Davenport is $78,819.
What is the Median Household income in Davenport?
Median Household Income in Davenport is $65,855.
What is Income or Wage Gap in Davenport?
Income or Wage Gap in Davenport is 49.5%.
Women in Davenport earn 50.5 cents for every dollar earned by a man.
What is Inequality or Gini Index in Davenport?
Inequality or Gini Index in Davenport is 0.51.
What is the Total Population of Davenport?
Total Population of Davenport is 650.
What is the Total Male Population of Davenport?
Total Male Population of Davenport is 344.
What is the Total Female Population of Davenport?
Total Female Population of Davenport is 306.
What is the Ratio of Males per 100 Females in Davenport?
There are 112.42 Males per 100 Females in Davenport.
What is the Ratio of Females per 100 Males in Davenport?
There are 88.95 Females per 100 Males in Davenport.
What is the Median Population Age in Davenport?
Median Population Age in Davenport is 32.4 Years.
What is the Average Family Size in Davenport
Average Family Size in Davenport is 4.7 People.
What is the Average Household Size in Davenport
Average Household Size in Davenport is 3.5 People.
How Large is the Labor Force in Davenport?
There are 274 People in the Labor Forcein in Davenport.
What is the Percentage of People in the Labor Force in Davenport?
58.2% of People are in the Labor Force in Davenport.
What is the Unemployment Rate in Davenport?
Unemployment Rate in Davenport is 10.2%.