Fowler, CA Map & Demographics
Fowler Map
Fowler Overview
$26,623
PER CAPITA INCOME
$81,463
AVG FAMILY INCOME
$56,410
AVG HOUSEHOLD INCOME
39.8%
WAGE / INCOME GAP [ % ]
60.2¢/ $1
WAGE / INCOME GAP [ $ ]
0.53
INEQUALITY / GINI INDEX
6,819
TOTAL POPULATION
3,169
MALE POPULATION
3,650
FEMALE POPULATION
86.82
MALES / 100 FEMALES
115.18
FEMALES / 100 MALES
34.1
MEDIAN AGE
3.9
AVG FAMILY SIZE
3.2
AVG HOUSEHOLD SIZE
2,794
LABOR FORCE [ PEOPLE ]
55.6%
PERCENT IN LABOR FORCE
8.5%
UNEMPLOYMENT RATE
Fowler Zip Codes
Fowler Area Codes
Income in Fowler
Income Overview in Fowler
Per Capita Income in Fowler is $26,623, while median incomes of families and households are $81,463 and $56,410 respectively.
| Characteristic | Number | Measure |
| Per Capita Income | 6,819 | $26,623 |
| Median Family Income | 1,531 | $81,463 |
| Mean Family Income | 1,531 | $104,289 |
| Median Household Income | 2,107 | $56,410 |
| Mean Household Income | 2,107 | $84,773 |
| Income Deficit | 1,531 | $0 |
| Wage / Income Gap (%) | 6,819 | 39.77% |
| Wage / Income Gap ($) | 6,819 | 60.23¢ per $1 |
| Gini / Inequality Index | 6,819 | 0.53 |
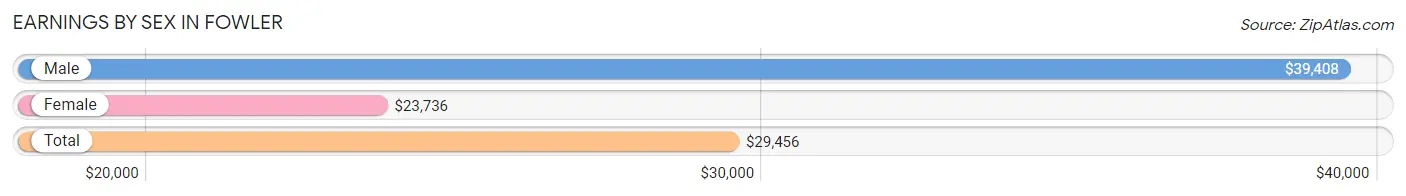
Earnings by Sex in Fowler
Average Earnings in Fowler are $29,456, $39,408 for men and $23,736 for women, a difference of 39.8%.
| Sex | Number | Average Earnings |
| Male | 1,488 (52.6%) | $39,408 |
| Female | 1,343 (47.4%) | $23,736 |
| Total | 2,831 (100.0%) | $29,456 |
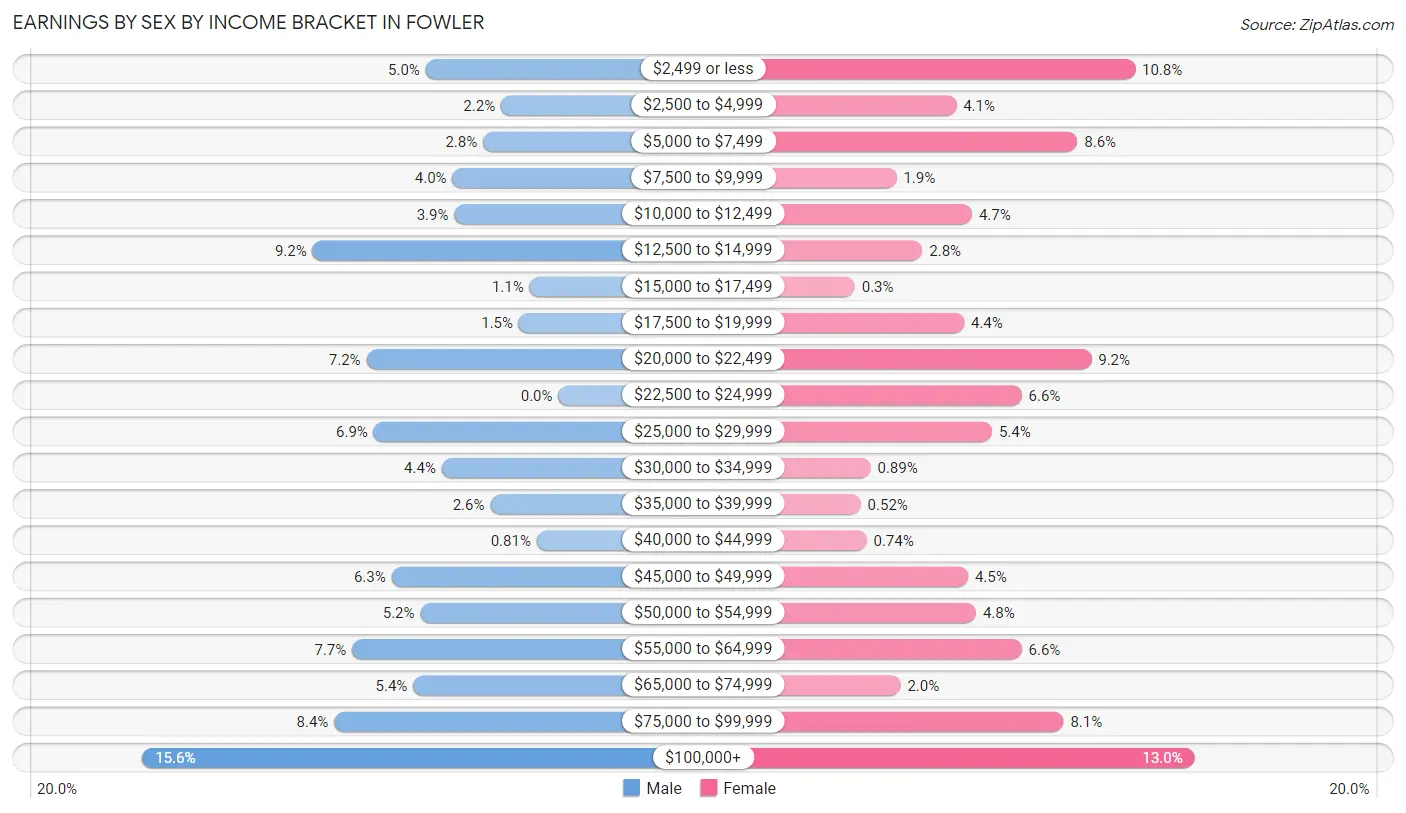
Earnings by Sex by Income Bracket in Fowler
The most common earnings brackets in Fowler are $100,000+ for men (232 | 15.6%) and $100,000+ for women (175 | 13.0%).
| Income | Male | Female |
| $2,499 or less | 74 (5.0%) | 145 (10.8%) |
| $2,500 to $4,999 | 32 (2.1%) | 55 (4.1%) |
| $5,000 to $7,499 | 42 (2.8%) | 116 (8.6%) |
| $7,500 to $9,999 | 59 (4.0%) | 25 (1.9%) |
| $10,000 to $12,499 | 58 (3.9%) | 63 (4.7%) |
| $12,500 to $14,999 | 137 (9.2%) | 38 (2.8%) |
| $15,000 to $17,499 | 16 (1.1%) | 4 (0.3%) |
| $17,500 to $19,999 | 22 (1.5%) | 59 (4.4%) |
| $20,000 to $22,499 | 107 (7.2%) | 123 (9.2%) |
| $22,500 to $24,999 | 0 (0.0%) | 88 (6.6%) |
| $25,000 to $29,999 | 103 (6.9%) | 73 (5.4%) |
| $30,000 to $34,999 | 65 (4.4%) | 12 (0.9%) |
| $35,000 to $39,999 | 38 (2.5%) | 7 (0.5%) |
| $40,000 to $44,999 | 12 (0.8%) | 10 (0.7%) |
| $45,000 to $49,999 | 93 (6.2%) | 61 (4.5%) |
| $50,000 to $54,999 | 77 (5.2%) | 65 (4.8%) |
| $55,000 to $64,999 | 115 (7.7%) | 88 (6.6%) |
| $65,000 to $74,999 | 81 (5.4%) | 27 (2.0%) |
| $75,000 to $99,999 | 125 (8.4%) | 109 (8.1%) |
| $100,000+ | 232 (15.6%) | 175 (13.0%) |
| Total | 1,488 (100.0%) | 1,343 (100.0%) |
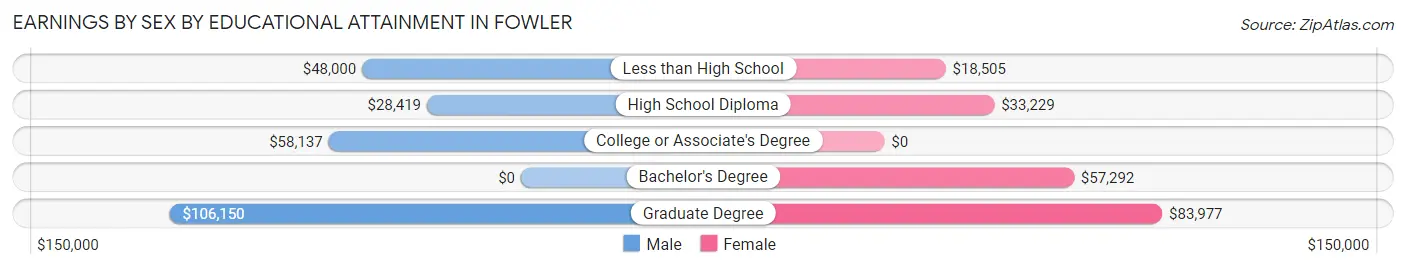
Earnings by Sex by Educational Attainment in Fowler
Average earnings in Fowler are $49,974 for men and $27,581 for women, a difference of 44.8%. Men with an educational attainment of graduate degree enjoy the highest average annual earnings of $106,150, while those with high school diploma education earn the least with $28,419. Women with an educational attainment of graduate degree earn the most with the average annual earnings of $83,977, while those with less than high school education have the smallest earnings of $18,505.
| Educational Attainment | Male Income | Female Income |
| Less than High School | $48,000 | $18,505 |
| High School Diploma | $28,419 | $33,229 |
| College or Associate's Degree | $58,137 | $0 |
| Bachelor's Degree | - | - |
| Graduate Degree | $106,150 | $83,977 |
| Total | $49,974 | $27,581 |
Family Income in Fowler
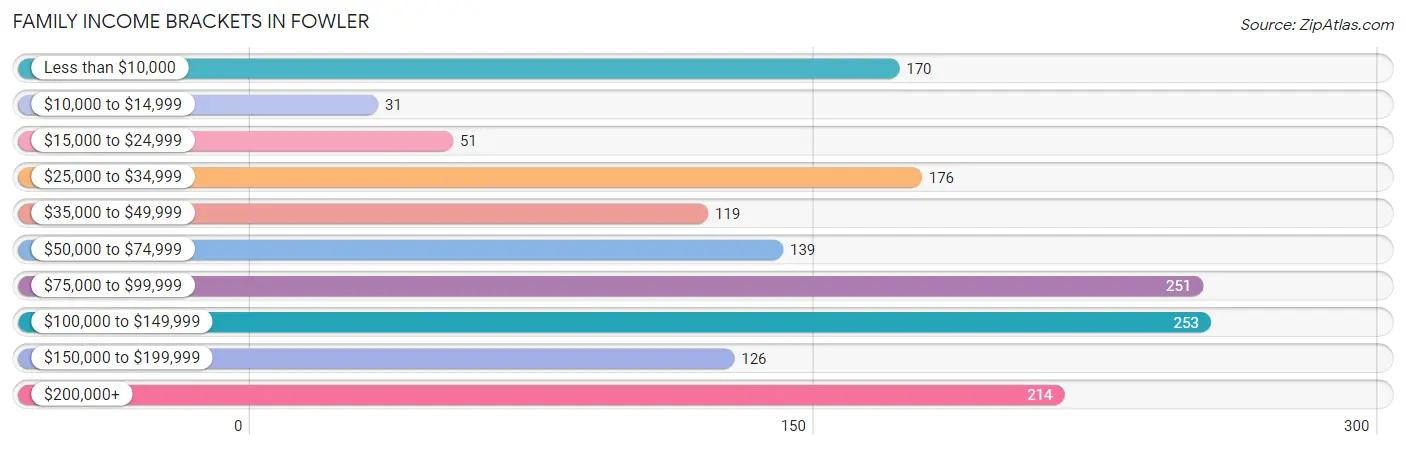
Family Income Brackets in Fowler
According to the Fowler family income data, there are 253 families falling into the $100,000 to $149,999 income range, which is the most common income bracket and makes up 16.5% of all families. Conversely, the $10,000 to $14,999 income bracket is the least frequent group with only 31 families (2.0%) belonging to this category.
| Income Bracket | # Families | % Families |
| Less than $10,000 | 170 | 11.1% |
| $10,000 to $14,999 | 31 | 2.0% |
| $15,000 to $24,999 | 51 | 3.3% |
| $25,000 to $34,999 | 176 | 11.5% |
| $35,000 to $49,999 | 119 | 7.8% |
| $50,000 to $74,999 | 139 | 9.1% |
| $75,000 to $99,999 | 251 | 16.4% |
| $100,000 to $149,999 | 253 | 16.5% |
| $150,000 to $199,999 | 126 | 8.2% |
| $200,000+ | 214 | 14.0% |
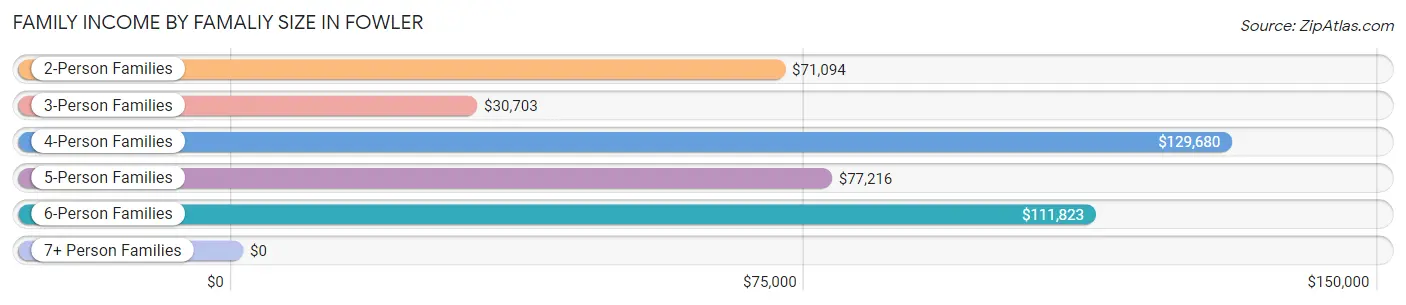
Family Income by Famaliy Size in Fowler
4-person families (335 | 21.9%) account for the highest median family income in Fowler with $129,680 per family, while 2-person families (449 | 29.3%) have the highest median income of $35,547 per family member.
| Income Bracket | # Families | Median Income |
| 2-Person Families | 449 (29.3%) | $71,094 |
| 3-Person Families | 344 (22.5%) | $30,703 |
| 4-Person Families | 335 (21.9%) | $129,680 |
| 5-Person Families | 192 (12.5%) | $77,216 |
| 6-Person Families | 115 (7.5%) | $111,823 |
| 7+ Person Families | 96 (6.3%) | $0 |
| Total | 1,531 (100.0%) | $81,463 |
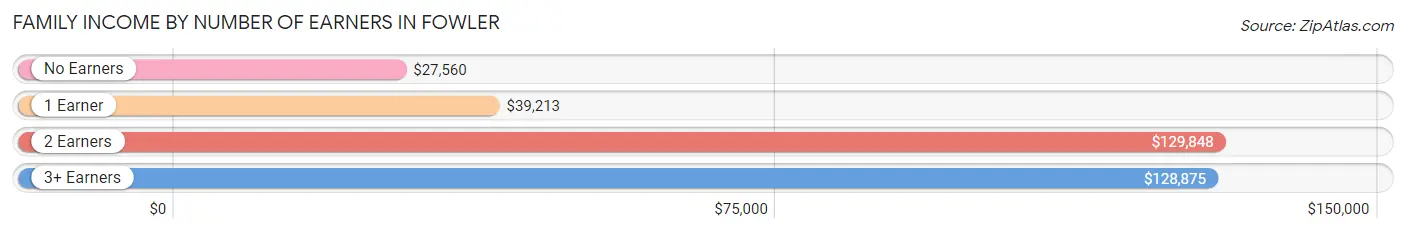
Family Income by Number of Earners in Fowler
The median family income in Fowler is $81,463, with families comprising 2 earners (476) having the highest median family income of $129,848, while families with no earners (286) have the lowest median family income of $27,560, accounting for 31.1% and 18.7% of families, respectively.
| Number of Earners | # Families | Median Income |
| No Earners | 286 (18.7%) | $27,560 |
| 1 Earner | 465 (30.4%) | $39,213 |
| 2 Earners | 476 (31.1%) | $129,848 |
| 3+ Earners | 304 (19.9%) | $128,875 |
| Total | 1,531 (100.0%) | $81,463 |
Household Income in Fowler
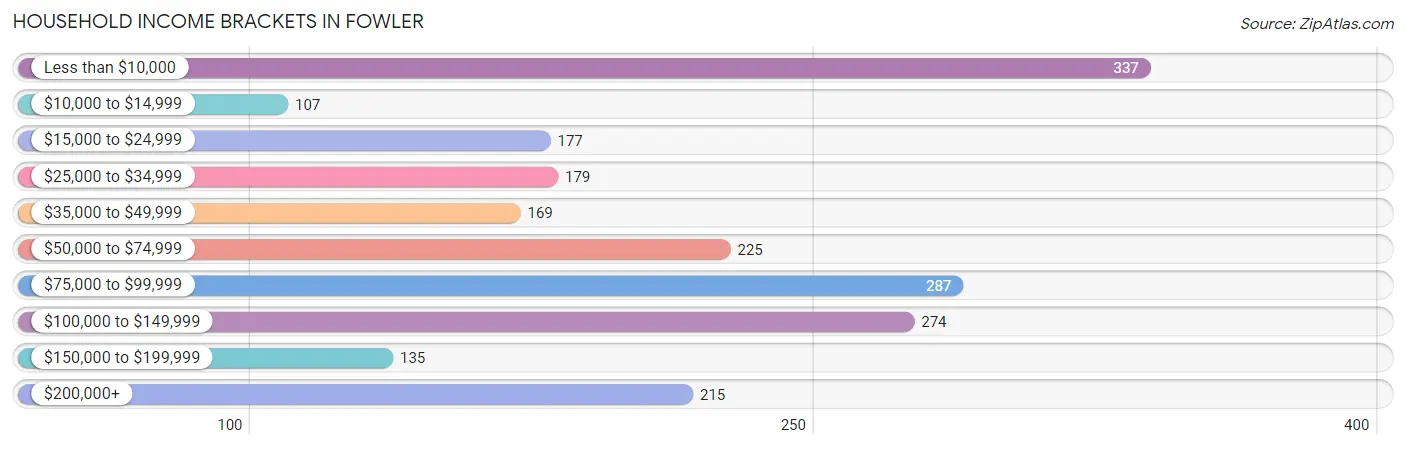
Household Income Brackets in Fowler
With 337 households falling in the category, the less than $10,000 income range is the most frequent in Fowler, accounting for 16.0% of all households. In contrast, only 107 households (5.1%) fall into the $10,000 to $14,999 income bracket, making it the least populous group.
| Income Bracket | # Households | % Households |
| Less than $10,000 | 337 | 16.0% |
| $10,000 to $14,999 | 107 | 5.1% |
| $15,000 to $24,999 | 177 | 8.4% |
| $25,000 to $34,999 | 179 | 8.5% |
| $35,000 to $49,999 | 169 | 8.0% |
| $50,000 to $74,999 | 225 | 10.7% |
| $75,000 to $99,999 | 287 | 13.6% |
| $100,000 to $149,999 | 274 | 13.0% |
| $150,000 to $199,999 | 135 | 6.4% |
| $200,000+ | 215 | 10.2% |
Household Income by Householder Age in Fowler
The median household income in Fowler is $56,410, with the highest median household income of $75,760 found in the 45 to 64 years age bracket for the primary householder. A total of 951 households (45.1%) fall into this category. Meanwhile, the 15 to 24 years age bracket for the primary householder has the lowest median household income of $0, with 9 households (0.4%) in this group.
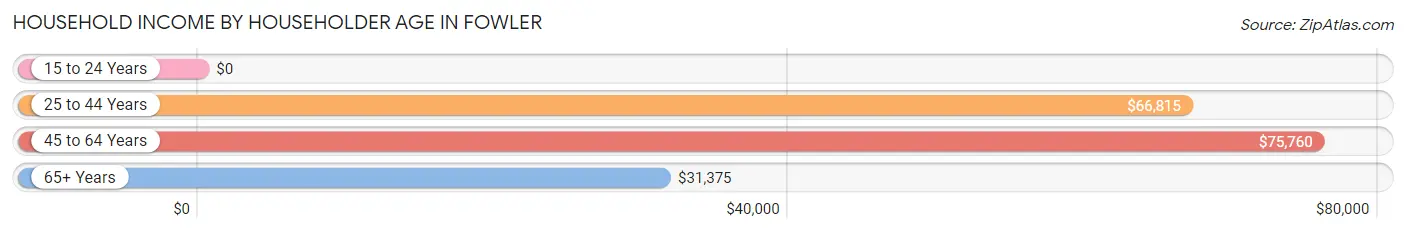
| Income Bracket | # Households | Median Income |
| 15 to 24 Years | 9 (0.4%) | $0 |
| 25 to 44 Years | 627 (29.8%) | $66,815 |
| 45 to 64 Years | 951 (45.1%) | $75,760 |
| 65+ Years | 520 (24.7%) | $31,375 |
| Total | 2,107 (100.0%) | $56,410 |
Poverty in Fowler
Income Below Poverty by Sex and Age in Fowler
With 15.3% poverty level for males and 26.0% for females among the residents of Fowler, 16 and 17 year old males and 5 year old females are the most vulnerable to poverty, with 66 males (47.8%) and 34 females (100.0%) in their respective age groups living below the poverty level.
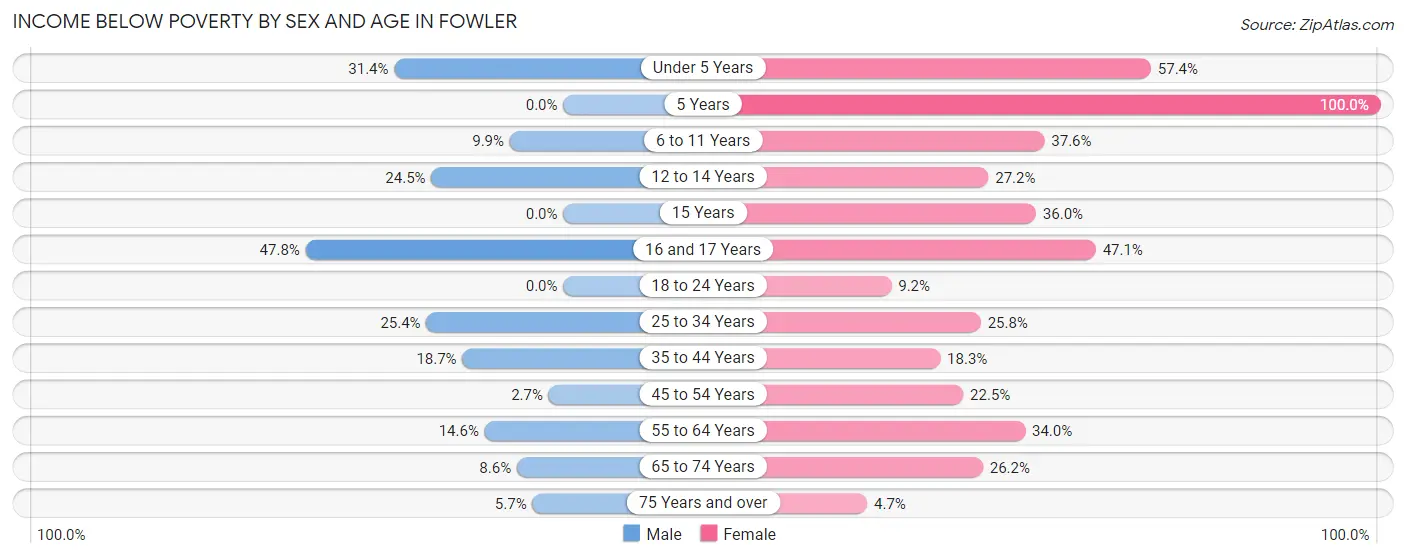
| Age Bracket | Male | Female |
| Under 5 Years | 85 (31.4%) | 109 (57.4%) |
| 5 Years | 0 (0.0%) | 34 (100.0%) |
| 6 to 11 Years | 28 (9.9%) | 94 (37.6%) |
| 12 to 14 Years | 36 (24.5%) | 87 (27.2%) |
| 15 Years | 0 (0.0%) | 49 (36.0%) |
| 16 and 17 Years | 66 (47.8%) | 41 (47.1%) |
| 18 to 24 Years | 0 (0.0%) | 44 (9.2%) |
| 25 to 34 Years | 123 (25.4%) | 74 (25.8%) |
| 35 to 44 Years | 50 (18.7%) | 86 (18.3%) |
| 45 to 54 Years | 11 (2.7%) | 98 (22.5%) |
| 55 to 64 Years | 55 (14.6%) | 135 (34.0%) |
| 65 to 74 Years | 18 (8.6%) | 78 (26.2%) |
| 75 Years and over | 9 (5.7%) | 11 (4.7%) |
| Total | 481 (15.3%) | 940 (26.0%) |
Income Above Poverty by Sex and Age in Fowler
According to the poverty statistics in Fowler, males aged 5 years and females aged 75 years and over are the age groups that are most secure financially, with 100.0% of males and 95.3% of females in these age groups living above the poverty line.
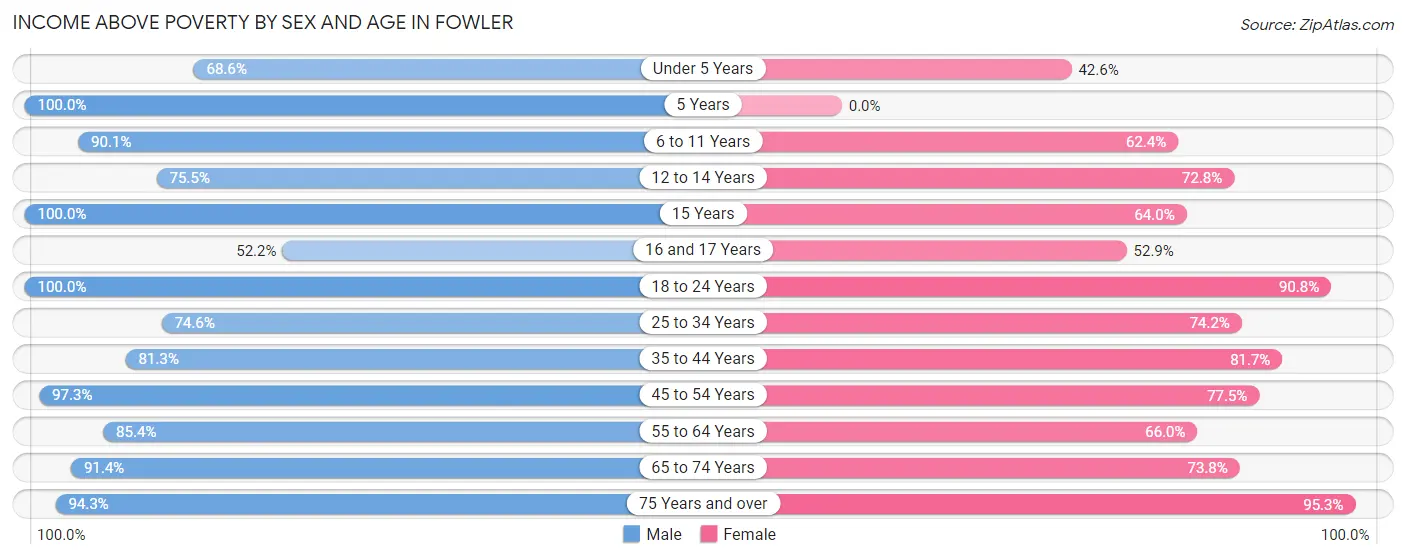
| Age Bracket | Male | Female |
| Under 5 Years | 186 (68.6%) | 81 (42.6%) |
| 5 Years | 131 (100.0%) | 0 (0.0%) |
| 6 to 11 Years | 254 (90.1%) | 156 (62.4%) |
| 12 to 14 Years | 111 (75.5%) | 233 (72.8%) |
| 15 Years | 33 (100.0%) | 87 (64.0%) |
| 16 and 17 Years | 72 (52.2%) | 46 (52.9%) |
| 18 to 24 Years | 243 (100.0%) | 435 (90.8%) |
| 25 to 34 Years | 361 (74.6%) | 213 (74.2%) |
| 35 to 44 Years | 217 (81.3%) | 385 (81.7%) |
| 45 to 54 Years | 397 (97.3%) | 337 (77.5%) |
| 55 to 64 Years | 322 (85.4%) | 262 (66.0%) |
| 65 to 74 Years | 191 (91.4%) | 220 (73.8%) |
| 75 Years and over | 148 (94.3%) | 223 (95.3%) |
| Total | 2,666 (84.7%) | 2,678 (74.0%) |
Income Below Poverty Among Married-Couple Families in Fowler
The poverty statistics for married-couple families in Fowler show that 7.1% or 77 of the total 1,090 families live below the poverty line. Families with 5 or more children have the highest poverty rate of 100.0%, comprising of 48 families. On the other hand, families with 3 or 4 children have the lowest poverty rate of 0.0%, which includes 0 families.
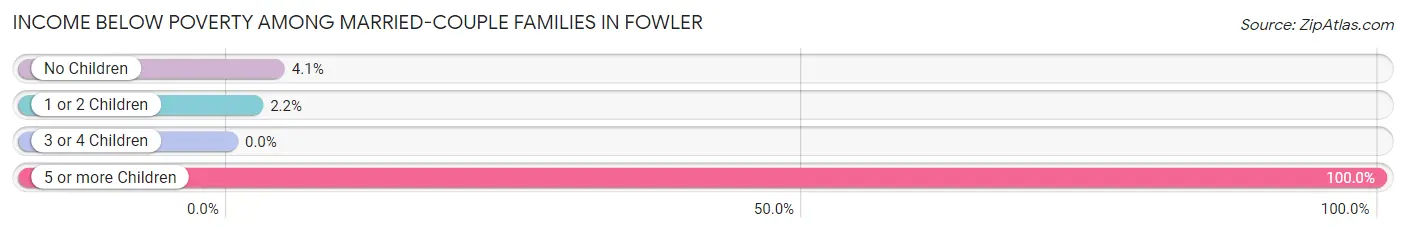
| Children | Above Poverty | Below Poverty |
| No Children | 447 (95.9%) | 19 (4.1%) |
| 1 or 2 Children | 447 (97.8%) | 10 (2.2%) |
| 3 or 4 Children | 119 (100.0%) | 0 (0.0%) |
| 5 or more Children | 0 (0.0%) | 48 (100.0%) |
| Total | 1,013 (92.9%) | 77 (7.1%) |
Income Below Poverty Among Single-Parent Households in Fowler
According to the poverty data in Fowler, 30.1% or 47 single-father households and 55.8% or 159 single-mother households are living below the poverty line. Among single-father households, those with 1 or 2 children have the highest poverty rate, with 47 households (34.8%) experiencing poverty. Likewise, among single-mother households, those with 3 or 4 children have the highest poverty rate, with 37 households (100.0%) falling below the poverty line.
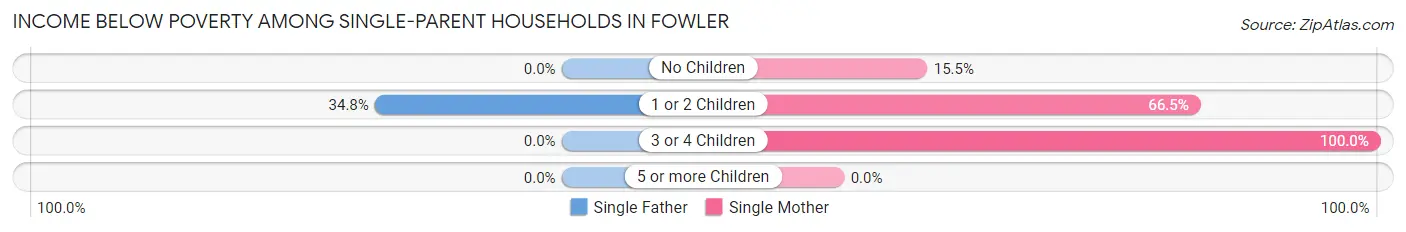
| Children | Single Father | Single Mother |
| No Children | 0 (0.0%) | 13 (15.5%) |
| 1 or 2 Children | 47 (34.8%) | 109 (66.5%) |
| 3 or 4 Children | 0 (0.0%) | 37 (100.0%) |
| 5 or more Children | 0 (0.0%) | 0 (0.0%) |
| Total | 47 (30.1%) | 159 (55.8%) |
Income Below Poverty Among Married-Couple vs Single-Parent Households in Fowler
The poverty data for Fowler shows that 77 of the married-couple family households (7.1%) and 206 of the single-parent households (46.7%) are living below the poverty level. Within the married-couple family households, those with 5 or more children have the highest poverty rate, with 48 households (100.0%) falling below the poverty line. Among the single-parent households, those with 3 or 4 children have the highest poverty rate, with 37 household (100.0%) living below poverty.
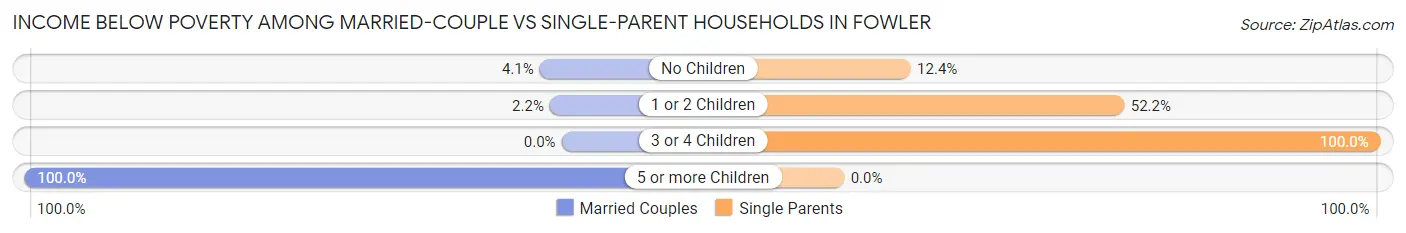
| Children | Married-Couple Families | Single-Parent Households |
| No Children | 19 (4.1%) | 13 (12.4%) |
| 1 or 2 Children | 10 (2.2%) | 156 (52.2%) |
| 3 or 4 Children | 0 (0.0%) | 37 (100.0%) |
| 5 or more Children | 48 (100.0%) | 0 (0.0%) |
| Total | 77 (7.1%) | 206 (46.7%) |
Race in Fowler
The most populous races in Fowler are Hispanic or Latino (4,493 | 65.9%), White / Caucasian (3,644 | 53.4%), and Some other Race (1,093 | 16.0%).
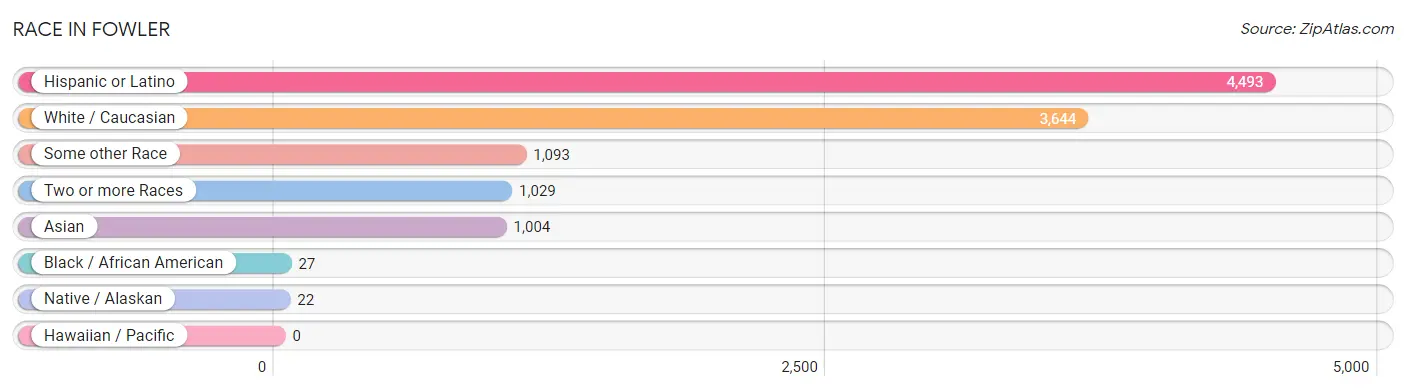
| Race | # Population | % Population |
| Asian | 1,004 | 14.7% |
| Black / African American | 27 | 0.4% |
| Hawaiian / Pacific | 0 | 0.0% |
| Hispanic or Latino | 4,493 | 65.9% |
| Native / Alaskan | 22 | 0.3% |
| White / Caucasian | 3,644 | 53.4% |
| Two or more Races | 1,029 | 15.1% |
| Some other Race | 1,093 | 16.0% |
| Total | 6,819 | 100.0% |
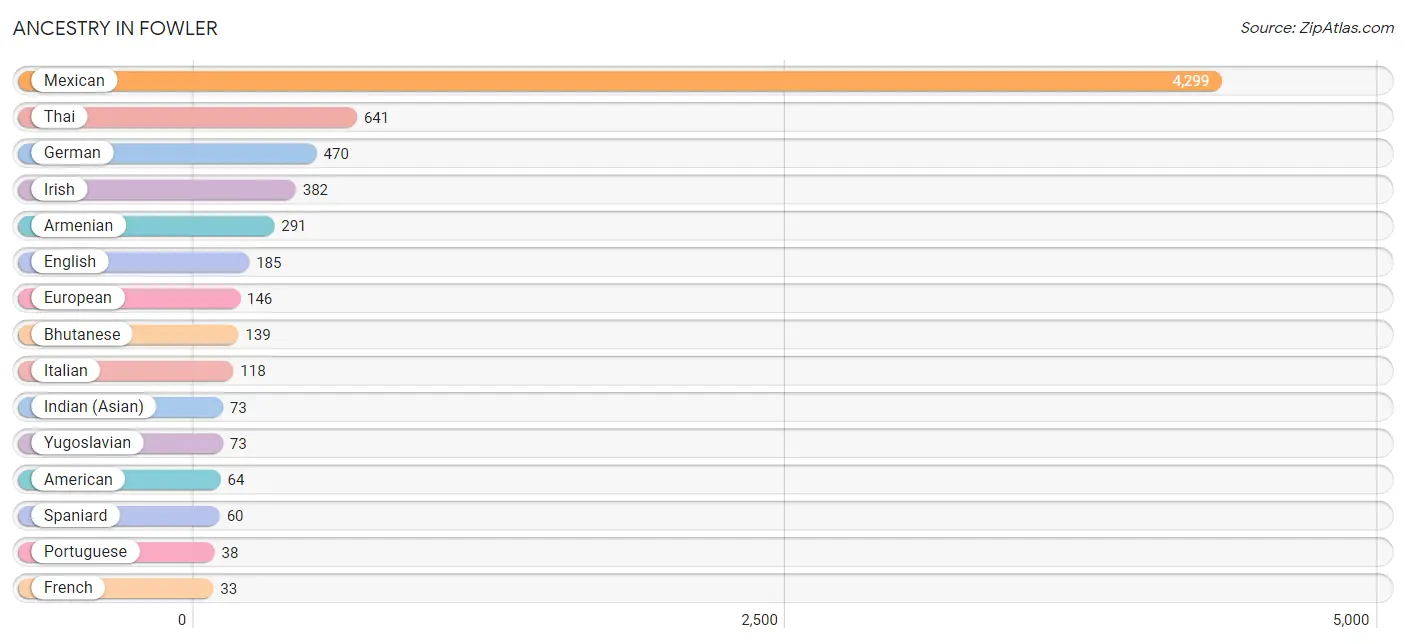
Ancestry in Fowler
The most populous ancestries reported in Fowler are Mexican (4,299 | 63.0%), Thai (641 | 9.4%), German (470 | 6.9%), Irish (382 | 5.6%), and Armenian (291 | 4.3%), together accounting for 89.2% of all Fowler residents.
| Ancestry | # Population | % Population |
| American | 64 | 0.9% |
| Armenian | 291 | 4.3% |
| Bangladeshi | 30 | 0.4% |
| Basque | 11 | 0.2% |
| Bhutanese | 139 | 2.0% |
| Blackfeet | 11 | 0.2% |
| Central American | 20 | 0.3% |
| Czech | 21 | 0.3% |
| Danish | 20 | 0.3% |
| Dutch | 10 | 0.2% |
| English | 185 | 2.7% |
| European | 146 | 2.1% |
| French | 33 | 0.5% |
| German | 470 | 6.9% |
| German Russian | 31 | 0.4% |
| Greek | 12 | 0.2% |
| Guatemalan | 20 | 0.3% |
| Indian (Asian) | 73 | 1.1% |
| Irish | 382 | 5.6% |
| Italian | 118 | 1.7% |
| Japanese | 6 | 0.1% |
| Mexican | 4,299 | 63.0% |
| Norwegian | 25 | 0.4% |
| Peruvian | 12 | 0.2% |
| Pima | 11 | 0.2% |
| Portuguese | 38 | 0.6% |
| Russian | 11 | 0.2% |
| Scotch-Irish | 10 | 0.2% |
| Scottish | 11 | 0.2% |
| South American | 22 | 0.3% |
| Spaniard | 60 | 0.9% |
| Spanish | 21 | 0.3% |
| Thai | 641 | 9.4% |
| Uruguayan | 10 | 0.2% |
| Welsh | 11 | 0.2% |
| Yugoslavian | 73 | 1.1% | View All 36 Rows |
Immigrants in Fowler
The most numerous immigrant groups reported in Fowler came from Latin America (671 | 9.8%), Central America (636 | 9.3%), Mexico (616 | 9.0%), Asia (563 | 8.3%), and India (533 | 7.8%), together accounting for 44.3% of all Fowler residents.
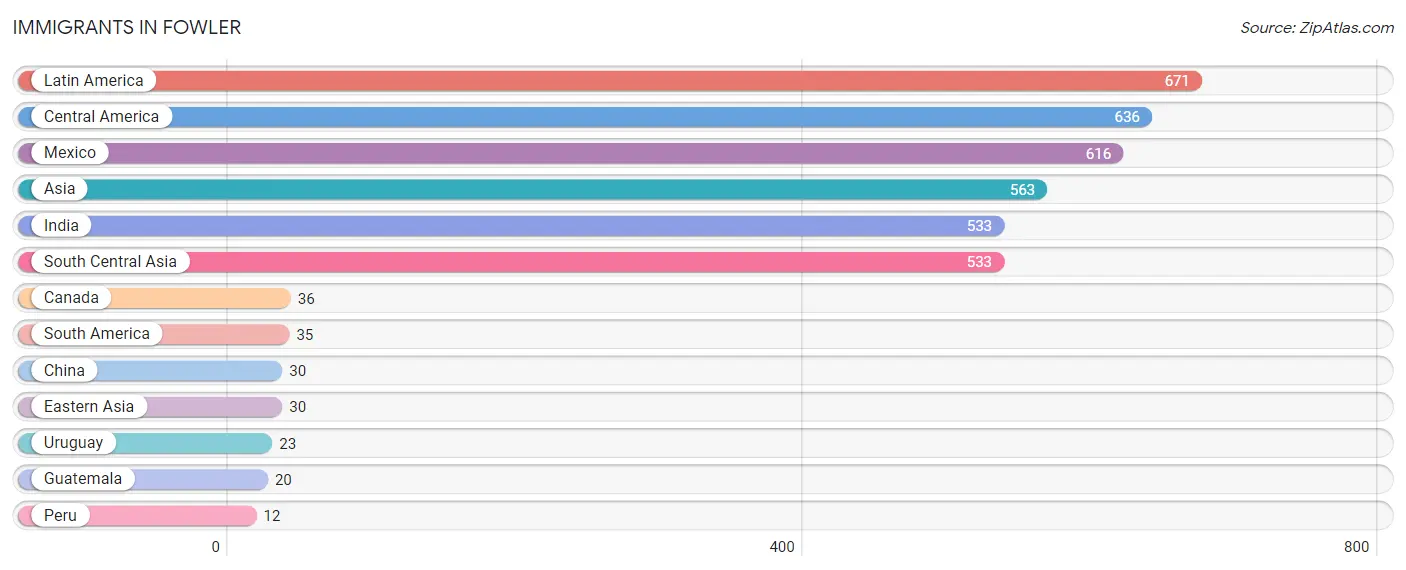
| Immigration Origin | # Population | % Population |
| Asia | 563 | 8.3% |
| Canada | 36 | 0.5% |
| Central America | 636 | 9.3% |
| China | 30 | 0.4% |
| Eastern Asia | 30 | 0.4% |
| Guatemala | 20 | 0.3% |
| India | 533 | 7.8% |
| Latin America | 671 | 9.8% |
| Mexico | 616 | 9.0% |
| Peru | 12 | 0.2% |
| South America | 35 | 0.5% |
| South Central Asia | 533 | 7.8% |
| Uruguay | 23 | 0.3% | View All 13 Rows |
Sex and Age in Fowler
Sex and Age in Fowler
The most populous age groups in Fowler are 5 to 9 Years (372 | 11.7%) for men and 10 to 14 Years (410 | 11.2%) for women.
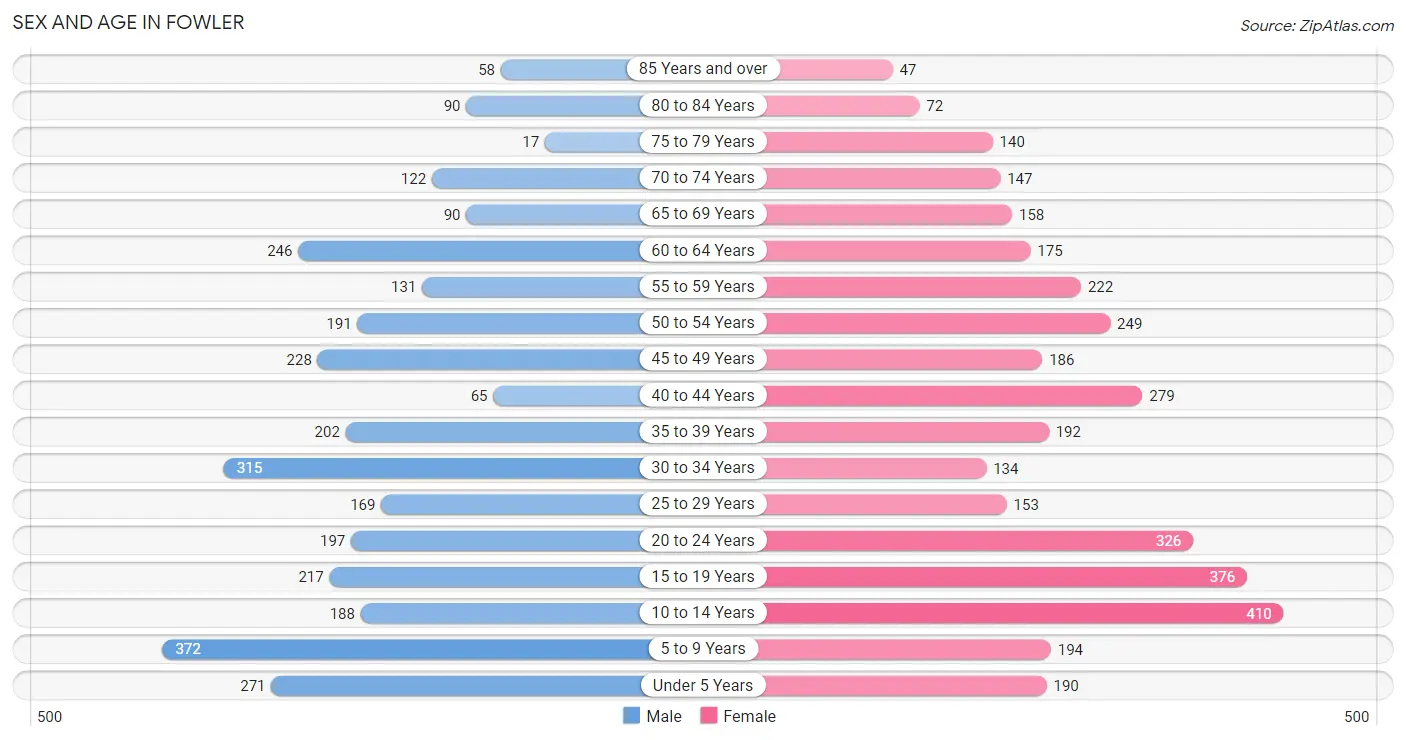
| Age Bracket | Male | Female |
| Under 5 Years | 271 (8.6%) | 190 (5.2%) |
| 5 to 9 Years | 372 (11.7%) | 194 (5.3%) |
| 10 to 14 Years | 188 (5.9%) | 410 (11.2%) |
| 15 to 19 Years | 217 (6.9%) | 376 (10.3%) |
| 20 to 24 Years | 197 (6.2%) | 326 (8.9%) |
| 25 to 29 Years | 169 (5.3%) | 153 (4.2%) |
| 30 to 34 Years | 315 (9.9%) | 134 (3.7%) |
| 35 to 39 Years | 202 (6.4%) | 192 (5.3%) |
| 40 to 44 Years | 65 (2.1%) | 279 (7.6%) |
| 45 to 49 Years | 228 (7.2%) | 186 (5.1%) |
| 50 to 54 Years | 191 (6.0%) | 249 (6.8%) |
| 55 to 59 Years | 131 (4.1%) | 222 (6.1%) |
| 60 to 64 Years | 246 (7.8%) | 175 (4.8%) |
| 65 to 69 Years | 90 (2.8%) | 158 (4.3%) |
| 70 to 74 Years | 122 (3.8%) | 147 (4.0%) |
| 75 to 79 Years | 17 (0.5%) | 140 (3.8%) |
| 80 to 84 Years | 90 (2.8%) | 72 (2.0%) |
| 85 Years and over | 58 (1.8%) | 47 (1.3%) |
| Total | 3,169 (100.0%) | 3,650 (100.0%) |
Families and Households in Fowler
Median Family Size in Fowler
The median family size in Fowler is 3.91 persons per family, with married-couple families (1,090 | 71.2%) accounting for the largest median family size of 4.16 persons per family. On the other hand, single male/father families (156 | 10.2%) represent the smallest median family size with 2.86 persons per family.
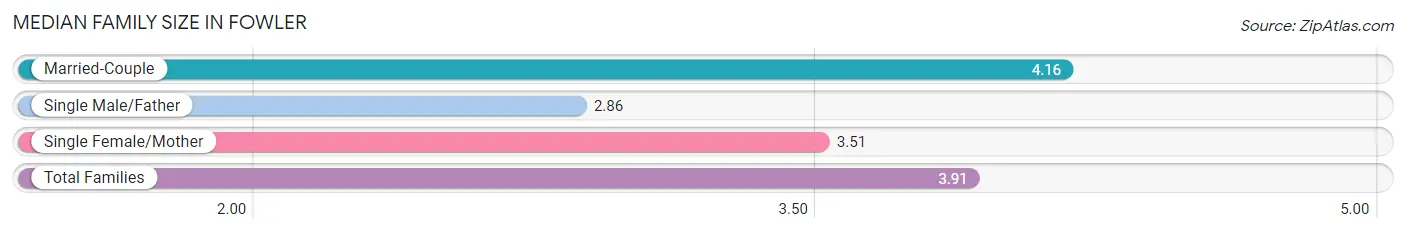
| Family Type | # Families | Family Size |
| Married-Couple | 1,090 (71.2%) | 4.16 |
| Single Male/Father | 156 (10.2%) | 2.86 |
| Single Female/Mother | 285 (18.6%) | 3.51 |
| Total Families | 1,531 (100.0%) | 3.91 |
Median Household Size in Fowler
The median household size in Fowler is 3.21 persons per household, with married-couple households (1,090 | 51.7%) accounting for the largest median household size of 4.18 persons per household. non-family households (576 | 27.3%) represent the smallest median household size with 1.04 persons per household.
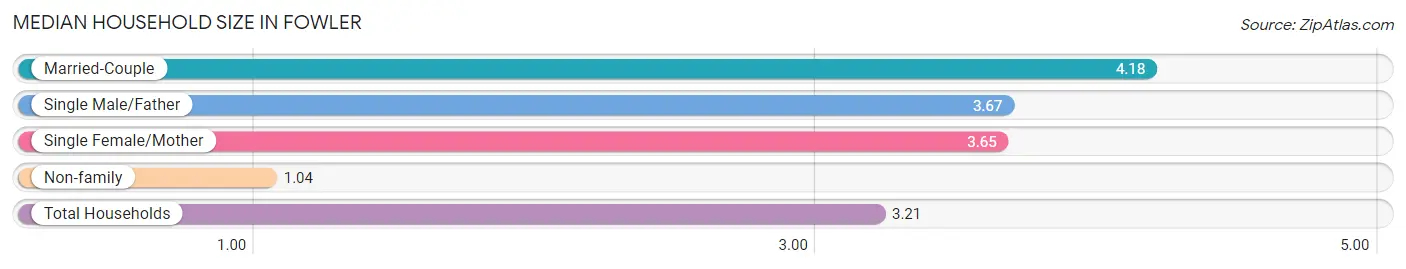
| Household Type | # Households | Household Size |
| Married-Couple | 1,090 (51.7%) | 4.18 |
| Single Male/Father | 156 (7.4%) | 3.67 |
| Single Female/Mother | 285 (13.5%) | 3.65 |
| Non-family | 576 (27.3%) | 1.04 |
| Total Households | 2,107 (100.0%) | 3.21 |
Household Size by Marriage Status in Fowler
Out of a total of 2,107 households in Fowler, 1,531 (72.7%) are family households, while 576 (27.3%) are nonfamily households. The most numerous type of family households are 4-person households, comprising 410, and the most common type of nonfamily households are 1-person households, comprising 554.
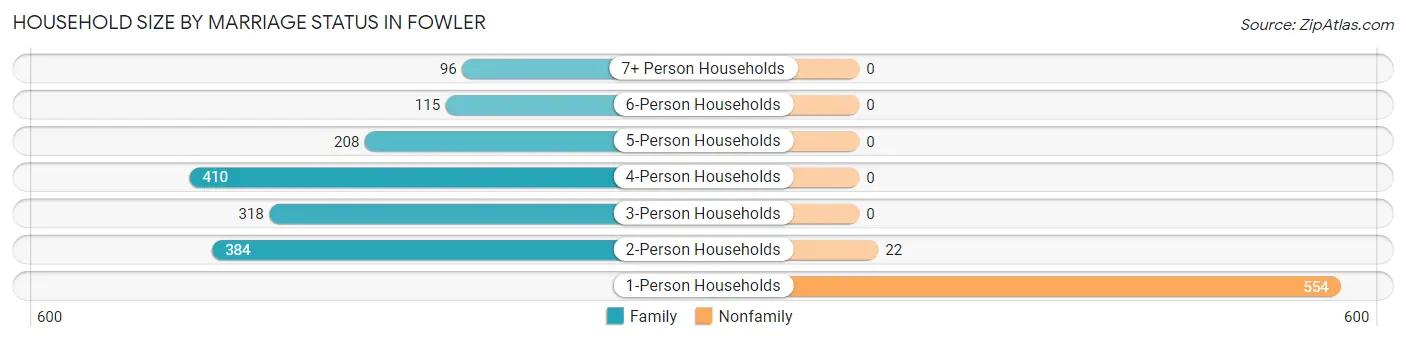
| Household Size | Family Households | Nonfamily Households |
| 1-Person Households | - | 554 (26.3%) |
| 2-Person Households | 384 (18.2%) | 22 (1.0%) |
| 3-Person Households | 318 (15.1%) | 0 (0.0%) |
| 4-Person Households | 410 (19.5%) | 0 (0.0%) |
| 5-Person Households | 208 (9.9%) | 0 (0.0%) |
| 6-Person Households | 115 (5.5%) | 0 (0.0%) |
| 7+ Person Households | 96 (4.6%) | 0 (0.0%) |
| Total | 1,531 (72.7%) | 576 (27.3%) |
Female Fertility in Fowler
Fertility by Age in Fowler
Average fertility rate in Fowler is 101.0 births per 1,000 women. Women in the age bracket of 20 to 34 years have the highest fertility rate with 160.0 births per 1,000 women. Women in the age bracket of 20 to 34 years acount for 57.7% of all women with births.
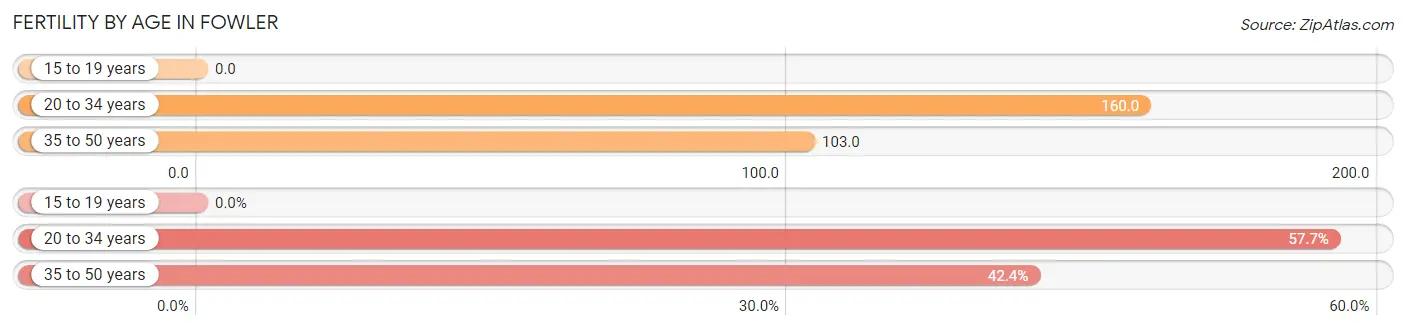
| Age Bracket | Women with Births | Births / 1,000 Women |
| 15 to 19 years | 0 (0.0%) | 0.0 |
| 20 to 34 years | 98 (57.7%) | 160.0 |
| 35 to 50 years | 72 (42.3%) | 103.0 |
| Total | 170 (100.0%) | 101.0 |
Fertility by Age by Marriage Status in Fowler
81.2% of women with births (170) in Fowler are married. The highest percentage of unmarried women with births falls into 20 to 34 years age bracket with 32.7% of them unmarried at the time of birth, while the lowest percentage of unmarried women with births belong to 35 to 50 years age bracket with 0.0% of them unmarried.
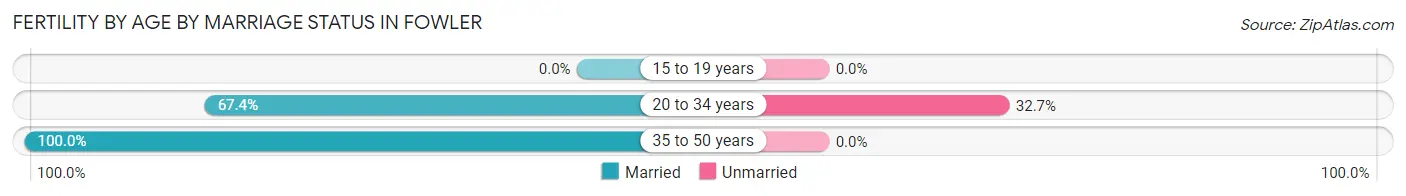
| Age Bracket | Married | Unmarried |
| 15 to 19 years | 0 (0.0%) | 0 (0.0%) |
| 20 to 34 years | 66 (67.3%) | 32 (32.7%) |
| 35 to 50 years | 72 (100.0%) | 0 (0.0%) |
| Total | 138 (81.2%) | 32 (18.8%) |
Fertility by Education in Fowler
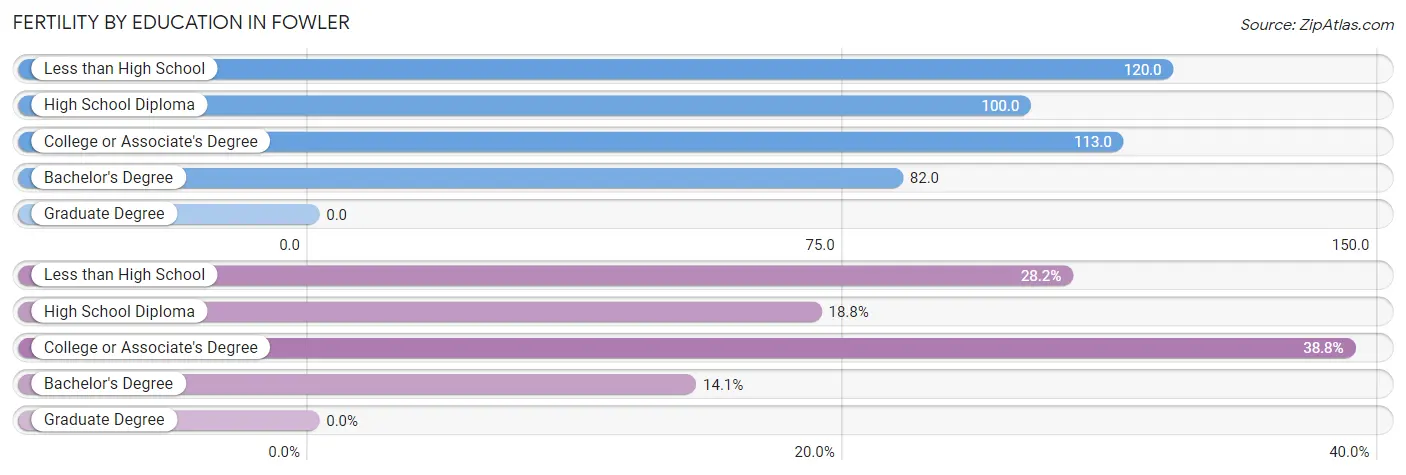
| Educational Attainment | Women with Births | Births / 1,000 Women |
| Less than High School | 48 (28.2%) | 120.0 |
| High School Diploma | 32 (18.8%) | 100.0 |
| College or Associate's Degree | 66 (38.8%) | 113.0 |
| Bachelor's Degree | 24 (14.1%) | 82.0 |
| Graduate Degree | 0 (0.0%) | 0.0 |
| Total | 170 (100.0%) | 101.0 |
Fertility by Education by Marriage Status in Fowler
18.8% of women with births in Fowler are unmarried. Women with the educational attainment of less than high school are most likely to be married with 100.0% of them married at childbirth, while women with the educational attainment of high school diploma are least likely to be married with 100.0% of them unmarried at childbirth.
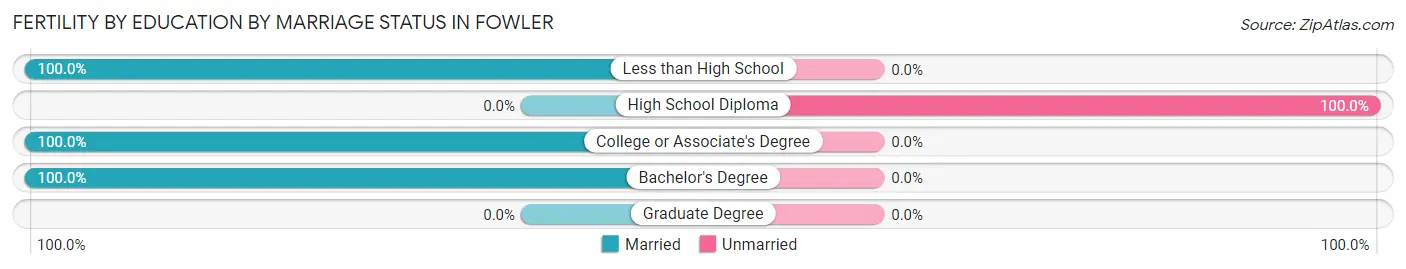
| Educational Attainment | Married | Unmarried |
| Less than High School | 48 (100.0%) | 0 (0.0%) |
| High School Diploma | 0 (0.0%) | 32 (100.0%) |
| College or Associate's Degree | 66 (100.0%) | 0 (0.0%) |
| Bachelor's Degree | 24 (100.0%) | 0 (0.0%) |
| Graduate Degree | 0 (0.0%) | 0 (0.0%) |
| Total | 138 (81.2%) | 32 (18.8%) |
Employment Characteristics in Fowler
Employment by Class of Employer in Fowler
Among the 2,528 employed individuals in Fowler, private company employees (1,642 | 64.9%), local government employees (407 | 16.1%), and not-for-profit organizations (133 | 5.3%) make up the most common classes of employment.
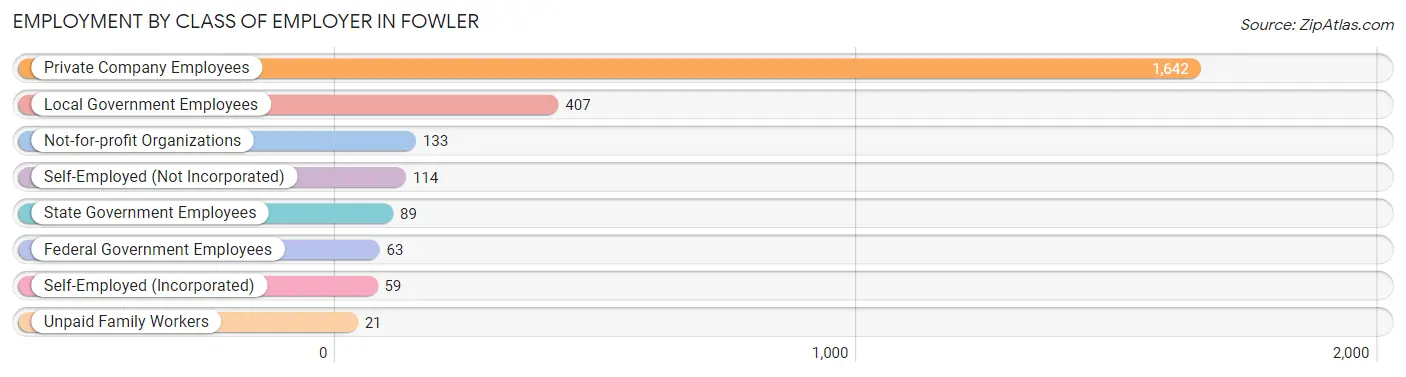
| Employer Class | # Employees | % Employees |
| Private Company Employees | 1,642 | 64.9% |
| Self-Employed (Incorporated) | 59 | 2.3% |
| Self-Employed (Not Incorporated) | 114 | 4.5% |
| Not-for-profit Organizations | 133 | 5.3% |
| Local Government Employees | 407 | 16.1% |
| State Government Employees | 89 | 3.5% |
| Federal Government Employees | 63 | 2.5% |
| Unpaid Family Workers | 21 | 0.8% |
| Total | 2,528 | 100.0% |
Employment Status by Age in Fowler
According to the labor force statistics for Fowler, out of the total population over 16 years of age (5,025), 55.6% or 2,794 individuals are in the labor force, with 8.5% or 237 of them unemployed. The age group with the highest labor force participation rate is 25 to 29 years, with 84.2% or 271 individuals in the labor force. Within the labor force, the 25 to 29 years age range has the highest percentage of unemployed individuals, with 16.2% or 44 of them being unemployed.
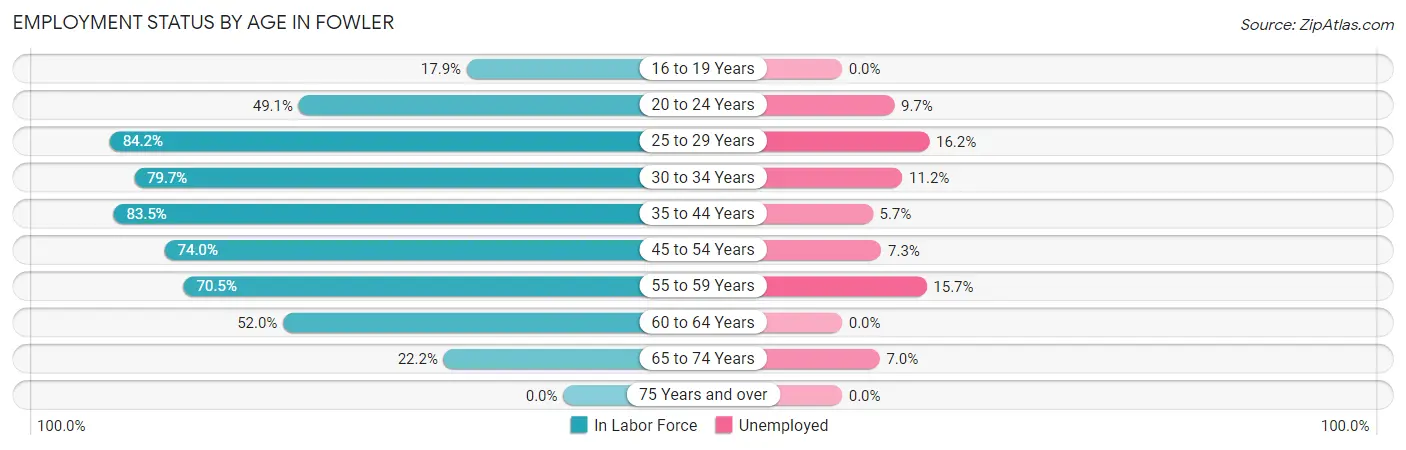
| Age Bracket | In Labor Force | Unemployed |
| 16 to 19 Years | 76 (17.9%) | 0 (0.0%) |
| 20 to 24 Years | 257 (49.1%) | 25 (9.7%) |
| 25 to 29 Years | 271 (84.2%) | 44 (16.2%) |
| 30 to 34 Years | 358 (79.7%) | 40 (11.2%) |
| 35 to 44 Years | 616 (83.5%) | 35 (5.7%) |
| 45 to 54 Years | 632 (74.0%) | 46 (7.3%) |
| 55 to 59 Years | 249 (70.5%) | 39 (15.7%) |
| 60 to 64 Years | 219 (52.0%) | 0 (0.0%) |
| 65 to 74 Years | 115 (22.2%) | 8 (7.0%) |
| 75 Years and over | 0 (0.0%) | 0 (0.0%) |
| Total | 2,794 (55.6%) | 237 (8.5%) |
Employment Status by Educational Attainment in Fowler
According to labor force statistics for Fowler, 74.8% of individuals (2,346) out of the total population between 25 and 64 years of age (3,137) are in the labor force, with 8.7% or 204 of them being unemployed. The group with the highest labor force participation rate are those with the educational attainment of bachelor's degree or higher, with 86.2% or 806 individuals in the labor force. Within the labor force, individuals with high school diploma education have the highest percentage of unemployment, with 18.3% or 66 of them being unemployed.
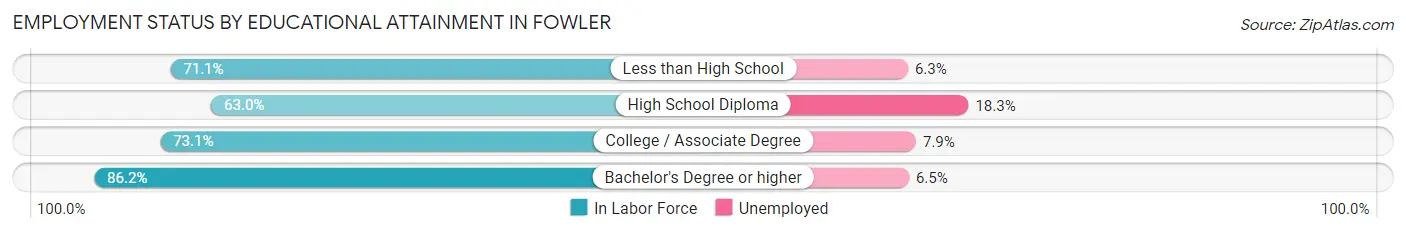
| Educational Attainment | In Labor Force | Unemployed |
| Less than High School | 460 (71.1%) | 41 (6.3%) |
| High School Diploma | 360 (63.0%) | 104 (18.3%) |
| College / Associate Degree | 719 (73.1%) | 78 (7.9%) |
| Bachelor's Degree or higher | 806 (86.2%) | 61 (6.5%) |
| Total | 2,346 (74.8%) | 273 (8.7%) |
Employment Occupations by Sex in Fowler
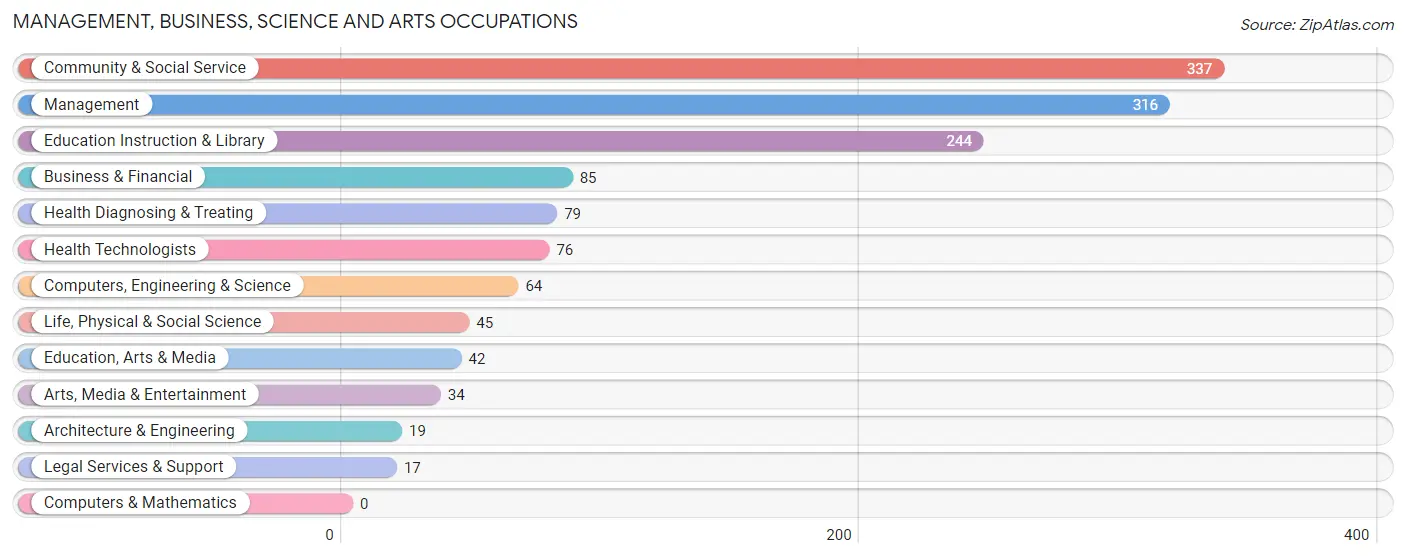
Management, Business, Science and Arts Occupations
The most common Management, Business, Science and Arts occupations in Fowler are Community & Social Service (337 | 13.2%), Management (316 | 12.4%), Education Instruction & Library (244 | 9.6%), Business & Financial (85 | 3.3%), and Health Diagnosing & Treating (79 | 3.1%).
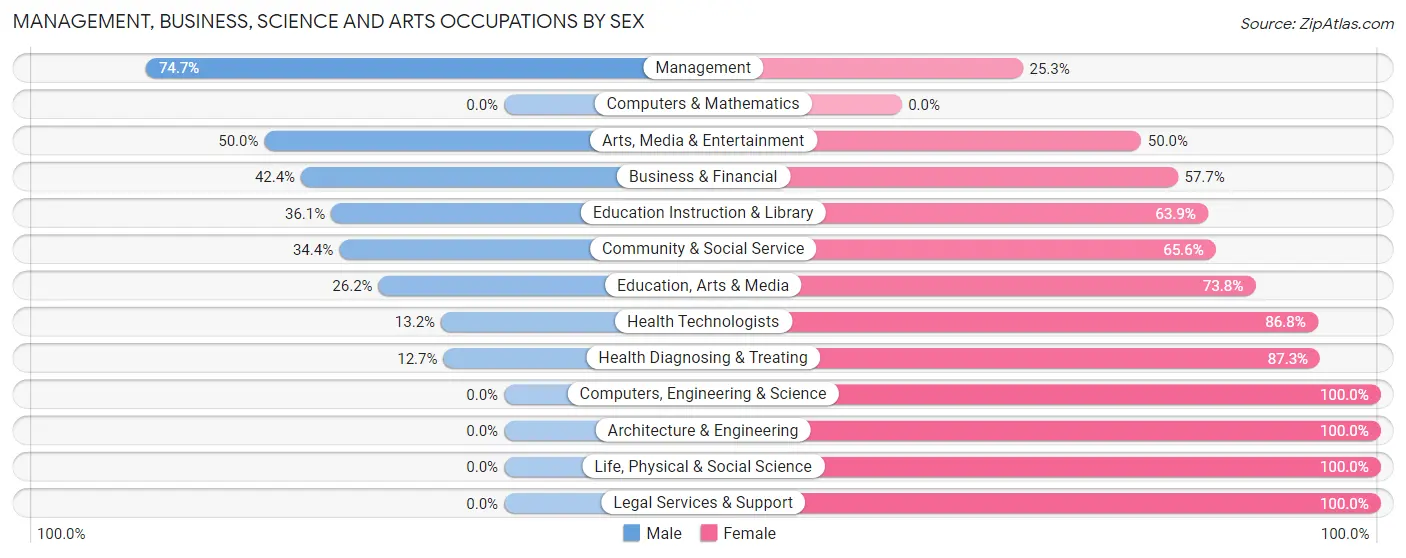
Management, Business, Science and Arts Occupations by Sex
Within the Management, Business, Science and Arts occupations in Fowler, the most male-oriented occupations are Management (74.7%), Arts, Media & Entertainment (50.0%), and Business & Financial (42.3%), while the most female-oriented occupations are Computers, Engineering & Science (100.0%), Architecture & Engineering (100.0%), and Life, Physical & Social Science (100.0%).
| Occupation | Male | Female |
| Management | 236 (74.7%) | 80 (25.3%) |
| Business & Financial | 36 (42.3%) | 49 (57.7%) |
| Computers, Engineering & Science | 0 (0.0%) | 64 (100.0%) |
| Computers & Mathematics | 0 (0.0%) | 0 (0.0%) |
| Architecture & Engineering | 0 (0.0%) | 19 (100.0%) |
| Life, Physical & Social Science | 0 (0.0%) | 45 (100.0%) |
| Community & Social Service | 116 (34.4%) | 221 (65.6%) |
| Education, Arts & Media | 11 (26.2%) | 31 (73.8%) |
| Legal Services & Support | 0 (0.0%) | 17 (100.0%) |
| Education Instruction & Library | 88 (36.1%) | 156 (63.9%) |
| Arts, Media & Entertainment | 17 (50.0%) | 17 (50.0%) |
| Health Diagnosing & Treating | 10 (12.7%) | 69 (87.3%) |
| Health Technologists | 10 (13.2%) | 66 (86.8%) |
| Total (Category) | 398 (45.2%) | 483 (54.8%) |
| Total (Overall) | 1,380 (54.0%) | 1,176 (46.0%) |
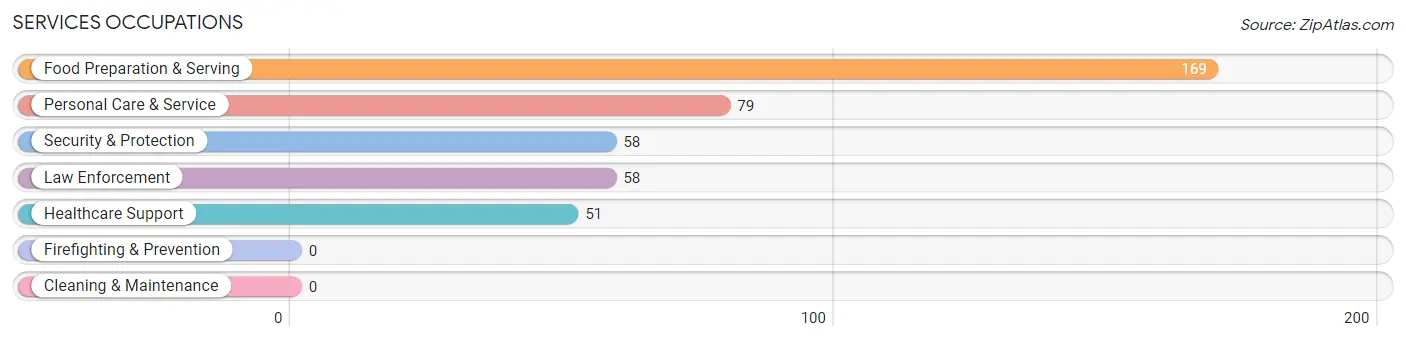
Services Occupations
The most common Services occupations in Fowler are Food Preparation & Serving (169 | 6.6%), Personal Care & Service (79 | 3.1%), Security & Protection (58 | 2.3%), Law Enforcement (58 | 2.3%), and Healthcare Support (51 | 2.0%).
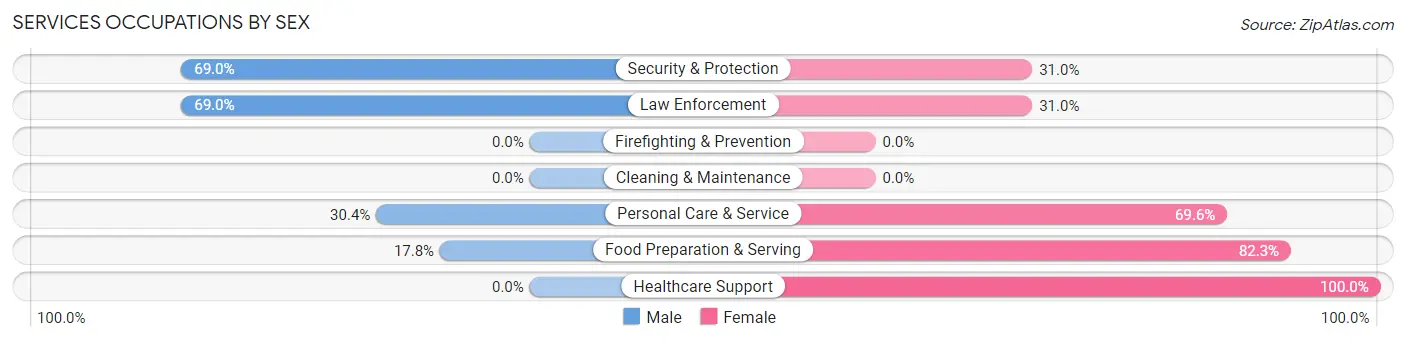
Services Occupations by Sex
Within the Services occupations in Fowler, the most male-oriented occupations are Security & Protection (69.0%), Law Enforcement (69.0%), and Personal Care & Service (30.4%), while the most female-oriented occupations are Healthcare Support (100.0%), Food Preparation & Serving (82.3%), and Personal Care & Service (69.6%).
| Occupation | Male | Female |
| Healthcare Support | 0 (0.0%) | 51 (100.0%) |
| Security & Protection | 40 (69.0%) | 18 (31.0%) |
| Firefighting & Prevention | 0 (0.0%) | 0 (0.0%) |
| Law Enforcement | 40 (69.0%) | 18 (31.0%) |
| Food Preparation & Serving | 30 (17.7%) | 139 (82.3%) |
| Cleaning & Maintenance | 0 (0.0%) | 0 (0.0%) |
| Personal Care & Service | 24 (30.4%) | 55 (69.6%) |
| Total (Category) | 94 (26.3%) | 263 (73.7%) |
| Total (Overall) | 1,380 (54.0%) | 1,176 (46.0%) |
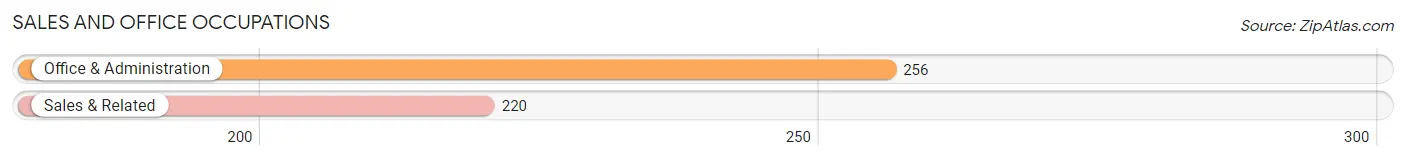
Sales and Office Occupations
The most common Sales and Office occupations in Fowler are Office & Administration (256 | 10.0%), and Sales & Related (220 | 8.6%).
Sales and Office Occupations by Sex
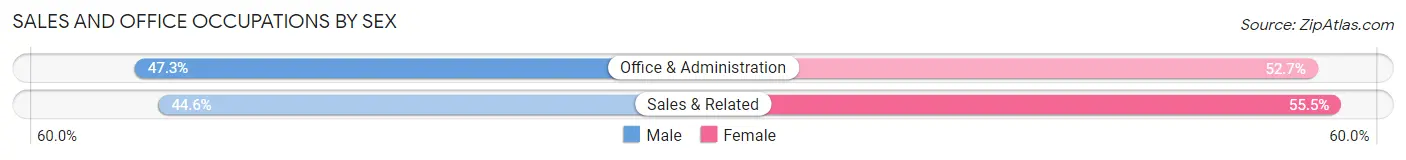
| Occupation | Male | Female |
| Sales & Related | 98 (44.6%) | 122 (55.4%) |
| Office & Administration | 121 (47.3%) | 135 (52.7%) |
| Total (Category) | 219 (46.0%) | 257 (54.0%) |
| Total (Overall) | 1,380 (54.0%) | 1,176 (46.0%) |
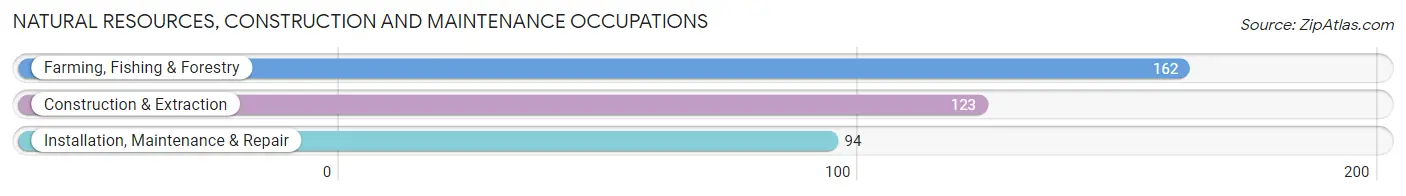
Natural Resources, Construction and Maintenance Occupations
The most common Natural Resources, Construction and Maintenance occupations in Fowler are Farming, Fishing & Forestry (162 | 6.3%), Construction & Extraction (123 | 4.8%), and Installation, Maintenance & Repair (94 | 3.7%).
Natural Resources, Construction and Maintenance Occupations by Sex
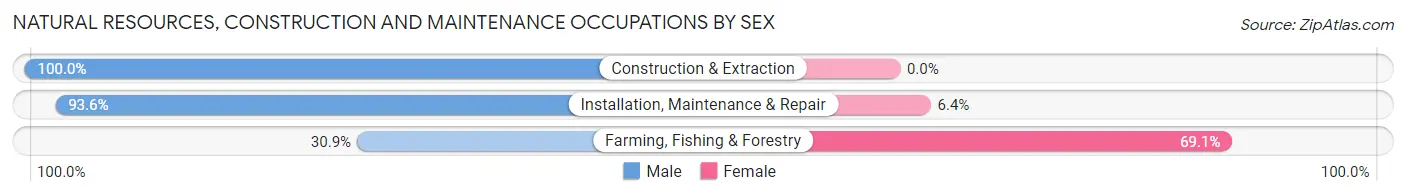
| Occupation | Male | Female |
| Farming, Fishing & Forestry | 50 (30.9%) | 112 (69.1%) |
| Construction & Extraction | 123 (100.0%) | 0 (0.0%) |
| Installation, Maintenance & Repair | 88 (93.6%) | 6 (6.4%) |
| Total (Category) | 261 (68.9%) | 118 (31.1%) |
| Total (Overall) | 1,380 (54.0%) | 1,176 (46.0%) |
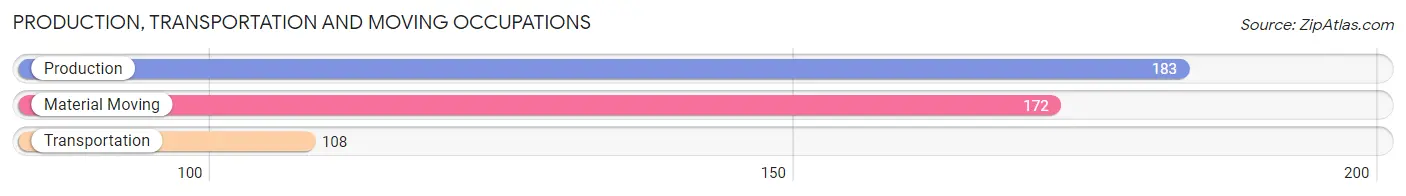
Production, Transportation and Moving Occupations
The most common Production, Transportation and Moving occupations in Fowler are Production (183 | 7.2%), Material Moving (172 | 6.7%), and Transportation (108 | 4.2%).
Production, Transportation and Moving Occupations by Sex
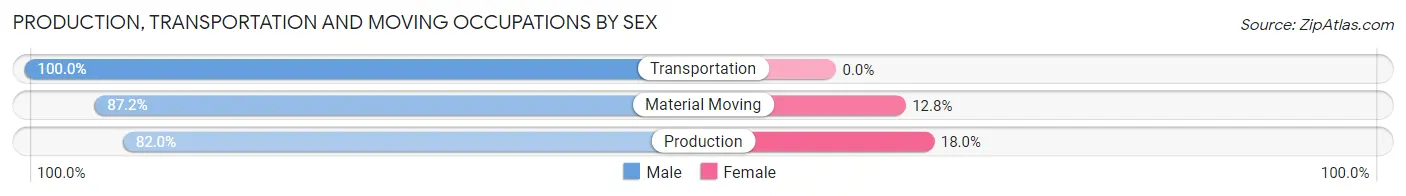
| Occupation | Male | Female |
| Production | 150 (82.0%) | 33 (18.0%) |
| Transportation | 108 (100.0%) | 0 (0.0%) |
| Material Moving | 150 (87.2%) | 22 (12.8%) |
| Total (Category) | 408 (88.1%) | 55 (11.9%) |
| Total (Overall) | 1,380 (54.0%) | 1,176 (46.0%) |
Employment Industries by Sex in Fowler
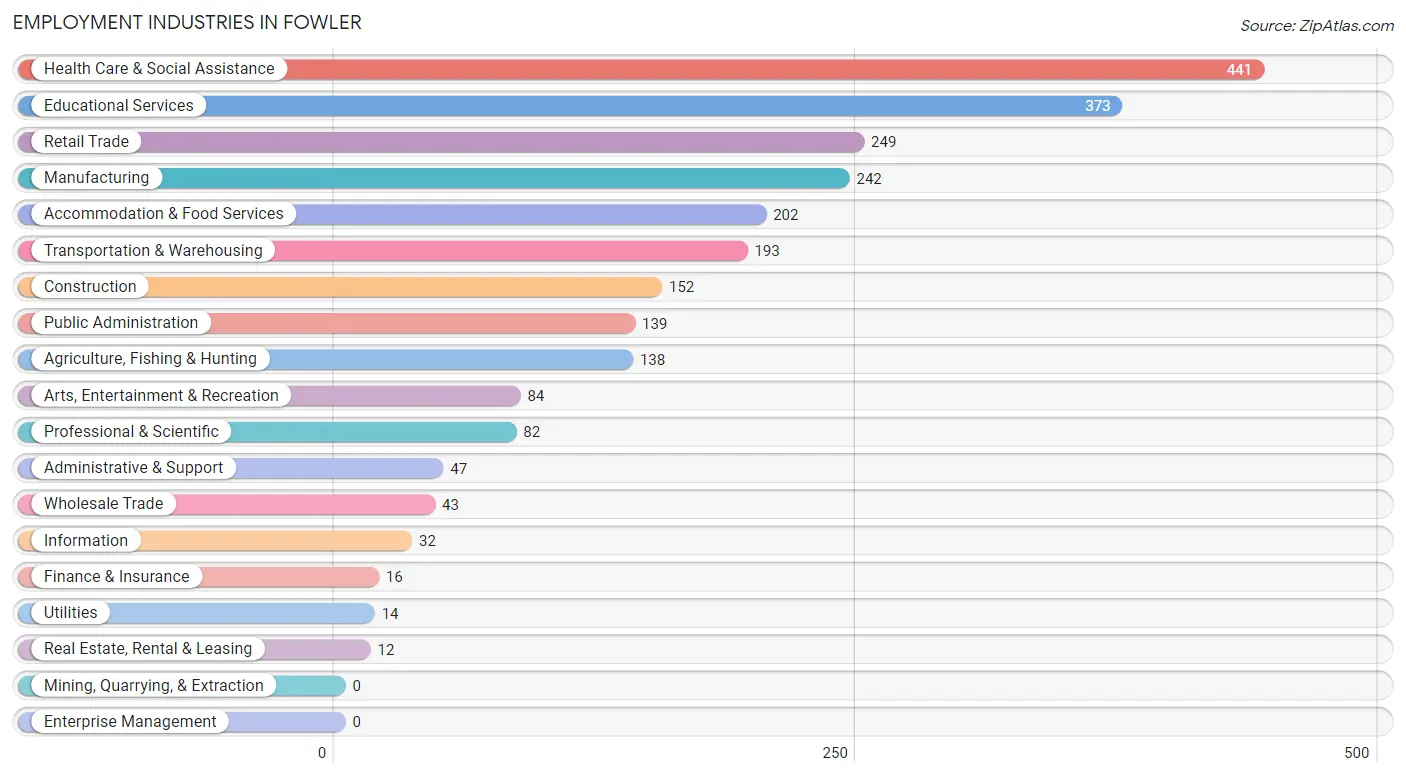
Employment Industries in Fowler
The major employment industries in Fowler include Health Care & Social Assistance (441 | 17.2%), Educational Services (373 | 14.6%), Retail Trade (249 | 9.7%), Manufacturing (242 | 9.5%), and Accommodation & Food Services (202 | 7.9%).
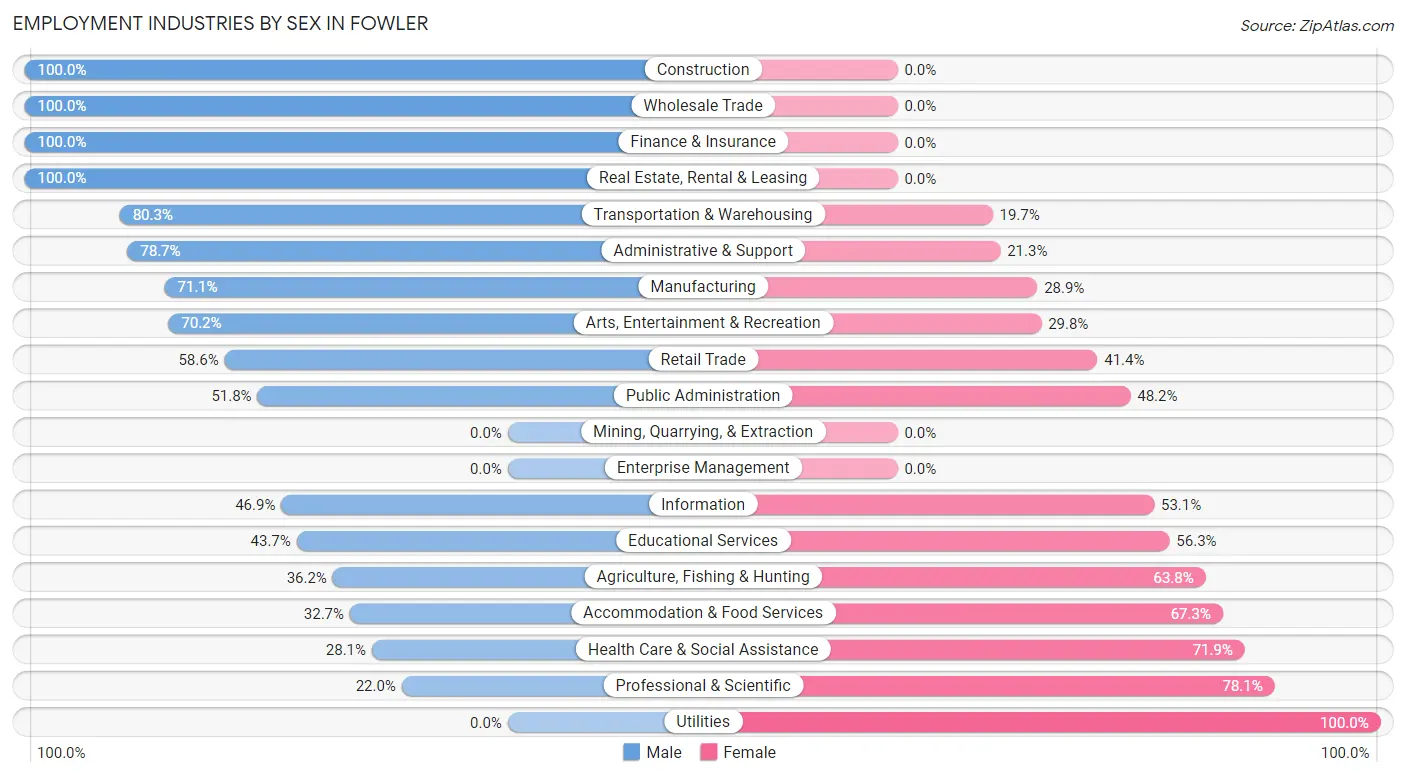
Employment Industries by Sex in Fowler
The Fowler industries that see more men than women are Construction (100.0%), Wholesale Trade (100.0%), and Finance & Insurance (100.0%), whereas the industries that tend to have a higher number of women are Utilities (100.0%), Professional & Scientific (78.0%), and Health Care & Social Assistance (71.9%).
| Industry | Male | Female |
| Agriculture, Fishing & Hunting | 50 (36.2%) | 88 (63.8%) |
| Mining, Quarrying, & Extraction | 0 (0.0%) | 0 (0.0%) |
| Construction | 152 (100.0%) | 0 (0.0%) |
| Manufacturing | 172 (71.1%) | 70 (28.9%) |
| Wholesale Trade | 43 (100.0%) | 0 (0.0%) |
| Retail Trade | 146 (58.6%) | 103 (41.4%) |
| Transportation & Warehousing | 155 (80.3%) | 38 (19.7%) |
| Utilities | 0 (0.0%) | 14 (100.0%) |
| Information | 15 (46.9%) | 17 (53.1%) |
| Finance & Insurance | 16 (100.0%) | 0 (0.0%) |
| Real Estate, Rental & Leasing | 12 (100.0%) | 0 (0.0%) |
| Professional & Scientific | 18 (22.0%) | 64 (78.0%) |
| Enterprise Management | 0 (0.0%) | 0 (0.0%) |
| Administrative & Support | 37 (78.7%) | 10 (21.3%) |
| Educational Services | 163 (43.7%) | 210 (56.3%) |
| Health Care & Social Assistance | 124 (28.1%) | 317 (71.9%) |
| Arts, Entertainment & Recreation | 59 (70.2%) | 25 (29.8%) |
| Accommodation & Food Services | 66 (32.7%) | 136 (67.3%) |
| Public Administration | 72 (51.8%) | 67 (48.2%) |
| Total | 1,380 (54.0%) | 1,176 (46.0%) |
Education in Fowler
School Enrollment in Fowler
The most common levels of schooling among the 2,141 students in Fowler are middle school (523 | 24.4%), high school (448 | 20.9%), and elementary school (425 | 19.9%).
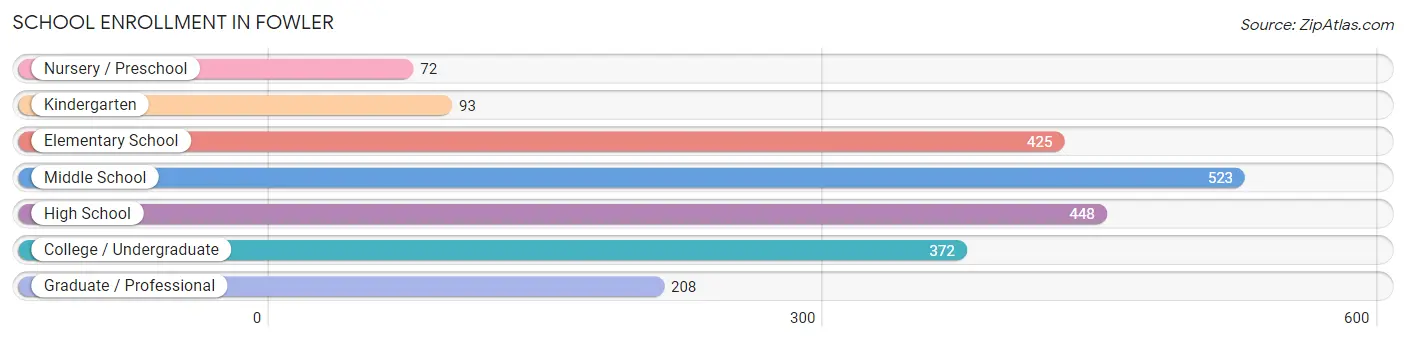
| School Level | # Students | % Students |
| Nursery / Preschool | 72 | 3.4% |
| Kindergarten | 93 | 4.3% |
| Elementary School | 425 | 19.9% |
| Middle School | 523 | 24.4% |
| High School | 448 | 20.9% |
| College / Undergraduate | 372 | 17.4% |
| Graduate / Professional | 208 | 9.7% |
| Total | 2,141 | 100.0% |
School Enrollment by Age by Funding Source in Fowler
Out of a total of 2,141 students who are enrolled in schools in Fowler, 240 (11.2%) attend a private institution, while the remaining 1,901 (88.8%) are enrolled in public schools. The age group of 25 to 34 year olds has the highest likelihood of being enrolled in private schools, with 67 (51.5% in the age bracket) enrolled. Conversely, the age group of 5 to 9 year old has the lowest likelihood of being enrolled in a private school, with 561 (99.1% in the age bracket) attending a public institution.
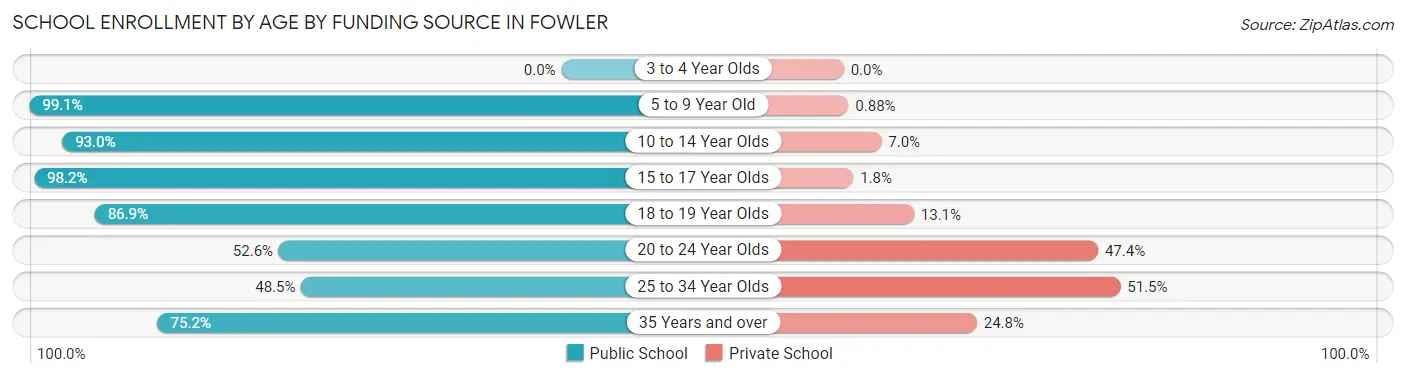
| Age Bracket | Public School | Private School |
| 3 to 4 Year Olds | 0 (0.0%) | 0 (0.0%) |
| 5 to 9 Year Old | 561 (99.1%) | 5 (0.9%) |
| 10 to 14 Year Olds | 556 (93.0%) | 42 (7.0%) |
| 15 to 17 Year Olds | 387 (98.2%) | 7 (1.8%) |
| 18 to 19 Year Olds | 173 (86.9%) | 26 (13.1%) |
| 20 to 24 Year Olds | 70 (52.6%) | 63 (47.4%) |
| 25 to 34 Year Olds | 63 (48.5%) | 67 (51.5%) |
| 35 Years and over | 91 (75.2%) | 30 (24.8%) |
| Total | 1,901 (88.8%) | 240 (11.2%) |
Educational Attainment by Field of Study in Fowler
Science & technology (189 | 16.0%), bio, nature & agricultural (157 | 13.3%), business (139 | 11.7%), liberal arts & history (116 | 9.8%), and engineering (110 | 9.3%) are the most common fields of study among 1,184 individuals in Fowler who have obtained a bachelor's degree or higher.
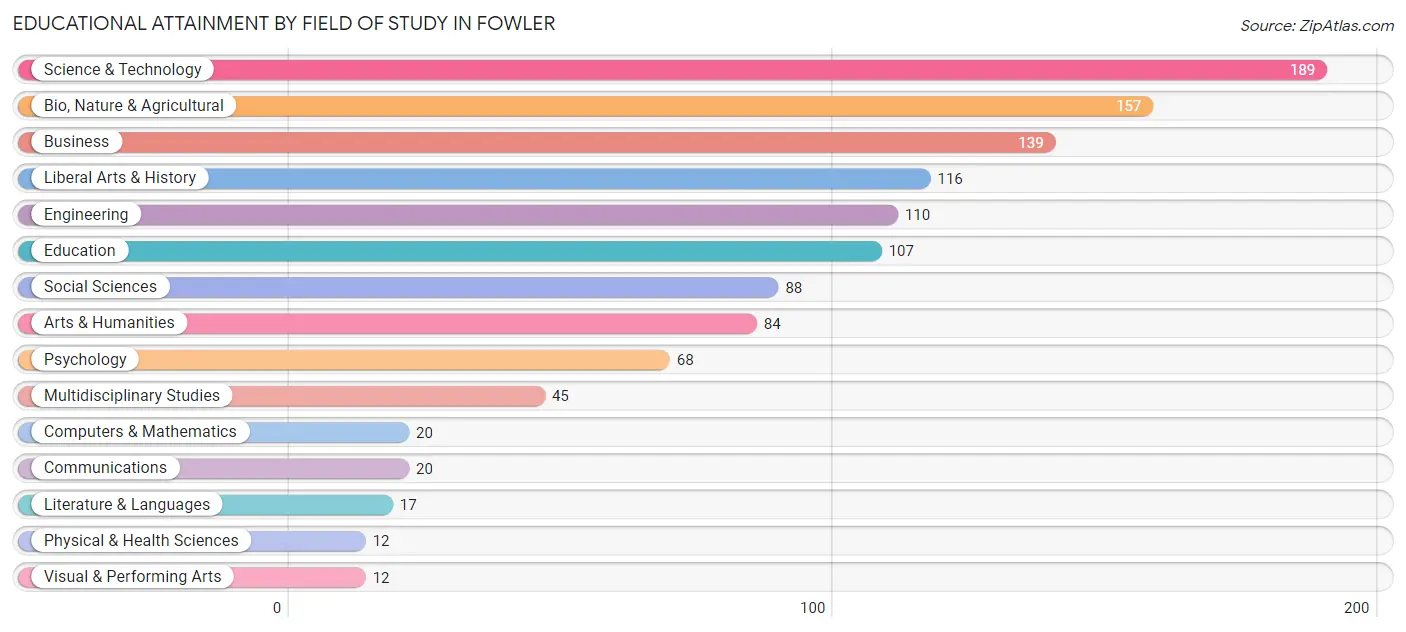
| Field of Study | # Graduates | % Graduates |
| Computers & Mathematics | 20 | 1.7% |
| Bio, Nature & Agricultural | 157 | 13.3% |
| Physical & Health Sciences | 12 | 1.0% |
| Psychology | 68 | 5.7% |
| Social Sciences | 88 | 7.4% |
| Engineering | 110 | 9.3% |
| Multidisciplinary Studies | 45 | 3.8% |
| Science & Technology | 189 | 16.0% |
| Business | 139 | 11.7% |
| Education | 107 | 9.0% |
| Literature & Languages | 17 | 1.4% |
| Liberal Arts & History | 116 | 9.8% |
| Visual & Performing Arts | 12 | 1.0% |
| Communications | 20 | 1.7% |
| Arts & Humanities | 84 | 7.1% |
| Total | 1,184 | 100.0% |
Transportation & Commute in Fowler
Vehicle Availability by Sex in Fowler
The most prevalent vehicle ownership categories in Fowler are males with 2 vehicles (467, accounting for 33.8%) and females with 2 vehicles (415, making up 40.7%).
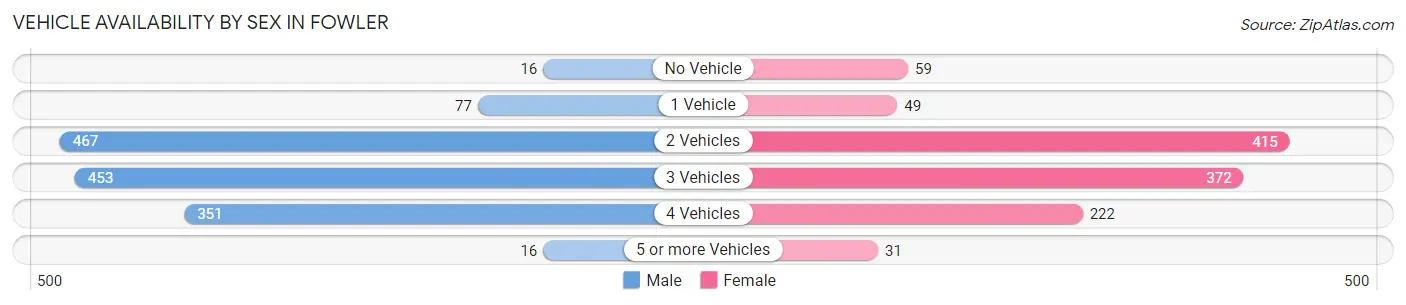
| Vehicles Available | Male | Female |
| No Vehicle | 16 (1.2%) | 59 (5.1%) |
| 1 Vehicle | 77 (5.6%) | 49 (4.3%) |
| 2 Vehicles | 467 (33.8%) | 415 (36.1%) |
| 3 Vehicles | 453 (32.8%) | 372 (32.4%) |
| 4 Vehicles | 351 (25.4%) | 222 (19.3%) |
| 5 or more Vehicles | 16 (1.2%) | 31 (2.7%) |
| Total | 1,380 (100.0%) | 1,148 (100.0%) |
Commute Time in Fowler
The most frequently occuring commute durations in Fowler are 20 to 24 minutes (584 commuters, 24.3%), 10 to 14 minutes (471 commuters, 19.6%), and 30 to 34 minutes (372 commuters, 15.5%).
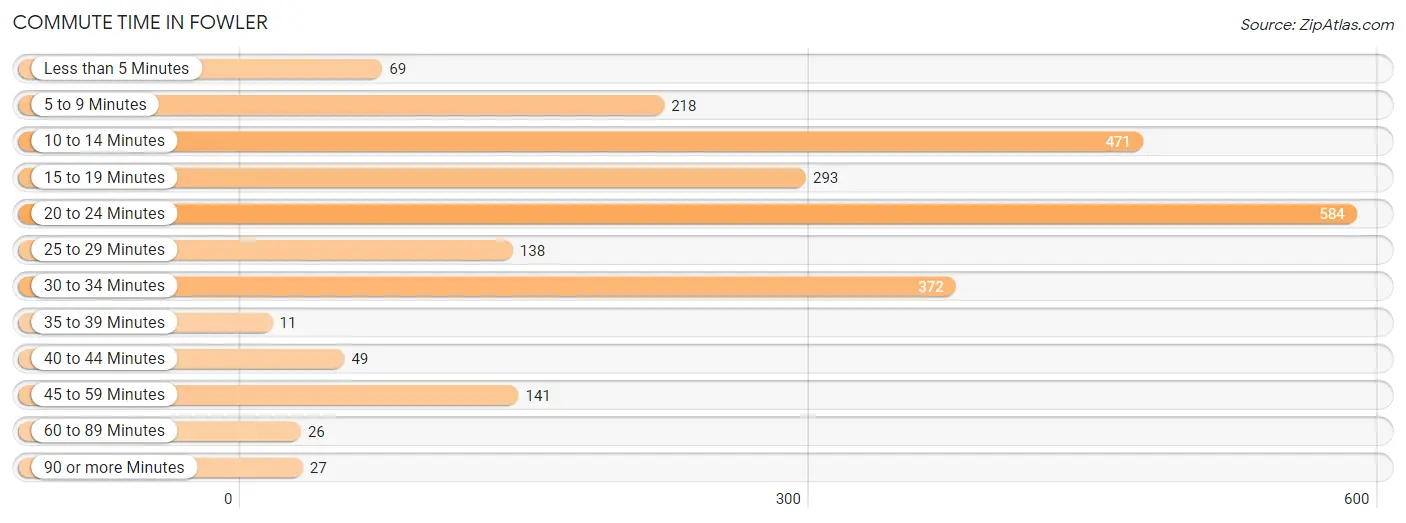
| Commute Time | # Commuters | % Commuters |
| Less than 5 Minutes | 69 | 2.9% |
| 5 to 9 Minutes | 218 | 9.1% |
| 10 to 14 Minutes | 471 | 19.6% |
| 15 to 19 Minutes | 293 | 12.2% |
| 20 to 24 Minutes | 584 | 24.3% |
| 25 to 29 Minutes | 138 | 5.8% |
| 30 to 34 Minutes | 372 | 15.5% |
| 35 to 39 Minutes | 11 | 0.5% |
| 40 to 44 Minutes | 49 | 2.0% |
| 45 to 59 Minutes | 141 | 5.9% |
| 60 to 89 Minutes | 26 | 1.1% |
| 90 or more Minutes | 27 | 1.1% |
Commute Time by Sex in Fowler
The most common commute times in Fowler are 10 to 14 minutes (307 commuters, 23.7%) for males and 20 to 24 minutes (288 commuters, 26.1%) for females.
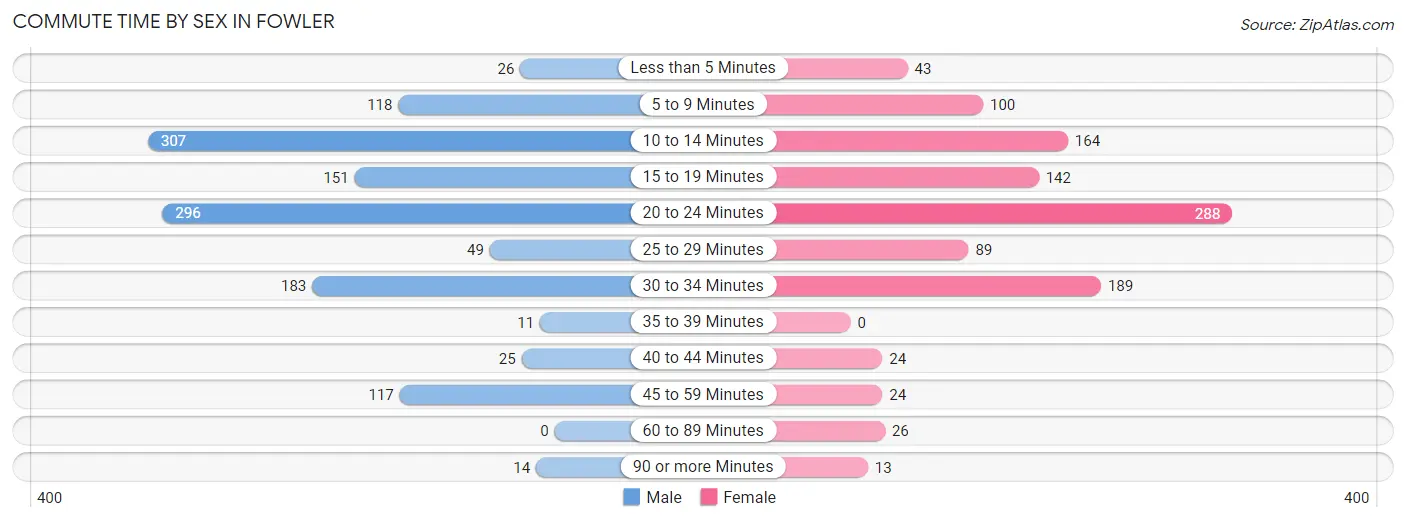
| Commute Time | Male | Female |
| Less than 5 Minutes | 26 (2.0%) | 43 (3.9%) |
| 5 to 9 Minutes | 118 (9.1%) | 100 (9.1%) |
| 10 to 14 Minutes | 307 (23.7%) | 164 (14.9%) |
| 15 to 19 Minutes | 151 (11.6%) | 142 (12.9%) |
| 20 to 24 Minutes | 296 (22.8%) | 288 (26.1%) |
| 25 to 29 Minutes | 49 (3.8%) | 89 (8.1%) |
| 30 to 34 Minutes | 183 (14.1%) | 189 (17.2%) |
| 35 to 39 Minutes | 11 (0.9%) | 0 (0.0%) |
| 40 to 44 Minutes | 25 (1.9%) | 24 (2.2%) |
| 45 to 59 Minutes | 117 (9.0%) | 24 (2.2%) |
| 60 to 89 Minutes | 0 (0.0%) | 26 (2.4%) |
| 90 or more Minutes | 14 (1.1%) | 13 (1.2%) |
Time of Departure to Work by Sex in Fowler
The most frequent times of departure to work in Fowler are 7:00 AM to 7:29 AM (302, 23.3%) for males and 7:00 AM to 7:29 AM (175, 15.9%) for females.
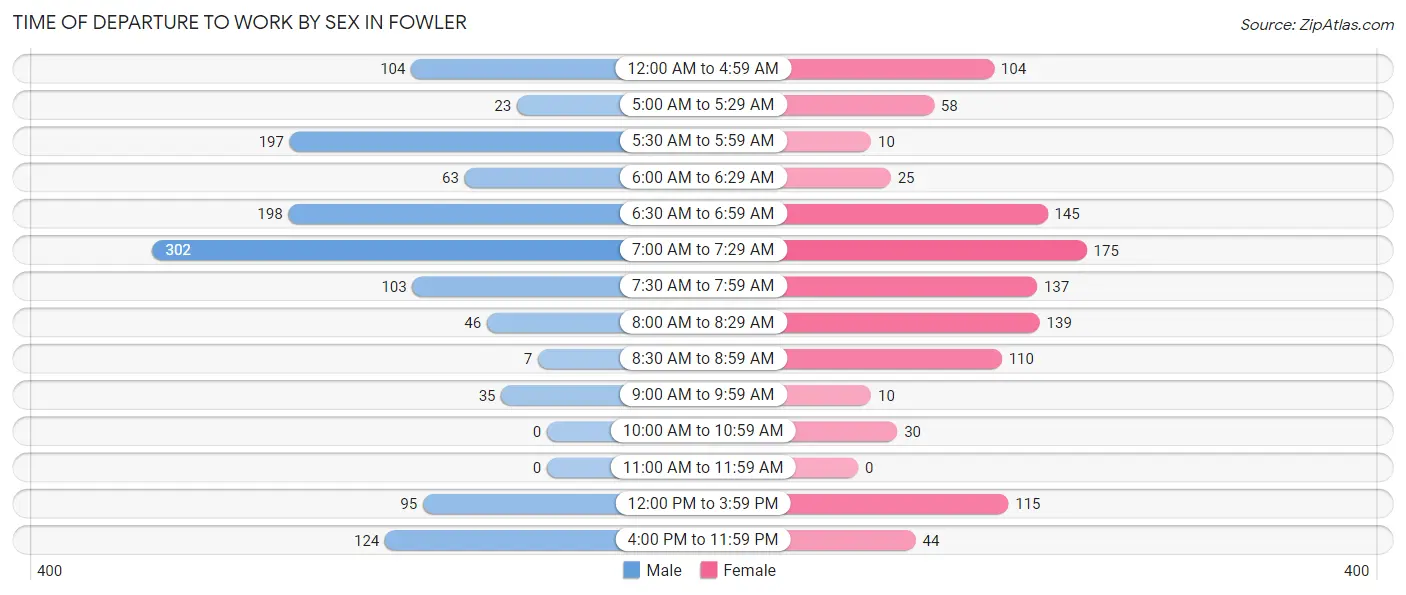
| Time of Departure | Male | Female |
| 12:00 AM to 4:59 AM | 104 (8.0%) | 104 (9.4%) |
| 5:00 AM to 5:29 AM | 23 (1.8%) | 58 (5.3%) |
| 5:30 AM to 5:59 AM | 197 (15.2%) | 10 (0.9%) |
| 6:00 AM to 6:29 AM | 63 (4.9%) | 25 (2.3%) |
| 6:30 AM to 6:59 AM | 198 (15.3%) | 145 (13.2%) |
| 7:00 AM to 7:29 AM | 302 (23.3%) | 175 (15.9%) |
| 7:30 AM to 7:59 AM | 103 (7.9%) | 137 (12.4%) |
| 8:00 AM to 8:29 AM | 46 (3.5%) | 139 (12.6%) |
| 8:30 AM to 8:59 AM | 7 (0.5%) | 110 (10.0%) |
| 9:00 AM to 9:59 AM | 35 (2.7%) | 10 (0.9%) |
| 10:00 AM to 10:59 AM | 0 (0.0%) | 30 (2.7%) |
| 11:00 AM to 11:59 AM | 0 (0.0%) | 0 (0.0%) |
| 12:00 PM to 3:59 PM | 95 (7.3%) | 115 (10.4%) |
| 4:00 PM to 11:59 PM | 124 (9.6%) | 44 (4.0%) |
| Total | 1,297 (100.0%) | 1,102 (100.0%) |
Housing Occupancy in Fowler
Occupancy by Ownership in Fowler
Of the total 2,107 dwellings in Fowler, owner-occupied units account for 1,190 (56.5%), while renter-occupied units make up 917 (43.5%).
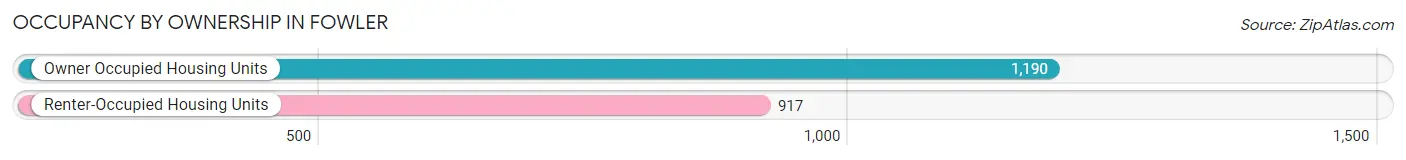
| Occupancy | # Housing Units | % Housing Units |
| Owner Occupied Housing Units | 1,190 | 56.5% |
| Renter-Occupied Housing Units | 917 | 43.5% |
| Total Occupied Housing Units | 2,107 | 100.0% |
Occupancy by Household Size in Fowler
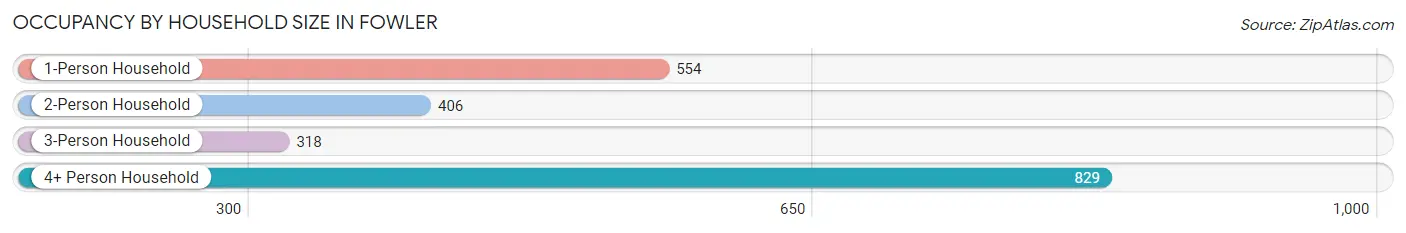
| Household Size | # Housing Units | % Housing Units |
| 1-Person Household | 554 | 26.3% |
| 2-Person Household | 406 | 19.3% |
| 3-Person Household | 318 | 15.1% |
| 4+ Person Household | 829 | 39.4% |
| Total Housing Units | 2,107 | 100.0% |
Occupancy by Ownership by Household Size in Fowler
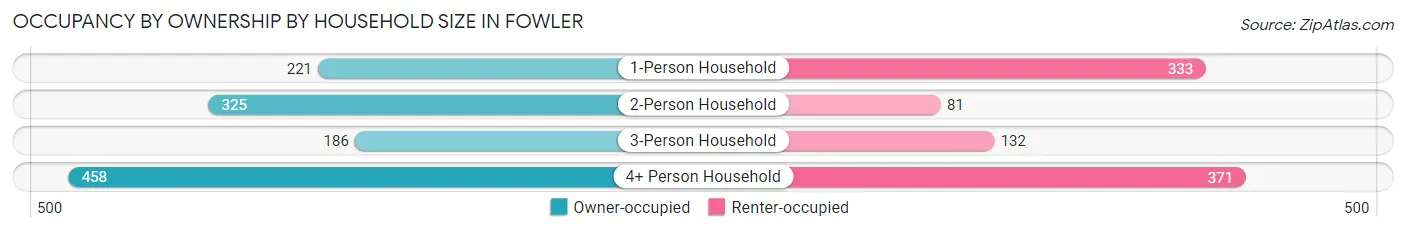
| Household Size | Owner-occupied | Renter-occupied |
| 1-Person Household | 221 (39.9%) | 333 (60.1%) |
| 2-Person Household | 325 (80.0%) | 81 (20.0%) |
| 3-Person Household | 186 (58.5%) | 132 (41.5%) |
| 4+ Person Household | 458 (55.2%) | 371 (44.8%) |
| Total Housing Units | 1,190 (56.5%) | 917 (43.5%) |
Occupancy by Educational Attainment in Fowler
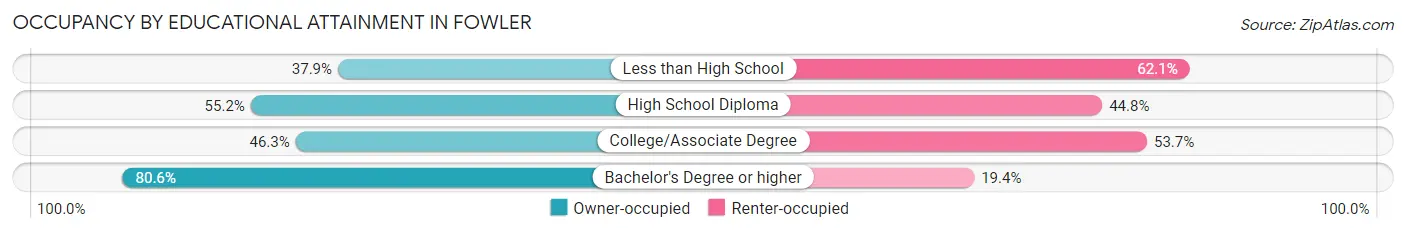
| Household Size | Owner-occupied | Renter-occupied |
| Less than High School | 144 (37.9%) | 236 (62.1%) |
| High School Diploma | 229 (55.2%) | 186 (44.8%) |
| College/Associate Degree | 324 (46.3%) | 376 (53.7%) |
| Bachelor's Degree or higher | 493 (80.6%) | 119 (19.4%) |
Occupancy by Age of Householder in Fowler
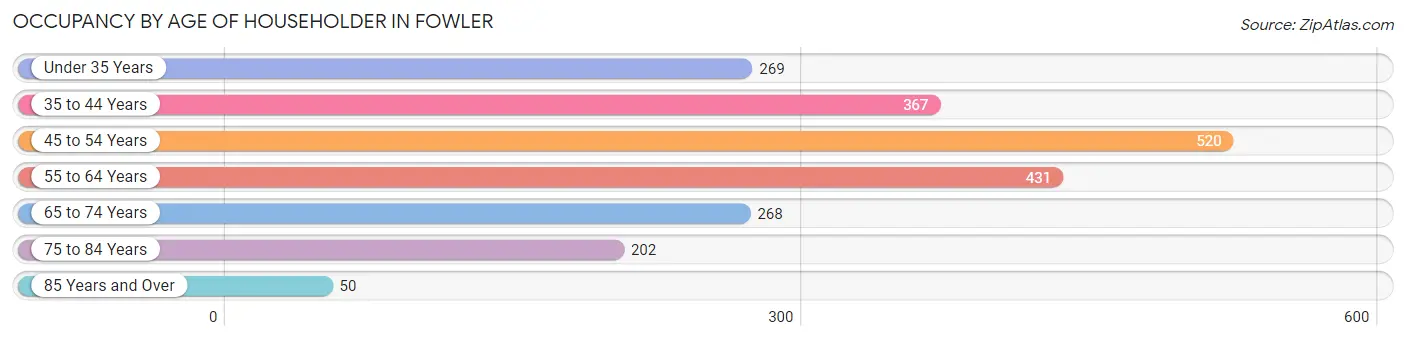
| Age Bracket | # Households | % Households |
| Under 35 Years | 269 | 12.8% |
| 35 to 44 Years | 367 | 17.4% |
| 45 to 54 Years | 520 | 24.7% |
| 55 to 64 Years | 431 | 20.5% |
| 65 to 74 Years | 268 | 12.7% |
| 75 to 84 Years | 202 | 9.6% |
| 85 Years and Over | 50 | 2.4% |
| Total | 2,107 | 100.0% |
Housing Finances in Fowler
Median Income by Occupancy in Fowler
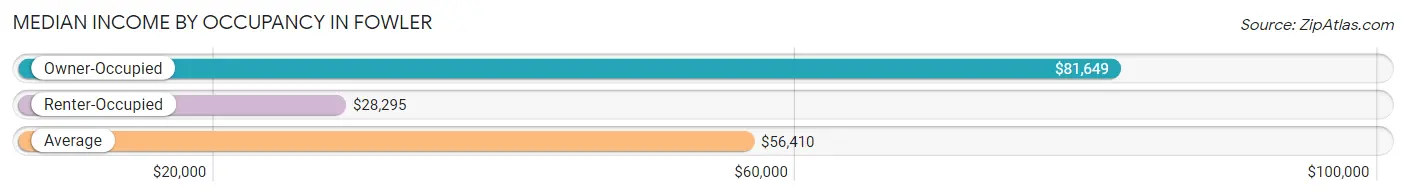
| Occupancy Type | # Households | Median Income |
| Owner-Occupied | 1,190 (56.5%) | $81,649 |
| Renter-Occupied | 917 (43.5%) | $28,295 |
| Average | 2,107 (100.0%) | $56,410 |
Occupancy by Householder Income Bracket in Fowler
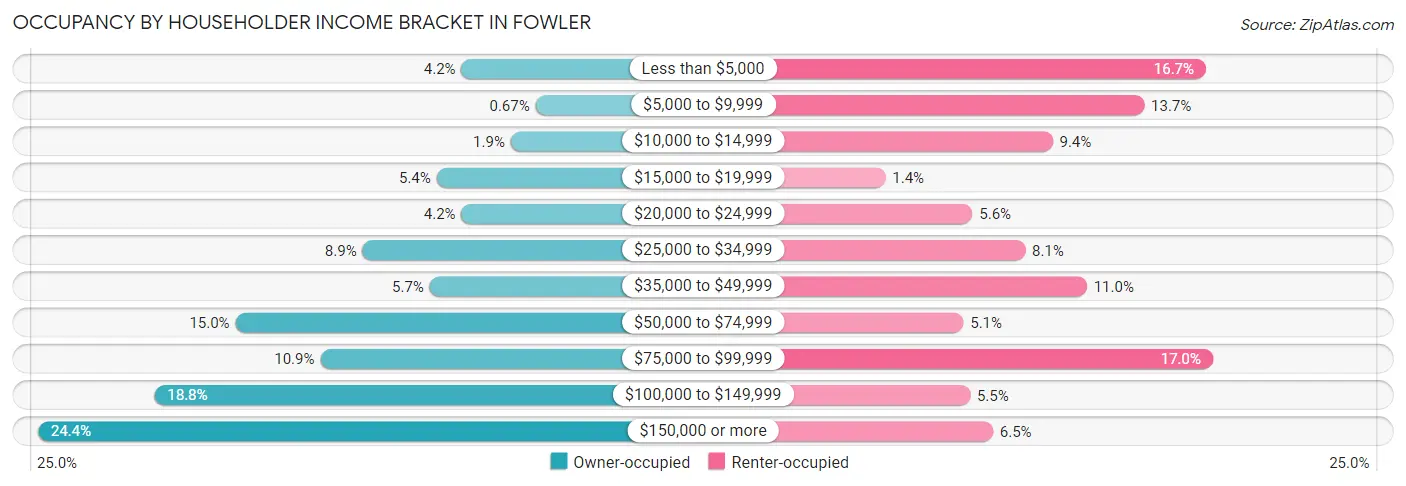
| Income Bracket | Owner-occupied | Renter-occupied |
| Less than $5,000 | 50 (4.2%) | 153 (16.7%) |
| $5,000 to $9,999 | 8 (0.7%) | 126 (13.7%) |
| $10,000 to $14,999 | 22 (1.8%) | 86 (9.4%) |
| $15,000 to $19,999 | 64 (5.4%) | 13 (1.4%) |
| $20,000 to $24,999 | 50 (4.2%) | 51 (5.6%) |
| $25,000 to $34,999 | 106 (8.9%) | 74 (8.1%) |
| $35,000 to $49,999 | 68 (5.7%) | 101 (11.0%) |
| $50,000 to $74,999 | 178 (15.0%) | 47 (5.1%) |
| $75,000 to $99,999 | 130 (10.9%) | 156 (17.0%) |
| $100,000 to $149,999 | 224 (18.8%) | 50 (5.4%) |
| $150,000 or more | 290 (24.4%) | 60 (6.5%) |
| Total | 1,190 (100.0%) | 917 (100.0%) |
Monthly Housing Cost Tiers in Fowler
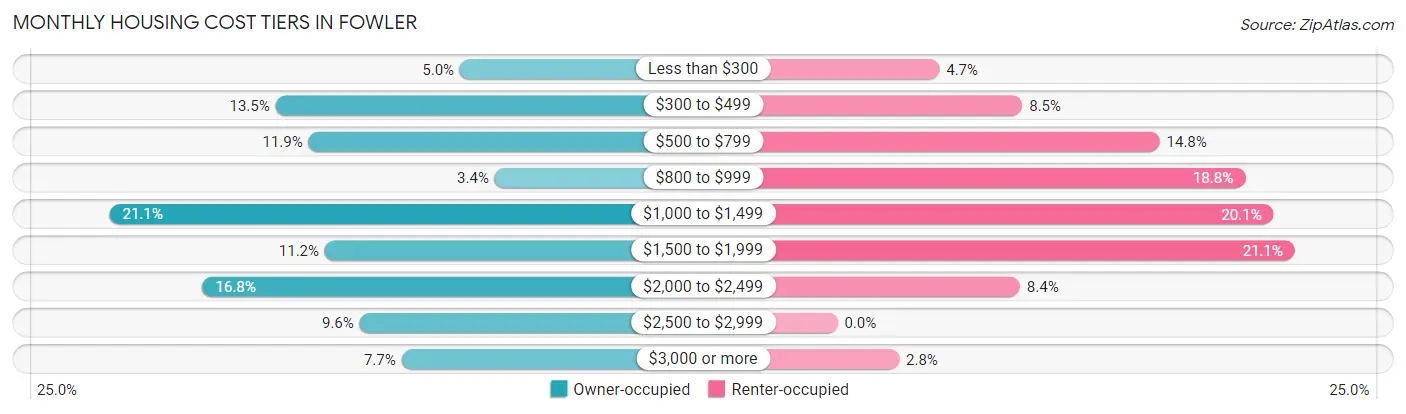
| Monthly Cost | Owner-occupied | Renter-occupied |
| Less than $300 | 59 (5.0%) | 43 (4.7%) |
| $300 to $499 | 160 (13.5%) | 78 (8.5%) |
| $500 to $799 | 142 (11.9%) | 136 (14.8%) |
| $800 to $999 | 40 (3.4%) | 172 (18.8%) |
| $1,000 to $1,499 | 251 (21.1%) | 184 (20.1%) |
| $1,500 to $1,999 | 133 (11.2%) | 193 (21.0%) |
| $2,000 to $2,499 | 200 (16.8%) | 77 (8.4%) |
| $2,500 to $2,999 | 114 (9.6%) | 0 (0.0%) |
| $3,000 or more | 91 (7.6%) | 26 (2.8%) |
| Total | 1,190 (100.0%) | 917 (100.0%) |
Physical Housing Characteristics in Fowler
Housing Structures in Fowler
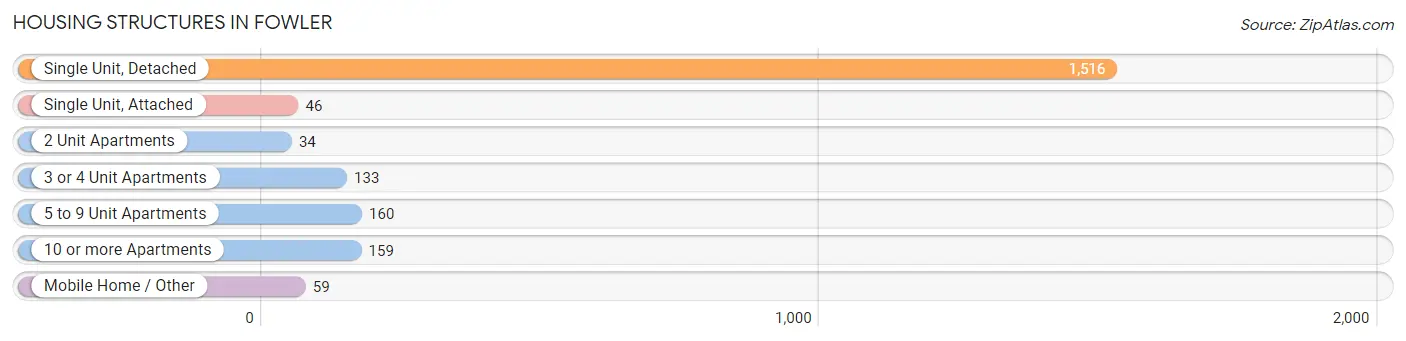
| Structure Type | # Housing Units | % Housing Units |
| Single Unit, Detached | 1,516 | 72.0% |
| Single Unit, Attached | 46 | 2.2% |
| 2 Unit Apartments | 34 | 1.6% |
| 3 or 4 Unit Apartments | 133 | 6.3% |
| 5 to 9 Unit Apartments | 160 | 7.6% |
| 10 or more Apartments | 159 | 7.5% |
| Mobile Home / Other | 59 | 2.8% |
| Total | 2,107 | 100.0% |
Housing Structures by Occupancy in Fowler
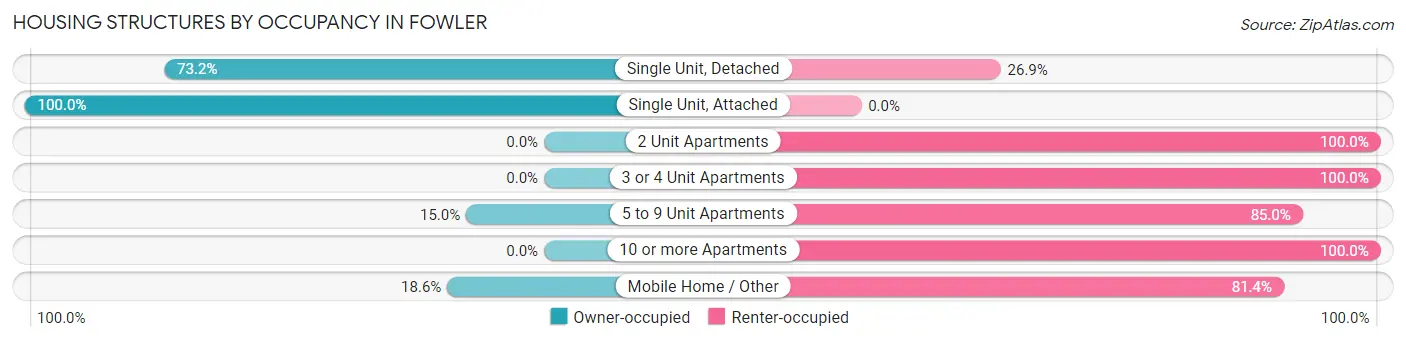
| Structure Type | Owner-occupied | Renter-occupied |
| Single Unit, Detached | 1,109 (73.2%) | 407 (26.9%) |
| Single Unit, Attached | 46 (100.0%) | 0 (0.0%) |
| 2 Unit Apartments | 0 (0.0%) | 34 (100.0%) |
| 3 or 4 Unit Apartments | 0 (0.0%) | 133 (100.0%) |
| 5 to 9 Unit Apartments | 24 (15.0%) | 136 (85.0%) |
| 10 or more Apartments | 0 (0.0%) | 159 (100.0%) |
| Mobile Home / Other | 11 (18.6%) | 48 (81.4%) |
| Total | 1,190 (56.5%) | 917 (43.5%) |
Housing Structures by Number of Rooms in Fowler
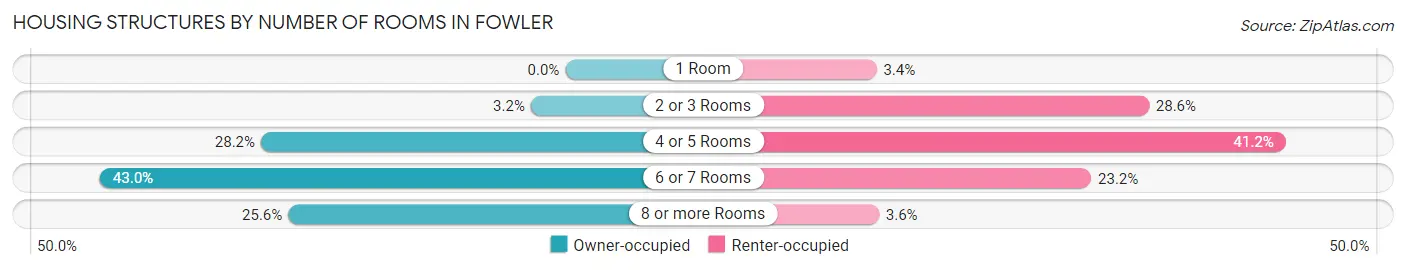
| Number of Rooms | Owner-occupied | Renter-occupied |
| 1 Room | 0 (0.0%) | 31 (3.4%) |
| 2 or 3 Rooms | 38 (3.2%) | 262 (28.6%) |
| 4 or 5 Rooms | 335 (28.1%) | 378 (41.2%) |
| 6 or 7 Rooms | 512 (43.0%) | 213 (23.2%) |
| 8 or more Rooms | 305 (25.6%) | 33 (3.6%) |
| Total | 1,190 (100.0%) | 917 (100.0%) |
Housing Structure by Heating Type in Fowler
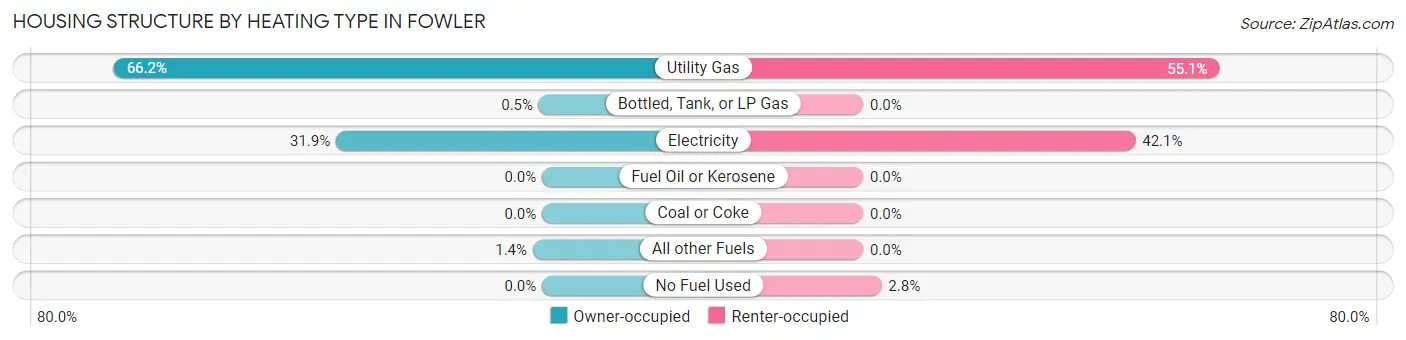
| Heating Type | Owner-occupied | Renter-occupied |
| Utility Gas | 788 (66.2%) | 505 (55.1%) |
| Bottled, Tank, or LP Gas | 6 (0.5%) | 0 (0.0%) |
| Electricity | 379 (31.9%) | 386 (42.1%) |
| Fuel Oil or Kerosene | 0 (0.0%) | 0 (0.0%) |
| Coal or Coke | 0 (0.0%) | 0 (0.0%) |
| All other Fuels | 17 (1.4%) | 0 (0.0%) |
| No Fuel Used | 0 (0.0%) | 26 (2.8%) |
| Total | 1,190 (100.0%) | 917 (100.0%) |
Household Vehicle Usage in Fowler
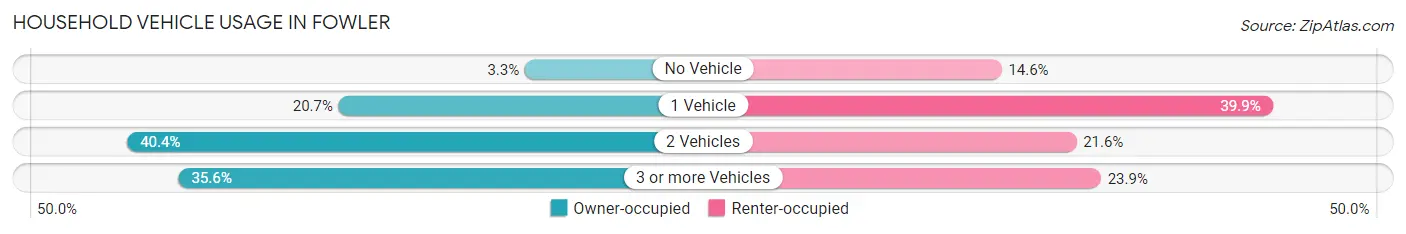
| Vehicles per Household | Owner-occupied | Renter-occupied |
| No Vehicle | 39 (3.3%) | 134 (14.6%) |
| 1 Vehicle | 246 (20.7%) | 366 (39.9%) |
| 2 Vehicles | 481 (40.4%) | 198 (21.6%) |
| 3 or more Vehicles | 424 (35.6%) | 219 (23.9%) |
| Total | 1,190 (100.0%) | 917 (100.0%) |
Real Estate & Mortgages in Fowler
Real Estate and Mortgage Overview in Fowler
| Characteristic | Without Mortgage | With Mortgage |
| Housing Units | 400 | 790 |
| Median Property Value | $275,800 | $358,000 |
| Median Household Income | $44,083 | $237 |
| Monthly Housing Costs | $494 | $91 |
| Real Estate Taxes | $1,783 | $15 |
Property Value by Mortgage Status in Fowler
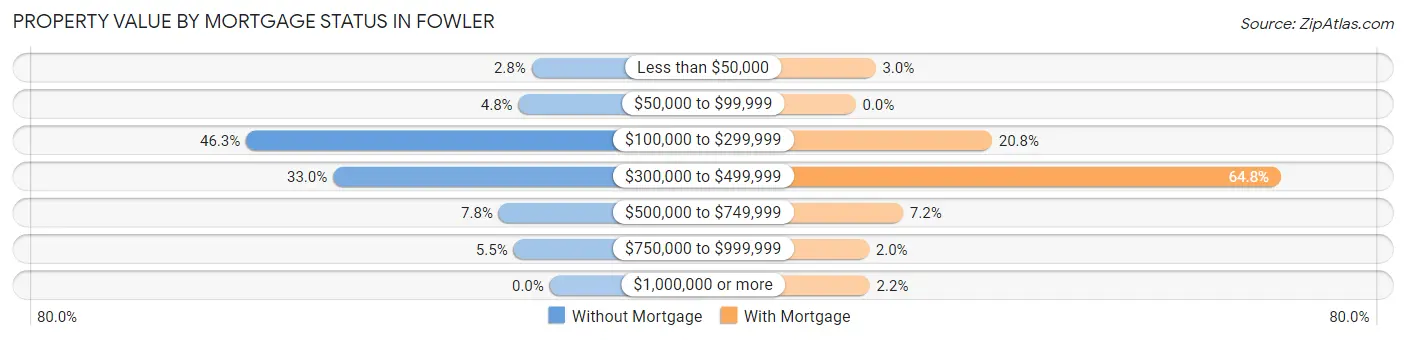
| Property Value | Without Mortgage | With Mortgage |
| Less than $50,000 | 11 (2.8%) | 24 (3.0%) |
| $50,000 to $99,999 | 19 (4.8%) | 0 (0.0%) |
| $100,000 to $299,999 | 185 (46.3%) | 164 (20.8%) |
| $300,000 to $499,999 | 132 (33.0%) | 512 (64.8%) |
| $500,000 to $749,999 | 31 (7.7%) | 57 (7.2%) |
| $750,000 to $999,999 | 22 (5.5%) | 16 (2.0%) |
| $1,000,000 or more | 0 (0.0%) | 17 (2.1%) |
| Total | 400 (100.0%) | 790 (100.0%) |
Household Income by Mortgage Status in Fowler
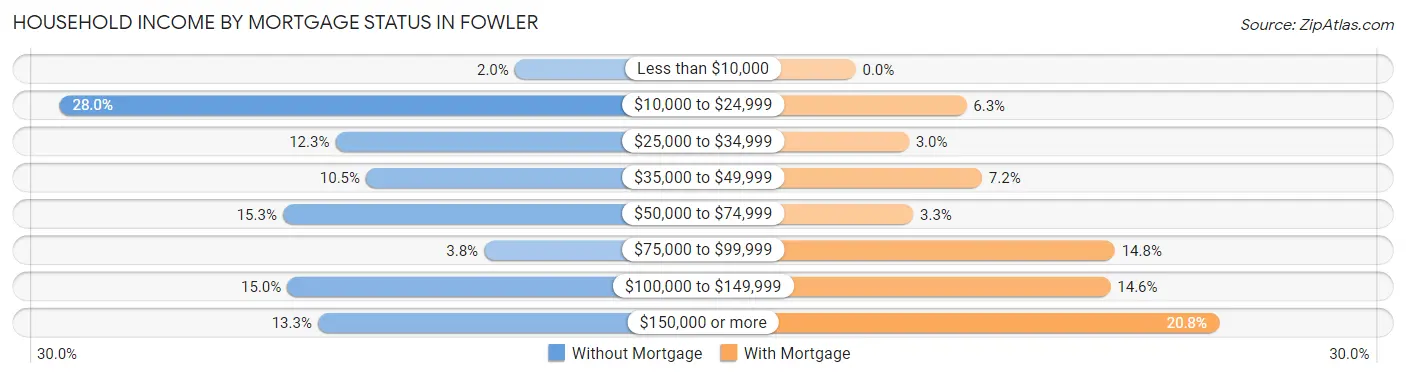
| Household Income | Without Mortgage | With Mortgage |
| Less than $10,000 | 8 (2.0%) | 0 (0.0%) |
| $10,000 to $24,999 | 112 (28.0%) | 50 (6.3%) |
| $25,000 to $34,999 | 49 (12.2%) | 24 (3.0%) |
| $35,000 to $49,999 | 42 (10.5%) | 57 (7.2%) |
| $50,000 to $74,999 | 61 (15.2%) | 26 (3.3%) |
| $75,000 to $99,999 | 15 (3.7%) | 117 (14.8%) |
| $100,000 to $149,999 | 60 (15.0%) | 115 (14.6%) |
| $150,000 or more | 53 (13.3%) | 164 (20.8%) |
| Total | 400 (100.0%) | 790 (100.0%) |
Property Value to Household Income Ratio in Fowler
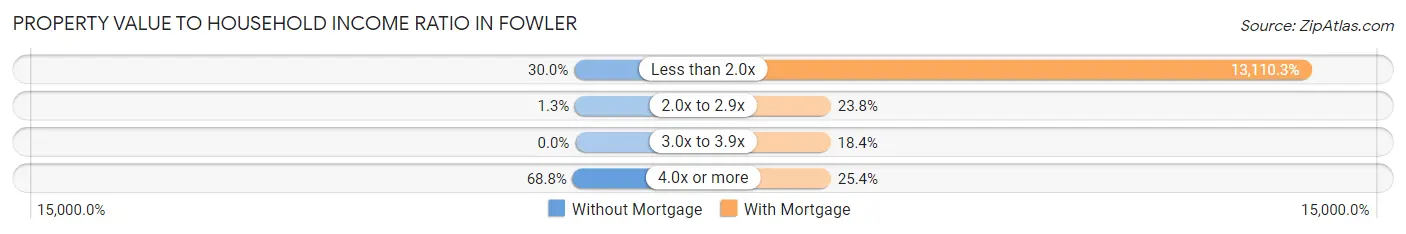
| Value-to-Income Ratio | Without Mortgage | With Mortgage |
| Less than 2.0x | 120 (30.0%) | 103,571 (13,110.2%) |
| 2.0x to 2.9x | 5 (1.3%) | 188 (23.8%) |
| 3.0x to 3.9x | 0 (0.0%) | 145 (18.3%) |
| 4.0x or more | 275 (68.8%) | 201 (25.4%) |
| Total | 400 (100.0%) | 790 (100.0%) |
Real Estate Taxes by Mortgage Status in Fowler
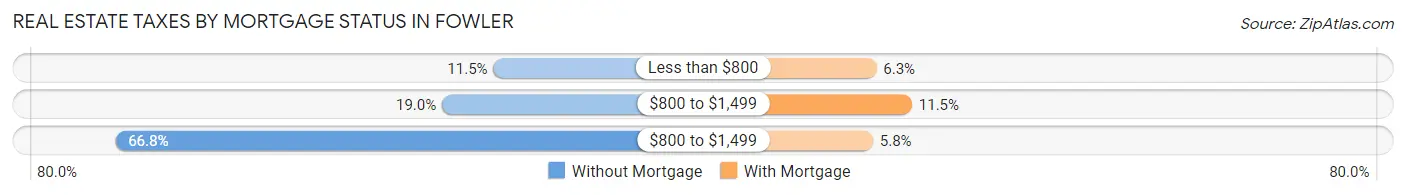
| Property Taxes | Without Mortgage | With Mortgage |
| Less than $800 | 46 (11.5%) | 50 (6.3%) |
| $800 to $1,499 | 76 (19.0%) | 91 (11.5%) |
| $800 to $1,499 | 267 (66.7%) | 46 (5.8%) |
| Total | 400 (100.0%) | 790 (100.0%) |
Health & Disability in Fowler
Health Insurance Coverage by Age in Fowler
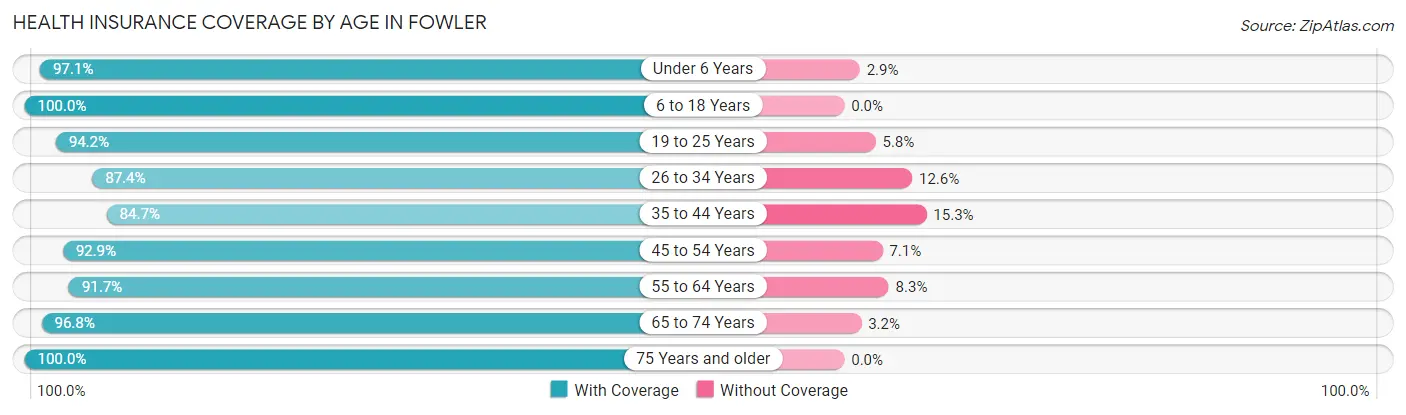
| Age Bracket | With Coverage | Without Coverage |
| Under 6 Years | 608 (97.1%) | 18 (2.9%) |
| 6 to 18 Years | 1,553 (100.0%) | 0 (0.0%) |
| 19 to 25 Years | 614 (94.2%) | 38 (5.8%) |
| 26 to 34 Years | 595 (87.4%) | 86 (12.6%) |
| 35 to 44 Years | 625 (84.7%) | 113 (15.3%) |
| 45 to 54 Years | 783 (92.9%) | 60 (7.1%) |
| 55 to 64 Years | 710 (91.7%) | 64 (8.3%) |
| 65 to 74 Years | 491 (96.8%) | 16 (3.2%) |
| 75 Years and older | 391 (100.0%) | 0 (0.0%) |
| Total | 6,370 (94.2%) | 395 (5.8%) |
Health Insurance Coverage by Citizenship Status in Fowler
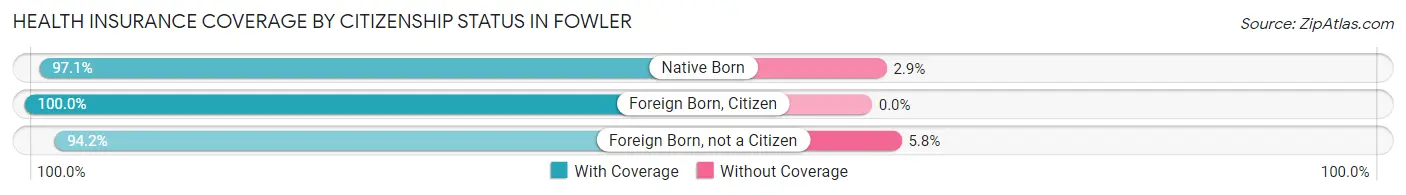
| Citizenship Status | With Coverage | Without Coverage |
| Native Born | 608 (97.1%) | 18 (2.9%) |
| Foreign Born, Citizen | 1,553 (100.0%) | 0 (0.0%) |
| Foreign Born, not a Citizen | 614 (94.2%) | 38 (5.8%) |
Health Insurance Coverage by Household Income in Fowler
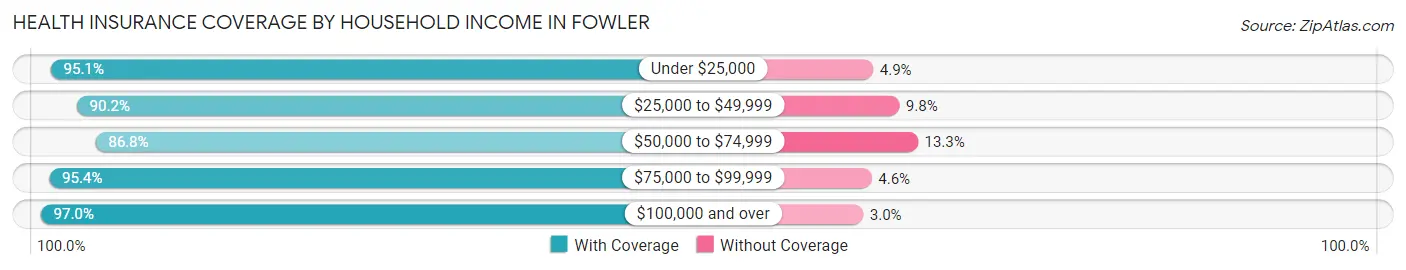
| Household Income | With Coverage | Without Coverage |
| Under $25,000 | 1,110 (95.1%) | 57 (4.9%) |
| $25,000 to $49,999 | 1,045 (90.2%) | 113 (9.8%) |
| $50,000 to $74,999 | 622 (86.8%) | 95 (13.3%) |
| $75,000 to $99,999 | 1,079 (95.4%) | 52 (4.6%) |
| $100,000 and over | 2,514 (97.0%) | 78 (3.0%) |
Public vs Private Health Insurance Coverage by Age in Fowler
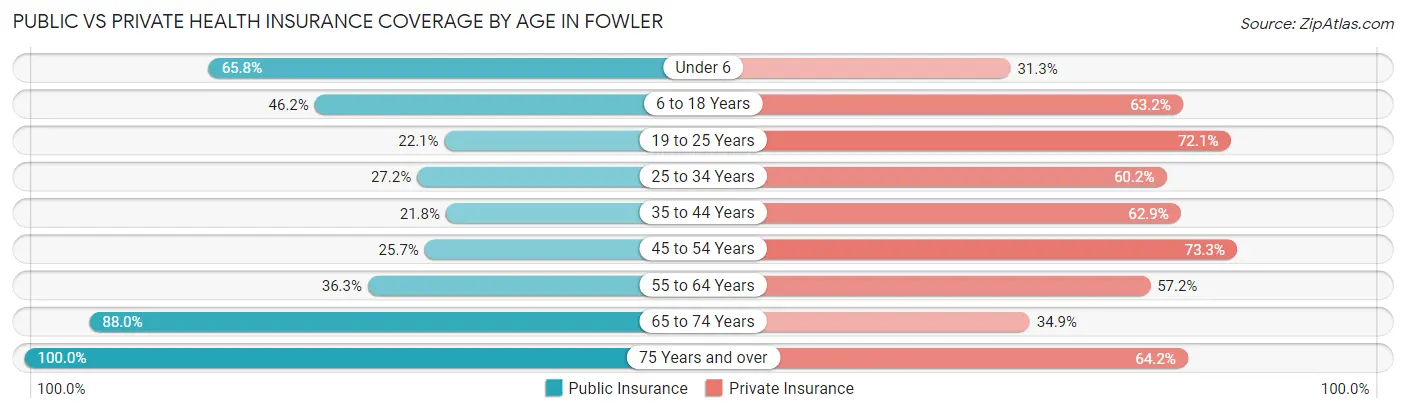
| Age Bracket | Public Insurance | Private Insurance |
| Under 6 | 412 (65.8%) | 196 (31.3%) |
| 6 to 18 Years | 717 (46.2%) | 982 (63.2%) |
| 19 to 25 Years | 144 (22.1%) | 470 (72.1%) |
| 25 to 34 Years | 185 (27.2%) | 410 (60.2%) |
| 35 to 44 Years | 161 (21.8%) | 464 (62.9%) |
| 45 to 54 Years | 217 (25.7%) | 618 (73.3%) |
| 55 to 64 Years | 281 (36.3%) | 443 (57.2%) |
| 65 to 74 Years | 446 (88.0%) | 177 (34.9%) |
| 75 Years and over | 391 (100.0%) | 251 (64.2%) |
| Total | 2,954 (43.7%) | 4,011 (59.3%) |
Disability Status by Sex by Age in Fowler
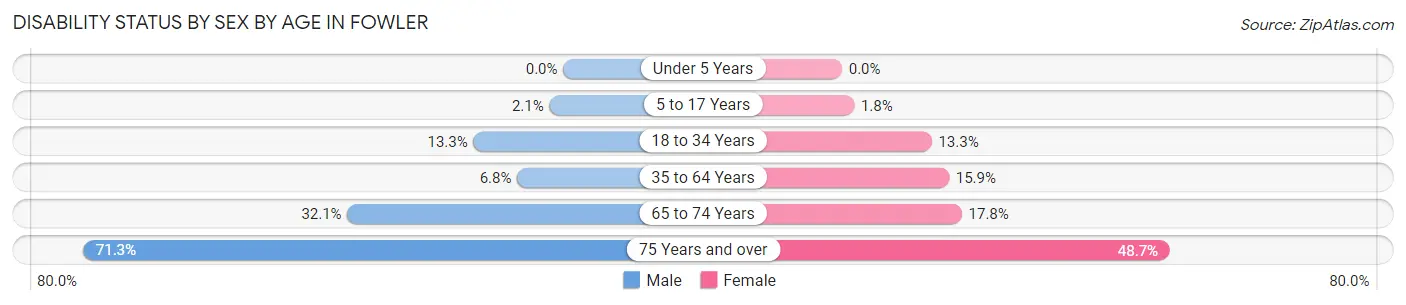
| Age Bracket | Male | Female |
| Under 5 Years | 0 (0.0%) | 0 (0.0%) |
| 5 to 17 Years | 15 (2.1%) | 15 (1.8%) |
| 18 to 34 Years | 97 (13.3%) | 102 (13.3%) |
| 35 to 64 Years | 72 (6.8%) | 207 (15.9%) |
| 65 to 74 Years | 67 (32.1%) | 53 (17.8%) |
| 75 Years and over | 112 (71.3%) | 114 (48.7%) |
Disability Class by Sex by Age in Fowler
Disability Class: Hearing Difficulty
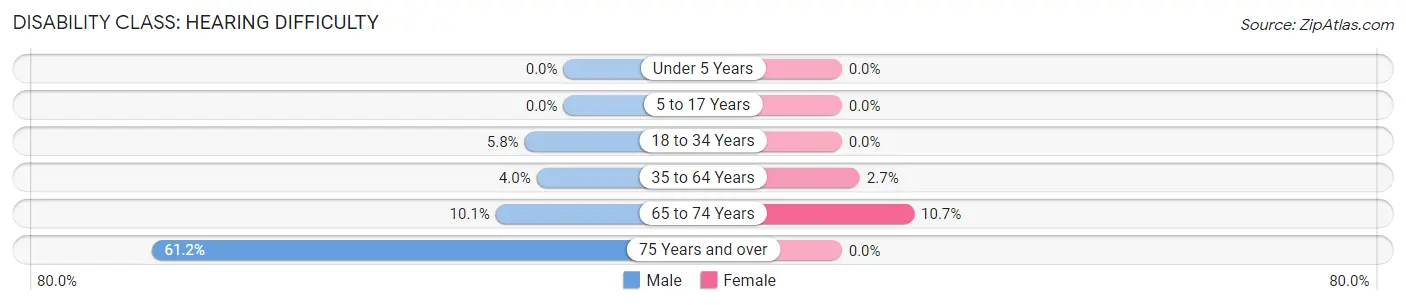
| Age Bracket | Male | Female |
| Under 5 Years | 0 (0.0%) | 0 (0.0%) |
| 5 to 17 Years | 0 (0.0%) | 0 (0.0%) |
| 18 to 34 Years | 42 (5.8%) | 0 (0.0%) |
| 35 to 64 Years | 42 (4.0%) | 35 (2.7%) |
| 65 to 74 Years | 21 (10.1%) | 32 (10.7%) |
| 75 Years and over | 96 (61.2%) | 0 (0.0%) |
Disability Class: Vision Difficulty
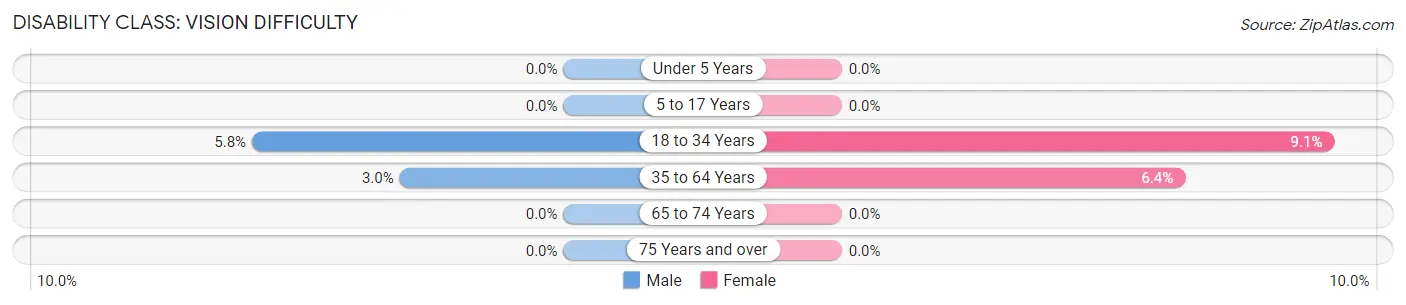
| Age Bracket | Male | Female |
| Under 5 Years | 0 (0.0%) | 0 (0.0%) |
| 5 to 17 Years | 0 (0.0%) | 0 (0.0%) |
| 18 to 34 Years | 42 (5.8%) | 70 (9.1%) |
| 35 to 64 Years | 32 (3.0%) | 83 (6.4%) |
| 65 to 74 Years | 0 (0.0%) | 0 (0.0%) |
| 75 Years and over | 0 (0.0%) | 0 (0.0%) |
Disability Class: Cognitive Difficulty
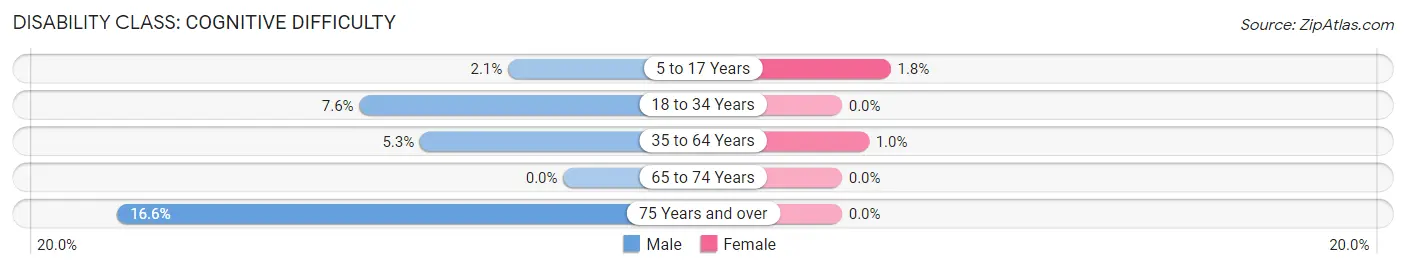
| Age Bracket | Male | Female |
| 5 to 17 Years | 15 (2.1%) | 15 (1.8%) |
| 18 to 34 Years | 55 (7.6%) | 0 (0.0%) |
| 35 to 64 Years | 56 (5.3%) | 13 (1.0%) |
| 65 to 74 Years | 0 (0.0%) | 0 (0.0%) |
| 75 Years and over | 26 (16.6%) | 0 (0.0%) |
Disability Class: Ambulatory Difficulty
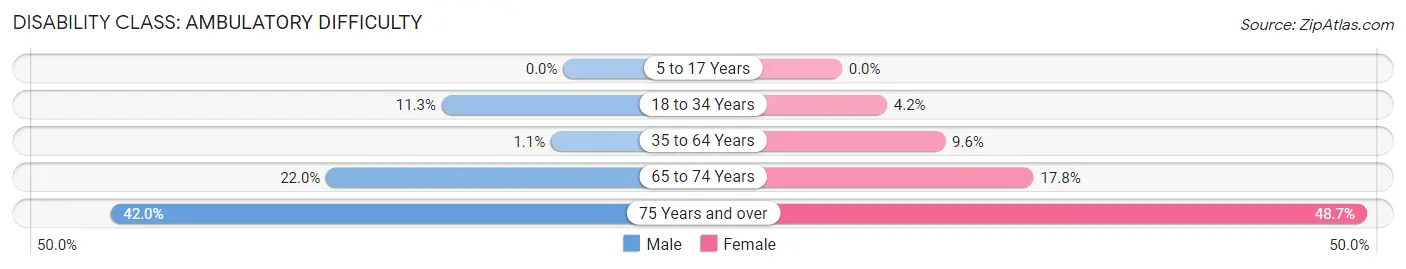
| Age Bracket | Male | Female |
| 5 to 17 Years | 0 (0.0%) | 0 (0.0%) |
| 18 to 34 Years | 82 (11.3%) | 32 (4.2%) |
| 35 to 64 Years | 12 (1.1%) | 125 (9.6%) |
| 65 to 74 Years | 46 (22.0%) | 53 (17.8%) |
| 75 Years and over | 66 (42.0%) | 114 (48.7%) |
Disability Class: Self-Care Difficulty
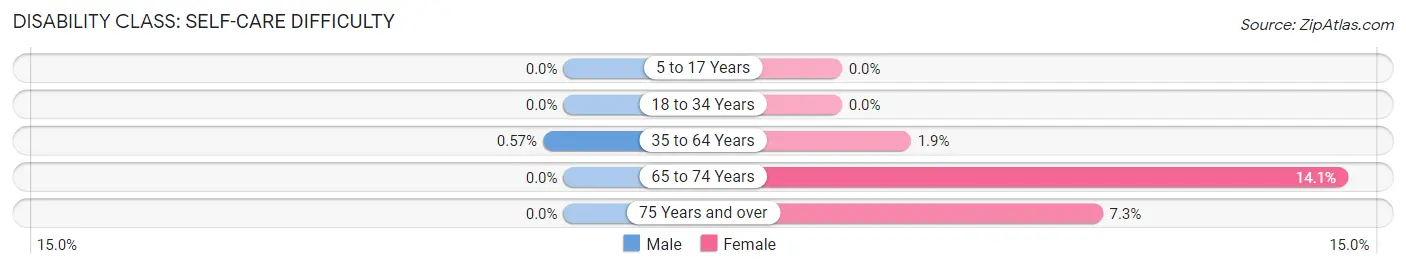
| Age Bracket | Male | Female |
| 5 to 17 Years | 0 (0.0%) | 0 (0.0%) |
| 18 to 34 Years | 0 (0.0%) | 0 (0.0%) |
| 35 to 64 Years | 6 (0.6%) | 25 (1.9%) |
| 65 to 74 Years | 0 (0.0%) | 42 (14.1%) |
| 75 Years and over | 0 (0.0%) | 17 (7.3%) |
Technology Access in Fowler
Computing Device Access in Fowler
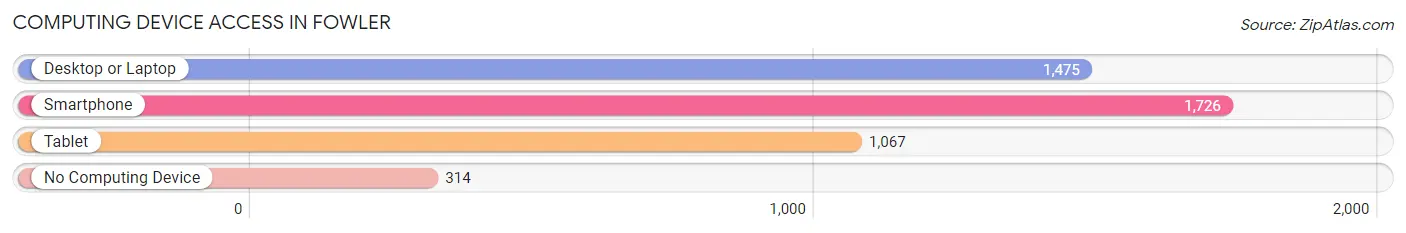
| Device Type | # Households | % Households |
| Desktop or Laptop | 1,475 | 70.0% |
| Smartphone | 1,726 | 81.9% |
| Tablet | 1,067 | 50.6% |
| No Computing Device | 314 | 14.9% |
| Total | 2,107 | 100.0% |
Internet Access in Fowler
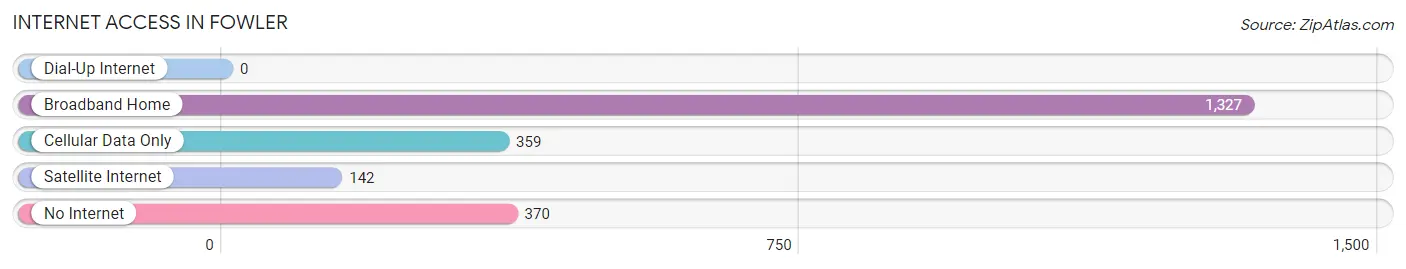
| Internet Type | # Households | % Households |
| Dial-Up Internet | 0 | 0.0% |
| Broadband Home | 1,327 | 63.0% |
| Cellular Data Only | 359 | 17.0% |
| Satellite Internet | 142 | 6.7% |
| No Internet | 370 | 17.6% |
| Total | 2,107 | 100.0% |
Fowler Summary
Fowler is a small city located in Fresno County, California. It is situated in the San Joaquin Valley, approximately 10 miles south of Fresno. The city has a population of approximately 6,000 people and covers an area of 1.7 square miles.
History
Fowler was founded in 1884 by George Fowler, a rancher from Illinois. He purchased land in the area and began to develop it for agricultural purposes. The city was incorporated in 1908 and was named after its founder.
In the early 1900s, Fowler was a thriving agricultural community. It was known for its production of cotton, grapes, and other crops. The city also had a thriving dairy industry.
In the 1950s, the city began to experience a population boom as people moved to the area for jobs in the agricultural industry. This growth continued into the 1960s and 1970s, and Fowler became a popular destination for people looking to escape the hustle and bustle of the larger cities in the area.
Geography
Fowler is located in the San Joaquin Valley, approximately 10 miles south of Fresno. The city is situated on the banks of the Kings River and is surrounded by rolling hills and farmland. The climate in Fowler is hot and dry in the summer and mild in the winter.
Economy
Fowler’s economy is largely based on agriculture. The city is home to a number of farms and ranches that produce a variety of crops, including cotton, grapes, and other fruits and vegetables. The city also has a thriving dairy industry.
In addition to agriculture, Fowler is home to a number of small businesses, including restaurants, retail stores, and service providers. The city also has a number of manufacturing companies that produce a variety of products, including furniture, clothing, and electronics.
Demographics
As of the 2010 census, Fowler had a population of 6,000 people. The racial makeup of the city was 57.3% White, 1.3% African American, 0.7% Native American, 0.7% Asian, 0.1% Pacific Islander, and 37.3% from other races. Hispanic or Latino of any race were 59.3% of the population.
The median household income in Fowler was $37,917, and the median family income was $41,917. The per capita income was $15,917. About 18.3% of families and 22.3% of the population were below the poverty line.
Fowler is a small city with a rich history and a vibrant economy. It is home to a diverse population and is a great place to live and work.
Common Questions
What is Per Capita Income in Fowler?
Per Capita income in Fowler is $26,623.
What is the Median Family Income in Fowler?
Median Family Income in Fowler is $81,463.
What is the Median Household income in Fowler?
Median Household Income in Fowler is $56,410.
What is Income or Wage Gap in Fowler?
Income or Wage Gap in Fowler is 39.8%.
Women in Fowler earn 60.2 cents for every dollar earned by a man.
What is Inequality or Gini Index in Fowler?
Inequality or Gini Index in Fowler is 0.53.
What is the Total Population of Fowler?
Total Population of Fowler is 6,819.
What is the Total Male Population of Fowler?
Total Male Population of Fowler is 3,169.
What is the Total Female Population of Fowler?
Total Female Population of Fowler is 3,650.
What is the Ratio of Males per 100 Females in Fowler?
There are 86.82 Males per 100 Females in Fowler.
What is the Ratio of Females per 100 Males in Fowler?
There are 115.18 Females per 100 Males in Fowler.
What is the Median Population Age in Fowler?
Median Population Age in Fowler is 34.1 Years.
What is the Average Family Size in Fowler
Average Family Size in Fowler is 3.9 People.
What is the Average Household Size in Fowler
Average Household Size in Fowler is 3.2 People.
How Large is the Labor Force in Fowler?
There are 2,794 People in the Labor Forcein in Fowler.
What is the Percentage of People in the Labor Force in Fowler?
55.6% of People are in the Labor Force in Fowler.
What is the Unemployment Rate in Fowler?
Unemployment Rate in Fowler is 8.5%.