Miranda, CA Map & Demographics
Miranda Map
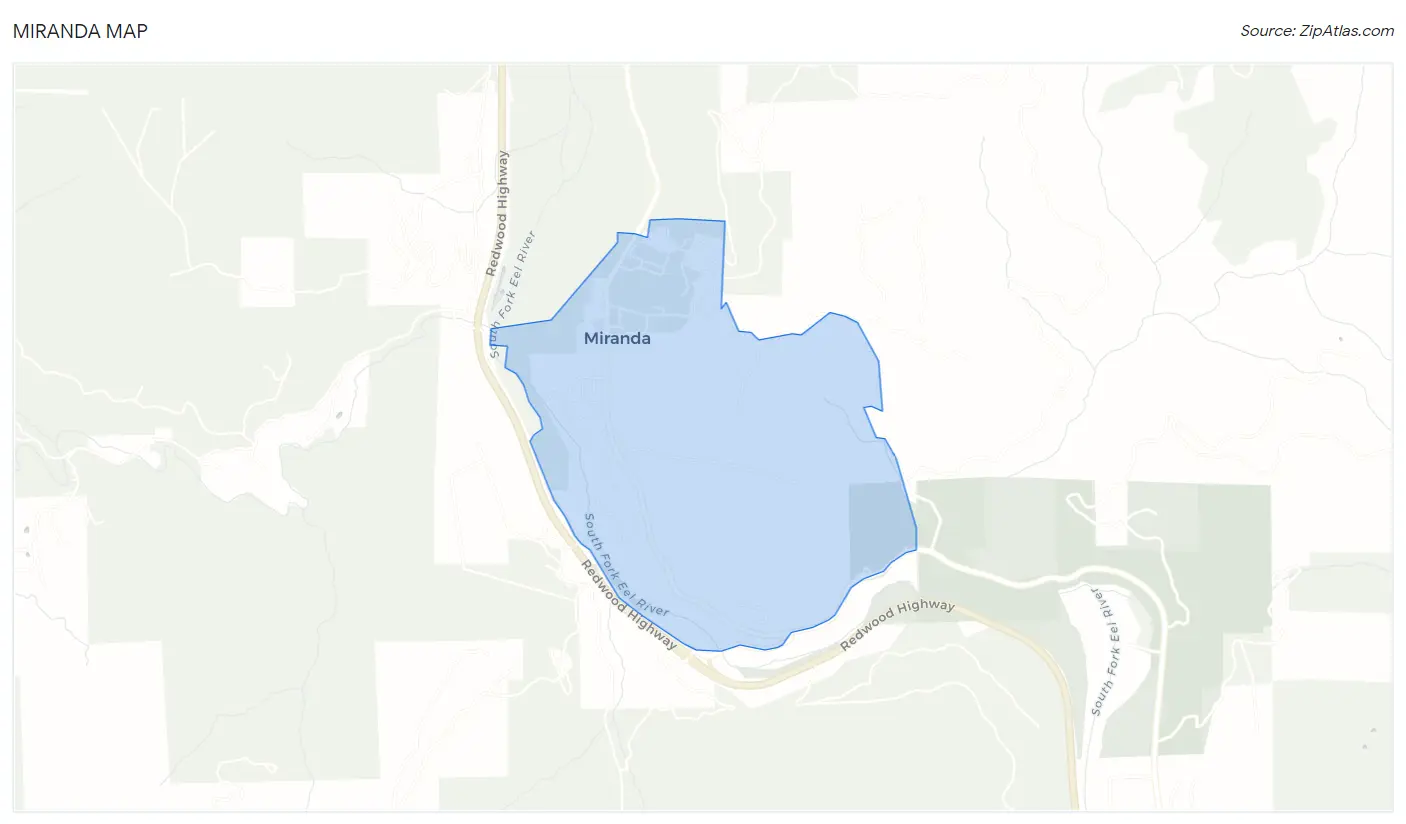
Miranda Overview
$17,267
PER CAPITA INCOME
0.50
INEQUALITY / GINI INDEX
656
TOTAL POPULATION
343
MALE POPULATION
313
FEMALE POPULATION
109.58
MALES / 100 FEMALES
91.25
FEMALES / 100 MALES
21.0
MEDIAN AGE
5.5
AVG FAMILY SIZE
2.6
AVG HOUSEHOLD SIZE
208
LABOR FORCE [ PEOPLE ]
53.2%
PERCENT IN LABOR FORCE
Miranda Zip Codes
Miranda Area Codes
Income in Miranda
Income Overview in Miranda
| Characteristic | Number | Measure |
| Per Capita Income | 656 | $17,267 |
| Median Family Income | 66 | $0 |
| Mean Family Income | 66 | $0 |
| Median Household Income | 248 | $0 |
| Mean Household Income | 248 | $43,409 |
| Income Deficit | 66 | $0 |
| Wage / Income Gap (%) | 656 | 0.00% |
| Wage / Income Gap ($) | 656 | 100.00¢ per $1 |
| Gini / Inequality Index | 656 | 0.50 |
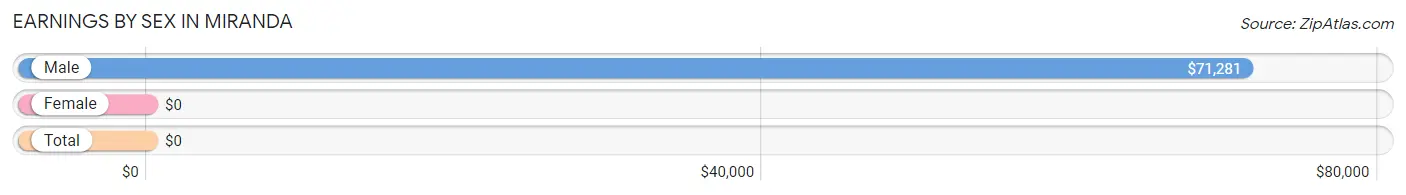
Earnings by Sex in Miranda
| Sex | Number | Average Earnings |
| Male | 103 (43.3%) | $71,281 |
| Female | 135 (56.7%) | $0 |
| Total | 238 (100.0%) | $0 |
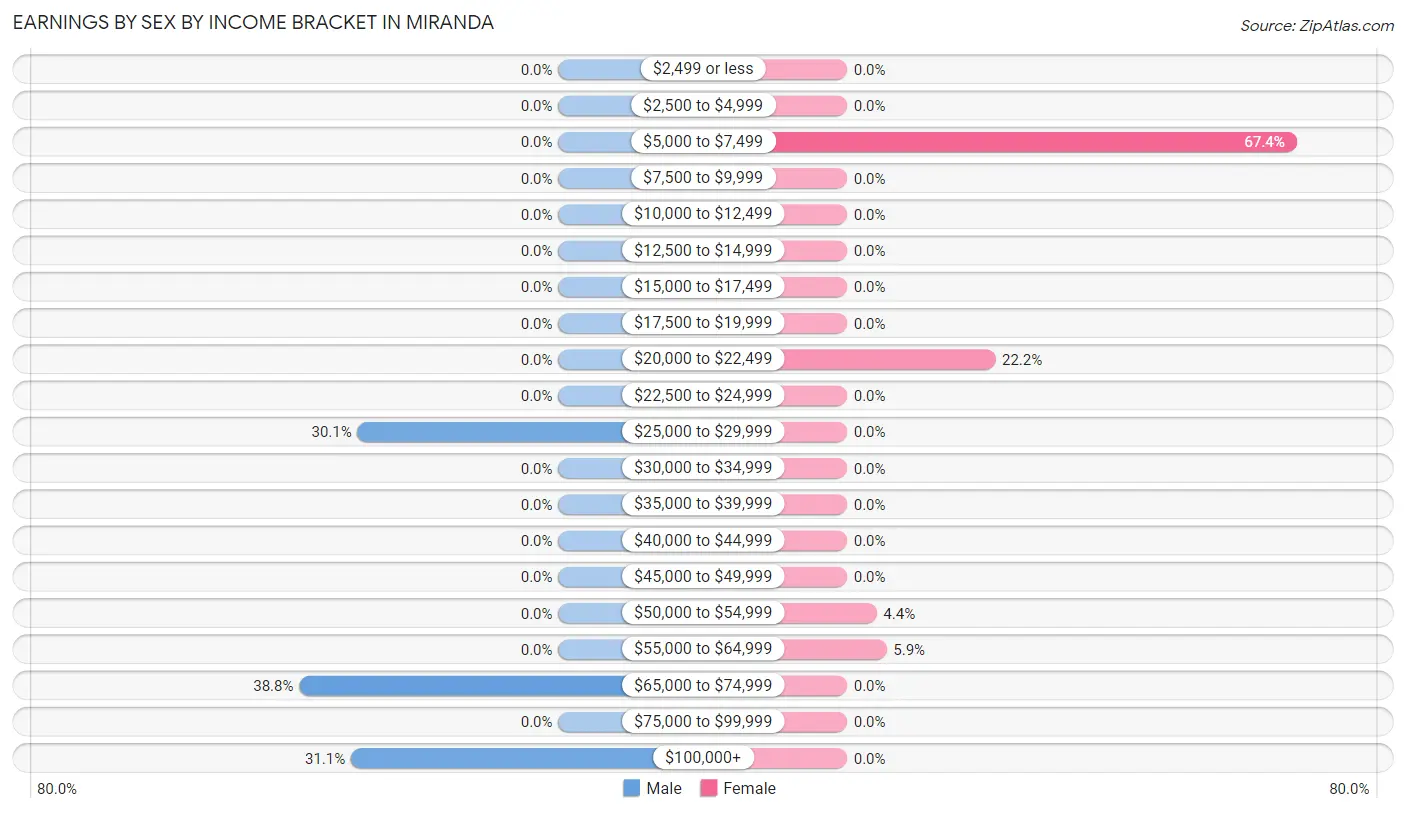
Earnings by Sex by Income Bracket in Miranda
The most common earnings brackets in Miranda are $65,000 to $74,999 for men (40 | 38.8%) and $5,000 to $7,499 for women (91 | 67.4%).
| Income | Male | Female |
| $2,499 or less | 0 (0.0%) | 0 (0.0%) |
| $2,500 to $4,999 | 0 (0.0%) | 0 (0.0%) |
| $5,000 to $7,499 | 0 (0.0%) | 91 (67.4%) |
| $7,500 to $9,999 | 0 (0.0%) | 0 (0.0%) |
| $10,000 to $12,499 | 0 (0.0%) | 0 (0.0%) |
| $12,500 to $14,999 | 0 (0.0%) | 0 (0.0%) |
| $15,000 to $17,499 | 0 (0.0%) | 0 (0.0%) |
| $17,500 to $19,999 | 0 (0.0%) | 0 (0.0%) |
| $20,000 to $22,499 | 0 (0.0%) | 30 (22.2%) |
| $22,500 to $24,999 | 0 (0.0%) | 0 (0.0%) |
| $25,000 to $29,999 | 31 (30.1%) | 0 (0.0%) |
| $30,000 to $34,999 | 0 (0.0%) | 0 (0.0%) |
| $35,000 to $39,999 | 0 (0.0%) | 0 (0.0%) |
| $40,000 to $44,999 | 0 (0.0%) | 0 (0.0%) |
| $45,000 to $49,999 | 0 (0.0%) | 0 (0.0%) |
| $50,000 to $54,999 | 0 (0.0%) | 6 (4.4%) |
| $55,000 to $64,999 | 0 (0.0%) | 8 (5.9%) |
| $65,000 to $74,999 | 40 (38.8%) | 0 (0.0%) |
| $75,000 to $99,999 | 0 (0.0%) | 0 (0.0%) |
| $100,000+ | 32 (31.1%) | 0 (0.0%) |
| Total | 103 (100.0%) | 135 (100.0%) |
Earnings by Sex by Educational Attainment in Miranda
| Educational Attainment | Male Income | Female Income |
| Less than High School | - | - |
| High School Diploma | - | - |
| College or Associate's Degree | - | - |
| Bachelor's Degree | - | - |
| Graduate Degree | - | - |
| Total | $71,281 | $0 |
Family Income in Miranda
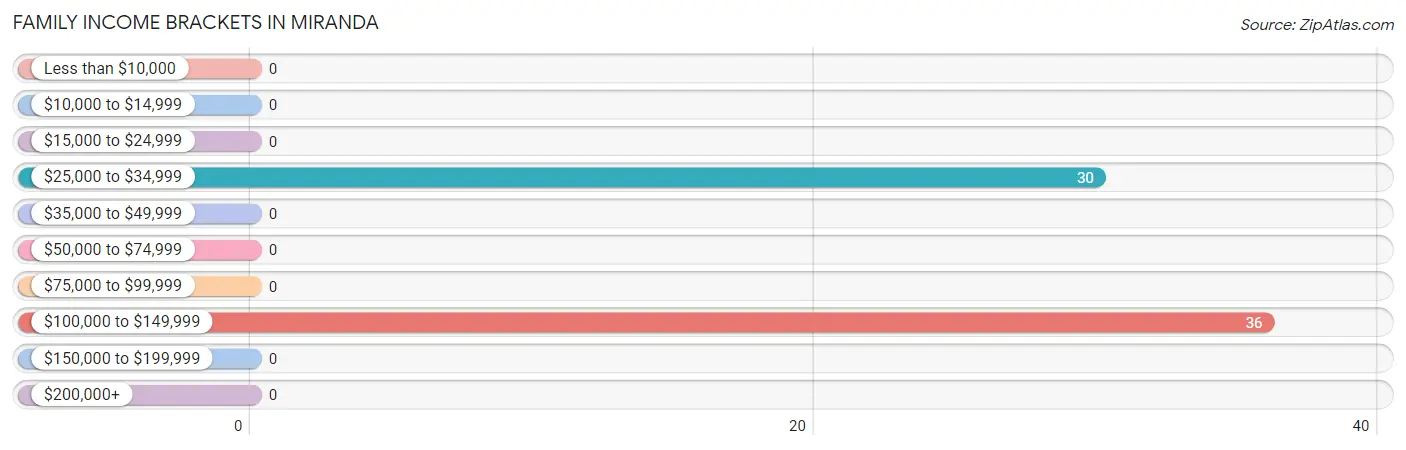
Family Income Brackets in Miranda
According to the Miranda family income data, there are 36 families falling into the $100,000 to $149,999 income range, which is the most common income bracket and makes up 54.5% of all families.
| Income Bracket | # Families | % Families |
| Less than $10,000 | 0 | 0.0% |
| $10,000 to $14,999 | 0 | 0.0% |
| $15,000 to $24,999 | 0 | 0.0% |
| $25,000 to $34,999 | 30 | 45.5% |
| $35,000 to $49,999 | 0 | 0.0% |
| $50,000 to $74,999 | 0 | 0.0% |
| $75,000 to $99,999 | 0 | 0.0% |
| $100,000 to $149,999 | 36 | 54.5% |
| $150,000 to $199,999 | 0 | 0.0% |
| $200,000+ | 0 | 0.0% |
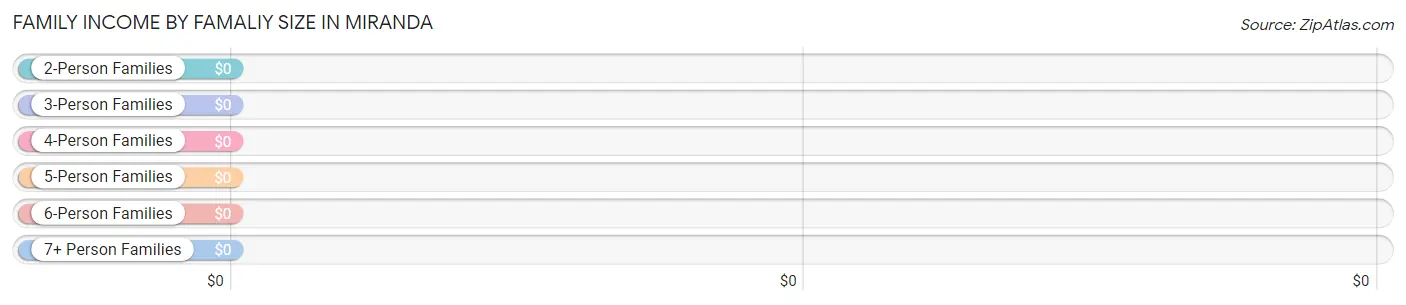
Family Income by Famaliy Size in Miranda
| Income Bracket | # Families | Median Income |
| 2-Person Families | 0 (0.0%) | $0 |
| 3-Person Families | 0 (0.0%) | $0 |
| 4-Person Families | 0 (0.0%) | $0 |
| 5-Person Families | 36 (54.5%) | $0 |
| 6-Person Families | 30 (45.5%) | $0 |
| 7+ Person Families | 0 (0.0%) | $0 |
| Total | 66 (100.0%) | $0 |
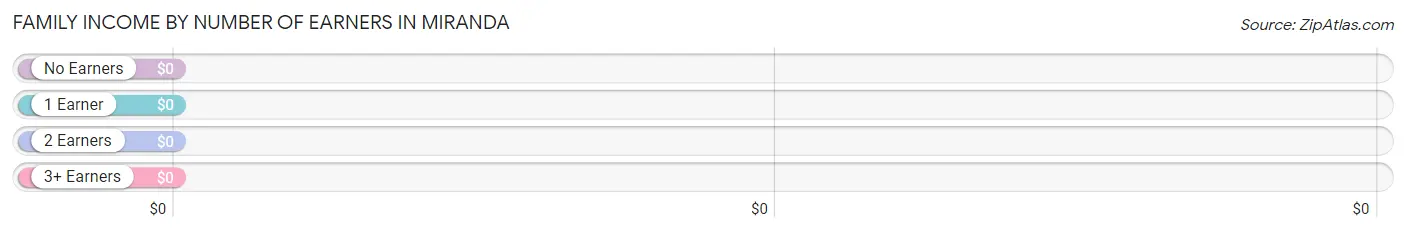
Family Income by Number of Earners in Miranda
| Number of Earners | # Families | Median Income |
| No Earners | 0 (0.0%) | $0 |
| 1 Earner | 66 (100.0%) | $0 |
| 2 Earners | 0 (0.0%) | $0 |
| 3+ Earners | 0 (0.0%) | $0 |
| Total | 66 (100.0%) | $0 |
Household Income in Miranda
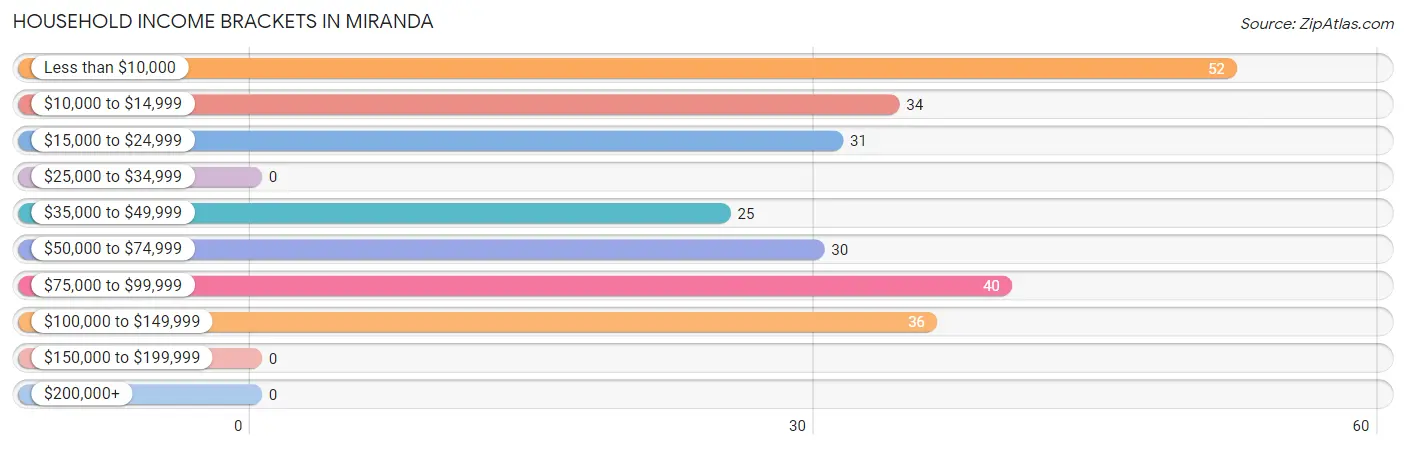
Household Income Brackets in Miranda
With 52 households falling in the category, the less than $10,000 income range is the most frequent in Miranda, accounting for 21.0% of all households.
| Income Bracket | # Households | % Households |
| Less than $10,000 | 52 | 21.0% |
| $10,000 to $14,999 | 34 | 13.7% |
| $15,000 to $24,999 | 31 | 12.5% |
| $25,000 to $34,999 | 0 | 0.0% |
| $35,000 to $49,999 | 25 | 10.1% |
| $50,000 to $74,999 | 30 | 12.1% |
| $75,000 to $99,999 | 40 | 16.1% |
| $100,000 to $149,999 | 36 | 14.5% |
| $150,000 to $199,999 | 0 | 0.0% |
| $200,000+ | 0 | 0.0% |
Household Income by Householder Age in Miranda
The median household income in Miranda is $0, with the highest median household income of $76,438 found in the 25 to 44 years age bracket for the primary householder. A total of 106 households (42.7%) fall into this category. Meanwhile, the 15 to 24 years age bracket for the primary householder has the lowest median household income of $0, with 52 households (21.0%) in this group.
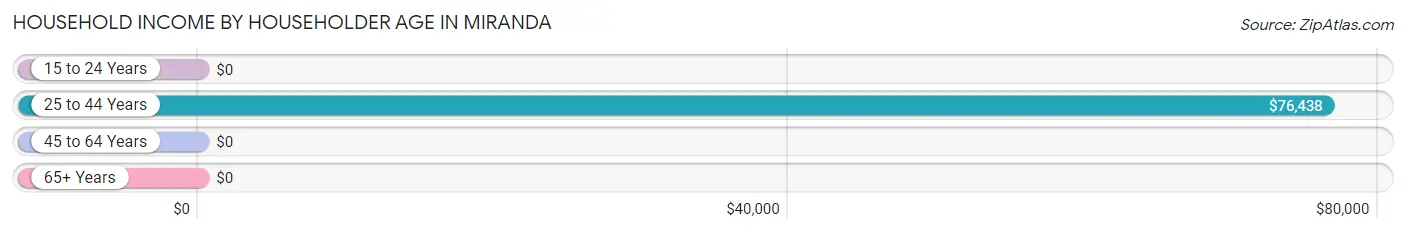
| Income Bracket | # Households | Median Income |
| 15 to 24 Years | 52 (21.0%) | $0 |
| 25 to 44 Years | 106 (42.7%) | $76,438 |
| 45 to 64 Years | 0 (0.0%) | $0 |
| 65+ Years | 90 (36.3%) | $0 |
| Total | 248 (100.0%) | $0 |
Poverty in Miranda
Income Below Poverty by Sex and Age in Miranda
With 35.3% poverty level for males and 76.0% for females among the residents of Miranda, 18 to 24 year old males and 5 year old females are the most vulnerable to poverty, with 52 males (100.0%) and 37 females (100.0%) in their respective age groups living below the poverty level.
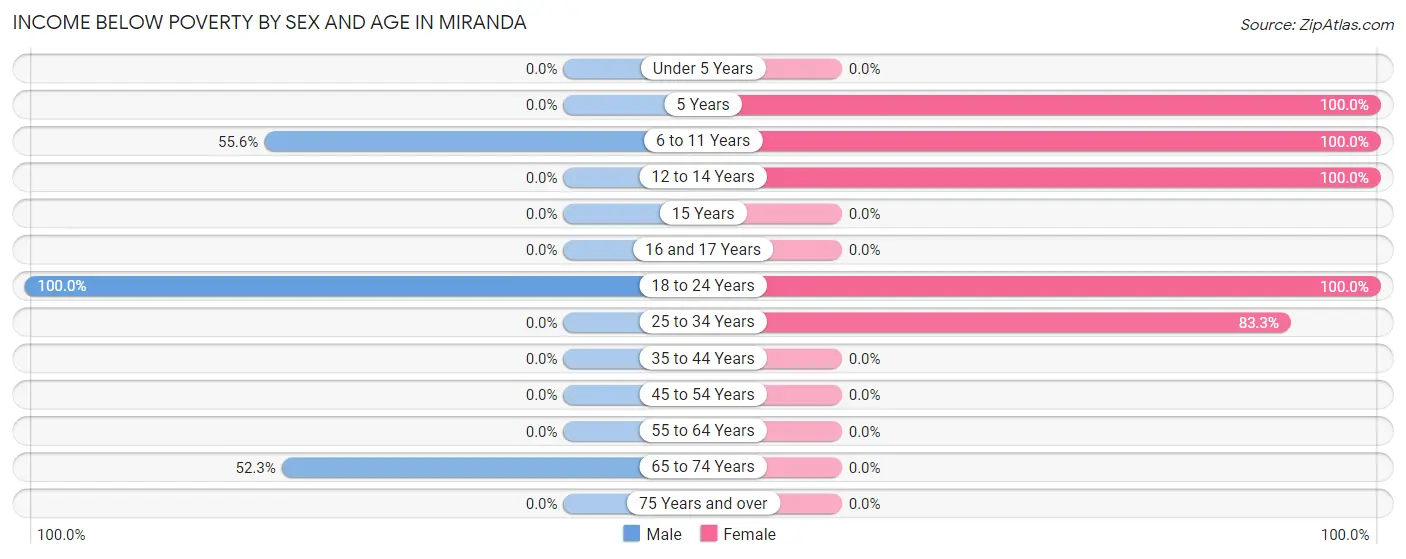
| Age Bracket | Male | Female |
| Under 5 Years | 0 (0.0%) | 0 (0.0%) |
| 5 Years | 0 (0.0%) | 37 (100.0%) |
| 6 to 11 Years | 35 (55.6%) | 35 (100.0%) |
| 12 to 14 Years | 0 (0.0%) | 70 (100.0%) |
| 15 Years | 0 (0.0%) | 0 (0.0%) |
| 16 and 17 Years | 0 (0.0%) | 0 (0.0%) |
| 18 to 24 Years | 52 (100.0%) | 66 (100.0%) |
| 25 to 34 Years | 0 (0.0%) | 30 (83.3%) |
| 35 to 44 Years | 0 (0.0%) | 0 (0.0%) |
| 45 to 54 Years | 0 (0.0%) | 0 (0.0%) |
| 55 to 64 Years | 0 (0.0%) | 0 (0.0%) |
| 65 to 74 Years | 34 (52.3%) | 0 (0.0%) |
| 75 Years and over | 0 (0.0%) | 0 (0.0%) |
| Total | 121 (35.3%) | 238 (76.0%) |
Income Above Poverty by Sex and Age in Miranda
According to the poverty statistics in Miranda, males aged under 5 years and females aged 35 to 44 years are the age groups that are most secure financially, with 100.0% of males and 100.0% of females in these age groups living above the poverty line.
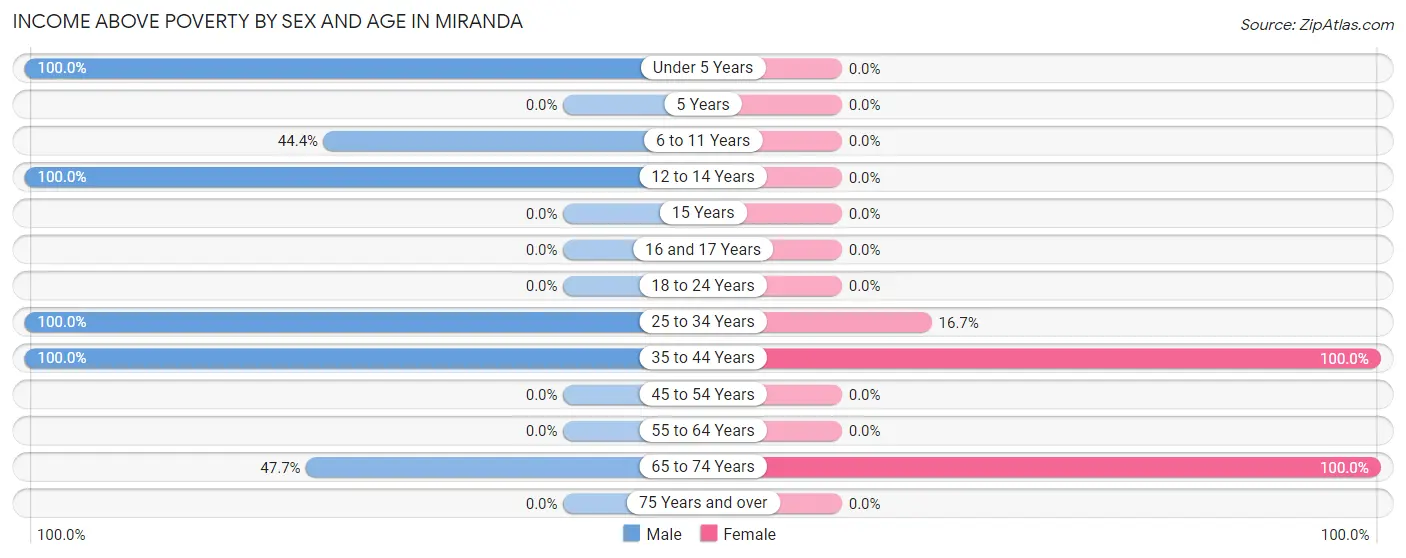
| Age Bracket | Male | Female |
| Under 5 Years | 32 (100.0%) | 0 (0.0%) |
| 5 Years | 0 (0.0%) | 0 (0.0%) |
| 6 to 11 Years | 28 (44.4%) | 0 (0.0%) |
| 12 to 14 Years | 28 (100.0%) | 0 (0.0%) |
| 15 Years | 0 (0.0%) | 0 (0.0%) |
| 16 and 17 Years | 0 (0.0%) | 0 (0.0%) |
| 18 to 24 Years | 0 (0.0%) | 0 (0.0%) |
| 25 to 34 Years | 71 (100.0%) | 6 (16.7%) |
| 35 to 44 Years | 32 (100.0%) | 44 (100.0%) |
| 45 to 54 Years | 0 (0.0%) | 0 (0.0%) |
| 55 to 64 Years | 0 (0.0%) | 0 (0.0%) |
| 65 to 74 Years | 31 (47.7%) | 25 (100.0%) |
| 75 Years and over | 0 (0.0%) | 0 (0.0%) |
| Total | 222 (64.7%) | 75 (24.0%) |
Income Below Poverty Among Married-Couple Families in Miranda
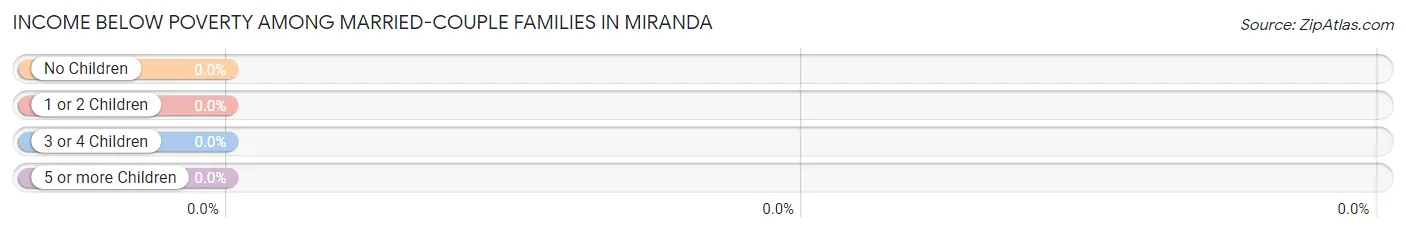
| Children | Above Poverty | Below Poverty |
| No Children | 0 (0.0%) | 0 (0.0%) |
| 1 or 2 Children | 0 (0.0%) | 0 (0.0%) |
| 3 or 4 Children | 36 (100.0%) | 0 (0.0%) |
| 5 or more Children | 0 (0.0%) | 0 (0.0%) |
| Total | 36 (100.0%) | 0 (0.0%) |
Income Below Poverty Among Single-Parent Households in Miranda
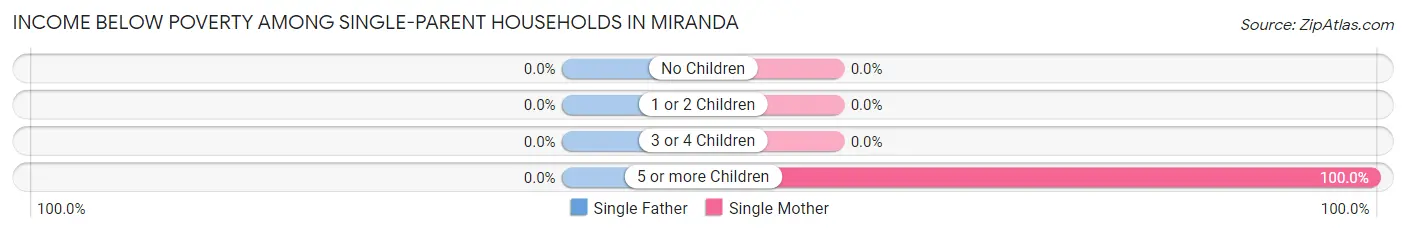
| Children | Single Father | Single Mother |
| No Children | 0 (0.0%) | 0 (0.0%) |
| 1 or 2 Children | 0 (0.0%) | 0 (0.0%) |
| 3 or 4 Children | 0 (0.0%) | 0 (0.0%) |
| 5 or more Children | 0 (0.0%) | 30 (100.0%) |
| Total | 0 (0.0%) | 30 (100.0%) |
Income Below Poverty Among Married-Couple vs Single-Parent Households in Miranda
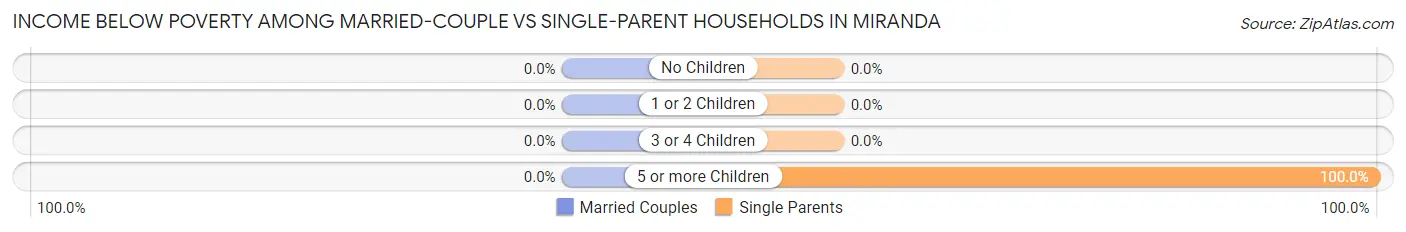
| Children | Married-Couple Families | Single-Parent Households |
| No Children | 0 (0.0%) | 0 (0.0%) |
| 1 or 2 Children | 0 (0.0%) | 0 (0.0%) |
| 3 or 4 Children | 0 (0.0%) | 0 (0.0%) |
| 5 or more Children | 0 (0.0%) | 30 (100.0%) |
| Total | 0 (0.0%) | 30 (100.0%) |
Race in Miranda
The most populous races in Miranda are White / Caucasian (330 | 50.3%), Two or more Races (170 | 25.9%), and Hispanic or Latino (156 | 23.8%).
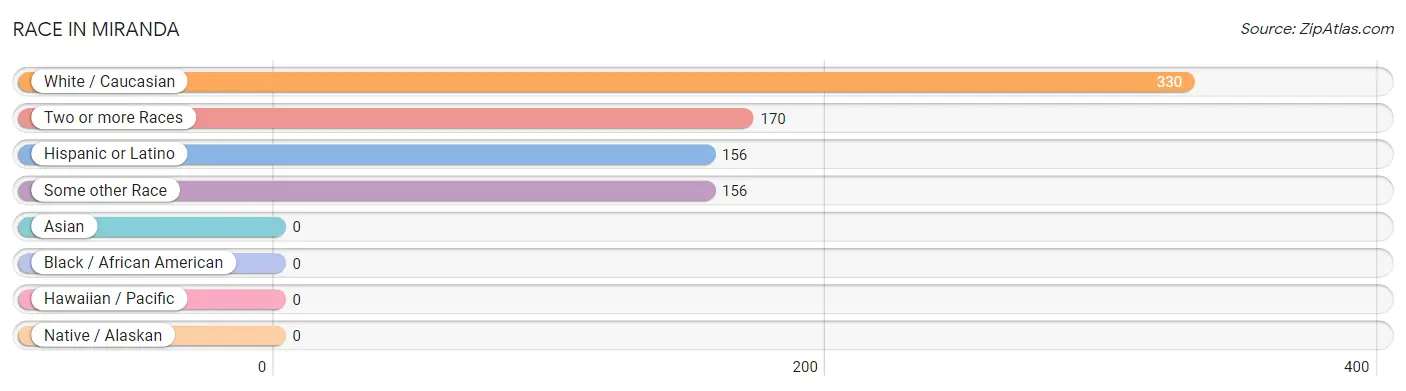
| Race | # Population | % Population |
| Asian | 0 | 0.0% |
| Black / African American | 0 | 0.0% |
| Hawaiian / Pacific | 0 | 0.0% |
| Hispanic or Latino | 156 | 23.8% |
| Native / Alaskan | 0 | 0.0% |
| White / Caucasian | 330 | 50.3% |
| Two or more Races | 170 | 25.9% |
| Some other Race | 156 | 23.8% |
| Total | 656 | 100.0% |
Ancestry in Miranda
The most populous ancestries reported in Miranda are German (291 | 44.4%), Iroquois (170 | 25.9%), Mexican (156 | 23.8%), Irish (140 | 21.3%), and Scottish (68 | 10.4%), together accounting for 125.8% of all Miranda residents.
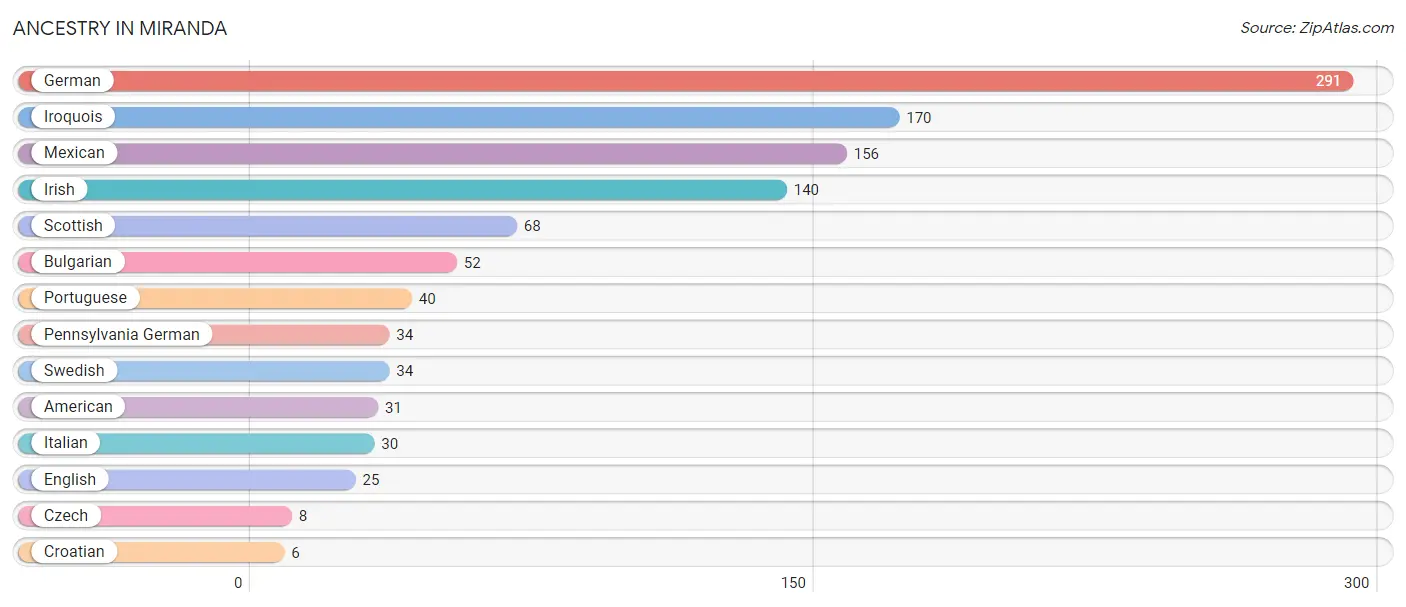
| Ancestry | # Population | % Population |
| American | 31 | 4.7% |
| Bulgarian | 52 | 7.9% |
| Croatian | 6 | 0.9% |
| Czech | 8 | 1.2% |
| English | 25 | 3.8% |
| German | 291 | 44.4% |
| Irish | 140 | 21.3% |
| Iroquois | 170 | 25.9% |
| Italian | 30 | 4.6% |
| Mexican | 156 | 23.8% |
| Pennsylvania German | 34 | 5.2% |
| Portuguese | 40 | 6.1% |
| Scottish | 68 | 10.4% |
| Swedish | 34 | 5.2% | View All 14 Rows |
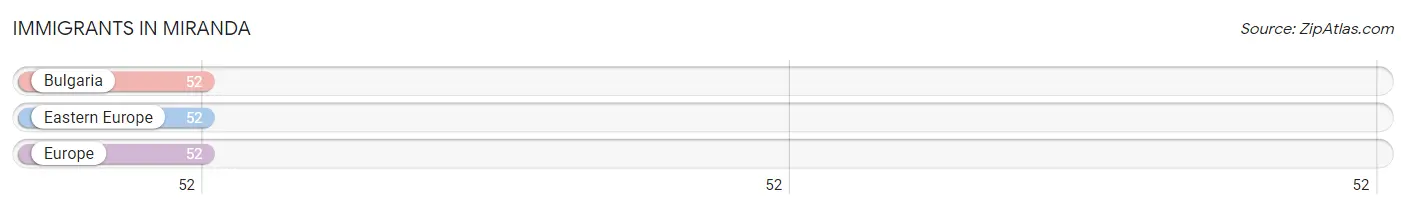
Immigrants in Miranda
The most numerous immigrant groups reported in Miranda came from Bulgaria (52 | 7.9%), Eastern Europe (52 | 7.9%), and Europe (52 | 7.9%), together accounting for 23.8% of all Miranda residents.
| Immigration Origin | # Population | % Population |
| Bulgaria | 52 | 7.9% |
| Eastern Europe | 52 | 7.9% |
| Europe | 52 | 7.9% | View All 3 Rows |
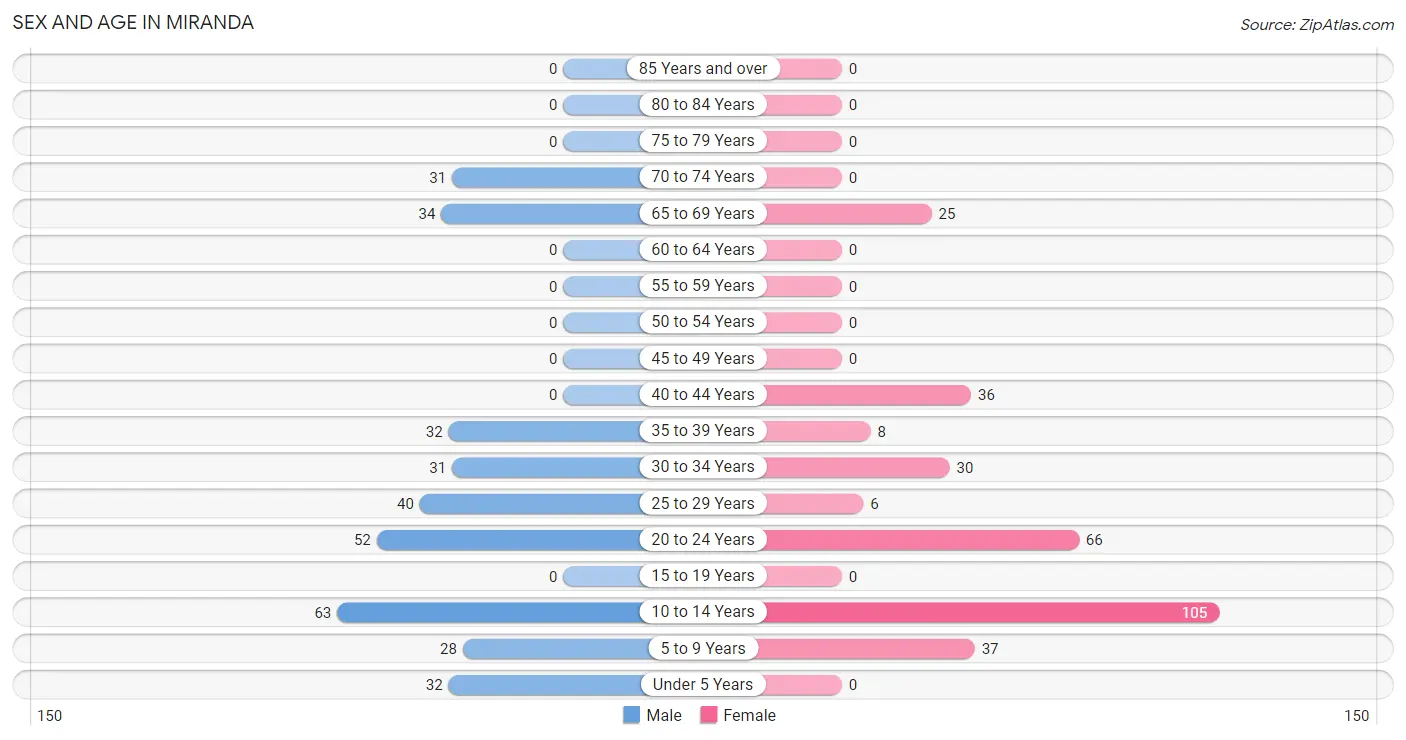
Sex and Age in Miranda
Sex and Age in Miranda
The most populous age groups in Miranda are 10 to 14 Years (63 | 18.4%) for men and 10 to 14 Years (105 | 33.6%) for women.
| Age Bracket | Male | Female |
| Under 5 Years | 32 (9.3%) | 0 (0.0%) |
| 5 to 9 Years | 28 (8.2%) | 37 (11.8%) |
| 10 to 14 Years | 63 (18.4%) | 105 (33.6%) |
| 15 to 19 Years | 0 (0.0%) | 0 (0.0%) |
| 20 to 24 Years | 52 (15.2%) | 66 (21.1%) |
| 25 to 29 Years | 40 (11.7%) | 6 (1.9%) |
| 30 to 34 Years | 31 (9.0%) | 30 (9.6%) |
| 35 to 39 Years | 32 (9.3%) | 8 (2.6%) |
| 40 to 44 Years | 0 (0.0%) | 36 (11.5%) |
| 45 to 49 Years | 0 (0.0%) | 0 (0.0%) |
| 50 to 54 Years | 0 (0.0%) | 0 (0.0%) |
| 55 to 59 Years | 0 (0.0%) | 0 (0.0%) |
| 60 to 64 Years | 0 (0.0%) | 0 (0.0%) |
| 65 to 69 Years | 34 (9.9%) | 25 (8.0%) |
| 70 to 74 Years | 31 (9.0%) | 0 (0.0%) |
| 75 to 79 Years | 0 (0.0%) | 0 (0.0%) |
| 80 to 84 Years | 0 (0.0%) | 0 (0.0%) |
| 85 Years and over | 0 (0.0%) | 0 (0.0%) |
| Total | 343 (100.0%) | 313 (100.0%) |
Families and Households in Miranda
Median Family Size in Miranda
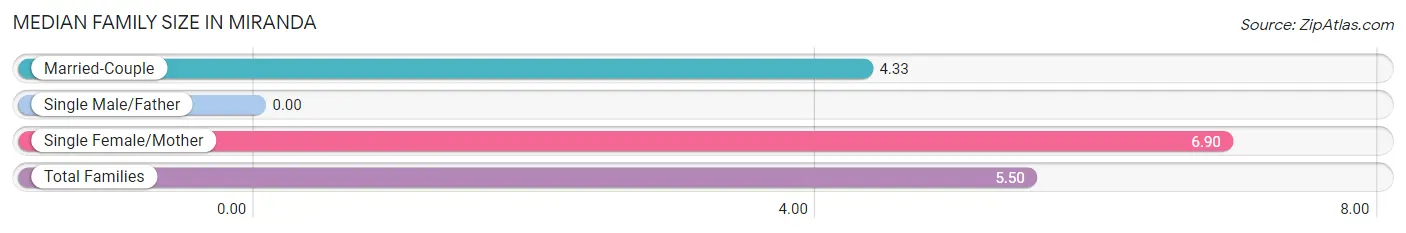
| Family Type | # Families | Family Size |
| Married-Couple | 36 (54.5%) | 4.33 |
| Single Male/Father | 0 (0.0%) | - |
| Single Female/Mother | 30 (45.5%) | 6.90 |
| Total Families | 66 (100.0%) | 5.50 |
Median Household Size in Miranda
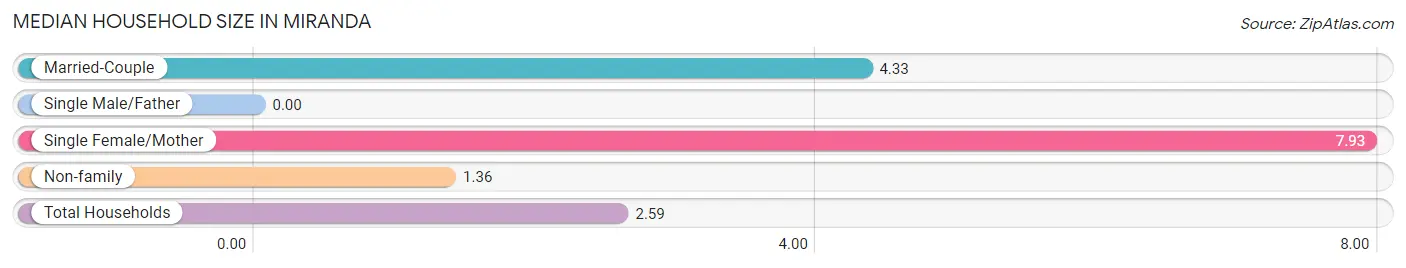
| Household Type | # Households | Household Size |
| Married-Couple | 36 (14.5%) | 4.33 |
| Single Male/Father | 0 (0.0%) | - |
| Single Female/Mother | 30 (12.1%) | 7.93 |
| Non-family | 182 (73.4%) | 1.36 |
| Total Households | 248 (100.0%) | 2.59 |
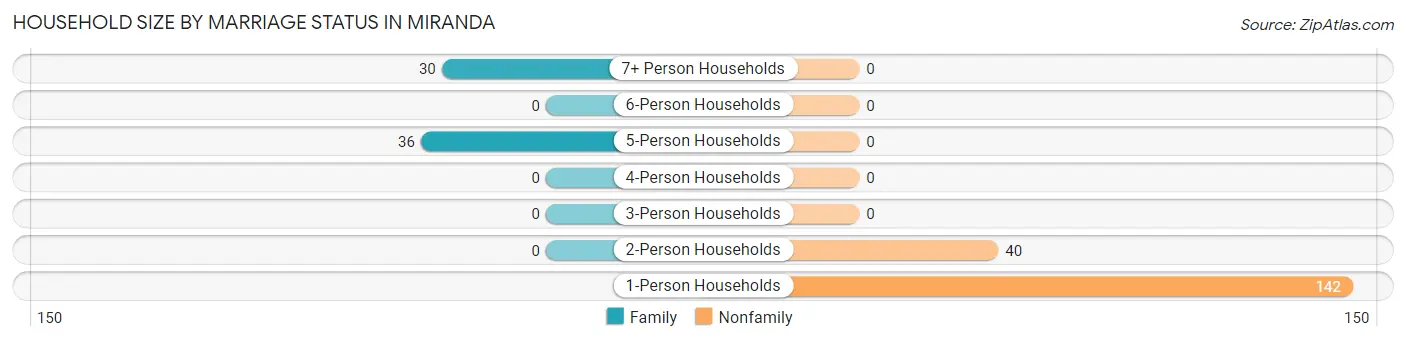
Household Size by Marriage Status in Miranda
Out of a total of 248 households in Miranda, 66 (26.6%) are family households, while 182 (73.4%) are nonfamily households. The most numerous type of family households are 5-person households, comprising 36, and the most common type of nonfamily households are 1-person households, comprising 142.
| Household Size | Family Households | Nonfamily Households |
| 1-Person Households | - | 142 (57.3%) |
| 2-Person Households | 0 (0.0%) | 40 (16.1%) |
| 3-Person Households | 0 (0.0%) | 0 (0.0%) |
| 4-Person Households | 0 (0.0%) | 0 (0.0%) |
| 5-Person Households | 36 (14.5%) | 0 (0.0%) |
| 6-Person Households | 0 (0.0%) | 0 (0.0%) |
| 7+ Person Households | 30 (12.1%) | 0 (0.0%) |
| Total | 66 (26.6%) | 182 (73.4%) |
Female Fertility in Miranda
Fertility by Age in Miranda
| Age Bracket | Women with Births | Births / 1,000 Women |
| 15 to 19 years | 0 (0.0%) | 0.0 |
| 20 to 34 years | 0 (0.0%) | 0.0 |
| 35 to 50 years | 0 (0.0%) | 0.0 |
| Total | 0 (0.0%) | 0.0 |
Fertility by Age by Marriage Status in Miranda
| Age Bracket | Married | Unmarried |
| 15 to 19 years | 0 (0.0%) | 0 (0.0%) |
| 20 to 34 years | 0 (0.0%) | 0 (0.0%) |
| 35 to 50 years | 0 (0.0%) | 0 (0.0%) |
| Total | 0 (0.0%) | 0 (0.0%) |
Fertility by Education in Miranda
| Educational Attainment | Women with Births | Births / 1,000 Women |
| Less than High School | 0 (0.0%) | 0.0 |
| High School Diploma | 0 (0.0%) | 0.0 |
| College or Associate's Degree | 0 (0.0%) | 0.0 |
| Bachelor's Degree | 0 (0.0%) | 0.0 |
| Graduate Degree | 0 (0.0%) | 0.0 |
| Total | 0 (0.0%) | 0.0 |
Fertility by Education by Marriage Status in Miranda
| Educational Attainment | Married | Unmarried |
| Less than High School | 0 (0.0%) | 0 (0.0%) |
| High School Diploma | 0 (0.0%) | 0 (0.0%) |
| College or Associate's Degree | 0 (0.0%) | 0 (0.0%) |
| Bachelor's Degree | 0 (0.0%) | 0 (0.0%) |
| Graduate Degree | 0 (0.0%) | 0 (0.0%) |
| Total | 0 (0.0%) | 0 (0.0%) |
Employment Characteristics in Miranda
Employment by Class of Employer in Miranda
Among the 208 employed individuals in Miranda, private company employees (97 | 46.6%), self-employed (not incorporated) (72 | 34.6%), and local government employees (25 | 12.0%) make up the most common classes of employment.
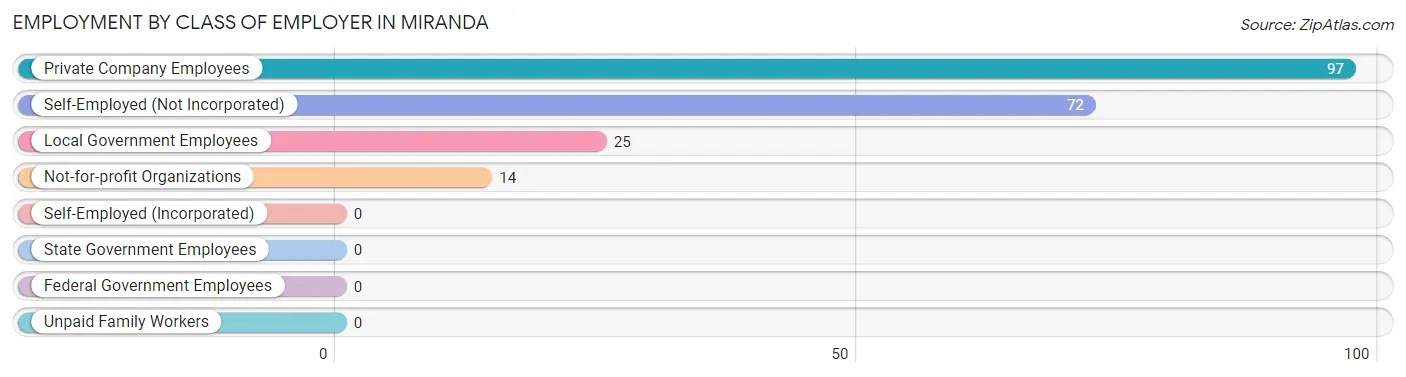
| Employer Class | # Employees | % Employees |
| Private Company Employees | 97 | 46.6% |
| Self-Employed (Incorporated) | 0 | 0.0% |
| Self-Employed (Not Incorporated) | 72 | 34.6% |
| Not-for-profit Organizations | 14 | 6.7% |
| Local Government Employees | 25 | 12.0% |
| State Government Employees | 0 | 0.0% |
| Federal Government Employees | 0 | 0.0% |
| Unpaid Family Workers | 0 | 0.0% |
| Total | 208 | 100.0% |
Employment Status by Age in Miranda
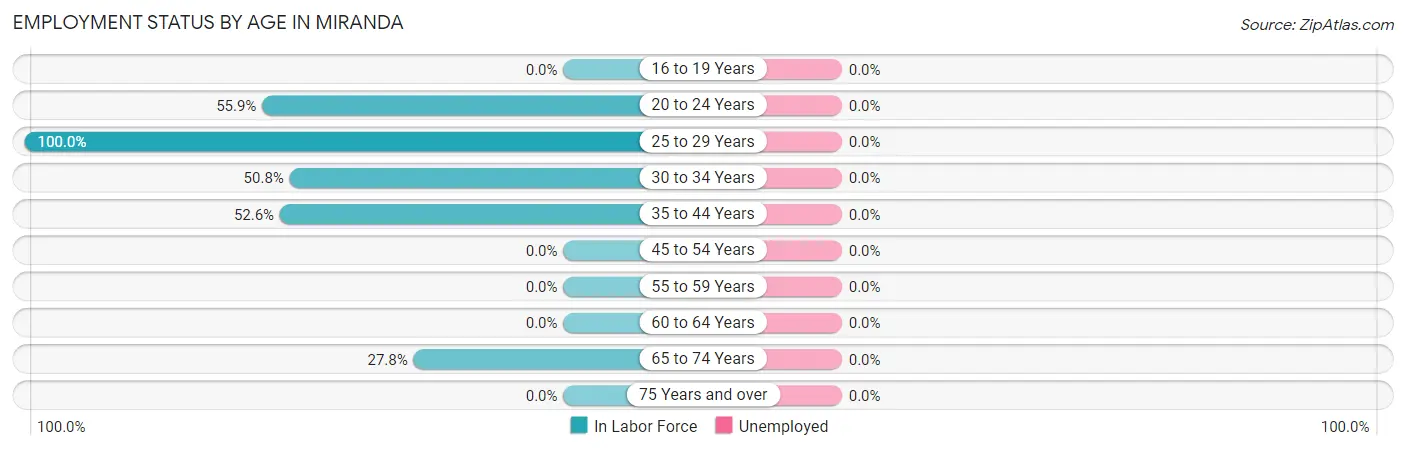
| Age Bracket | In Labor Force | Unemployed |
| 16 to 19 Years | 0 (0.0%) | 0 (0.0%) |
| 20 to 24 Years | 66 (55.9%) | 0 (0.0%) |
| 25 to 29 Years | 46 (100.0%) | 0 (0.0%) |
| 30 to 34 Years | 31 (50.8%) | 0 (0.0%) |
| 35 to 44 Years | 40 (52.6%) | 0 (0.0%) |
| 45 to 54 Years | 0 (0.0%) | 0 (0.0%) |
| 55 to 59 Years | 0 (0.0%) | 0 (0.0%) |
| 60 to 64 Years | 0 (0.0%) | 0 (0.0%) |
| 65 to 74 Years | 25 (27.8%) | 0 (0.0%) |
| 75 Years and over | 0 (0.0%) | 0 (0.0%) |
| Total | 208 (53.2%) | 0 (0.0%) |
Employment Status by Educational Attainment in Miranda
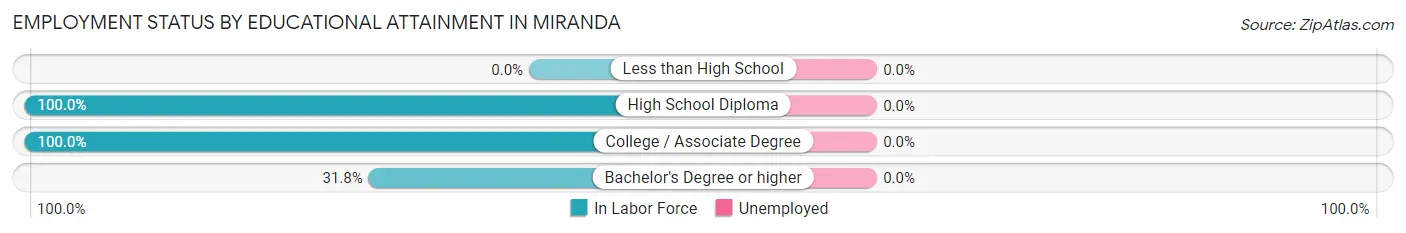
| Educational Attainment | In Labor Force | Unemployed |
| Less than High School | 0 (0.0%) | 0 (0.0%) |
| High School Diploma | 71 (100.0%) | 0 (0.0%) |
| College / Associate Degree | 32 (100.0%) | 0 (0.0%) |
| Bachelor's Degree or higher | 14 (31.8%) | 0 (0.0%) |
| Total | 117 (63.9%) | 0 (0.0%) |
Employment Occupations by Sex in Miranda
Management, Business, Science and Arts Occupations
The most common Management, Business, Science and Arts occupations in Miranda are Management (80 | 38.5%), Community & Social Service (6 | 2.9%), and Education Instruction & Library (6 | 2.9%).
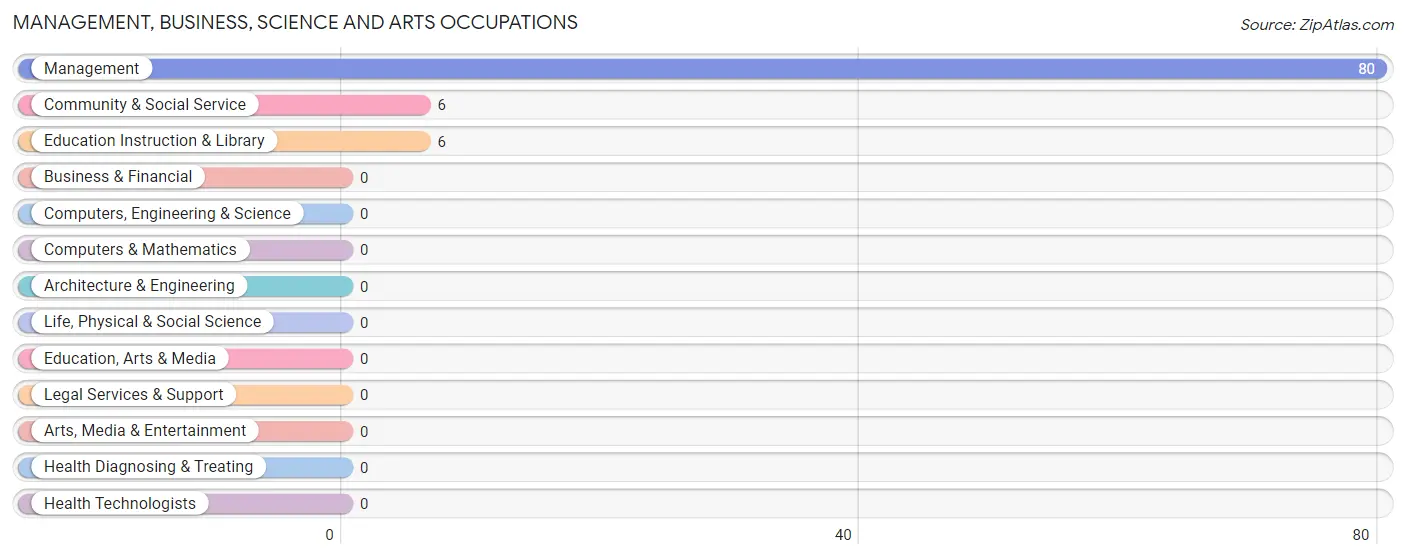
Management, Business, Science and Arts Occupations by Sex
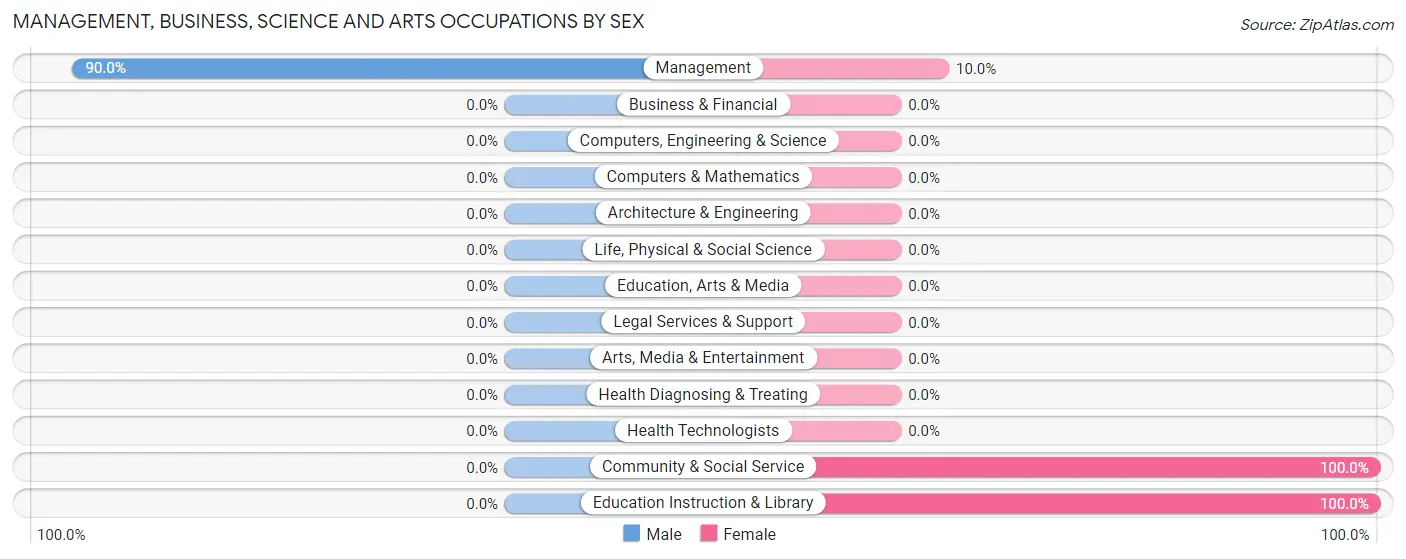
| Occupation | Male | Female |
| Management | 72 (90.0%) | 8 (10.0%) |
| Business & Financial | 0 (0.0%) | 0 (0.0%) |
| Computers, Engineering & Science | 0 (0.0%) | 0 (0.0%) |
| Computers & Mathematics | 0 (0.0%) | 0 (0.0%) |
| Architecture & Engineering | 0 (0.0%) | 0 (0.0%) |
| Life, Physical & Social Science | 0 (0.0%) | 0 (0.0%) |
| Community & Social Service | 0 (0.0%) | 6 (100.0%) |
| Education, Arts & Media | 0 (0.0%) | 0 (0.0%) |
| Legal Services & Support | 0 (0.0%) | 0 (0.0%) |
| Education Instruction & Library | 0 (0.0%) | 6 (100.0%) |
| Arts, Media & Entertainment | 0 (0.0%) | 0 (0.0%) |
| Health Diagnosing & Treating | 0 (0.0%) | 0 (0.0%) |
| Health Technologists | 0 (0.0%) | 0 (0.0%) |
| Total (Category) | 72 (83.7%) | 14 (16.3%) |
| Total (Overall) | 103 (49.5%) | 105 (50.5%) |
Services Occupations
The most common Services occupations in Miranda are Food Preparation & Serving (66 | 31.7%), and Cleaning & Maintenance (31 | 14.9%).
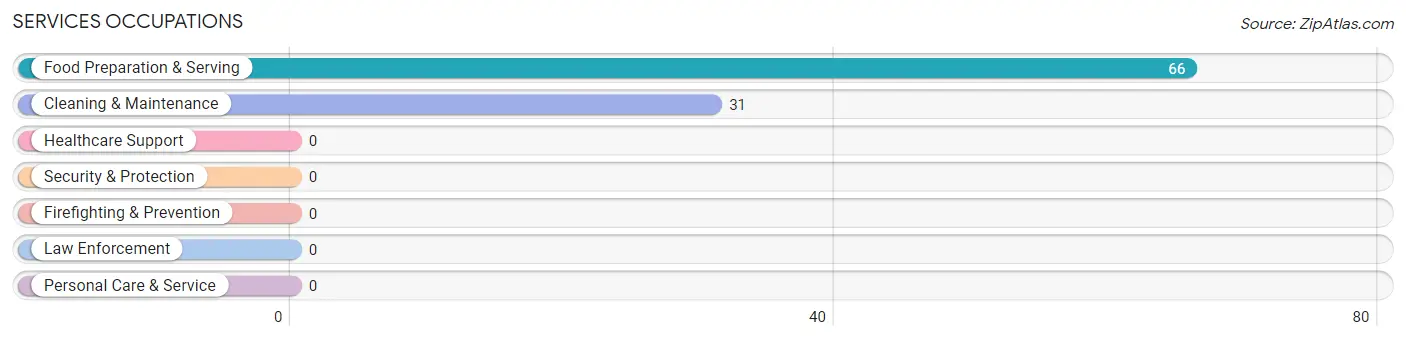
Services Occupations by Sex
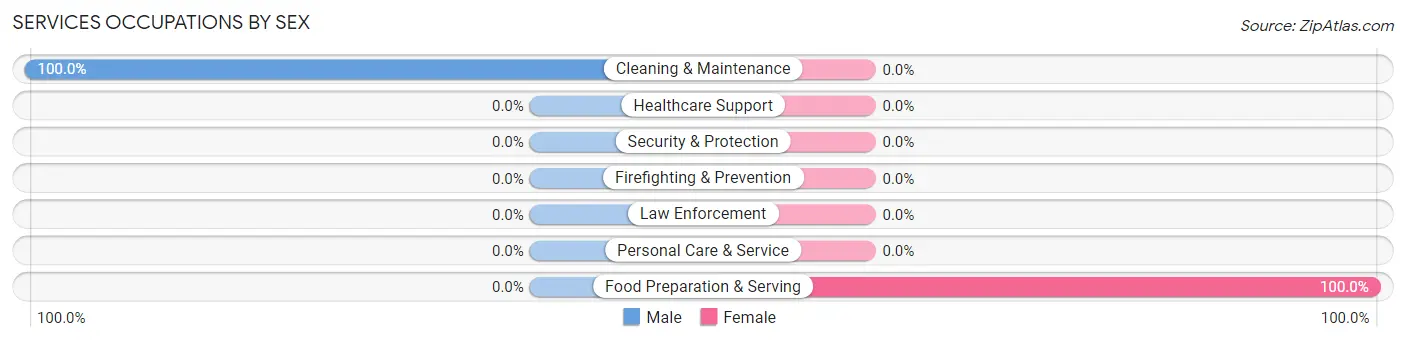
| Occupation | Male | Female |
| Healthcare Support | 0 (0.0%) | 0 (0.0%) |
| Security & Protection | 0 (0.0%) | 0 (0.0%) |
| Firefighting & Prevention | 0 (0.0%) | 0 (0.0%) |
| Law Enforcement | 0 (0.0%) | 0 (0.0%) |
| Food Preparation & Serving | 0 (0.0%) | 66 (100.0%) |
| Cleaning & Maintenance | 31 (100.0%) | 0 (0.0%) |
| Personal Care & Service | 0 (0.0%) | 0 (0.0%) |
| Total (Category) | 31 (32.0%) | 66 (68.0%) |
| Total (Overall) | 103 (49.5%) | 105 (50.5%) |
Sales and Office Occupations
The most common Sales and Office occupations in Miranda are , and Office & Administration (25 | 12.0%).
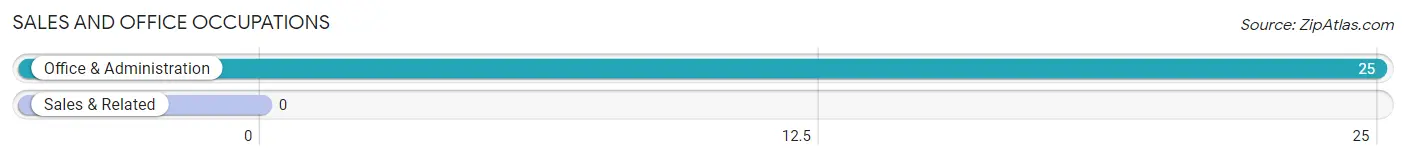
Sales and Office Occupations by Sex
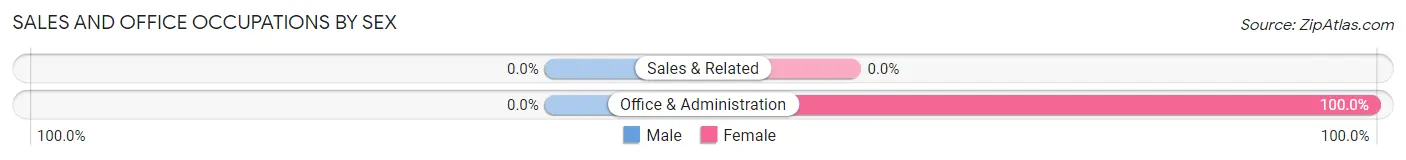
| Occupation | Male | Female |
| Sales & Related | 0 (0.0%) | 0 (0.0%) |
| Office & Administration | 0 (0.0%) | 25 (100.0%) |
| Total (Category) | 0 (0.0%) | 25 (100.0%) |
| Total (Overall) | 103 (49.5%) | 105 (50.5%) |
Natural Resources, Construction and Maintenance Occupations
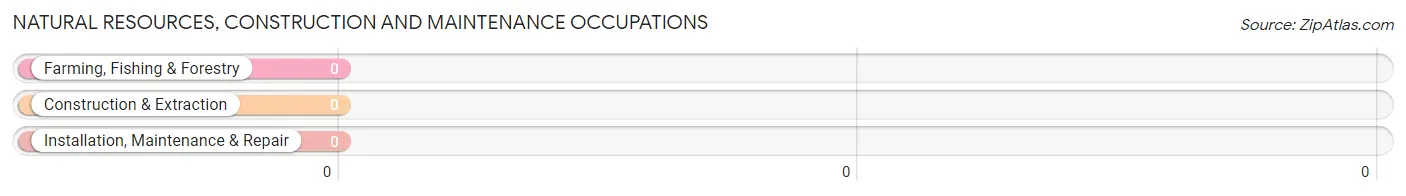
Natural Resources, Construction and Maintenance Occupations by Sex
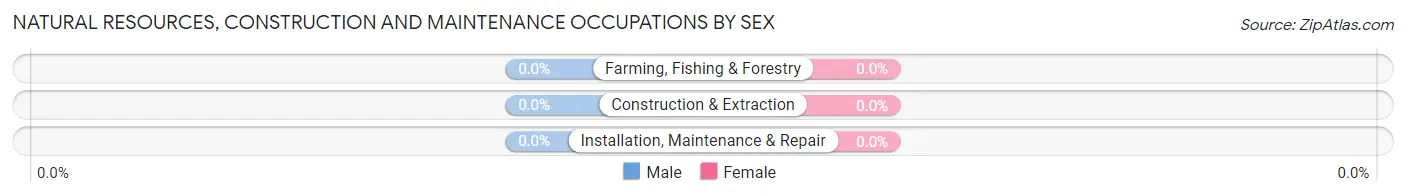
| Occupation | Male | Female |
| Farming, Fishing & Forestry | 0 (0.0%) | 0 (0.0%) |
| Construction & Extraction | 0 (0.0%) | 0 (0.0%) |
| Installation, Maintenance & Repair | 0 (0.0%) | 0 (0.0%) |
| Total (Category) | 0 (0.0%) | 0 (0.0%) |
| Total (Overall) | 103 (49.5%) | 105 (50.5%) |
Production, Transportation and Moving Occupations
Production, Transportation and Moving Occupations by Sex
| Occupation | Male | Female |
| Production | 0 (0.0%) | 0 (0.0%) |
| Transportation | 0 (0.0%) | 0 (0.0%) |
| Material Moving | 0 (0.0%) | 0 (0.0%) |
| Total (Category) | 0 (0.0%) | 0 (0.0%) |
| Total (Overall) | 103 (49.5%) | 105 (50.5%) |
Employment Industries by Sex in Miranda
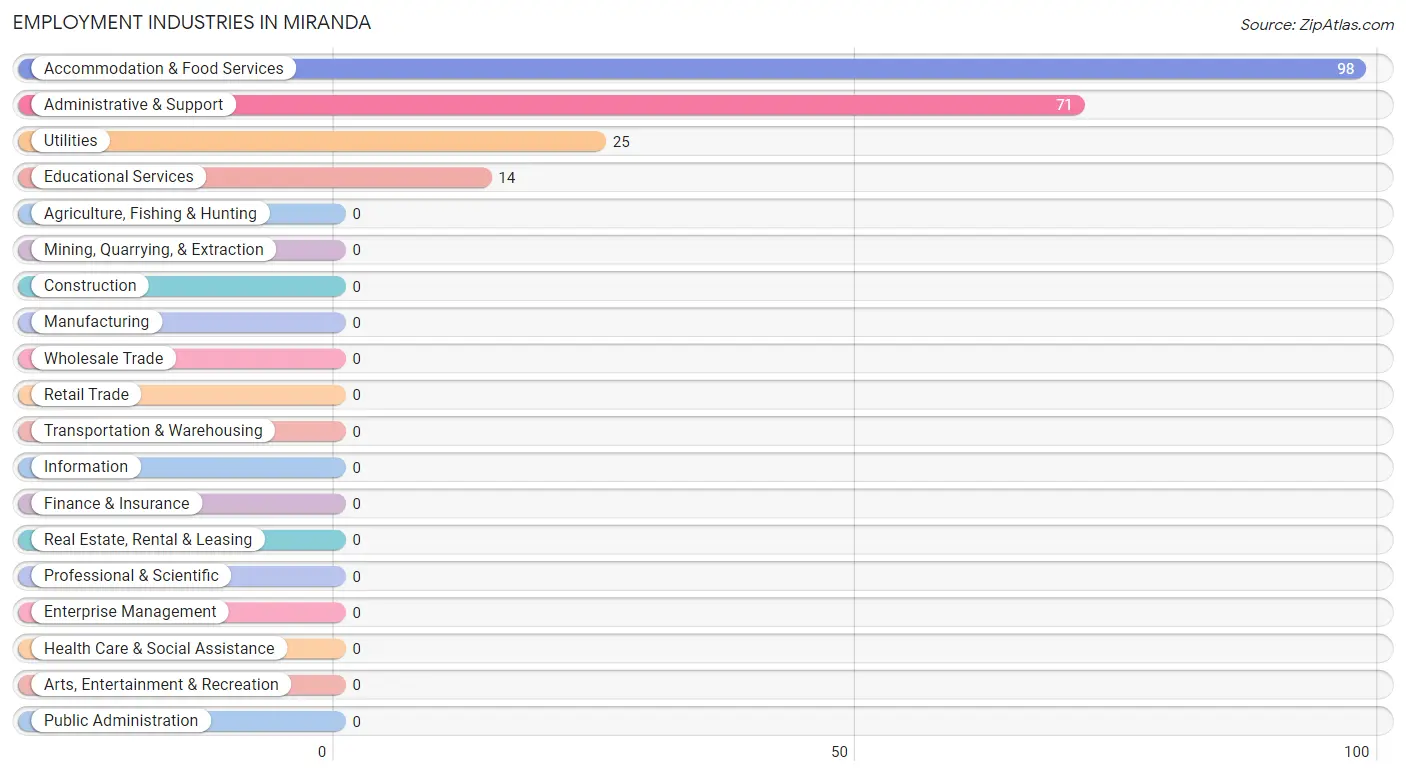
Employment Industries in Miranda
The major employment industries in Miranda include Accommodation & Food Services (98 | 47.1%), Administrative & Support (71 | 34.1%), Utilities (25 | 12.0%), and Educational Services (14 | 6.7%).
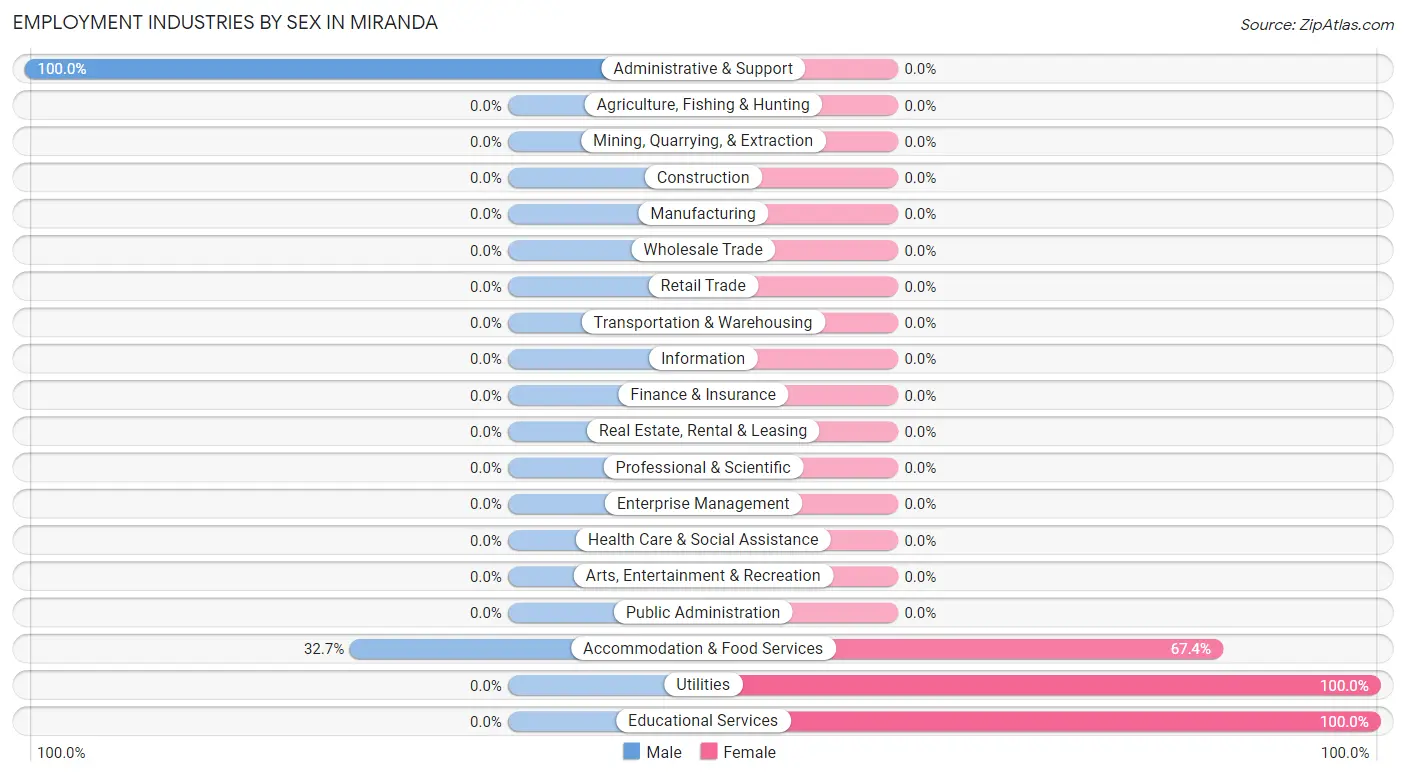
Employment Industries by Sex in Miranda
The Miranda industries that see more men than women are Administrative & Support (100.0%), and Accommodation & Food Services (32.7%), whereas the industries that tend to have a higher number of women are Utilities (100.0%), Educational Services (100.0%), and Accommodation & Food Services (67.3%).
| Industry | Male | Female |
| Agriculture, Fishing & Hunting | 0 (0.0%) | 0 (0.0%) |
| Mining, Quarrying, & Extraction | 0 (0.0%) | 0 (0.0%) |
| Construction | 0 (0.0%) | 0 (0.0%) |
| Manufacturing | 0 (0.0%) | 0 (0.0%) |
| Wholesale Trade | 0 (0.0%) | 0 (0.0%) |
| Retail Trade | 0 (0.0%) | 0 (0.0%) |
| Transportation & Warehousing | 0 (0.0%) | 0 (0.0%) |
| Utilities | 0 (0.0%) | 25 (100.0%) |
| Information | 0 (0.0%) | 0 (0.0%) |
| Finance & Insurance | 0 (0.0%) | 0 (0.0%) |
| Real Estate, Rental & Leasing | 0 (0.0%) | 0 (0.0%) |
| Professional & Scientific | 0 (0.0%) | 0 (0.0%) |
| Enterprise Management | 0 (0.0%) | 0 (0.0%) |
| Administrative & Support | 71 (100.0%) | 0 (0.0%) |
| Educational Services | 0 (0.0%) | 14 (100.0%) |
| Health Care & Social Assistance | 0 (0.0%) | 0 (0.0%) |
| Arts, Entertainment & Recreation | 0 (0.0%) | 0 (0.0%) |
| Accommodation & Food Services | 32 (32.7%) | 66 (67.3%) |
| Public Administration | 0 (0.0%) | 0 (0.0%) |
| Total | 103 (49.5%) | 105 (50.5%) |
Education in Miranda
School Enrollment in Miranda
The most common levels of schooling among the 263 students in Miranda are middle school (133 | 50.6%), elementary school (63 | 23.9%), and kindergarten (37 | 14.1%).
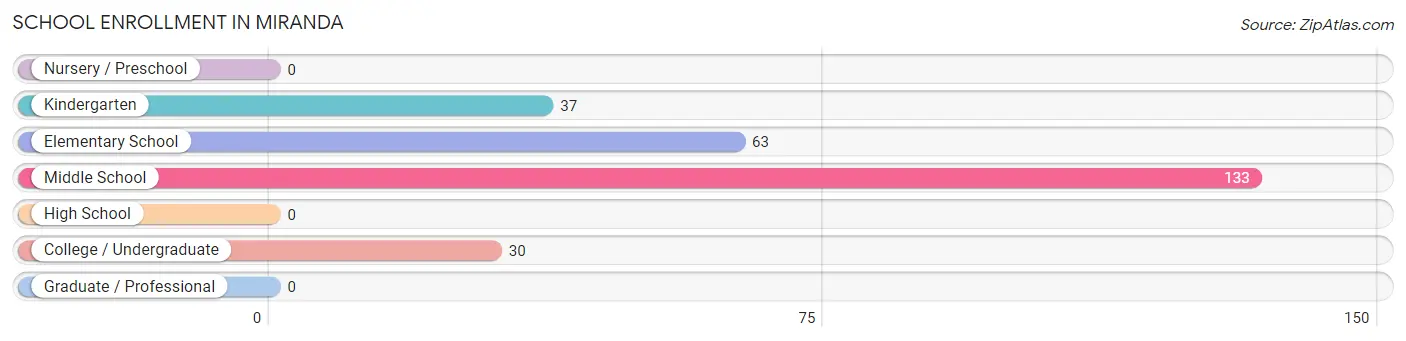
| School Level | # Students | % Students |
| Nursery / Preschool | 0 | 0.0% |
| Kindergarten | 37 | 14.1% |
| Elementary School | 63 | 23.9% |
| Middle School | 133 | 50.6% |
| High School | 0 | 0.0% |
| College / Undergraduate | 30 | 11.4% |
| Graduate / Professional | 0 | 0.0% |
| Total | 263 | 100.0% |
School Enrollment by Age by Funding Source in Miranda
Out of a total of 263 students who are enrolled in schools in Miranda, 28 (10.6%) attend a private institution, while the remaining 235 (89.4%) are enrolled in public schools. The age group of 5 to 9 year old has the highest likelihood of being enrolled in private schools, with 28 (43.1% in the age bracket) enrolled. Conversely, the age group of 10 to 14 year olds has the lowest likelihood of being enrolled in a private school, with 168 (100.0% in the age bracket) attending a public institution.
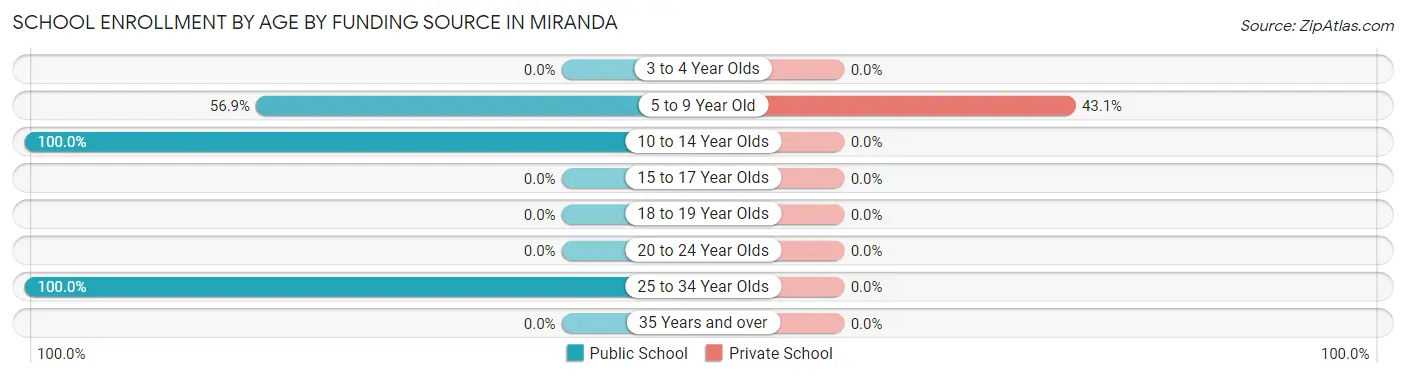
| Age Bracket | Public School | Private School |
| 3 to 4 Year Olds | 0 (0.0%) | 0 (0.0%) |
| 5 to 9 Year Old | 37 (56.9%) | 28 (43.1%) |
| 10 to 14 Year Olds | 168 (100.0%) | 0 (0.0%) |
| 15 to 17 Year Olds | 0 (0.0%) | 0 (0.0%) |
| 18 to 19 Year Olds | 0 (0.0%) | 0 (0.0%) |
| 20 to 24 Year Olds | 0 (0.0%) | 0 (0.0%) |
| 25 to 34 Year Olds | 30 (100.0%) | 0 (0.0%) |
| 35 Years and over | 0 (0.0%) | 0 (0.0%) |
| Total | 235 (89.4%) | 28 (10.6%) |
Educational Attainment by Field of Study in Miranda
Psychology (30 | 68.2%), and visual & performing arts (14 | 31.8%) are the most common fields of study among 44 individuals in Miranda who have obtained a bachelor's degree or higher.
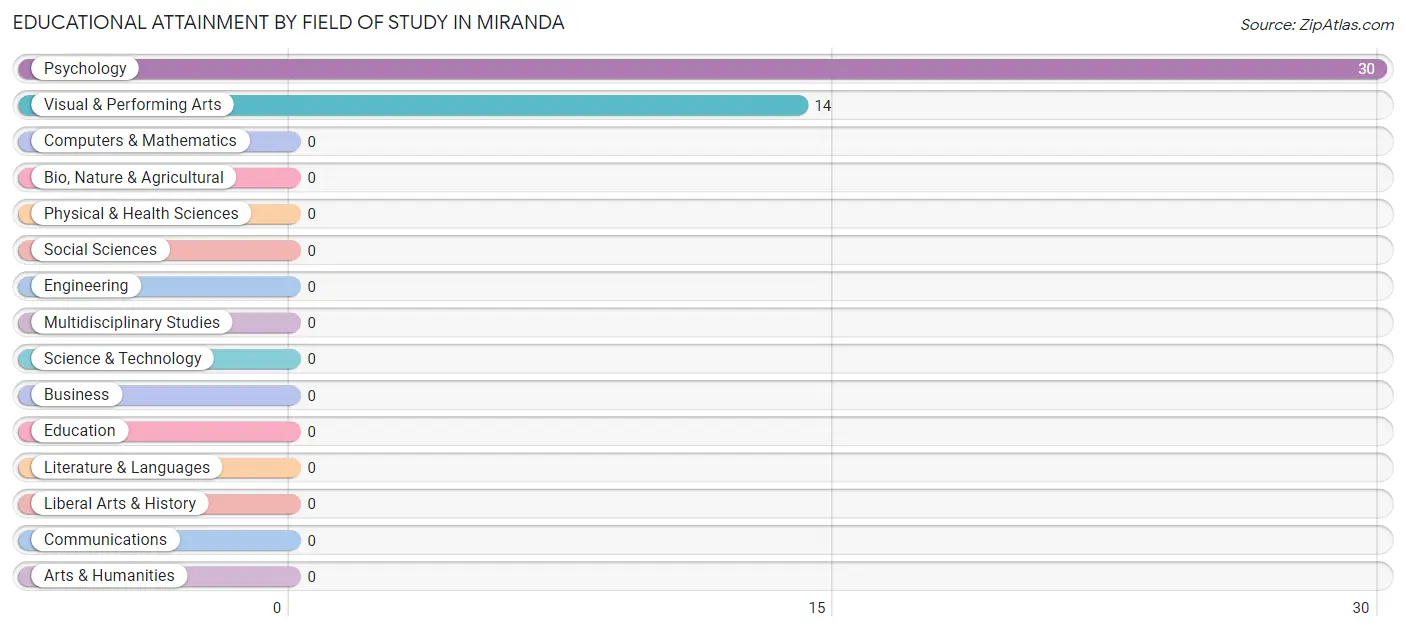
| Field of Study | # Graduates | % Graduates |
| Computers & Mathematics | 0 | 0.0% |
| Bio, Nature & Agricultural | 0 | 0.0% |
| Physical & Health Sciences | 0 | 0.0% |
| Psychology | 30 | 68.2% |
| Social Sciences | 0 | 0.0% |
| Engineering | 0 | 0.0% |
| Multidisciplinary Studies | 0 | 0.0% |
| Science & Technology | 0 | 0.0% |
| Business | 0 | 0.0% |
| Education | 0 | 0.0% |
| Literature & Languages | 0 | 0.0% |
| Liberal Arts & History | 0 | 0.0% |
| Visual & Performing Arts | 14 | 31.8% |
| Communications | 0 | 0.0% |
| Arts & Humanities | 0 | 0.0% |
| Total | 44 | 100.0% |
Transportation & Commute in Miranda
Vehicle Availability by Sex in Miranda
The most prevalent vehicle ownership categories in Miranda are males with 2 vehicles (63, accounting for 61.2%) and females with 2 vehicles (25, making up 69.2%).
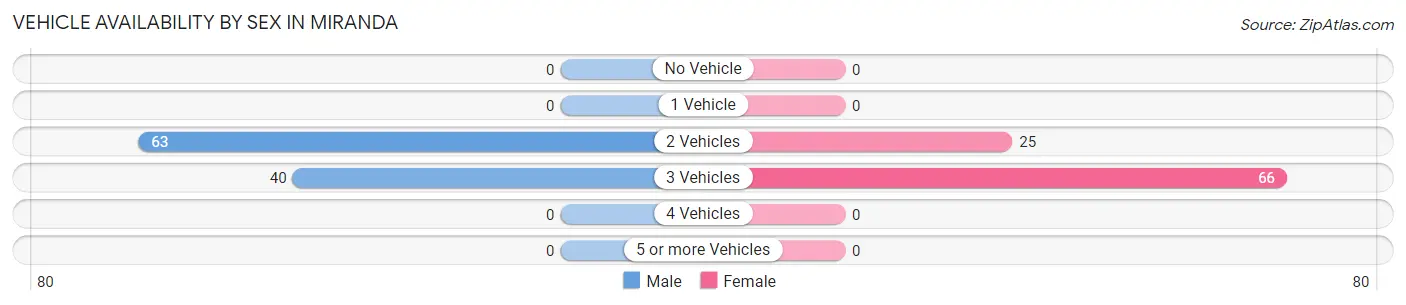
| Vehicles Available | Male | Female |
| No Vehicle | 0 (0.0%) | 0 (0.0%) |
| 1 Vehicle | 0 (0.0%) | 0 (0.0%) |
| 2 Vehicles | 63 (61.2%) | 25 (27.5%) |
| 3 Vehicles | 40 (38.8%) | 66 (72.5%) |
| 4 Vehicles | 0 (0.0%) | 0 (0.0%) |
| 5 or more Vehicles | 0 (0.0%) | 0 (0.0%) |
| Total | 103 (100.0%) | 91 (100.0%) |
Commute Time in Miranda
The most frequently occuring commute durations in Miranda are less than 5 minutes (97 commuters, 48.5%), 15 to 19 minutes (63 commuters, 31.5%), and 60 to 89 minutes (40 commuters, 20.0%).
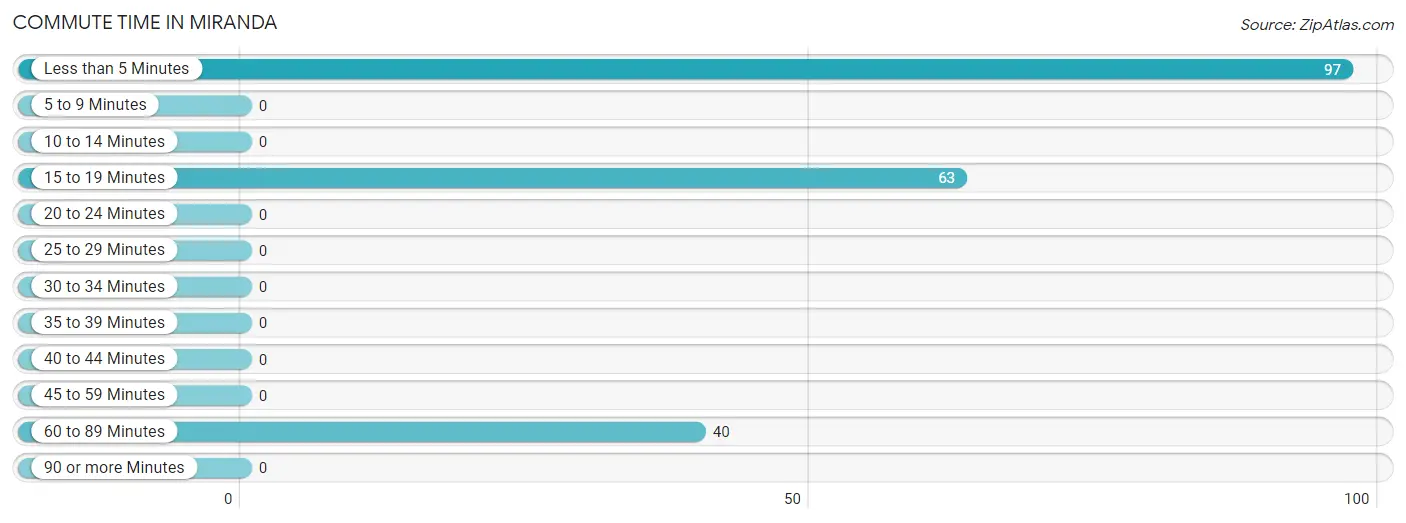
| Commute Time | # Commuters | % Commuters |
| Less than 5 Minutes | 97 | 48.5% |
| 5 to 9 Minutes | 0 | 0.0% |
| 10 to 14 Minutes | 0 | 0.0% |
| 15 to 19 Minutes | 63 | 31.5% |
| 20 to 24 Minutes | 0 | 0.0% |
| 25 to 29 Minutes | 0 | 0.0% |
| 30 to 34 Minutes | 0 | 0.0% |
| 35 to 39 Minutes | 0 | 0.0% |
| 40 to 44 Minutes | 0 | 0.0% |
| 45 to 59 Minutes | 0 | 0.0% |
| 60 to 89 Minutes | 40 | 20.0% |
| 90 or more Minutes | 0 | 0.0% |
Commute Time by Sex in Miranda
The most common commute times in Miranda are 15 to 19 minutes (63 commuters, 61.2%) for males and less than 5 minutes (97 commuters, 100.0%) for females.
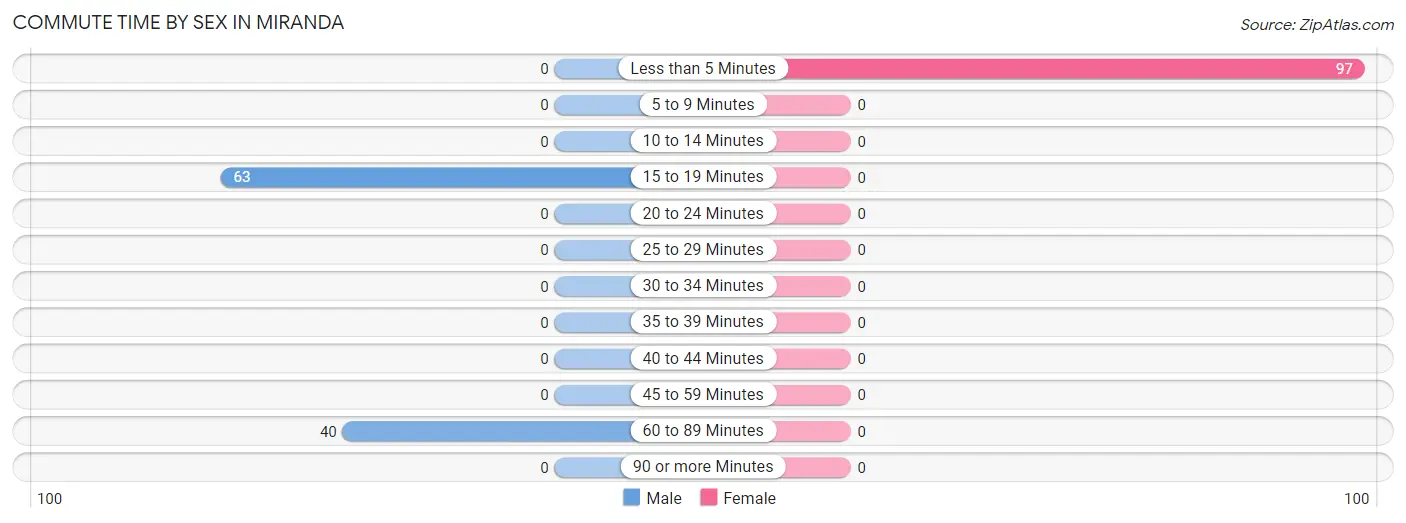
| Commute Time | Male | Female |
| Less than 5 Minutes | 0 (0.0%) | 97 (100.0%) |
| 5 to 9 Minutes | 0 (0.0%) | 0 (0.0%) |
| 10 to 14 Minutes | 0 (0.0%) | 0 (0.0%) |
| 15 to 19 Minutes | 63 (61.2%) | 0 (0.0%) |
| 20 to 24 Minutes | 0 (0.0%) | 0 (0.0%) |
| 25 to 29 Minutes | 0 (0.0%) | 0 (0.0%) |
| 30 to 34 Minutes | 0 (0.0%) | 0 (0.0%) |
| 35 to 39 Minutes | 0 (0.0%) | 0 (0.0%) |
| 40 to 44 Minutes | 0 (0.0%) | 0 (0.0%) |
| 45 to 59 Minutes | 0 (0.0%) | 0 (0.0%) |
| 60 to 89 Minutes | 40 (38.8%) | 0 (0.0%) |
| 90 or more Minutes | 0 (0.0%) | 0 (0.0%) |
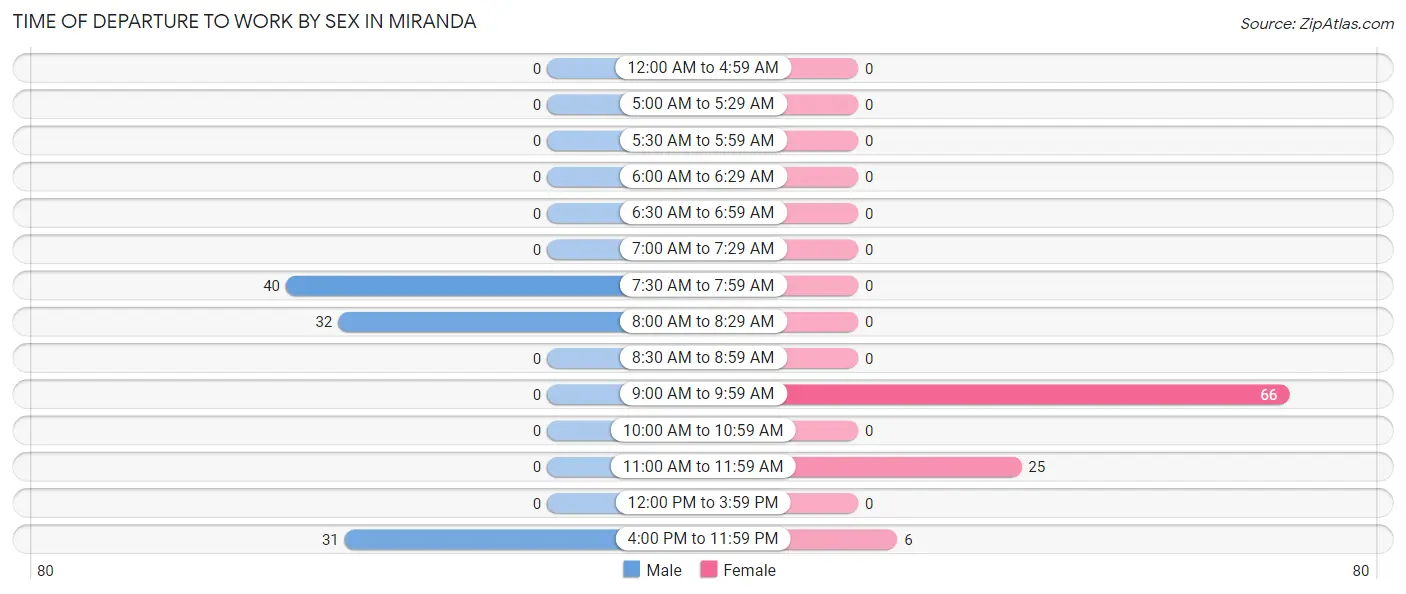
Time of Departure to Work by Sex in Miranda
The most frequent times of departure to work in Miranda are 7:30 AM to 7:59 AM (40, 38.8%) for males and 9:00 AM to 9:59 AM (66, 68.0%) for females.
| Time of Departure | Male | Female |
| 12:00 AM to 4:59 AM | 0 (0.0%) | 0 (0.0%) |
| 5:00 AM to 5:29 AM | 0 (0.0%) | 0 (0.0%) |
| 5:30 AM to 5:59 AM | 0 (0.0%) | 0 (0.0%) |
| 6:00 AM to 6:29 AM | 0 (0.0%) | 0 (0.0%) |
| 6:30 AM to 6:59 AM | 0 (0.0%) | 0 (0.0%) |
| 7:00 AM to 7:29 AM | 0 (0.0%) | 0 (0.0%) |
| 7:30 AM to 7:59 AM | 40 (38.8%) | 0 (0.0%) |
| 8:00 AM to 8:29 AM | 32 (31.1%) | 0 (0.0%) |
| 8:30 AM to 8:59 AM | 0 (0.0%) | 0 (0.0%) |
| 9:00 AM to 9:59 AM | 0 (0.0%) | 66 (68.0%) |
| 10:00 AM to 10:59 AM | 0 (0.0%) | 0 (0.0%) |
| 11:00 AM to 11:59 AM | 0 (0.0%) | 25 (25.8%) |
| 12:00 PM to 3:59 PM | 0 (0.0%) | 0 (0.0%) |
| 4:00 PM to 11:59 PM | 31 (30.1%) | 6 (6.2%) |
| Total | 103 (100.0%) | 97 (100.0%) |
Housing Occupancy in Miranda
Occupancy by Ownership in Miranda
Of the total 248 dwellings in Miranda, owner-occupied units account for 117 (47.2%), while renter-occupied units make up 131 (52.8%).
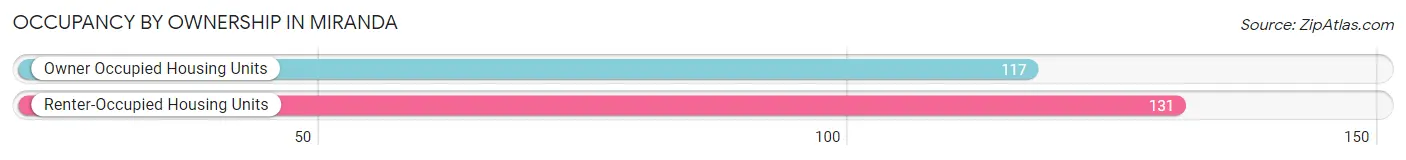
| Occupancy | # Housing Units | % Housing Units |
| Owner Occupied Housing Units | 117 | 47.2% |
| Renter-Occupied Housing Units | 131 | 52.8% |
| Total Occupied Housing Units | 248 | 100.0% |
Occupancy by Household Size in Miranda
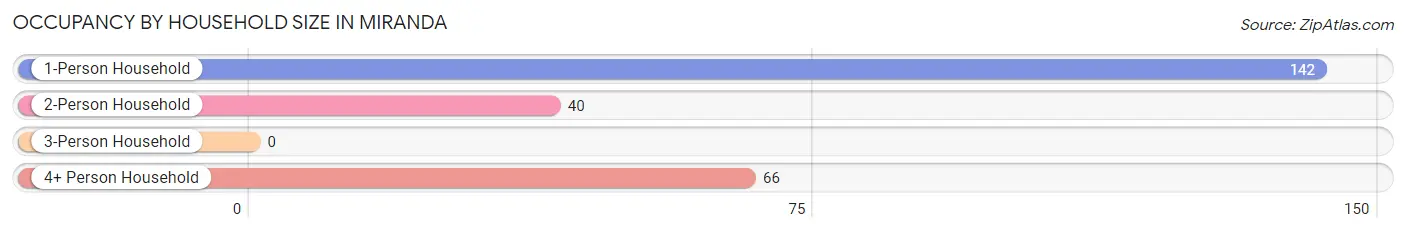
| Household Size | # Housing Units | % Housing Units |
| 1-Person Household | 142 | 57.3% |
| 2-Person Household | 40 | 16.1% |
| 3-Person Household | 0 | 0.0% |
| 4+ Person Household | 66 | 26.6% |
| Total Housing Units | 248 | 100.0% |
Occupancy by Ownership by Household Size in Miranda
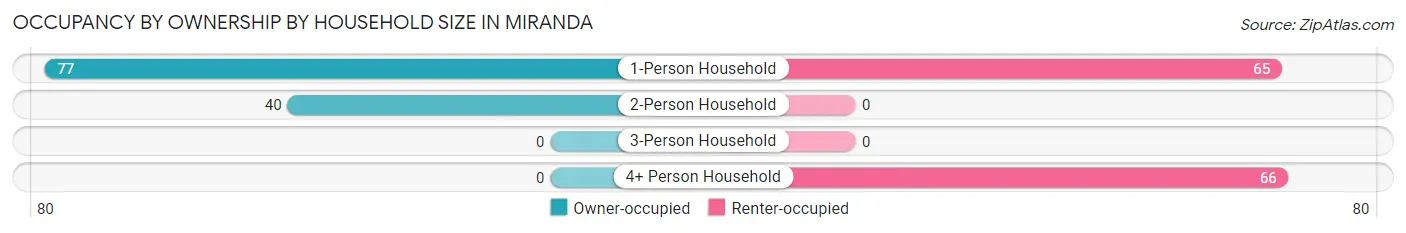
| Household Size | Owner-occupied | Renter-occupied |
| 1-Person Household | 77 (54.2%) | 65 (45.8%) |
| 2-Person Household | 40 (100.0%) | 0 (0.0%) |
| 3-Person Household | 0 (0.0%) | 0 (0.0%) |
| 4+ Person Household | 0 (0.0%) | 66 (100.0%) |
| Total Housing Units | 117 (47.2%) | 131 (52.8%) |
Occupancy by Educational Attainment in Miranda
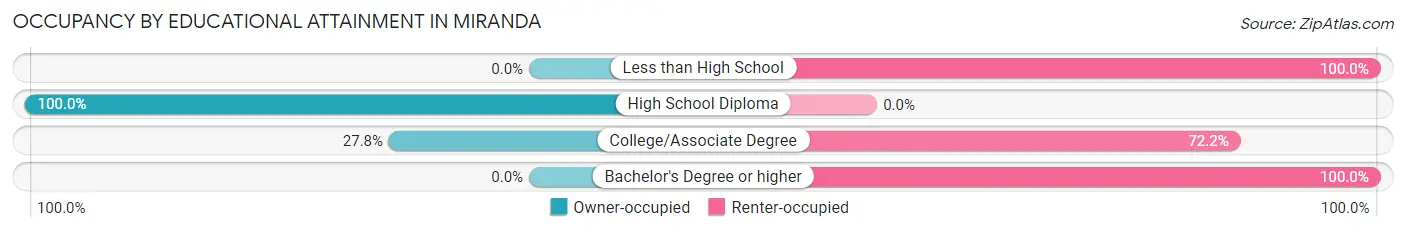
| Household Size | Owner-occupied | Renter-occupied |
| Less than High School | 0 (0.0%) | 36 (100.0%) |
| High School Diploma | 92 (100.0%) | 0 (0.0%) |
| College/Associate Degree | 25 (27.8%) | 65 (72.2%) |
| Bachelor's Degree or higher | 0 (0.0%) | 30 (100.0%) |
Occupancy by Age of Householder in Miranda
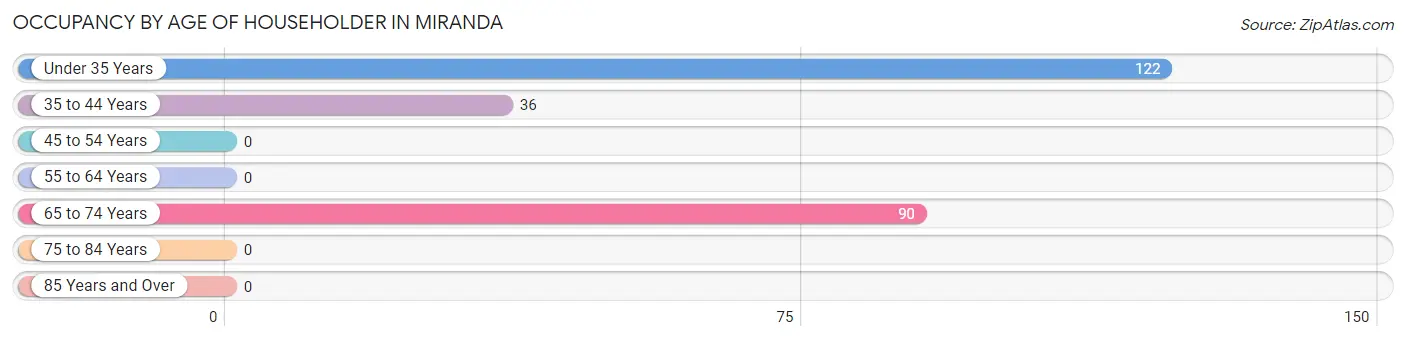
| Age Bracket | # Households | % Households |
| Under 35 Years | 122 | 49.2% |
| 35 to 44 Years | 36 | 14.5% |
| 45 to 54 Years | 0 | 0.0% |
| 55 to 64 Years | 0 | 0.0% |
| 65 to 74 Years | 90 | 36.3% |
| 75 to 84 Years | 0 | 0.0% |
| 85 Years and Over | 0 | 0.0% |
| Total | 248 | 100.0% |
Housing Finances in Miranda
Median Income by Occupancy in Miranda
| Occupancy Type | # Households | Median Income |
| Owner-Occupied | 117 (47.2%) | $0 |
| Renter-Occupied | 131 (52.8%) | $0 |
| Average | 248 (100.0%) | $0 |
Occupancy by Householder Income Bracket in Miranda
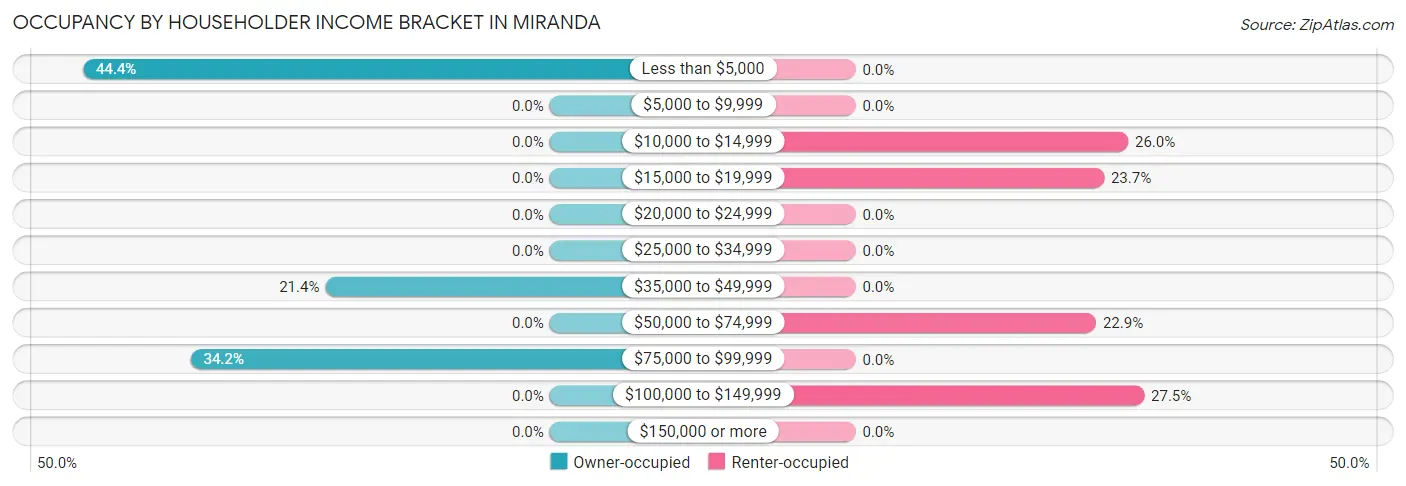
| Income Bracket | Owner-occupied | Renter-occupied |
| Less than $5,000 | 52 (44.4%) | 0 (0.0%) |
| $5,000 to $9,999 | 0 (0.0%) | 0 (0.0%) |
| $10,000 to $14,999 | 0 (0.0%) | 34 (26.0%) |
| $15,000 to $19,999 | 0 (0.0%) | 31 (23.7%) |
| $20,000 to $24,999 | 0 (0.0%) | 0 (0.0%) |
| $25,000 to $34,999 | 0 (0.0%) | 0 (0.0%) |
| $35,000 to $49,999 | 25 (21.4%) | 0 (0.0%) |
| $50,000 to $74,999 | 0 (0.0%) | 30 (22.9%) |
| $75,000 to $99,999 | 40 (34.2%) | 0 (0.0%) |
| $100,000 to $149,999 | 0 (0.0%) | 36 (27.5%) |
| $150,000 or more | 0 (0.0%) | 0 (0.0%) |
| Total | 117 (100.0%) | 131 (100.0%) |
Monthly Housing Cost Tiers in Miranda
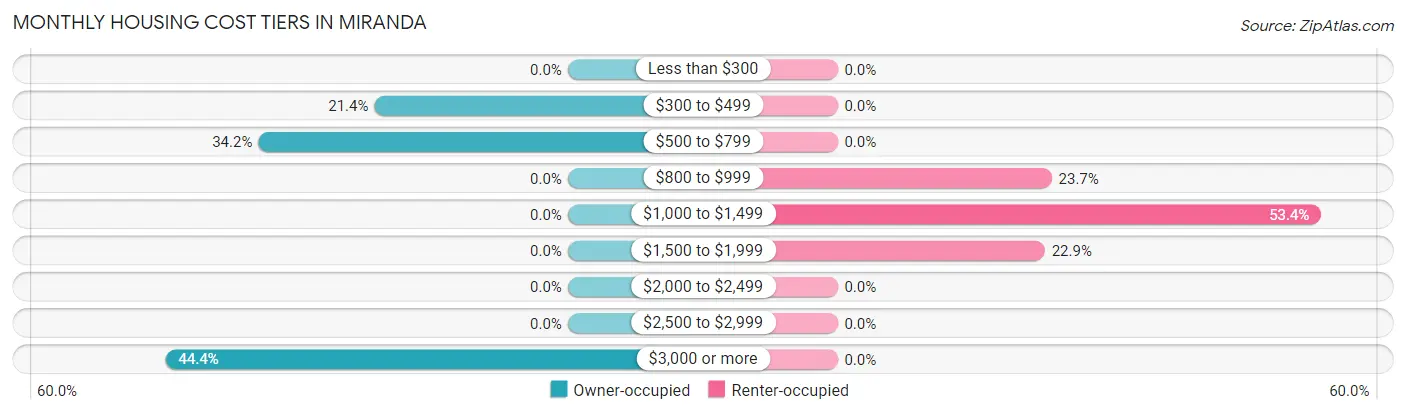
| Monthly Cost | Owner-occupied | Renter-occupied |
| Less than $300 | 0 (0.0%) | 0 (0.0%) |
| $300 to $499 | 25 (21.4%) | 0 (0.0%) |
| $500 to $799 | 40 (34.2%) | 0 (0.0%) |
| $800 to $999 | 0 (0.0%) | 31 (23.7%) |
| $1,000 to $1,499 | 0 (0.0%) | 70 (53.4%) |
| $1,500 to $1,999 | 0 (0.0%) | 30 (22.9%) |
| $2,000 to $2,499 | 0 (0.0%) | 0 (0.0%) |
| $2,500 to $2,999 | 0 (0.0%) | 0 (0.0%) |
| $3,000 or more | 52 (44.4%) | 0 (0.0%) |
| Total | 117 (100.0%) | 131 (100.0%) |
Physical Housing Characteristics in Miranda
Housing Structures in Miranda
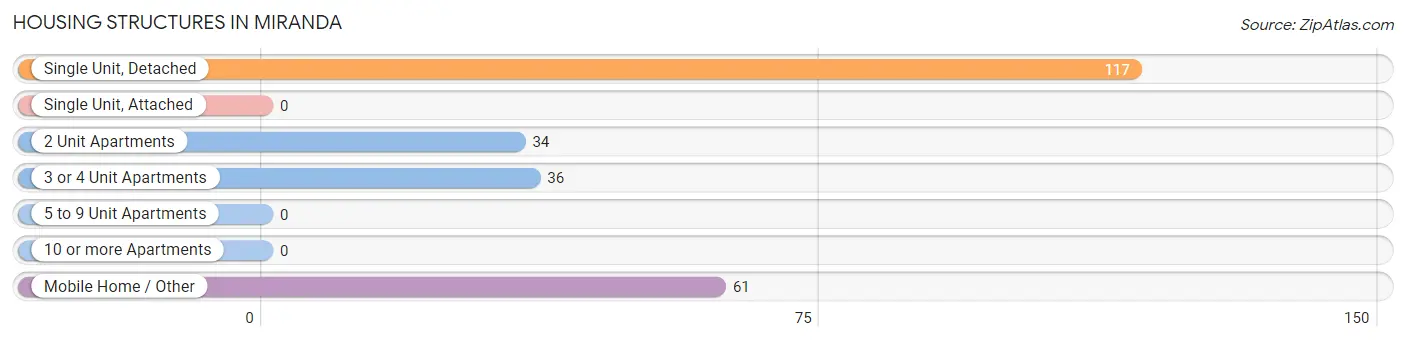
| Structure Type | # Housing Units | % Housing Units |
| Single Unit, Detached | 117 | 47.2% |
| Single Unit, Attached | 0 | 0.0% |
| 2 Unit Apartments | 34 | 13.7% |
| 3 or 4 Unit Apartments | 36 | 14.5% |
| 5 to 9 Unit Apartments | 0 | 0.0% |
| 10 or more Apartments | 0 | 0.0% |
| Mobile Home / Other | 61 | 24.6% |
| Total | 248 | 100.0% |
Housing Structures by Occupancy in Miranda
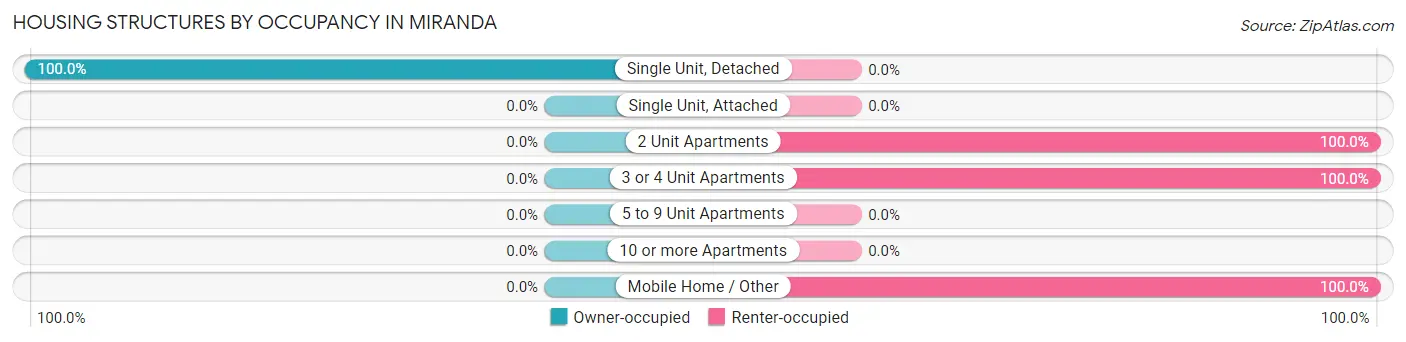
| Structure Type | Owner-occupied | Renter-occupied |
| Single Unit, Detached | 117 (100.0%) | 0 (0.0%) |
| Single Unit, Attached | 0 (0.0%) | 0 (0.0%) |
| 2 Unit Apartments | 0 (0.0%) | 34 (100.0%) |
| 3 or 4 Unit Apartments | 0 (0.0%) | 36 (100.0%) |
| 5 to 9 Unit Apartments | 0 (0.0%) | 0 (0.0%) |
| 10 or more Apartments | 0 (0.0%) | 0 (0.0%) |
| Mobile Home / Other | 0 (0.0%) | 61 (100.0%) |
| Total | 117 (47.2%) | 131 (52.8%) |
Housing Structures by Number of Rooms in Miranda
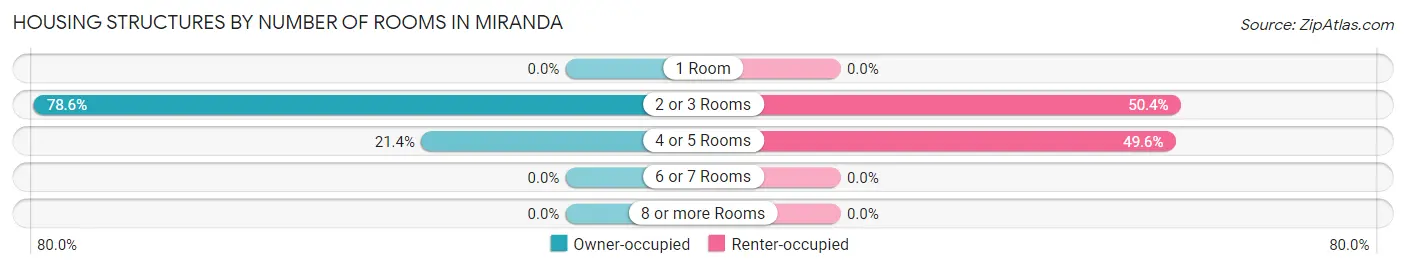
| Number of Rooms | Owner-occupied | Renter-occupied |
| 1 Room | 0 (0.0%) | 0 (0.0%) |
| 2 or 3 Rooms | 92 (78.6%) | 66 (50.4%) |
| 4 or 5 Rooms | 25 (21.4%) | 65 (49.6%) |
| 6 or 7 Rooms | 0 (0.0%) | 0 (0.0%) |
| 8 or more Rooms | 0 (0.0%) | 0 (0.0%) |
| Total | 117 (100.0%) | 131 (100.0%) |
Housing Structure by Heating Type in Miranda
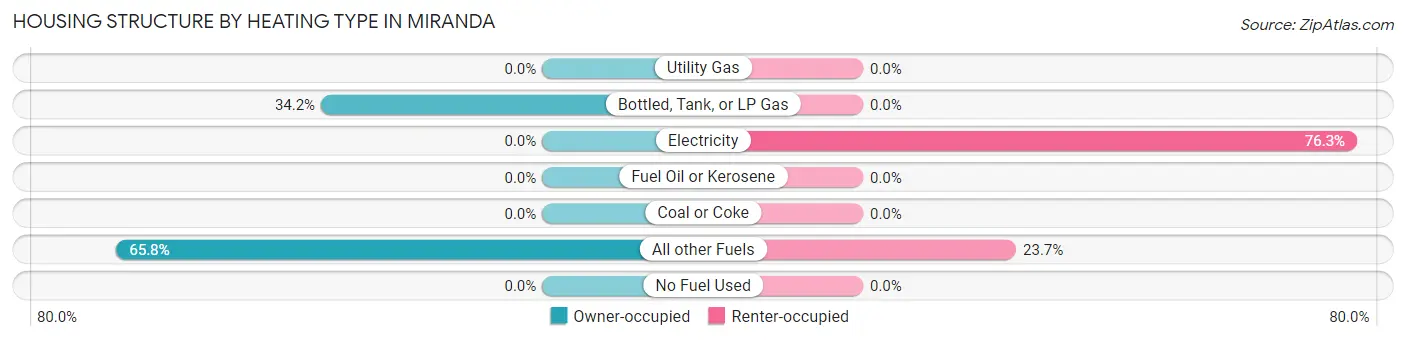
| Heating Type | Owner-occupied | Renter-occupied |
| Utility Gas | 0 (0.0%) | 0 (0.0%) |
| Bottled, Tank, or LP Gas | 40 (34.2%) | 0 (0.0%) |
| Electricity | 0 (0.0%) | 100 (76.3%) |
| Fuel Oil or Kerosene | 0 (0.0%) | 0 (0.0%) |
| Coal or Coke | 0 (0.0%) | 0 (0.0%) |
| All other Fuels | 77 (65.8%) | 31 (23.7%) |
| No Fuel Used | 0 (0.0%) | 0 (0.0%) |
| Total | 117 (100.0%) | 131 (100.0%) |
Household Vehicle Usage in Miranda
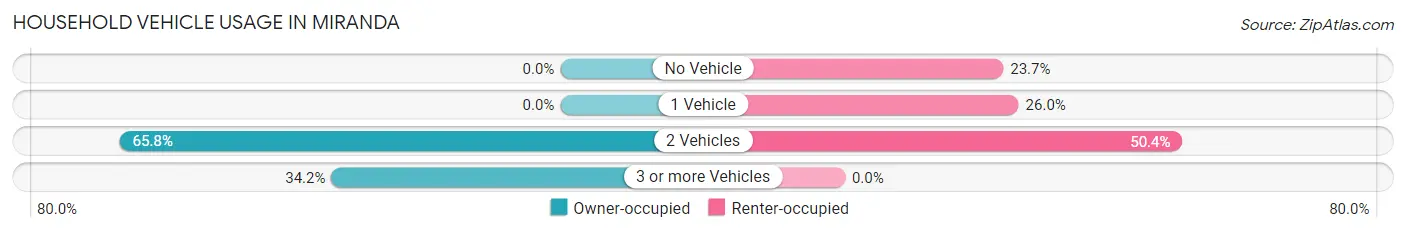
| Vehicles per Household | Owner-occupied | Renter-occupied |
| No Vehicle | 0 (0.0%) | 31 (23.7%) |
| 1 Vehicle | 0 (0.0%) | 34 (26.0%) |
| 2 Vehicles | 77 (65.8%) | 66 (50.4%) |
| 3 or more Vehicles | 40 (34.2%) | 0 (0.0%) |
| Total | 117 (100.0%) | 131 (100.0%) |
Real Estate & Mortgages in Miranda
Real Estate and Mortgage Overview in Miranda
| Characteristic | Without Mortgage | With Mortgage |
| Housing Units | 65 | 52 |
| Median Property Value | - | - |
| Median Household Income | - | - |
| Monthly Housing Costs | - | - |
| Real Estate Taxes | - | - |
Property Value by Mortgage Status in Miranda
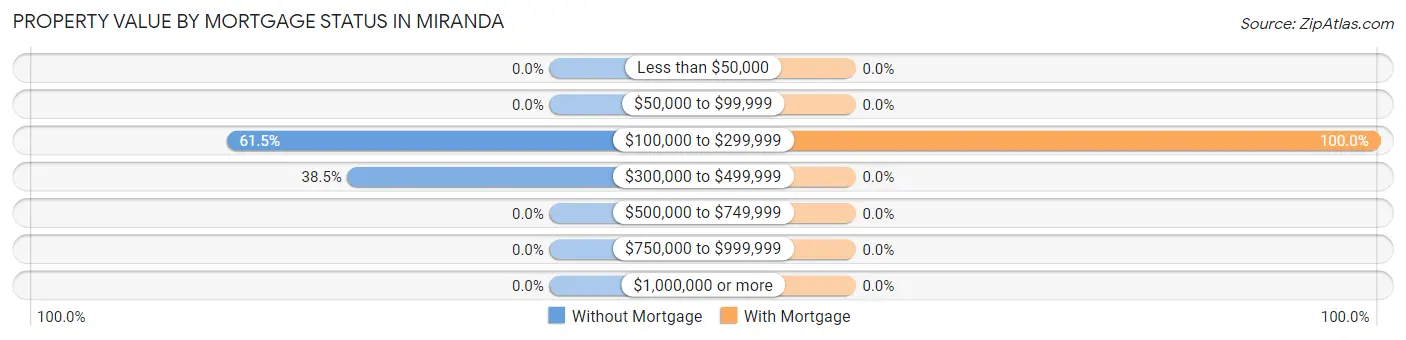
| Property Value | Without Mortgage | With Mortgage |
| Less than $50,000 | 0 (0.0%) | 0 (0.0%) |
| $50,000 to $99,999 | 0 (0.0%) | 0 (0.0%) |
| $100,000 to $299,999 | 40 (61.5%) | 52 (100.0%) |
| $300,000 to $499,999 | 25 (38.5%) | 0 (0.0%) |
| $500,000 to $749,999 | 0 (0.0%) | 0 (0.0%) |
| $750,000 to $999,999 | 0 (0.0%) | 0 (0.0%) |
| $1,000,000 or more | 0 (0.0%) | 0 (0.0%) |
| Total | 65 (100.0%) | 52 (100.0%) |
Household Income by Mortgage Status in Miranda
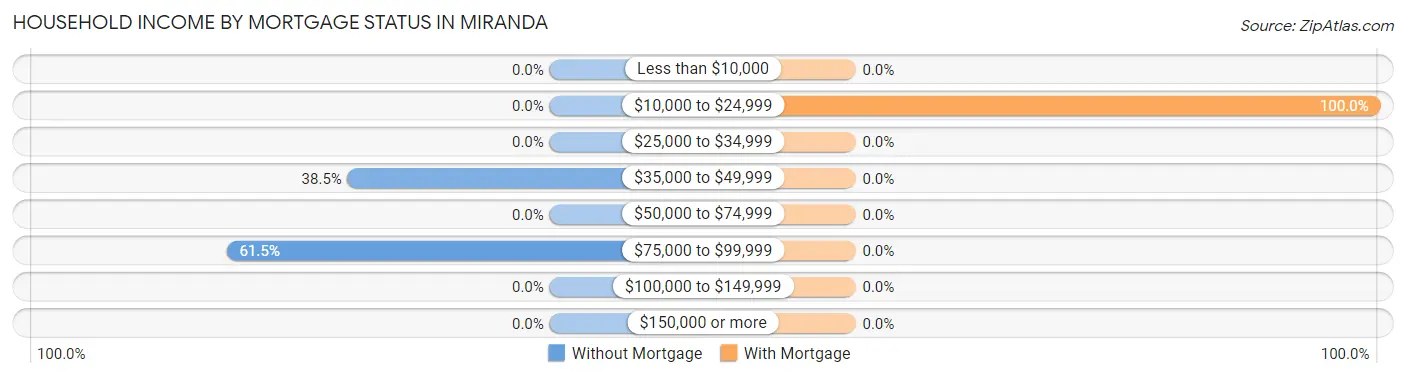
| Household Income | Without Mortgage | With Mortgage |
| Less than $10,000 | 0 (0.0%) | 0 (0.0%) |
| $10,000 to $24,999 | 0 (0.0%) | 52 (100.0%) |
| $25,000 to $34,999 | 0 (0.0%) | 0 (0.0%) |
| $35,000 to $49,999 | 25 (38.5%) | 0 (0.0%) |
| $50,000 to $74,999 | 0 (0.0%) | 0 (0.0%) |
| $75,000 to $99,999 | 40 (61.5%) | 0 (0.0%) |
| $100,000 to $149,999 | 0 (0.0%) | 0 (0.0%) |
| $150,000 or more | 0 (0.0%) | 0 (0.0%) |
| Total | 65 (100.0%) | 52 (100.0%) |
Property Value to Household Income Ratio in Miranda
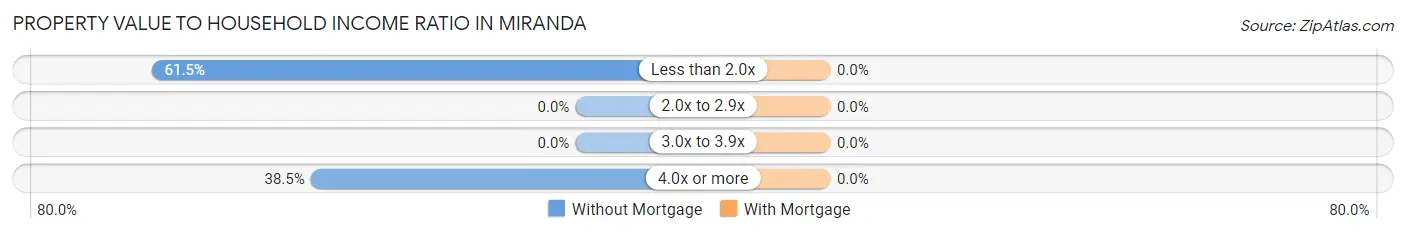
| Value-to-Income Ratio | Without Mortgage | With Mortgage |
| Less than 2.0x | 40 (61.5%) | 0 (0.0%) |
| 2.0x to 2.9x | 0 (0.0%) | 0 (0.0%) |
| 3.0x to 3.9x | 0 (0.0%) | 0 (0.0%) |
| 4.0x or more | 25 (38.5%) | 0 (0.0%) |
| Total | 65 (100.0%) | 52 (100.0%) |
Real Estate Taxes by Mortgage Status in Miranda
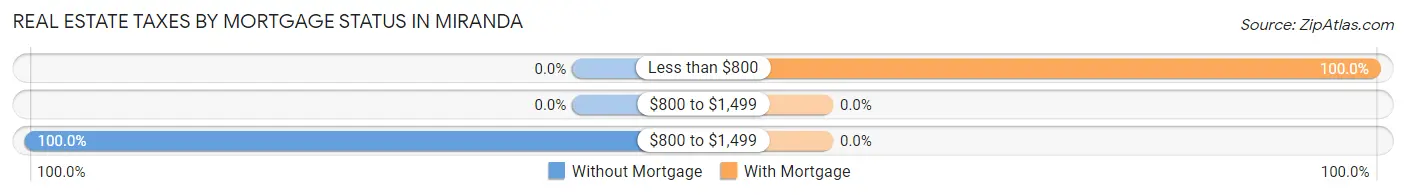
| Property Taxes | Without Mortgage | With Mortgage |
| Less than $800 | 0 (0.0%) | 52 (100.0%) |
| $800 to $1,499 | 0 (0.0%) | 0 (0.0%) |
| $800 to $1,499 | 65 (100.0%) | 0 (0.0%) |
| Total | 65 (100.0%) | 52 (100.0%) |
Health & Disability in Miranda
Health Insurance Coverage by Age in Miranda
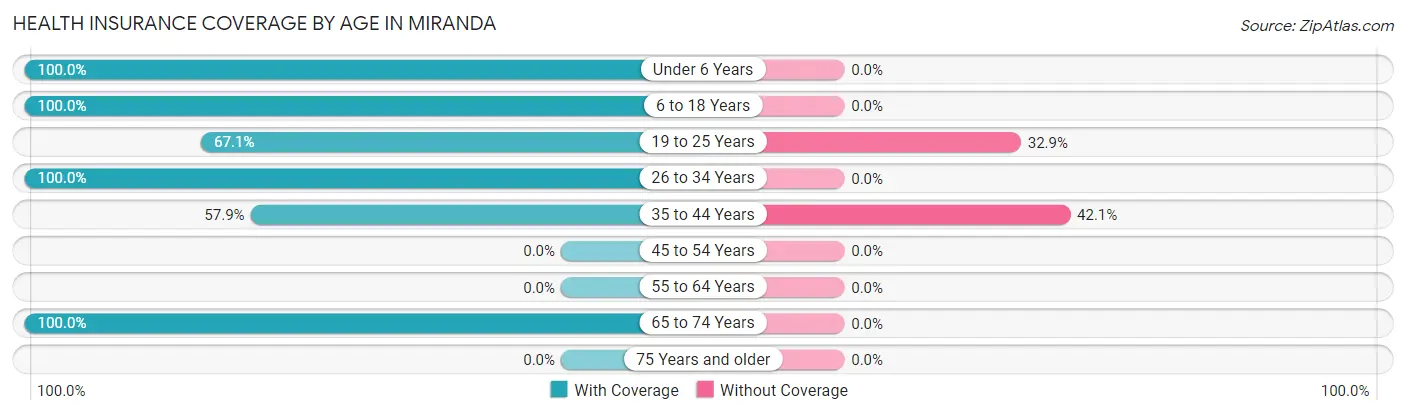
| Age Bracket | With Coverage | Without Coverage |
| Under 6 Years | 69 (100.0%) | 0 (0.0%) |
| 6 to 18 Years | 196 (100.0%) | 0 (0.0%) |
| 19 to 25 Years | 106 (67.1%) | 52 (32.9%) |
| 26 to 34 Years | 67 (100.0%) | 0 (0.0%) |
| 35 to 44 Years | 44 (57.9%) | 32 (42.1%) |
| 45 to 54 Years | 0 (0.0%) | 0 (0.0%) |
| 55 to 64 Years | 0 (0.0%) | 0 (0.0%) |
| 65 to 74 Years | 90 (100.0%) | 0 (0.0%) |
| 75 Years and older | 0 (0.0%) | 0 (0.0%) |
| Total | 572 (87.2%) | 84 (12.8%) |
Health Insurance Coverage by Citizenship Status in Miranda
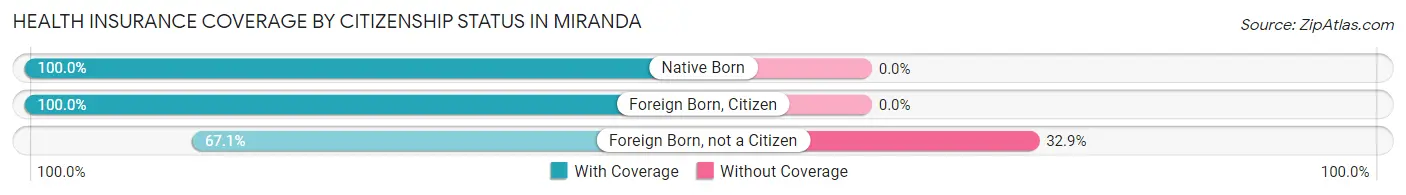
| Citizenship Status | With Coverage | Without Coverage |
| Native Born | 69 (100.0%) | 0 (0.0%) |
| Foreign Born, Citizen | 196 (100.0%) | 0 (0.0%) |
| Foreign Born, not a Citizen | 106 (67.1%) | 52 (32.9%) |
Health Insurance Coverage by Household Income in Miranda
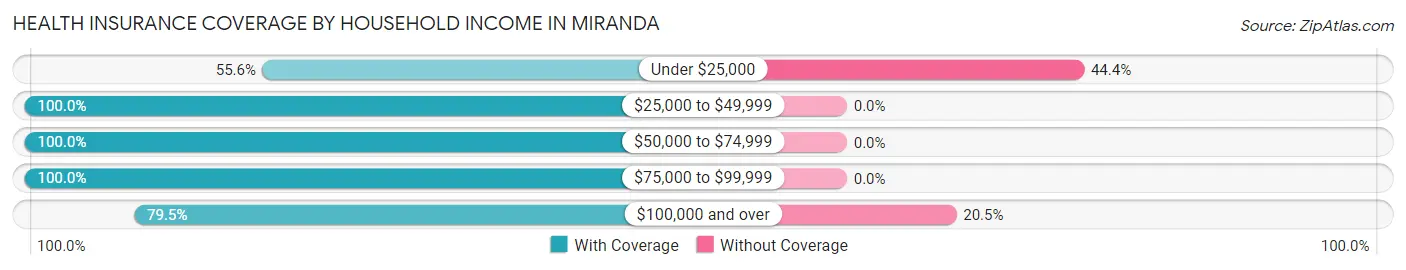
| Household Income | With Coverage | Without Coverage |
| Under $25,000 | 65 (55.6%) | 52 (44.4%) |
| $25,000 to $49,999 | 25 (100.0%) | 0 (0.0%) |
| $50,000 to $74,999 | 238 (100.0%) | 0 (0.0%) |
| $75,000 to $99,999 | 106 (100.0%) | 0 (0.0%) |
| $100,000 and over | 124 (79.5%) | 32 (20.5%) |
Public vs Private Health Insurance Coverage by Age in Miranda
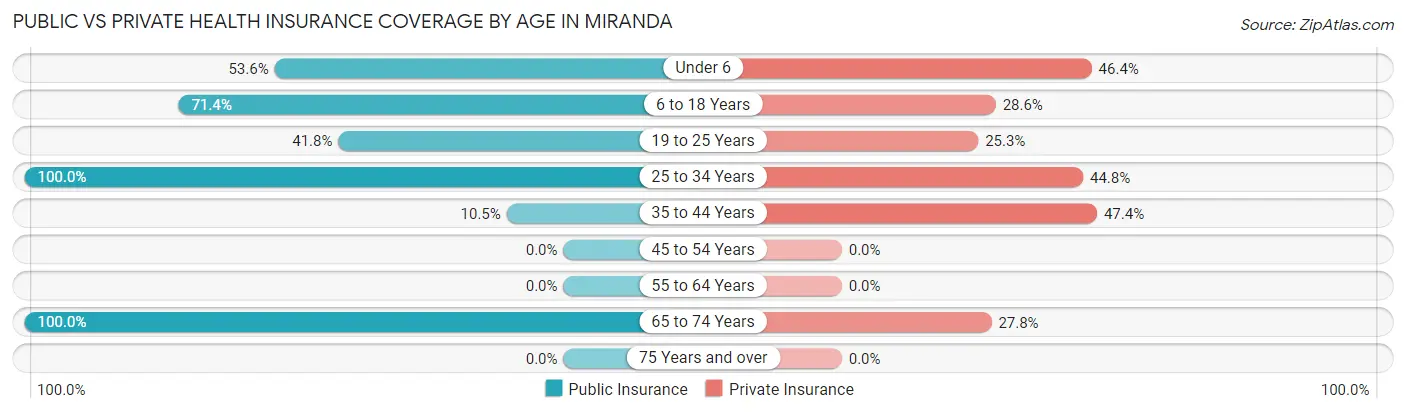
| Age Bracket | Public Insurance | Private Insurance |
| Under 6 | 37 (53.6%) | 32 (46.4%) |
| 6 to 18 Years | 140 (71.4%) | 56 (28.6%) |
| 19 to 25 Years | 66 (41.8%) | 40 (25.3%) |
| 25 to 34 Years | 67 (100.0%) | 30 (44.8%) |
| 35 to 44 Years | 8 (10.5%) | 36 (47.4%) |
| 45 to 54 Years | 0 (0.0%) | 0 (0.0%) |
| 55 to 64 Years | 0 (0.0%) | 0 (0.0%) |
| 65 to 74 Years | 90 (100.0%) | 25 (27.8%) |
| 75 Years and over | 0 (0.0%) | 0 (0.0%) |
| Total | 408 (62.2%) | 219 (33.4%) |
Disability Status by Sex by Age in Miranda
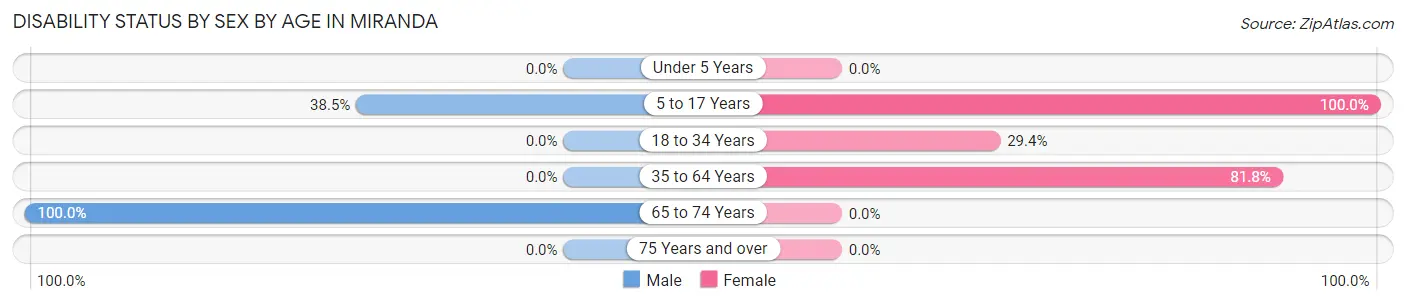
| Age Bracket | Male | Female |
| Under 5 Years | 0 (0.0%) | 0 (0.0%) |
| 5 to 17 Years | 35 (38.5%) | 142 (100.0%) |
| 18 to 34 Years | 0 (0.0%) | 30 (29.4%) |
| 35 to 64 Years | 0 (0.0%) | 36 (81.8%) |
| 65 to 74 Years | 65 (100.0%) | 0 (0.0%) |
| 75 Years and over | 0 (0.0%) | 0 (0.0%) |
Disability Class by Sex by Age in Miranda
Disability Class: Hearing Difficulty
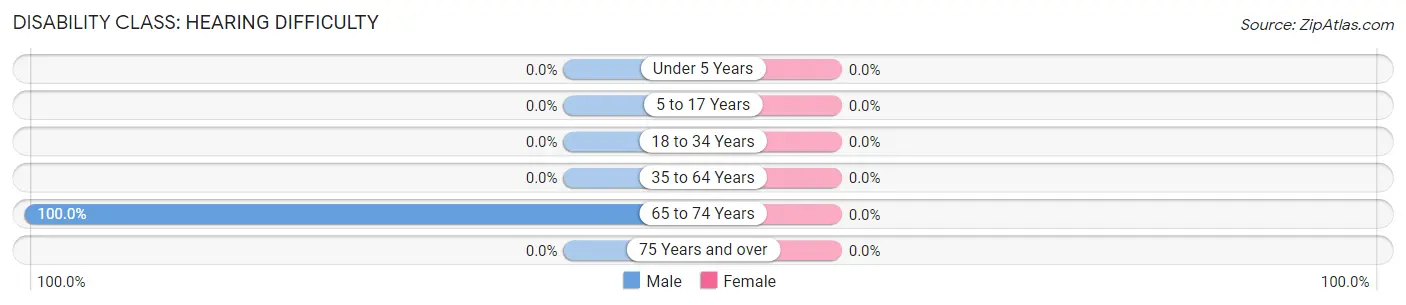
| Age Bracket | Male | Female |
| Under 5 Years | 0 (0.0%) | 0 (0.0%) |
| 5 to 17 Years | 0 (0.0%) | 0 (0.0%) |
| 18 to 34 Years | 0 (0.0%) | 0 (0.0%) |
| 35 to 64 Years | 0 (0.0%) | 0 (0.0%) |
| 65 to 74 Years | 65 (100.0%) | 0 (0.0%) |
| 75 Years and over | 0 (0.0%) | 0 (0.0%) |
Disability Class: Vision Difficulty
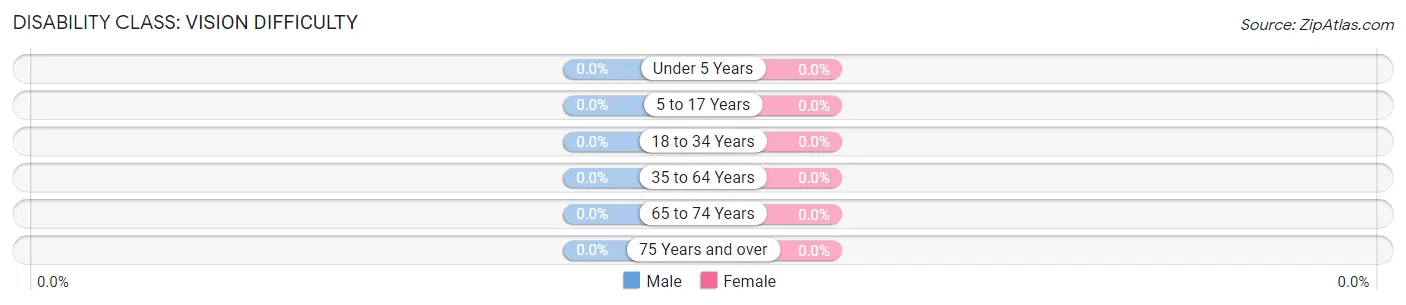
| Age Bracket | Male | Female |
| Under 5 Years | 0 (0.0%) | 0 (0.0%) |
| 5 to 17 Years | 0 (0.0%) | 0 (0.0%) |
| 18 to 34 Years | 0 (0.0%) | 0 (0.0%) |
| 35 to 64 Years | 0 (0.0%) | 0 (0.0%) |
| 65 to 74 Years | 0 (0.0%) | 0 (0.0%) |
| 75 Years and over | 0 (0.0%) | 0 (0.0%) |
Disability Class: Cognitive Difficulty
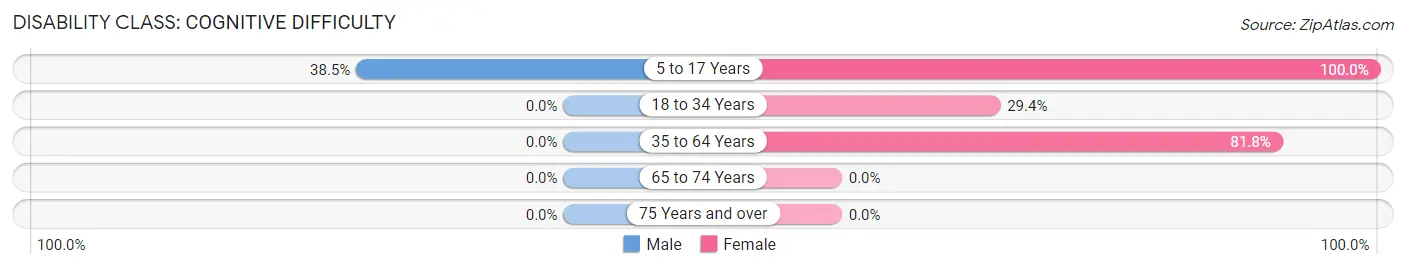
| Age Bracket | Male | Female |
| 5 to 17 Years | 35 (38.5%) | 142 (100.0%) |
| 18 to 34 Years | 0 (0.0%) | 30 (29.4%) |
| 35 to 64 Years | 0 (0.0%) | 36 (81.8%) |
| 65 to 74 Years | 0 (0.0%) | 0 (0.0%) |
| 75 Years and over | 0 (0.0%) | 0 (0.0%) |
Disability Class: Ambulatory Difficulty
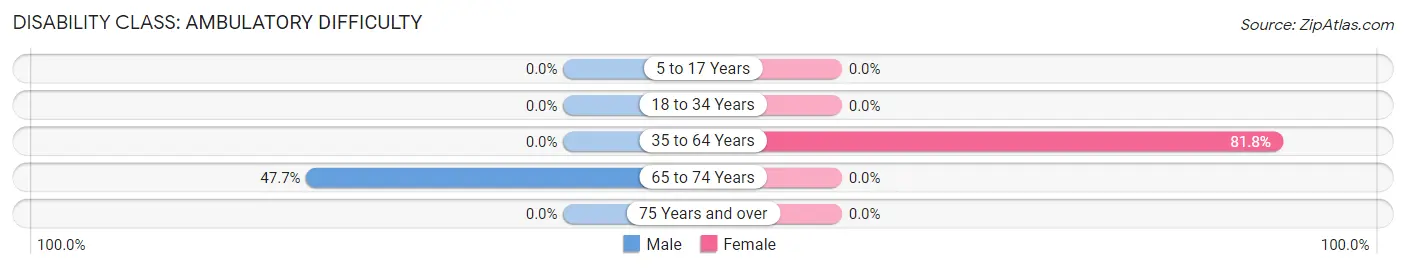
| Age Bracket | Male | Female |
| 5 to 17 Years | 0 (0.0%) | 0 (0.0%) |
| 18 to 34 Years | 0 (0.0%) | 0 (0.0%) |
| 35 to 64 Years | 0 (0.0%) | 36 (81.8%) |
| 65 to 74 Years | 31 (47.7%) | 0 (0.0%) |
| 75 Years and over | 0 (0.0%) | 0 (0.0%) |
Disability Class: Self-Care Difficulty
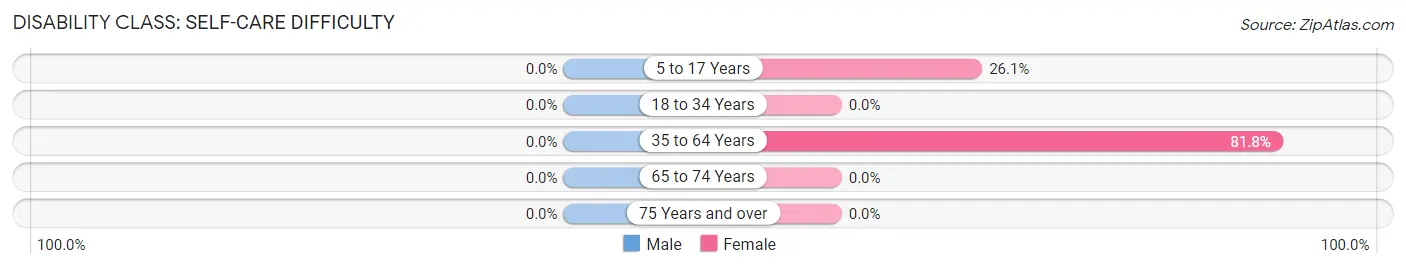
| Age Bracket | Male | Female |
| 5 to 17 Years | 0 (0.0%) | 37 (26.1%) |
| 18 to 34 Years | 0 (0.0%) | 0 (0.0%) |
| 35 to 64 Years | 0 (0.0%) | 36 (81.8%) |
| 65 to 74 Years | 0 (0.0%) | 0 (0.0%) |
| 75 Years and over | 0 (0.0%) | 0 (0.0%) |
Technology Access in Miranda
Computing Device Access in Miranda
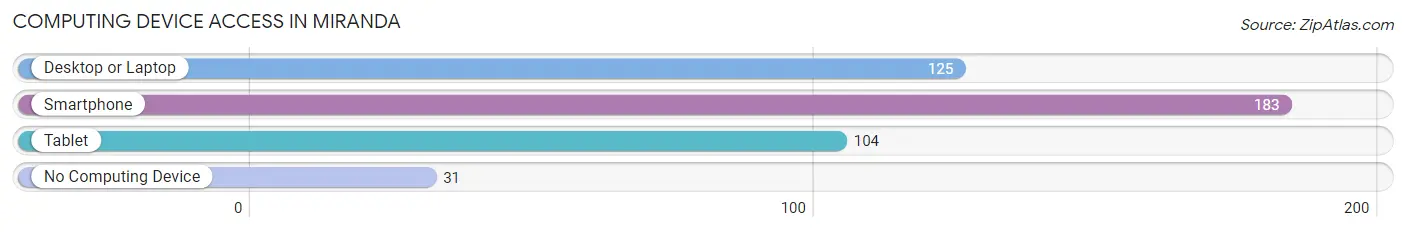
| Device Type | # Households | % Households |
| Desktop or Laptop | 125 | 50.4% |
| Smartphone | 183 | 73.8% |
| Tablet | 104 | 41.9% |
| No Computing Device | 31 | 12.5% |
| Total | 248 | 100.0% |
Internet Access in Miranda
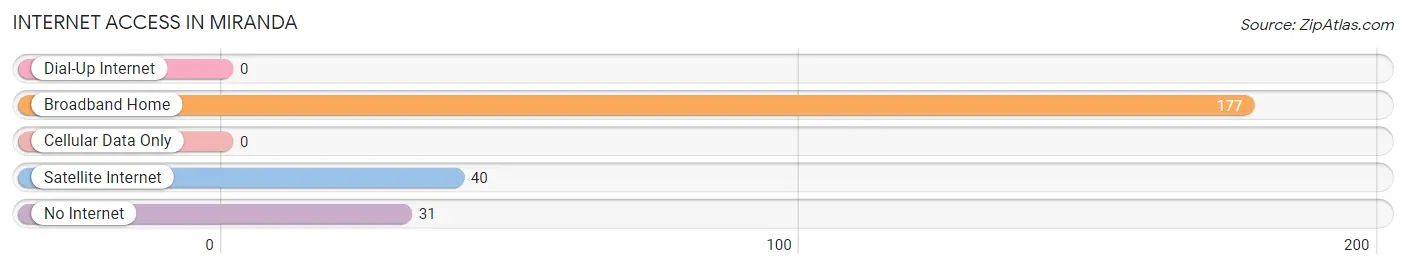
| Internet Type | # Households | % Households |
| Dial-Up Internet | 0 | 0.0% |
| Broadband Home | 177 | 71.4% |
| Cellular Data Only | 0 | 0.0% |
| Satellite Internet | 40 | 16.1% |
| No Internet | 31 | 12.5% |
| Total | 248 | 100.0% |
Miranda Summary
Miranda is a small unincorporated community located in Humboldt County, California. It is situated in the Eel River Valley, approximately 10 miles (16 km) south of Garberville and about 20 miles (32 km) north of the county seat of Eureka. The population of Miranda was estimated to be around 1,000 in 2020.
History
The area that is now Miranda was originally inhabited by the Wiyot people, who lived in the area for thousands of years before the arrival of European settlers. The first European settlers arrived in the area in the 1850s, and the town of Miranda was established in 1875. The town was named after the Miranda family, who were among the first settlers in the area.
The town of Miranda was a logging and lumber town for many years, and the local economy was largely based on the timber industry. In the early 1900s, the town was home to several sawmills and lumber mills, as well as a shingle mill. The town also had a general store, a post office, a blacksmith shop, and a hotel.
In the 1950s, the timber industry began to decline in the area, and the town of Miranda began to decline as well. The population of the town decreased, and many of the businesses closed. In the 1970s, the town was revitalized by the arrival of the marijuana industry, which brought new jobs and economic activity to the area.
Geography
Miranda is located in the Eel River Valley, in the northwestern part of Humboldt County. The town is situated at an elevation of approximately 500 feet (152 m) above sea level. The town is surrounded by rolling hills and is located near the Eel River, which flows through the area.
The climate in Miranda is mild and temperate, with warm summers and cool winters. The average annual temperature is around 55°F (13°C), and the average annual precipitation is around 40 inches (102 cm).
Economy
The economy of Miranda is largely based on the marijuana industry, which has been a major source of employment and economic activity in the area since the 1970s. The town is also home to several small businesses, including a general store, a post office, and a few restaurants.
Demographics
The population of Miranda was estimated to be around 1,000 in 2020. The racial makeup of the town is predominantly white (90.2%), with smaller percentages of Hispanic or Latino (4.2%), African American (2.2%), and Native American (1.2%) residents. The median household income in Miranda is around $45,000, and the median home value is around $200,000.
Common Questions
What is Per Capita Income in Miranda?
Per Capita income in Miranda is $17,267.
What is Inequality or Gini Index in Miranda?
Inequality or Gini Index in Miranda is 0.50.
What is the Total Population of Miranda?
Total Population of Miranda is 656.
What is the Total Male Population of Miranda?
Total Male Population of Miranda is 343.
What is the Total Female Population of Miranda?
Total Female Population of Miranda is 313.
What is the Ratio of Males per 100 Females in Miranda?
There are 109.58 Males per 100 Females in Miranda.
What is the Ratio of Females per 100 Males in Miranda?
There are 91.25 Females per 100 Males in Miranda.
What is the Median Population Age in Miranda?
Median Population Age in Miranda is 21.0 Years.
What is the Average Family Size in Miranda
Average Family Size in Miranda is 5.5 People.
What is the Average Household Size in Miranda
Average Household Size in Miranda is 2.6 People.
How Large is the Labor Force in Miranda?
There are 208 People in the Labor Forcein in Miranda.
What is the Percentage of People in the Labor Force in Miranda?
53.2% of People are in the Labor Force in Miranda.