South Dos Palos, CA Map & Demographics
South Dos Palos Map
South Dos Palos Overview
$23,522
PER CAPITA INCOME
0.54
INEQUALITY / GINI INDEX
1,476
TOTAL POPULATION
559
MALE POPULATION
917
FEMALE POPULATION
60.96
MALES / 100 FEMALES
164.04
FEMALES / 100 MALES
36.9
MEDIAN AGE
3.4
AVG FAMILY SIZE
3.2
AVG HOUSEHOLD SIZE
625
LABOR FORCE [ PEOPLE ]
51.5%
PERCENT IN LABOR FORCE
17.8%
UNEMPLOYMENT RATE
South Dos Palos Zip Codes
South Dos Palos Area Codes
Income in South Dos Palos
Income Overview in South Dos Palos
| Characteristic | Number | Measure |
| Per Capita Income | 1,476 | $23,522 |
| Median Family Income | 387 | $0 |
| Mean Family Income | 387 | $78,328 |
| Median Household Income | 459 | $0 |
| Mean Household Income | 459 | $74,309 |
| Income Deficit | 387 | $0 |
| Wage / Income Gap (%) | 1,476 | 0.00% |
| Wage / Income Gap ($) | 1,476 | 100.00¢ per $1 |
| Gini / Inequality Index | 1,476 | 0.54 |
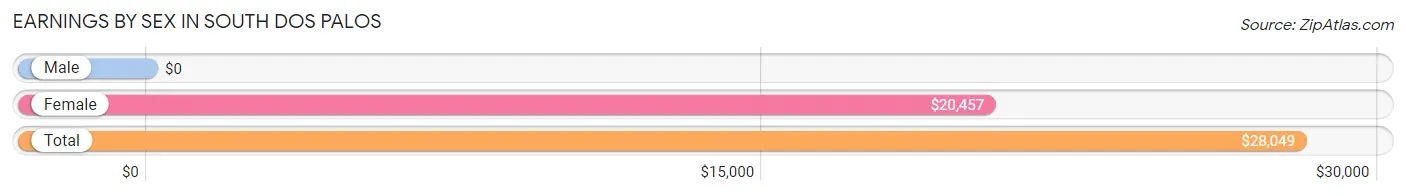
Earnings by Sex in South Dos Palos
| Sex | Number | Average Earnings |
| Male | 231 (37.0%) | $0 |
| Female | 393 (63.0%) | $20,457 |
| Total | 624 (100.0%) | $28,049 |
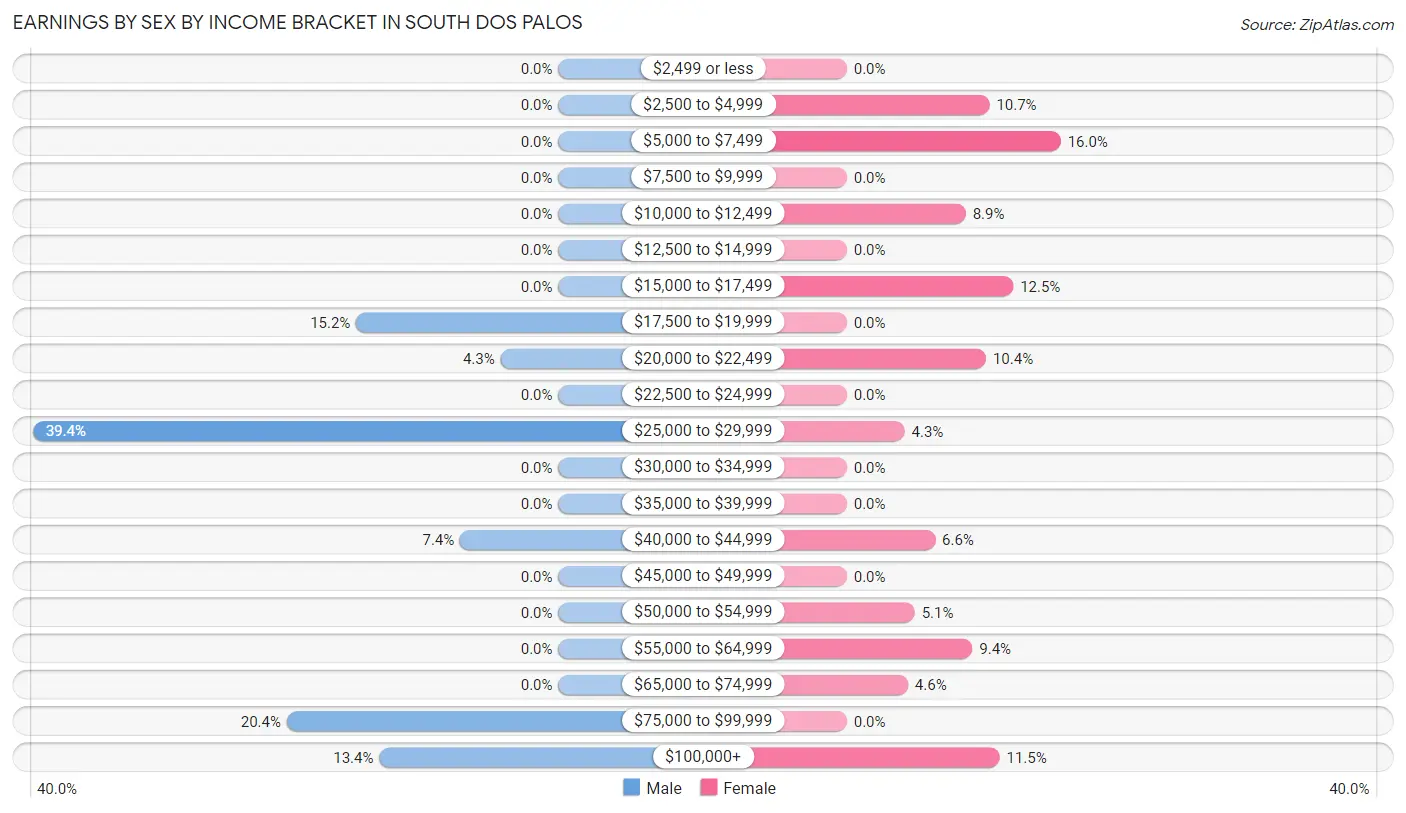
Earnings by Sex by Income Bracket in South Dos Palos
The most common earnings brackets in South Dos Palos are $25,000 to $29,999 for men (91 | 39.4%) and $5,000 to $7,499 for women (63 | 16.0%).
| Income | Male | Female |
| $2,499 or less | 0 (0.0%) | 0 (0.0%) |
| $2,500 to $4,999 | 0 (0.0%) | 42 (10.7%) |
| $5,000 to $7,499 | 0 (0.0%) | 63 (16.0%) |
| $7,500 to $9,999 | 0 (0.0%) | 0 (0.0%) |
| $10,000 to $12,499 | 0 (0.0%) | 35 (8.9%) |
| $12,500 to $14,999 | 0 (0.0%) | 0 (0.0%) |
| $15,000 to $17,499 | 0 (0.0%) | 49 (12.5%) |
| $17,500 to $19,999 | 35 (15.1%) | 0 (0.0%) |
| $20,000 to $22,499 | 10 (4.3%) | 41 (10.4%) |
| $22,500 to $24,999 | 0 (0.0%) | 0 (0.0%) |
| $25,000 to $29,999 | 91 (39.4%) | 17 (4.3%) |
| $30,000 to $34,999 | 0 (0.0%) | 0 (0.0%) |
| $35,000 to $39,999 | 0 (0.0%) | 0 (0.0%) |
| $40,000 to $44,999 | 17 (7.4%) | 26 (6.6%) |
| $45,000 to $49,999 | 0 (0.0%) | 0 (0.0%) |
| $50,000 to $54,999 | 0 (0.0%) | 20 (5.1%) |
| $55,000 to $64,999 | 0 (0.0%) | 37 (9.4%) |
| $65,000 to $74,999 | 0 (0.0%) | 18 (4.6%) |
| $75,000 to $99,999 | 47 (20.3%) | 0 (0.0%) |
| $100,000+ | 31 (13.4%) | 45 (11.5%) |
| Total | 231 (100.0%) | 393 (100.0%) |
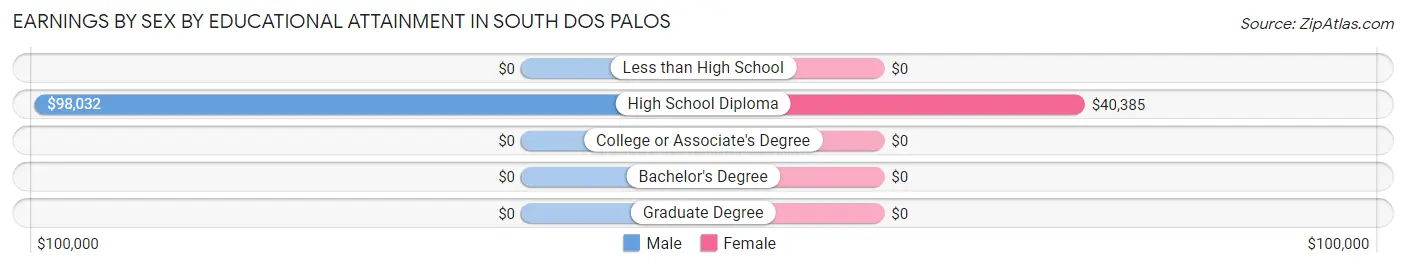
Earnings by Sex by Educational Attainment in South Dos Palos
| Educational Attainment | Male Income | Female Income |
| Less than High School | - | - |
| High School Diploma | $98,032 | $40,385 |
| College or Associate's Degree | - | - |
| Bachelor's Degree | - | - |
| Graduate Degree | - | - |
| Total | - | - |
Family Income in South Dos Palos
Family Income Brackets in South Dos Palos
According to the South Dos Palos family income data, there are 83 families falling into the less than $10,000 income range, which is the most common income bracket and makes up 21.4% of all families.
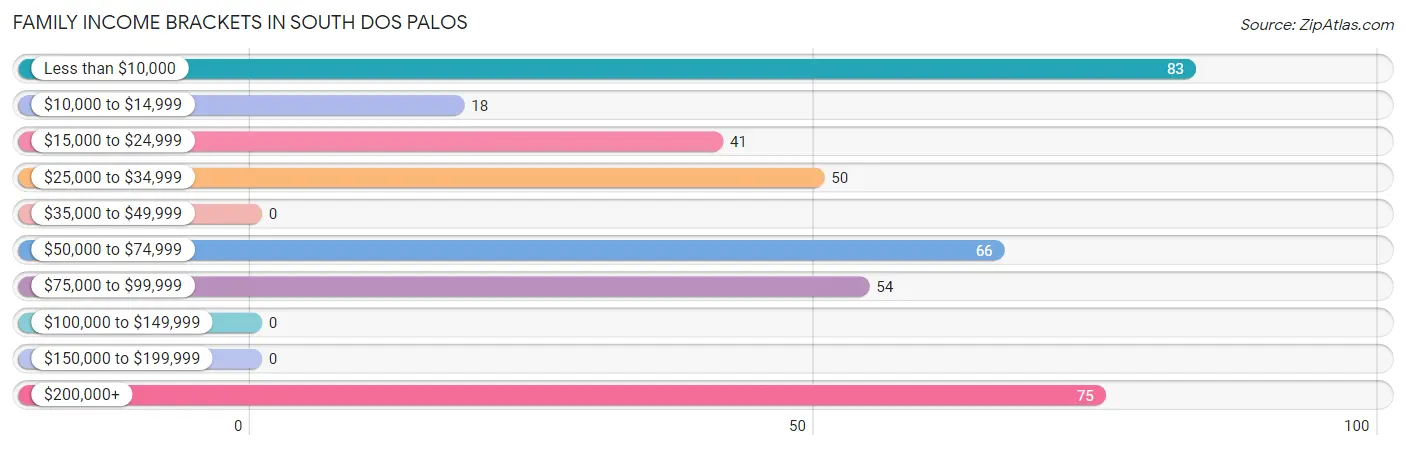
| Income Bracket | # Families | % Families |
| Less than $10,000 | 83 | 21.4% |
| $10,000 to $14,999 | 18 | 4.7% |
| $15,000 to $24,999 | 41 | 10.6% |
| $25,000 to $34,999 | 50 | 12.9% |
| $35,000 to $49,999 | 0 | 0.0% |
| $50,000 to $74,999 | 66 | 17.1% |
| $75,000 to $99,999 | 54 | 14.0% |
| $100,000 to $149,999 | 0 | 0.0% |
| $150,000 to $199,999 | 0 | 0.0% |
| $200,000+ | 75 | 19.4% |
Family Income by Famaliy Size in South Dos Palos
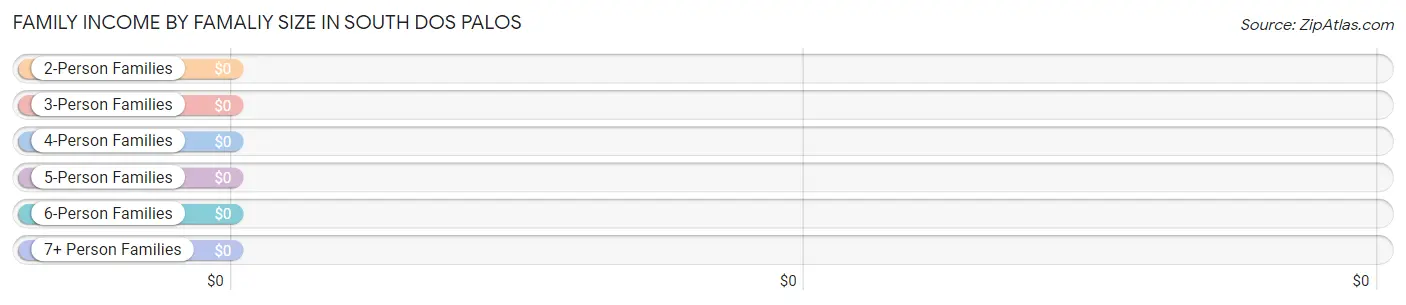
| Income Bracket | # Families | Median Income |
| 2-Person Families | 135 (34.9%) | $0 |
| 3-Person Families | 67 (17.3%) | $0 |
| 4-Person Families | 131 (33.9%) | $0 |
| 5-Person Families | 37 (9.6%) | $0 |
| 6-Person Families | 17 (4.4%) | $0 |
| 7+ Person Families | 0 (0.0%) | $0 |
| Total | 387 (100.0%) | $0 |
Family Income by Number of Earners in South Dos Palos
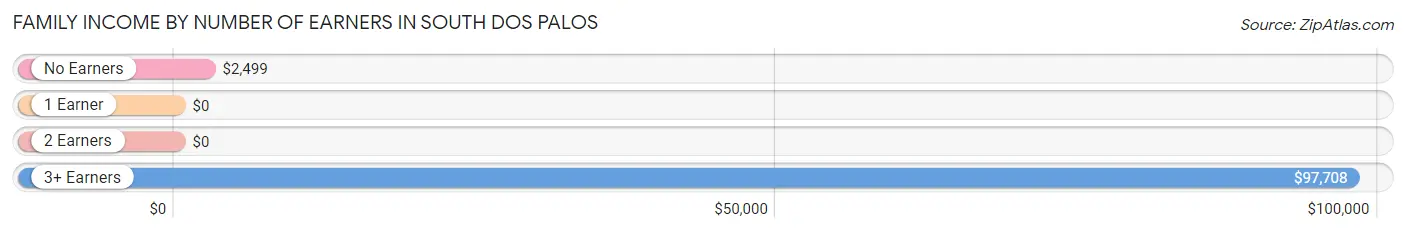
| Number of Earners | # Families | Median Income |
| No Earners | 133 (34.4%) | $2,499 |
| 1 Earner | 80 (20.7%) | $0 |
| 2 Earners | 75 (19.4%) | $0 |
| 3+ Earners | 99 (25.6%) | $97,708 |
| Total | 387 (100.0%) | $0 |
Household Income in South Dos Palos
Household Income Brackets in South Dos Palos
With 80 households falling in the category, the $15,000 to $24,999 income range is the most frequent in South Dos Palos, accounting for 17.4% of all households.
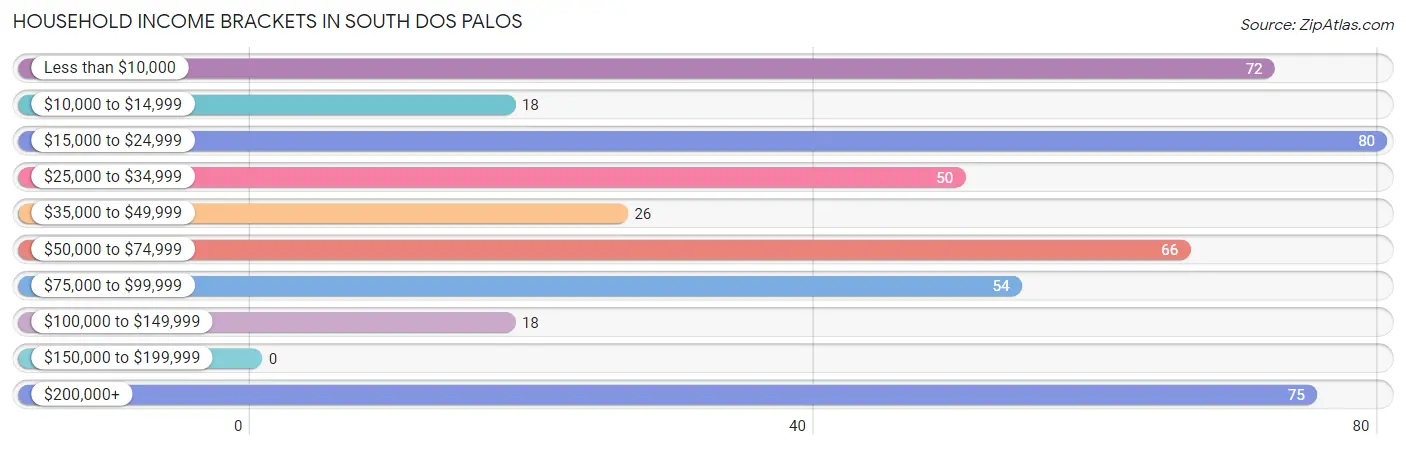
| Income Bracket | # Households | % Households |
| Less than $10,000 | 72 | 15.7% |
| $10,000 to $14,999 | 18 | 3.9% |
| $15,000 to $24,999 | 80 | 17.4% |
| $25,000 to $34,999 | 50 | 10.9% |
| $35,000 to $49,999 | 26 | 5.7% |
| $50,000 to $74,999 | 66 | 14.4% |
| $75,000 to $99,999 | 54 | 11.8% |
| $100,000 to $149,999 | 18 | 3.9% |
| $150,000 to $199,999 | 0 | 0.0% |
| $200,000+ | 75 | 16.3% |
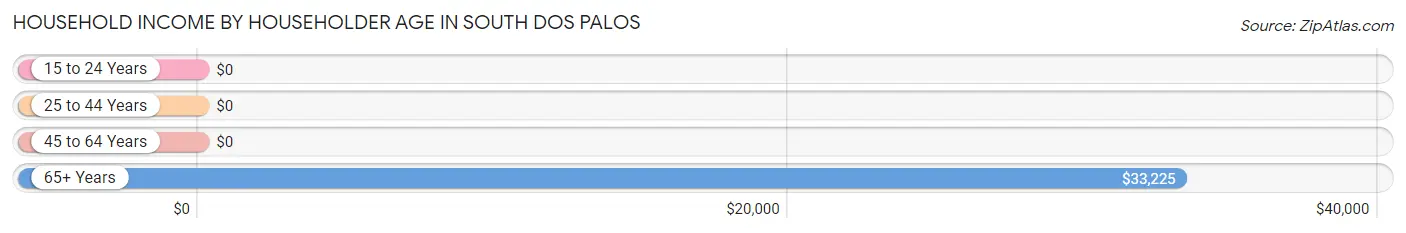
Household Income by Householder Age in South Dos Palos
The median household income in South Dos Palos is $0, with the highest median household income of $33,225 found in the 65+ years age bracket for the primary householder. A total of 107 households (23.3%) fall into this category.
| Income Bracket | # Households | Median Income |
| 15 to 24 Years | 0 (0.0%) | $0 |
| 25 to 44 Years | 169 (36.8%) | $0 |
| 45 to 64 Years | 183 (39.9%) | $0 |
| 65+ Years | 107 (23.3%) | $33,225 |
| Total | 459 (100.0%) | $0 |
Poverty in South Dos Palos
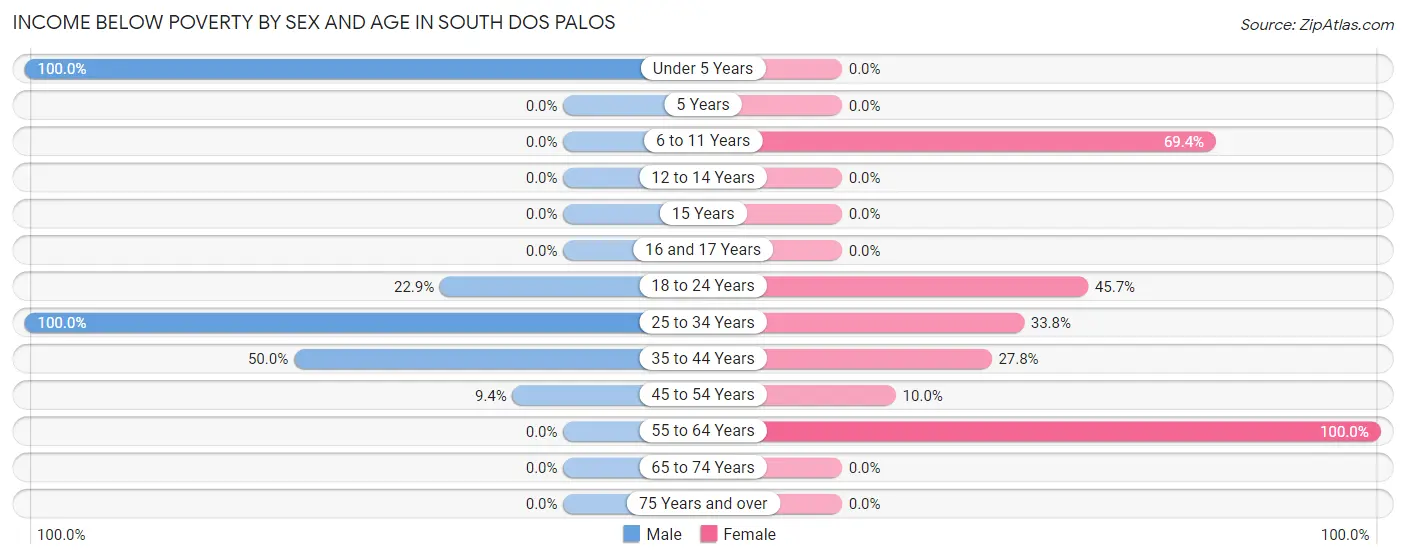
Income Below Poverty by Sex and Age in South Dos Palos
With 28.3% poverty level for males and 27.6% for females among the residents of South Dos Palos, under 5 year old males and 55 to 64 year old females are the most vulnerable to poverty, with 15 males (100.0%) and 60 females (100.0%) in their respective age groups living below the poverty level.
| Age Bracket | Male | Female |
| Under 5 Years | 15 (100.0%) | 0 (0.0%) |
| 5 Years | 0 (0.0%) | 0 (0.0%) |
| 6 to 11 Years | 0 (0.0%) | 25 (69.4%) |
| 12 to 14 Years | 0 (0.0%) | 0 (0.0%) |
| 15 Years | 0 (0.0%) | 0 (0.0%) |
| 16 and 17 Years | 0 (0.0%) | 0 (0.0%) |
| 18 to 24 Years | 27 (22.9%) | 74 (45.7%) |
| 25 to 34 Years | 29 (100.0%) | 25 (33.8%) |
| 35 to 44 Years | 74 (50.0%) | 55 (27.8%) |
| 45 to 54 Years | 13 (9.4%) | 14 (10.0%) |
| 55 to 64 Years | 0 (0.0%) | 60 (100.0%) |
| 65 to 74 Years | 0 (0.0%) | 0 (0.0%) |
| 75 Years and over | 0 (0.0%) | 0 (0.0%) |
| Total | 158 (28.3%) | 253 (27.6%) |
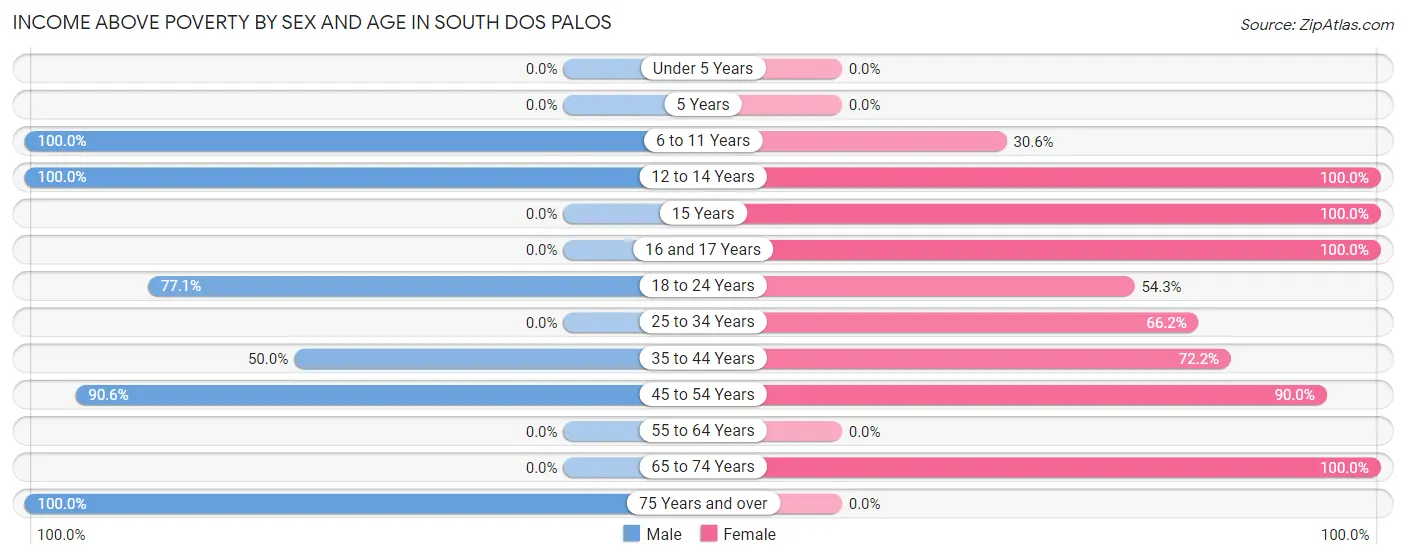
Income Above Poverty by Sex and Age in South Dos Palos
According to the poverty statistics in South Dos Palos, males aged 6 to 11 years and females aged 12 to 14 years are the age groups that are most secure financially, with 100.0% of males and 100.0% of females in these age groups living above the poverty line.
| Age Bracket | Male | Female |
| Under 5 Years | 0 (0.0%) | 0 (0.0%) |
| 5 Years | 0 (0.0%) | 0 (0.0%) |
| 6 to 11 Years | 61 (100.0%) | 11 (30.6%) |
| 12 to 14 Years | 11 (100.0%) | 93 (100.0%) |
| 15 Years | 0 (0.0%) | 46 (100.0%) |
| 16 and 17 Years | 0 (0.0%) | 40 (100.0%) |
| 18 to 24 Years | 91 (77.1%) | 88 (54.3%) |
| 25 to 34 Years | 0 (0.0%) | 49 (66.2%) |
| 35 to 44 Years | 74 (50.0%) | 143 (72.2%) |
| 45 to 54 Years | 125 (90.6%) | 126 (90.0%) |
| 55 to 64 Years | 0 (0.0%) | 0 (0.0%) |
| 65 to 74 Years | 0 (0.0%) | 68 (100.0%) |
| 75 Years and over | 39 (100.0%) | 0 (0.0%) |
| Total | 401 (71.7%) | 664 (72.4%) |
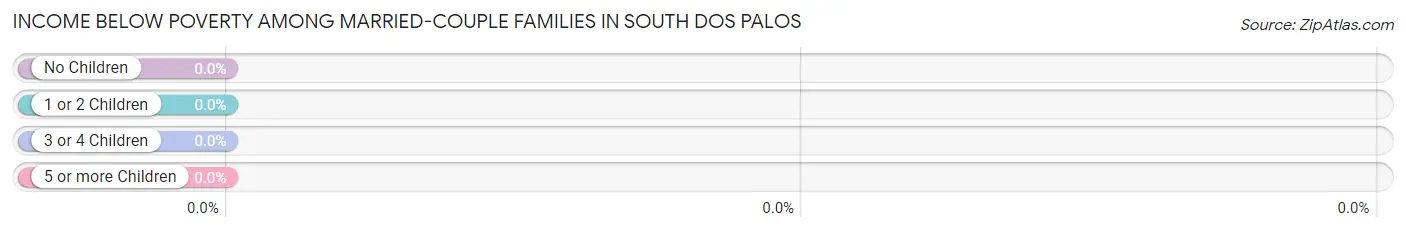
Income Below Poverty Among Married-Couple Families in South Dos Palos
| Children | Above Poverty | Below Poverty |
| No Children | 0 (0.0%) | 0 (0.0%) |
| 1 or 2 Children | 147 (100.0%) | 0 (0.0%) |
| 3 or 4 Children | 0 (0.0%) | 0 (0.0%) |
| 5 or more Children | 0 (0.0%) | 0 (0.0%) |
| Total | 147 (100.0%) | 0 (0.0%) |
Income Below Poverty Among Single-Parent Households in South Dos Palos
According to the poverty data in South Dos Palos, 100.0% or 39 single-father households and 30.8% or 62 single-mother households are living below the poverty line. Among single-father households, those with 1 or 2 children have the highest poverty rate, with 39 households (100.0%) experiencing poverty. Likewise, among single-mother households, those with no children have the highest poverty rate, with 62 households (40.5%) falling below the poverty line.
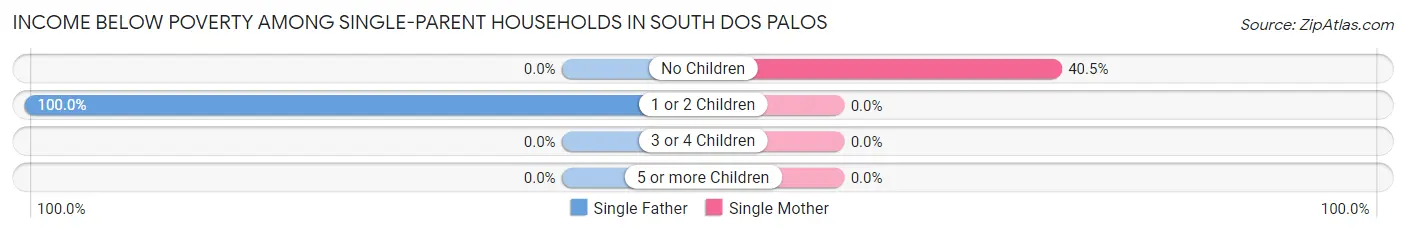
| Children | Single Father | Single Mother |
| No Children | 0 (0.0%) | 62 (40.5%) |
| 1 or 2 Children | 39 (100.0%) | 0 (0.0%) |
| 3 or 4 Children | 0 (0.0%) | 0 (0.0%) |
| 5 or more Children | 0 (0.0%) | 0 (0.0%) |
| Total | 39 (100.0%) | 62 (30.8%) |
Income Below Poverty Among Married-Couple vs Single-Parent Households in South Dos Palos
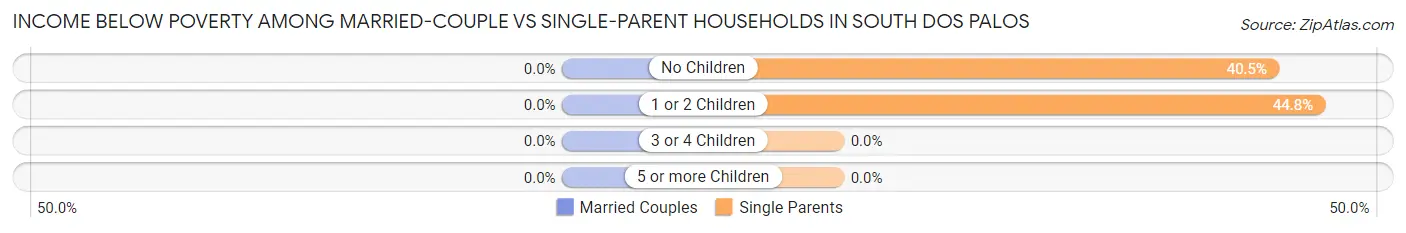
| Children | Married-Couple Families | Single-Parent Households |
| No Children | 0 (0.0%) | 62 (40.5%) |
| 1 or 2 Children | 0 (0.0%) | 39 (44.8%) |
| 3 or 4 Children | 0 (0.0%) | 0 (0.0%) |
| 5 or more Children | 0 (0.0%) | 0 (0.0%) |
| Total | 0 (0.0%) | 101 (42.1%) |
Race in South Dos Palos
The most populous races in South Dos Palos are Hispanic or Latino (1,188 | 80.5%), White / Caucasian (607 | 41.1%), and Some other Race (598 | 40.5%).
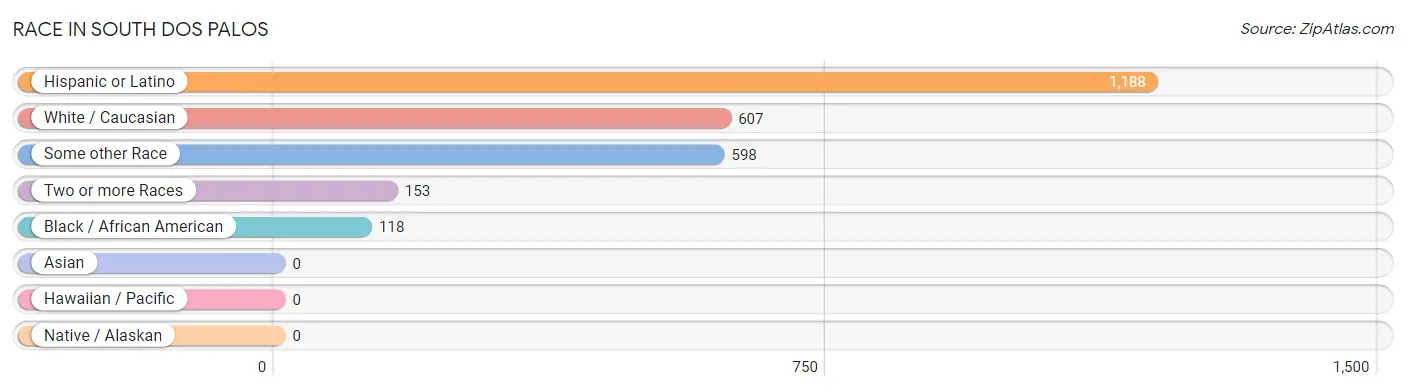
| Race | # Population | % Population |
| Asian | 0 | 0.0% |
| Black / African American | 118 | 8.0% |
| Hawaiian / Pacific | 0 | 0.0% |
| Hispanic or Latino | 1,188 | 80.5% |
| Native / Alaskan | 0 | 0.0% |
| White / Caucasian | 607 | 41.1% |
| Two or more Races | 153 | 10.4% |
| Some other Race | 598 | 40.5% |
| Total | 1,476 | 100.0% |
Ancestry in South Dos Palos
The most populous ancestries reported in South Dos Palos are Mexican (1,188 | 80.5%), Portuguese (20 | 1.4%), and American (10 | 0.7%), together accounting for 82.5% of all South Dos Palos residents.
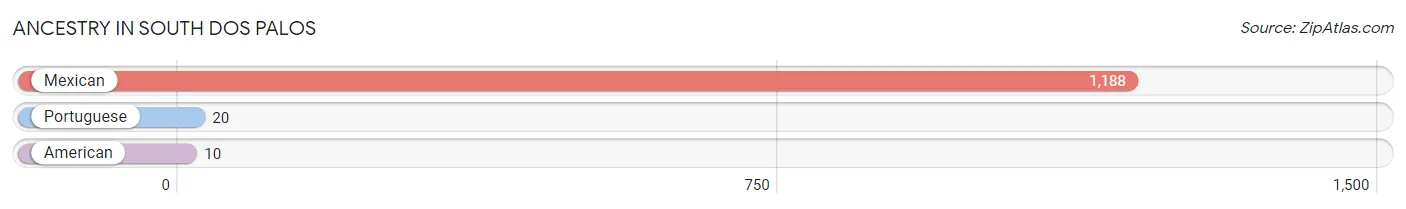
| Ancestry | # Population | % Population |
| American | 10 | 0.7% |
| Mexican | 1,188 | 80.5% |
| Portuguese | 20 | 1.4% | View All 3 Rows |
Immigrants in South Dos Palos
The most numerous immigrant groups reported in South Dos Palos came from Central America (411 | 27.9%), Latin America (411 | 27.9%), and Mexico (411 | 27.9%), together accounting for 83.6% of all South Dos Palos residents.
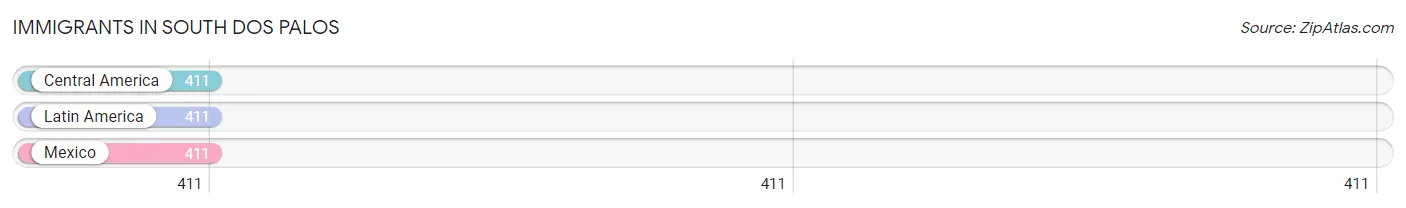
| Immigration Origin | # Population | % Population |
| Central America | 411 | 27.9% |
| Latin America | 411 | 27.9% |
| Mexico | 411 | 27.9% | View All 3 Rows |
Sex and Age in South Dos Palos
Sex and Age in South Dos Palos
The most populous age groups in South Dos Palos are 40 to 44 Years (131 | 23.4%) for men and 15 to 19 Years (157 | 17.1%) for women.
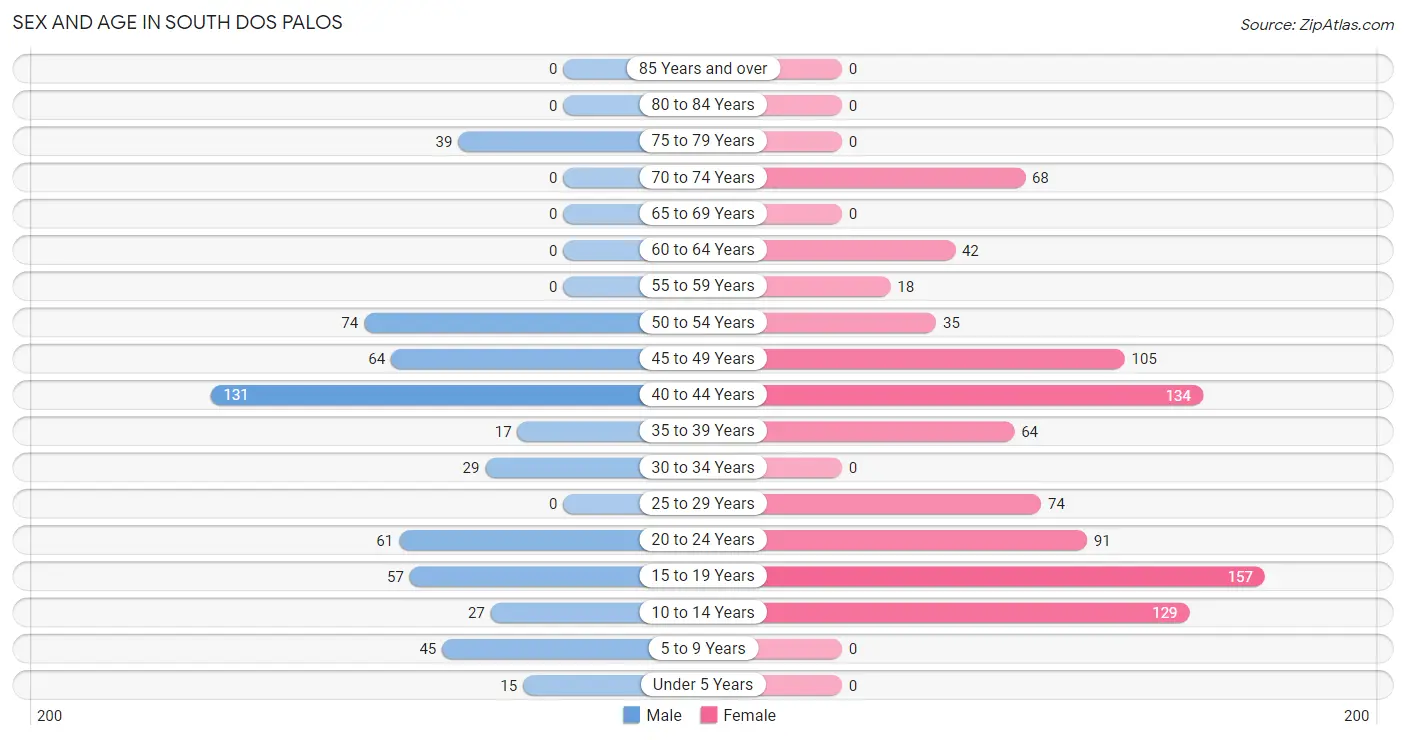
| Age Bracket | Male | Female |
| Under 5 Years | 15 (2.7%) | 0 (0.0%) |
| 5 to 9 Years | 45 (8.1%) | 0 (0.0%) |
| 10 to 14 Years | 27 (4.8%) | 129 (14.1%) |
| 15 to 19 Years | 57 (10.2%) | 157 (17.1%) |
| 20 to 24 Years | 61 (10.9%) | 91 (9.9%) |
| 25 to 29 Years | 0 (0.0%) | 74 (8.1%) |
| 30 to 34 Years | 29 (5.2%) | 0 (0.0%) |
| 35 to 39 Years | 17 (3.0%) | 64 (7.0%) |
| 40 to 44 Years | 131 (23.4%) | 134 (14.6%) |
| 45 to 49 Years | 64 (11.5%) | 105 (11.5%) |
| 50 to 54 Years | 74 (13.2%) | 35 (3.8%) |
| 55 to 59 Years | 0 (0.0%) | 18 (2.0%) |
| 60 to 64 Years | 0 (0.0%) | 42 (4.6%) |
| 65 to 69 Years | 0 (0.0%) | 0 (0.0%) |
| 70 to 74 Years | 0 (0.0%) | 68 (7.4%) |
| 75 to 79 Years | 39 (7.0%) | 0 (0.0%) |
| 80 to 84 Years | 0 (0.0%) | 0 (0.0%) |
| 85 Years and over | 0 (0.0%) | 0 (0.0%) |
| Total | 559 (100.0%) | 917 (100.0%) |
Families and Households in South Dos Palos
Median Family Size in South Dos Palos
The median family size in South Dos Palos is 3.40 persons per family, with single male/father families (39 | 10.1%) accounting for the largest median family size of 4.03 persons per family. On the other hand, single female/mother families (201 | 51.9%) represent the smallest median family size with 2.88 persons per family.
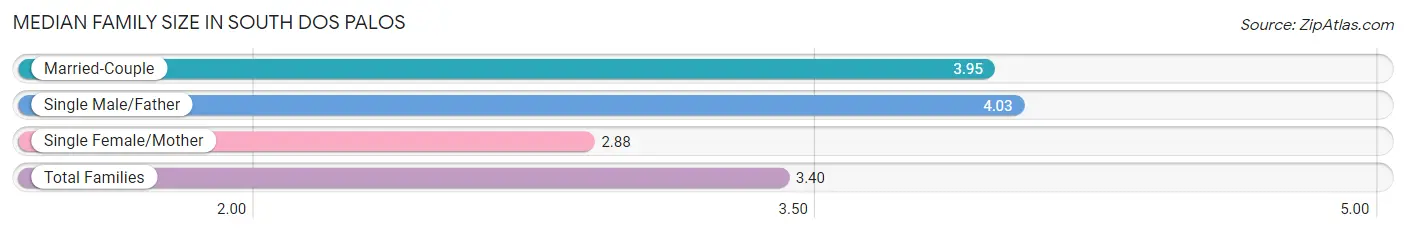
| Family Type | # Families | Family Size |
| Married-Couple | 147 (38.0%) | 3.95 |
| Single Male/Father | 39 (10.1%) | 4.03 |
| Single Female/Mother | 201 (51.9%) | 2.88 |
| Total Families | 387 (100.0%) | 3.40 |
Median Household Size in South Dos Palos
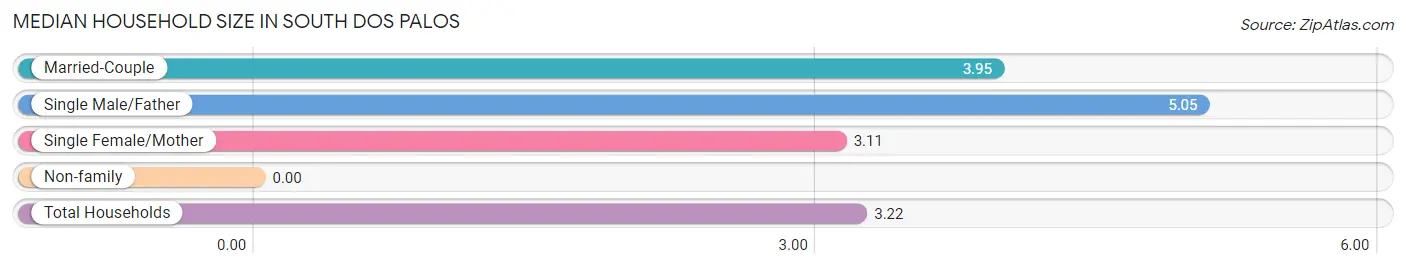
| Household Type | # Households | Household Size |
| Married-Couple | 147 (32.0%) | 3.95 |
| Single Male/Father | 39 (8.5%) | 5.05 |
| Single Female/Mother | 201 (43.8%) | 3.11 |
| Non-family | 72 (15.7%) | - |
| Total Households | 459 (100.0%) | 3.22 |
Household Size by Marriage Status in South Dos Palos
Out of a total of 459 households in South Dos Palos, 387 (84.3%) are family households, while 72 (15.7%) are nonfamily households. The most numerous type of family households are 3-person households, comprising 108, and the most common type of nonfamily households are 1-person households, comprising 72.
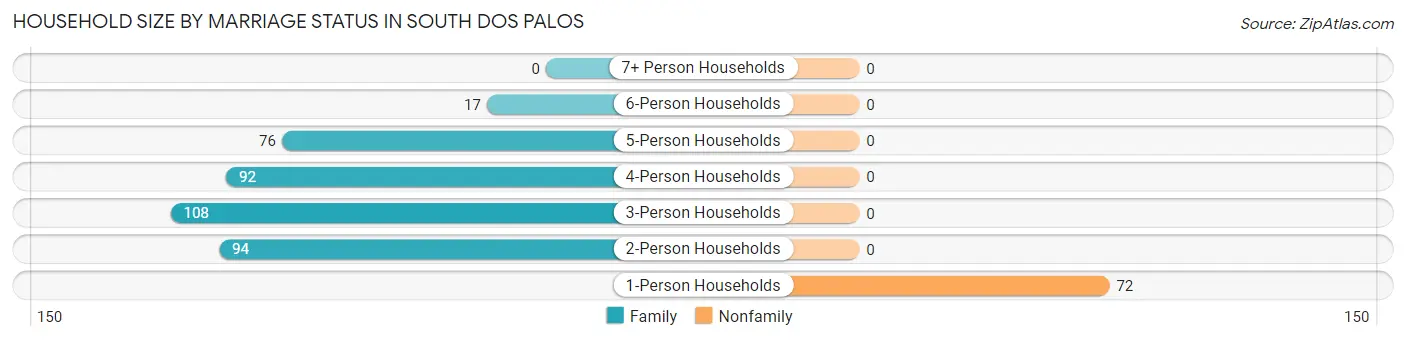
| Household Size | Family Households | Nonfamily Households |
| 1-Person Households | - | 72 (15.7%) |
| 2-Person Households | 94 (20.5%) | 0 (0.0%) |
| 3-Person Households | 108 (23.5%) | 0 (0.0%) |
| 4-Person Households | 92 (20.0%) | 0 (0.0%) |
| 5-Person Households | 76 (16.6%) | 0 (0.0%) |
| 6-Person Households | 17 (3.7%) | 0 (0.0%) |
| 7+ Person Households | 0 (0.0%) | 0 (0.0%) |
| Total | 387 (84.3%) | 72 (15.7%) |
Female Fertility in South Dos Palos
Fertility by Age in South Dos Palos
Average fertility rate in South Dos Palos is 40.0 births per 1,000 women. Women in the age bracket of 15 to 19 years have the highest fertility rate with 159.0 births per 1,000 women. Women in the age bracket of 15 to 19 years acount for 100.0% of all women with births.
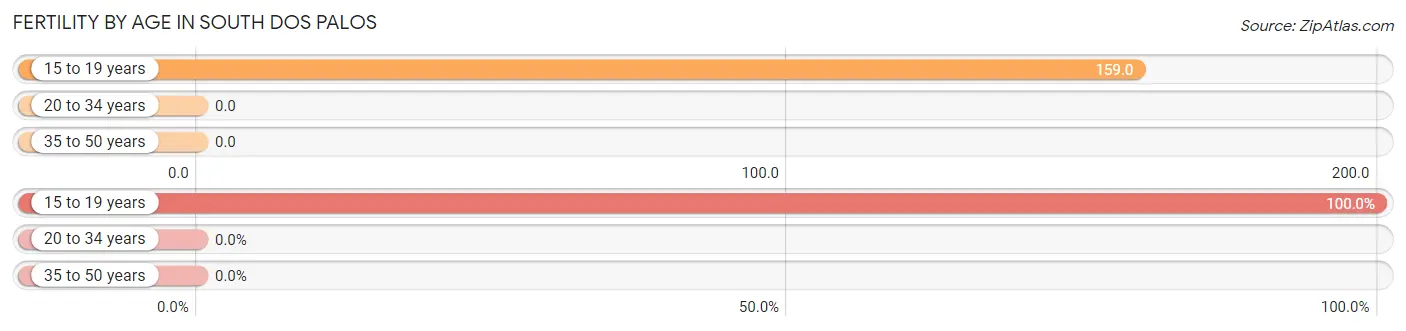
| Age Bracket | Women with Births | Births / 1,000 Women |
| 15 to 19 years | 25 (100.0%) | 159.0 |
| 20 to 34 years | 0 (0.0%) | 0.0 |
| 35 to 50 years | 0 (0.0%) | 0.0 |
| Total | 25 (100.0%) | 40.0 |
Fertility by Age by Marriage Status in South Dos Palos
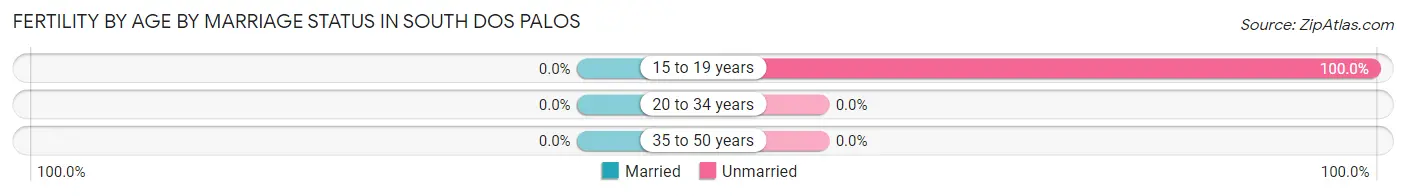
| Age Bracket | Married | Unmarried |
| 15 to 19 years | 0 (0.0%) | 25 (100.0%) |
| 20 to 34 years | 0 (0.0%) | 0 (0.0%) |
| 35 to 50 years | 0 (0.0%) | 0 (0.0%) |
| Total | 0 (0.0%) | 25 (100.0%) |
Fertility by Education in South Dos Palos
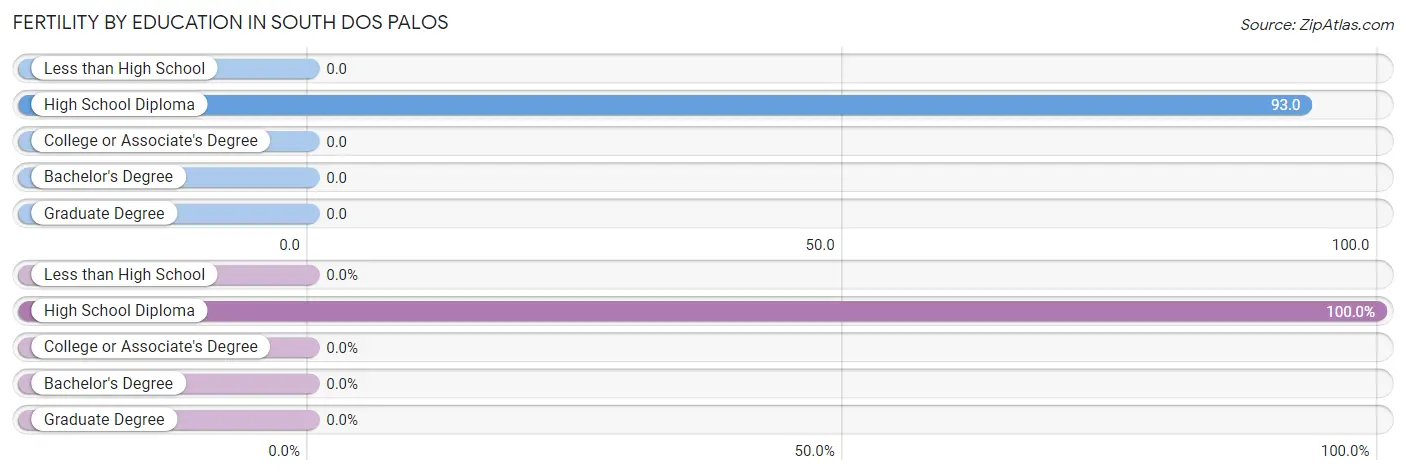
| Educational Attainment | Women with Births | Births / 1,000 Women |
| Less than High School | 0 (0.0%) | 0.0 |
| High School Diploma | 25 (100.0%) | 93.0 |
| College or Associate's Degree | 0 (0.0%) | 0.0 |
| Bachelor's Degree | 0 (0.0%) | 0.0 |
| Graduate Degree | 0 (0.0%) | 0.0 |
| Total | 25 (100.0%) | 40.0 |
Fertility by Education by Marriage Status in South Dos Palos
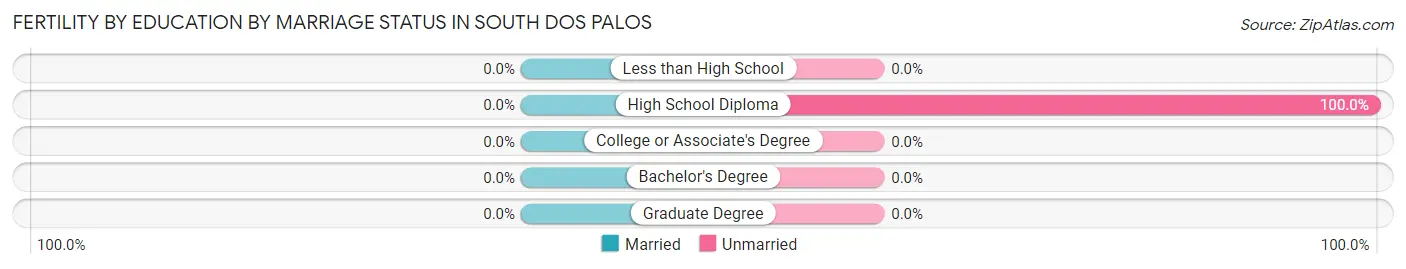
| Educational Attainment | Married | Unmarried |
| Less than High School | 0 (0.0%) | 0 (0.0%) |
| High School Diploma | 0 (0.0%) | 25 (100.0%) |
| College or Associate's Degree | 0 (0.0%) | 0 (0.0%) |
| Bachelor's Degree | 0 (0.0%) | 0 (0.0%) |
| Graduate Degree | 0 (0.0%) | 0 (0.0%) |
| Total | 0 (0.0%) | 25 (100.0%) |
Employment Characteristics in South Dos Palos
Employment by Class of Employer in South Dos Palos
Among the 514 employed individuals in South Dos Palos, private company employees (438 | 85.2%), state government employees (47 | 9.1%), and local government employees (18 | 3.5%) make up the most common classes of employment.
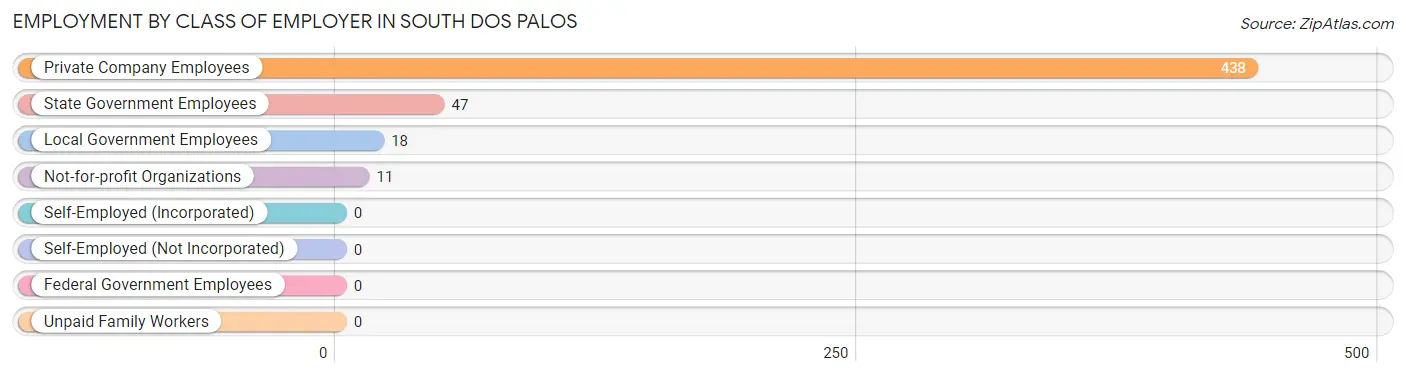
| Employer Class | # Employees | % Employees |
| Private Company Employees | 438 | 85.2% |
| Self-Employed (Incorporated) | 0 | 0.0% |
| Self-Employed (Not Incorporated) | 0 | 0.0% |
| Not-for-profit Organizations | 11 | 2.1% |
| Local Government Employees | 18 | 3.5% |
| State Government Employees | 47 | 9.1% |
| Federal Government Employees | 0 | 0.0% |
| Unpaid Family Workers | 0 | 0.0% |
| Total | 514 | 100.0% |
Employment Status by Age in South Dos Palos
According to the labor force statistics for South Dos Palos, out of the total population over 16 years of age (1,214), 51.5% or 625 individuals are in the labor force, with 17.8% or 111 of them unemployed. The age group with the highest labor force participation rate is 25 to 29 years, with 100.0% or 74 individuals in the labor force. Within the labor force, the 20 to 24 years age range has the highest percentage of unemployed individuals, with 63.5% or 80 of them being unemployed.
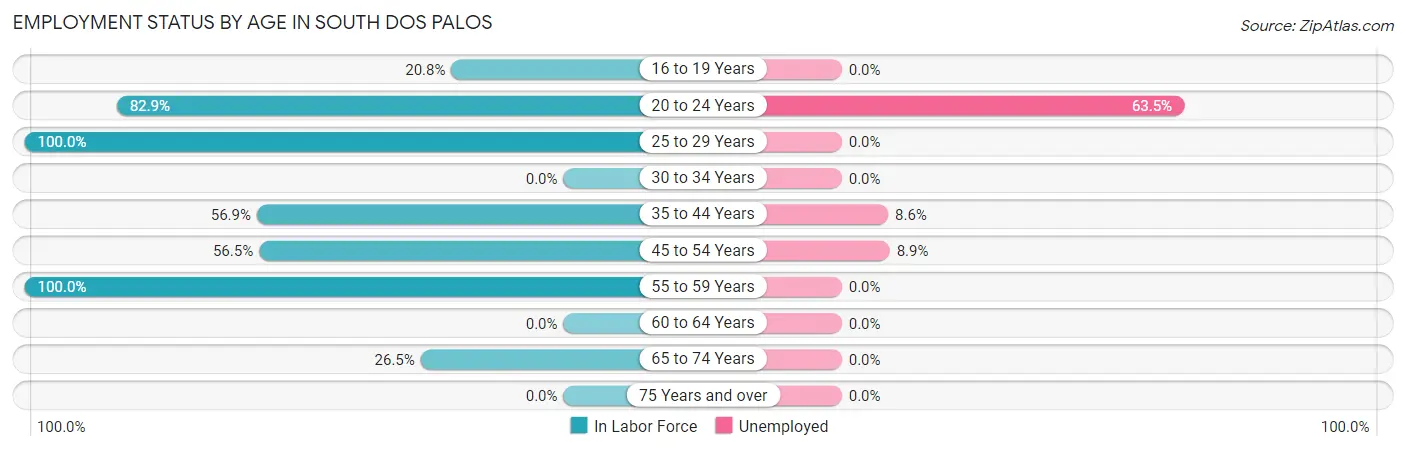
| Age Bracket | In Labor Force | Unemployed |
| 16 to 19 Years | 35 (20.8%) | 0 (0.0%) |
| 20 to 24 Years | 126 (82.9%) | 80 (63.5%) |
| 25 to 29 Years | 74 (100.0%) | 0 (0.0%) |
| 30 to 34 Years | 0 (0.0%) | 0 (0.0%) |
| 35 to 44 Years | 197 (56.9%) | 17 (8.6%) |
| 45 to 54 Years | 157 (56.5%) | 14 (8.9%) |
| 55 to 59 Years | 18 (100.0%) | 0 (0.0%) |
| 60 to 64 Years | 0 (0.0%) | 0 (0.0%) |
| 65 to 74 Years | 18 (26.5%) | 0 (0.0%) |
| 75 Years and over | 0 (0.0%) | 0 (0.0%) |
| Total | 625 (51.5%) | 111 (17.8%) |
Employment Status by Educational Attainment in South Dos Palos
According to labor force statistics for South Dos Palos, 56.7% of individuals (446) out of the total population between 25 and 64 years of age (787) are in the labor force, with 7.0% or 31 of them being unemployed. The group with the highest labor force participation rate are those with the educational attainment of college / associate degree, with 73.0% or 54 individuals in the labor force. Within the labor force, individuals with less than high school education have the highest percentage of unemployment, with 9.2% or 14 of them being unemployed.
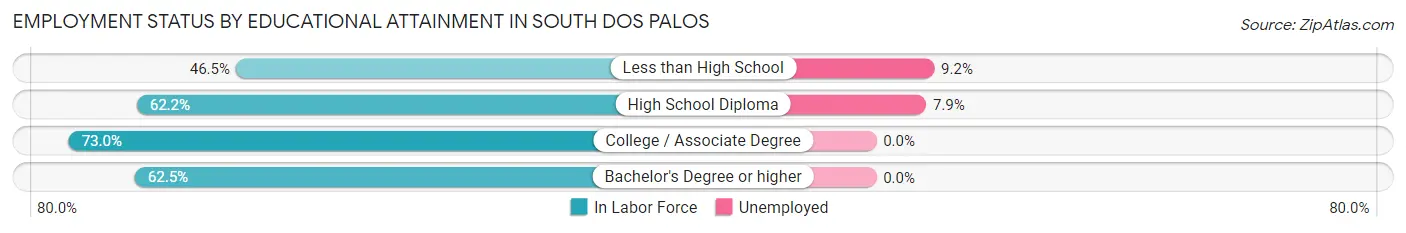
| Educational Attainment | In Labor Force | Unemployed |
| Less than High School | 153 (46.5%) | 30 (9.2%) |
| High School Diploma | 214 (62.2%) | 27 (7.9%) |
| College / Associate Degree | 54 (73.0%) | 0 (0.0%) |
| Bachelor's Degree or higher | 25 (62.5%) | 0 (0.0%) |
| Total | 446 (56.7%) | 55 (7.0%) |
Employment Occupations by Sex in South Dos Palos
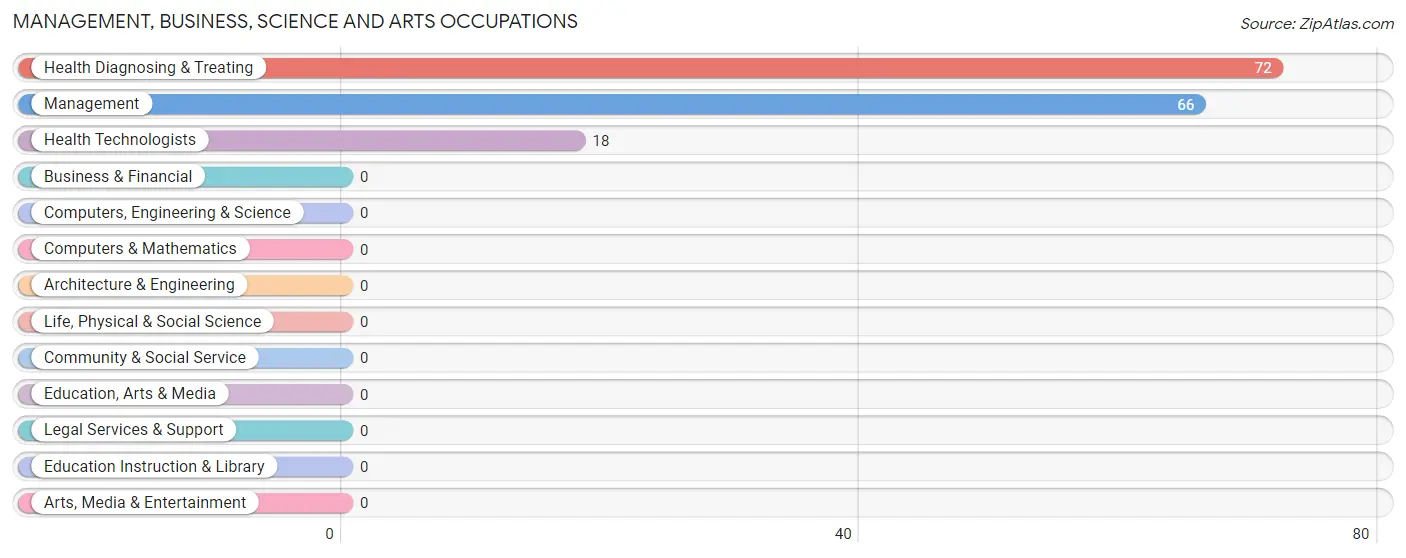
Management, Business, Science and Arts Occupations
The most common Management, Business, Science and Arts occupations in South Dos Palos are Health Diagnosing & Treating (72 | 14.0%), Management (66 | 12.8%), and Health Technologists (18 | 3.5%).
Management, Business, Science and Arts Occupations by Sex
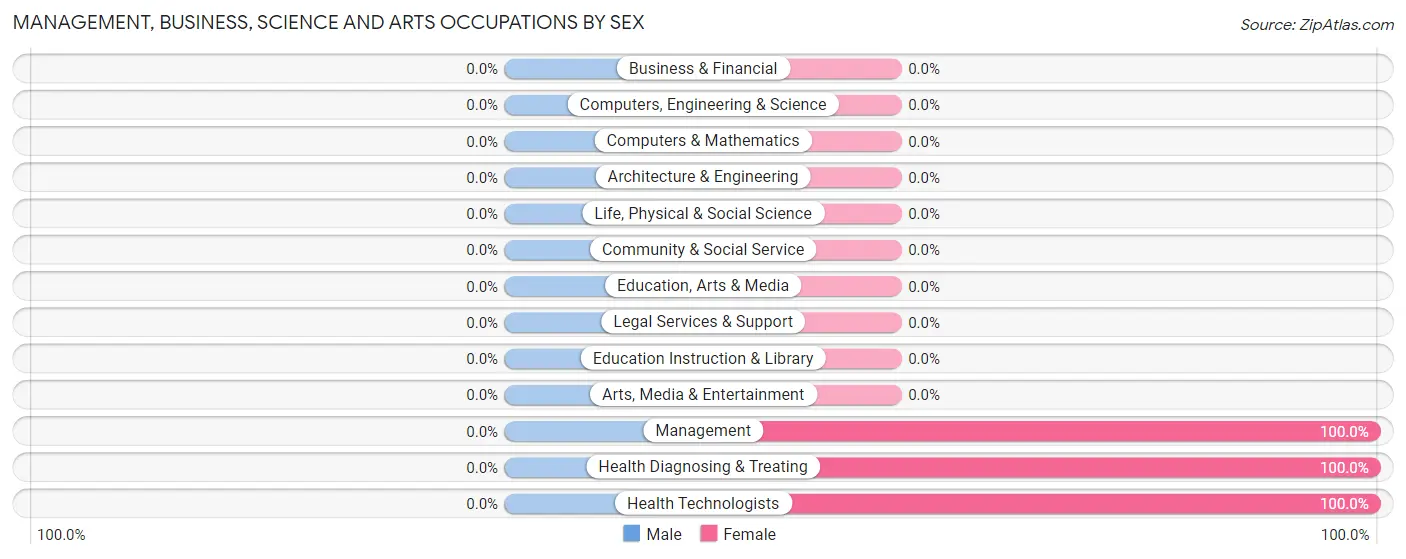
| Occupation | Male | Female |
| Management | 0 (0.0%) | 66 (100.0%) |
| Business & Financial | 0 (0.0%) | 0 (0.0%) |
| Computers, Engineering & Science | 0 (0.0%) | 0 (0.0%) |
| Computers & Mathematics | 0 (0.0%) | 0 (0.0%) |
| Architecture & Engineering | 0 (0.0%) | 0 (0.0%) |
| Life, Physical & Social Science | 0 (0.0%) | 0 (0.0%) |
| Community & Social Service | 0 (0.0%) | 0 (0.0%) |
| Education, Arts & Media | 0 (0.0%) | 0 (0.0%) |
| Legal Services & Support | 0 (0.0%) | 0 (0.0%) |
| Education Instruction & Library | 0 (0.0%) | 0 (0.0%) |
| Arts, Media & Entertainment | 0 (0.0%) | 0 (0.0%) |
| Health Diagnosing & Treating | 0 (0.0%) | 72 (100.0%) |
| Health Technologists | 0 (0.0%) | 18 (100.0%) |
| Total (Category) | 0 (0.0%) | 138 (100.0%) |
| Total (Overall) | 183 (35.6%) | 331 (64.4%) |
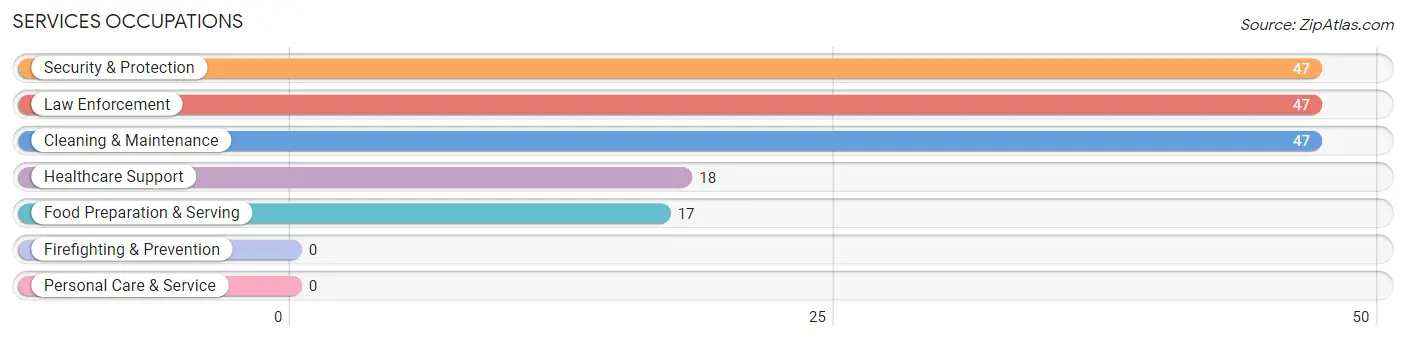
Services Occupations
The most common Services occupations in South Dos Palos are Security & Protection (47 | 9.1%), Law Enforcement (47 | 9.1%), Cleaning & Maintenance (47 | 9.1%), Healthcare Support (18 | 3.5%), and Food Preparation & Serving (17 | 3.3%).
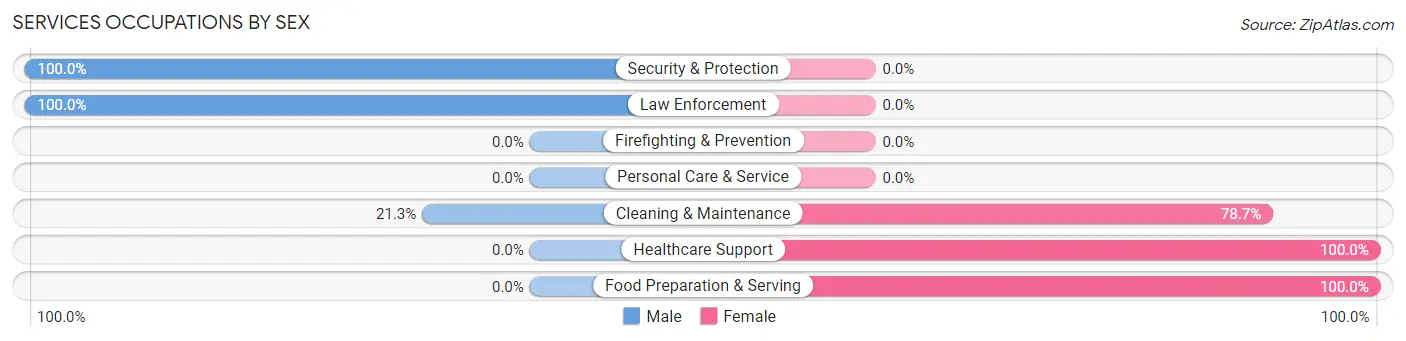
Services Occupations by Sex
Within the Services occupations in South Dos Palos, the most male-oriented occupations are Security & Protection (100.0%), Law Enforcement (100.0%), and Cleaning & Maintenance (21.3%), while the most female-oriented occupations are Healthcare Support (100.0%), Food Preparation & Serving (100.0%), and Cleaning & Maintenance (78.7%).
| Occupation | Male | Female |
| Healthcare Support | 0 (0.0%) | 18 (100.0%) |
| Security & Protection | 47 (100.0%) | 0 (0.0%) |
| Firefighting & Prevention | 0 (0.0%) | 0 (0.0%) |
| Law Enforcement | 47 (100.0%) | 0 (0.0%) |
| Food Preparation & Serving | 0 (0.0%) | 17 (100.0%) |
| Cleaning & Maintenance | 10 (21.3%) | 37 (78.7%) |
| Personal Care & Service | 0 (0.0%) | 0 (0.0%) |
| Total (Category) | 57 (44.2%) | 72 (55.8%) |
| Total (Overall) | 183 (35.6%) | 331 (64.4%) |
Sales and Office Occupations
The most common Sales and Office occupations in South Dos Palos are , and Office & Administration (37 | 7.2%).
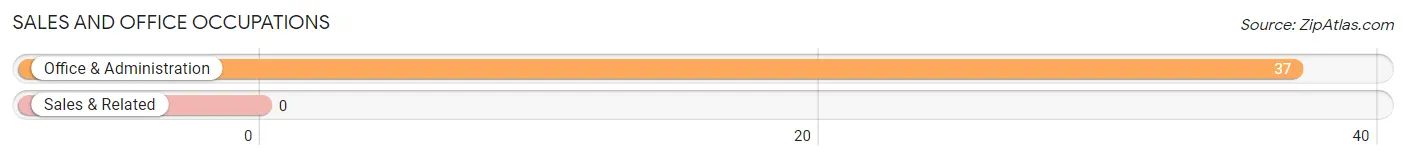
Sales and Office Occupations by Sex
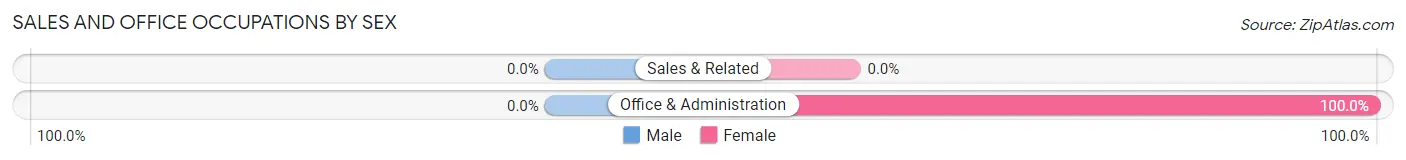
| Occupation | Male | Female |
| Sales & Related | 0 (0.0%) | 0 (0.0%) |
| Office & Administration | 0 (0.0%) | 37 (100.0%) |
| Total (Category) | 0 (0.0%) | 37 (100.0%) |
| Total (Overall) | 183 (35.6%) | 331 (64.4%) |
Natural Resources, Construction and Maintenance Occupations
The most common Natural Resources, Construction and Maintenance occupations in South Dos Palos are , and Farming, Fishing & Forestry (81 | 15.8%).
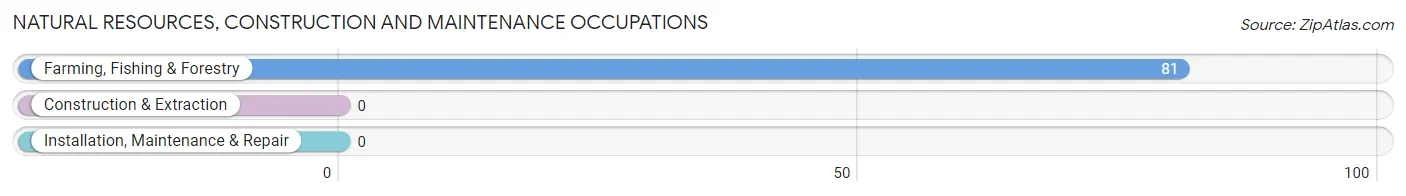
Natural Resources, Construction and Maintenance Occupations by Sex
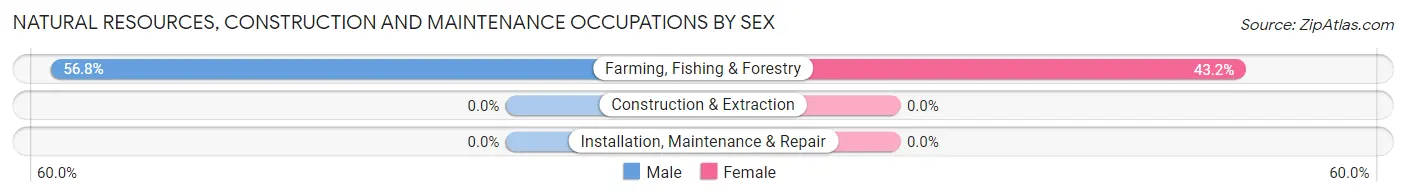
| Occupation | Male | Female |
| Farming, Fishing & Forestry | 46 (56.8%) | 35 (43.2%) |
| Construction & Extraction | 0 (0.0%) | 0 (0.0%) |
| Installation, Maintenance & Repair | 0 (0.0%) | 0 (0.0%) |
| Total (Category) | 46 (56.8%) | 35 (43.2%) |
| Total (Overall) | 183 (35.6%) | 331 (64.4%) |
Production, Transportation and Moving Occupations
The most common Production, Transportation and Moving occupations in South Dos Palos are Material Moving (80 | 15.6%), and Production (49 | 9.5%).
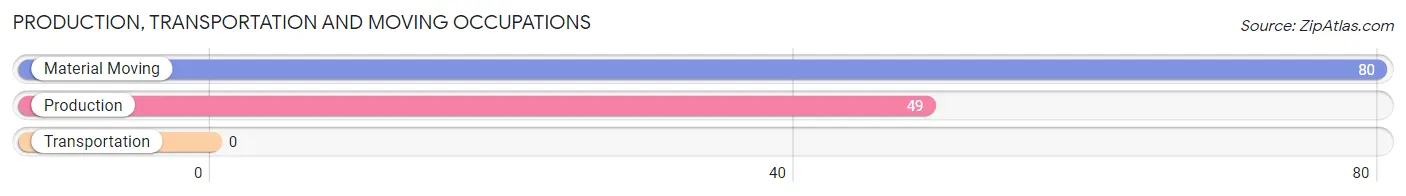
Production, Transportation and Moving Occupations by Sex
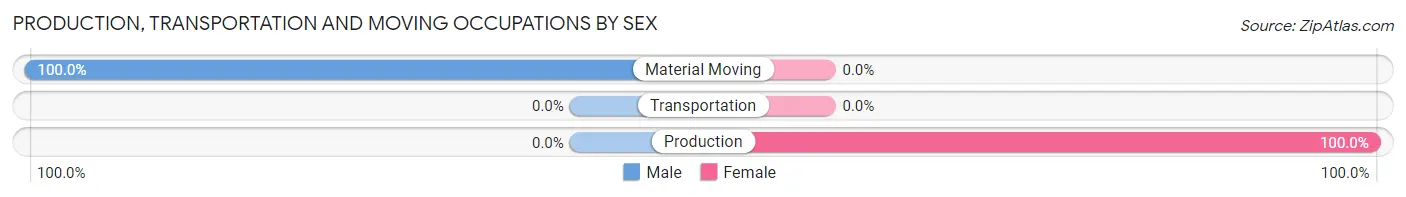
| Occupation | Male | Female |
| Production | 0 (0.0%) | 49 (100.0%) |
| Transportation | 0 (0.0%) | 0 (0.0%) |
| Material Moving | 80 (100.0%) | 0 (0.0%) |
| Total (Category) | 80 (62.0%) | 49 (38.0%) |
| Total (Overall) | 183 (35.6%) | 331 (64.4%) |
Employment Industries by Sex in South Dos Palos
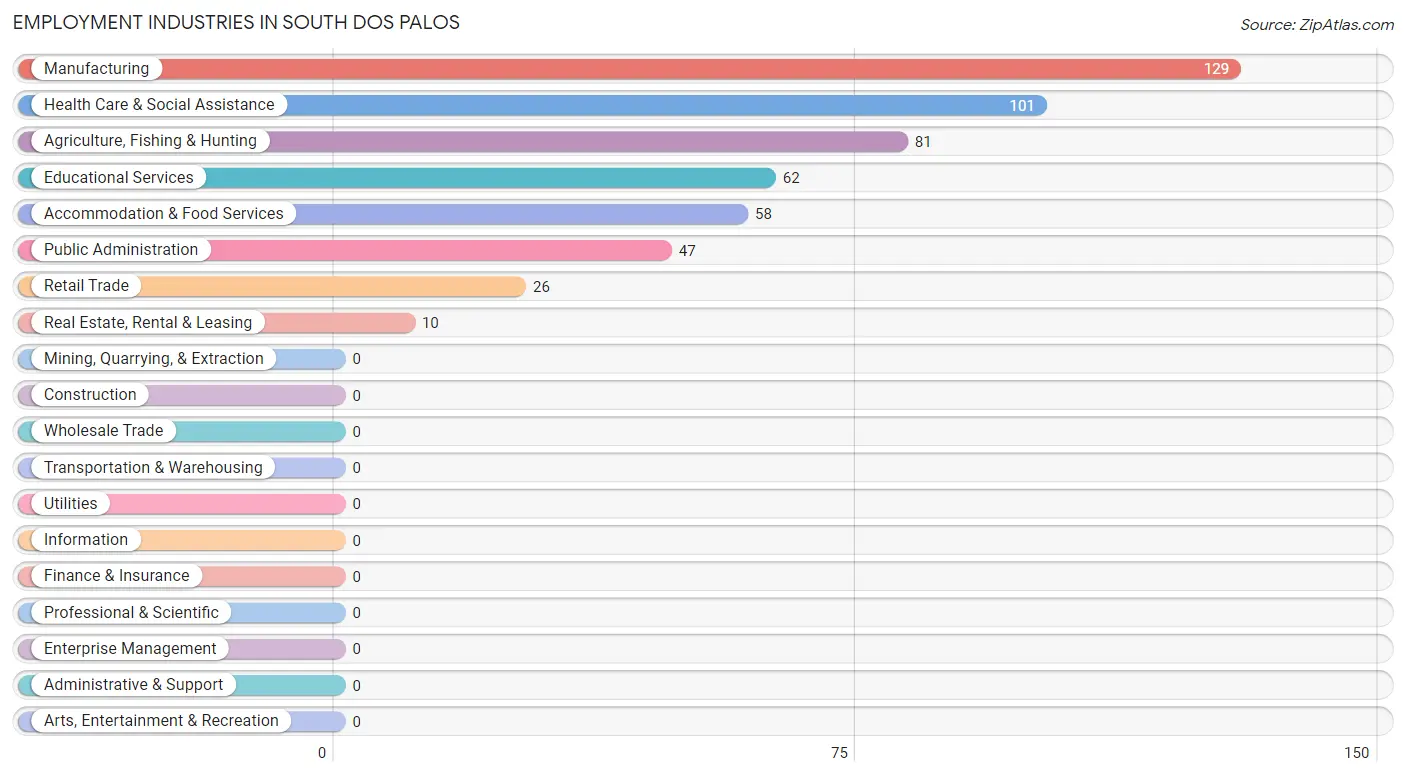
Employment Industries in South Dos Palos
The major employment industries in South Dos Palos include Manufacturing (129 | 25.1%), Health Care & Social Assistance (101 | 19.7%), Agriculture, Fishing & Hunting (81 | 15.8%), Educational Services (62 | 12.1%), and Accommodation & Food Services (58 | 11.3%).
Employment Industries by Sex in South Dos Palos
The South Dos Palos industries that see more men than women are Real Estate, Rental & Leasing (100.0%), Public Administration (100.0%), and Manufacturing (62.0%), whereas the industries that tend to have a higher number of women are Retail Trade (100.0%), Educational Services (100.0%), and Health Care & Social Assistance (100.0%).
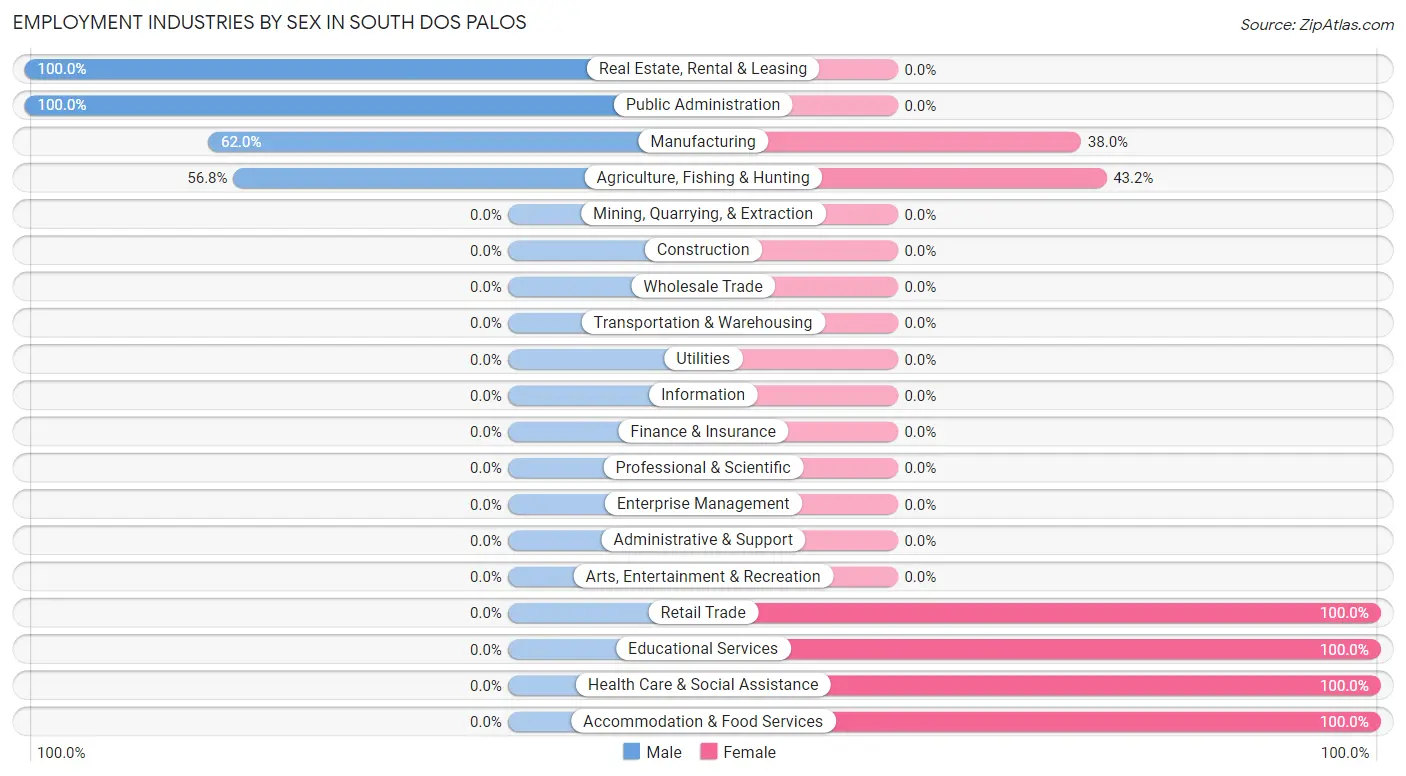
| Industry | Male | Female |
| Agriculture, Fishing & Hunting | 46 (56.8%) | 35 (43.2%) |
| Mining, Quarrying, & Extraction | 0 (0.0%) | 0 (0.0%) |
| Construction | 0 (0.0%) | 0 (0.0%) |
| Manufacturing | 80 (62.0%) | 49 (38.0%) |
| Wholesale Trade | 0 (0.0%) | 0 (0.0%) |
| Retail Trade | 0 (0.0%) | 26 (100.0%) |
| Transportation & Warehousing | 0 (0.0%) | 0 (0.0%) |
| Utilities | 0 (0.0%) | 0 (0.0%) |
| Information | 0 (0.0%) | 0 (0.0%) |
| Finance & Insurance | 0 (0.0%) | 0 (0.0%) |
| Real Estate, Rental & Leasing | 10 (100.0%) | 0 (0.0%) |
| Professional & Scientific | 0 (0.0%) | 0 (0.0%) |
| Enterprise Management | 0 (0.0%) | 0 (0.0%) |
| Administrative & Support | 0 (0.0%) | 0 (0.0%) |
| Educational Services | 0 (0.0%) | 62 (100.0%) |
| Health Care & Social Assistance | 0 (0.0%) | 101 (100.0%) |
| Arts, Entertainment & Recreation | 0 (0.0%) | 0 (0.0%) |
| Accommodation & Food Services | 0 (0.0%) | 58 (100.0%) |
| Public Administration | 47 (100.0%) | 0 (0.0%) |
| Total | 183 (35.6%) | 331 (64.4%) |
Education in South Dos Palos
School Enrollment in South Dos Palos
The most common levels of schooling among the 387 students in South Dos Palos are high school (120 | 31.0%), middle school (111 | 28.7%), and college / undergraduate (85 | 22.0%).
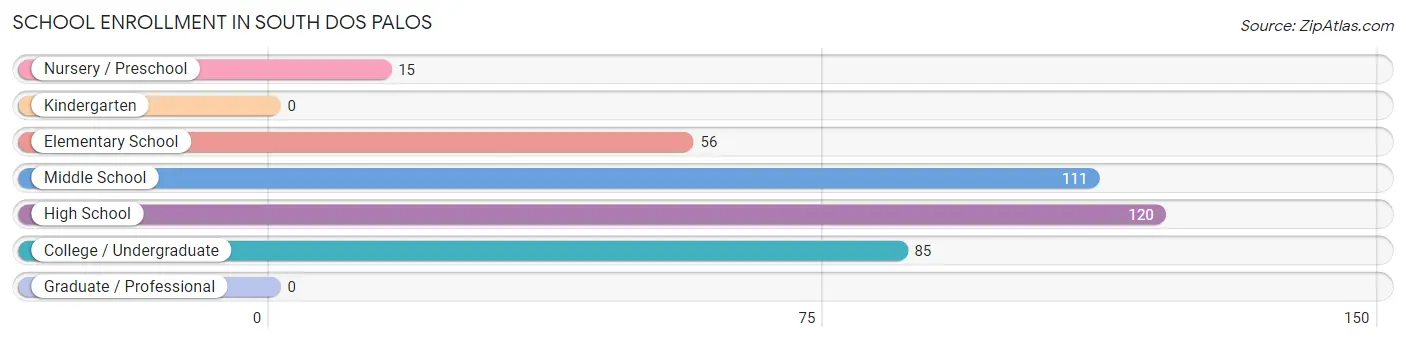
| School Level | # Students | % Students |
| Nursery / Preschool | 15 | 3.9% |
| Kindergarten | 0 | 0.0% |
| Elementary School | 56 | 14.5% |
| Middle School | 111 | 28.7% |
| High School | 120 | 31.0% |
| College / Undergraduate | 85 | 22.0% |
| Graduate / Professional | 0 | 0.0% |
| Total | 387 | 100.0% |
School Enrollment by Age by Funding Source in South Dos Palos
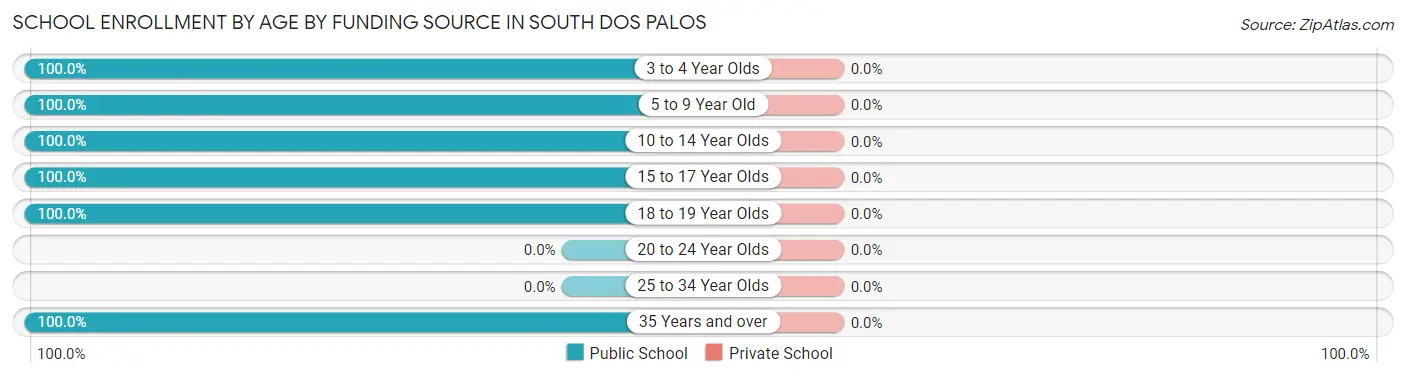
| Age Bracket | Public School | Private School |
| 3 to 4 Year Olds | 15 (100.0%) | 0 (0.0%) |
| 5 to 9 Year Old | 45 (100.0%) | 0 (0.0%) |
| 10 to 14 Year Olds | 156 (100.0%) | 0 (0.0%) |
| 15 to 17 Year Olds | 86 (100.0%) | 0 (0.0%) |
| 18 to 19 Year Olds | 68 (100.0%) | 0 (0.0%) |
| 20 to 24 Year Olds | 0 (0.0%) | 0 (0.0%) |
| 25 to 34 Year Olds | 0 (0.0%) | 0 (0.0%) |
| 35 Years and over | 17 (100.0%) | 0 (0.0%) |
| Total | 387 (100.0%) | 0 (0.0%) |
Educational Attainment by Field of Study in South Dos Palos
Psychology (25 | 43.1%), bio, nature & agricultural (18 | 31.0%), and social sciences (15 | 25.9%) are the most common fields of study among 58 individuals in South Dos Palos who have obtained a bachelor's degree or higher.
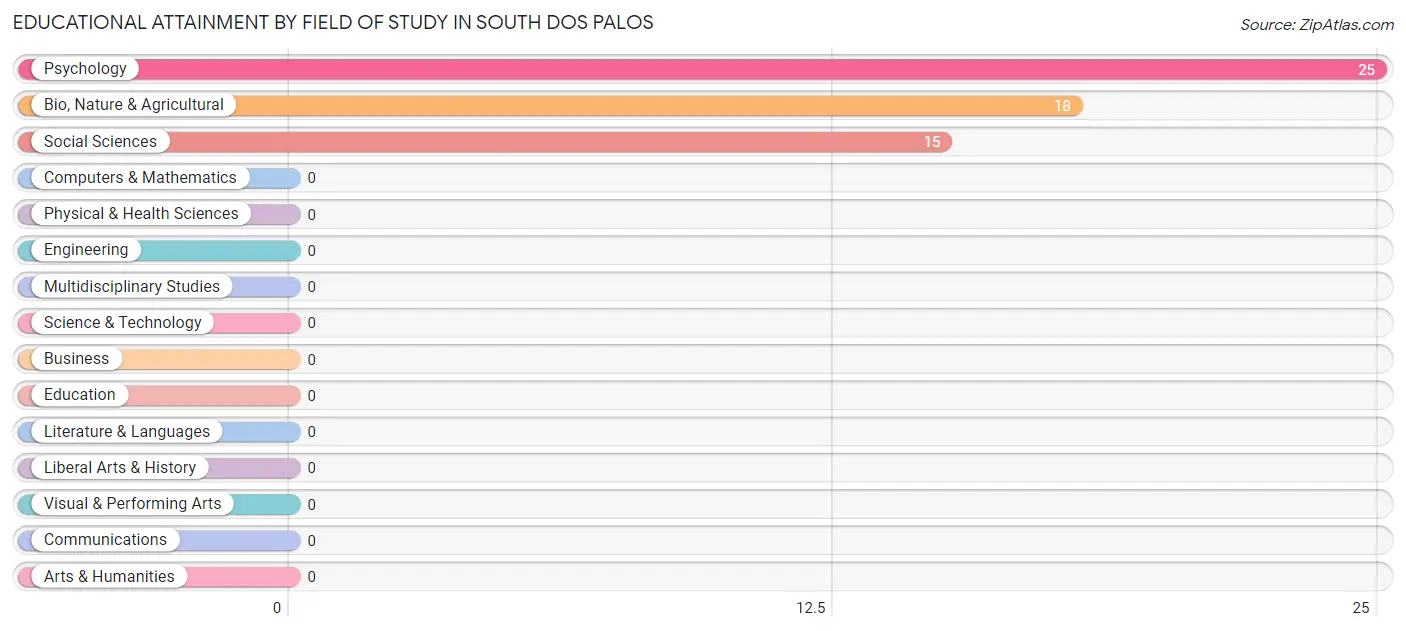
| Field of Study | # Graduates | % Graduates |
| Computers & Mathematics | 0 | 0.0% |
| Bio, Nature & Agricultural | 18 | 31.0% |
| Physical & Health Sciences | 0 | 0.0% |
| Psychology | 25 | 43.1% |
| Social Sciences | 15 | 25.9% |
| Engineering | 0 | 0.0% |
| Multidisciplinary Studies | 0 | 0.0% |
| Science & Technology | 0 | 0.0% |
| Business | 0 | 0.0% |
| Education | 0 | 0.0% |
| Literature & Languages | 0 | 0.0% |
| Liberal Arts & History | 0 | 0.0% |
| Visual & Performing Arts | 0 | 0.0% |
| Communications | 0 | 0.0% |
| Arts & Humanities | 0 | 0.0% |
| Total | 58 | 100.0% |
Transportation & Commute in South Dos Palos
Vehicle Availability by Sex in South Dos Palos
The most prevalent vehicle ownership categories in South Dos Palos are males with 3 vehicles (138, accounting for 75.4%) and females with 3 vehicles (121, making up 41.7%).
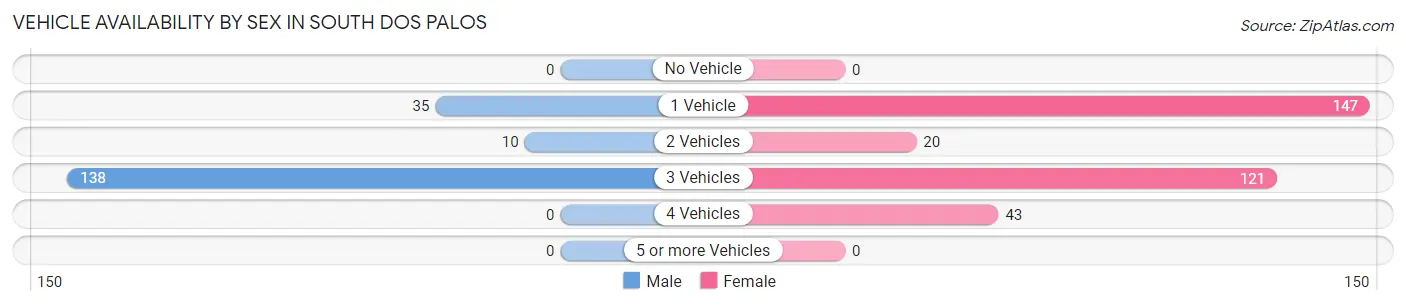
| Vehicles Available | Male | Female |
| No Vehicle | 0 (0.0%) | 0 (0.0%) |
| 1 Vehicle | 35 (19.1%) | 147 (44.4%) |
| 2 Vehicles | 10 (5.5%) | 20 (6.0%) |
| 3 Vehicles | 138 (75.4%) | 121 (36.6%) |
| 4 Vehicles | 0 (0.0%) | 43 (13.0%) |
| 5 or more Vehicles | 0 (0.0%) | 0 (0.0%) |
| Total | 183 (100.0%) | 331 (100.0%) |
Commute Time in South Dos Palos
The most frequently occuring commute durations in South Dos Palos are 90 or more minutes (127 commuters, 27.0%), 5 to 9 minutes (104 commuters, 22.1%), and 30 to 34 minutes (74 commuters, 15.7%).
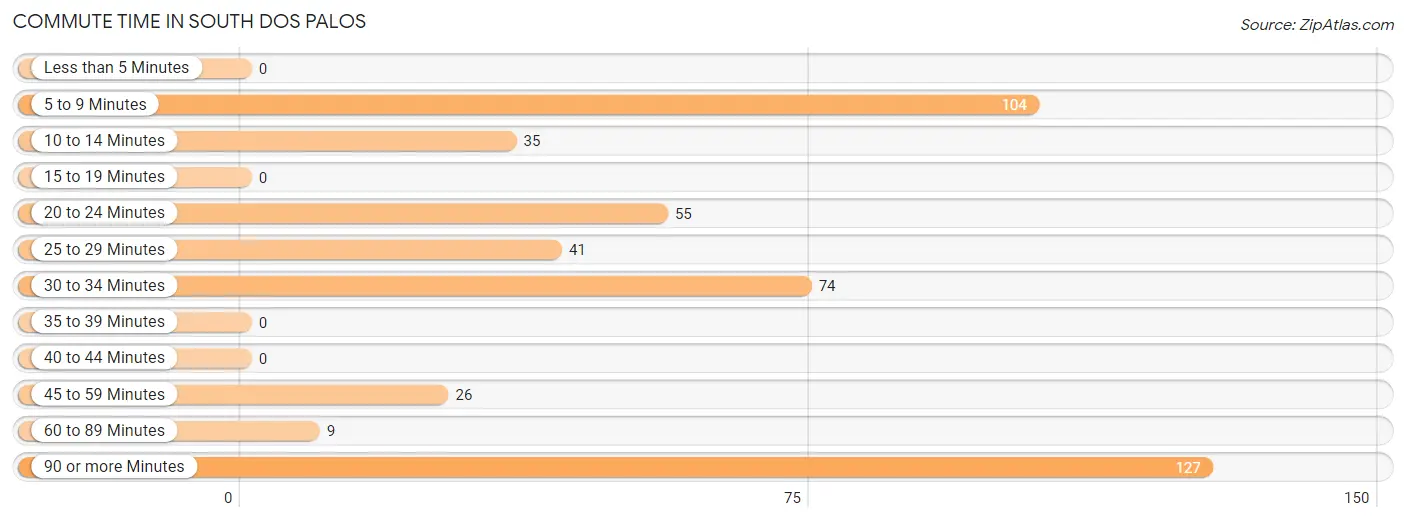
| Commute Time | # Commuters | % Commuters |
| Less than 5 Minutes | 0 | 0.0% |
| 5 to 9 Minutes | 104 | 22.1% |
| 10 to 14 Minutes | 35 | 7.4% |
| 15 to 19 Minutes | 0 | 0.0% |
| 20 to 24 Minutes | 55 | 11.7% |
| 25 to 29 Minutes | 41 | 8.7% |
| 30 to 34 Minutes | 74 | 15.7% |
| 35 to 39 Minutes | 0 | 0.0% |
| 40 to 44 Minutes | 0 | 0.0% |
| 45 to 59 Minutes | 26 | 5.5% |
| 60 to 89 Minutes | 9 | 1.9% |
| 90 or more Minutes | 127 | 27.0% |
Commute Time by Sex in South Dos Palos
The most common commute times in South Dos Palos are 90 or more minutes (82 commuters, 44.8%) for males and 5 to 9 minutes (104 commuters, 36.1%) for females.
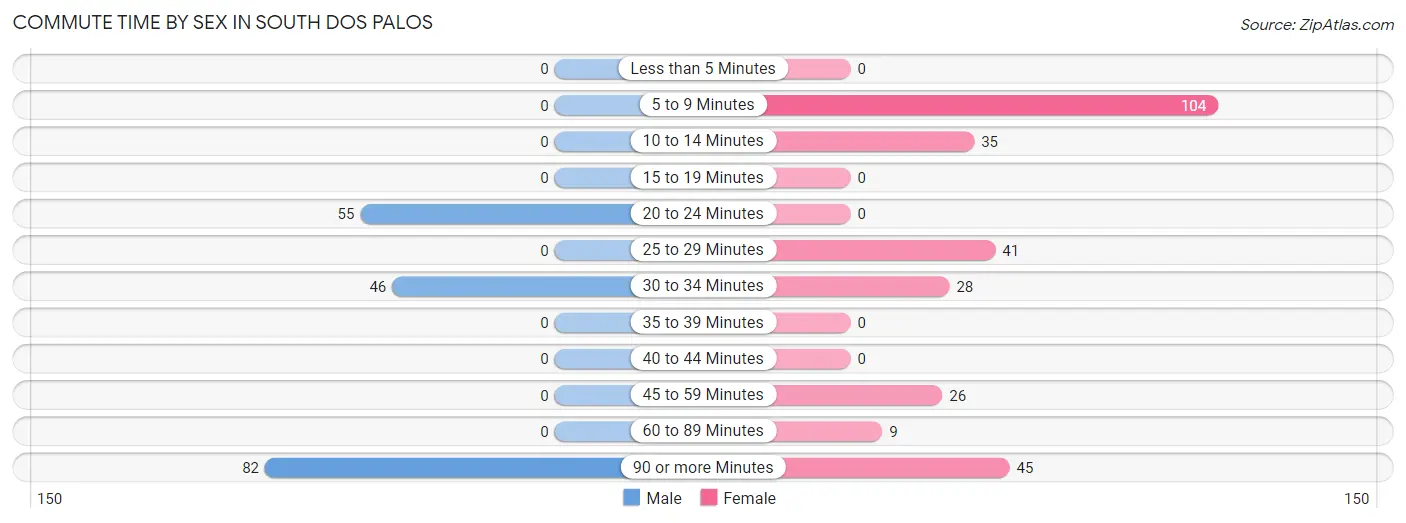
| Commute Time | Male | Female |
| Less than 5 Minutes | 0 (0.0%) | 0 (0.0%) |
| 5 to 9 Minutes | 0 (0.0%) | 104 (36.1%) |
| 10 to 14 Minutes | 0 (0.0%) | 35 (12.1%) |
| 15 to 19 Minutes | 0 (0.0%) | 0 (0.0%) |
| 20 to 24 Minutes | 55 (30.0%) | 0 (0.0%) |
| 25 to 29 Minutes | 0 (0.0%) | 41 (14.2%) |
| 30 to 34 Minutes | 46 (25.1%) | 28 (9.7%) |
| 35 to 39 Minutes | 0 (0.0%) | 0 (0.0%) |
| 40 to 44 Minutes | 0 (0.0%) | 0 (0.0%) |
| 45 to 59 Minutes | 0 (0.0%) | 26 (9.0%) |
| 60 to 89 Minutes | 0 (0.0%) | 9 (3.1%) |
| 90 or more Minutes | 82 (44.8%) | 45 (15.6%) |
Time of Departure to Work by Sex in South Dos Palos
The most frequent times of departure to work in South Dos Palos are 12:00 AM to 4:59 AM (47, 25.7%) for males and 6:00 AM to 6:29 AM (86, 29.9%) for females.
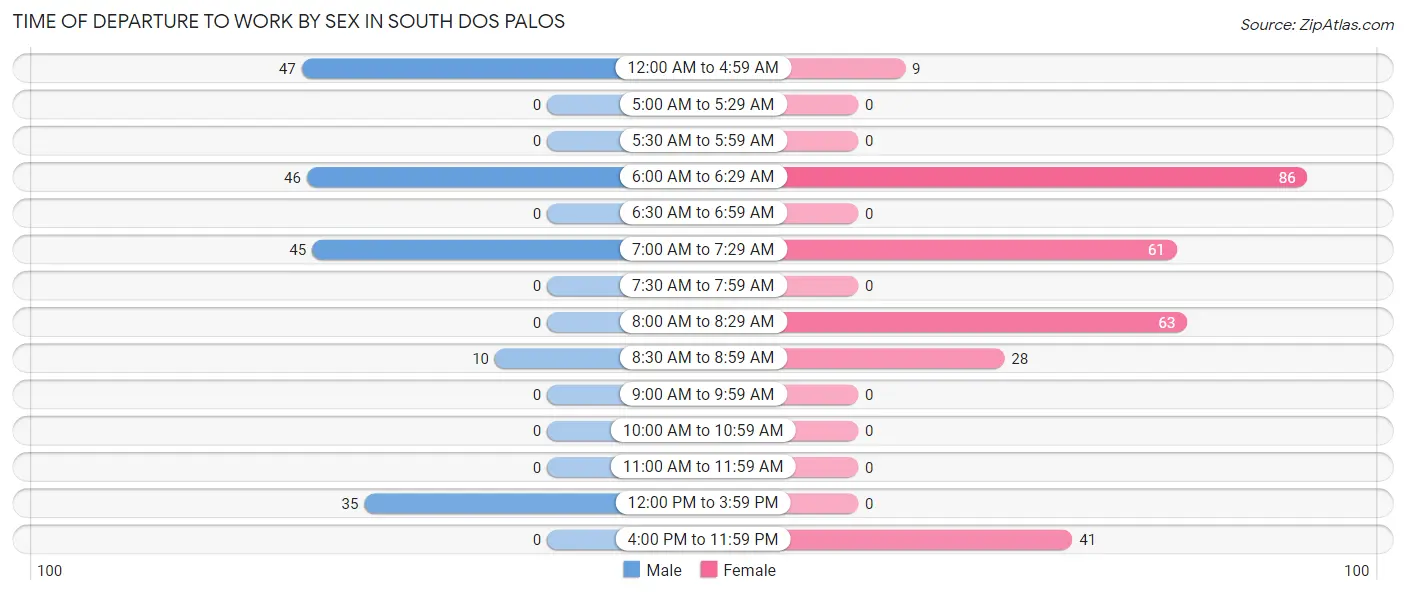
| Time of Departure | Male | Female |
| 12:00 AM to 4:59 AM | 47 (25.7%) | 9 (3.1%) |
| 5:00 AM to 5:29 AM | 0 (0.0%) | 0 (0.0%) |
| 5:30 AM to 5:59 AM | 0 (0.0%) | 0 (0.0%) |
| 6:00 AM to 6:29 AM | 46 (25.1%) | 86 (29.9%) |
| 6:30 AM to 6:59 AM | 0 (0.0%) | 0 (0.0%) |
| 7:00 AM to 7:29 AM | 45 (24.6%) | 61 (21.2%) |
| 7:30 AM to 7:59 AM | 0 (0.0%) | 0 (0.0%) |
| 8:00 AM to 8:29 AM | 0 (0.0%) | 63 (21.9%) |
| 8:30 AM to 8:59 AM | 10 (5.5%) | 28 (9.7%) |
| 9:00 AM to 9:59 AM | 0 (0.0%) | 0 (0.0%) |
| 10:00 AM to 10:59 AM | 0 (0.0%) | 0 (0.0%) |
| 11:00 AM to 11:59 AM | 0 (0.0%) | 0 (0.0%) |
| 12:00 PM to 3:59 PM | 35 (19.1%) | 0 (0.0%) |
| 4:00 PM to 11:59 PM | 0 (0.0%) | 41 (14.2%) |
| Total | 183 (100.0%) | 288 (100.0%) |
Housing Occupancy in South Dos Palos
Occupancy by Ownership in South Dos Palos
Of the total 459 dwellings in South Dos Palos, owner-occupied units account for 199 (43.4%), while renter-occupied units make up 260 (56.6%).
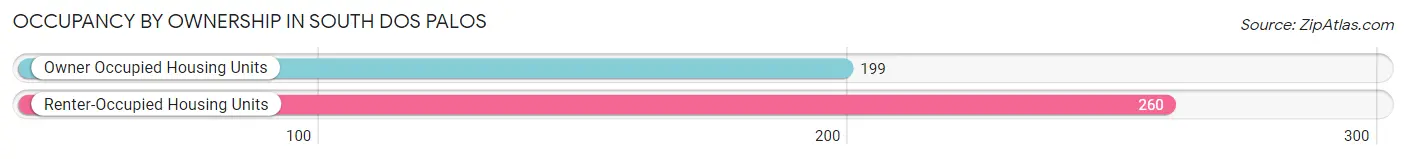
| Occupancy | # Housing Units | % Housing Units |
| Owner Occupied Housing Units | 199 | 43.4% |
| Renter-Occupied Housing Units | 260 | 56.6% |
| Total Occupied Housing Units | 459 | 100.0% |
Occupancy by Household Size in South Dos Palos
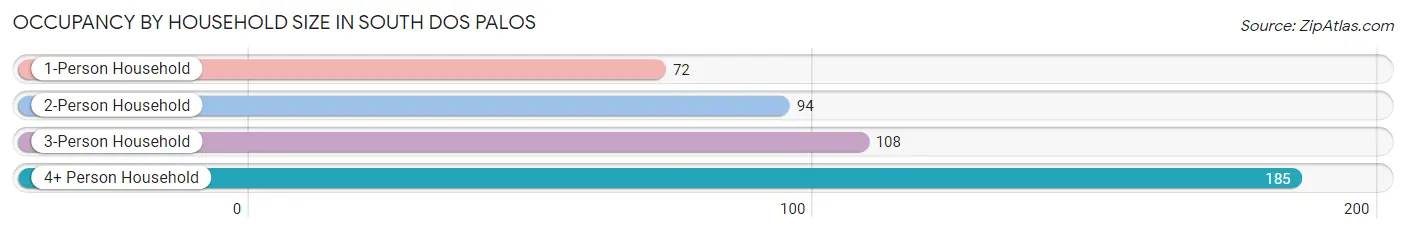
| Household Size | # Housing Units | % Housing Units |
| 1-Person Household | 72 | 15.7% |
| 2-Person Household | 94 | 20.5% |
| 3-Person Household | 108 | 23.5% |
| 4+ Person Household | 185 | 40.3% |
| Total Housing Units | 459 | 100.0% |
Occupancy by Ownership by Household Size in South Dos Palos
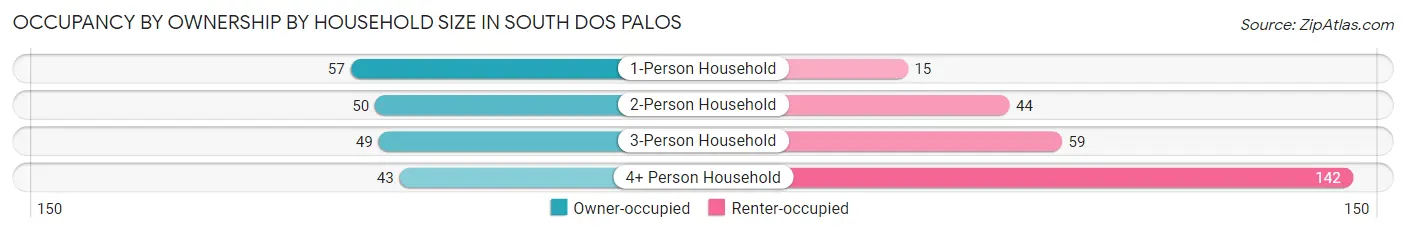
| Household Size | Owner-occupied | Renter-occupied |
| 1-Person Household | 57 (79.2%) | 15 (20.8%) |
| 2-Person Household | 50 (53.2%) | 44 (46.8%) |
| 3-Person Household | 49 (45.4%) | 59 (54.6%) |
| 4+ Person Household | 43 (23.2%) | 142 (76.8%) |
| Total Housing Units | 199 (43.4%) | 260 (56.6%) |
Occupancy by Educational Attainment in South Dos Palos
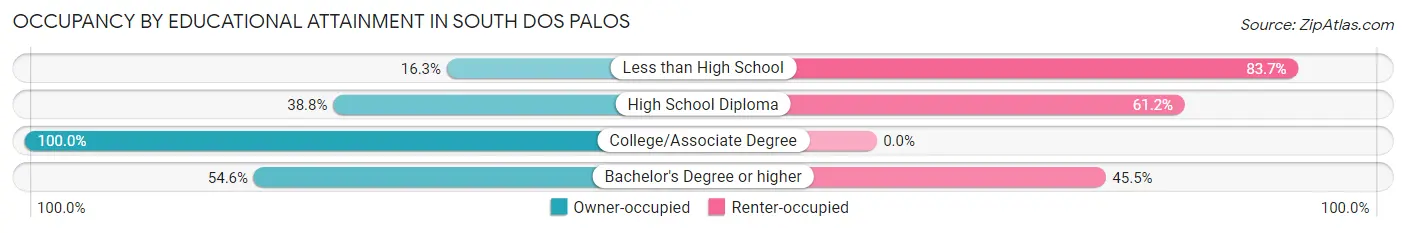
| Household Size | Owner-occupied | Renter-occupied |
| Less than High School | 28 (16.3%) | 144 (83.7%) |
| High School Diploma | 64 (38.8%) | 101 (61.2%) |
| College/Associate Degree | 89 (100.0%) | 0 (0.0%) |
| Bachelor's Degree or higher | 18 (54.5%) | 15 (45.5%) |
Occupancy by Age of Householder in South Dos Palos
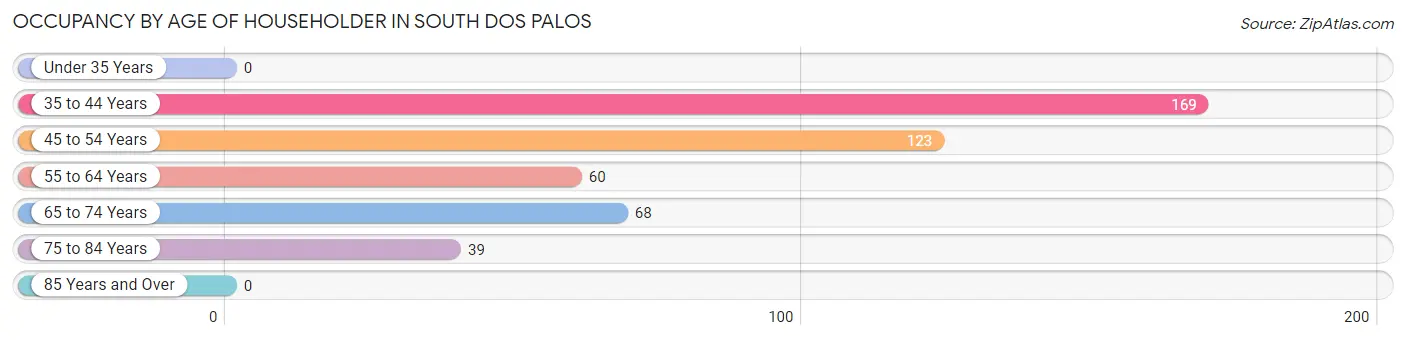
| Age Bracket | # Households | % Households |
| Under 35 Years | 0 | 0.0% |
| 35 to 44 Years | 169 | 36.8% |
| 45 to 54 Years | 123 | 26.8% |
| 55 to 64 Years | 60 | 13.1% |
| 65 to 74 Years | 68 | 14.8% |
| 75 to 84 Years | 39 | 8.5% |
| 85 Years and Over | 0 | 0.0% |
| Total | 459 | 100.0% |
Housing Finances in South Dos Palos
Median Income by Occupancy in South Dos Palos
| Occupancy Type | # Households | Median Income |
| Owner-Occupied | 199 (43.4%) | $0 |
| Renter-Occupied | 260 (56.6%) | $0 |
| Average | 459 (100.0%) | $0 |
Occupancy by Householder Income Bracket in South Dos Palos
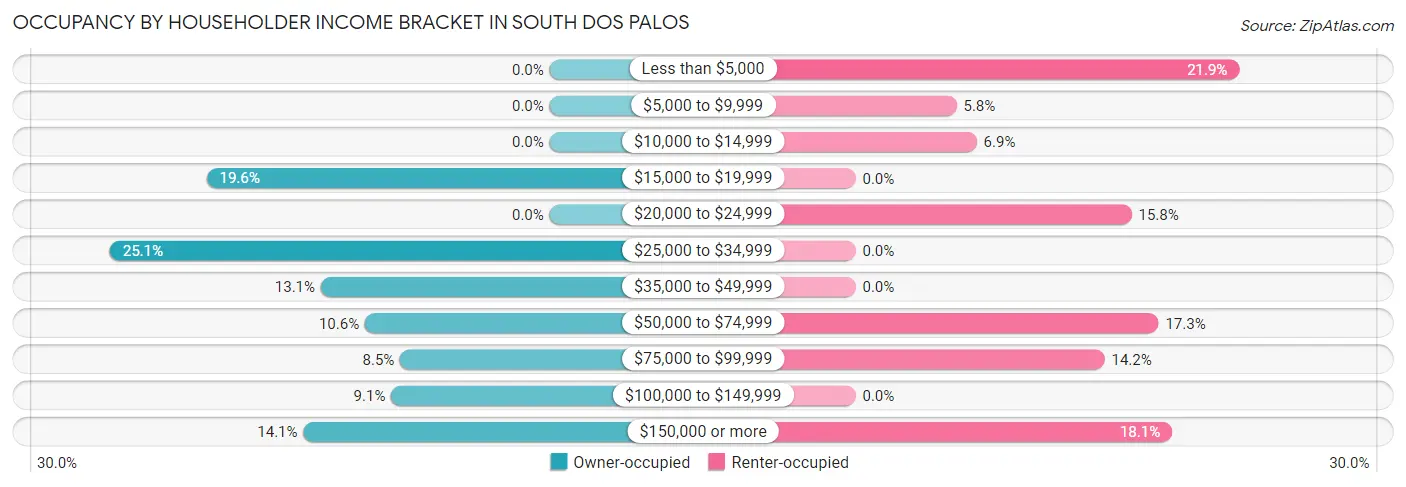
| Income Bracket | Owner-occupied | Renter-occupied |
| Less than $5,000 | 0 (0.0%) | 57 (21.9%) |
| $5,000 to $9,999 | 0 (0.0%) | 15 (5.8%) |
| $10,000 to $14,999 | 0 (0.0%) | 18 (6.9%) |
| $15,000 to $19,999 | 39 (19.6%) | 0 (0.0%) |
| $20,000 to $24,999 | 0 (0.0%) | 41 (15.8%) |
| $25,000 to $34,999 | 50 (25.1%) | 0 (0.0%) |
| $35,000 to $49,999 | 26 (13.1%) | 0 (0.0%) |
| $50,000 to $74,999 | 21 (10.5%) | 45 (17.3%) |
| $75,000 to $99,999 | 17 (8.5%) | 37 (14.2%) |
| $100,000 to $149,999 | 18 (9.0%) | 0 (0.0%) |
| $150,000 or more | 28 (14.1%) | 47 (18.1%) |
| Total | 199 (100.0%) | 260 (100.0%) |
Monthly Housing Cost Tiers in South Dos Palos
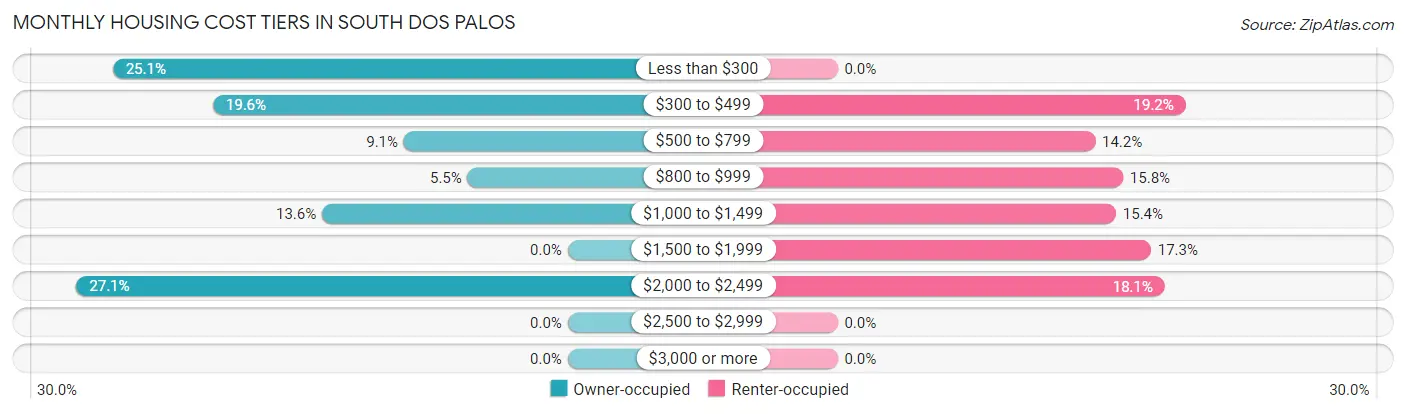
| Monthly Cost | Owner-occupied | Renter-occupied |
| Less than $300 | 50 (25.1%) | 0 (0.0%) |
| $300 to $499 | 39 (19.6%) | 50 (19.2%) |
| $500 to $799 | 18 (9.0%) | 37 (14.2%) |
| $800 to $999 | 11 (5.5%) | 41 (15.8%) |
| $1,000 to $1,499 | 27 (13.6%) | 40 (15.4%) |
| $1,500 to $1,999 | 0 (0.0%) | 45 (17.3%) |
| $2,000 to $2,499 | 54 (27.1%) | 47 (18.1%) |
| $2,500 to $2,999 | 0 (0.0%) | 0 (0.0%) |
| $3,000 or more | 0 (0.0%) | 0 (0.0%) |
| Total | 199 (100.0%) | 260 (100.0%) |
Physical Housing Characteristics in South Dos Palos
Housing Structures in South Dos Palos
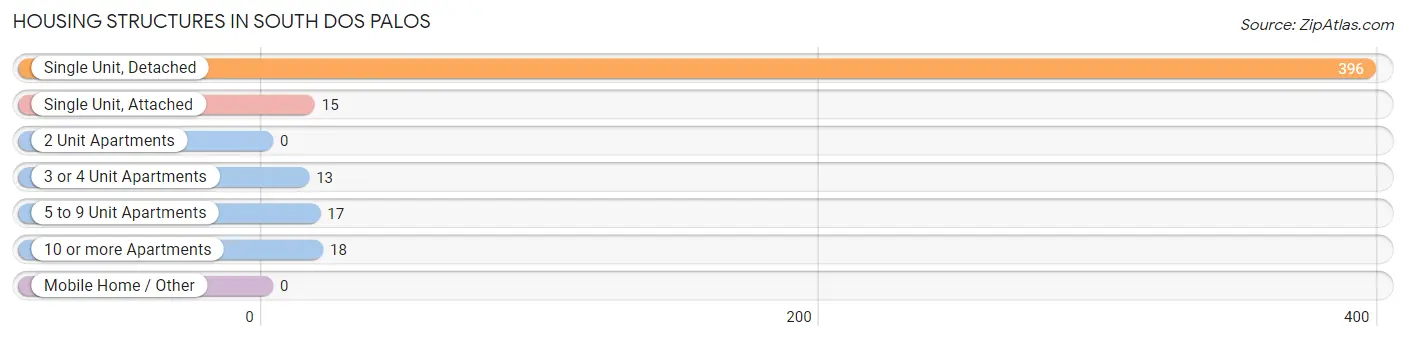
| Structure Type | # Housing Units | % Housing Units |
| Single Unit, Detached | 396 | 86.3% |
| Single Unit, Attached | 15 | 3.3% |
| 2 Unit Apartments | 0 | 0.0% |
| 3 or 4 Unit Apartments | 13 | 2.8% |
| 5 to 9 Unit Apartments | 17 | 3.7% |
| 10 or more Apartments | 18 | 3.9% |
| Mobile Home / Other | 0 | 0.0% |
| Total | 459 | 100.0% |
Housing Structures by Occupancy in South Dos Palos
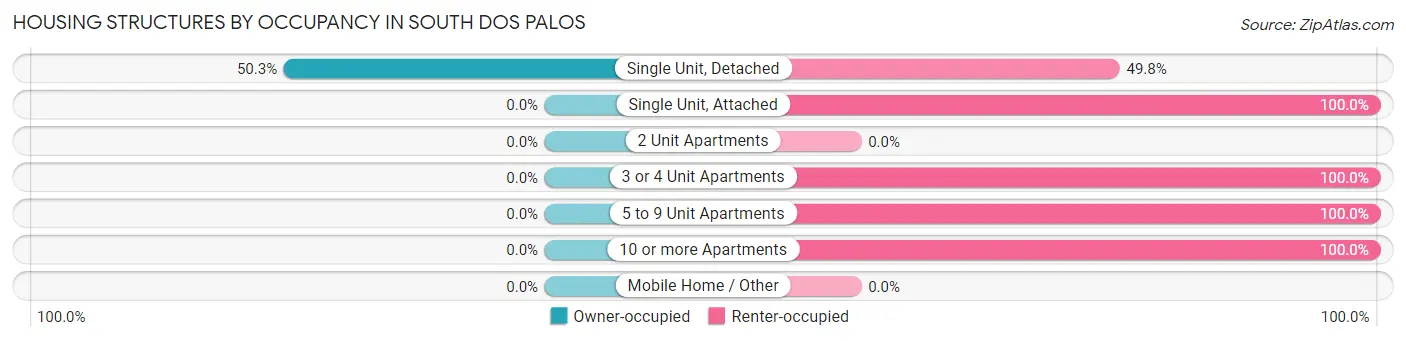
| Structure Type | Owner-occupied | Renter-occupied |
| Single Unit, Detached | 199 (50.2%) | 197 (49.7%) |
| Single Unit, Attached | 0 (0.0%) | 15 (100.0%) |
| 2 Unit Apartments | 0 (0.0%) | 0 (0.0%) |
| 3 or 4 Unit Apartments | 0 (0.0%) | 13 (100.0%) |
| 5 to 9 Unit Apartments | 0 (0.0%) | 17 (100.0%) |
| 10 or more Apartments | 0 (0.0%) | 18 (100.0%) |
| Mobile Home / Other | 0 (0.0%) | 0 (0.0%) |
| Total | 199 (43.4%) | 260 (56.6%) |
Housing Structures by Number of Rooms in South Dos Palos
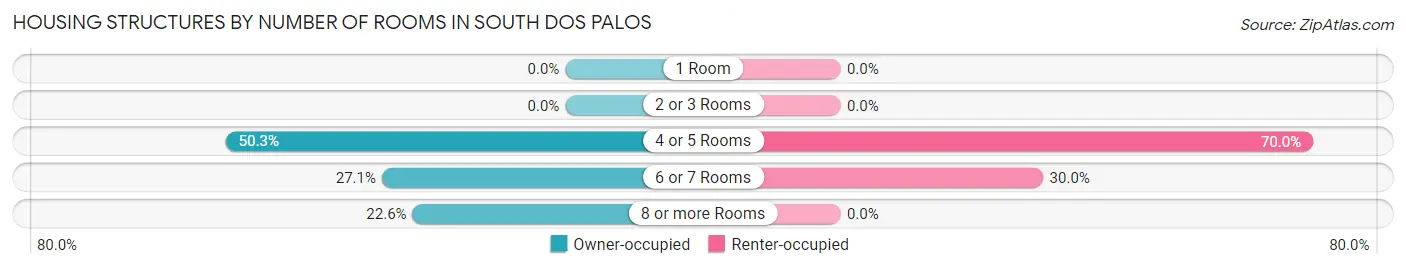
| Number of Rooms | Owner-occupied | Renter-occupied |
| 1 Room | 0 (0.0%) | 0 (0.0%) |
| 2 or 3 Rooms | 0 (0.0%) | 0 (0.0%) |
| 4 or 5 Rooms | 100 (50.2%) | 182 (70.0%) |
| 6 or 7 Rooms | 54 (27.1%) | 78 (30.0%) |
| 8 or more Rooms | 45 (22.6%) | 0 (0.0%) |
| Total | 199 (100.0%) | 260 (100.0%) |
Housing Structure by Heating Type in South Dos Palos
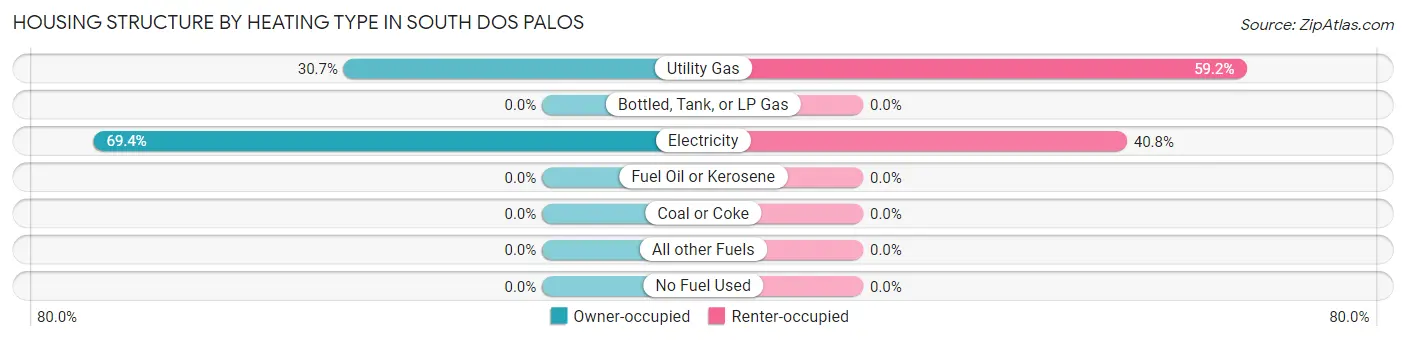
| Heating Type | Owner-occupied | Renter-occupied |
| Utility Gas | 61 (30.6%) | 154 (59.2%) |
| Bottled, Tank, or LP Gas | 0 (0.0%) | 0 (0.0%) |
| Electricity | 138 (69.4%) | 106 (40.8%) |
| Fuel Oil or Kerosene | 0 (0.0%) | 0 (0.0%) |
| Coal or Coke | 0 (0.0%) | 0 (0.0%) |
| All other Fuels | 0 (0.0%) | 0 (0.0%) |
| No Fuel Used | 0 (0.0%) | 0 (0.0%) |
| Total | 199 (100.0%) | 260 (100.0%) |
Household Vehicle Usage in South Dos Palos
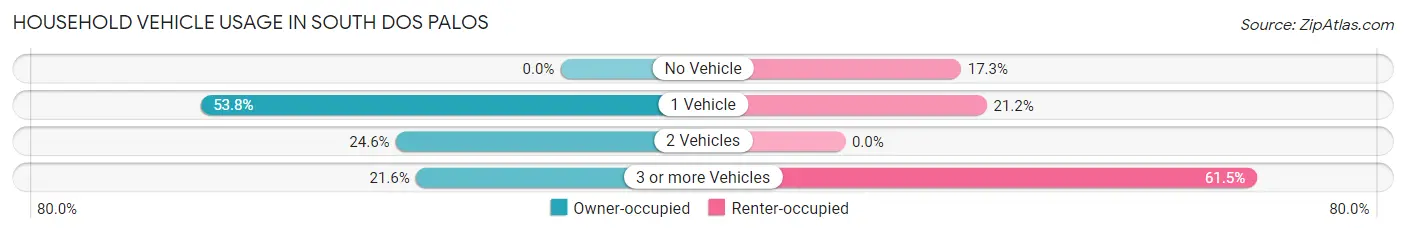
| Vehicles per Household | Owner-occupied | Renter-occupied |
| No Vehicle | 0 (0.0%) | 45 (17.3%) |
| 1 Vehicle | 107 (53.8%) | 55 (21.1%) |
| 2 Vehicles | 49 (24.6%) | 0 (0.0%) |
| 3 or more Vehicles | 43 (21.6%) | 160 (61.5%) |
| Total | 199 (100.0%) | 260 (100.0%) |
Real Estate & Mortgages in South Dos Palos
Real Estate and Mortgage Overview in South Dos Palos
| Characteristic | Without Mortgage | With Mortgage |
| Housing Units | 107 | 92 |
| Median Property Value | $170,100 | $348,700 |
| Median Household Income | $33,225 | $28 |
| Monthly Housing Costs | $354 | $0 |
| Real Estate Taxes | $443 | $0 |
Property Value by Mortgage Status in South Dos Palos
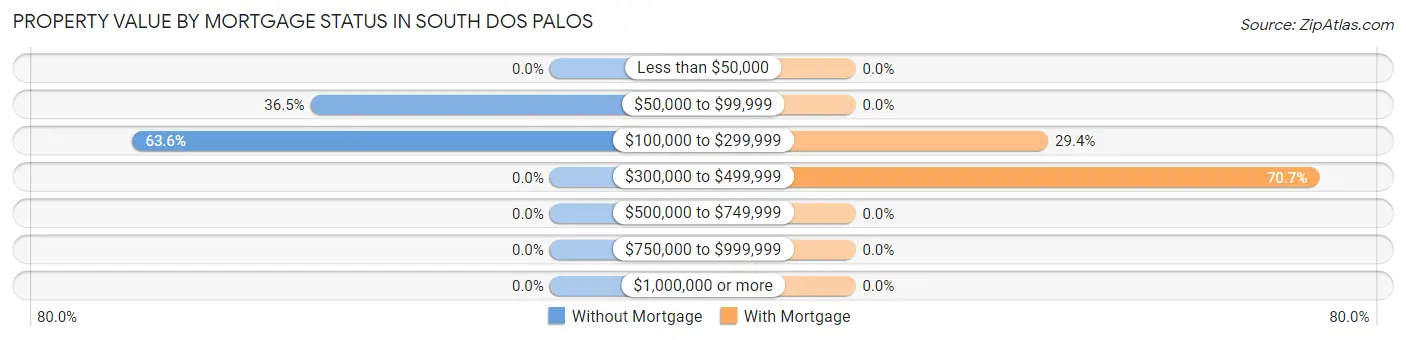
| Property Value | Without Mortgage | With Mortgage |
| Less than $50,000 | 0 (0.0%) | 0 (0.0%) |
| $50,000 to $99,999 | 39 (36.4%) | 0 (0.0%) |
| $100,000 to $299,999 | 68 (63.5%) | 27 (29.3%) |
| $300,000 to $499,999 | 0 (0.0%) | 65 (70.7%) |
| $500,000 to $749,999 | 0 (0.0%) | 0 (0.0%) |
| $750,000 to $999,999 | 0 (0.0%) | 0 (0.0%) |
| $1,000,000 or more | 0 (0.0%) | 0 (0.0%) |
| Total | 107 (100.0%) | 92 (100.0%) |
Household Income by Mortgage Status in South Dos Palos
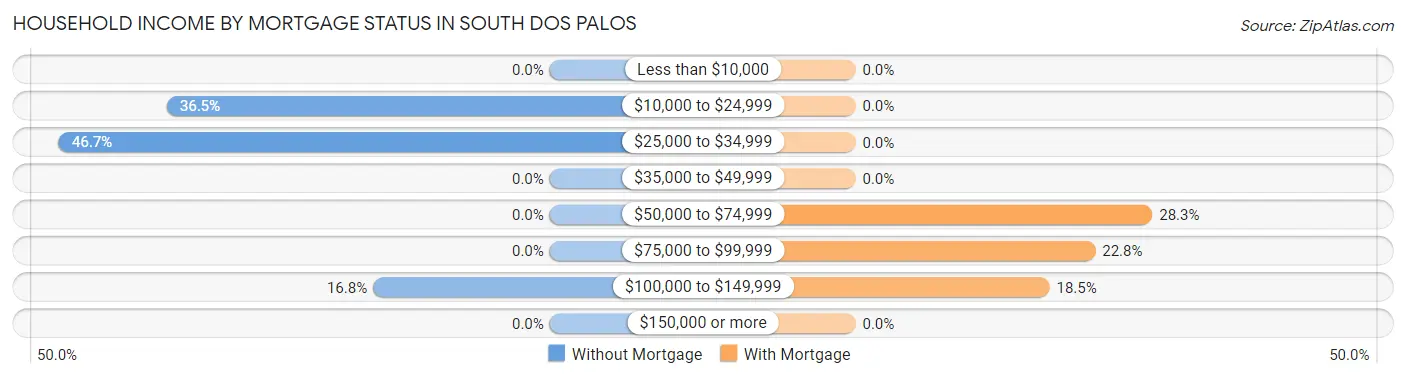
| Household Income | Without Mortgage | With Mortgage |
| Less than $10,000 | 0 (0.0%) | 0 (0.0%) |
| $10,000 to $24,999 | 39 (36.4%) | 0 (0.0%) |
| $25,000 to $34,999 | 50 (46.7%) | 0 (0.0%) |
| $35,000 to $49,999 | 0 (0.0%) | 0 (0.0%) |
| $50,000 to $74,999 | 0 (0.0%) | 26 (28.3%) |
| $75,000 to $99,999 | 0 (0.0%) | 21 (22.8%) |
| $100,000 to $149,999 | 18 (16.8%) | 17 (18.5%) |
| $150,000 or more | 0 (0.0%) | 0 (0.0%) |
| Total | 107 (100.0%) | 92 (100.0%) |
Property Value to Household Income Ratio in South Dos Palos
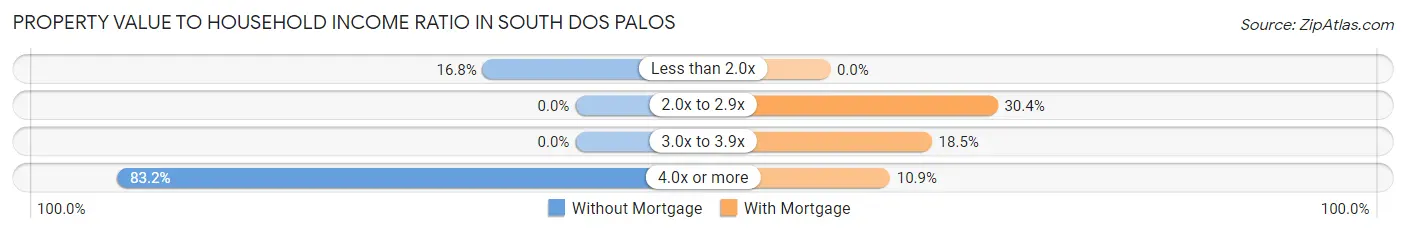
| Value-to-Income Ratio | Without Mortgage | With Mortgage |
| Less than 2.0x | 18 (16.8%) | 0 (0.0%) |
| 2.0x to 2.9x | 0 (0.0%) | 28 (30.4%) |
| 3.0x to 3.9x | 0 (0.0%) | 17 (18.5%) |
| 4.0x or more | 89 (83.2%) | 10 (10.9%) |
| Total | 107 (100.0%) | 92 (100.0%) |
Real Estate Taxes by Mortgage Status in South Dos Palos
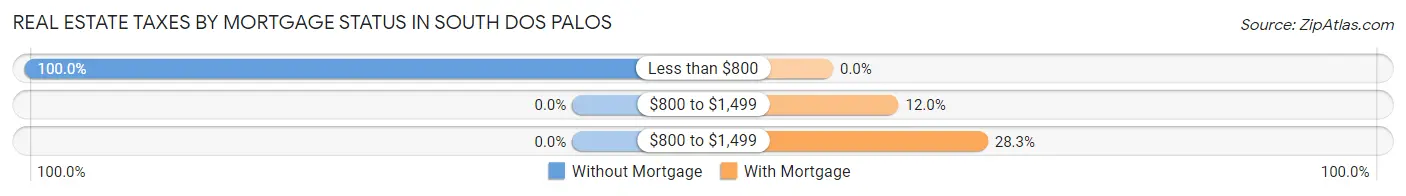
| Property Taxes | Without Mortgage | With Mortgage |
| Less than $800 | 107 (100.0%) | 0 (0.0%) |
| $800 to $1,499 | 0 (0.0%) | 11 (12.0%) |
| $800 to $1,499 | 0 (0.0%) | 26 (28.3%) |
| Total | 107 (100.0%) | 92 (100.0%) |
Health & Disability in South Dos Palos
Health Insurance Coverage by Age in South Dos Palos
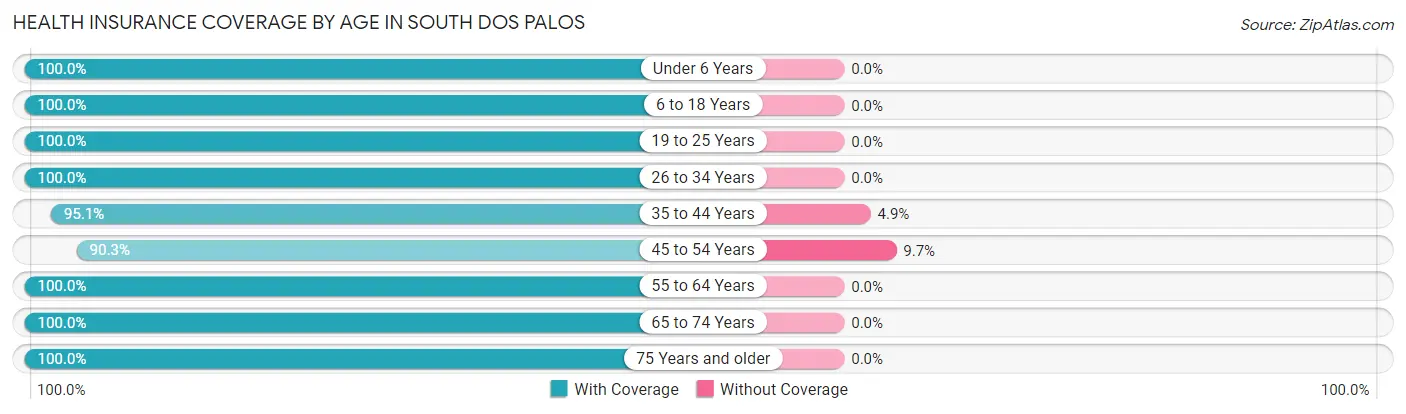
| Age Bracket | With Coverage | Without Coverage |
| Under 6 Years | 15 (100.0%) | 0 (0.0%) |
| 6 to 18 Years | 299 (100.0%) | 0 (0.0%) |
| 19 to 25 Years | 293 (100.0%) | 0 (0.0%) |
| 26 to 34 Years | 78 (100.0%) | 0 (0.0%) |
| 35 to 44 Years | 329 (95.1%) | 17 (4.9%) |
| 45 to 54 Years | 251 (90.3%) | 27 (9.7%) |
| 55 to 64 Years | 60 (100.0%) | 0 (0.0%) |
| 65 to 74 Years | 68 (100.0%) | 0 (0.0%) |
| 75 Years and older | 39 (100.0%) | 0 (0.0%) |
| Total | 1,432 (97.0%) | 44 (3.0%) |
Health Insurance Coverage by Citizenship Status in South Dos Palos
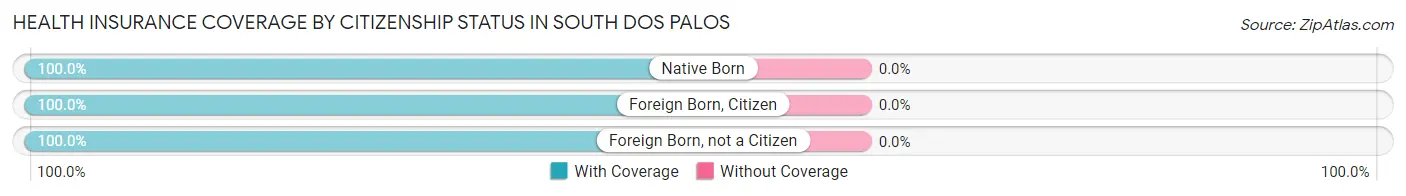
| Citizenship Status | With Coverage | Without Coverage |
| Native Born | 15 (100.0%) | 0 (0.0%) |
| Foreign Born, Citizen | 299 (100.0%) | 0 (0.0%) |
| Foreign Born, not a Citizen | 293 (100.0%) | 0 (0.0%) |
Health Insurance Coverage by Household Income in South Dos Palos
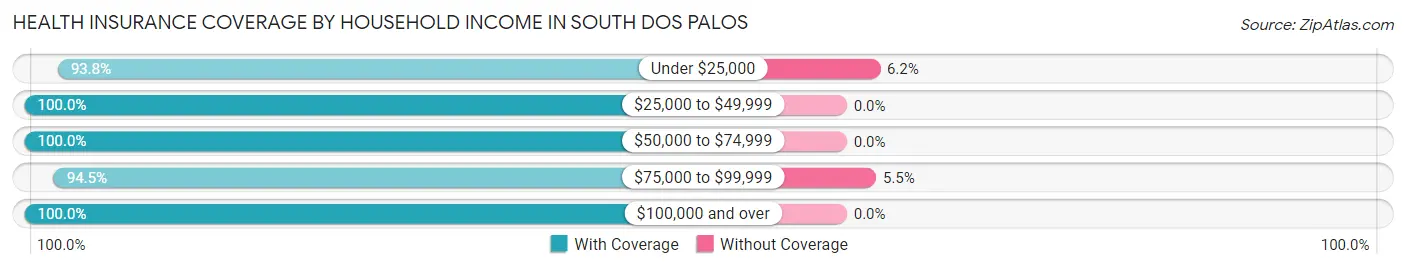
| Household Income | With Coverage | Without Coverage |
| Under $25,000 | 408 (93.8%) | 27 (6.2%) |
| $25,000 to $49,999 | 207 (100.0%) | 0 (0.0%) |
| $50,000 to $74,999 | 230 (100.0%) | 0 (0.0%) |
| $75,000 to $99,999 | 293 (94.5%) | 17 (5.5%) |
| $100,000 and over | 294 (100.0%) | 0 (0.0%) |
Public vs Private Health Insurance Coverage by Age in South Dos Palos
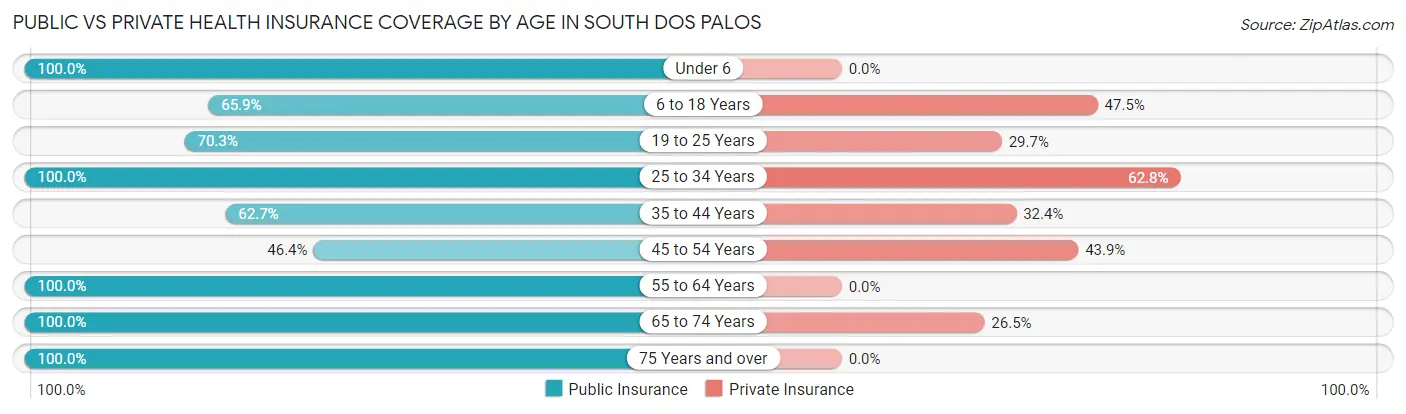
| Age Bracket | Public Insurance | Private Insurance |
| Under 6 | 15 (100.0%) | 0 (0.0%) |
| 6 to 18 Years | 197 (65.9%) | 142 (47.5%) |
| 19 to 25 Years | 206 (70.3%) | 87 (29.7%) |
| 25 to 34 Years | 78 (100.0%) | 49 (62.8%) |
| 35 to 44 Years | 217 (62.7%) | 112 (32.4%) |
| 45 to 54 Years | 129 (46.4%) | 122 (43.9%) |
| 55 to 64 Years | 60 (100.0%) | 0 (0.0%) |
| 65 to 74 Years | 68 (100.0%) | 18 (26.5%) |
| 75 Years and over | 39 (100.0%) | 0 (0.0%) |
| Total | 1,009 (68.4%) | 530 (35.9%) |
Disability Status by Sex by Age in South Dos Palos
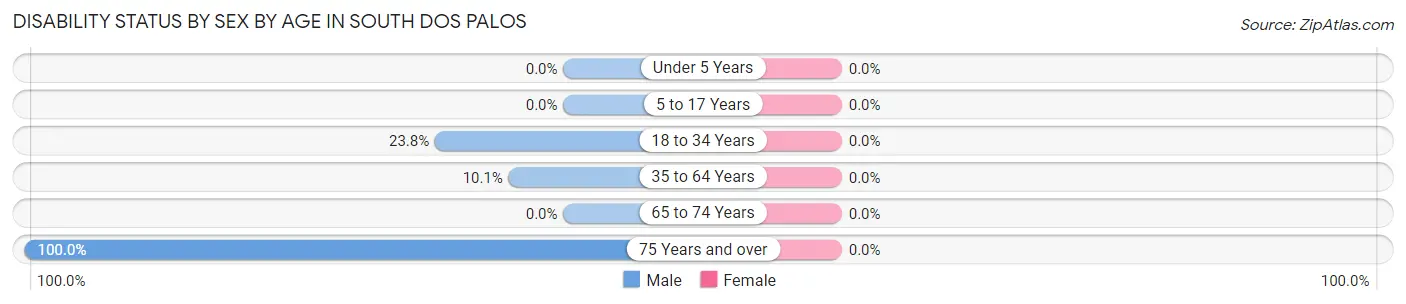
| Age Bracket | Male | Female |
| Under 5 Years | 0 (0.0%) | 0 (0.0%) |
| 5 to 17 Years | 0 (0.0%) | 0 (0.0%) |
| 18 to 34 Years | 35 (23.8%) | 0 (0.0%) |
| 35 to 64 Years | 29 (10.1%) | 0 (0.0%) |
| 65 to 74 Years | 0 (0.0%) | 0 (0.0%) |
| 75 Years and over | 39 (100.0%) | 0 (0.0%) |
Disability Class by Sex by Age in South Dos Palos
Disability Class: Hearing Difficulty
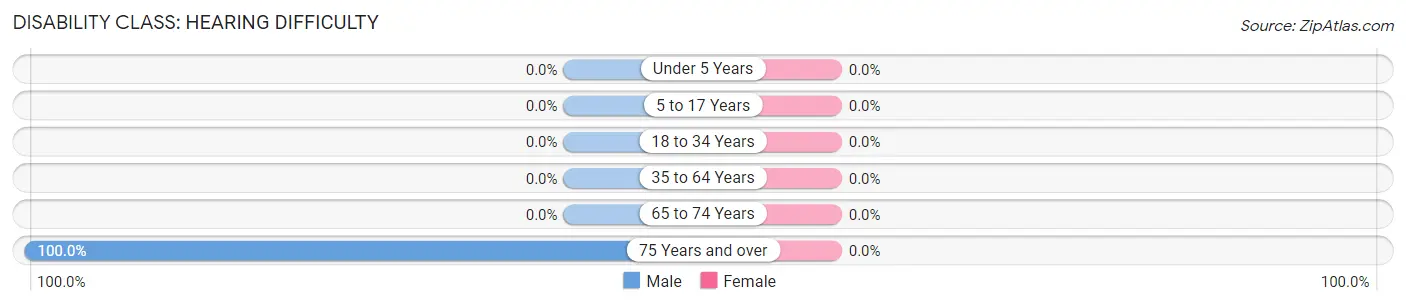
| Age Bracket | Male | Female |
| Under 5 Years | 0 (0.0%) | 0 (0.0%) |
| 5 to 17 Years | 0 (0.0%) | 0 (0.0%) |
| 18 to 34 Years | 0 (0.0%) | 0 (0.0%) |
| 35 to 64 Years | 0 (0.0%) | 0 (0.0%) |
| 65 to 74 Years | 0 (0.0%) | 0 (0.0%) |
| 75 Years and over | 39 (100.0%) | 0 (0.0%) |
Disability Class: Vision Difficulty
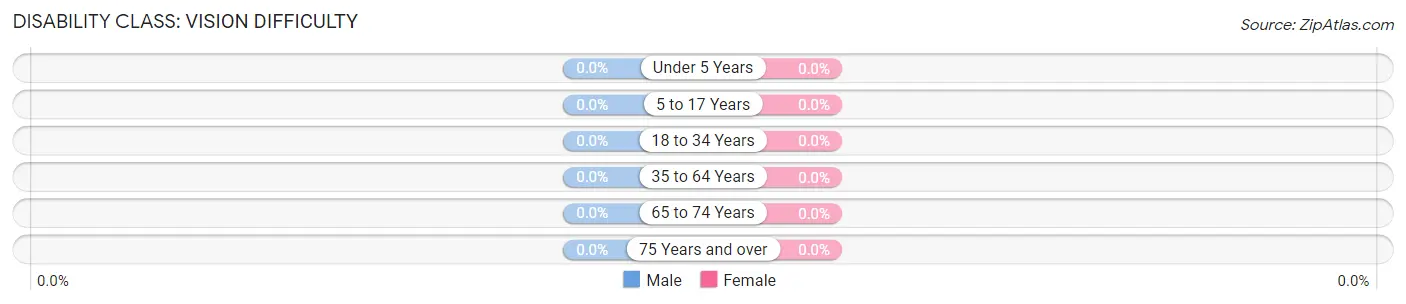
| Age Bracket | Male | Female |
| Under 5 Years | 0 (0.0%) | 0 (0.0%) |
| 5 to 17 Years | 0 (0.0%) | 0 (0.0%) |
| 18 to 34 Years | 0 (0.0%) | 0 (0.0%) |
| 35 to 64 Years | 0 (0.0%) | 0 (0.0%) |
| 65 to 74 Years | 0 (0.0%) | 0 (0.0%) |
| 75 Years and over | 0 (0.0%) | 0 (0.0%) |
Disability Class: Cognitive Difficulty
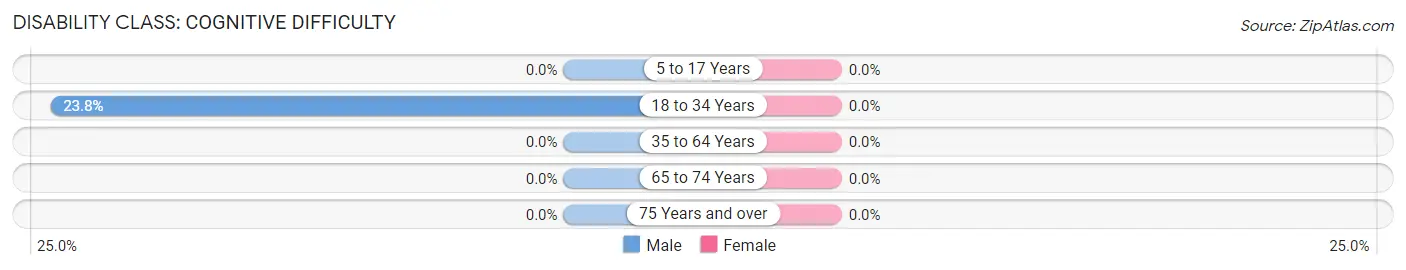
| Age Bracket | Male | Female |
| 5 to 17 Years | 0 (0.0%) | 0 (0.0%) |
| 18 to 34 Years | 35 (23.8%) | 0 (0.0%) |
| 35 to 64 Years | 0 (0.0%) | 0 (0.0%) |
| 65 to 74 Years | 0 (0.0%) | 0 (0.0%) |
| 75 Years and over | 0 (0.0%) | 0 (0.0%) |
Disability Class: Ambulatory Difficulty
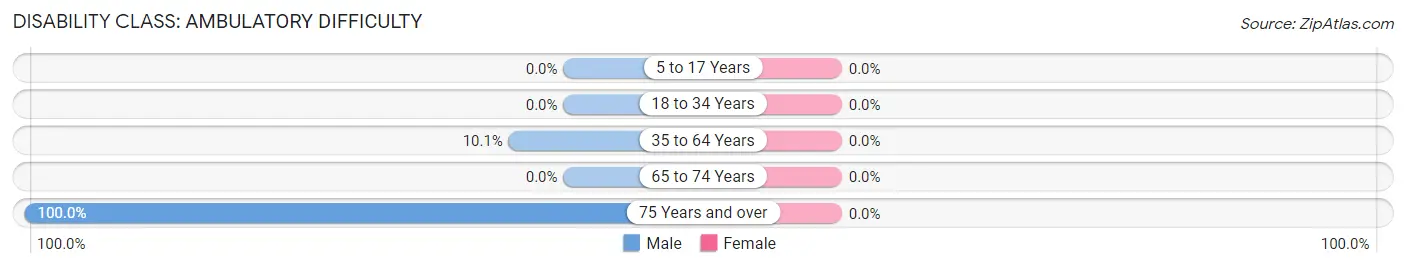
| Age Bracket | Male | Female |
| 5 to 17 Years | 0 (0.0%) | 0 (0.0%) |
| 18 to 34 Years | 0 (0.0%) | 0 (0.0%) |
| 35 to 64 Years | 29 (10.1%) | 0 (0.0%) |
| 65 to 74 Years | 0 (0.0%) | 0 (0.0%) |
| 75 Years and over | 39 (100.0%) | 0 (0.0%) |
Disability Class: Self-Care Difficulty
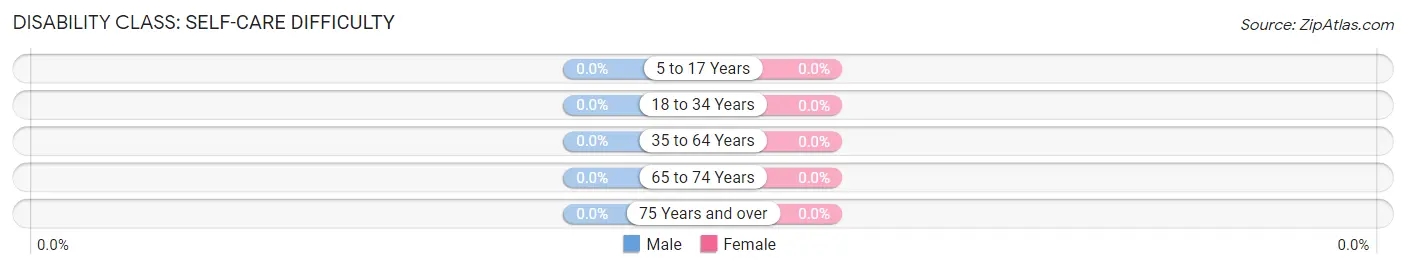
| Age Bracket | Male | Female |
| 5 to 17 Years | 0 (0.0%) | 0 (0.0%) |
| 18 to 34 Years | 0 (0.0%) | 0 (0.0%) |
| 35 to 64 Years | 0 (0.0%) | 0 (0.0%) |
| 65 to 74 Years | 0 (0.0%) | 0 (0.0%) |
| 75 Years and over | 0 (0.0%) | 0 (0.0%) |
Technology Access in South Dos Palos
Computing Device Access in South Dos Palos
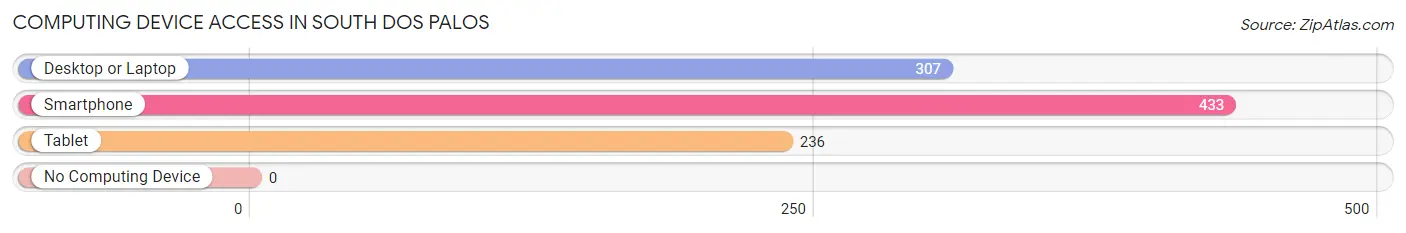
| Device Type | # Households | % Households |
| Desktop or Laptop | 307 | 66.9% |
| Smartphone | 433 | 94.3% |
| Tablet | 236 | 51.4% |
| No Computing Device | 0 | 0.0% |
| Total | 459 | 100.0% |
Internet Access in South Dos Palos
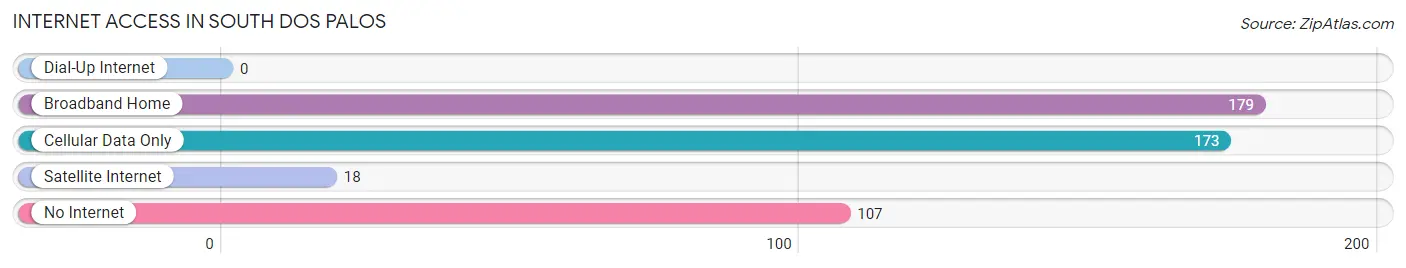
| Internet Type | # Households | % Households |
| Dial-Up Internet | 0 | 0.0% |
| Broadband Home | 179 | 39.0% |
| Cellular Data Only | 173 | 37.7% |
| Satellite Internet | 18 | 3.9% |
| No Internet | 107 | 23.3% |
| Total | 459 | 100.0% |
South Dos Palos Summary
History
South Dos Palos is a small unincorporated community located in Merced County, California. It is situated in the San Joaquin Valley, approximately 10 miles south of Los Banos and 25 miles northwest of Fresno. The community was founded in the late 19th century by Mexican settlers who were attracted to the area by the fertile soil and abundant water supply. The town was originally known as Dos Palos, but the name was changed to South Dos Palos in the early 20th century to distinguish it from the nearby town of Dos Palos.
The first settlers in South Dos Palos were Mexican immigrants who arrived in the late 19th century. They were attracted to the area by the fertile soil and abundant water supply, which made it ideal for farming. The settlers established small farms and ranches, growing crops such as wheat, corn, and alfalfa. The town grew slowly but steadily, and by the early 20th century it had become a thriving agricultural community.
In the early 20th century, the town was home to a number of businesses, including a general store, a blacksmith shop, a livery stable, and a saloon. The town also had a school, a post office, and a church. The town was served by the Southern Pacific Railroad, which provided transportation for goods and passengers.
Geography
South Dos Palos is located in the San Joaquin Valley of California, approximately 10 miles south of Los Banos and 25 miles northwest of Fresno. The town is situated on the banks of the San Joaquin River, which provides a source of irrigation for the surrounding agricultural lands. The town is surrounded by rolling hills and is bordered by the Dos Palos Hills to the east and the San Luis Reservoir to the west.
The climate in South Dos Palos is typical of the San Joaquin Valley, with hot, dry summers and mild, wet winters. The average annual temperature is around 70°F, with temperatures reaching as high as 100°F in the summer months and as low as 40°F in the winter months. The average annual precipitation is around 10 inches, with most of the rain falling in the winter months.
Economy
South Dos Palos is an agricultural community, with the majority of the population employed in farming and related industries. The town is home to a number of small businesses, including a general store, a blacksmith shop, a livery stable, and a saloon. The town is also home to a number of agricultural processing plants, which process and package the crops grown in the area.
The town is served by the Southern Pacific Railroad, which provides transportation for goods and passengers. The town is also served by a number of highways, including State Route 33, State Route 152, and State Route 165.
Demographics
As of the 2010 census, the population of South Dos Palos was 2,845. The racial makeup of the town was 75.3% Hispanic or Latino, 22.2% White, 0.7% African American, 0.3% Native American, 0.2% Asian, and 1.5% from other races. The median household income was $30,938, and the median family income was $35,938. The per capita income was $14,938.
The town is served by the Dos Palos-Oro Loma Joint Unified School District, which includes two elementary schools, one middle school, and one high school. The town is also home to a number of churches, including the First Baptist Church of South Dos Palos and the Iglesia de Dios Pentecostal.
Common Questions
What is Per Capita Income in South Dos Palos?
Per Capita income in South Dos Palos is $23,522.
What is Inequality or Gini Index in South Dos Palos?
Inequality or Gini Index in South Dos Palos is 0.54.
What is the Total Population of South Dos Palos?
Total Population of South Dos Palos is 1,476.
What is the Total Male Population of South Dos Palos?
Total Male Population of South Dos Palos is 559.
What is the Total Female Population of South Dos Palos?
Total Female Population of South Dos Palos is 917.
What is the Ratio of Males per 100 Females in South Dos Palos?
There are 60.96 Males per 100 Females in South Dos Palos.
What is the Ratio of Females per 100 Males in South Dos Palos?
There are 164.04 Females per 100 Males in South Dos Palos.
What is the Median Population Age in South Dos Palos?
Median Population Age in South Dos Palos is 36.9 Years.
What is the Average Family Size in South Dos Palos
Average Family Size in South Dos Palos is 3.4 People.
What is the Average Household Size in South Dos Palos
Average Household Size in South Dos Palos is 3.2 People.
How Large is the Labor Force in South Dos Palos?
There are 625 People in the Labor Forcein in South Dos Palos.
What is the Percentage of People in the Labor Force in South Dos Palos?
51.5% of People are in the Labor Force in South Dos Palos.
What is the Unemployment Rate in South Dos Palos?
Unemployment Rate in South Dos Palos is 17.8%.