Zip Codes with the Highest Percentage of Households with Income Below $10,000 in Lompoc, CA
RELATED REPORTS & OPTIONS
Household Income | $0-10k
Lompoc
Compare Zip Codes
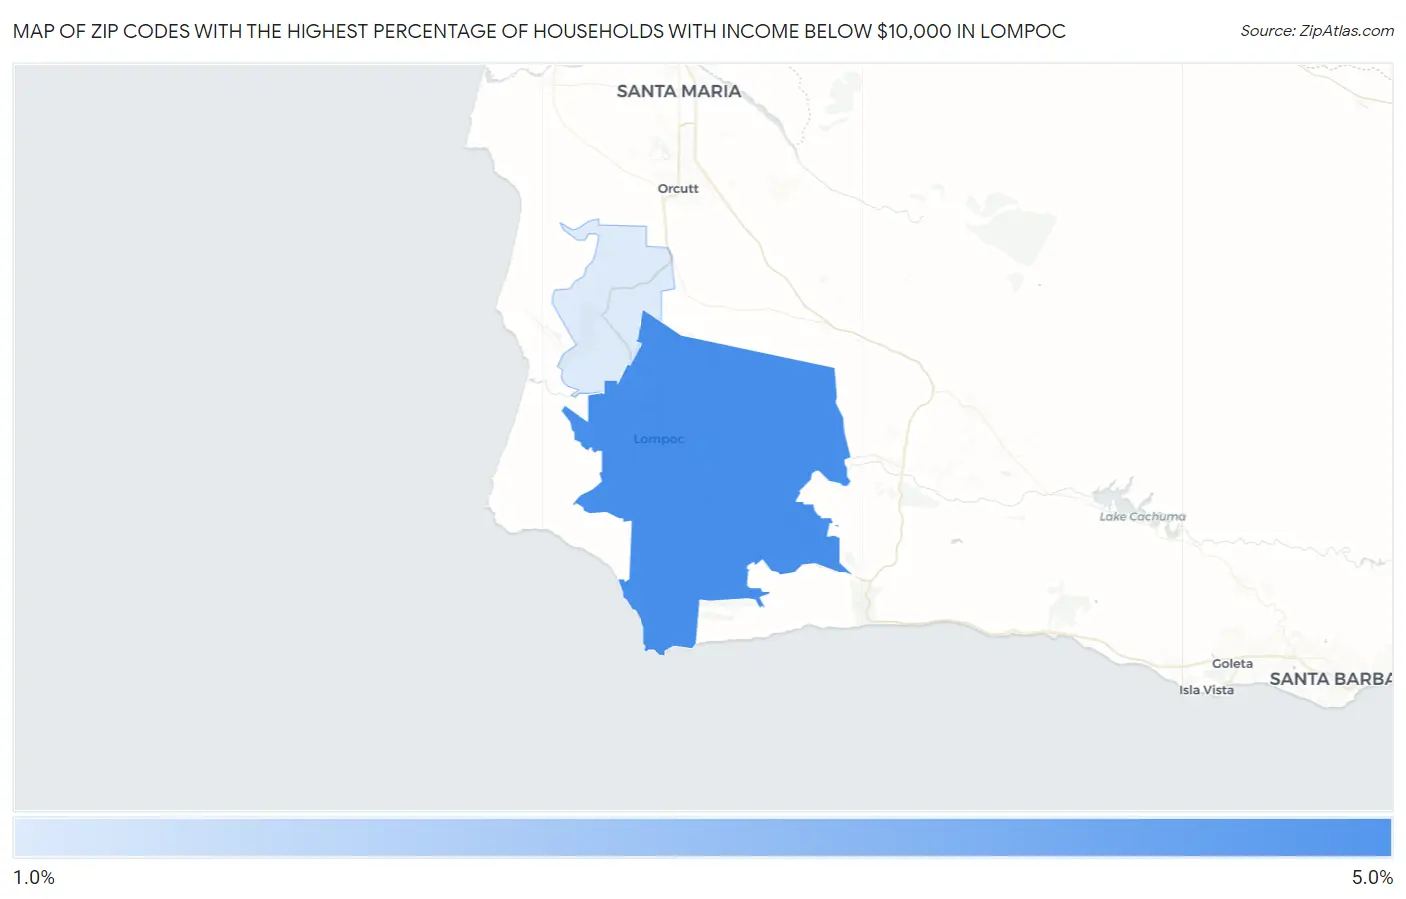
Map of Zip Codes with the Highest Percentage of Households with Income Below $10,000 in Lompoc
1.1%
4.1%
Zip Codes with the Highest Percentage of Households with Income Below $10,000 in Lompoc, CA
| Zip Code | Households with Income < $10k | vs State | vs National | |
| 1. | 93436 | 4.1% | 4.4%(-0.300)#797 | 4.9%(-0.800)#14,791 |
| 2. | 93437 | 1.1% | 4.4%(-3.30)#1,498 | 4.9%(-3.80)#26,621 |
1
Common Questions
What are the Top Zip Codes with the Highest Percentage of Households with Income Below $10,000 in Lompoc, CA?
Top Zip Codes with the Highest Percentage of Households with Income Below $10,000 in Lompoc, CA are:
What zip code has the Highest Percentage of Households with Income Below $10,000 in Lompoc, CA?
93436 has the Highest Percentage of Households with Income Below $10,000 in Lompoc, CA with 4.1%.
What is the Percentage of Households with Income Below $10,000 in Lompoc, CA?
Percentage of Households with Income Below $10,000 in Lompoc is 5.1%.
What is the Percentage of Households with Income Below $10,000 in California?
Percentage of Households with Income Below $10,000 in California is 4.4%.
What is the Percentage of Households with Income Below $10,000 in the United States?
Percentage of Households with Income Below $10,000 in the United States is 4.9%.