Stirling City, CA Map & Demographics
Stirling City Map
Stirling City Overview
$30,606
PER CAPITA INCOME
32.2%
WAGE / INCOME GAP [ % ]
67.8¢/ $1
WAGE / INCOME GAP [ $ ]
0.37
INEQUALITY / GINI INDEX
501
TOTAL POPULATION
166
MALE POPULATION
335
FEMALE POPULATION
49.55
MALES / 100 FEMALES
201.81
FEMALES / 100 MALES
56.1
MEDIAN AGE
2.8
AVG FAMILY SIZE
2.5
AVG HOUSEHOLD SIZE
224
LABOR FORCE [ PEOPLE ]
55.6%
PERCENT IN LABOR FORCE
8.0%
UNEMPLOYMENT RATE
Stirling City Zip Codes
Stirling City Area Codes
Income in Stirling City
Income Overview in Stirling City
| Characteristic | Number | Measure |
| Per Capita Income | 501 | $30,606 |
| Median Family Income | 145 | $0 |
| Mean Family Income | 145 | $89,568 |
| Median Household Income | 197 | $0 |
| Mean Household Income | 197 | $79,512 |
| Income Deficit | 145 | $0 |
| Wage / Income Gap (%) | 501 | 32.16% |
| Wage / Income Gap ($) | 501 | 67.84¢ per $1 |
| Gini / Inequality Index | 501 | 0.37 |
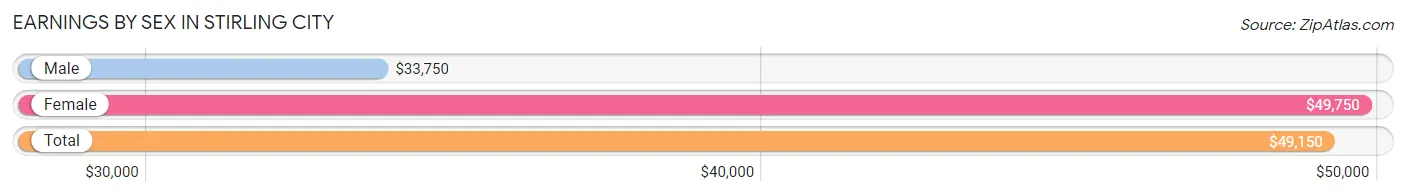
Earnings by Sex in Stirling City
Average Earnings in Stirling City are $49,150, $33,750 for men and $49,750 for women, a difference of 32.2%.
| Sex | Number | Average Earnings |
| Male | 60 (27.7%) | $33,750 |
| Female | 157 (72.4%) | $49,750 |
| Total | 217 (100.0%) | $49,150 |
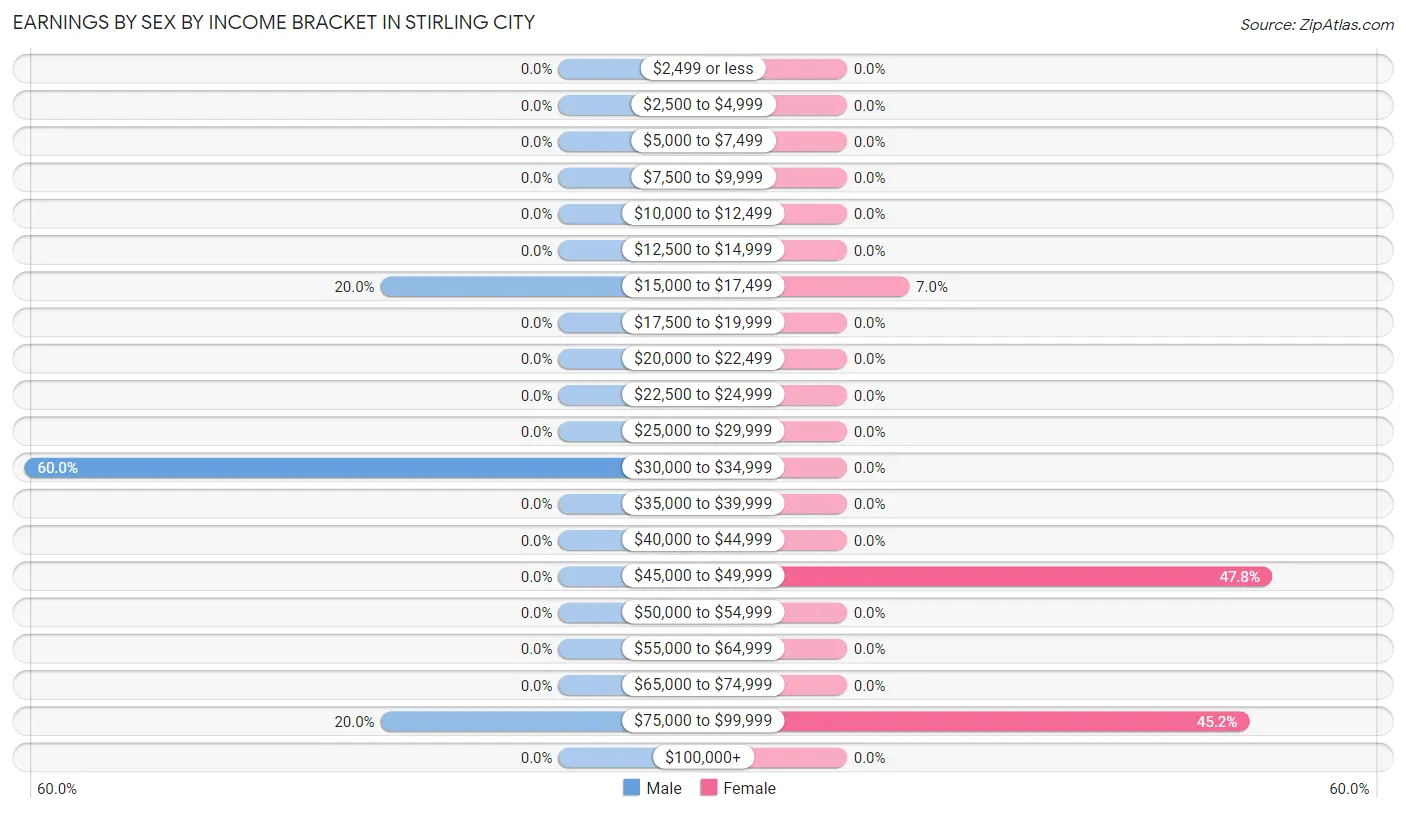
Earnings by Sex by Income Bracket in Stirling City
The most common earnings brackets in Stirling City are $30,000 to $34,999 for men (36 | 60.0%) and $45,000 to $49,999 for women (75 | 47.8%).
| Income | Male | Female |
| $2,499 or less | 0 (0.0%) | 0 (0.0%) |
| $2,500 to $4,999 | 0 (0.0%) | 0 (0.0%) |
| $5,000 to $7,499 | 0 (0.0%) | 0 (0.0%) |
| $7,500 to $9,999 | 0 (0.0%) | 0 (0.0%) |
| $10,000 to $12,499 | 0 (0.0%) | 0 (0.0%) |
| $12,500 to $14,999 | 0 (0.0%) | 0 (0.0%) |
| $15,000 to $17,499 | 12 (20.0%) | 11 (7.0%) |
| $17,500 to $19,999 | 0 (0.0%) | 0 (0.0%) |
| $20,000 to $22,499 | 0 (0.0%) | 0 (0.0%) |
| $22,500 to $24,999 | 0 (0.0%) | 0 (0.0%) |
| $25,000 to $29,999 | 0 (0.0%) | 0 (0.0%) |
| $30,000 to $34,999 | 36 (60.0%) | 0 (0.0%) |
| $35,000 to $39,999 | 0 (0.0%) | 0 (0.0%) |
| $40,000 to $44,999 | 0 (0.0%) | 0 (0.0%) |
| $45,000 to $49,999 | 0 (0.0%) | 75 (47.8%) |
| $50,000 to $54,999 | 0 (0.0%) | 0 (0.0%) |
| $55,000 to $64,999 | 0 (0.0%) | 0 (0.0%) |
| $65,000 to $74,999 | 0 (0.0%) | 0 (0.0%) |
| $75,000 to $99,999 | 12 (20.0%) | 71 (45.2%) |
| $100,000+ | 0 (0.0%) | 0 (0.0%) |
| Total | 60 (100.0%) | 157 (100.0%) |
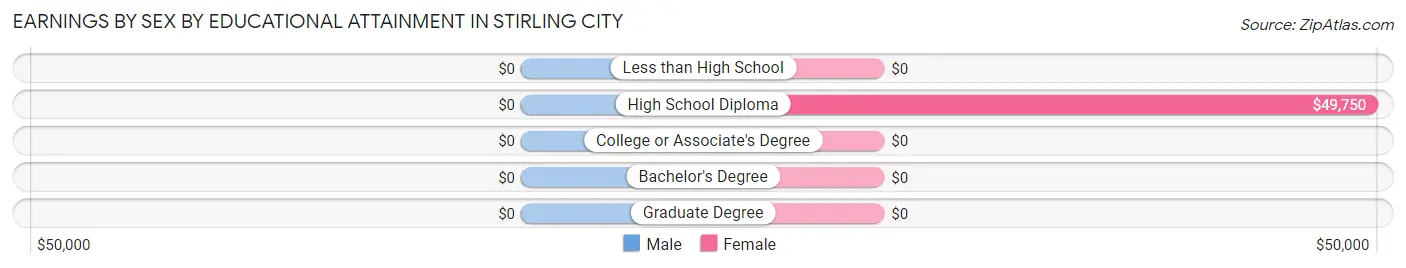
Earnings by Sex by Educational Attainment in Stirling City
| Educational Attainment | Male Income | Female Income |
| Less than High School | - | - |
| High School Diploma | - | - |
| College or Associate's Degree | - | - |
| Bachelor's Degree | - | - |
| Graduate Degree | - | - |
| Total | $33,750 | $49,750 |
Family Income in Stirling City
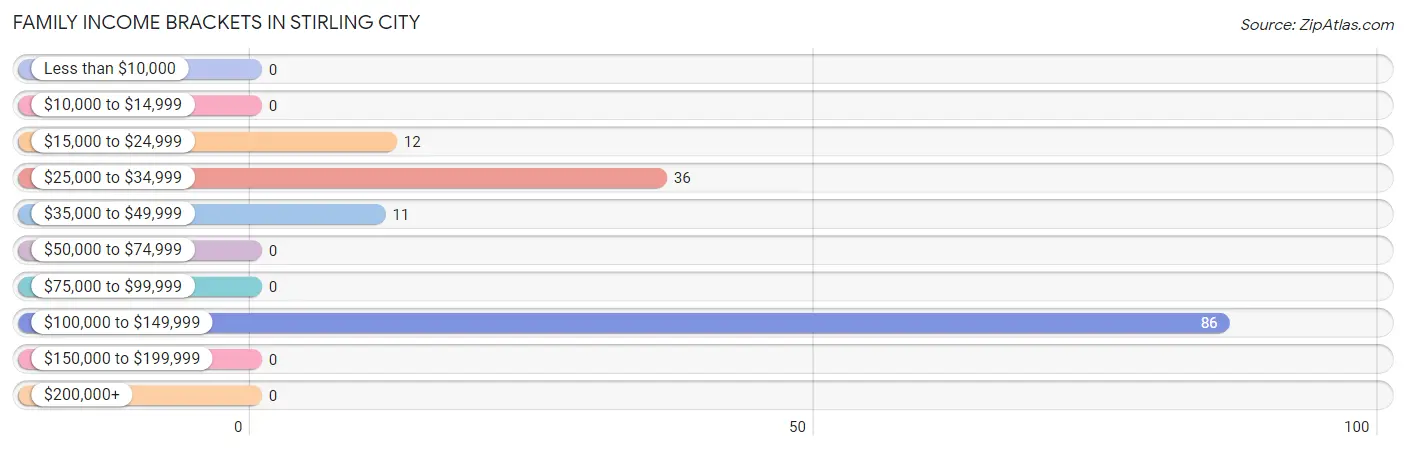
Family Income Brackets in Stirling City
According to the Stirling City family income data, there are 86 families falling into the $100,000 to $149,999 income range, which is the most common income bracket and makes up 59.3% of all families.
| Income Bracket | # Families | % Families |
| Less than $10,000 | 0 | 0.0% |
| $10,000 to $14,999 | 0 | 0.0% |
| $15,000 to $24,999 | 12 | 8.3% |
| $25,000 to $34,999 | 36 | 24.8% |
| $35,000 to $49,999 | 11 | 7.6% |
| $50,000 to $74,999 | 0 | 0.0% |
| $75,000 to $99,999 | 0 | 0.0% |
| $100,000 to $149,999 | 86 | 59.3% |
| $150,000 to $199,999 | 0 | 0.0% |
| $200,000+ | 0 | 0.0% |
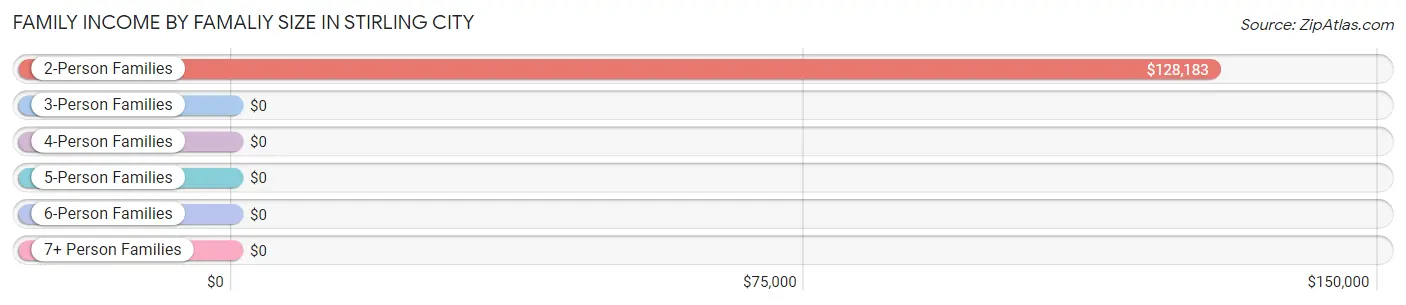
Family Income by Famaliy Size in Stirling City
2-person families (109 | 75.2%) account for the highest median family income in Stirling City with $128,183 per family, while 2-person families (109 | 75.2%) have the highest median income of $64,092 per family member.
| Income Bracket | # Families | Median Income |
| 2-Person Families | 109 (75.2%) | $128,183 |
| 3-Person Families | 0 (0.0%) | $0 |
| 4-Person Families | 0 (0.0%) | $0 |
| 5-Person Families | 36 (24.8%) | $0 |
| 6-Person Families | 0 (0.0%) | $0 |
| 7+ Person Families | 0 (0.0%) | $0 |
| Total | 145 (100.0%) | $0 |
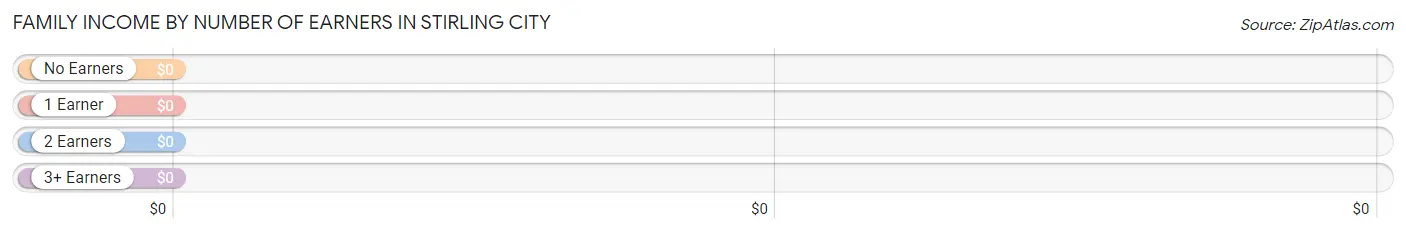
Family Income by Number of Earners in Stirling City
| Number of Earners | # Families | Median Income |
| No Earners | 22 (15.2%) | $0 |
| 1 Earner | 48 (33.1%) | $0 |
| 2 Earners | 75 (51.7%) | $0 |
| 3+ Earners | 0 (0.0%) | $0 |
| Total | 145 (100.0%) | $0 |
Household Income in Stirling City
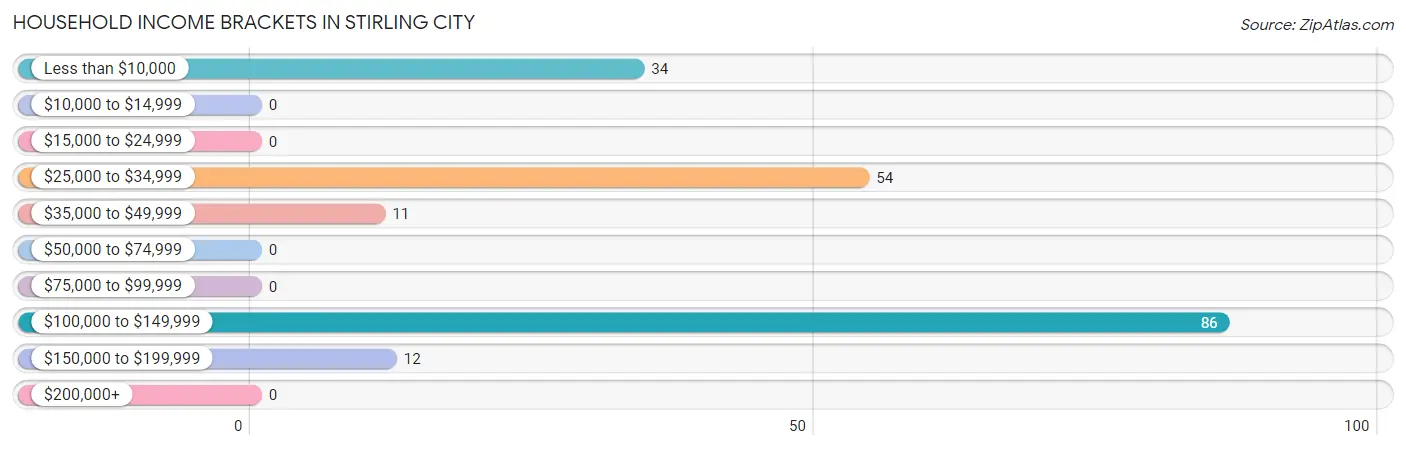
Household Income Brackets in Stirling City
With 86 households falling in the category, the $100,000 to $149,999 income range is the most frequent in Stirling City, accounting for 43.6% of all households.
| Income Bracket | # Households | % Households |
| Less than $10,000 | 34 | 17.3% |
| $10,000 to $14,999 | 0 | 0.0% |
| $15,000 to $24,999 | 0 | 0.0% |
| $25,000 to $34,999 | 54 | 27.4% |
| $35,000 to $49,999 | 11 | 5.6% |
| $50,000 to $74,999 | 0 | 0.0% |
| $75,000 to $99,999 | 0 | 0.0% |
| $100,000 to $149,999 | 86 | 43.7% |
| $150,000 to $199,999 | 12 | 6.1% |
| $200,000+ | 0 | 0.0% |
Household Income by Householder Age in Stirling City
| Income Bracket | # Households | Median Income |
| 15 to 24 Years | 0 (0.0%) | $0 |
| 25 to 44 Years | 12 (6.1%) | $0 |
| 45 to 64 Years | 152 (77.2%) | $0 |
| 65+ Years | 33 (16.8%) | $0 |
| Total | 197 (100.0%) | $0 |
Poverty in Stirling City
Income Below Poverty by Sex and Age in Stirling City
With 72.9% poverty level for males and 42.4% for females among the residents of Stirling City, 6 to 11 year old males and 6 to 11 year old females are the most vulnerable to poverty, with 11 males (100.0%) and 34 females (100.0%) in their respective age groups living below the poverty level.
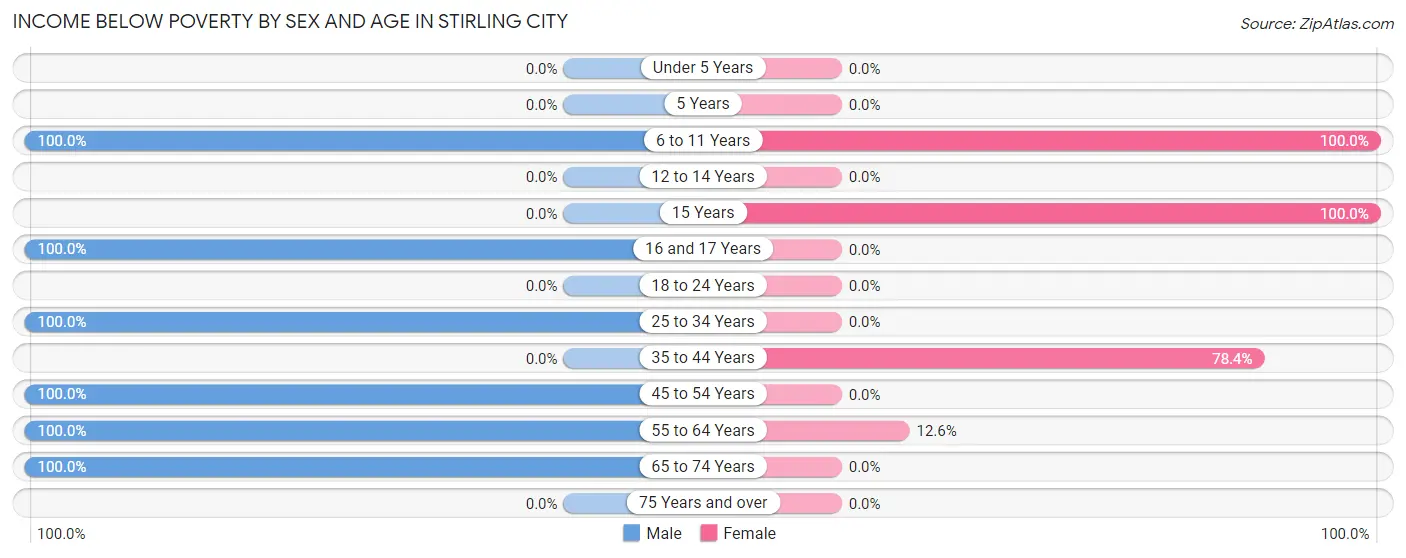
| Age Bracket | Male | Female |
| Under 5 Years | 0 (0.0%) | 0 (0.0%) |
| 5 Years | 0 (0.0%) | 0 (0.0%) |
| 6 to 11 Years | 11 (100.0%) | 34 (100.0%) |
| 12 to 14 Years | 0 (0.0%) | 0 (0.0%) |
| 15 Years | 0 (0.0%) | 41 (100.0%) |
| 16 and 17 Years | 39 (100.0%) | 0 (0.0%) |
| 18 to 24 Years | 0 (0.0%) | 0 (0.0%) |
| 25 to 34 Years | 12 (100.0%) | 0 (0.0%) |
| 35 to 44 Years | 0 (0.0%) | 40 (78.4%) |
| 45 to 54 Years | 36 (100.0%) | 0 (0.0%) |
| 55 to 64 Years | 12 (100.0%) | 22 (12.6%) |
| 65 to 74 Years | 11 (100.0%) | 0 (0.0%) |
| 75 Years and over | 0 (0.0%) | 0 (0.0%) |
| Total | 121 (72.9%) | 137 (42.4%) |
Income Above Poverty by Sex and Age in Stirling City
According to the poverty statistics in Stirling City, males aged 35 to 44 years and females aged 65 to 74 years are the age groups that are most secure financially, with 100.0% of males and 100.0% of females in these age groups living above the poverty line.
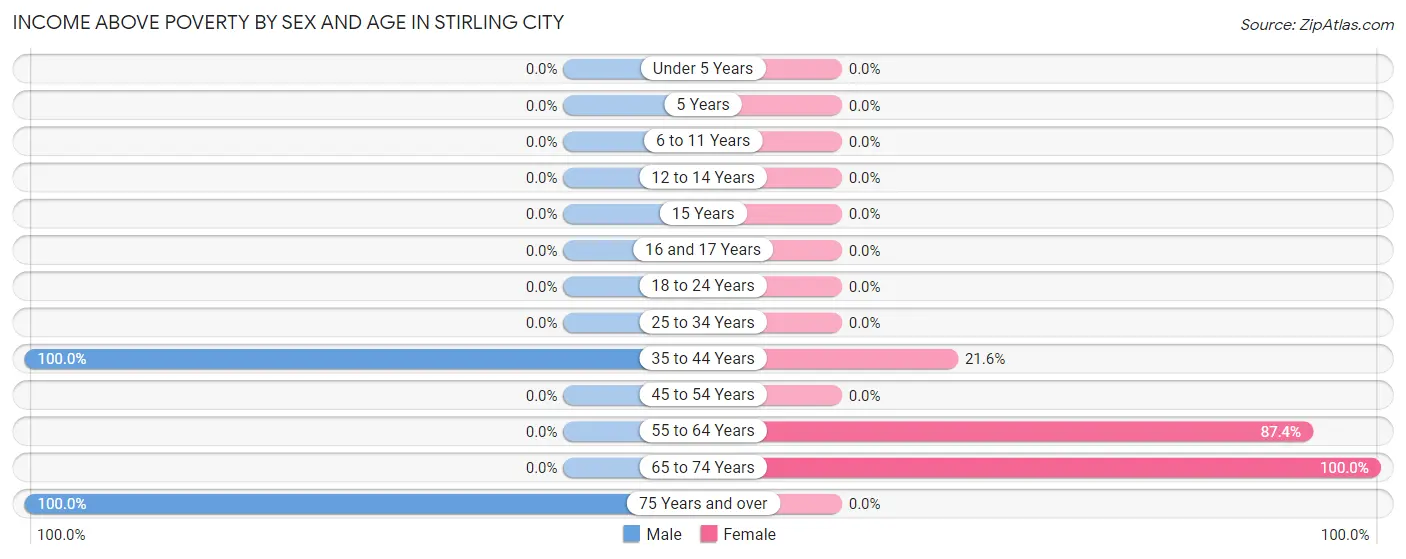
| Age Bracket | Male | Female |
| Under 5 Years | 0 (0.0%) | 0 (0.0%) |
| 5 Years | 0 (0.0%) | 0 (0.0%) |
| 6 to 11 Years | 0 (0.0%) | 0 (0.0%) |
| 12 to 14 Years | 0 (0.0%) | 0 (0.0%) |
| 15 Years | 0 (0.0%) | 0 (0.0%) |
| 16 and 17 Years | 0 (0.0%) | 0 (0.0%) |
| 18 to 24 Years | 0 (0.0%) | 0 (0.0%) |
| 25 to 34 Years | 0 (0.0%) | 0 (0.0%) |
| 35 to 44 Years | 12 (100.0%) | 11 (21.6%) |
| 45 to 54 Years | 0 (0.0%) | 0 (0.0%) |
| 55 to 64 Years | 0 (0.0%) | 153 (87.4%) |
| 65 to 74 Years | 0 (0.0%) | 22 (100.0%) |
| 75 Years and over | 33 (100.0%) | 0 (0.0%) |
| Total | 45 (27.1%) | 186 (57.6%) |
Income Below Poverty Among Married-Couple Families in Stirling City
The poverty statistics for married-couple families in Stirling City show that 62.1% or 36 of the total 58 families live below the poverty line. Families with 3 or 4 children have the highest poverty rate of 100.0%, comprising of 36 families. On the other hand, families with no children have the lowest poverty rate of 0.0%, which includes 0 families.
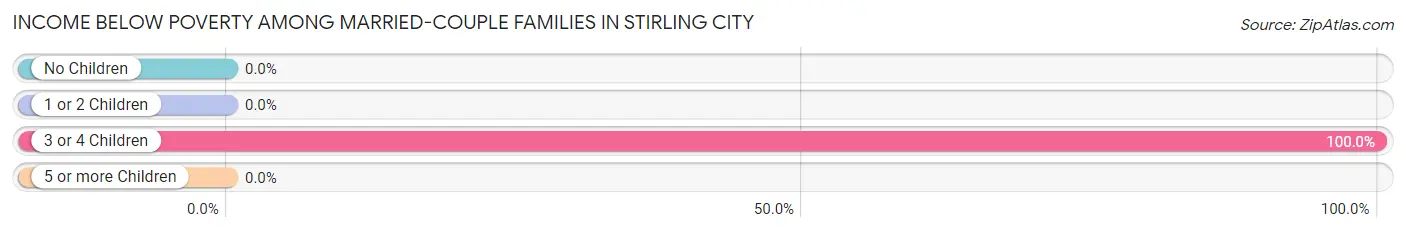
| Children | Above Poverty | Below Poverty |
| No Children | 22 (100.0%) | 0 (0.0%) |
| 1 or 2 Children | 0 (0.0%) | 0 (0.0%) |
| 3 or 4 Children | 0 (0.0%) | 36 (100.0%) |
| 5 or more Children | 0 (0.0%) | 0 (0.0%) |
| Total | 22 (37.9%) | 36 (62.1%) |
Income Below Poverty Among Single-Parent Households in Stirling City
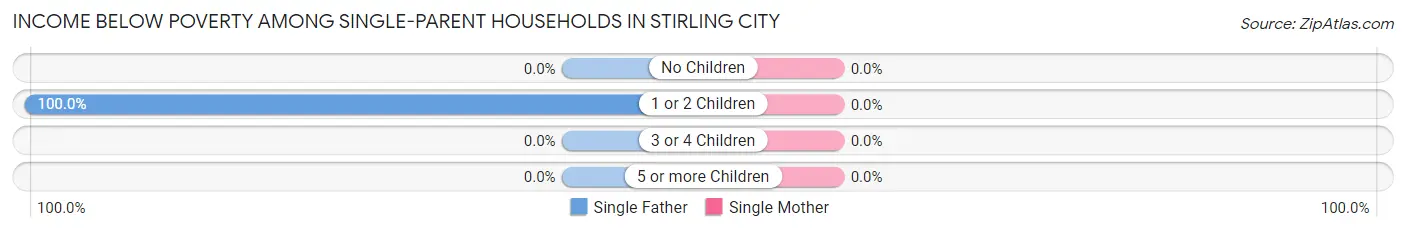
| Children | Single Father | Single Mother |
| No Children | 0 (0.0%) | 0 (0.0%) |
| 1 or 2 Children | 12 (100.0%) | 0 (0.0%) |
| 3 or 4 Children | 0 (0.0%) | 0 (0.0%) |
| 5 or more Children | 0 (0.0%) | 0 (0.0%) |
| Total | 12 (100.0%) | 0 (0.0%) |
Income Below Poverty Among Married-Couple vs Single-Parent Households in Stirling City
The poverty data for Stirling City shows that 36 of the married-couple family households (62.1%) and 12 of the single-parent households (13.8%) are living below the poverty level. Within the married-couple family households, those with 3 or 4 children have the highest poverty rate, with 36 households (100.0%) falling below the poverty line. Among the single-parent households, those with 1 or 2 children have the highest poverty rate, with 12 household (100.0%) living below poverty.
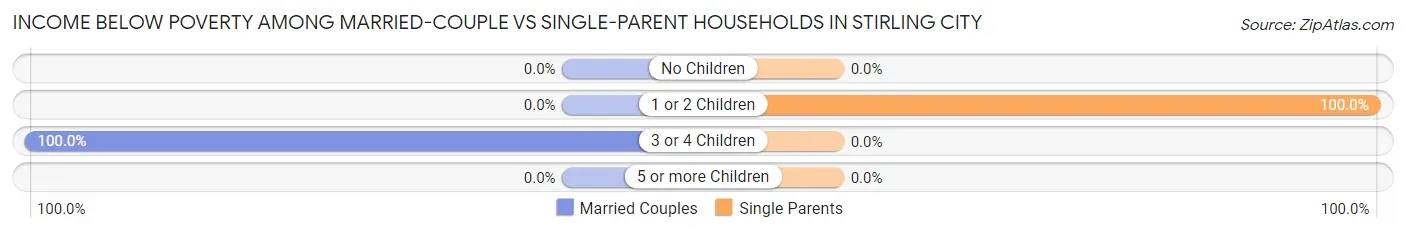
| Children | Married-Couple Families | Single-Parent Households |
| No Children | 0 (0.0%) | 0 (0.0%) |
| 1 or 2 Children | 0 (0.0%) | 12 (100.0%) |
| 3 or 4 Children | 36 (100.0%) | 0 (0.0%) |
| 5 or more Children | 0 (0.0%) | 0 (0.0%) |
| Total | 36 (62.1%) | 12 (13.8%) |
Race in Stirling City
The most populous races in Stirling City are White / Caucasian (501 | 100.0%), and Hispanic or Latino (208 | 41.5%).
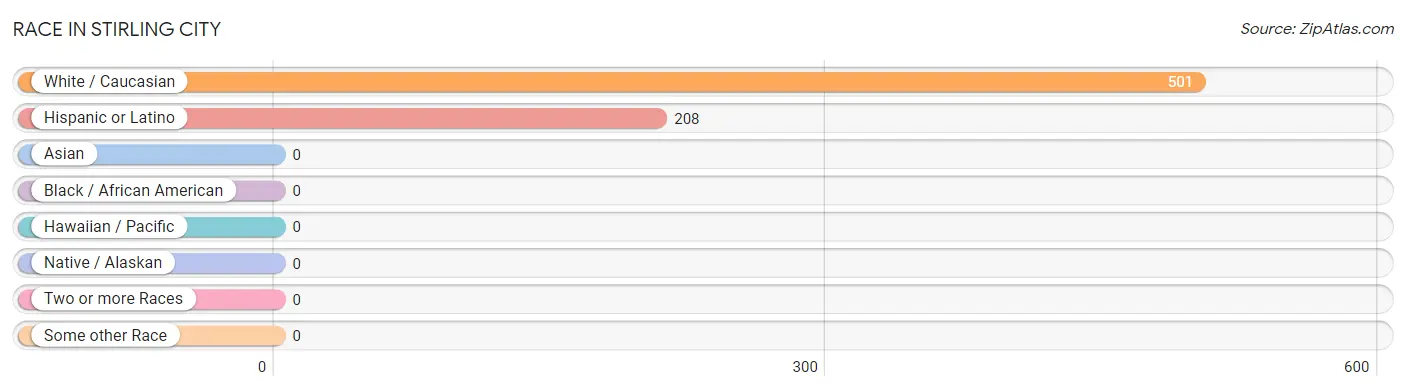
| Race | # Population | % Population |
| Asian | 0 | 0.0% |
| Black / African American | 0 | 0.0% |
| Hawaiian / Pacific | 0 | 0.0% |
| Hispanic or Latino | 208 | 41.5% |
| Native / Alaskan | 0 | 0.0% |
| White / Caucasian | 501 | 100.0% |
| Two or more Races | 0 | 0.0% |
| Some other Race | 0 | 0.0% |
| Total | 501 | 100.0% |
Ancestry in Stirling City
The most populous ancestries reported in Stirling City are Mexican (208 | 41.5%), German (33 | 6.6%), Italian (11 | 2.2%), and Scottish (11 | 2.2%), together accounting for 52.5% of all Stirling City residents.
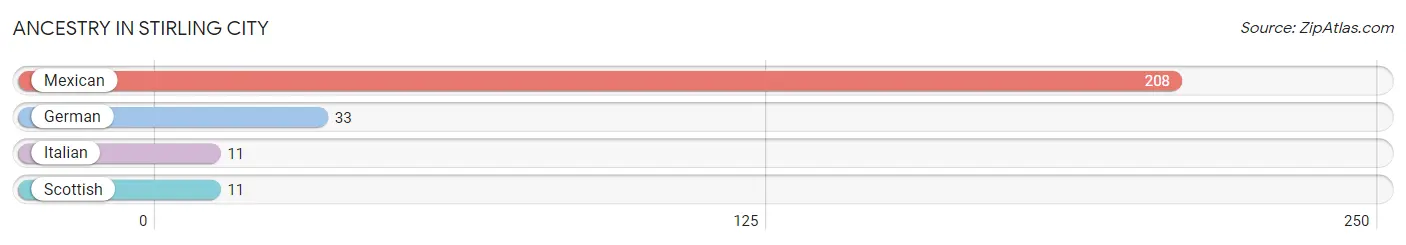
| Ancestry | # Population | % Population |
| German | 33 | 6.6% |
| Italian | 11 | 2.2% |
| Mexican | 208 | 41.5% |
| Scottish | 11 | 2.2% | View All 4 Rows |
Immigrants in Stirling City
The most numerous immigrant groups reported in Stirling City came from Central America (94 | 18.8%), Latin America (94 | 18.8%), and Mexico (94 | 18.8%), together accounting for 56.3% of all Stirling City residents.
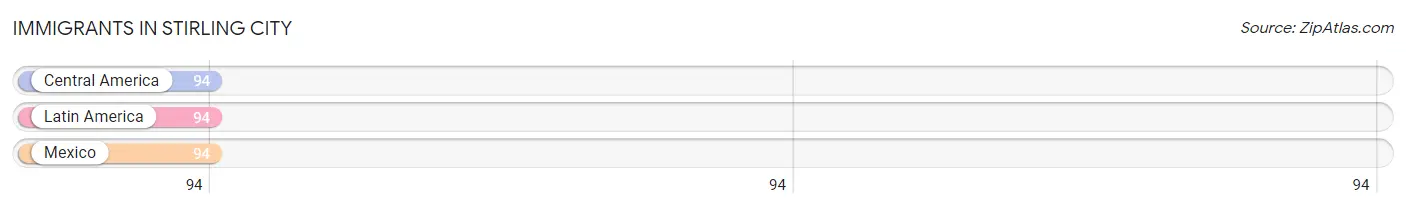
| Immigration Origin | # Population | % Population |
| Central America | 94 | 18.8% |
| Latin America | 94 | 18.8% |
| Mexico | 94 | 18.8% | View All 3 Rows |
Sex and Age in Stirling City
Sex and Age in Stirling City
The most populous age groups in Stirling City are 15 to 19 Years (39 | 23.5%) for men and 55 to 59 Years (168 | 50.1%) for women.
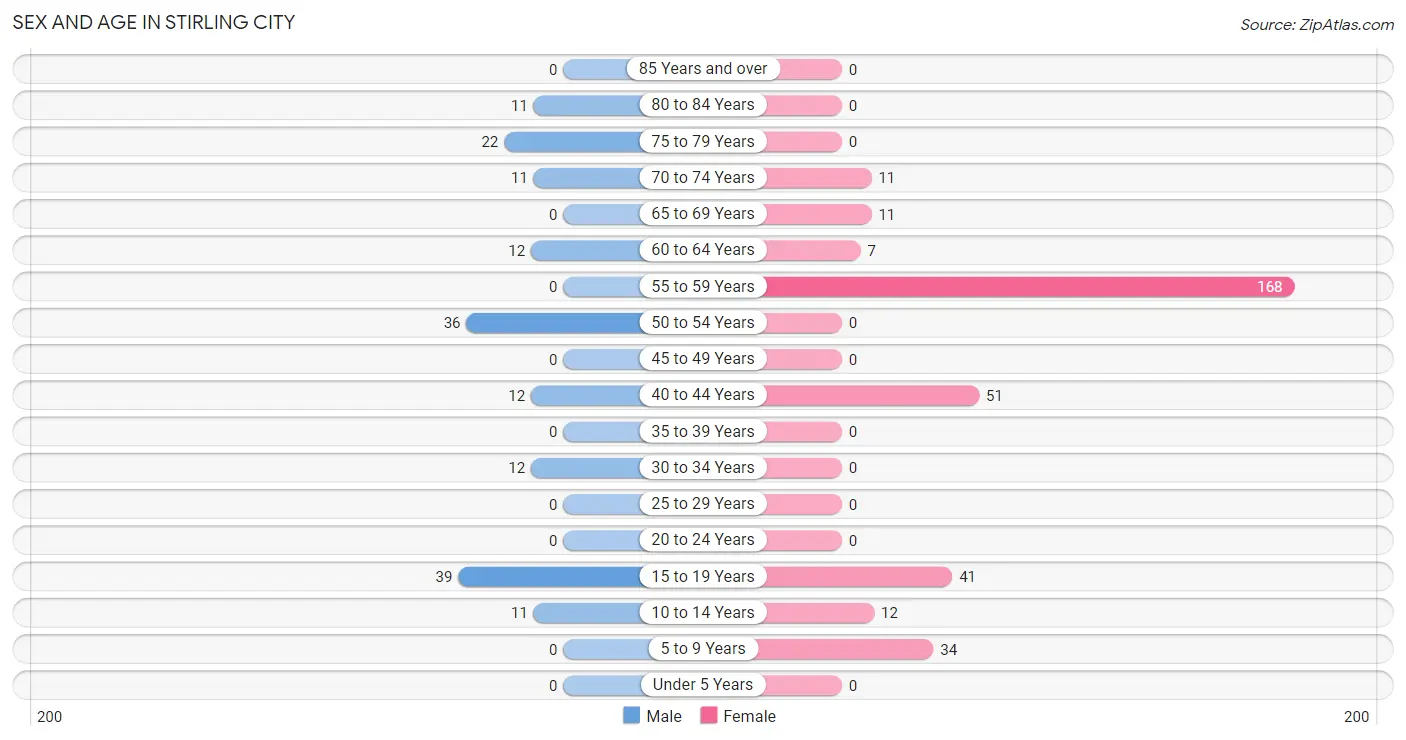
| Age Bracket | Male | Female |
| Under 5 Years | 0 (0.0%) | 0 (0.0%) |
| 5 to 9 Years | 0 (0.0%) | 34 (10.2%) |
| 10 to 14 Years | 11 (6.6%) | 12 (3.6%) |
| 15 to 19 Years | 39 (23.5%) | 41 (12.2%) |
| 20 to 24 Years | 0 (0.0%) | 0 (0.0%) |
| 25 to 29 Years | 0 (0.0%) | 0 (0.0%) |
| 30 to 34 Years | 12 (7.2%) | 0 (0.0%) |
| 35 to 39 Years | 0 (0.0%) | 0 (0.0%) |
| 40 to 44 Years | 12 (7.2%) | 51 (15.2%) |
| 45 to 49 Years | 0 (0.0%) | 0 (0.0%) |
| 50 to 54 Years | 36 (21.7%) | 0 (0.0%) |
| 55 to 59 Years | 0 (0.0%) | 168 (50.1%) |
| 60 to 64 Years | 12 (7.2%) | 7 (2.1%) |
| 65 to 69 Years | 0 (0.0%) | 11 (3.3%) |
| 70 to 74 Years | 11 (6.6%) | 11 (3.3%) |
| 75 to 79 Years | 22 (13.3%) | 0 (0.0%) |
| 80 to 84 Years | 11 (6.6%) | 0 (0.0%) |
| 85 Years and over | 0 (0.0%) | 0 (0.0%) |
| Total | 166 (100.0%) | 335 (100.0%) |
Families and Households in Stirling City
Median Family Size in Stirling City
The median family size in Stirling City is 2.78 persons per family, with married-couple families (58 | 40.0%) accounting for the largest median family size of 4.03 persons per family. On the other hand, single male/father families (12 | 8.3%) represent the smallest median family size with 1.92 persons per family.
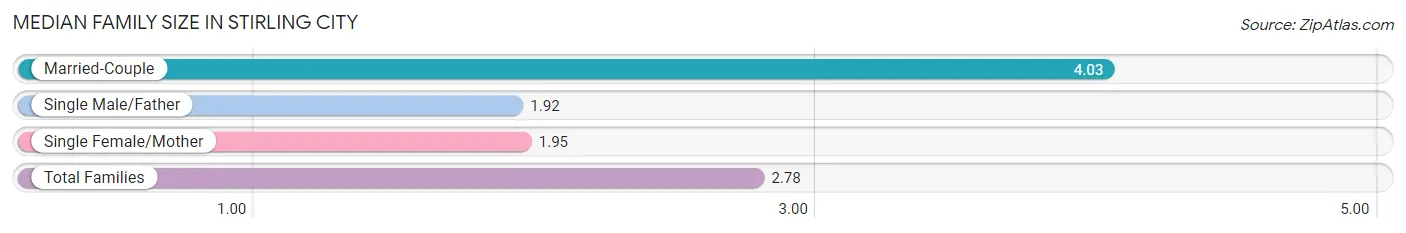
| Family Type | # Families | Family Size |
| Married-Couple | 58 (40.0%) | 4.03 |
| Single Male/Father | 12 (8.3%) | 1.92 |
| Single Female/Mother | 75 (51.7%) | 1.95 |
| Total Families | 145 (100.0%) | 2.78 |
Median Household Size in Stirling City
The median household size in Stirling City is 2.54 persons per household, with single male/father households (12 | 6.1%) accounting for the largest median household size of 4.83 persons per household. non-family households (52 | 26.4%) represent the smallest median household size with 1.21 persons per household.
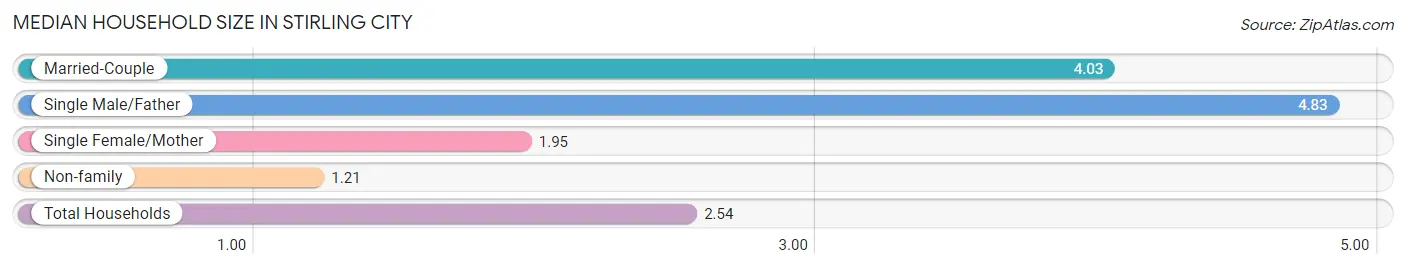
| Household Type | # Households | Household Size |
| Married-Couple | 58 (29.4%) | 4.03 |
| Single Male/Father | 12 (6.1%) | 4.83 |
| Single Female/Mother | 75 (38.1%) | 1.95 |
| Non-family | 52 (26.4%) | 1.21 |
| Total Households | 197 (100.0%) | 2.54 |
Household Size by Marriage Status in Stirling City
Out of a total of 197 households in Stirling City, 145 (73.6%) are family households, while 52 (26.4%) are nonfamily households. The most numerous type of family households are 2-person households, comprising 97, and the most common type of nonfamily households are 1-person households, comprising 45.
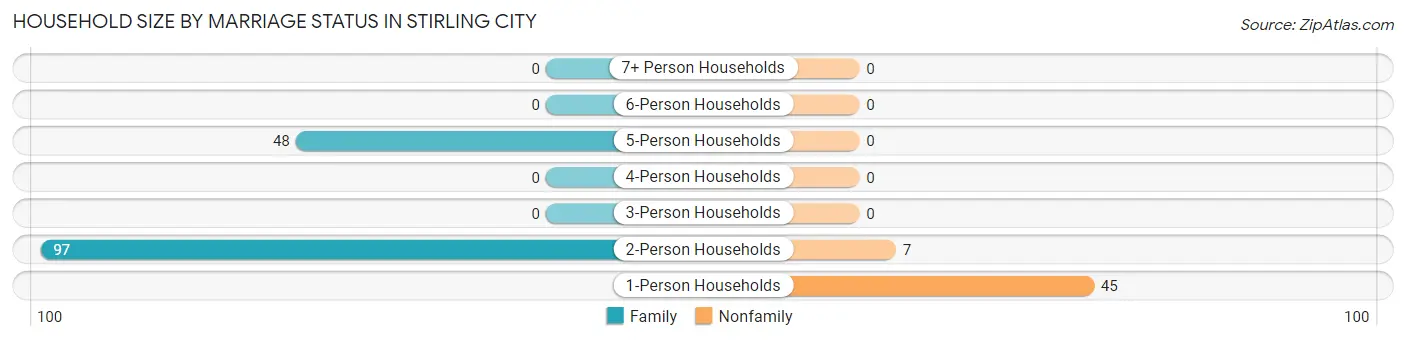
| Household Size | Family Households | Nonfamily Households |
| 1-Person Households | - | 45 (22.8%) |
| 2-Person Households | 97 (49.2%) | 7 (3.5%) |
| 3-Person Households | 0 (0.0%) | 0 (0.0%) |
| 4-Person Households | 0 (0.0%) | 0 (0.0%) |
| 5-Person Households | 48 (24.4%) | 0 (0.0%) |
| 6-Person Households | 0 (0.0%) | 0 (0.0%) |
| 7+ Person Households | 0 (0.0%) | 0 (0.0%) |
| Total | 145 (73.6%) | 52 (26.4%) |
Female Fertility in Stirling City
Fertility by Age in Stirling City
| Age Bracket | Women with Births | Births / 1,000 Women |
| 15 to 19 years | 0 (0.0%) | 0.0 |
| 20 to 34 years | 0 (0.0%) | 0.0 |
| 35 to 50 years | 0 (0.0%) | 0.0 |
| Total | 0 (0.0%) | 0.0 |
Fertility by Age by Marriage Status in Stirling City
| Age Bracket | Married | Unmarried |
| 15 to 19 years | 0 (0.0%) | 0 (0.0%) |
| 20 to 34 years | 0 (0.0%) | 0 (0.0%) |
| 35 to 50 years | 0 (0.0%) | 0 (0.0%) |
| Total | 0 (0.0%) | 0 (0.0%) |
Fertility by Education in Stirling City
| Educational Attainment | Women with Births | Births / 1,000 Women |
| Less than High School | 0 (0.0%) | 0.0 |
| High School Diploma | 0 (0.0%) | 0.0 |
| College or Associate's Degree | 0 (0.0%) | 0.0 |
| Bachelor's Degree | 0 (0.0%) | 0.0 |
| Graduate Degree | 0 (0.0%) | 0.0 |
| Total | 0 (0.0%) | 0.0 |
Fertility by Education by Marriage Status in Stirling City
| Educational Attainment | Married | Unmarried |
| Less than High School | 0 (0.0%) | 0 (0.0%) |
| High School Diploma | 0 (0.0%) | 0 (0.0%) |
| College or Associate's Degree | 0 (0.0%) | 0 (0.0%) |
| Bachelor's Degree | 0 (0.0%) | 0 (0.0%) |
| Graduate Degree | 0 (0.0%) | 0 (0.0%) |
| Total | 0 (0.0%) | 0 (0.0%) |
Employment Characteristics in Stirling City
Employment by Class of Employer in Stirling City
Among the 206 employed individuals in Stirling City, private company employees (135 | 65.5%), and state government employees (71 | 34.5%) make up the most common classes of employment.
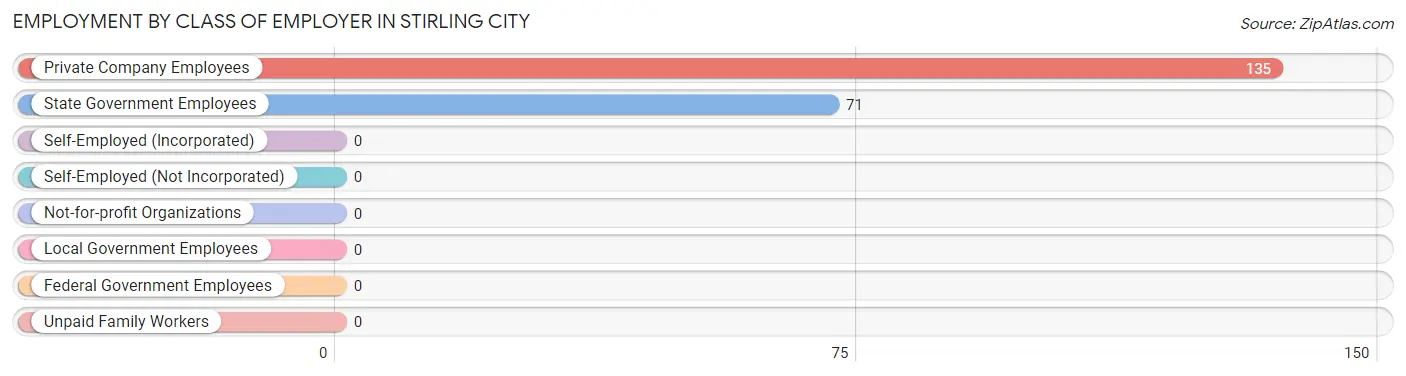
| Employer Class | # Employees | % Employees |
| Private Company Employees | 135 | 65.5% |
| Self-Employed (Incorporated) | 0 | 0.0% |
| Self-Employed (Not Incorporated) | 0 | 0.0% |
| Not-for-profit Organizations | 0 | 0.0% |
| Local Government Employees | 0 | 0.0% |
| State Government Employees | 71 | 34.5% |
| Federal Government Employees | 0 | 0.0% |
| Unpaid Family Workers | 0 | 0.0% |
| Total | 206 | 100.0% |
Employment Status by Age in Stirling City
According to the labor force statistics for Stirling City, out of the total population over 16 years of age (403), 55.6% or 224 individuals are in the labor force, with 8.0% or 18 of them unemployed. The age group with the highest labor force participation rate is 30 to 34 years, with 100.0% or 12 individuals in the labor force. Within the labor force, the 60 to 64 years age range has the highest percentage of unemployed individuals, with 100.0% or 7 of them being unemployed.
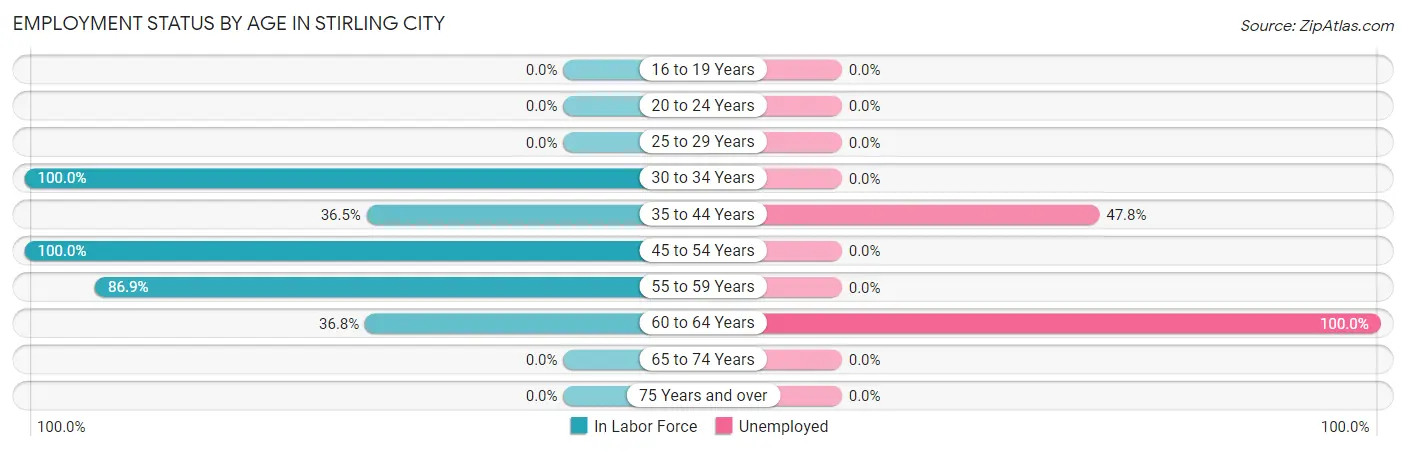
| Age Bracket | In Labor Force | Unemployed |
| 16 to 19 Years | 0 (0.0%) | 0 (0.0%) |
| 20 to 24 Years | 0 (0.0%) | 0 (0.0%) |
| 25 to 29 Years | 0 (0.0%) | 0 (0.0%) |
| 30 to 34 Years | 12 (100.0%) | 0 (0.0%) |
| 35 to 44 Years | 23 (36.5%) | 11 (47.8%) |
| 45 to 54 Years | 36 (100.0%) | 0 (0.0%) |
| 55 to 59 Years | 146 (86.9%) | 0 (0.0%) |
| 60 to 64 Years | 7 (36.8%) | 7 (100.0%) |
| 65 to 74 Years | 0 (0.0%) | 0 (0.0%) |
| 75 Years and over | 0 (0.0%) | 0 (0.0%) |
| Total | 224 (55.6%) | 18 (8.0%) |
Employment Status by Educational Attainment in Stirling City
According to labor force statistics for Stirling City, 75.2% of individuals (224) out of the total population between 25 and 64 years of age (298) are in the labor force, with 8.0% or 18 of them being unemployed. The group with the highest labor force participation rate are those with the educational attainment of bachelor's degree or higher, with 100.0% or 12 individuals in the labor force. Within the labor force, individuals with high school diploma education have the highest percentage of unemployment, with 10.2% or 18 of them being unemployed.
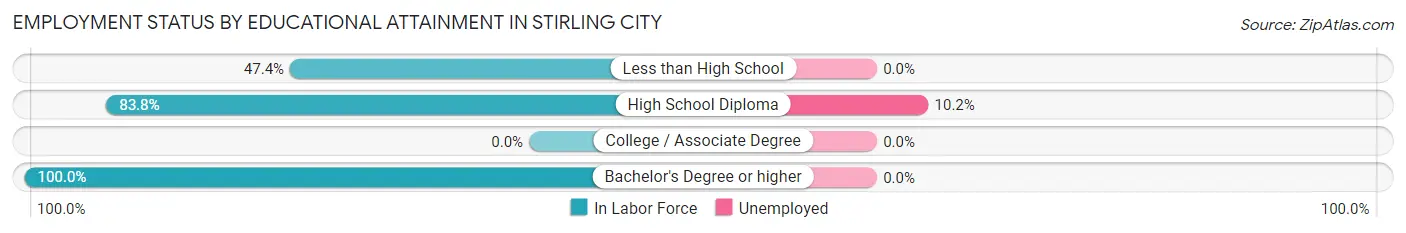
| Educational Attainment | In Labor Force | Unemployed |
| Less than High School | 36 (47.4%) | 0 (0.0%) |
| High School Diploma | 176 (83.8%) | 21 (10.2%) |
| College / Associate Degree | 0 (0.0%) | 0 (0.0%) |
| Bachelor's Degree or higher | 12 (100.0%) | 0 (0.0%) |
| Total | 224 (75.2%) | 24 (8.0%) |
Employment Occupations by Sex in Stirling City
Management, Business, Science and Arts Occupations
The most common Management, Business, Science and Arts occupations in Stirling City are , and Management (71 | 34.5%).
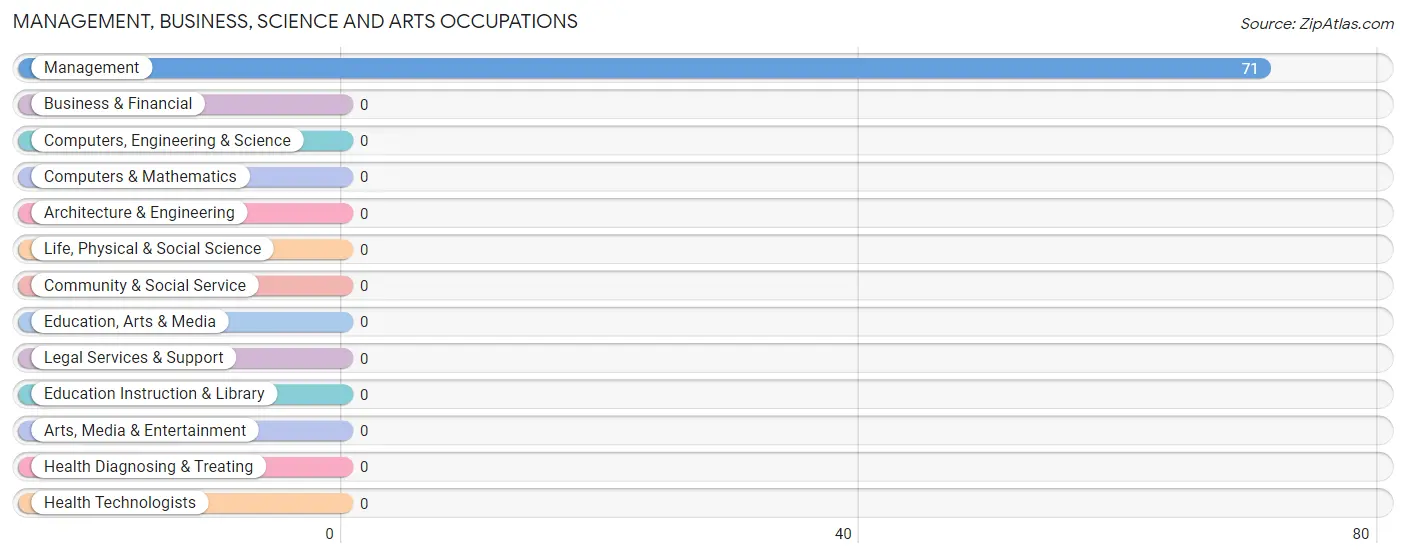
Management, Business, Science and Arts Occupations by Sex
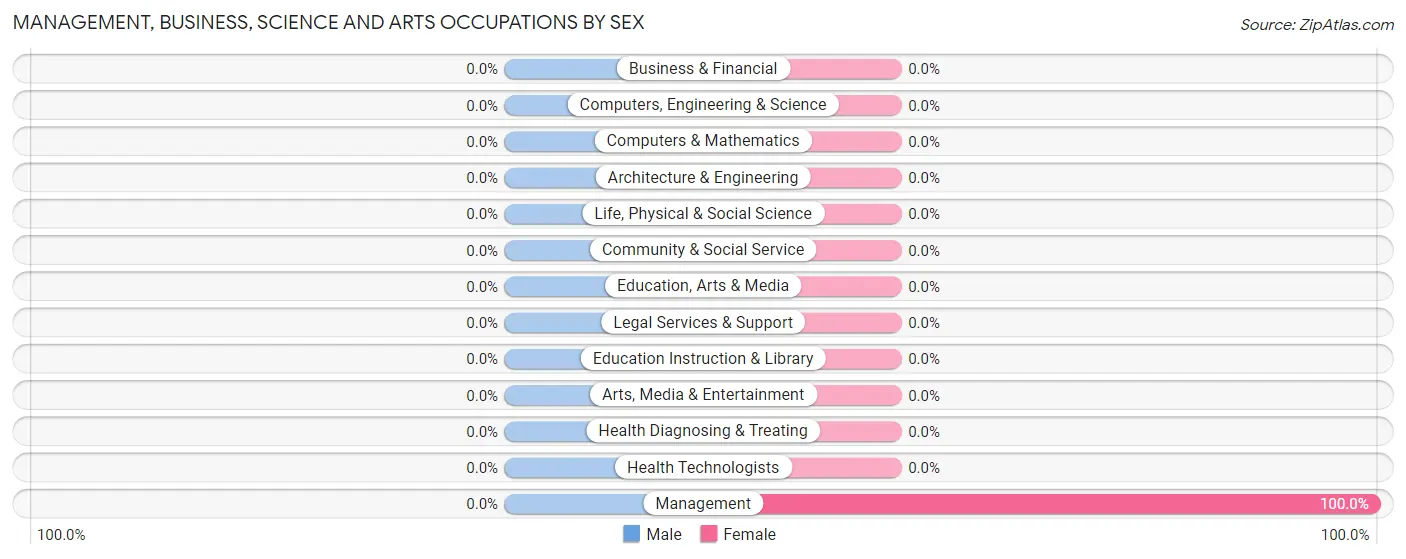
| Occupation | Male | Female |
| Management | 0 (0.0%) | 71 (100.0%) |
| Business & Financial | 0 (0.0%) | 0 (0.0%) |
| Computers, Engineering & Science | 0 (0.0%) | 0 (0.0%) |
| Computers & Mathematics | 0 (0.0%) | 0 (0.0%) |
| Architecture & Engineering | 0 (0.0%) | 0 (0.0%) |
| Life, Physical & Social Science | 0 (0.0%) | 0 (0.0%) |
| Community & Social Service | 0 (0.0%) | 0 (0.0%) |
| Education, Arts & Media | 0 (0.0%) | 0 (0.0%) |
| Legal Services & Support | 0 (0.0%) | 0 (0.0%) |
| Education Instruction & Library | 0 (0.0%) | 0 (0.0%) |
| Arts, Media & Entertainment | 0 (0.0%) | 0 (0.0%) |
| Health Diagnosing & Treating | 0 (0.0%) | 0 (0.0%) |
| Health Technologists | 0 (0.0%) | 0 (0.0%) |
| Total (Category) | 0 (0.0%) | 71 (100.0%) |
| Total (Overall) | 60 (29.1%) | 146 (70.9%) |
Services Occupations
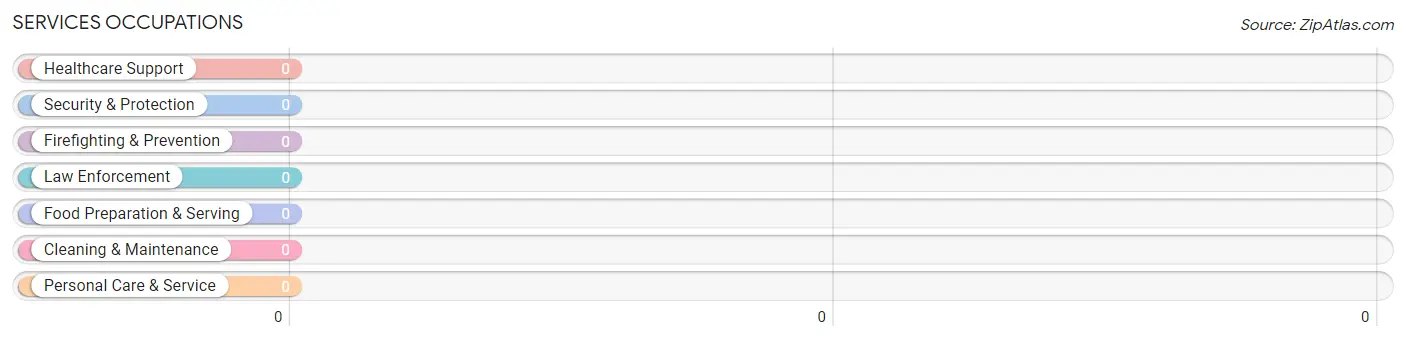
Services Occupations by Sex
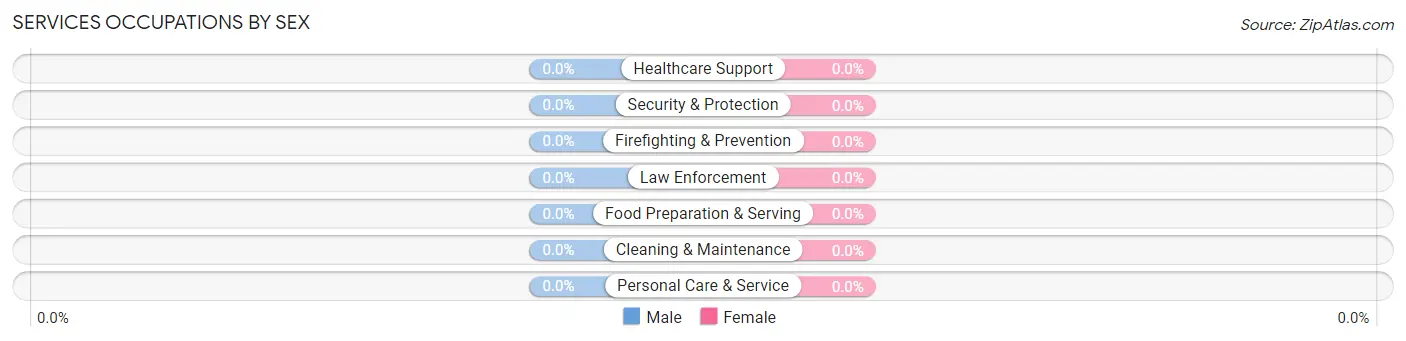
| Occupation | Male | Female |
| Healthcare Support | 0 (0.0%) | 0 (0.0%) |
| Security & Protection | 0 (0.0%) | 0 (0.0%) |
| Firefighting & Prevention | 0 (0.0%) | 0 (0.0%) |
| Law Enforcement | 0 (0.0%) | 0 (0.0%) |
| Food Preparation & Serving | 0 (0.0%) | 0 (0.0%) |
| Cleaning & Maintenance | 0 (0.0%) | 0 (0.0%) |
| Personal Care & Service | 0 (0.0%) | 0 (0.0%) |
| Total (Category) | 0 (0.0%) | 0 (0.0%) |
| Total (Overall) | 60 (29.1%) | 146 (70.9%) |
Sales and Office Occupations
The most common Sales and Office occupations in Stirling City are , and Sales & Related (75 | 36.4%).
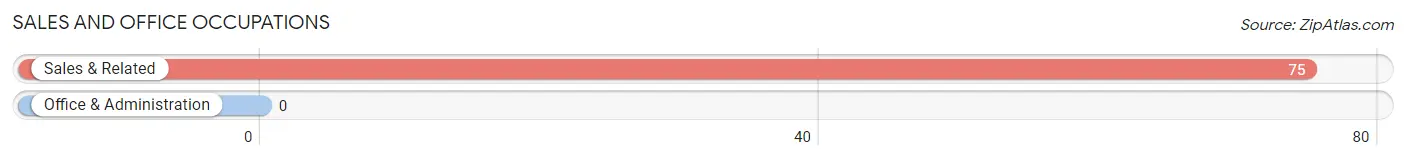
Sales and Office Occupations by Sex
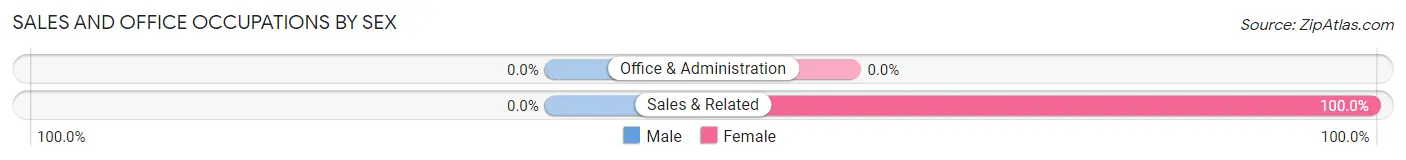
| Occupation | Male | Female |
| Sales & Related | 0 (0.0%) | 75 (100.0%) |
| Office & Administration | 0 (0.0%) | 0 (0.0%) |
| Total (Category) | 0 (0.0%) | 75 (100.0%) |
| Total (Overall) | 60 (29.1%) | 146 (70.9%) |
Natural Resources, Construction and Maintenance Occupations
The most common Natural Resources, Construction and Maintenance occupations in Stirling City are Construction & Extraction (48 | 23.3%), and Installation, Maintenance & Repair (12 | 5.8%).
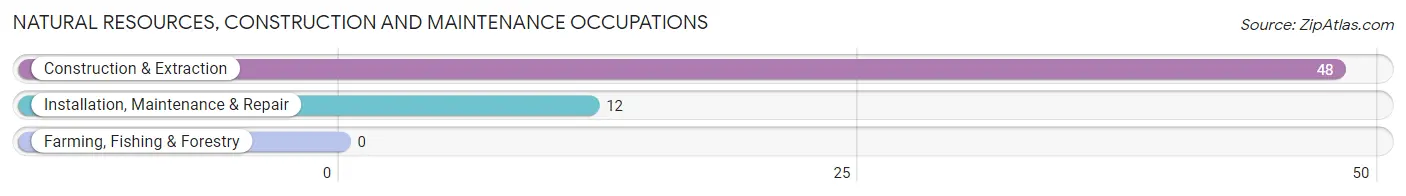
Natural Resources, Construction and Maintenance Occupations by Sex
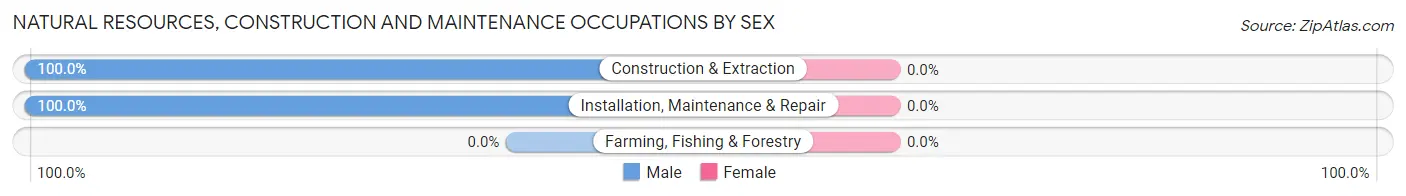
| Occupation | Male | Female |
| Farming, Fishing & Forestry | 0 (0.0%) | 0 (0.0%) |
| Construction & Extraction | 48 (100.0%) | 0 (0.0%) |
| Installation, Maintenance & Repair | 12 (100.0%) | 0 (0.0%) |
| Total (Category) | 60 (100.0%) | 0 (0.0%) |
| Total (Overall) | 60 (29.1%) | 146 (70.9%) |
Production, Transportation and Moving Occupations
Production, Transportation and Moving Occupations by Sex
| Occupation | Male | Female |
| Production | 0 (0.0%) | 0 (0.0%) |
| Transportation | 0 (0.0%) | 0 (0.0%) |
| Material Moving | 0 (0.0%) | 0 (0.0%) |
| Total (Category) | 0 (0.0%) | 0 (0.0%) |
| Total (Overall) | 60 (29.1%) | 146 (70.9%) |
Employment Industries by Sex in Stirling City
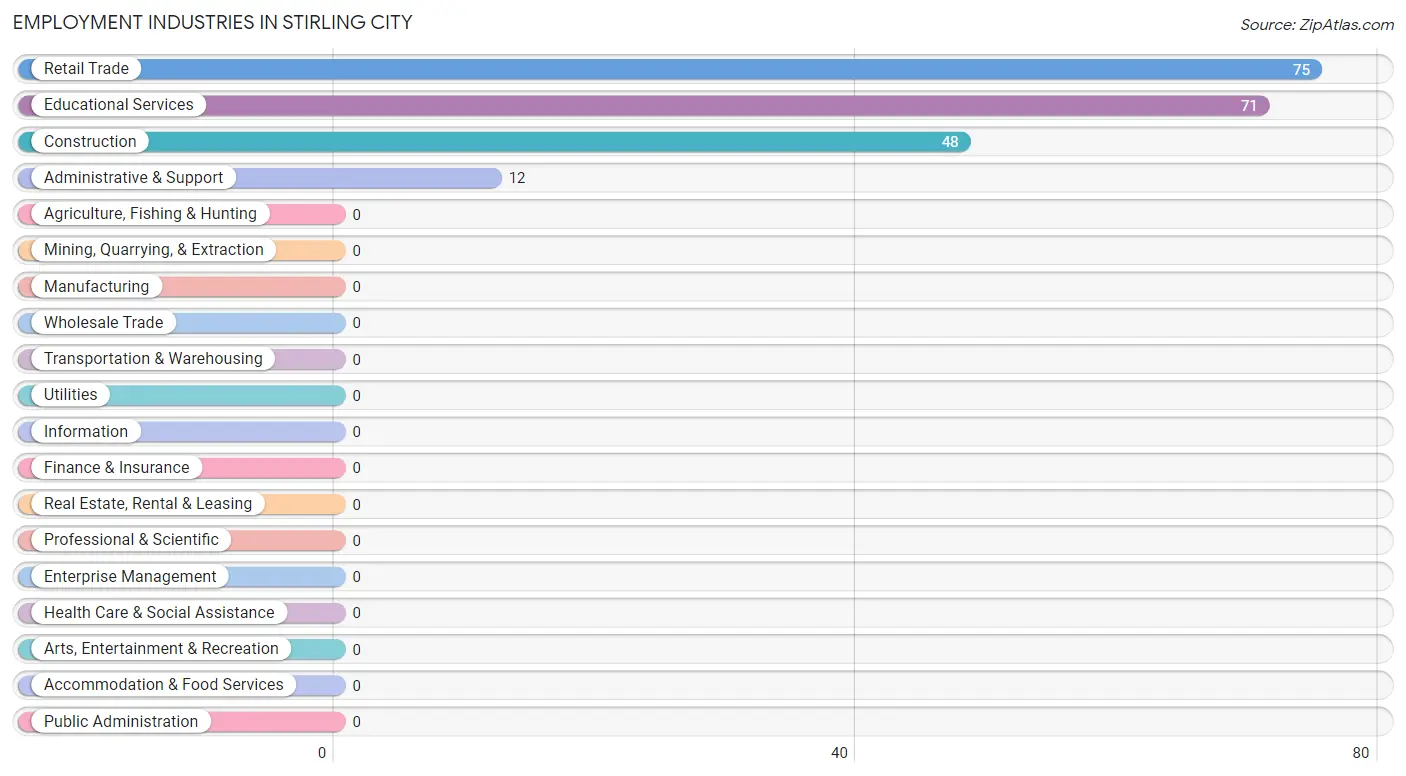
Employment Industries in Stirling City
The major employment industries in Stirling City include Retail Trade (75 | 36.4%), Educational Services (71 | 34.5%), Construction (48 | 23.3%), and Administrative & Support (12 | 5.8%).
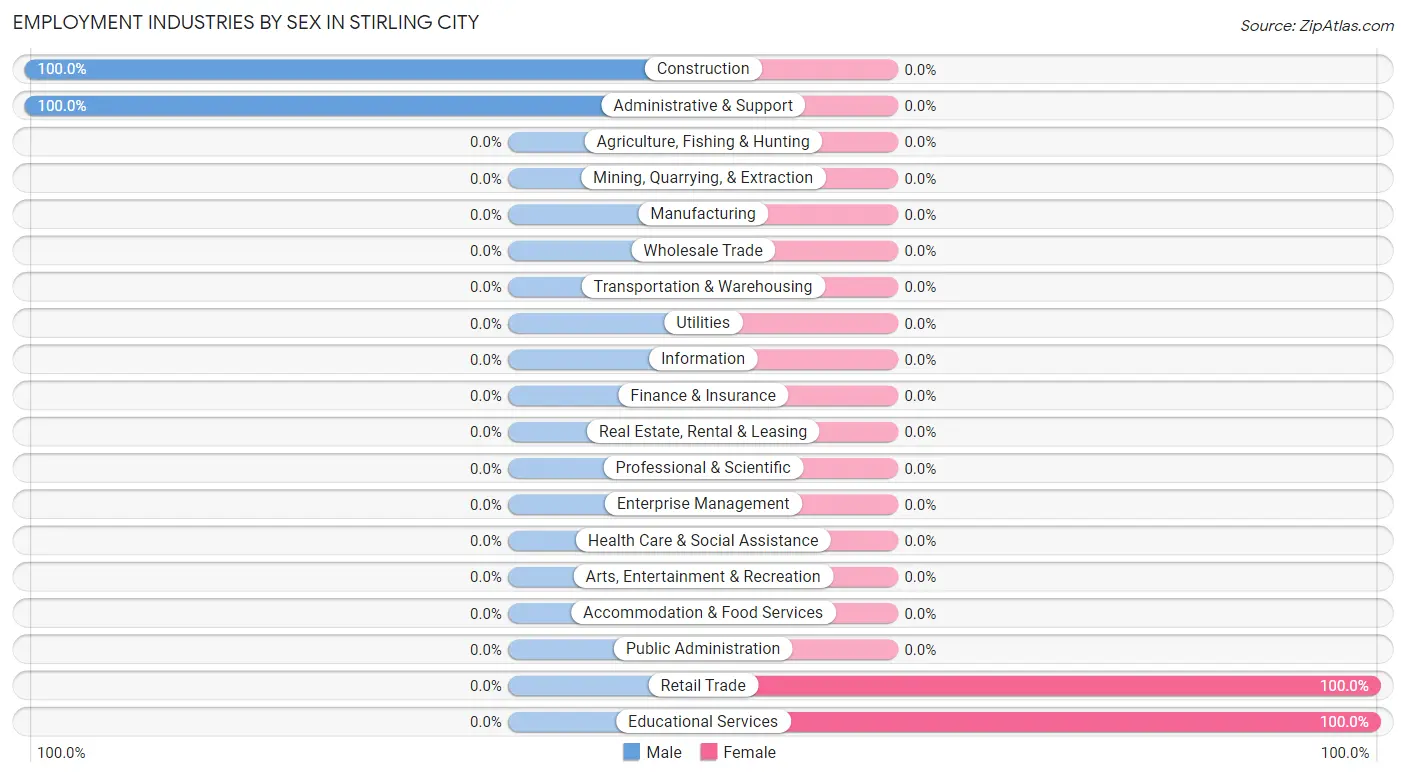
Employment Industries by Sex in Stirling City
The Stirling City industries that see more men than women are Construction (100.0%), and Administrative & Support (100.0%), whereas the industries that tend to have a higher number of women are Retail Trade (100.0%), and Educational Services (100.0%).
| Industry | Male | Female |
| Agriculture, Fishing & Hunting | 0 (0.0%) | 0 (0.0%) |
| Mining, Quarrying, & Extraction | 0 (0.0%) | 0 (0.0%) |
| Construction | 48 (100.0%) | 0 (0.0%) |
| Manufacturing | 0 (0.0%) | 0 (0.0%) |
| Wholesale Trade | 0 (0.0%) | 0 (0.0%) |
| Retail Trade | 0 (0.0%) | 75 (100.0%) |
| Transportation & Warehousing | 0 (0.0%) | 0 (0.0%) |
| Utilities | 0 (0.0%) | 0 (0.0%) |
| Information | 0 (0.0%) | 0 (0.0%) |
| Finance & Insurance | 0 (0.0%) | 0 (0.0%) |
| Real Estate, Rental & Leasing | 0 (0.0%) | 0 (0.0%) |
| Professional & Scientific | 0 (0.0%) | 0 (0.0%) |
| Enterprise Management | 0 (0.0%) | 0 (0.0%) |
| Administrative & Support | 12 (100.0%) | 0 (0.0%) |
| Educational Services | 0 (0.0%) | 71 (100.0%) |
| Health Care & Social Assistance | 0 (0.0%) | 0 (0.0%) |
| Arts, Entertainment & Recreation | 0 (0.0%) | 0 (0.0%) |
| Accommodation & Food Services | 0 (0.0%) | 0 (0.0%) |
| Public Administration | 0 (0.0%) | 0 (0.0%) |
| Total | 60 (29.1%) | 146 (70.9%) |
Education in Stirling City
School Enrollment in Stirling City
The most common levels of schooling among the 137 students in Stirling City are high school (80 | 58.4%), elementary school (34 | 24.8%), and middle school (23 | 16.8%).
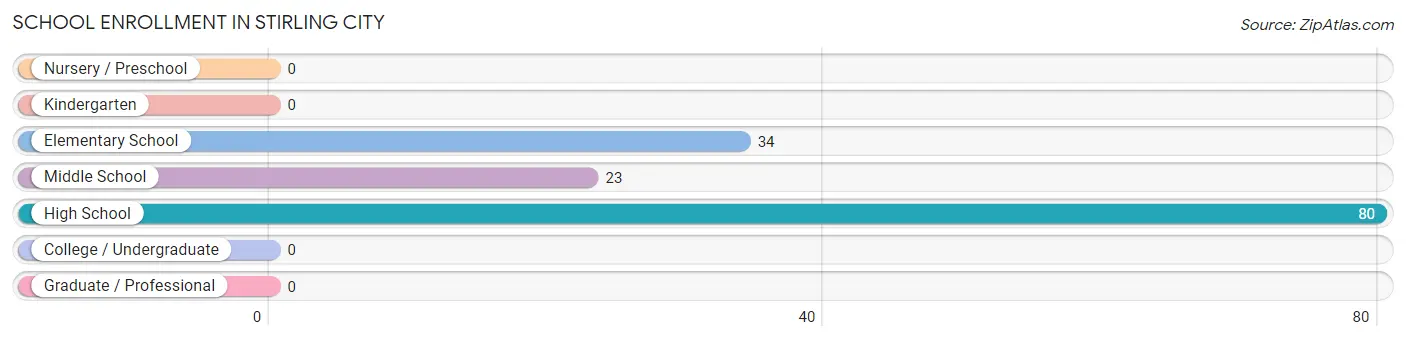
| School Level | # Students | % Students |
| Nursery / Preschool | 0 | 0.0% |
| Kindergarten | 0 | 0.0% |
| Elementary School | 34 | 24.8% |
| Middle School | 23 | 16.8% |
| High School | 80 | 58.4% |
| College / Undergraduate | 0 | 0.0% |
| Graduate / Professional | 0 | 0.0% |
| Total | 137 | 100.0% |
School Enrollment by Age by Funding Source in Stirling City
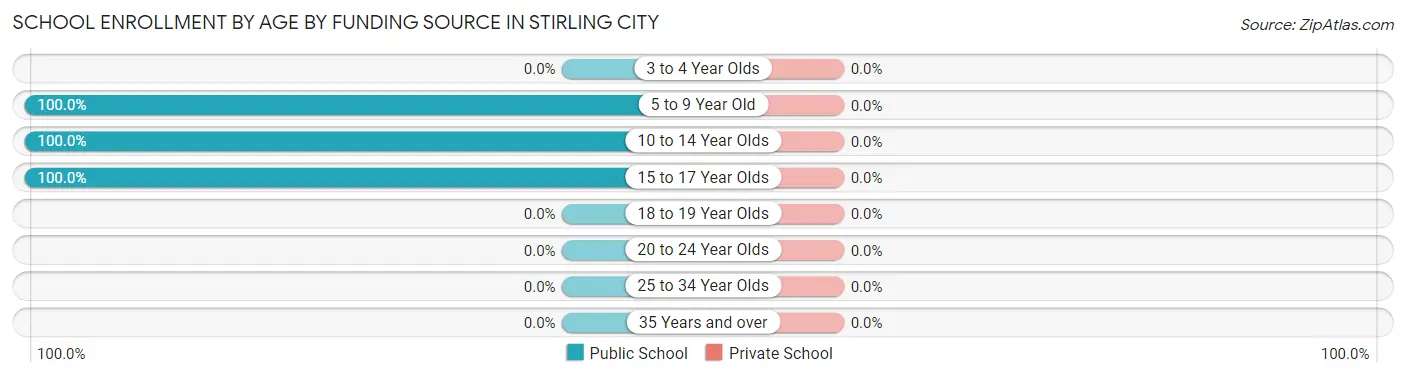
| Age Bracket | Public School | Private School |
| 3 to 4 Year Olds | 0 (0.0%) | 0 (0.0%) |
| 5 to 9 Year Old | 34 (100.0%) | 0 (0.0%) |
| 10 to 14 Year Olds | 23 (100.0%) | 0 (0.0%) |
| 15 to 17 Year Olds | 80 (100.0%) | 0 (0.0%) |
| 18 to 19 Year Olds | 0 (0.0%) | 0 (0.0%) |
| 20 to 24 Year Olds | 0 (0.0%) | 0 (0.0%) |
| 25 to 34 Year Olds | 0 (0.0%) | 0 (0.0%) |
| 35 Years and over | 0 (0.0%) | 0 (0.0%) |
| Total | 137 (100.0%) | 0 (0.0%) |
Educational Attainment by Field of Study in Stirling City
, and computers & mathematics (12 | 100.0%) are the most common fields of study among 12 individuals in Stirling City who have obtained a bachelor's degree or higher.
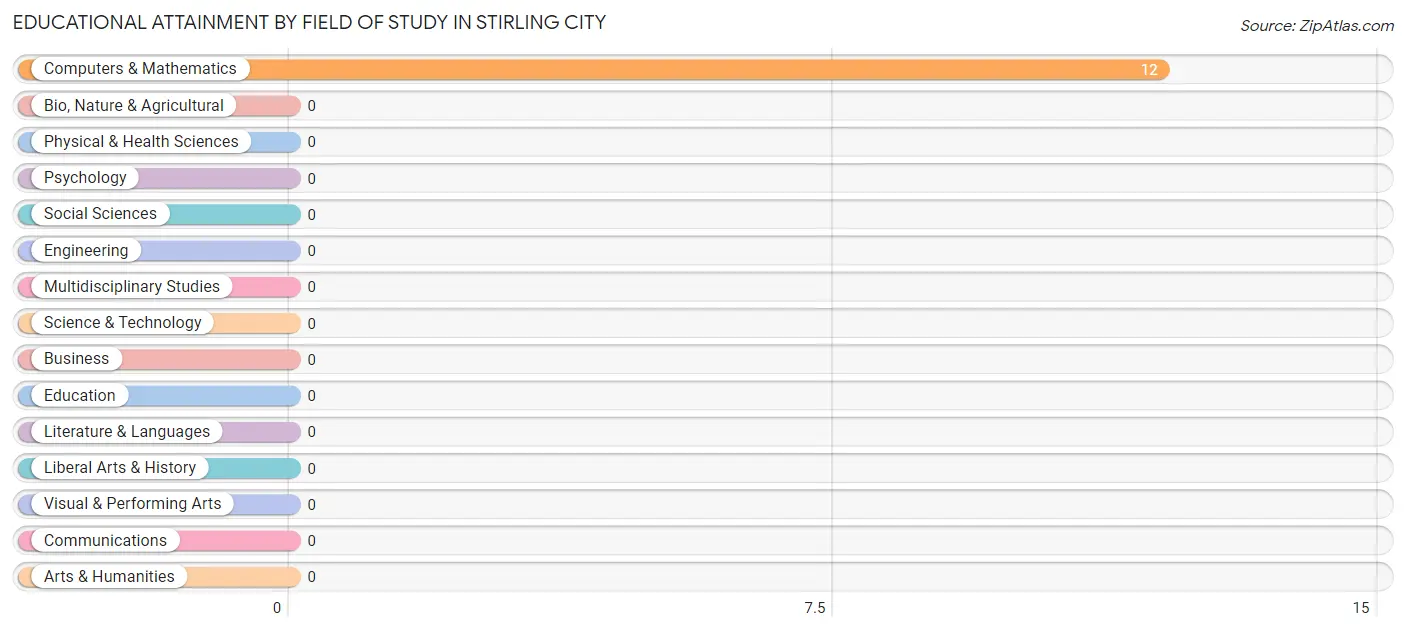
| Field of Study | # Graduates | % Graduates |
| Computers & Mathematics | 12 | 100.0% |
| Bio, Nature & Agricultural | 0 | 0.0% |
| Physical & Health Sciences | 0 | 0.0% |
| Psychology | 0 | 0.0% |
| Social Sciences | 0 | 0.0% |
| Engineering | 0 | 0.0% |
| Multidisciplinary Studies | 0 | 0.0% |
| Science & Technology | 0 | 0.0% |
| Business | 0 | 0.0% |
| Education | 0 | 0.0% |
| Literature & Languages | 0 | 0.0% |
| Liberal Arts & History | 0 | 0.0% |
| Visual & Performing Arts | 0 | 0.0% |
| Communications | 0 | 0.0% |
| Arts & Humanities | 0 | 0.0% |
| Total | 12 | 100.0% |
Transportation & Commute in Stirling City
Vehicle Availability by Sex in Stirling City
The most prevalent vehicle ownership categories in Stirling City are males with 1 vehicle (60, accounting for 100.0%) and females with 1 vehicle (0, making up 41.1%).
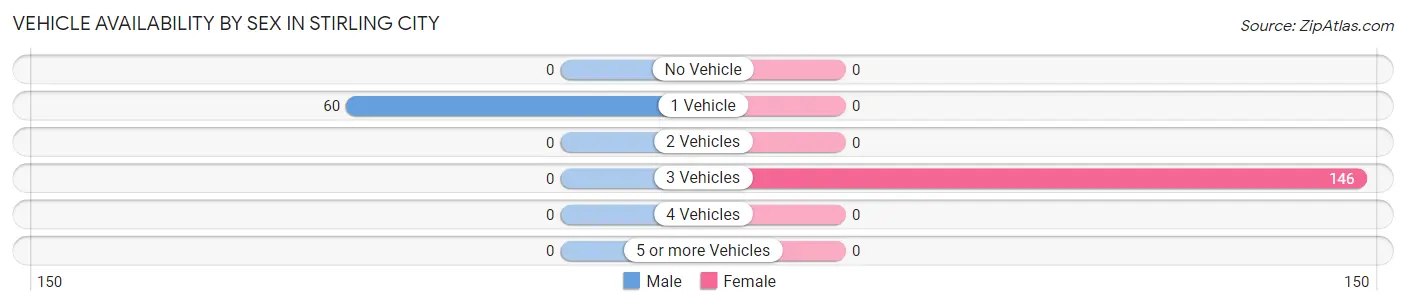
| Vehicles Available | Male | Female |
| No Vehicle | 0 (0.0%) | 0 (0.0%) |
| 1 Vehicle | 60 (100.0%) | 0 (0.0%) |
| 2 Vehicles | 0 (0.0%) | 0 (0.0%) |
| 3 Vehicles | 0 (0.0%) | 146 (100.0%) |
| 4 Vehicles | 0 (0.0%) | 0 (0.0%) |
| 5 or more Vehicles | 0 (0.0%) | 0 (0.0%) |
| Total | 60 (100.0%) | 146 (100.0%) |
Commute Time in Stirling City
The most frequently occuring commute durations in Stirling City are 30 to 34 minutes (87 commuters, 44.9%), 35 to 39 minutes (71 commuters, 36.6%), and 45 to 59 minutes (36 commuters, 18.6%).
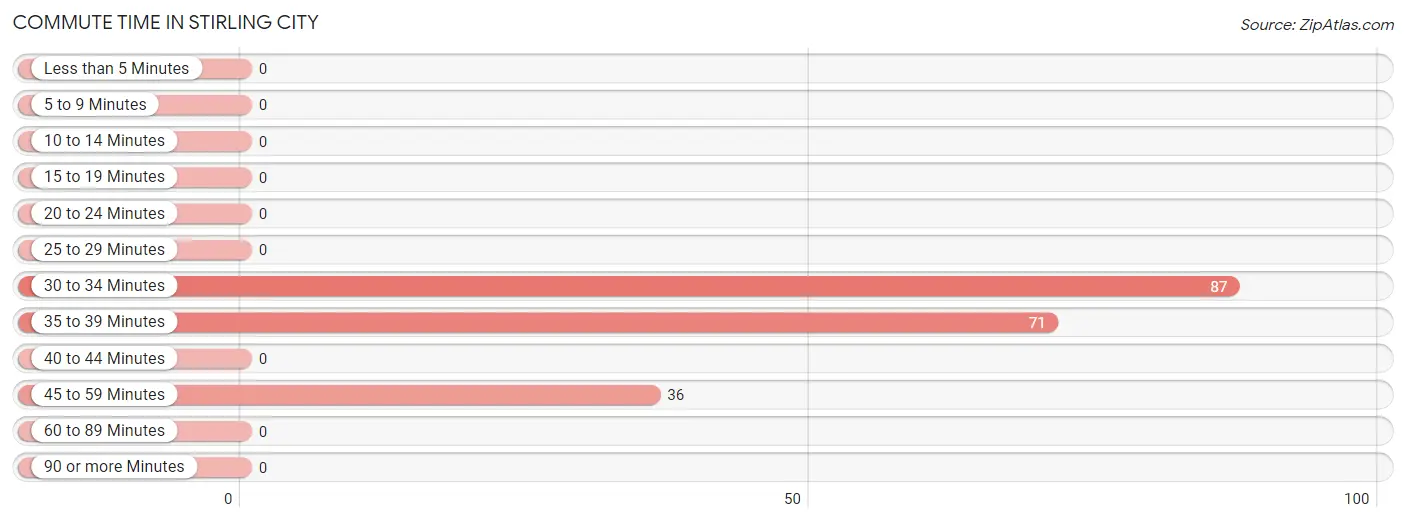
| Commute Time | # Commuters | % Commuters |
| Less than 5 Minutes | 0 | 0.0% |
| 5 to 9 Minutes | 0 | 0.0% |
| 10 to 14 Minutes | 0 | 0.0% |
| 15 to 19 Minutes | 0 | 0.0% |
| 20 to 24 Minutes | 0 | 0.0% |
| 25 to 29 Minutes | 0 | 0.0% |
| 30 to 34 Minutes | 87 | 44.9% |
| 35 to 39 Minutes | 71 | 36.6% |
| 40 to 44 Minutes | 0 | 0.0% |
| 45 to 59 Minutes | 36 | 18.6% |
| 60 to 89 Minutes | 0 | 0.0% |
| 90 or more Minutes | 0 | 0.0% |
Commute Time by Sex in Stirling City
The most common commute times in Stirling City are 45 to 59 minutes (36 commuters, 75.0%) for males and 30 to 34 minutes (75 commuters, 51.4%) for females.
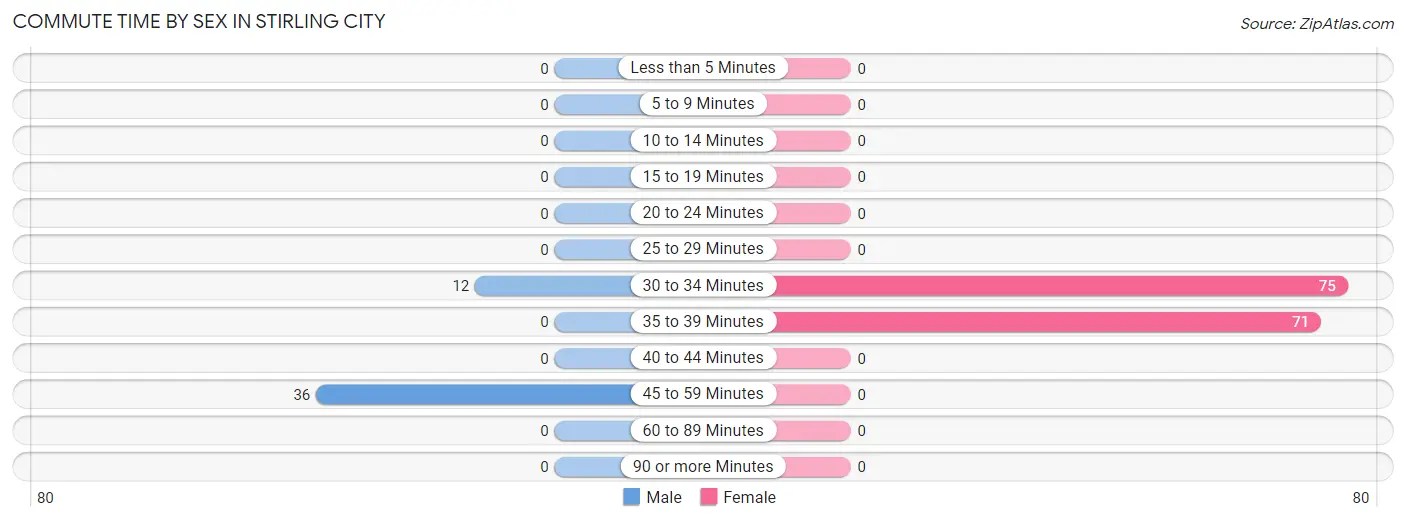
| Commute Time | Male | Female |
| Less than 5 Minutes | 0 (0.0%) | 0 (0.0%) |
| 5 to 9 Minutes | 0 (0.0%) | 0 (0.0%) |
| 10 to 14 Minutes | 0 (0.0%) | 0 (0.0%) |
| 15 to 19 Minutes | 0 (0.0%) | 0 (0.0%) |
| 20 to 24 Minutes | 0 (0.0%) | 0 (0.0%) |
| 25 to 29 Minutes | 0 (0.0%) | 0 (0.0%) |
| 30 to 34 Minutes | 12 (25.0%) | 75 (51.4%) |
| 35 to 39 Minutes | 0 (0.0%) | 71 (48.6%) |
| 40 to 44 Minutes | 0 (0.0%) | 0 (0.0%) |
| 45 to 59 Minutes | 36 (75.0%) | 0 (0.0%) |
| 60 to 89 Minutes | 0 (0.0%) | 0 (0.0%) |
| 90 or more Minutes | 0 (0.0%) | 0 (0.0%) |
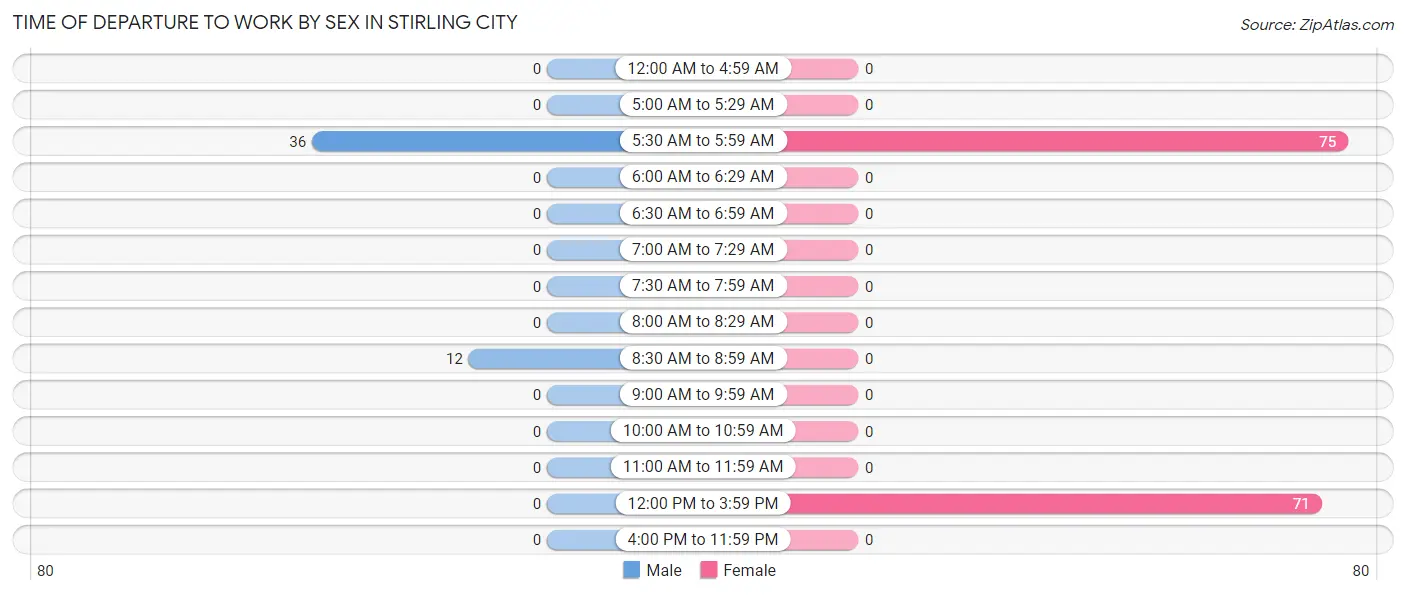
Time of Departure to Work by Sex in Stirling City
The most frequent times of departure to work in Stirling City are 5:30 AM to 5:59 AM (36, 75.0%) for males and 5:30 AM to 5:59 AM (75, 51.4%) for females.
| Time of Departure | Male | Female |
| 12:00 AM to 4:59 AM | 0 (0.0%) | 0 (0.0%) |
| 5:00 AM to 5:29 AM | 0 (0.0%) | 0 (0.0%) |
| 5:30 AM to 5:59 AM | 36 (75.0%) | 75 (51.4%) |
| 6:00 AM to 6:29 AM | 0 (0.0%) | 0 (0.0%) |
| 6:30 AM to 6:59 AM | 0 (0.0%) | 0 (0.0%) |
| 7:00 AM to 7:29 AM | 0 (0.0%) | 0 (0.0%) |
| 7:30 AM to 7:59 AM | 0 (0.0%) | 0 (0.0%) |
| 8:00 AM to 8:29 AM | 0 (0.0%) | 0 (0.0%) |
| 8:30 AM to 8:59 AM | 12 (25.0%) | 0 (0.0%) |
| 9:00 AM to 9:59 AM | 0 (0.0%) | 0 (0.0%) |
| 10:00 AM to 10:59 AM | 0 (0.0%) | 0 (0.0%) |
| 11:00 AM to 11:59 AM | 0 (0.0%) | 0 (0.0%) |
| 12:00 PM to 3:59 PM | 0 (0.0%) | 71 (48.6%) |
| 4:00 PM to 11:59 PM | 0 (0.0%) | 0 (0.0%) |
| Total | 48 (100.0%) | 146 (100.0%) |
Housing Occupancy in Stirling City
Occupancy by Ownership in Stirling City
Of the total 197 dwellings in Stirling City, owner-occupied units account for 120 (60.9%), while renter-occupied units make up 77 (39.1%).
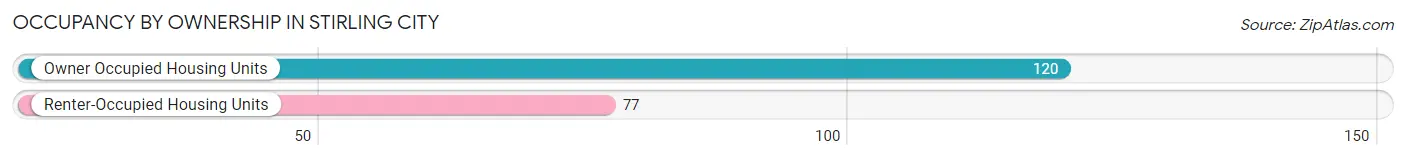
| Occupancy | # Housing Units | % Housing Units |
| Owner Occupied Housing Units | 120 | 60.9% |
| Renter-Occupied Housing Units | 77 | 39.1% |
| Total Occupied Housing Units | 197 | 100.0% |
Occupancy by Household Size in Stirling City
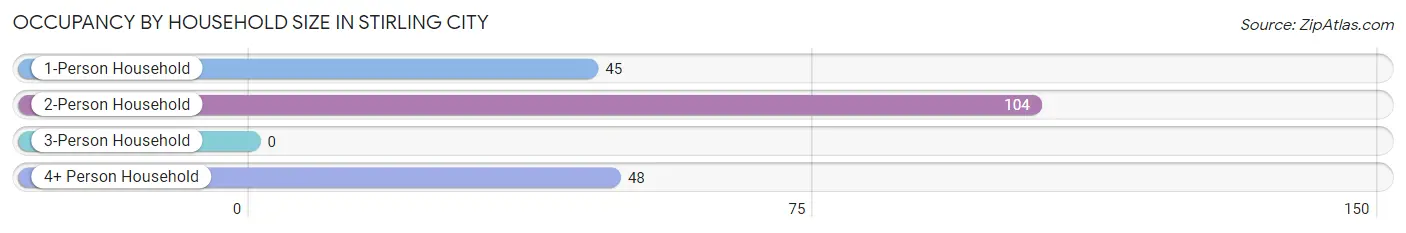
| Household Size | # Housing Units | % Housing Units |
| 1-Person Household | 45 | 22.8% |
| 2-Person Household | 104 | 52.8% |
| 3-Person Household | 0 | 0.0% |
| 4+ Person Household | 48 | 24.4% |
| Total Housing Units | 197 | 100.0% |
Occupancy by Ownership by Household Size in Stirling City
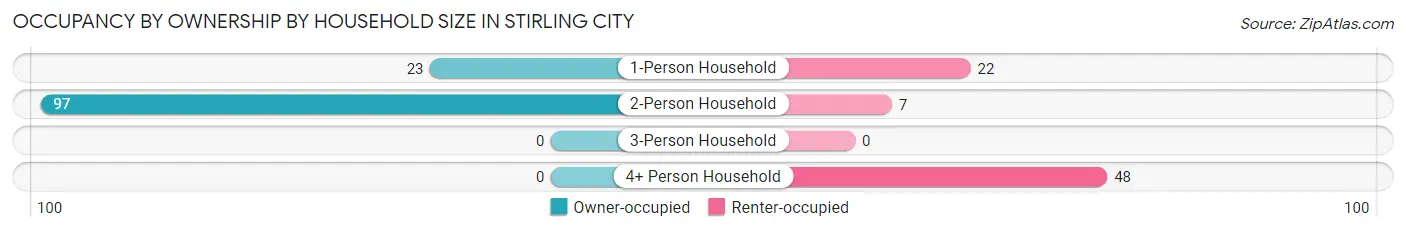
| Household Size | Owner-occupied | Renter-occupied |
| 1-Person Household | 23 (51.1%) | 22 (48.9%) |
| 2-Person Household | 97 (93.3%) | 7 (6.7%) |
| 3-Person Household | 0 (0.0%) | 0 (0.0%) |
| 4+ Person Household | 0 (0.0%) | 48 (100.0%) |
| Total Housing Units | 120 (60.9%) | 77 (39.1%) |
Occupancy by Educational Attainment in Stirling City
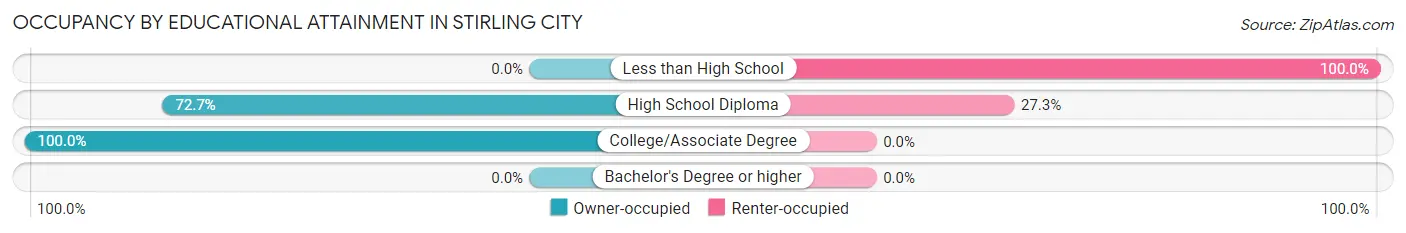
| Household Size | Owner-occupied | Renter-occupied |
| Less than High School | 0 (0.0%) | 36 (100.0%) |
| High School Diploma | 109 (72.7%) | 41 (27.3%) |
| College/Associate Degree | 11 (100.0%) | 0 (0.0%) |
| Bachelor's Degree or higher | 0 (0.0%) | 0 (0.0%) |
Occupancy by Age of Householder in Stirling City
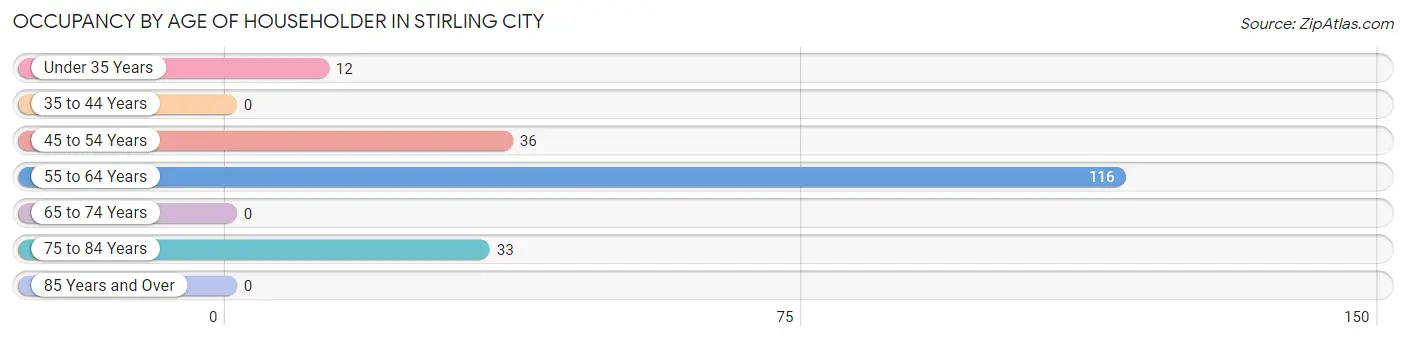
| Age Bracket | # Households | % Households |
| Under 35 Years | 12 | 6.1% |
| 35 to 44 Years | 0 | 0.0% |
| 45 to 54 Years | 36 | 18.3% |
| 55 to 64 Years | 116 | 58.9% |
| 65 to 74 Years | 0 | 0.0% |
| 75 to 84 Years | 33 | 16.8% |
| 85 Years and Over | 0 | 0.0% |
| Total | 197 | 100.0% |
Housing Finances in Stirling City
Median Income by Occupancy in Stirling City
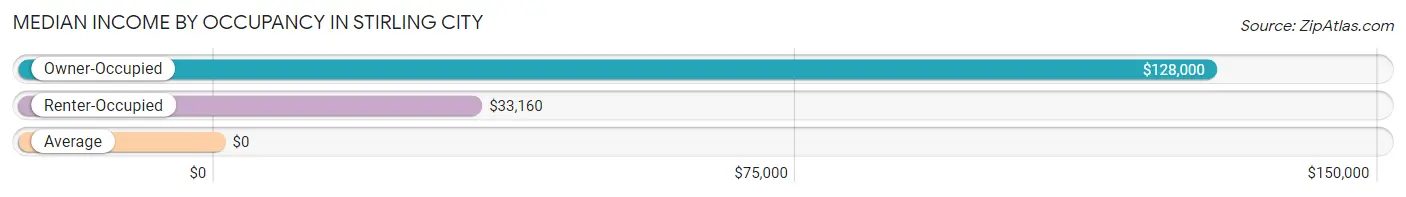
| Occupancy Type | # Households | Median Income |
| Owner-Occupied | 120 (60.9%) | $128,000 |
| Renter-Occupied | 77 (39.1%) | $33,160 |
| Average | 197 (100.0%) | $0 |
Occupancy by Householder Income Bracket in Stirling City
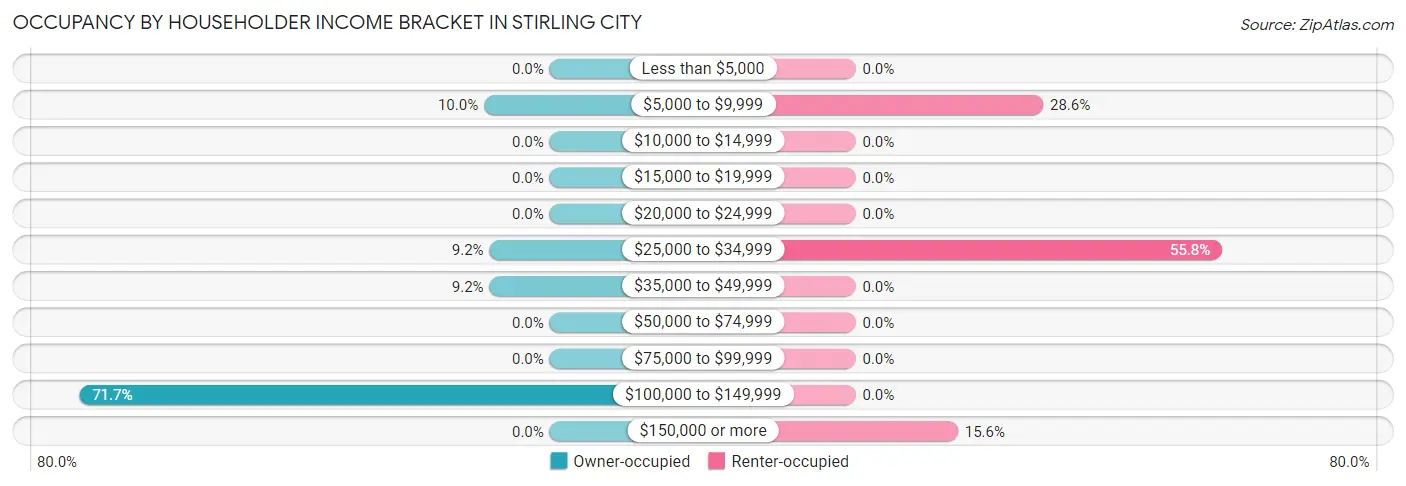
| Income Bracket | Owner-occupied | Renter-occupied |
| Less than $5,000 | 0 (0.0%) | 0 (0.0%) |
| $5,000 to $9,999 | 12 (10.0%) | 22 (28.6%) |
| $10,000 to $14,999 | 0 (0.0%) | 0 (0.0%) |
| $15,000 to $19,999 | 0 (0.0%) | 0 (0.0%) |
| $20,000 to $24,999 | 0 (0.0%) | 0 (0.0%) |
| $25,000 to $34,999 | 11 (9.2%) | 43 (55.8%) |
| $35,000 to $49,999 | 11 (9.2%) | 0 (0.0%) |
| $50,000 to $74,999 | 0 (0.0%) | 0 (0.0%) |
| $75,000 to $99,999 | 0 (0.0%) | 0 (0.0%) |
| $100,000 to $149,999 | 86 (71.7%) | 0 (0.0%) |
| $150,000 or more | 0 (0.0%) | 12 (15.6%) |
| Total | 120 (100.0%) | 77 (100.0%) |
Monthly Housing Cost Tiers in Stirling City
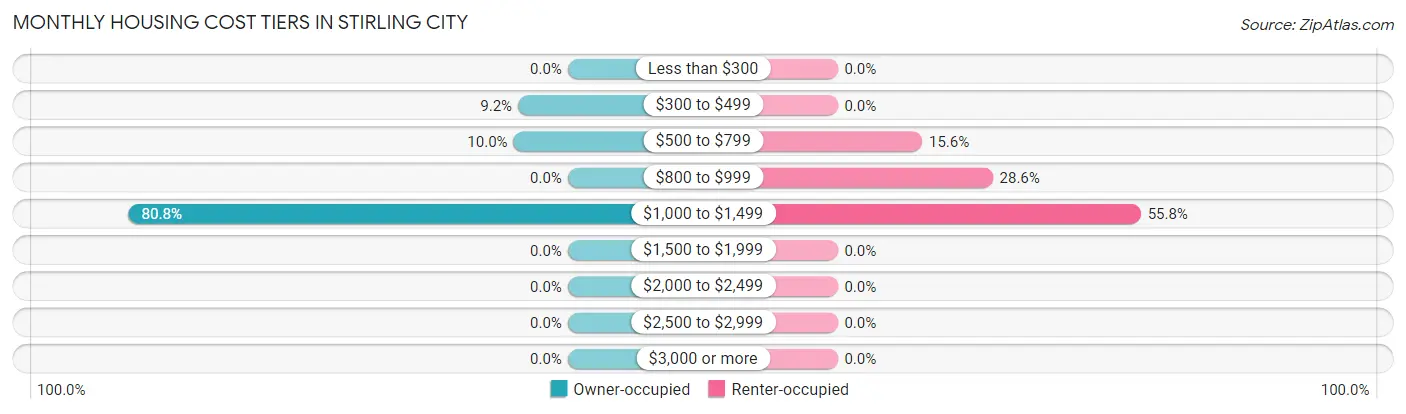
| Monthly Cost | Owner-occupied | Renter-occupied |
| Less than $300 | 0 (0.0%) | 0 (0.0%) |
| $300 to $499 | 11 (9.2%) | 0 (0.0%) |
| $500 to $799 | 12 (10.0%) | 12 (15.6%) |
| $800 to $999 | 0 (0.0%) | 22 (28.6%) |
| $1,000 to $1,499 | 97 (80.8%) | 43 (55.8%) |
| $1,500 to $1,999 | 0 (0.0%) | 0 (0.0%) |
| $2,000 to $2,499 | 0 (0.0%) | 0 (0.0%) |
| $2,500 to $2,999 | 0 (0.0%) | 0 (0.0%) |
| $3,000 or more | 0 (0.0%) | 0 (0.0%) |
| Total | 120 (100.0%) | 77 (100.0%) |
Physical Housing Characteristics in Stirling City
Housing Structures in Stirling City
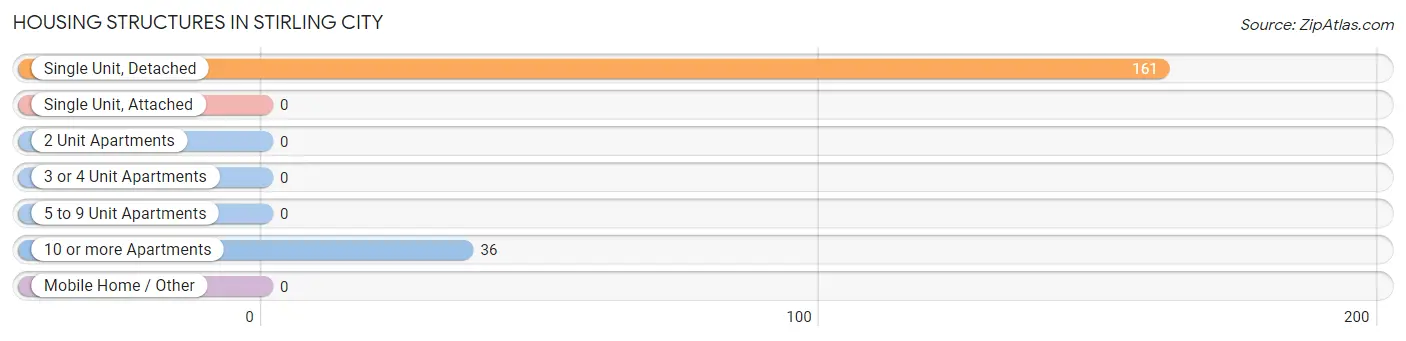
| Structure Type | # Housing Units | % Housing Units |
| Single Unit, Detached | 161 | 81.7% |
| Single Unit, Attached | 0 | 0.0% |
| 2 Unit Apartments | 0 | 0.0% |
| 3 or 4 Unit Apartments | 0 | 0.0% |
| 5 to 9 Unit Apartments | 0 | 0.0% |
| 10 or more Apartments | 36 | 18.3% |
| Mobile Home / Other | 0 | 0.0% |
| Total | 197 | 100.0% |
Housing Structures by Occupancy in Stirling City
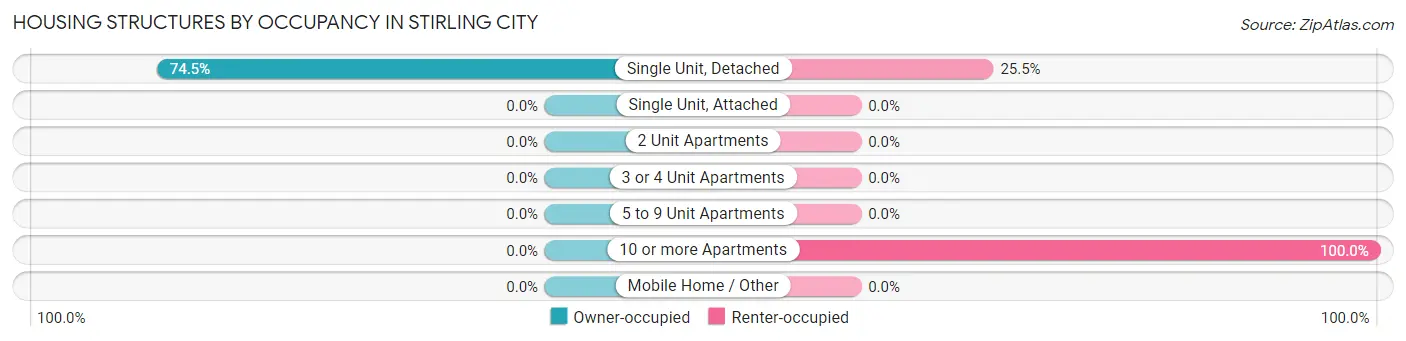
| Structure Type | Owner-occupied | Renter-occupied |
| Single Unit, Detached | 120 (74.5%) | 41 (25.5%) |
| Single Unit, Attached | 0 (0.0%) | 0 (0.0%) |
| 2 Unit Apartments | 0 (0.0%) | 0 (0.0%) |
| 3 or 4 Unit Apartments | 0 (0.0%) | 0 (0.0%) |
| 5 to 9 Unit Apartments | 0 (0.0%) | 0 (0.0%) |
| 10 or more Apartments | 0 (0.0%) | 36 (100.0%) |
| Mobile Home / Other | 0 (0.0%) | 0 (0.0%) |
| Total | 120 (60.9%) | 77 (39.1%) |
Housing Structures by Number of Rooms in Stirling City
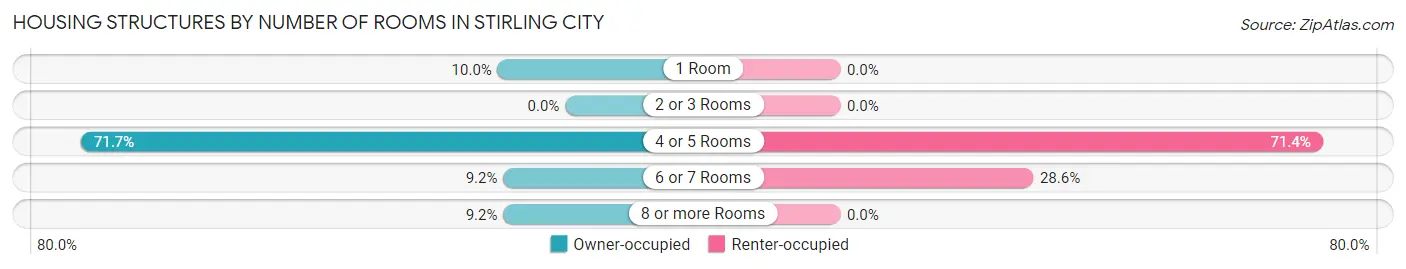
| Number of Rooms | Owner-occupied | Renter-occupied |
| 1 Room | 12 (10.0%) | 0 (0.0%) |
| 2 or 3 Rooms | 0 (0.0%) | 0 (0.0%) |
| 4 or 5 Rooms | 86 (71.7%) | 55 (71.4%) |
| 6 or 7 Rooms | 11 (9.2%) | 22 (28.6%) |
| 8 or more Rooms | 11 (9.2%) | 0 (0.0%) |
| Total | 120 (100.0%) | 77 (100.0%) |
Housing Structure by Heating Type in Stirling City

| Heating Type | Owner-occupied | Renter-occupied |
| Utility Gas | 0 (0.0%) | 43 (55.8%) |
| Bottled, Tank, or LP Gas | 22 (18.3%) | 0 (0.0%) |
| Electricity | 0 (0.0%) | 0 (0.0%) |
| Fuel Oil or Kerosene | 11 (9.2%) | 0 (0.0%) |
| Coal or Coke | 0 (0.0%) | 0 (0.0%) |
| All other Fuels | 87 (72.5%) | 34 (44.2%) |
| No Fuel Used | 0 (0.0%) | 0 (0.0%) |
| Total | 120 (100.0%) | 77 (100.0%) |
Household Vehicle Usage in Stirling City
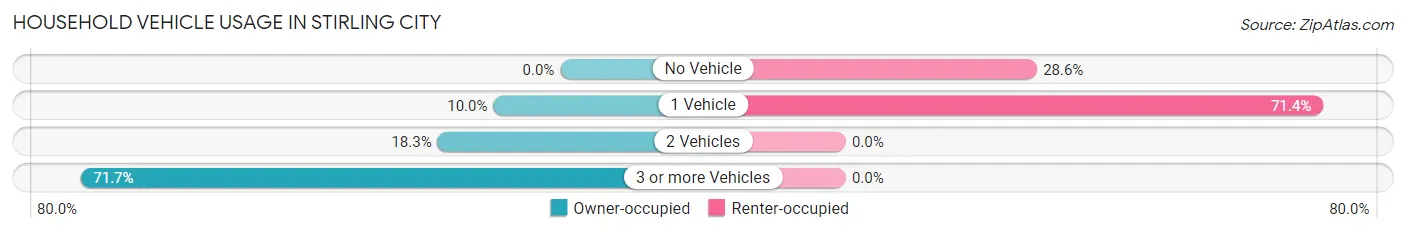
| Vehicles per Household | Owner-occupied | Renter-occupied |
| No Vehicle | 0 (0.0%) | 22 (28.6%) |
| 1 Vehicle | 12 (10.0%) | 55 (71.4%) |
| 2 Vehicles | 22 (18.3%) | 0 (0.0%) |
| 3 or more Vehicles | 86 (71.7%) | 0 (0.0%) |
| Total | 120 (100.0%) | 77 (100.0%) |
Real Estate & Mortgages in Stirling City
Real Estate and Mortgage Overview in Stirling City
| Characteristic | Without Mortgage | With Mortgage |
| Housing Units | 34 | 86 |
| Median Property Value | $272,700 | $0 |
| Median Household Income | - | - |
| Monthly Housing Costs | $750 | $0 |
| Real Estate Taxes | - | - |
Property Value by Mortgage Status in Stirling City
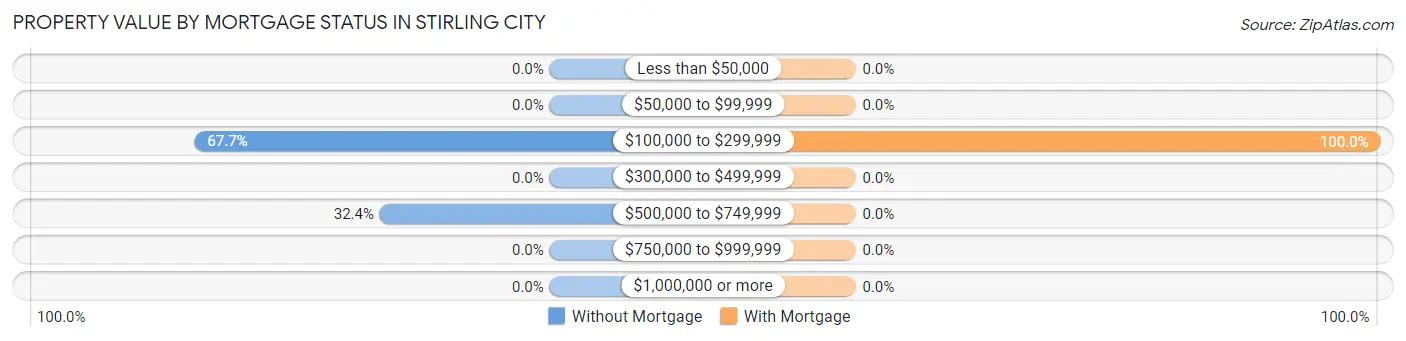
| Property Value | Without Mortgage | With Mortgage |
| Less than $50,000 | 0 (0.0%) | 0 (0.0%) |
| $50,000 to $99,999 | 0 (0.0%) | 0 (0.0%) |
| $100,000 to $299,999 | 23 (67.6%) | 86 (100.0%) |
| $300,000 to $499,999 | 0 (0.0%) | 0 (0.0%) |
| $500,000 to $749,999 | 11 (32.4%) | 0 (0.0%) |
| $750,000 to $999,999 | 0 (0.0%) | 0 (0.0%) |
| $1,000,000 or more | 0 (0.0%) | 0 (0.0%) |
| Total | 34 (100.0%) | 86 (100.0%) |
Household Income by Mortgage Status in Stirling City
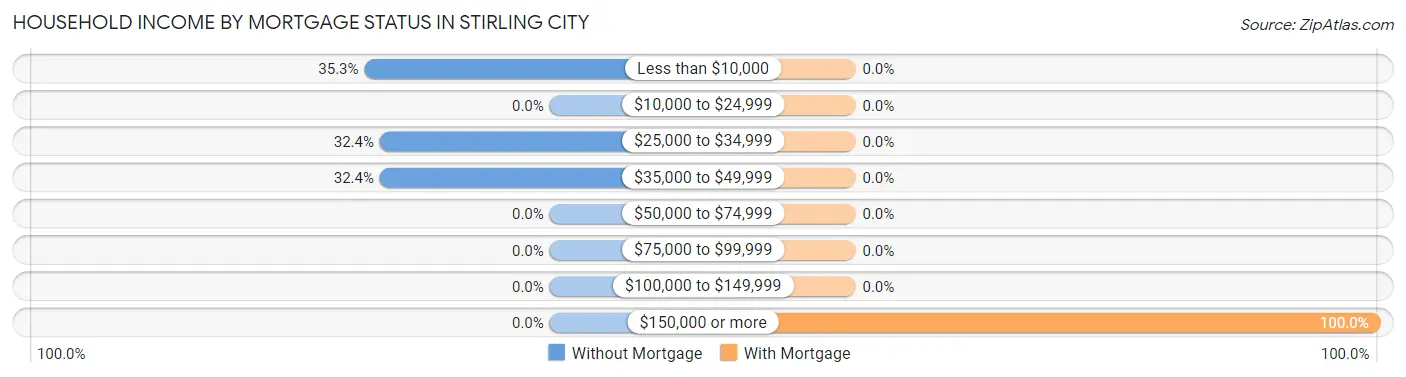
| Household Income | Without Mortgage | With Mortgage |
| Less than $10,000 | 12 (35.3%) | 0 (0.0%) |
| $10,000 to $24,999 | 0 (0.0%) | 0 (0.0%) |
| $25,000 to $34,999 | 11 (32.4%) | 0 (0.0%) |
| $35,000 to $49,999 | 11 (32.4%) | 0 (0.0%) |
| $50,000 to $74,999 | 0 (0.0%) | 0 (0.0%) |
| $75,000 to $99,999 | 0 (0.0%) | 0 (0.0%) |
| $100,000 to $149,999 | 0 (0.0%) | 0 (0.0%) |
| $150,000 or more | 0 (0.0%) | 86 (100.0%) |
| Total | 34 (100.0%) | 86 (100.0%) |
Property Value to Household Income Ratio in Stirling City
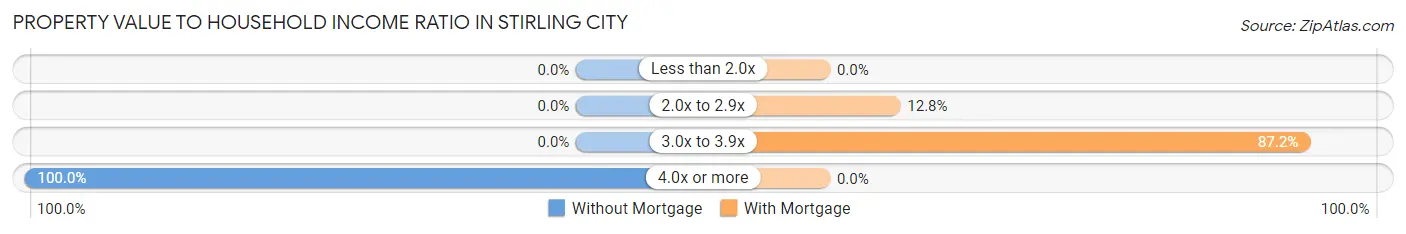
| Value-to-Income Ratio | Without Mortgage | With Mortgage |
| Less than 2.0x | 0 (0.0%) | 0 (0.0%) |
| 2.0x to 2.9x | 0 (0.0%) | 11 (12.8%) |
| 3.0x to 3.9x | 0 (0.0%) | 75 (87.2%) |
| 4.0x or more | 34 (100.0%) | 0 (0.0%) |
| Total | 34 (100.0%) | 86 (100.0%) |
Real Estate Taxes by Mortgage Status in Stirling City
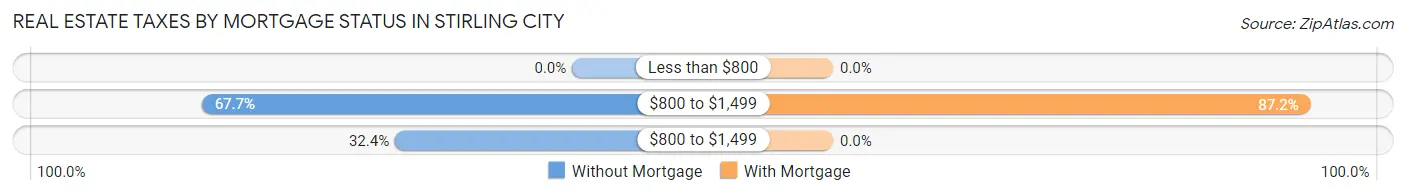
| Property Taxes | Without Mortgage | With Mortgage |
| Less than $800 | 0 (0.0%) | 0 (0.0%) |
| $800 to $1,499 | 23 (67.6%) | 75 (87.2%) |
| $800 to $1,499 | 11 (32.4%) | 0 (0.0%) |
| Total | 34 (100.0%) | 86 (100.0%) |
Health & Disability in Stirling City
Health Insurance Coverage by Age in Stirling City
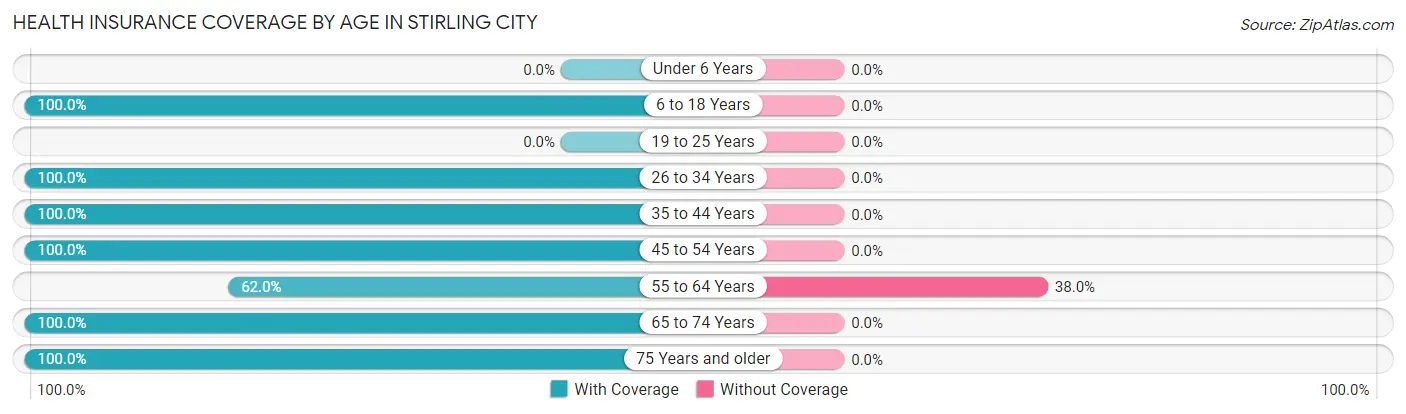
| Age Bracket | With Coverage | Without Coverage |
| Under 6 Years | 0 (0.0%) | 0 (0.0%) |
| 6 to 18 Years | 137 (100.0%) | 0 (0.0%) |
| 19 to 25 Years | 0 (0.0%) | 0 (0.0%) |
| 26 to 34 Years | 12 (100.0%) | 0 (0.0%) |
| 35 to 44 Years | 63 (100.0%) | 0 (0.0%) |
| 45 to 54 Years | 36 (100.0%) | 0 (0.0%) |
| 55 to 64 Years | 116 (62.0%) | 71 (38.0%) |
| 65 to 74 Years | 33 (100.0%) | 0 (0.0%) |
| 75 Years and older | 33 (100.0%) | 0 (0.0%) |
| Total | 430 (85.8%) | 71 (14.2%) |
Health Insurance Coverage by Citizenship Status in Stirling City
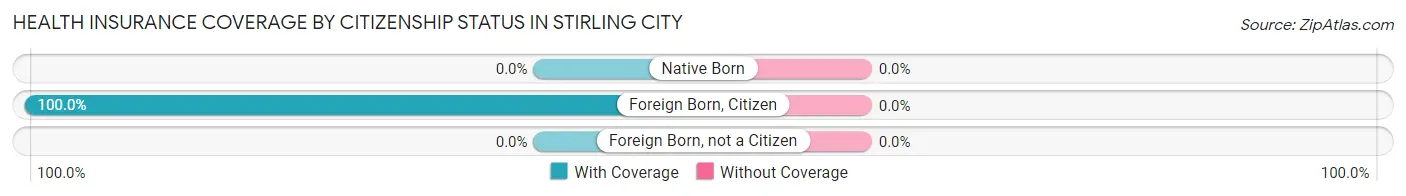
| Citizenship Status | With Coverage | Without Coverage |
| Native Born | 0 (0.0%) | 0 (0.0%) |
| Foreign Born, Citizen | 137 (100.0%) | 0 (0.0%) |
| Foreign Born, not a Citizen | 0 (0.0%) | 0 (0.0%) |
Health Insurance Coverage by Household Income in Stirling City
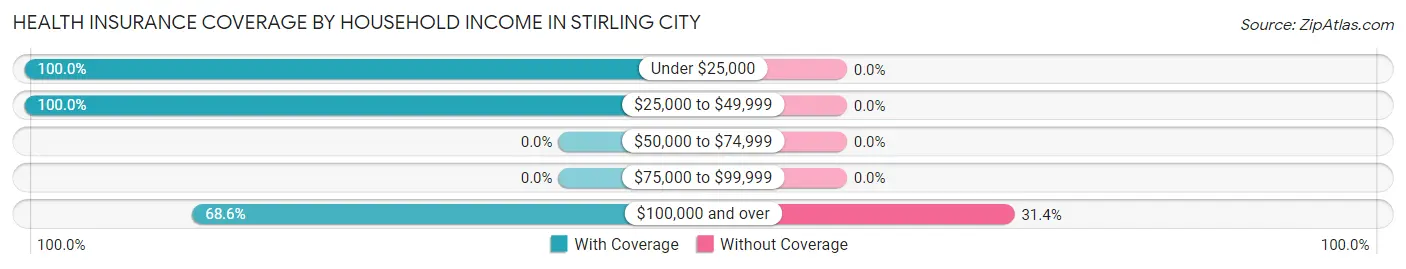
| Household Income | With Coverage | Without Coverage |
| Under $25,000 | 34 (100.0%) | 0 (0.0%) |
| $25,000 to $49,999 | 241 (100.0%) | 0 (0.0%) |
| $50,000 to $74,999 | 0 (0.0%) | 0 (0.0%) |
| $75,000 to $99,999 | 0 (0.0%) | 0 (0.0%) |
| $100,000 and over | 155 (68.6%) | 71 (31.4%) |
Public vs Private Health Insurance Coverage by Age in Stirling City
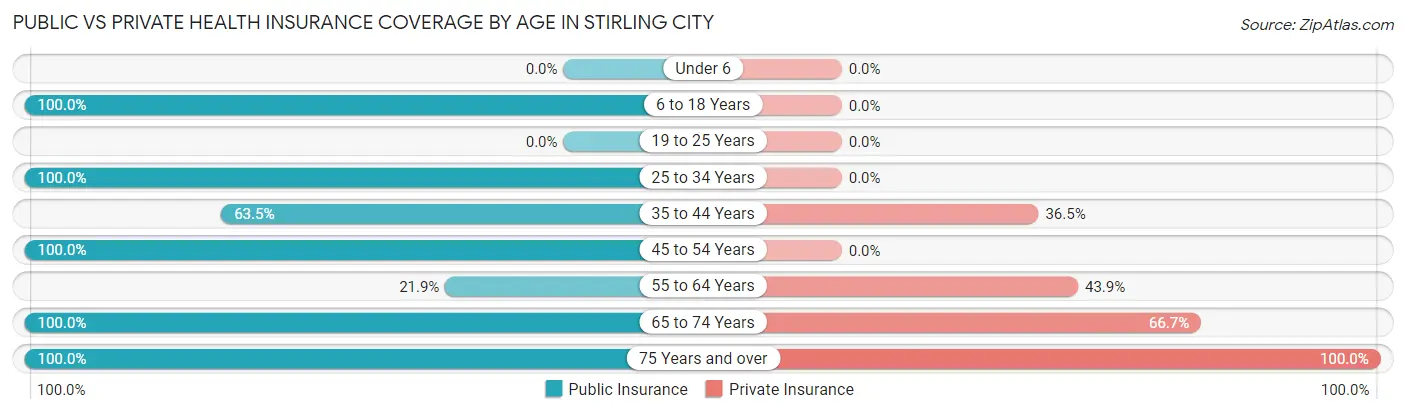
| Age Bracket | Public Insurance | Private Insurance |
| Under 6 | 0 (0.0%) | 0 (0.0%) |
| 6 to 18 Years | 137 (100.0%) | 0 (0.0%) |
| 19 to 25 Years | 0 (0.0%) | 0 (0.0%) |
| 25 to 34 Years | 12 (100.0%) | 0 (0.0%) |
| 35 to 44 Years | 40 (63.5%) | 23 (36.5%) |
| 45 to 54 Years | 36 (100.0%) | 0 (0.0%) |
| 55 to 64 Years | 41 (21.9%) | 82 (43.9%) |
| 65 to 74 Years | 33 (100.0%) | 22 (66.7%) |
| 75 Years and over | 33 (100.0%) | 33 (100.0%) |
| Total | 332 (66.3%) | 160 (31.9%) |
Disability Status by Sex by Age in Stirling City
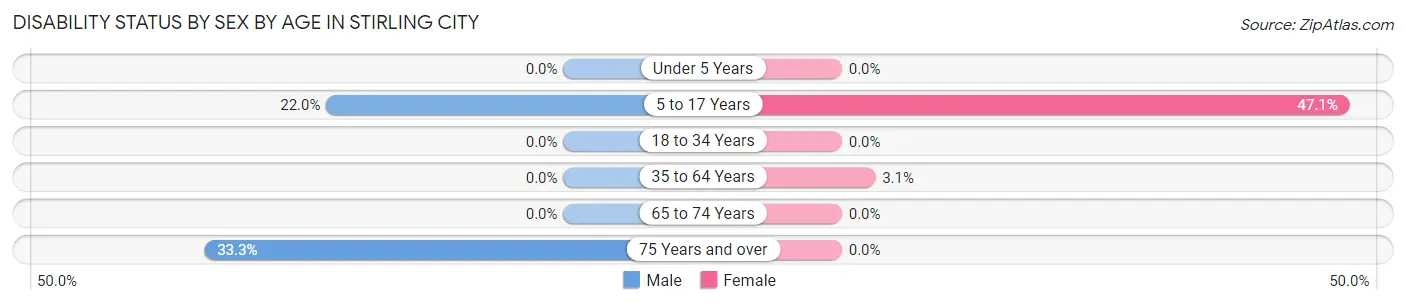
| Age Bracket | Male | Female |
| Under 5 Years | 0 (0.0%) | 0 (0.0%) |
| 5 to 17 Years | 11 (22.0%) | 41 (47.1%) |
| 18 to 34 Years | 0 (0.0%) | 0 (0.0%) |
| 35 to 64 Years | 0 (0.0%) | 7 (3.1%) |
| 65 to 74 Years | 0 (0.0%) | 0 (0.0%) |
| 75 Years and over | 11 (33.3%) | 0 (0.0%) |
Disability Class by Sex by Age in Stirling City
Disability Class: Hearing Difficulty
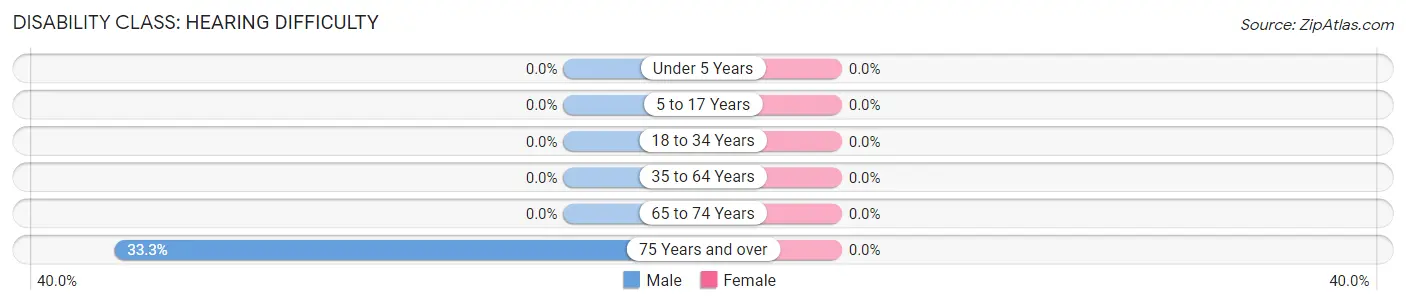
| Age Bracket | Male | Female |
| Under 5 Years | 0 (0.0%) | 0 (0.0%) |
| 5 to 17 Years | 0 (0.0%) | 0 (0.0%) |
| 18 to 34 Years | 0 (0.0%) | 0 (0.0%) |
| 35 to 64 Years | 0 (0.0%) | 0 (0.0%) |
| 65 to 74 Years | 0 (0.0%) | 0 (0.0%) |
| 75 Years and over | 11 (33.3%) | 0 (0.0%) |
Disability Class: Vision Difficulty
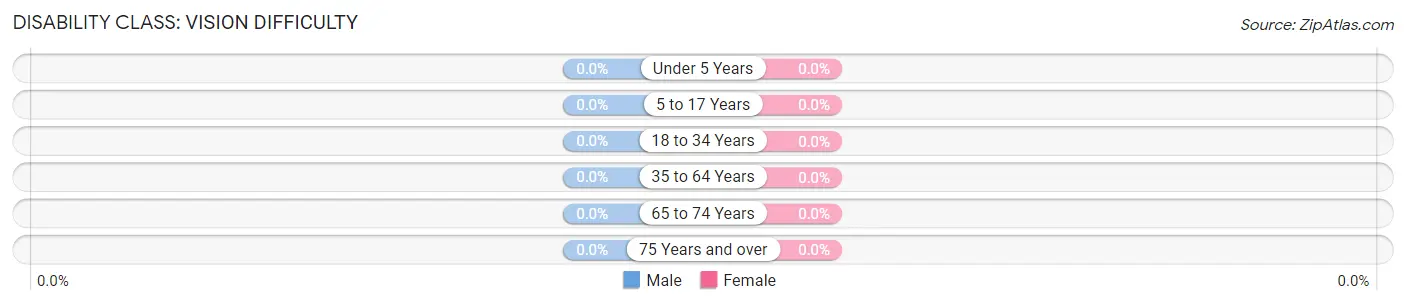
| Age Bracket | Male | Female |
| Under 5 Years | 0 (0.0%) | 0 (0.0%) |
| 5 to 17 Years | 0 (0.0%) | 0 (0.0%) |
| 18 to 34 Years | 0 (0.0%) | 0 (0.0%) |
| 35 to 64 Years | 0 (0.0%) | 0 (0.0%) |
| 65 to 74 Years | 0 (0.0%) | 0 (0.0%) |
| 75 Years and over | 0 (0.0%) | 0 (0.0%) |
Disability Class: Cognitive Difficulty
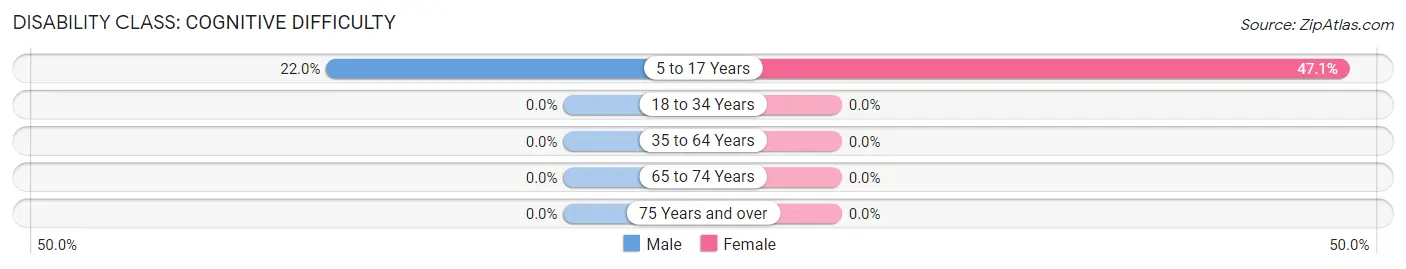
| Age Bracket | Male | Female |
| 5 to 17 Years | 11 (22.0%) | 41 (47.1%) |
| 18 to 34 Years | 0 (0.0%) | 0 (0.0%) |
| 35 to 64 Years | 0 (0.0%) | 0 (0.0%) |
| 65 to 74 Years | 0 (0.0%) | 0 (0.0%) |
| 75 Years and over | 0 (0.0%) | 0 (0.0%) |
Disability Class: Ambulatory Difficulty
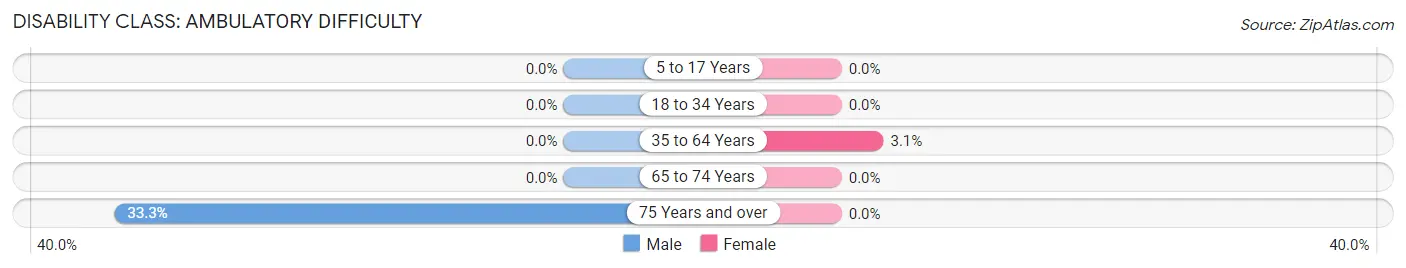
| Age Bracket | Male | Female |
| 5 to 17 Years | 0 (0.0%) | 0 (0.0%) |
| 18 to 34 Years | 0 (0.0%) | 0 (0.0%) |
| 35 to 64 Years | 0 (0.0%) | 7 (3.1%) |
| 65 to 74 Years | 0 (0.0%) | 0 (0.0%) |
| 75 Years and over | 11 (33.3%) | 0 (0.0%) |
Disability Class: Self-Care Difficulty
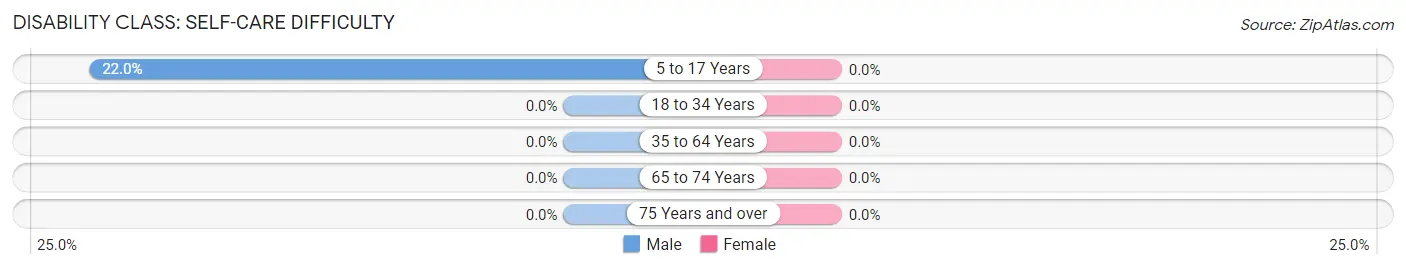
| Age Bracket | Male | Female |
| 5 to 17 Years | 11 (22.0%) | 0 (0.0%) |
| 18 to 34 Years | 0 (0.0%) | 0 (0.0%) |
| 35 to 64 Years | 0 (0.0%) | 0 (0.0%) |
| 65 to 74 Years | 0 (0.0%) | 0 (0.0%) |
| 75 Years and over | 0 (0.0%) | 0 (0.0%) |
Technology Access in Stirling City
Computing Device Access in Stirling City
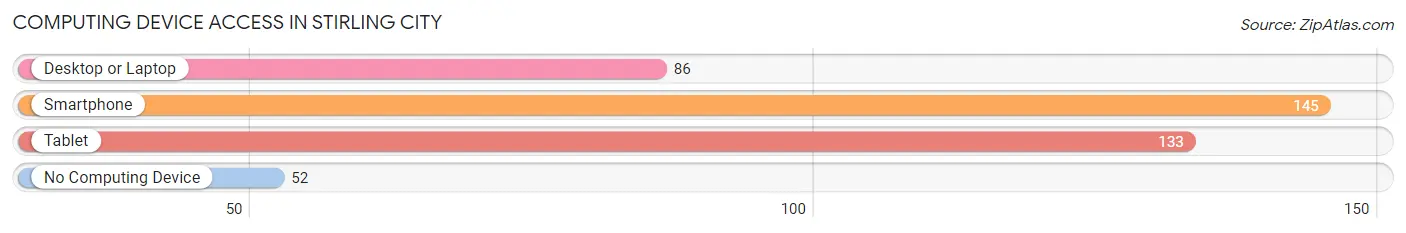
| Device Type | # Households | % Households |
| Desktop or Laptop | 86 | 43.6% |
| Smartphone | 145 | 73.6% |
| Tablet | 133 | 67.5% |
| No Computing Device | 52 | 26.4% |
| Total | 197 | 100.0% |
Internet Access in Stirling City
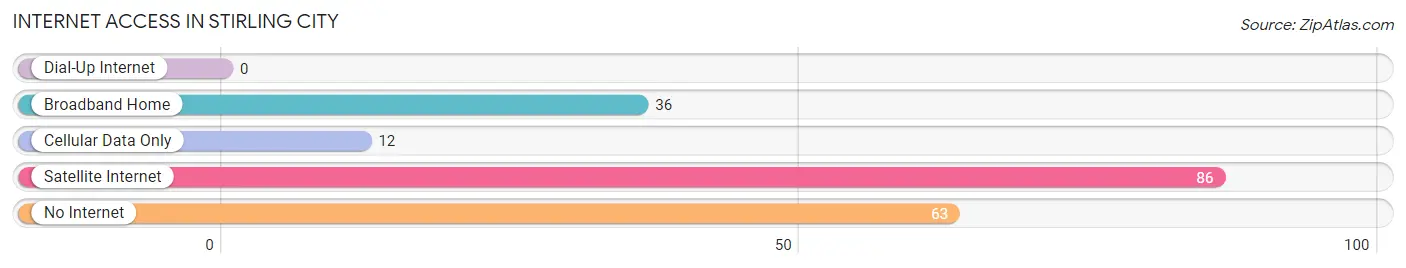
| Internet Type | # Households | % Households |
| Dial-Up Internet | 0 | 0.0% |
| Broadband Home | 36 | 18.3% |
| Cellular Data Only | 12 | 6.1% |
| Satellite Internet | 86 | 43.6% |
| No Internet | 63 | 32.0% |
| Total | 197 | 100.0% |
Stirling City Summary
Stirling City is a small unincorporated community located in Butte County, California. It is situated in the foothills of the Sierra Nevada Mountains, approximately 10 miles east of Chico. The population of Stirling City was estimated to be 1,092 in 2019.
History
Stirling City was founded in 1877 by William Stirling, a Scottish immigrant who had come to California in search of gold. He purchased a large tract of land in the foothills of the Sierra Nevada Mountains and began to develop the area. Stirling built a sawmill and a hotel, and the town quickly grew. By the early 1900s, Stirling City had become a thriving community with a population of over 1,000 people.
The town was home to a variety of businesses, including a general store, a blacksmith shop, a livery stable, a saloon, and a post office. The town also had a school, a church, and a cemetery.
In the early 1900s, Stirling City was a popular destination for tourists. The town was known for its beautiful scenery and its proximity to the Feather River.
Geography
Stirling City is located in the foothills of the Sierra Nevada Mountains, approximately 10 miles east of Chico. The town is situated at an elevation of 1,890 feet above sea level. The area is characterized by rolling hills and open meadows.
The climate in Stirling City is mild and temperate. The average high temperature in the summer is around 85 degrees Fahrenheit, and the average low temperature in the winter is around 40 degrees Fahrenheit.
Economy
Stirling City is a small, rural community with a limited economy. The town is home to a few small businesses, including a general store, a gas station, and a restaurant. The town also has a post office and a library.
The town is also home to a number of small farms and ranches. The area is known for its production of walnuts, almonds, and other tree nuts.
Demographics
The population of Stirling City was estimated to be 1,092 in 2019. The town is predominantly white, with a small Hispanic population. The median household income in Stirling City is $45,000, and the median home value is $250,000.
Conclusion
Stirling City is a small, rural community located in the foothills of the Sierra Nevada Mountains. The town has a long history, and it is known for its beautiful scenery and its proximity to the Feather River. The town has a limited economy, and it is home to a few small businesses and farms. The population of Stirling City was estimated to be 1,092 in 2019, and the town is predominantly white, with a small Hispanic population.
Common Questions
What is Per Capita Income in Stirling City?
Per Capita income in Stirling City is $30,606.
What is Income or Wage Gap in Stirling City?
Income or Wage Gap in Stirling City is 32.2%.
Women in Stirling City earn 67.8 cents for every dollar earned by a man.
What is Inequality or Gini Index in Stirling City?
Inequality or Gini Index in Stirling City is 0.37.
What is the Total Population of Stirling City?
Total Population of Stirling City is 501.
What is the Total Male Population of Stirling City?
Total Male Population of Stirling City is 166.
What is the Total Female Population of Stirling City?
Total Female Population of Stirling City is 335.
What is the Ratio of Males per 100 Females in Stirling City?
There are 49.55 Males per 100 Females in Stirling City.
What is the Ratio of Females per 100 Males in Stirling City?
There are 201.81 Females per 100 Males in Stirling City.
What is the Median Population Age in Stirling City?
Median Population Age in Stirling City is 56.1 Years.
What is the Average Family Size in Stirling City
Average Family Size in Stirling City is 2.8 People.
What is the Average Household Size in Stirling City
Average Household Size in Stirling City is 2.5 People.
How Large is the Labor Force in Stirling City?
There are 224 People in the Labor Forcein in Stirling City.
What is the Percentage of People in the Labor Force in Stirling City?
55.6% of People are in the Labor Force in Stirling City.
What is the Unemployment Rate in Stirling City?
Unemployment Rate in Stirling City is 8.0%.