Bass Lake, CA Map & Demographics
Bass Lake Map
Bass Lake Overview
$69,702
PER CAPITA INCOME
$145,833
AVG FAMILY INCOME
$145,083
AVG HOUSEHOLD INCOME
0.49
INEQUALITY / GINI INDEX
318
TOTAL POPULATION
202
MALE POPULATION
116
FEMALE POPULATION
174.14
MALES / 100 FEMALES
57.43
FEMALES / 100 MALES
64.5
MEDIAN AGE
2.4
AVG FAMILY SIZE
2.3
AVG HOUSEHOLD SIZE
111
LABOR FORCE [ PEOPLE ]
38.8%
PERCENT IN LABOR FORCE
Bass Lake Zip Codes
Bass Lake Area Codes
Income in Bass Lake
Income Overview in Bass Lake
Per Capita Income in Bass Lake is $69,702, while median incomes of families and households are $145,833 and $145,083 respectively.
| Characteristic | Number | Measure |
| Per Capita Income | 318 | $69,702 |
| Median Family Income | 130 | $145,833 |
| Mean Family Income | 130 | $180,772 |
| Median Household Income | 139 | $145,083 |
| Mean Household Income | 139 | $175,340 |
| Income Deficit | 130 | $0 |
| Wage / Income Gap (%) | 318 | 0.00% |
| Wage / Income Gap ($) | 318 | 100.00¢ per $1 |
| Gini / Inequality Index | 318 | 0.49 |
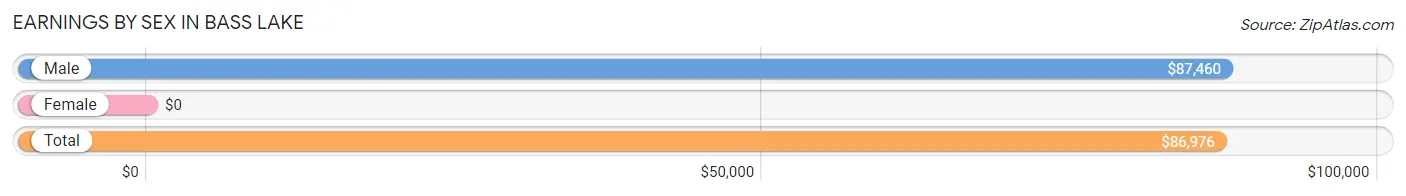
Earnings by Sex in Bass Lake
| Sex | Number | Average Earnings |
| Male | 99 (89.2%) | $87,460 |
| Female | 12 (10.8%) | $0 |
| Total | 111 (100.0%) | $86,976 |
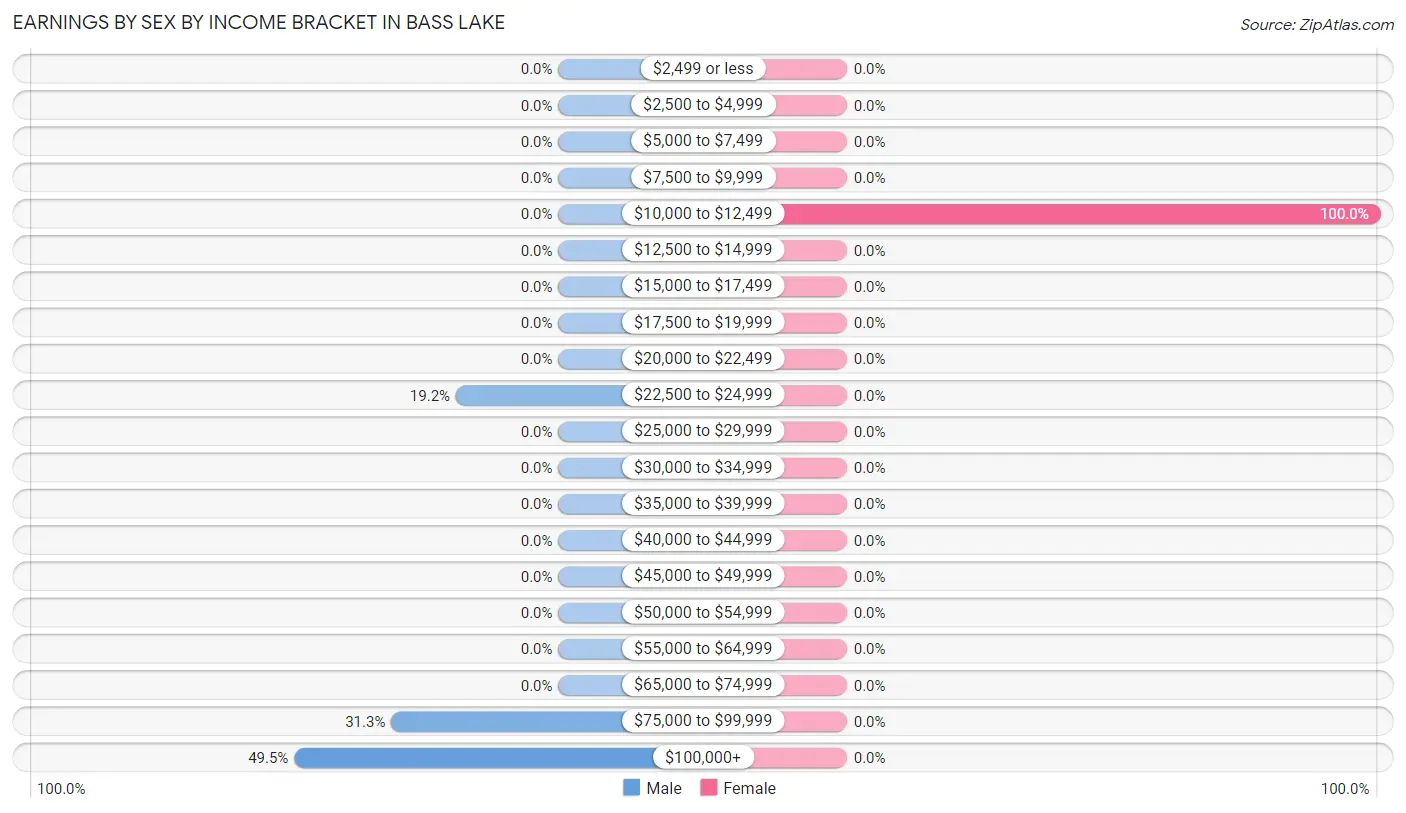
Earnings by Sex by Income Bracket in Bass Lake
The most common earnings brackets in Bass Lake are $100,000+ for men (49 | 49.5%) and $10,000 to $12,499 for women (12 | 100.0%).
| Income | Male | Female |
| $2,499 or less | 0 (0.0%) | 0 (0.0%) |
| $2,500 to $4,999 | 0 (0.0%) | 0 (0.0%) |
| $5,000 to $7,499 | 0 (0.0%) | 0 (0.0%) |
| $7,500 to $9,999 | 0 (0.0%) | 0 (0.0%) |
| $10,000 to $12,499 | 0 (0.0%) | 12 (100.0%) |
| $12,500 to $14,999 | 0 (0.0%) | 0 (0.0%) |
| $15,000 to $17,499 | 0 (0.0%) | 0 (0.0%) |
| $17,500 to $19,999 | 0 (0.0%) | 0 (0.0%) |
| $20,000 to $22,499 | 0 (0.0%) | 0 (0.0%) |
| $22,500 to $24,999 | 19 (19.2%) | 0 (0.0%) |
| $25,000 to $29,999 | 0 (0.0%) | 0 (0.0%) |
| $30,000 to $34,999 | 0 (0.0%) | 0 (0.0%) |
| $35,000 to $39,999 | 0 (0.0%) | 0 (0.0%) |
| $40,000 to $44,999 | 0 (0.0%) | 0 (0.0%) |
| $45,000 to $49,999 | 0 (0.0%) | 0 (0.0%) |
| $50,000 to $54,999 | 0 (0.0%) | 0 (0.0%) |
| $55,000 to $64,999 | 0 (0.0%) | 0 (0.0%) |
| $65,000 to $74,999 | 0 (0.0%) | 0 (0.0%) |
| $75,000 to $99,999 | 31 (31.3%) | 0 (0.0%) |
| $100,000+ | 49 (49.5%) | 0 (0.0%) |
| Total | 99 (100.0%) | 12 (100.0%) |
Earnings by Sex by Educational Attainment in Bass Lake
| Educational Attainment | Male Income | Female Income |
| Less than High School | - | - |
| High School Diploma | - | - |
| College or Associate's Degree | - | - |
| Bachelor's Degree | - | - |
| Graduate Degree | - | - |
| Total | - | - |
Family Income in Bass Lake
Family Income Brackets in Bass Lake
According to the Bass Lake family income data, there are 31 families falling into the $200,000+ income range, which is the most common income bracket and makes up 23.8% of all families.
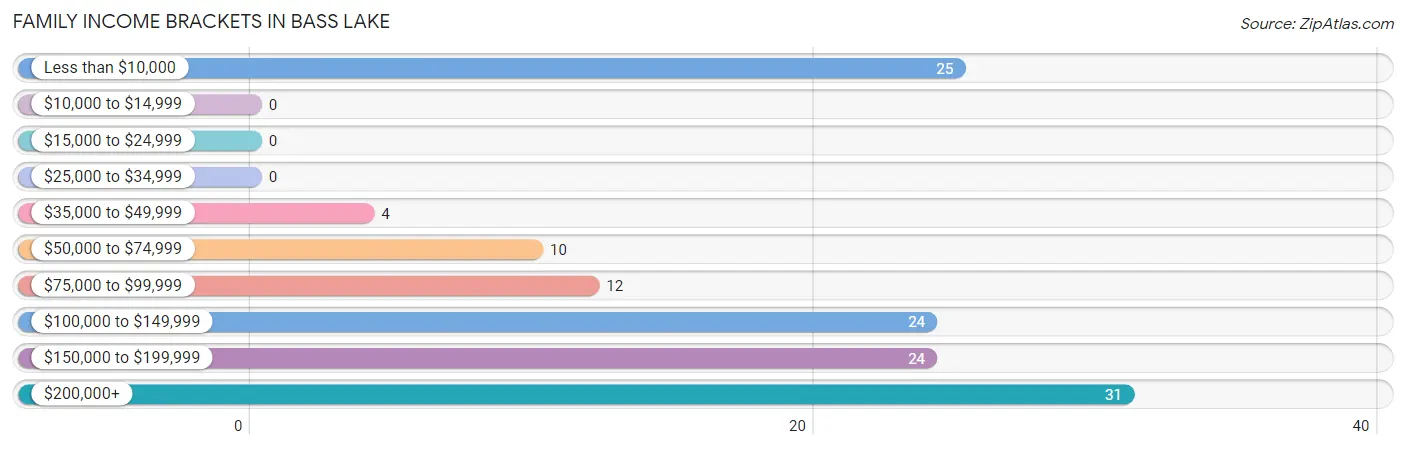
| Income Bracket | # Families | % Families |
| Less than $10,000 | 25 | 19.2% |
| $10,000 to $14,999 | 0 | 0.0% |
| $15,000 to $24,999 | 0 | 0.0% |
| $25,000 to $34,999 | 0 | 0.0% |
| $35,000 to $49,999 | 4 | 3.1% |
| $50,000 to $74,999 | 10 | 7.7% |
| $75,000 to $99,999 | 12 | 9.2% |
| $100,000 to $149,999 | 24 | 18.5% |
| $150,000 to $199,999 | 24 | 18.5% |
| $200,000+ | 31 | 23.8% |
Family Income by Famaliy Size in Bass Lake
2-person families (118 | 90.8%) account for the highest median family income in Bass Lake with $122,222 per family, while 2-person families (118 | 90.8%) have the highest median income of $61,111 per family member.
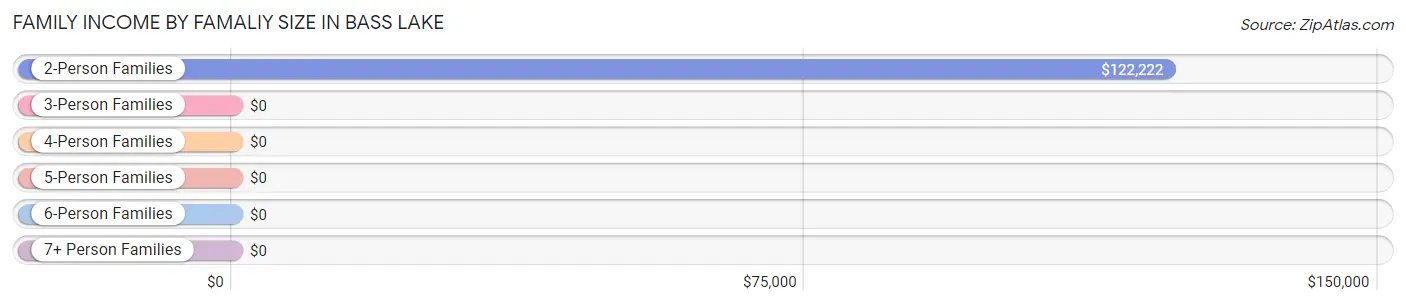
| Income Bracket | # Families | Median Income |
| 2-Person Families | 118 (90.8%) | $122,222 |
| 3-Person Families | 0 (0.0%) | $0 |
| 4-Person Families | 12 (9.2%) | $0 |
| 5-Person Families | 0 (0.0%) | $0 |
| 6-Person Families | 0 (0.0%) | $0 |
| 7+ Person Families | 0 (0.0%) | $0 |
| Total | 130 (100.0%) | $145,833 |
Family Income by Number of Earners in Bass Lake
| Number of Earners | # Families | Median Income |
| No Earners | 63 (48.5%) | $0 |
| 1 Earner | 24 (18.5%) | $0 |
| 2 Earners | 43 (33.1%) | $0 |
| 3+ Earners | 0 (0.0%) | $0 |
| Total | 130 (100.0%) | $145,833 |
Household Income in Bass Lake
Household Income Brackets in Bass Lake
With 31 households falling in the category, the $200,000+ income range is the most frequent in Bass Lake, accounting for 22.3% of all households.
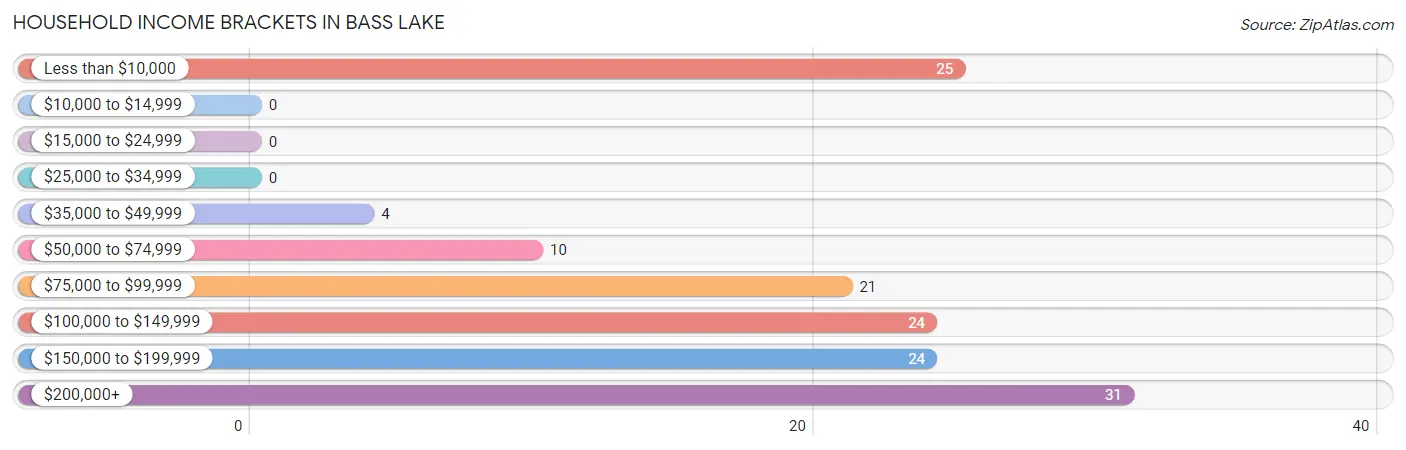
| Income Bracket | # Households | % Households |
| Less than $10,000 | 25 | 18.0% |
| $10,000 to $14,999 | 0 | 0.0% |
| $15,000 to $24,999 | 0 | 0.0% |
| $25,000 to $34,999 | 0 | 0.0% |
| $35,000 to $49,999 | 4 | 2.9% |
| $50,000 to $74,999 | 10 | 7.2% |
| $75,000 to $99,999 | 21 | 15.1% |
| $100,000 to $149,999 | 24 | 17.3% |
| $150,000 to $199,999 | 24 | 17.3% |
| $200,000+ | 31 | 22.3% |
Household Income by Householder Age in Bass Lake
The median household income in Bass Lake is $145,083, with the highest median household income of $81,875 found in the 65+ years age bracket for the primary householder. A total of 96 households (69.1%) fall into this category.
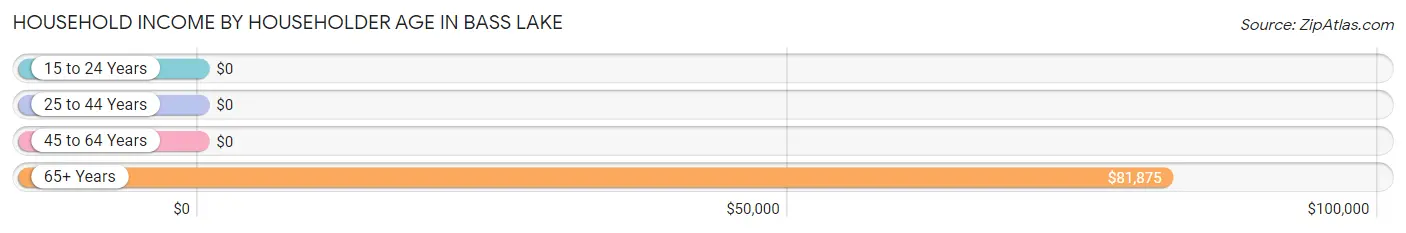
| Income Bracket | # Households | Median Income |
| 15 to 24 Years | 0 (0.0%) | $0 |
| 25 to 44 Years | 12 (8.6%) | $0 |
| 45 to 64 Years | 31 (22.3%) | $0 |
| 65+ Years | 96 (69.1%) | $81,875 |
| Total | 139 (100.0%) | $145,083 |
Poverty in Bass Lake
Income Below Poverty by Sex and Age in Bass Lake
With 19.8% poverty level for males and 21.5% for females among the residents of Bass Lake, 55 to 64 year old males and 75 year old and over females are the most vulnerable to poverty, with 40 males (100.0%) and 25 females (75.8%) in their respective age groups living below the poverty level.
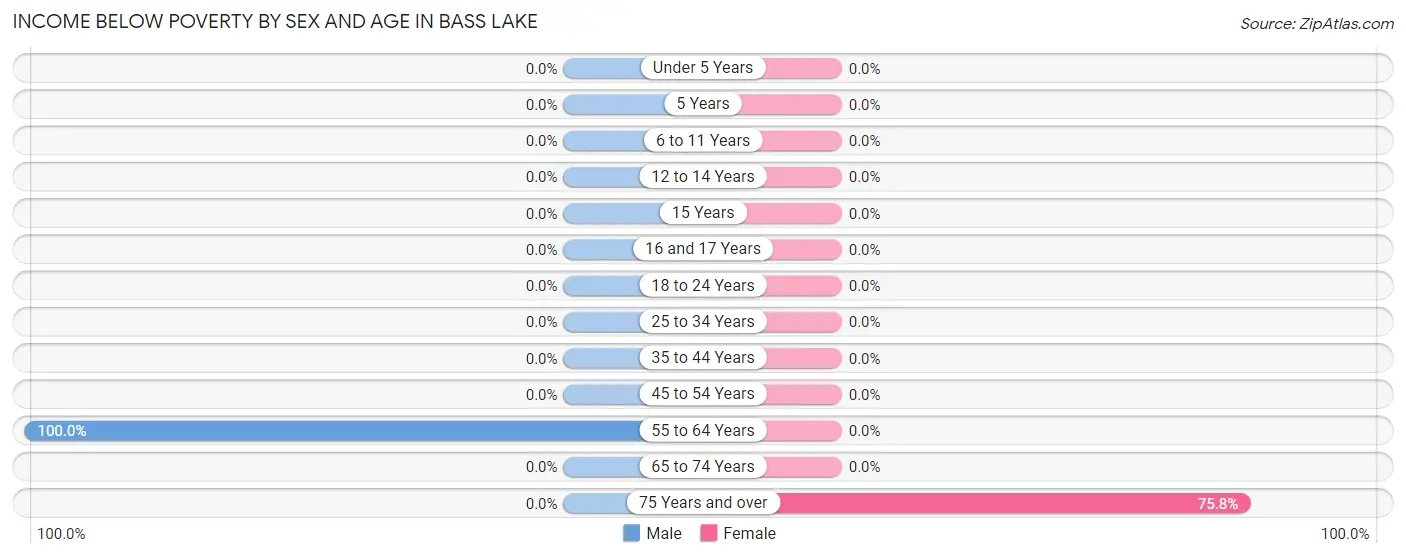
| Age Bracket | Male | Female |
| Under 5 Years | 0 (0.0%) | 0 (0.0%) |
| 5 Years | 0 (0.0%) | 0 (0.0%) |
| 6 to 11 Years | 0 (0.0%) | 0 (0.0%) |
| 12 to 14 Years | 0 (0.0%) | 0 (0.0%) |
| 15 Years | 0 (0.0%) | 0 (0.0%) |
| 16 and 17 Years | 0 (0.0%) | 0 (0.0%) |
| 18 to 24 Years | 0 (0.0%) | 0 (0.0%) |
| 25 to 34 Years | 0 (0.0%) | 0 (0.0%) |
| 35 to 44 Years | 0 (0.0%) | 0 (0.0%) |
| 45 to 54 Years | 0 (0.0%) | 0 (0.0%) |
| 55 to 64 Years | 40 (100.0%) | 0 (0.0%) |
| 65 to 74 Years | 0 (0.0%) | 0 (0.0%) |
| 75 Years and over | 0 (0.0%) | 25 (75.8%) |
| Total | 40 (19.8%) | 25 (21.5%) |
Income Above Poverty by Sex and Age in Bass Lake
According to the poverty statistics in Bass Lake, males aged 6 to 11 years and females aged 6 to 11 years are the age groups that are most secure financially, with 100.0% of males and 100.0% of females in these age groups living above the poverty line.
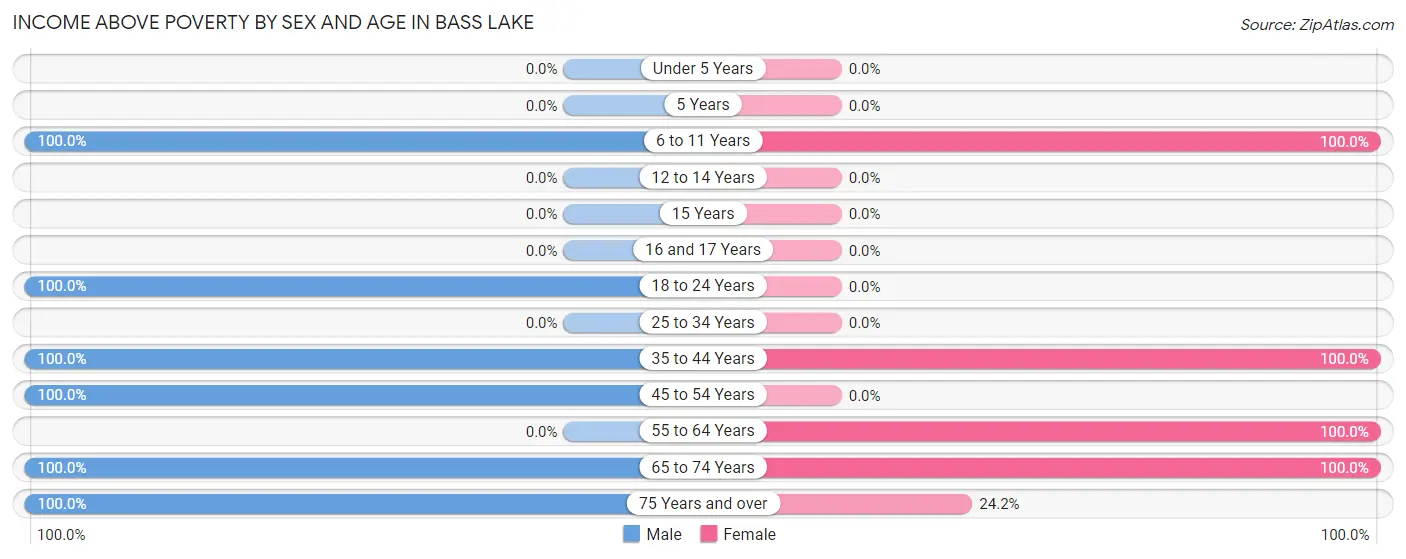
| Age Bracket | Male | Female |
| Under 5 Years | 0 (0.0%) | 0 (0.0%) |
| 5 Years | 0 (0.0%) | 0 (0.0%) |
| 6 to 11 Years | 13 (100.0%) | 19 (100.0%) |
| 12 to 14 Years | 0 (0.0%) | 0 (0.0%) |
| 15 Years | 0 (0.0%) | 0 (0.0%) |
| 16 and 17 Years | 0 (0.0%) | 0 (0.0%) |
| 18 to 24 Years | 19 (100.0%) | 0 (0.0%) |
| 25 to 34 Years | 0 (0.0%) | 0 (0.0%) |
| 35 to 44 Years | 12 (100.0%) | 14 (100.0%) |
| 45 to 54 Years | 56 (100.0%) | 0 (0.0%) |
| 55 to 64 Years | 0 (0.0%) | 6 (100.0%) |
| 65 to 74 Years | 41 (100.0%) | 44 (100.0%) |
| 75 Years and over | 21 (100.0%) | 8 (24.2%) |
| Total | 162 (80.2%) | 91 (78.4%) |
Income Below Poverty Among Married-Couple Families in Bass Lake
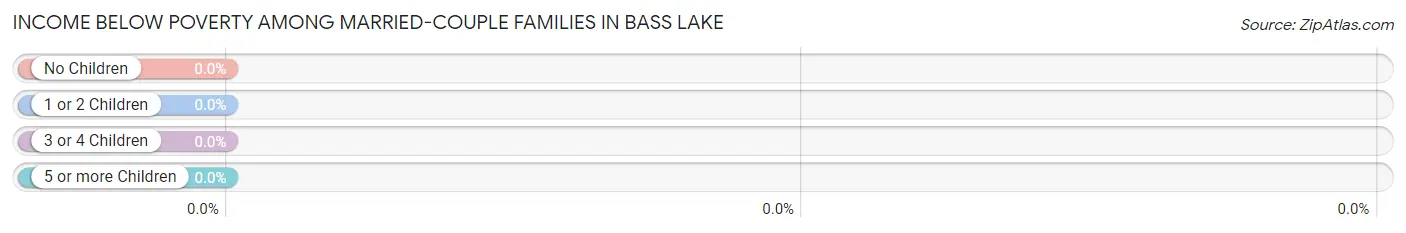
| Children | Above Poverty | Below Poverty |
| No Children | 81 (100.0%) | 0 (0.0%) |
| 1 or 2 Children | 12 (100.0%) | 0 (0.0%) |
| 3 or 4 Children | 0 (0.0%) | 0 (0.0%) |
| 5 or more Children | 0 (0.0%) | 0 (0.0%) |
| Total | 93 (100.0%) | 0 (0.0%) |
Income Below Poverty Among Single-Parent Households in Bass Lake
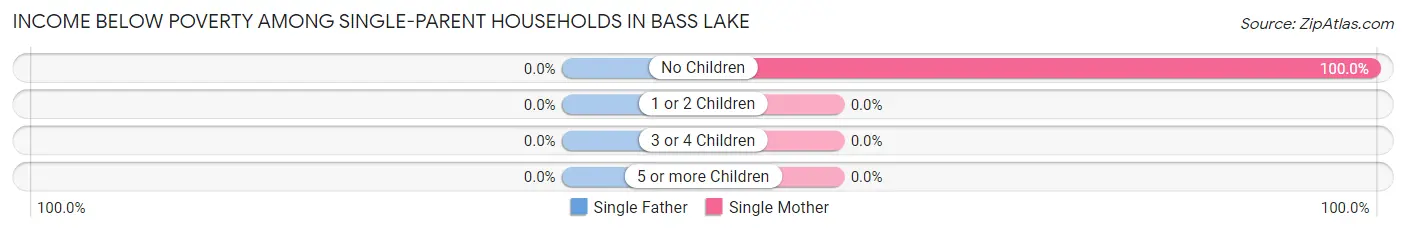
| Children | Single Father | Single Mother |
| No Children | 0 (0.0%) | 25 (100.0%) |
| 1 or 2 Children | 0 (0.0%) | 0 (0.0%) |
| 3 or 4 Children | 0 (0.0%) | 0 (0.0%) |
| 5 or more Children | 0 (0.0%) | 0 (0.0%) |
| Total | 0 (0.0%) | 25 (100.0%) |
Income Below Poverty Among Married-Couple vs Single-Parent Households in Bass Lake
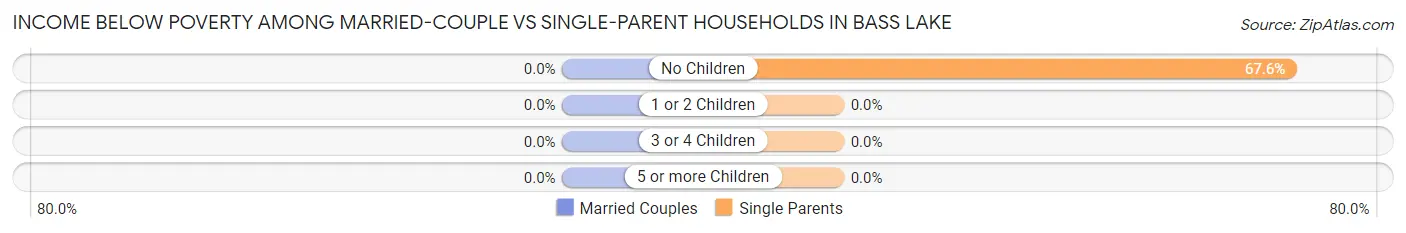
| Children | Married-Couple Families | Single-Parent Households |
| No Children | 0 (0.0%) | 25 (67.6%) |
| 1 or 2 Children | 0 (0.0%) | 0 (0.0%) |
| 3 or 4 Children | 0 (0.0%) | 0 (0.0%) |
| 5 or more Children | 0 (0.0%) | 0 (0.0%) |
| Total | 0 (0.0%) | 25 (67.6%) |
Race in Bass Lake
The most populous races in Bass Lake are White / Caucasian (295 | 92.8%), Hispanic or Latino (28 | 8.8%), and Native / Alaskan (14 | 4.4%).
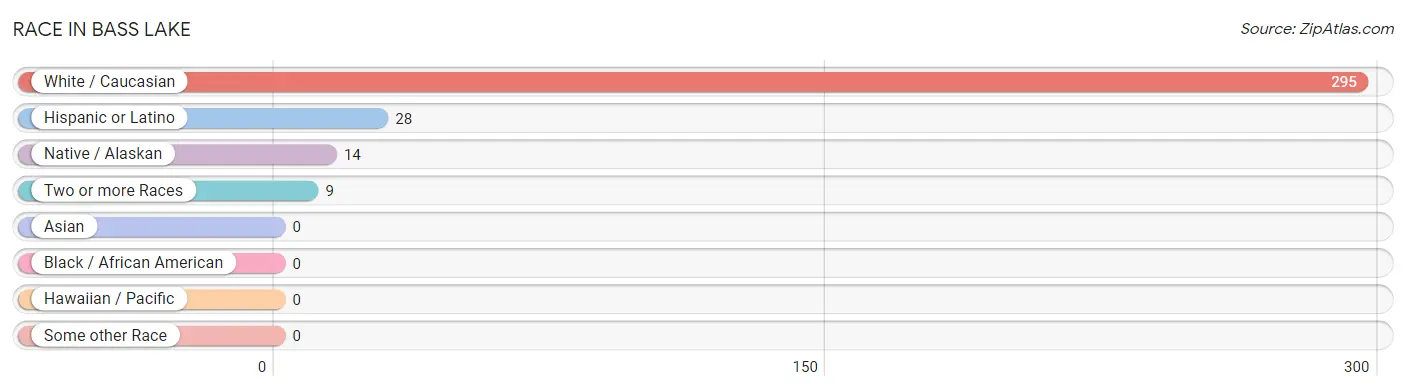
| Race | # Population | % Population |
| Asian | 0 | 0.0% |
| Black / African American | 0 | 0.0% |
| Hawaiian / Pacific | 0 | 0.0% |
| Hispanic or Latino | 28 | 8.8% |
| Native / Alaskan | 14 | 4.4% |
| White / Caucasian | 295 | 92.8% |
| Two or more Races | 9 | 2.8% |
| Some other Race | 0 | 0.0% |
| Total | 318 | 100.0% |
Ancestry in Bass Lake
The most populous ancestries reported in Bass Lake are German (68 | 21.4%), English (67 | 21.1%), European (31 | 9.8%), Irish (31 | 9.8%), and Polish (25 | 7.9%), together accounting for 69.8% of all Bass Lake residents.
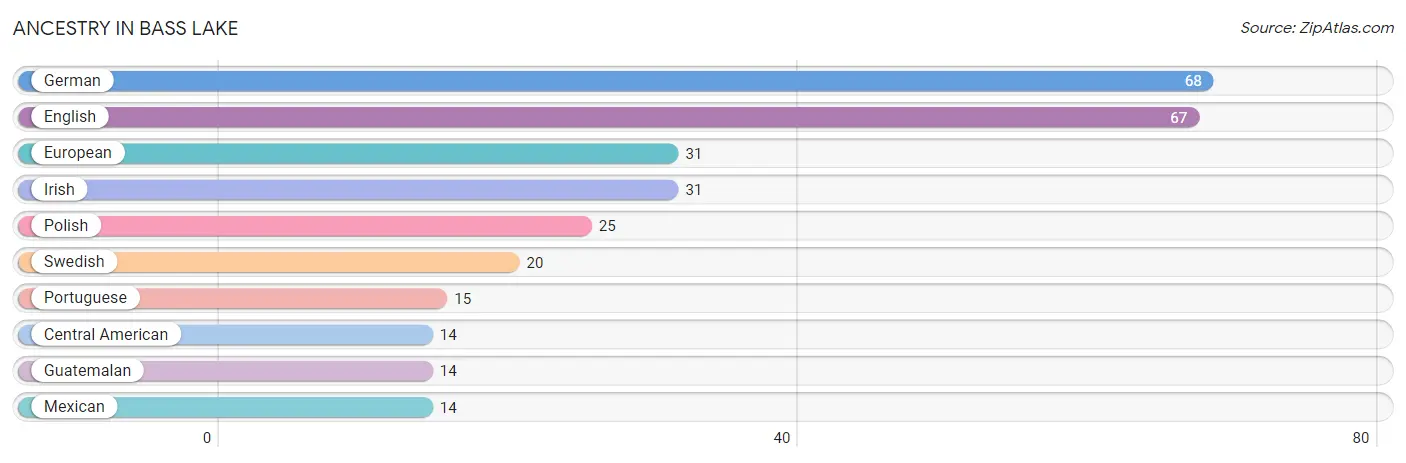
| Ancestry | # Population | % Population |
| Central American | 14 | 4.4% |
| English | 67 | 21.1% |
| European | 31 | 9.8% |
| German | 68 | 21.4% |
| Guatemalan | 14 | 4.4% |
| Irish | 31 | 9.8% |
| Mexican | 14 | 4.4% |
| Polish | 25 | 7.9% |
| Portuguese | 15 | 4.7% |
| Swedish | 20 | 6.3% | View All 10 Rows |
Immigrants in Bass Lake

| Immigration Origin | # Population | % Population | View All 0 Rows |
Sex and Age in Bass Lake
Sex and Age in Bass Lake
The most populous age groups in Bass Lake are 65 to 69 Years (41 | 20.3%) for men and 65 to 69 Years (35 | 30.2%) for women.
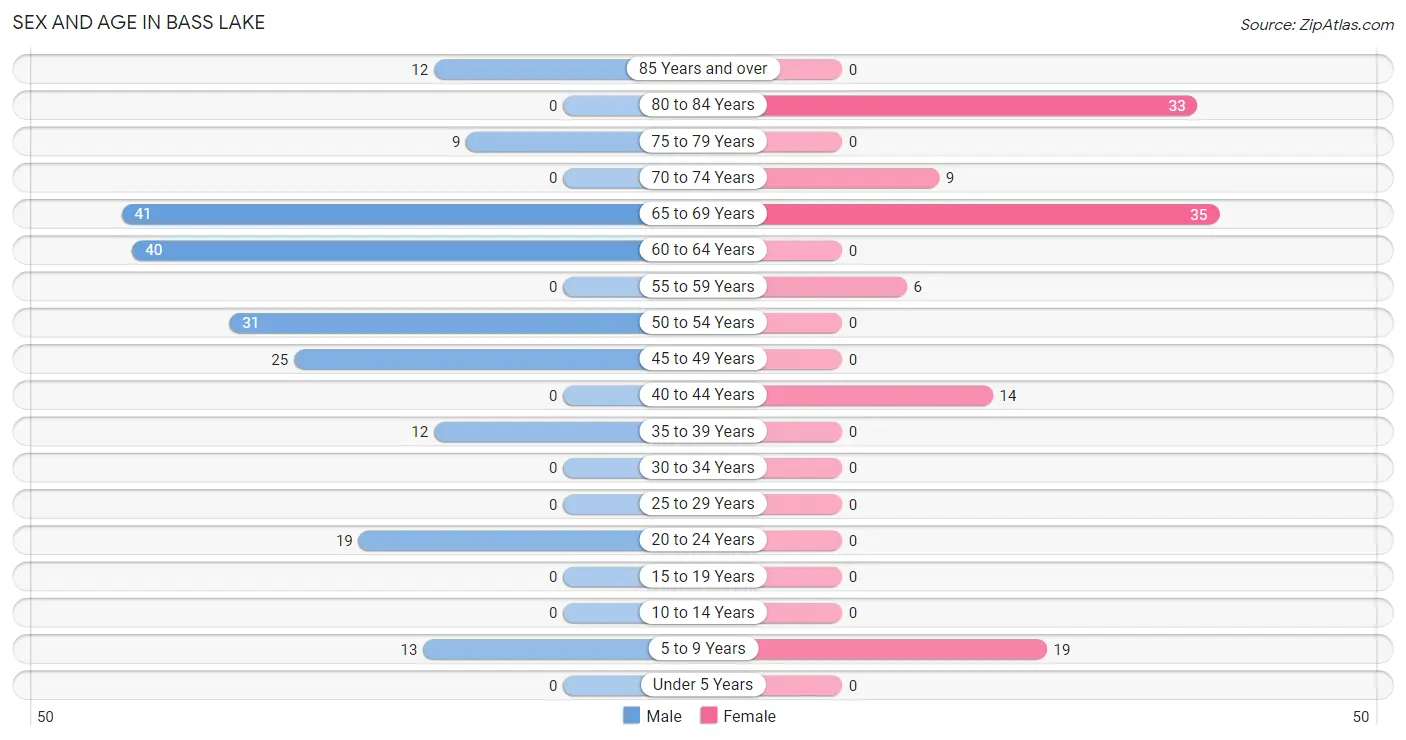
| Age Bracket | Male | Female |
| Under 5 Years | 0 (0.0%) | 0 (0.0%) |
| 5 to 9 Years | 13 (6.4%) | 19 (16.4%) |
| 10 to 14 Years | 0 (0.0%) | 0 (0.0%) |
| 15 to 19 Years | 0 (0.0%) | 0 (0.0%) |
| 20 to 24 Years | 19 (9.4%) | 0 (0.0%) |
| 25 to 29 Years | 0 (0.0%) | 0 (0.0%) |
| 30 to 34 Years | 0 (0.0%) | 0 (0.0%) |
| 35 to 39 Years | 12 (5.9%) | 0 (0.0%) |
| 40 to 44 Years | 0 (0.0%) | 14 (12.1%) |
| 45 to 49 Years | 25 (12.4%) | 0 (0.0%) |
| 50 to 54 Years | 31 (15.3%) | 0 (0.0%) |
| 55 to 59 Years | 0 (0.0%) | 6 (5.2%) |
| 60 to 64 Years | 40 (19.8%) | 0 (0.0%) |
| 65 to 69 Years | 41 (20.3%) | 35 (30.2%) |
| 70 to 74 Years | 0 (0.0%) | 9 (7.8%) |
| 75 to 79 Years | 9 (4.5%) | 0 (0.0%) |
| 80 to 84 Years | 0 (0.0%) | 33 (28.4%) |
| 85 Years and over | 12 (5.9%) | 0 (0.0%) |
| Total | 202 (100.0%) | 116 (100.0%) |
Families and Households in Bass Lake
Median Family Size in Bass Lake
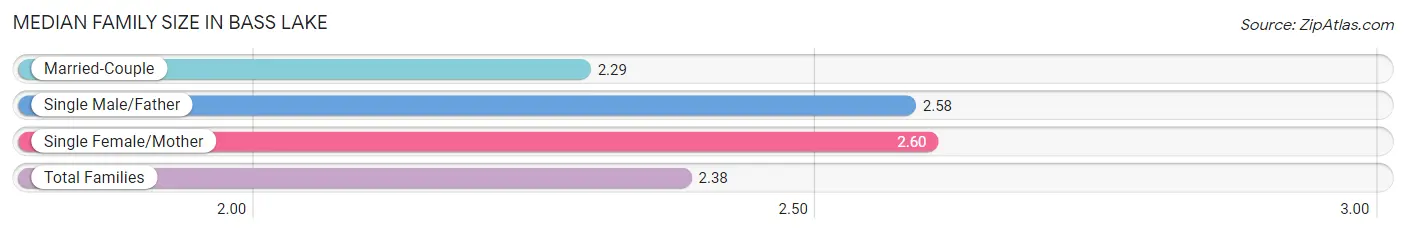
The median family size in Bass Lake is 2.38 persons per family, with single female/mother families (25 | 19.2%) accounting for the largest median family size of 2.6 persons per family. On the other hand, married-couple families (93 | 71.5%) represent the smallest median family size with 2.29 persons per family.
| Family Type | # Families | Family Size |
| Married-Couple | 93 (71.5%) | 2.29 |
| Single Male/Father | 12 (9.2%) | 2.58 |
| Single Female/Mother | 25 (19.2%) | 2.60 |
| Total Families | 130 (100.0%) | 2.38 |
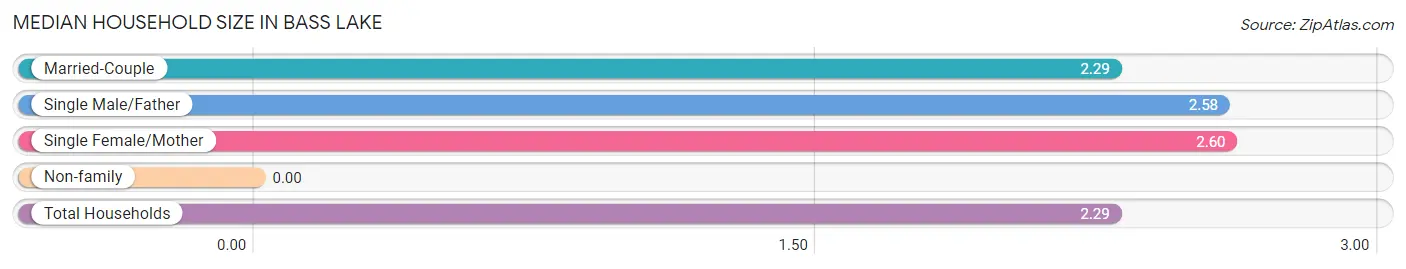
Median Household Size in Bass Lake
| Household Type | # Households | Household Size |
| Married-Couple | 93 (66.9%) | 2.29 |
| Single Male/Father | 12 (8.6%) | 2.58 |
| Single Female/Mother | 25 (18.0%) | 2.60 |
| Non-family | 9 (6.5%) | - |
| Total Households | 139 (100.0%) | 2.29 |
Household Size by Marriage Status in Bass Lake
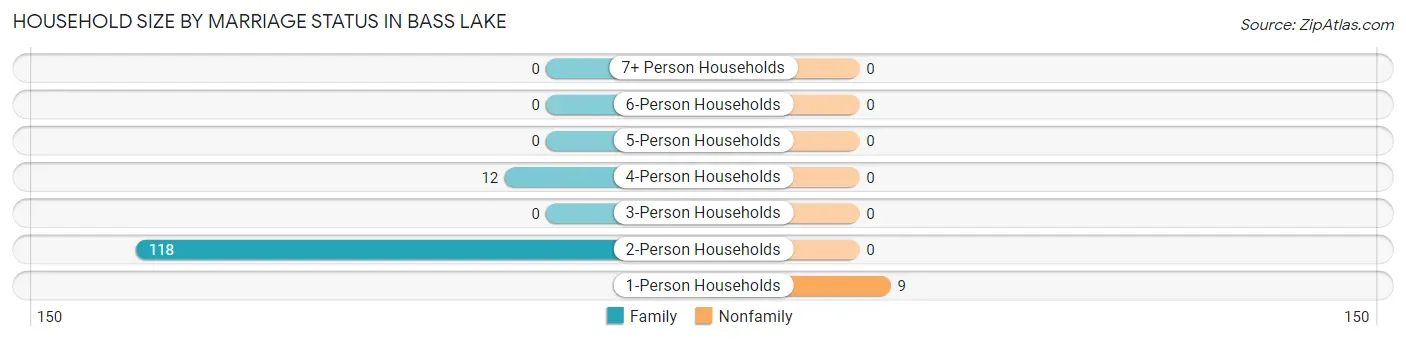
Out of a total of 139 households in Bass Lake, 130 (93.5%) are family households, while 9 (6.5%) are nonfamily households. The most numerous type of family households are 2-person households, comprising 118, and the most common type of nonfamily households are 1-person households, comprising 9.
| Household Size | Family Households | Nonfamily Households |
| 1-Person Households | - | 9 (6.5%) |
| 2-Person Households | 118 (84.9%) | 0 (0.0%) |
| 3-Person Households | 0 (0.0%) | 0 (0.0%) |
| 4-Person Households | 12 (8.6%) | 0 (0.0%) |
| 5-Person Households | 0 (0.0%) | 0 (0.0%) |
| 6-Person Households | 0 (0.0%) | 0 (0.0%) |
| 7+ Person Households | 0 (0.0%) | 0 (0.0%) |
| Total | 130 (93.5%) | 9 (6.5%) |
Female Fertility in Bass Lake
Fertility by Age in Bass Lake
| Age Bracket | Women with Births | Births / 1,000 Women |
| 15 to 19 years | 0 (0.0%) | 0.0 |
| 20 to 34 years | 0 (0.0%) | 0.0 |
| 35 to 50 years | 0 (0.0%) | 0.0 |
| Total | 0 (0.0%) | 0.0 |
Fertility by Age by Marriage Status in Bass Lake
| Age Bracket | Married | Unmarried |
| 15 to 19 years | 0 (0.0%) | 0 (0.0%) |
| 20 to 34 years | 0 (0.0%) | 0 (0.0%) |
| 35 to 50 years | 0 (0.0%) | 0 (0.0%) |
| Total | 0 (0.0%) | 0 (0.0%) |
Fertility by Education in Bass Lake
| Educational Attainment | Women with Births | Births / 1,000 Women |
| Less than High School | 0 (0.0%) | 0.0 |
| High School Diploma | 0 (0.0%) | 0.0 |
| College or Associate's Degree | 0 (0.0%) | 0.0 |
| Bachelor's Degree | 0 (0.0%) | 0.0 |
| Graduate Degree | 0 (0.0%) | 0.0 |
| Total | 0 (0.0%) | 0.0 |
Fertility by Education by Marriage Status in Bass Lake
| Educational Attainment | Married | Unmarried |
| Less than High School | 0 (0.0%) | 0 (0.0%) |
| High School Diploma | 0 (0.0%) | 0 (0.0%) |
| College or Associate's Degree | 0 (0.0%) | 0 (0.0%) |
| Bachelor's Degree | 0 (0.0%) | 0 (0.0%) |
| Graduate Degree | 0 (0.0%) | 0 (0.0%) |
| Total | 0 (0.0%) | 0 (0.0%) |
Employment Characteristics in Bass Lake
Employment by Class of Employer in Bass Lake
Among the 111 employed individuals in Bass Lake, local government employees (44 | 39.6%), private company employees (36 | 32.4%), and not-for-profit organizations (31 | 27.9%) make up the most common classes of employment.
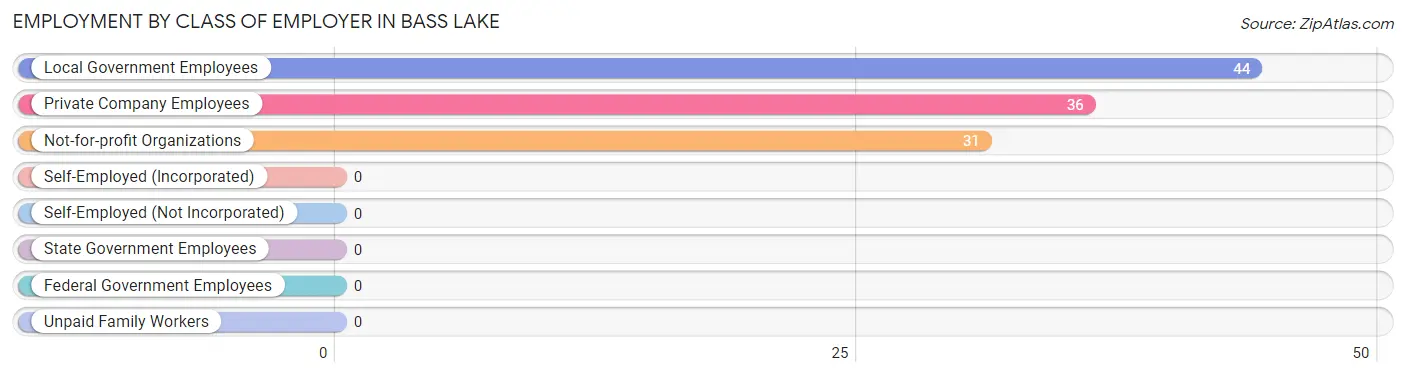
| Employer Class | # Employees | % Employees |
| Private Company Employees | 36 | 32.4% |
| Self-Employed (Incorporated) | 0 | 0.0% |
| Self-Employed (Not Incorporated) | 0 | 0.0% |
| Not-for-profit Organizations | 31 | 27.9% |
| Local Government Employees | 44 | 39.6% |
| State Government Employees | 0 | 0.0% |
| Federal Government Employees | 0 | 0.0% |
| Unpaid Family Workers | 0 | 0.0% |
| Total | 111 | 100.0% |
Employment Status by Age in Bass Lake
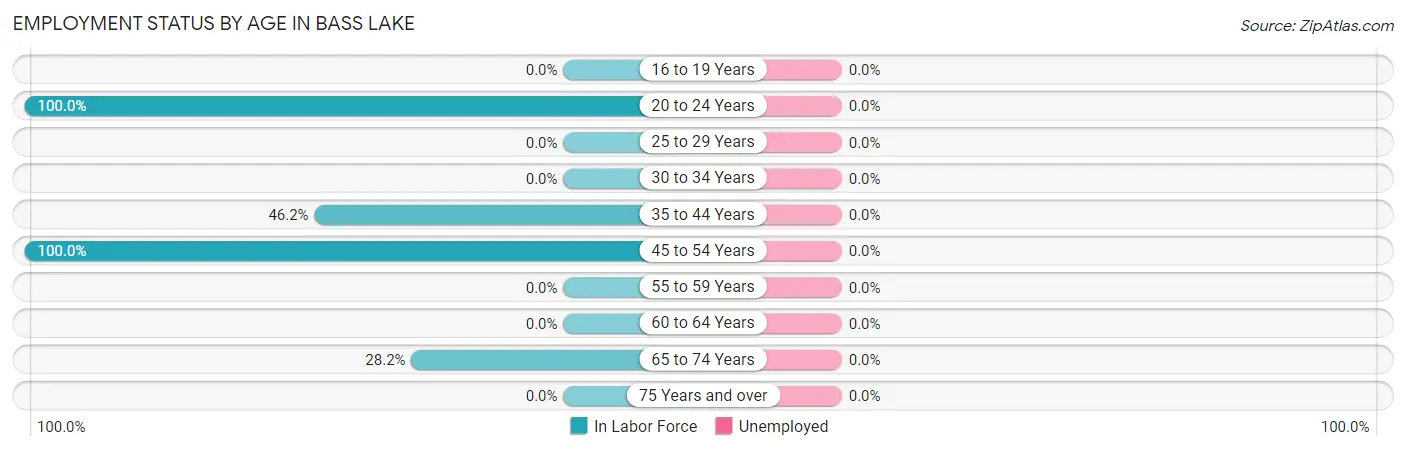
| Age Bracket | In Labor Force | Unemployed |
| 16 to 19 Years | 0 (0.0%) | 0 (0.0%) |
| 20 to 24 Years | 19 (100.0%) | 0 (0.0%) |
| 25 to 29 Years | 0 (0.0%) | 0 (0.0%) |
| 30 to 34 Years | 0 (0.0%) | 0 (0.0%) |
| 35 to 44 Years | 12 (46.2%) | 0 (0.0%) |
| 45 to 54 Years | 56 (100.0%) | 0 (0.0%) |
| 55 to 59 Years | 0 (0.0%) | 0 (0.0%) |
| 60 to 64 Years | 0 (0.0%) | 0 (0.0%) |
| 65 to 74 Years | 24 (28.2%) | 0 (0.0%) |
| 75 Years and over | 0 (0.0%) | 0 (0.0%) |
| Total | 111 (38.8%) | 0 (0.0%) |
Employment Status by Educational Attainment in Bass Lake
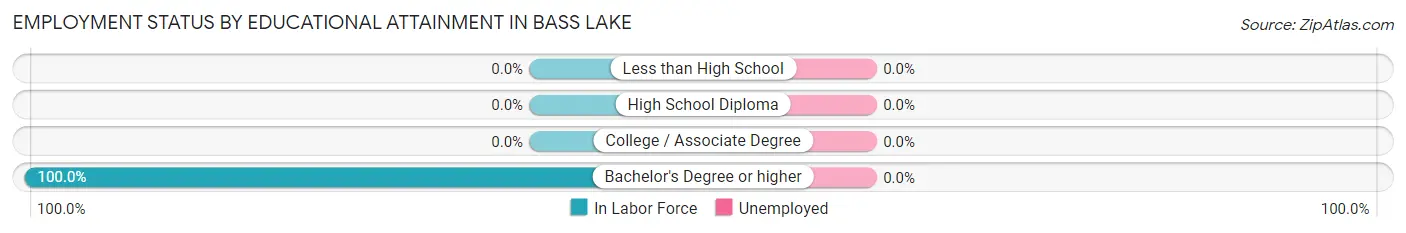
| Educational Attainment | In Labor Force | Unemployed |
| Less than High School | 0 (0.0%) | 0 (0.0%) |
| High School Diploma | 0 (0.0%) | 0 (0.0%) |
| College / Associate Degree | 0 (0.0%) | 0 (0.0%) |
| Bachelor's Degree or higher | 68 (100.0%) | 0 (0.0%) |
| Total | 68 (53.1%) | 0 (0.0%) |
Employment Occupations by Sex in Bass Lake
Management, Business, Science and Arts Occupations
The most common Management, Business, Science and Arts occupations in Bass Lake are Health Diagnosing & Treating (56 | 50.4%), Health Technologists (56 | 50.4%), and Management (12 | 10.8%).
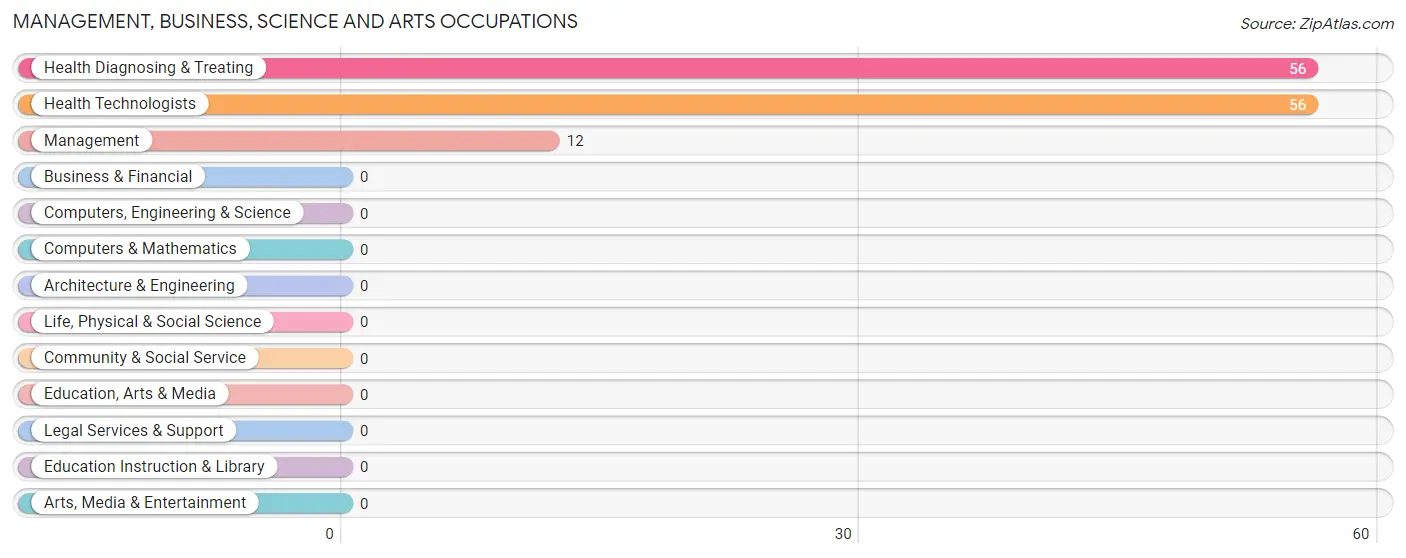
Management, Business, Science and Arts Occupations by Sex
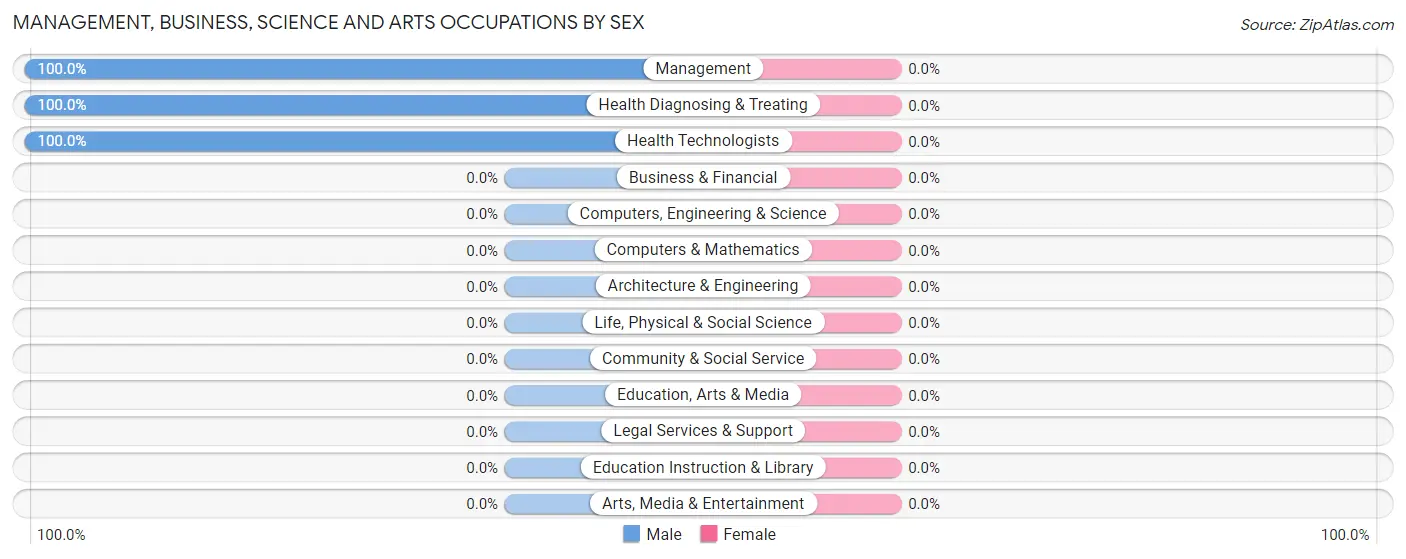
| Occupation | Male | Female |
| Management | 12 (100.0%) | 0 (0.0%) |
| Business & Financial | 0 (0.0%) | 0 (0.0%) |
| Computers, Engineering & Science | 0 (0.0%) | 0 (0.0%) |
| Computers & Mathematics | 0 (0.0%) | 0 (0.0%) |
| Architecture & Engineering | 0 (0.0%) | 0 (0.0%) |
| Life, Physical & Social Science | 0 (0.0%) | 0 (0.0%) |
| Community & Social Service | 0 (0.0%) | 0 (0.0%) |
| Education, Arts & Media | 0 (0.0%) | 0 (0.0%) |
| Legal Services & Support | 0 (0.0%) | 0 (0.0%) |
| Education Instruction & Library | 0 (0.0%) | 0 (0.0%) |
| Arts, Media & Entertainment | 0 (0.0%) | 0 (0.0%) |
| Health Diagnosing & Treating | 56 (100.0%) | 0 (0.0%) |
| Health Technologists | 56 (100.0%) | 0 (0.0%) |
| Total (Category) | 68 (100.0%) | 0 (0.0%) |
| Total (Overall) | 99 (89.2%) | 12 (10.8%) |
Services Occupations
The most common Services occupations in Bass Lake are Security & Protection (19 | 17.1%), Firefighting & Prevention (19 | 17.1%), and Food Preparation & Serving (12 | 10.8%).
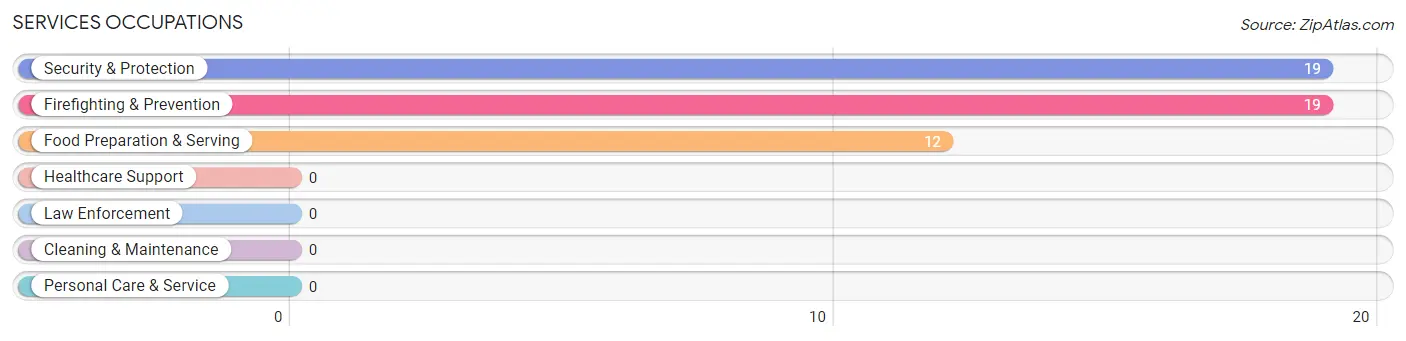
Services Occupations by Sex
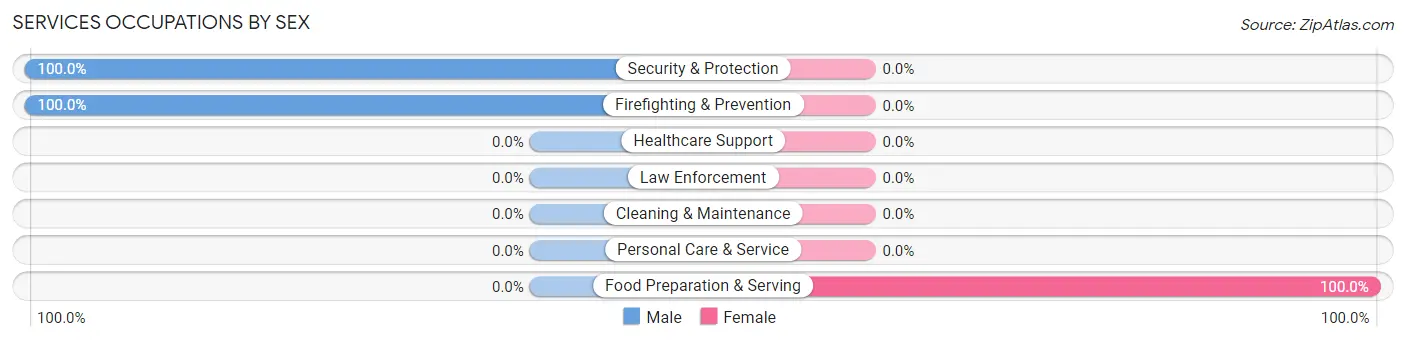
| Occupation | Male | Female |
| Healthcare Support | 0 (0.0%) | 0 (0.0%) |
| Security & Protection | 19 (100.0%) | 0 (0.0%) |
| Firefighting & Prevention | 19 (100.0%) | 0 (0.0%) |
| Law Enforcement | 0 (0.0%) | 0 (0.0%) |
| Food Preparation & Serving | 0 (0.0%) | 12 (100.0%) |
| Cleaning & Maintenance | 0 (0.0%) | 0 (0.0%) |
| Personal Care & Service | 0 (0.0%) | 0 (0.0%) |
| Total (Category) | 19 (61.3%) | 12 (38.7%) |
| Total (Overall) | 99 (89.2%) | 12 (10.8%) |
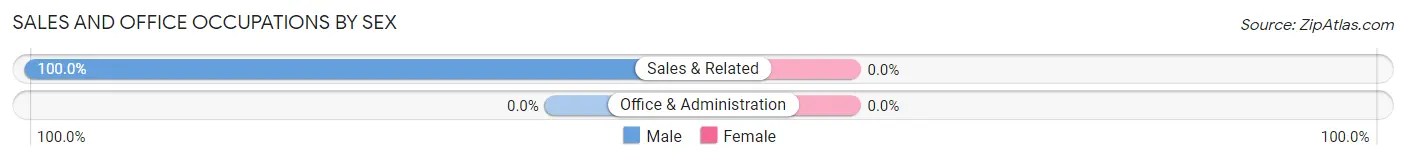
Sales and Office Occupations
The most common Sales and Office occupations in Bass Lake are , and Sales & Related (12 | 10.8%).
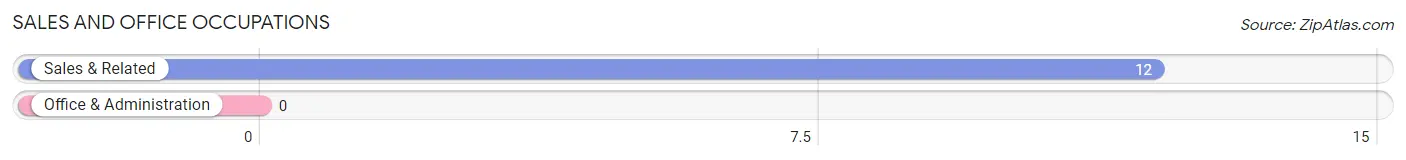
Sales and Office Occupations by Sex
| Occupation | Male | Female |
| Sales & Related | 12 (100.0%) | 0 (0.0%) |
| Office & Administration | 0 (0.0%) | 0 (0.0%) |
| Total (Category) | 12 (100.0%) | 0 (0.0%) |
| Total (Overall) | 99 (89.2%) | 12 (10.8%) |
Natural Resources, Construction and Maintenance Occupations
Natural Resources, Construction and Maintenance Occupations by Sex
| Occupation | Male | Female |
| Farming, Fishing & Forestry | 0 (0.0%) | 0 (0.0%) |
| Construction & Extraction | 0 (0.0%) | 0 (0.0%) |
| Installation, Maintenance & Repair | 0 (0.0%) | 0 (0.0%) |
| Total (Category) | 0 (0.0%) | 0 (0.0%) |
| Total (Overall) | 99 (89.2%) | 12 (10.8%) |
Production, Transportation and Moving Occupations
Production, Transportation and Moving Occupations by Sex
| Occupation | Male | Female |
| Production | 0 (0.0%) | 0 (0.0%) |
| Transportation | 0 (0.0%) | 0 (0.0%) |
| Material Moving | 0 (0.0%) | 0 (0.0%) |
| Total (Category) | 0 (0.0%) | 0 (0.0%) |
| Total (Overall) | 99 (89.2%) | 12 (10.8%) |
Employment Industries by Sex in Bass Lake
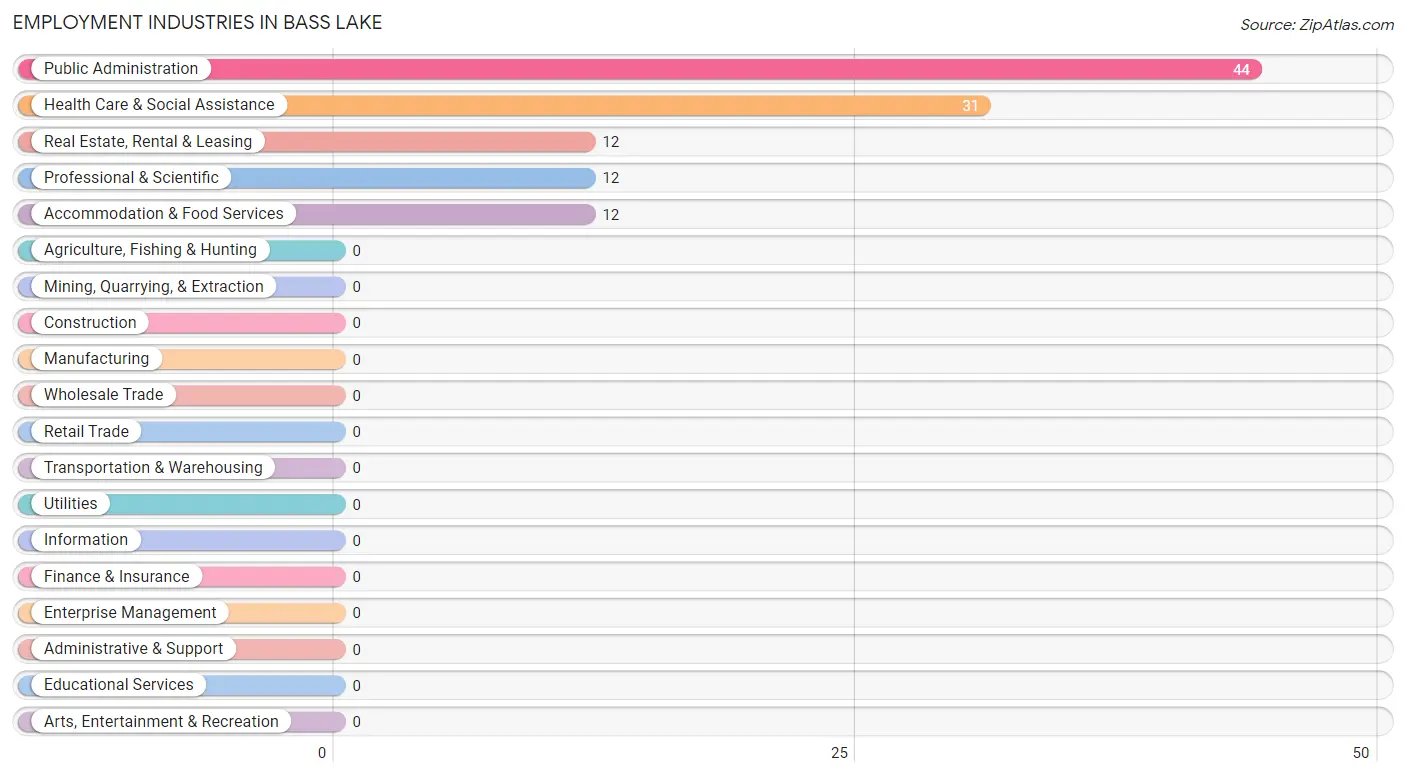
Employment Industries in Bass Lake
The major employment industries in Bass Lake include Public Administration (44 | 39.6%), Health Care & Social Assistance (31 | 27.9%), Real Estate, Rental & Leasing (12 | 10.8%), Professional & Scientific (12 | 10.8%), and Accommodation & Food Services (12 | 10.8%).
Employment Industries by Sex in Bass Lake
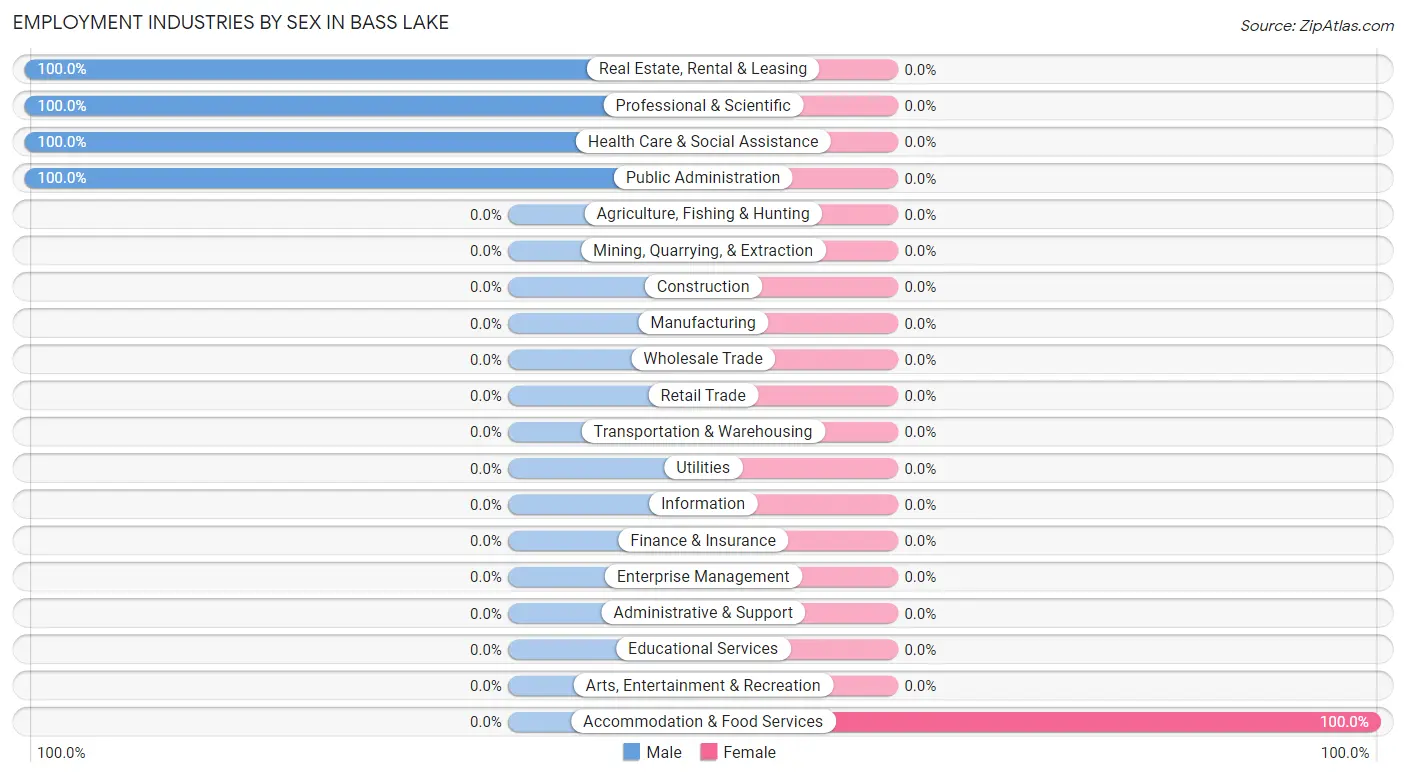
| Industry | Male | Female |
| Agriculture, Fishing & Hunting | 0 (0.0%) | 0 (0.0%) |
| Mining, Quarrying, & Extraction | 0 (0.0%) | 0 (0.0%) |
| Construction | 0 (0.0%) | 0 (0.0%) |
| Manufacturing | 0 (0.0%) | 0 (0.0%) |
| Wholesale Trade | 0 (0.0%) | 0 (0.0%) |
| Retail Trade | 0 (0.0%) | 0 (0.0%) |
| Transportation & Warehousing | 0 (0.0%) | 0 (0.0%) |
| Utilities | 0 (0.0%) | 0 (0.0%) |
| Information | 0 (0.0%) | 0 (0.0%) |
| Finance & Insurance | 0 (0.0%) | 0 (0.0%) |
| Real Estate, Rental & Leasing | 12 (100.0%) | 0 (0.0%) |
| Professional & Scientific | 12 (100.0%) | 0 (0.0%) |
| Enterprise Management | 0 (0.0%) | 0 (0.0%) |
| Administrative & Support | 0 (0.0%) | 0 (0.0%) |
| Educational Services | 0 (0.0%) | 0 (0.0%) |
| Health Care & Social Assistance | 31 (100.0%) | 0 (0.0%) |
| Arts, Entertainment & Recreation | 0 (0.0%) | 0 (0.0%) |
| Accommodation & Food Services | 0 (0.0%) | 12 (100.0%) |
| Public Administration | 44 (100.0%) | 0 (0.0%) |
| Total | 99 (89.2%) | 12 (10.8%) |
Education in Bass Lake
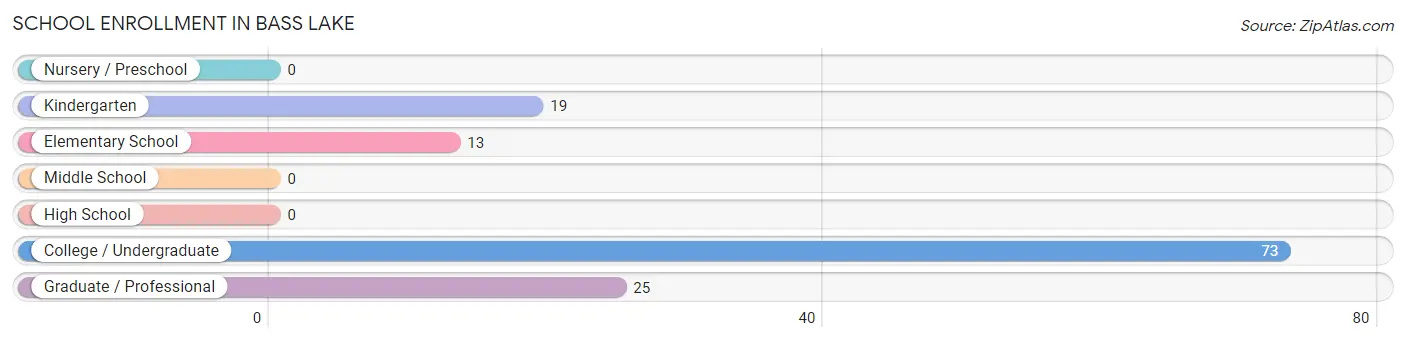
School Enrollment in Bass Lake
The most common levels of schooling among the 130 students in Bass Lake are college / undergraduate (73 | 56.1%), graduate / professional (25 | 19.2%), and kindergarten (19 | 14.6%).
| School Level | # Students | % Students |
| Nursery / Preschool | 0 | 0.0% |
| Kindergarten | 19 | 14.6% |
| Elementary School | 13 | 10.0% |
| Middle School | 0 | 0.0% |
| High School | 0 | 0.0% |
| College / Undergraduate | 73 | 56.1% |
| Graduate / Professional | 25 | 19.2% |
| Total | 130 | 100.0% |
School Enrollment by Age by Funding Source in Bass Lake
Out of a total of 130 students who are enrolled in schools in Bass Lake, 32 (24.6%) attend a private institution, while the remaining 98 (75.4%) are enrolled in public schools. The age group of 5 to 9 year old has the highest likelihood of being enrolled in private schools, with 32 (100.0% in the age bracket) enrolled. Conversely, the age group of 20 to 24 year olds has the lowest likelihood of being enrolled in a private school, with 19 (100.0% in the age bracket) attending a public institution.
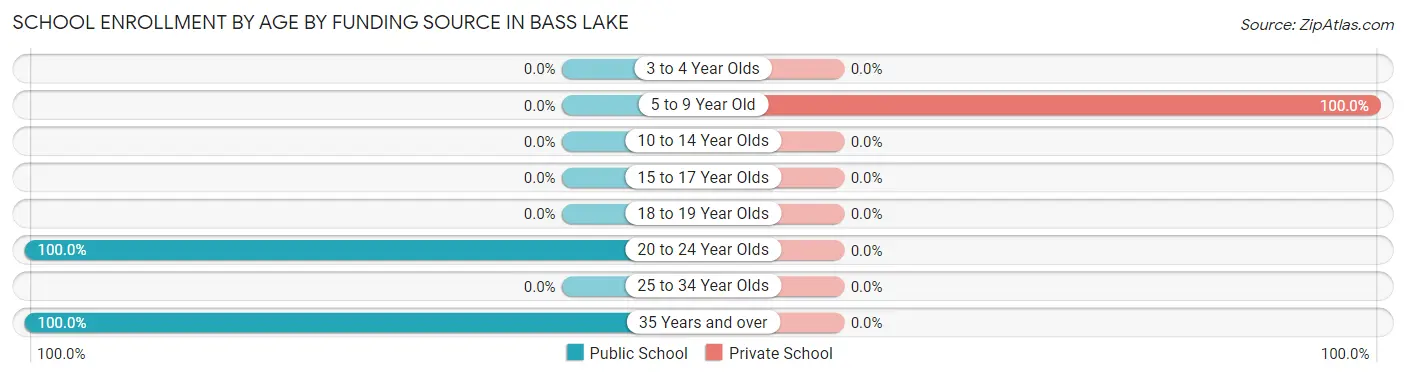
| Age Bracket | Public School | Private School |
| 3 to 4 Year Olds | 0 (0.0%) | 0 (0.0%) |
| 5 to 9 Year Old | 0 (0.0%) | 32 (100.0%) |
| 10 to 14 Year Olds | 0 (0.0%) | 0 (0.0%) |
| 15 to 17 Year Olds | 0 (0.0%) | 0 (0.0%) |
| 18 to 19 Year Olds | 0 (0.0%) | 0 (0.0%) |
| 20 to 24 Year Olds | 19 (100.0%) | 0 (0.0%) |
| 25 to 34 Year Olds | 0 (0.0%) | 0 (0.0%) |
| 35 Years and over | 79 (100.0%) | 0 (0.0%) |
| Total | 98 (75.4%) | 32 (24.6%) |
Educational Attainment by Field of Study in Bass Lake
Liberal arts & history (110 | 55.3%), education (56 | 28.1%), computers & mathematics (12 | 6.0%), arts & humanities (12 | 6.0%), and science & technology (9 | 4.5%) are the most common fields of study among 199 individuals in Bass Lake who have obtained a bachelor's degree or higher.
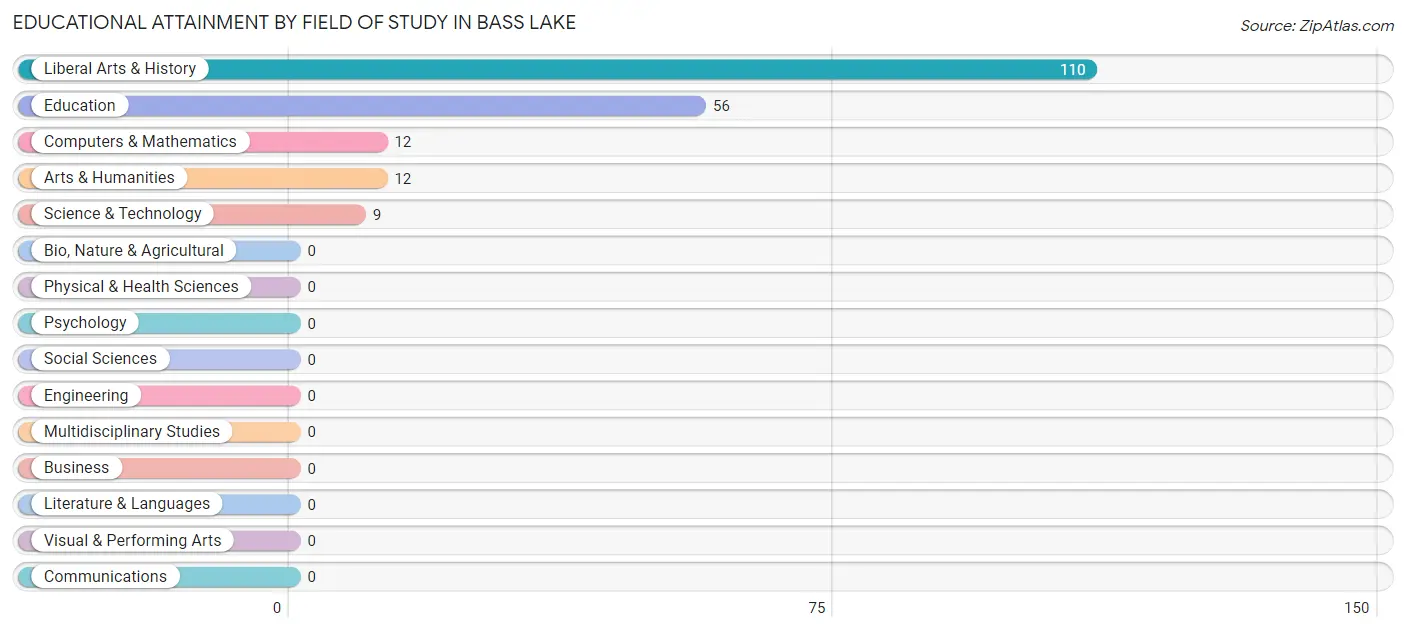
| Field of Study | # Graduates | % Graduates |
| Computers & Mathematics | 12 | 6.0% |
| Bio, Nature & Agricultural | 0 | 0.0% |
| Physical & Health Sciences | 0 | 0.0% |
| Psychology | 0 | 0.0% |
| Social Sciences | 0 | 0.0% |
| Engineering | 0 | 0.0% |
| Multidisciplinary Studies | 0 | 0.0% |
| Science & Technology | 9 | 4.5% |
| Business | 0 | 0.0% |
| Education | 56 | 28.1% |
| Literature & Languages | 0 | 0.0% |
| Liberal Arts & History | 110 | 55.3% |
| Visual & Performing Arts | 0 | 0.0% |
| Communications | 0 | 0.0% |
| Arts & Humanities | 12 | 6.0% |
| Total | 199 | 100.0% |
Transportation & Commute in Bass Lake
Vehicle Availability by Sex in Bass Lake
The most prevalent vehicle ownership categories in Bass Lake are males with 2 vehicles (68, accounting for 68.7%) and females with 2 vehicles (0, making up 566.7%).
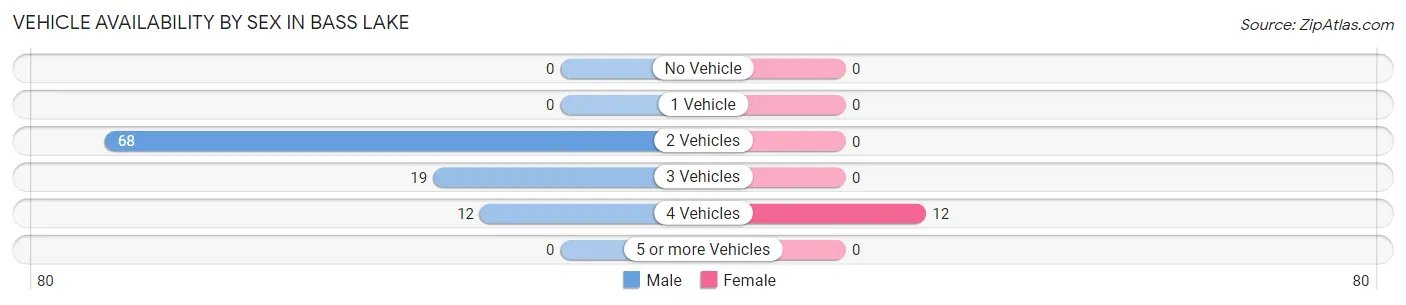
| Vehicles Available | Male | Female |
| No Vehicle | 0 (0.0%) | 0 (0.0%) |
| 1 Vehicle | 0 (0.0%) | 0 (0.0%) |
| 2 Vehicles | 68 (68.7%) | 0 (0.0%) |
| 3 Vehicles | 19 (19.2%) | 0 (0.0%) |
| 4 Vehicles | 12 (12.1%) | 12 (100.0%) |
| 5 or more Vehicles | 0 (0.0%) | 0 (0.0%) |
| Total | 99 (100.0%) | 12 (100.0%) |
Commute Time in Bass Lake
The most frequently occuring commute durations in Bass Lake are 20 to 24 minutes (31 commuters, 33.7%), 30 to 34 minutes (25 commuters, 27.2%), and 10 to 14 minutes (12 commuters, 13.0%).
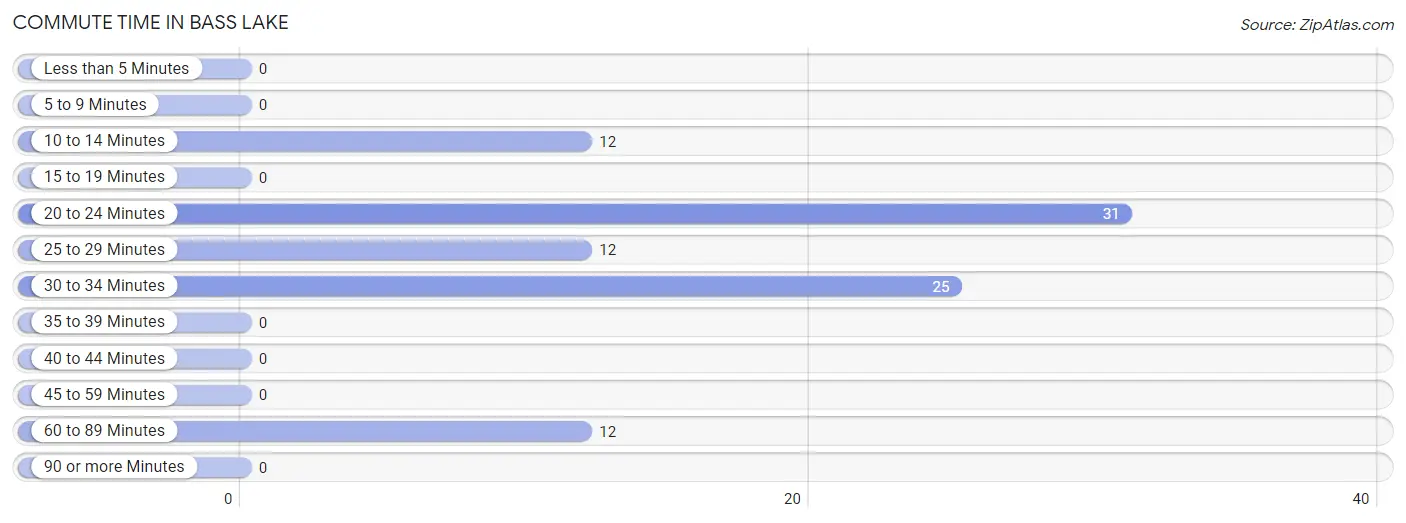
| Commute Time | # Commuters | % Commuters |
| Less than 5 Minutes | 0 | 0.0% |
| 5 to 9 Minutes | 0 | 0.0% |
| 10 to 14 Minutes | 12 | 13.0% |
| 15 to 19 Minutes | 0 | 0.0% |
| 20 to 24 Minutes | 31 | 33.7% |
| 25 to 29 Minutes | 12 | 13.0% |
| 30 to 34 Minutes | 25 | 27.2% |
| 35 to 39 Minutes | 0 | 0.0% |
| 40 to 44 Minutes | 0 | 0.0% |
| 45 to 59 Minutes | 0 | 0.0% |
| 60 to 89 Minutes | 12 | 13.0% |
| 90 or more Minutes | 0 | 0.0% |
Commute Time by Sex in Bass Lake
The most common commute times in Bass Lake are 20 to 24 minutes (31 commuters, 38.8%) for males and 25 to 29 minutes (12 commuters, 100.0%) for females.
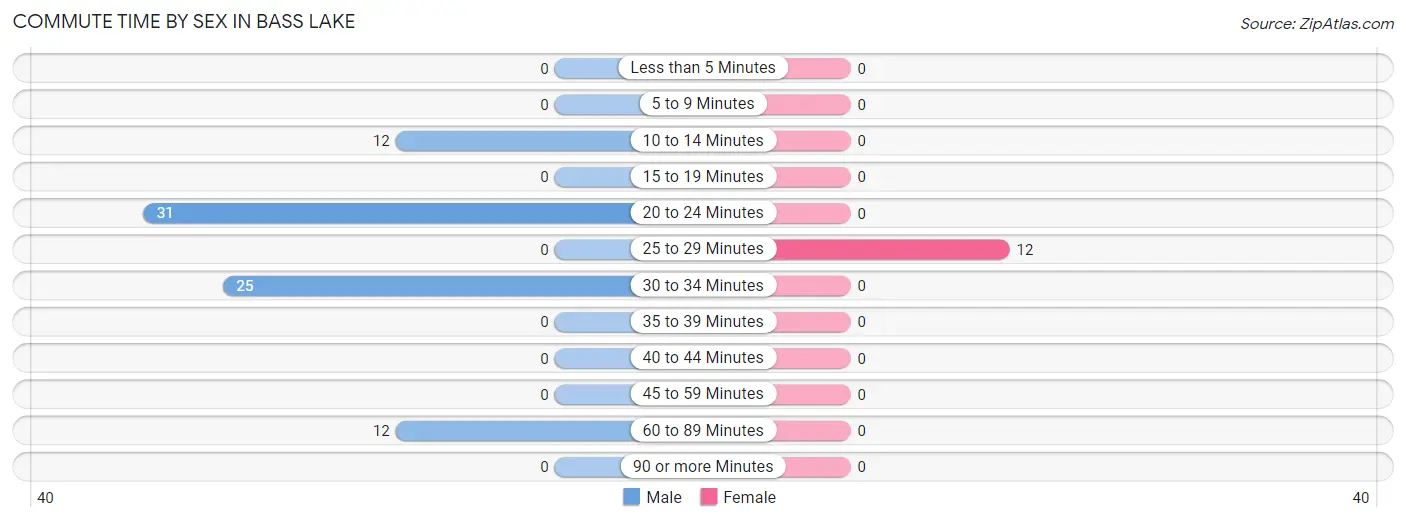
| Commute Time | Male | Female |
| Less than 5 Minutes | 0 (0.0%) | 0 (0.0%) |
| 5 to 9 Minutes | 0 (0.0%) | 0 (0.0%) |
| 10 to 14 Minutes | 12 (15.0%) | 0 (0.0%) |
| 15 to 19 Minutes | 0 (0.0%) | 0 (0.0%) |
| 20 to 24 Minutes | 31 (38.8%) | 0 (0.0%) |
| 25 to 29 Minutes | 0 (0.0%) | 12 (100.0%) |
| 30 to 34 Minutes | 25 (31.2%) | 0 (0.0%) |
| 35 to 39 Minutes | 0 (0.0%) | 0 (0.0%) |
| 40 to 44 Minutes | 0 (0.0%) | 0 (0.0%) |
| 45 to 59 Minutes | 0 (0.0%) | 0 (0.0%) |
| 60 to 89 Minutes | 12 (15.0%) | 0 (0.0%) |
| 90 or more Minutes | 0 (0.0%) | 0 (0.0%) |
Time of Departure to Work by Sex in Bass Lake
The most frequent times of departure to work in Bass Lake are 8:00 AM to 8:29 AM (31, 38.8%) for males and 12:00 PM to 3:59 PM (12, 100.0%) for females.
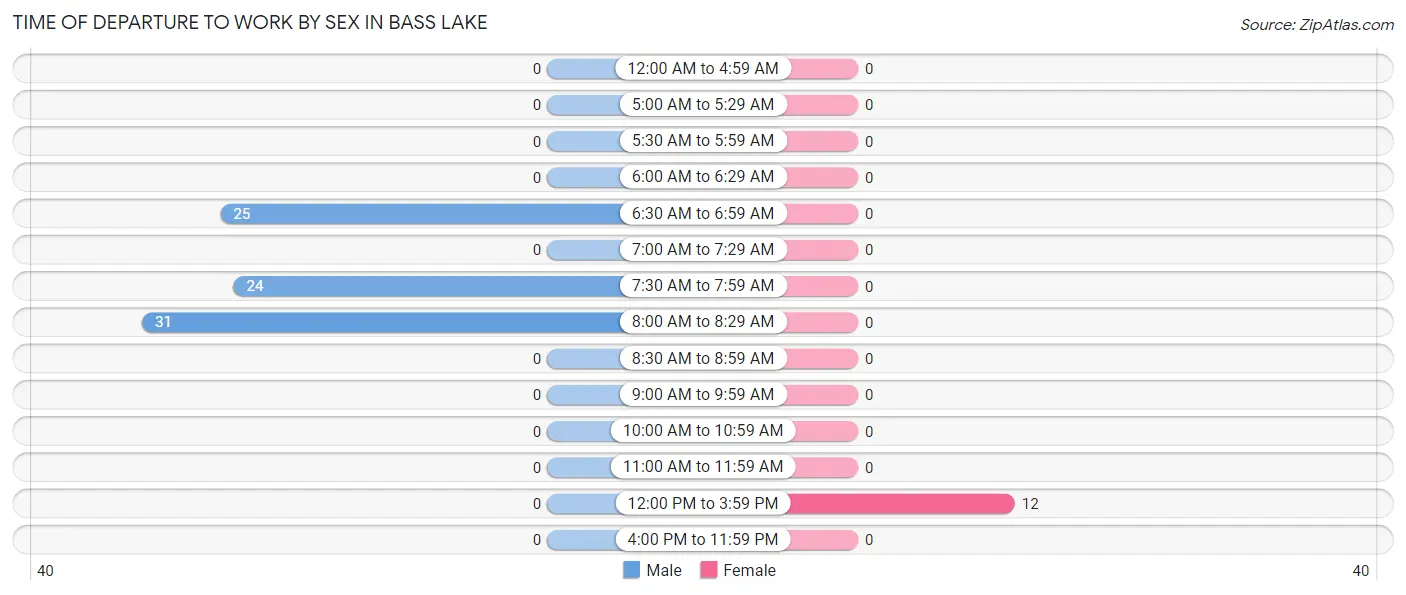
| Time of Departure | Male | Female |
| 12:00 AM to 4:59 AM | 0 (0.0%) | 0 (0.0%) |
| 5:00 AM to 5:29 AM | 0 (0.0%) | 0 (0.0%) |
| 5:30 AM to 5:59 AM | 0 (0.0%) | 0 (0.0%) |
| 6:00 AM to 6:29 AM | 0 (0.0%) | 0 (0.0%) |
| 6:30 AM to 6:59 AM | 25 (31.2%) | 0 (0.0%) |
| 7:00 AM to 7:29 AM | 0 (0.0%) | 0 (0.0%) |
| 7:30 AM to 7:59 AM | 24 (30.0%) | 0 (0.0%) |
| 8:00 AM to 8:29 AM | 31 (38.8%) | 0 (0.0%) |
| 8:30 AM to 8:59 AM | 0 (0.0%) | 0 (0.0%) |
| 9:00 AM to 9:59 AM | 0 (0.0%) | 0 (0.0%) |
| 10:00 AM to 10:59 AM | 0 (0.0%) | 0 (0.0%) |
| 11:00 AM to 11:59 AM | 0 (0.0%) | 0 (0.0%) |
| 12:00 PM to 3:59 PM | 0 (0.0%) | 12 (100.0%) |
| 4:00 PM to 11:59 PM | 0 (0.0%) | 0 (0.0%) |
| Total | 80 (100.0%) | 12 (100.0%) |
Housing Occupancy in Bass Lake
Occupancy by Ownership in Bass Lake
Of the total 139 dwellings in Bass Lake, owner-occupied units account for 139 (100.0%), while renter-occupied units make up 0 (0.0%).
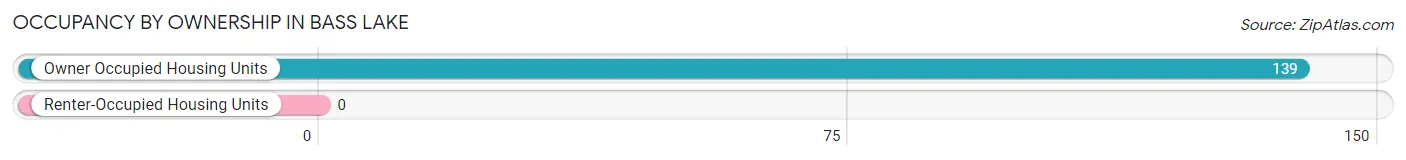
| Occupancy | # Housing Units | % Housing Units |
| Owner Occupied Housing Units | 139 | 100.0% |
| Renter-Occupied Housing Units | 0 | 0.0% |
| Total Occupied Housing Units | 139 | 100.0% |
Occupancy by Household Size in Bass Lake
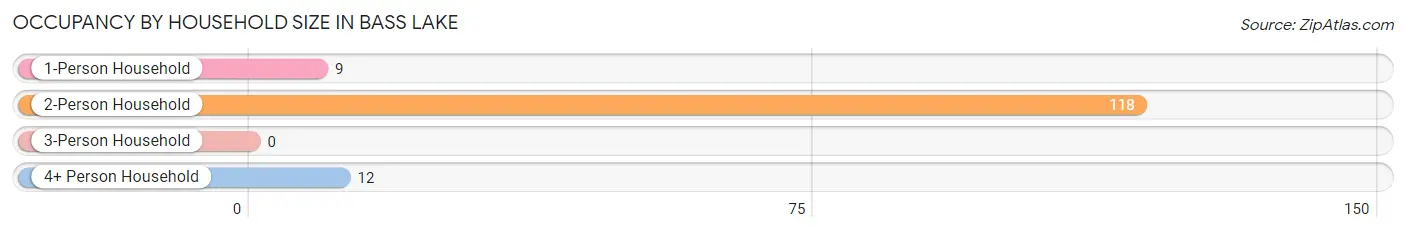
| Household Size | # Housing Units | % Housing Units |
| 1-Person Household | 9 | 6.5% |
| 2-Person Household | 118 | 84.9% |
| 3-Person Household | 0 | 0.0% |
| 4+ Person Household | 12 | 8.6% |
| Total Housing Units | 139 | 100.0% |
Occupancy by Ownership by Household Size in Bass Lake
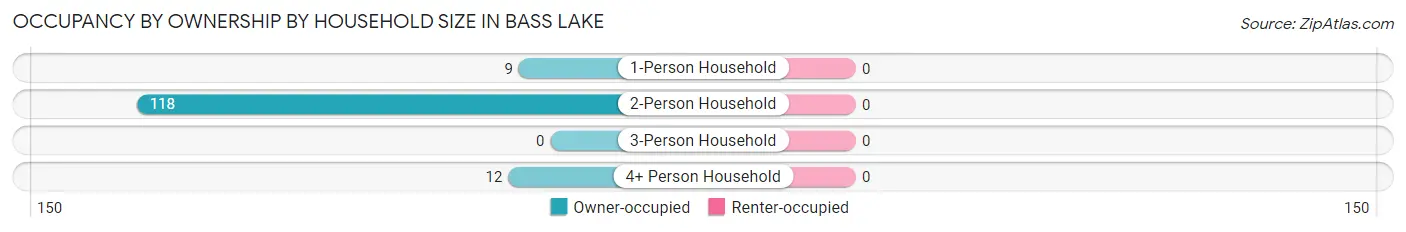
| Household Size | Owner-occupied | Renter-occupied |
| 1-Person Household | 9 (100.0%) | 0 (0.0%) |
| 2-Person Household | 118 (100.0%) | 0 (0.0%) |
| 3-Person Household | 0 (0.0%) | 0 (0.0%) |
| 4+ Person Household | 12 (100.0%) | 0 (0.0%) |
| Total Housing Units | 139 (100.0%) | 0 (0.0%) |
Occupancy by Educational Attainment in Bass Lake
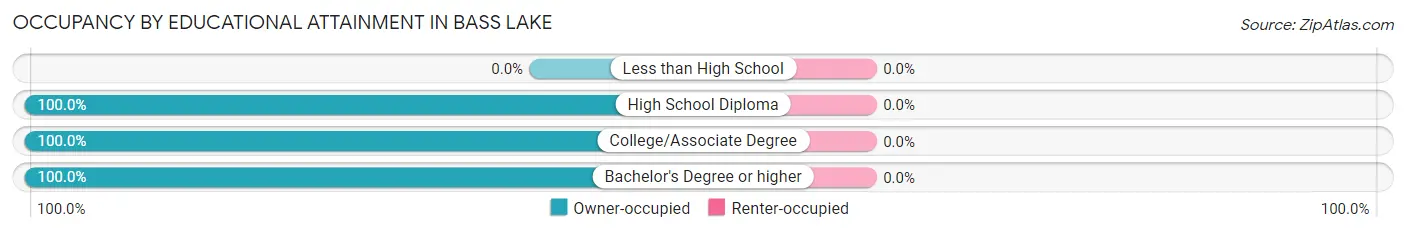
| Household Size | Owner-occupied | Renter-occupied |
| Less than High School | 0 (0.0%) | 0 (0.0%) |
| High School Diploma | 16 (100.0%) | 0 (0.0%) |
| College/Associate Degree | 19 (100.0%) | 0 (0.0%) |
| Bachelor's Degree or higher | 104 (100.0%) | 0 (0.0%) |
Occupancy by Age of Householder in Bass Lake
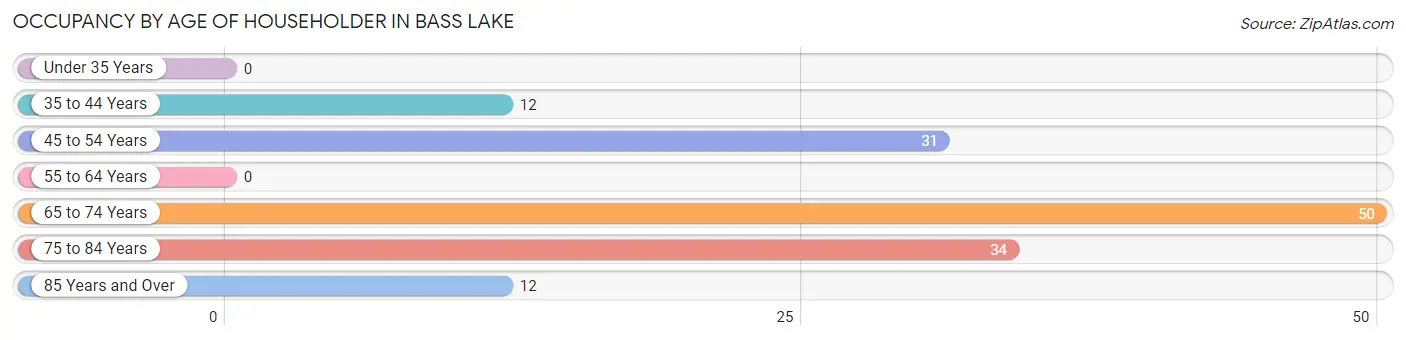
| Age Bracket | # Households | % Households |
| Under 35 Years | 0 | 0.0% |
| 35 to 44 Years | 12 | 8.6% |
| 45 to 54 Years | 31 | 22.3% |
| 55 to 64 Years | 0 | 0.0% |
| 65 to 74 Years | 50 | 36.0% |
| 75 to 84 Years | 34 | 24.5% |
| 85 Years and Over | 12 | 8.6% |
| Total | 139 | 100.0% |
Housing Finances in Bass Lake
Median Income by Occupancy in Bass Lake
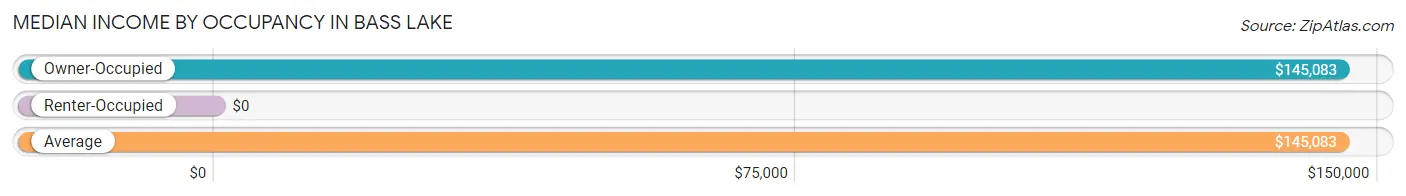
| Occupancy Type | # Households | Median Income |
| Owner-Occupied | 139 (100.0%) | $145,083 |
| Renter-Occupied | 0 (0.0%) | $0 |
| Average | 139 (100.0%) | $145,083 |
Occupancy by Householder Income Bracket in Bass Lake
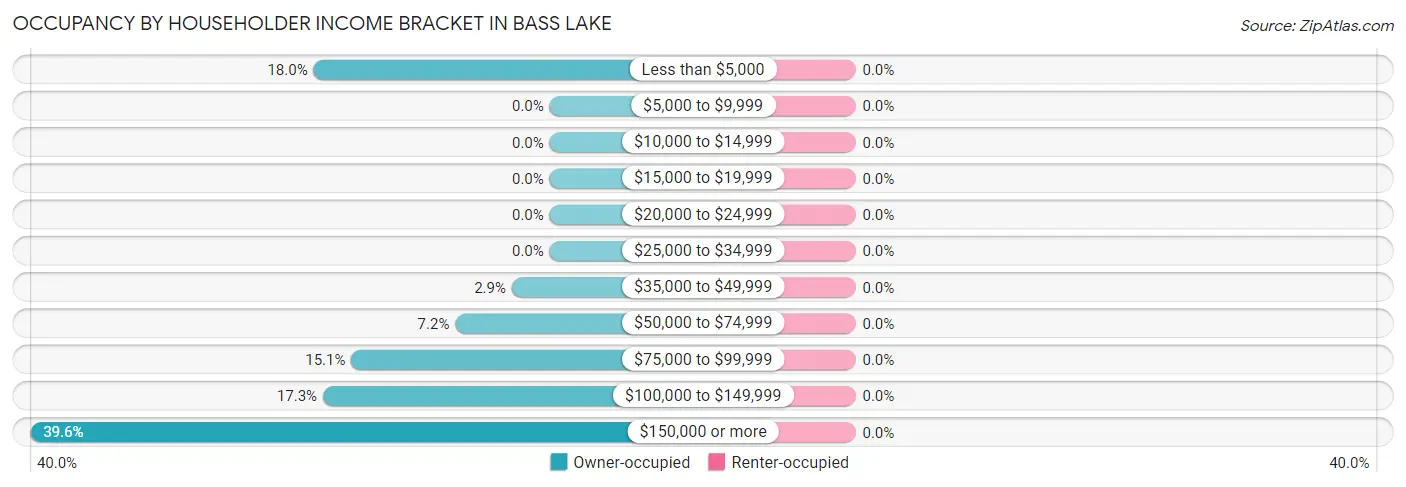
| Income Bracket | Owner-occupied | Renter-occupied |
| Less than $5,000 | 25 (18.0%) | 0 (0.0%) |
| $5,000 to $9,999 | 0 (0.0%) | 0 (0.0%) |
| $10,000 to $14,999 | 0 (0.0%) | 0 (0.0%) |
| $15,000 to $19,999 | 0 (0.0%) | 0 (0.0%) |
| $20,000 to $24,999 | 0 (0.0%) | 0 (0.0%) |
| $25,000 to $34,999 | 0 (0.0%) | 0 (0.0%) |
| $35,000 to $49,999 | 4 (2.9%) | 0 (0.0%) |
| $50,000 to $74,999 | 10 (7.2%) | 0 (0.0%) |
| $75,000 to $99,999 | 21 (15.1%) | 0 (0.0%) |
| $100,000 to $149,999 | 24 (17.3%) | 0 (0.0%) |
| $150,000 or more | 55 (39.6%) | 0 (0.0%) |
| Total | 139 (100.0%) | 0 (0.0%) |
Monthly Housing Cost Tiers in Bass Lake
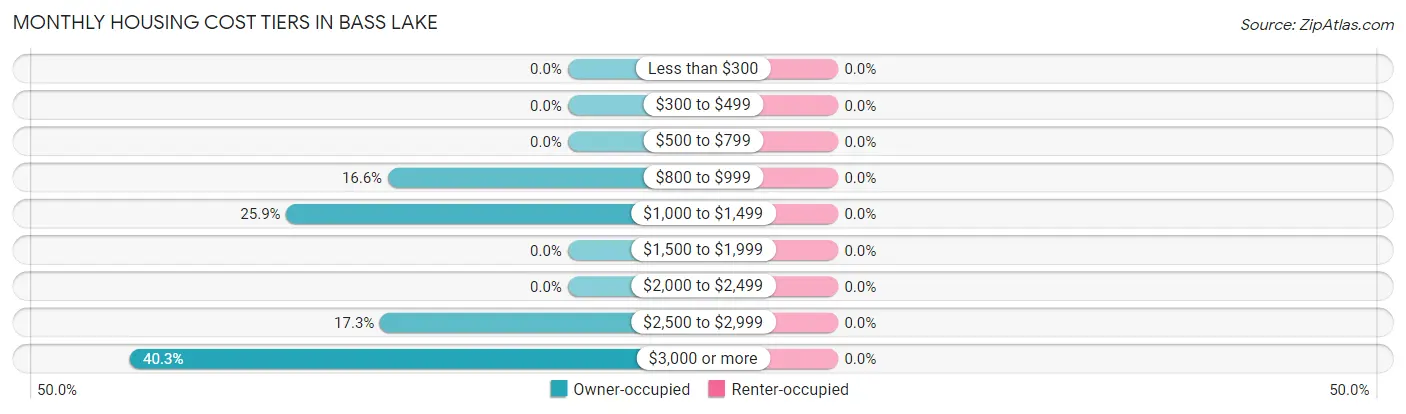
| Monthly Cost | Owner-occupied | Renter-occupied |
| Less than $300 | 0 (0.0%) | 0 (0.0%) |
| $300 to $499 | 0 (0.0%) | 0 (0.0%) |
| $500 to $799 | 0 (0.0%) | 0 (0.0%) |
| $800 to $999 | 23 (16.6%) | 0 (0.0%) |
| $1,000 to $1,499 | 36 (25.9%) | 0 (0.0%) |
| $1,500 to $1,999 | 0 (0.0%) | 0 (0.0%) |
| $2,000 to $2,499 | 0 (0.0%) | 0 (0.0%) |
| $2,500 to $2,999 | 24 (17.3%) | 0 (0.0%) |
| $3,000 or more | 56 (40.3%) | 0 (0.0%) |
| Total | 139 (100.0%) | 0 (0.0%) |
Physical Housing Characteristics in Bass Lake
Housing Structures in Bass Lake
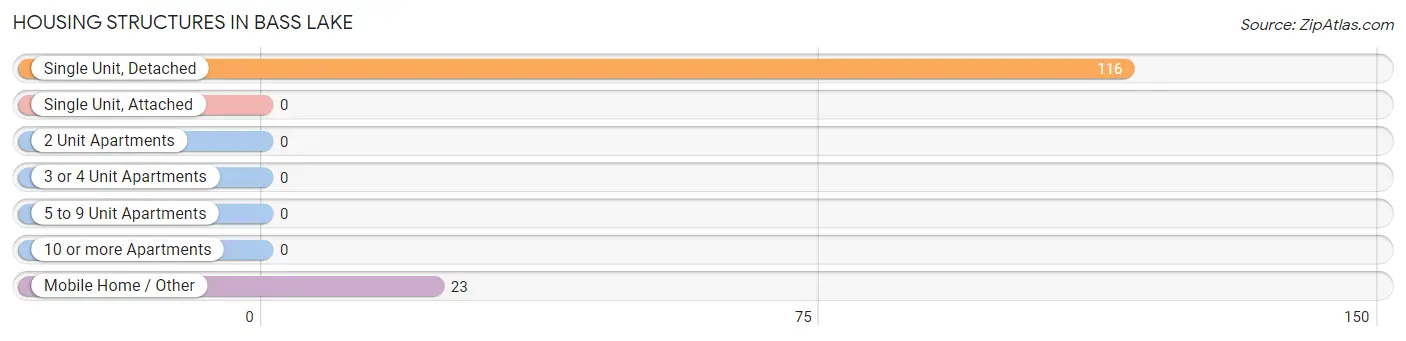
| Structure Type | # Housing Units | % Housing Units |
| Single Unit, Detached | 116 | 83.5% |
| Single Unit, Attached | 0 | 0.0% |
| 2 Unit Apartments | 0 | 0.0% |
| 3 or 4 Unit Apartments | 0 | 0.0% |
| 5 to 9 Unit Apartments | 0 | 0.0% |
| 10 or more Apartments | 0 | 0.0% |
| Mobile Home / Other | 23 | 16.6% |
| Total | 139 | 100.0% |
Housing Structures by Occupancy in Bass Lake
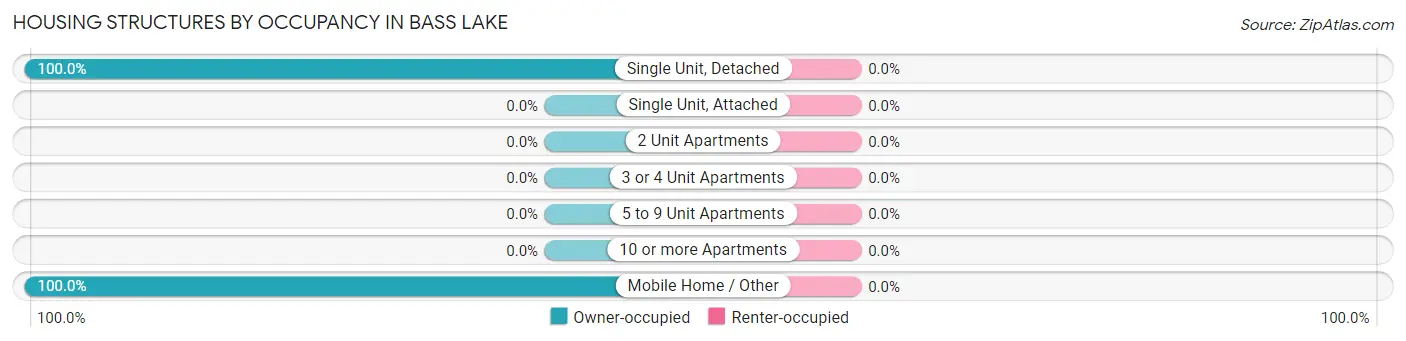
| Structure Type | Owner-occupied | Renter-occupied |
| Single Unit, Detached | 116 (100.0%) | 0 (0.0%) |
| Single Unit, Attached | 0 (0.0%) | 0 (0.0%) |
| 2 Unit Apartments | 0 (0.0%) | 0 (0.0%) |
| 3 or 4 Unit Apartments | 0 (0.0%) | 0 (0.0%) |
| 5 to 9 Unit Apartments | 0 (0.0%) | 0 (0.0%) |
| 10 or more Apartments | 0 (0.0%) | 0 (0.0%) |
| Mobile Home / Other | 23 (100.0%) | 0 (0.0%) |
| Total | 139 (100.0%) | 0 (0.0%) |
Housing Structures by Number of Rooms in Bass Lake
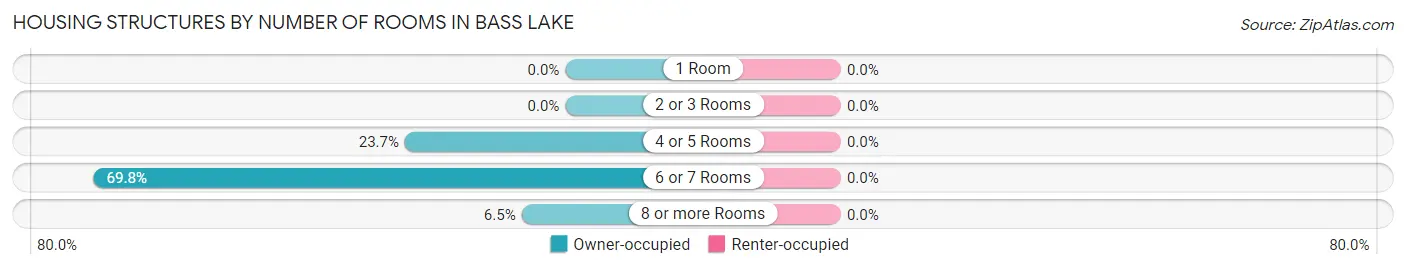
| Number of Rooms | Owner-occupied | Renter-occupied |
| 1 Room | 0 (0.0%) | 0 (0.0%) |
| 2 or 3 Rooms | 0 (0.0%) | 0 (0.0%) |
| 4 or 5 Rooms | 33 (23.7%) | 0 (0.0%) |
| 6 or 7 Rooms | 97 (69.8%) | 0 (0.0%) |
| 8 or more Rooms | 9 (6.5%) | 0 (0.0%) |
| Total | 139 (100.0%) | 0 (0.0%) |
Housing Structure by Heating Type in Bass Lake
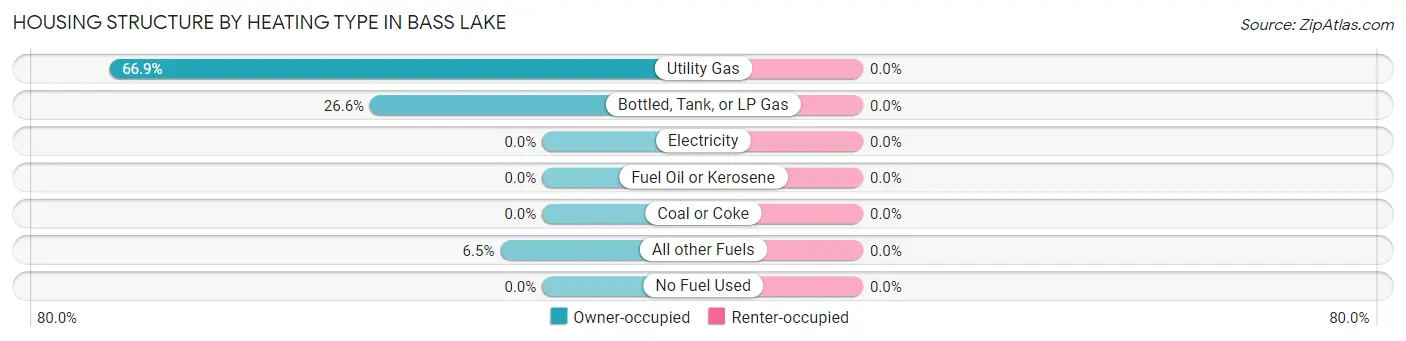
| Heating Type | Owner-occupied | Renter-occupied |
| Utility Gas | 93 (66.9%) | 0 (0.0%) |
| Bottled, Tank, or LP Gas | 37 (26.6%) | 0 (0.0%) |
| Electricity | 0 (0.0%) | 0 (0.0%) |
| Fuel Oil or Kerosene | 0 (0.0%) | 0 (0.0%) |
| Coal or Coke | 0 (0.0%) | 0 (0.0%) |
| All other Fuels | 9 (6.5%) | 0 (0.0%) |
| No Fuel Used | 0 (0.0%) | 0 (0.0%) |
| Total | 139 (100.0%) | 0 (0.0%) |
Household Vehicle Usage in Bass Lake
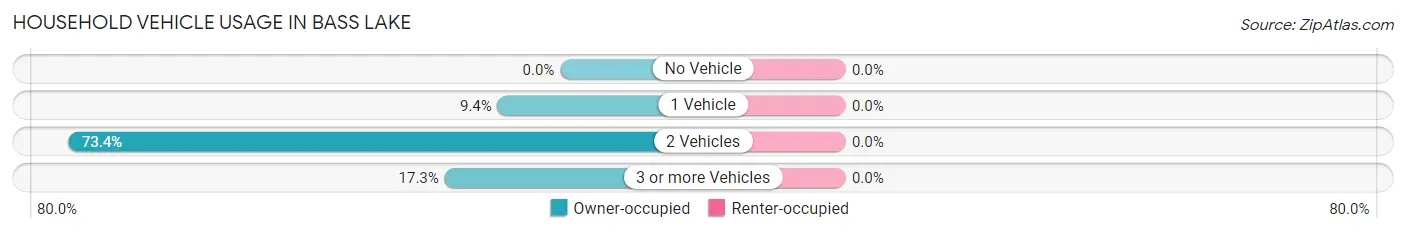
| Vehicles per Household | Owner-occupied | Renter-occupied |
| No Vehicle | 0 (0.0%) | 0 (0.0%) |
| 1 Vehicle | 13 (9.3%) | 0 (0.0%) |
| 2 Vehicles | 102 (73.4%) | 0 (0.0%) |
| 3 or more Vehicles | 24 (17.3%) | 0 (0.0%) |
| Total | 139 (100.0%) | 0 (0.0%) |
Real Estate & Mortgages in Bass Lake
Real Estate and Mortgage Overview in Bass Lake
| Characteristic | Without Mortgage | With Mortgage |
| Housing Units | 47 | 92 |
| Median Property Value | - | - |
| Median Household Income | $120,139 | $55 |
| Monthly Housing Costs | $1,006 | $56 |
| Real Estate Taxes | - | - |
Property Value by Mortgage Status in Bass Lake
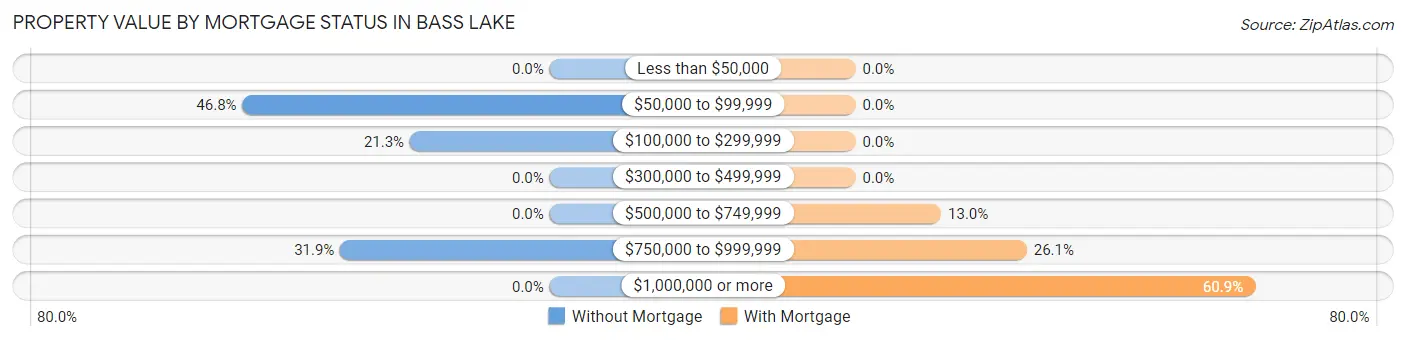
| Property Value | Without Mortgage | With Mortgage |
| Less than $50,000 | 0 (0.0%) | 0 (0.0%) |
| $50,000 to $99,999 | 22 (46.8%) | 0 (0.0%) |
| $100,000 to $299,999 | 10 (21.3%) | 0 (0.0%) |
| $300,000 to $499,999 | 0 (0.0%) | 0 (0.0%) |
| $500,000 to $749,999 | 0 (0.0%) | 12 (13.0%) |
| $750,000 to $999,999 | 15 (31.9%) | 24 (26.1%) |
| $1,000,000 or more | 0 (0.0%) | 56 (60.9%) |
| Total | 47 (100.0%) | 92 (100.0%) |
Household Income by Mortgage Status in Bass Lake
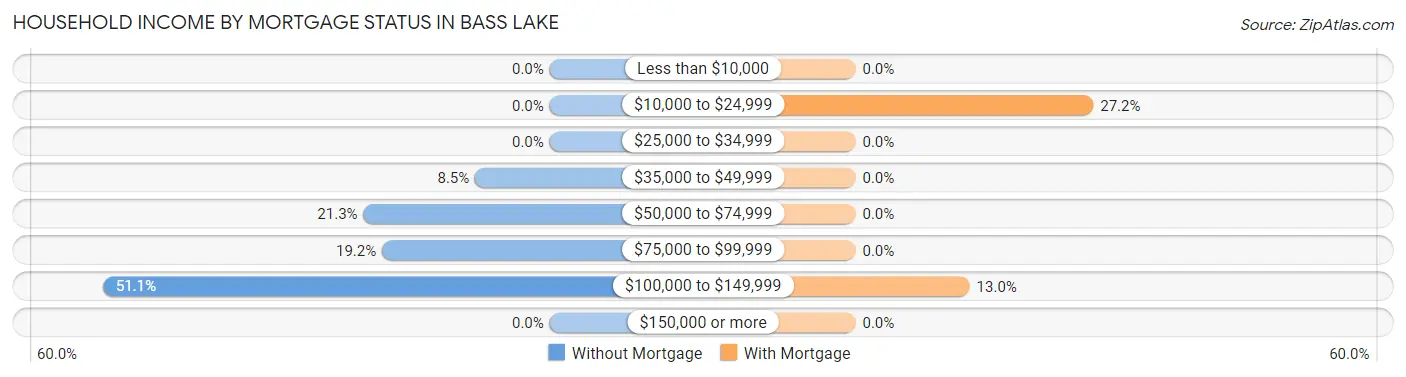
| Household Income | Without Mortgage | With Mortgage |
| Less than $10,000 | 0 (0.0%) | 0 (0.0%) |
| $10,000 to $24,999 | 0 (0.0%) | 25 (27.2%) |
| $25,000 to $34,999 | 0 (0.0%) | 0 (0.0%) |
| $35,000 to $49,999 | 4 (8.5%) | 0 (0.0%) |
| $50,000 to $74,999 | 10 (21.3%) | 0 (0.0%) |
| $75,000 to $99,999 | 9 (19.2%) | 0 (0.0%) |
| $100,000 to $149,999 | 24 (51.1%) | 12 (13.0%) |
| $150,000 or more | 0 (0.0%) | 0 (0.0%) |
| Total | 47 (100.0%) | 92 (100.0%) |
Property Value to Household Income Ratio in Bass Lake
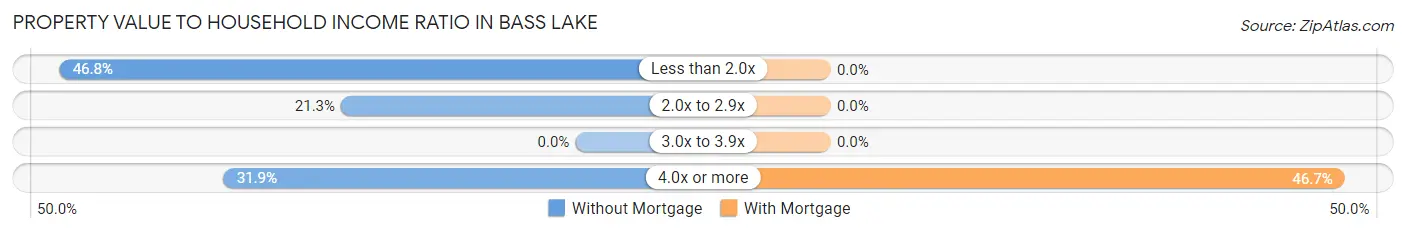
| Value-to-Income Ratio | Without Mortgage | With Mortgage |
| Less than 2.0x | 22 (46.8%) | 0 (0.0%) |
| 2.0x to 2.9x | 10 (21.3%) | 0 (0.0%) |
| 3.0x to 3.9x | 0 (0.0%) | 0 (0.0%) |
| 4.0x or more | 15 (31.9%) | 43 (46.7%) |
| Total | 47 (100.0%) | 92 (100.0%) |
Real Estate Taxes by Mortgage Status in Bass Lake
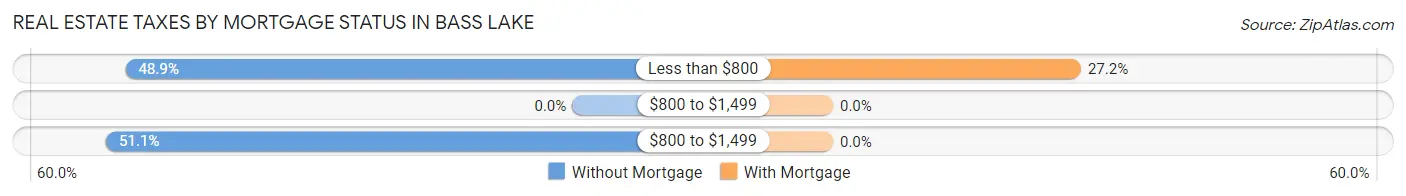
| Property Taxes | Without Mortgage | With Mortgage |
| Less than $800 | 23 (48.9%) | 25 (27.2%) |
| $800 to $1,499 | 0 (0.0%) | 0 (0.0%) |
| $800 to $1,499 | 24 (51.1%) | 0 (0.0%) |
| Total | 47 (100.0%) | 92 (100.0%) |
Health & Disability in Bass Lake
Health Insurance Coverage by Age in Bass Lake
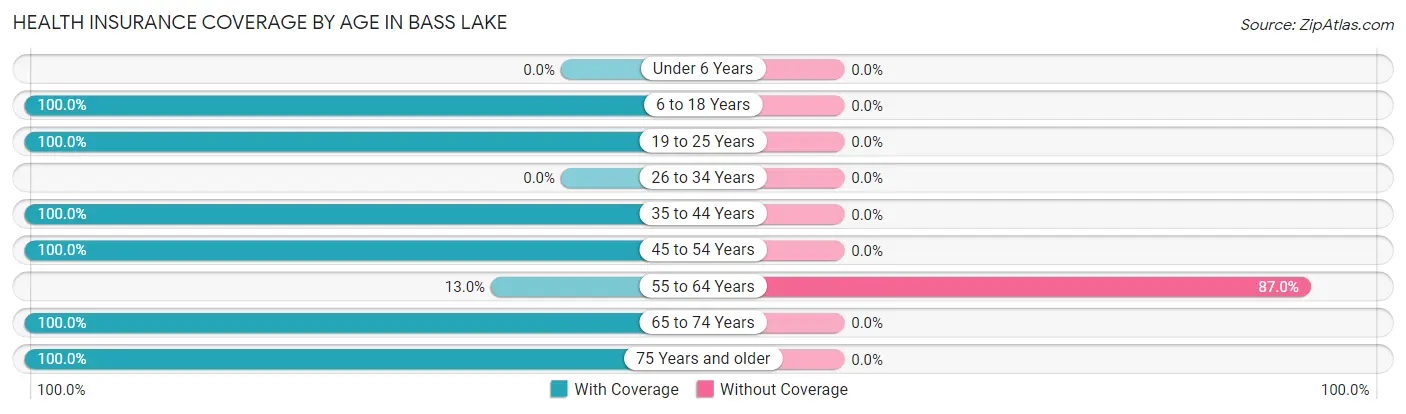
| Age Bracket | With Coverage | Without Coverage |
| Under 6 Years | 0 (0.0%) | 0 (0.0%) |
| 6 to 18 Years | 32 (100.0%) | 0 (0.0%) |
| 19 to 25 Years | 19 (100.0%) | 0 (0.0%) |
| 26 to 34 Years | 0 (0.0%) | 0 (0.0%) |
| 35 to 44 Years | 26 (100.0%) | 0 (0.0%) |
| 45 to 54 Years | 56 (100.0%) | 0 (0.0%) |
| 55 to 64 Years | 6 (13.0%) | 40 (87.0%) |
| 65 to 74 Years | 85 (100.0%) | 0 (0.0%) |
| 75 Years and older | 54 (100.0%) | 0 (0.0%) |
| Total | 278 (87.4%) | 40 (12.6%) |
Health Insurance Coverage by Citizenship Status in Bass Lake
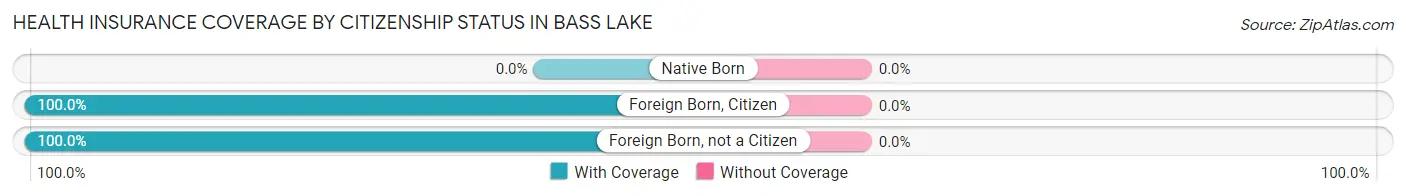
| Citizenship Status | With Coverage | Without Coverage |
| Native Born | 0 (0.0%) | 0 (0.0%) |
| Foreign Born, Citizen | 32 (100.0%) | 0 (0.0%) |
| Foreign Born, not a Citizen | 19 (100.0%) | 0 (0.0%) |
Health Insurance Coverage by Household Income in Bass Lake
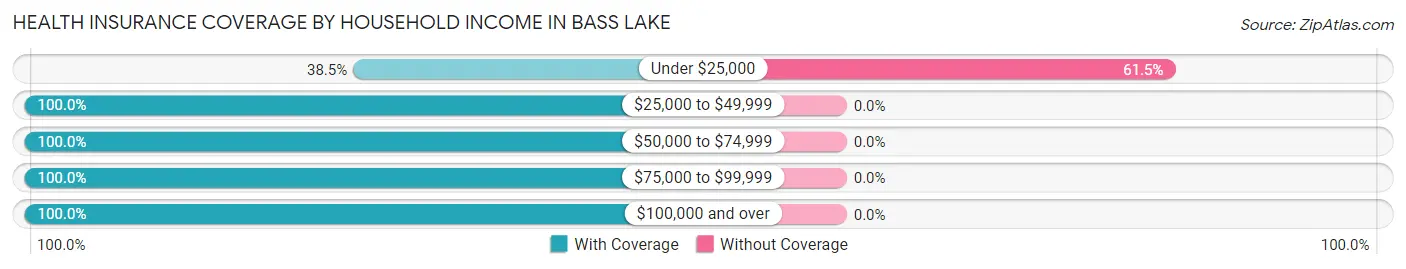
| Household Income | With Coverage | Without Coverage |
| Under $25,000 | 25 (38.5%) | 40 (61.5%) |
| $25,000 to $49,999 | 10 (100.0%) | 0 (0.0%) |
| $50,000 to $74,999 | 19 (100.0%) | 0 (0.0%) |
| $75,000 to $99,999 | 40 (100.0%) | 0 (0.0%) |
| $100,000 and over | 184 (100.0%) | 0 (0.0%) |
Public vs Private Health Insurance Coverage by Age in Bass Lake
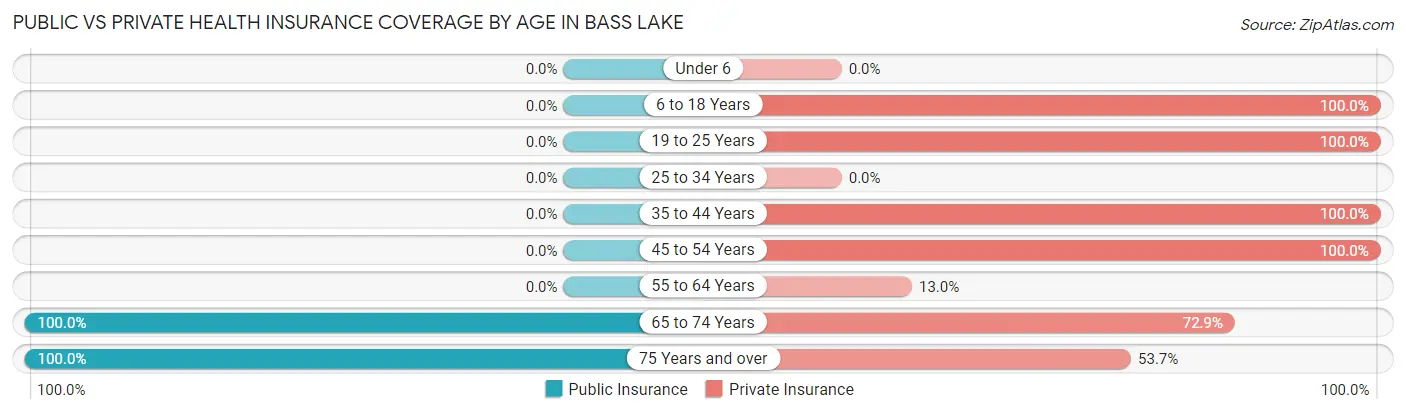
| Age Bracket | Public Insurance | Private Insurance |
| Under 6 | 0 (0.0%) | 0 (0.0%) |
| 6 to 18 Years | 0 (0.0%) | 32 (100.0%) |
| 19 to 25 Years | 0 (0.0%) | 19 (100.0%) |
| 25 to 34 Years | 0 (0.0%) | 0 (0.0%) |
| 35 to 44 Years | 0 (0.0%) | 26 (100.0%) |
| 45 to 54 Years | 0 (0.0%) | 56 (100.0%) |
| 55 to 64 Years | 0 (0.0%) | 6 (13.0%) |
| 65 to 74 Years | 85 (100.0%) | 62 (72.9%) |
| 75 Years and over | 54 (100.0%) | 29 (53.7%) |
| Total | 139 (43.7%) | 230 (72.3%) |
Disability Status by Sex by Age in Bass Lake
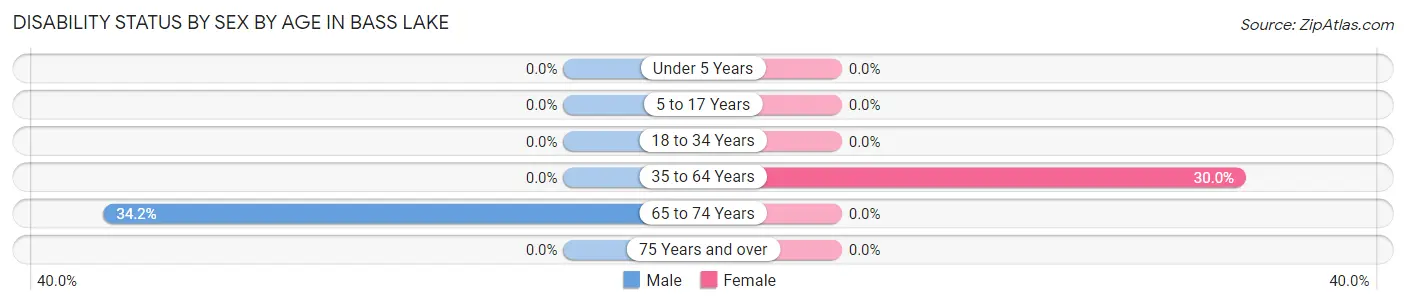
| Age Bracket | Male | Female |
| Under 5 Years | 0 (0.0%) | 0 (0.0%) |
| 5 to 17 Years | 0 (0.0%) | 0 (0.0%) |
| 18 to 34 Years | 0 (0.0%) | 0 (0.0%) |
| 35 to 64 Years | 0 (0.0%) | 6 (30.0%) |
| 65 to 74 Years | 14 (34.2%) | 0 (0.0%) |
| 75 Years and over | 0 (0.0%) | 0 (0.0%) |
Disability Class by Sex by Age in Bass Lake
Disability Class: Hearing Difficulty
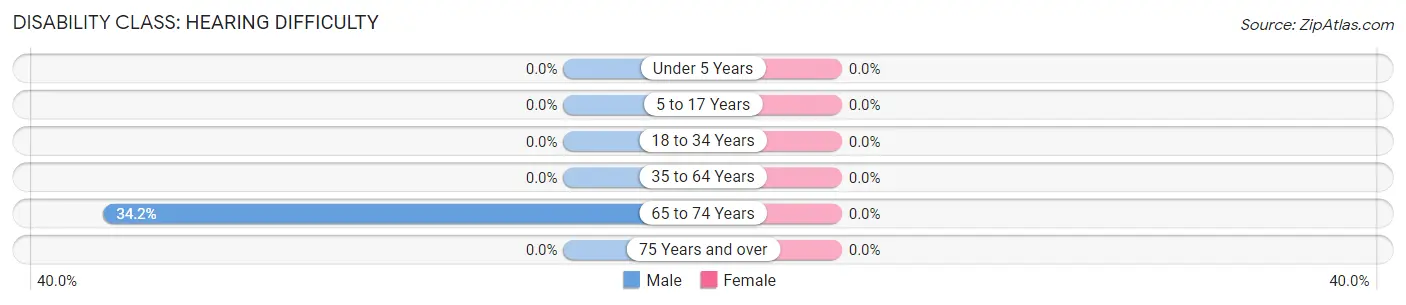
| Age Bracket | Male | Female |
| Under 5 Years | 0 (0.0%) | 0 (0.0%) |
| 5 to 17 Years | 0 (0.0%) | 0 (0.0%) |
| 18 to 34 Years | 0 (0.0%) | 0 (0.0%) |
| 35 to 64 Years | 0 (0.0%) | 0 (0.0%) |
| 65 to 74 Years | 14 (34.2%) | 0 (0.0%) |
| 75 Years and over | 0 (0.0%) | 0 (0.0%) |
Disability Class: Vision Difficulty
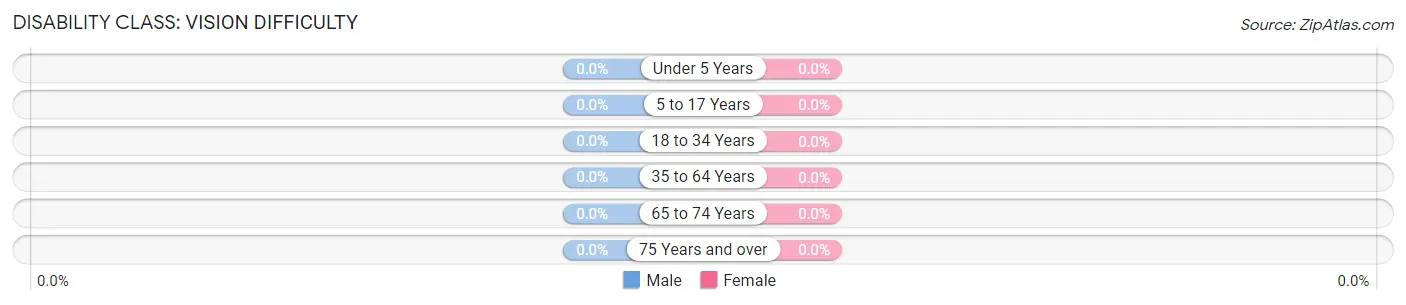
| Age Bracket | Male | Female |
| Under 5 Years | 0 (0.0%) | 0 (0.0%) |
| 5 to 17 Years | 0 (0.0%) | 0 (0.0%) |
| 18 to 34 Years | 0 (0.0%) | 0 (0.0%) |
| 35 to 64 Years | 0 (0.0%) | 0 (0.0%) |
| 65 to 74 Years | 0 (0.0%) | 0 (0.0%) |
| 75 Years and over | 0 (0.0%) | 0 (0.0%) |
Disability Class: Cognitive Difficulty
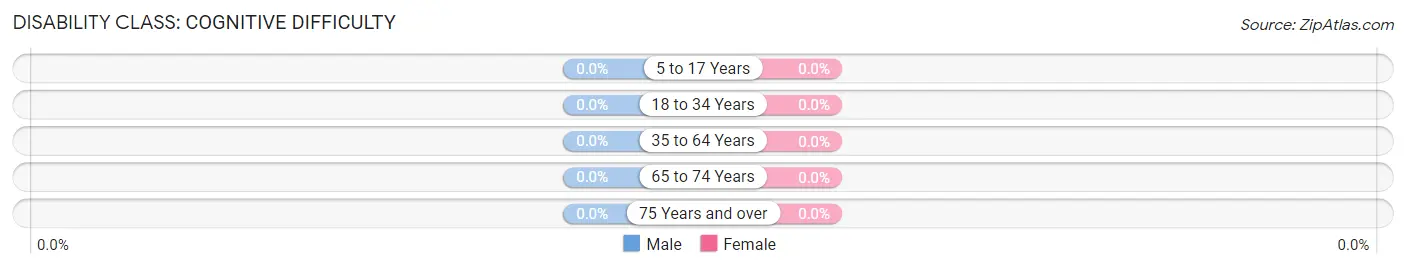
| Age Bracket | Male | Female |
| 5 to 17 Years | 0 (0.0%) | 0 (0.0%) |
| 18 to 34 Years | 0 (0.0%) | 0 (0.0%) |
| 35 to 64 Years | 0 (0.0%) | 0 (0.0%) |
| 65 to 74 Years | 0 (0.0%) | 0 (0.0%) |
| 75 Years and over | 0 (0.0%) | 0 (0.0%) |
Disability Class: Ambulatory Difficulty
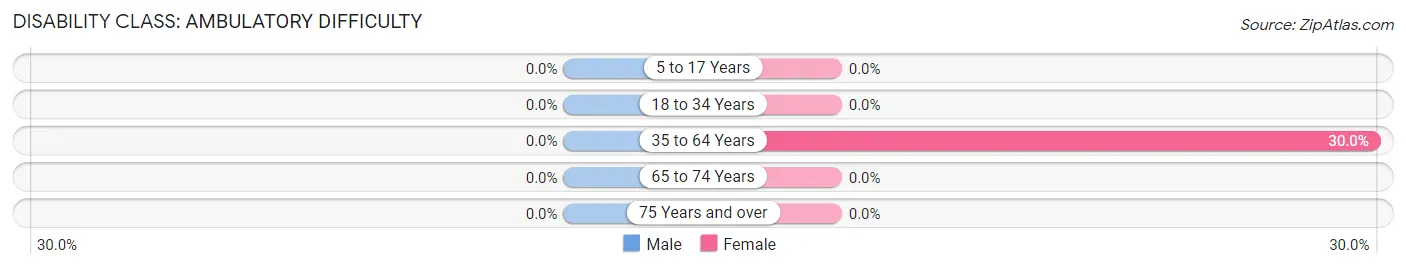
| Age Bracket | Male | Female |
| 5 to 17 Years | 0 (0.0%) | 0 (0.0%) |
| 18 to 34 Years | 0 (0.0%) | 0 (0.0%) |
| 35 to 64 Years | 0 (0.0%) | 6 (30.0%) |
| 65 to 74 Years | 0 (0.0%) | 0 (0.0%) |
| 75 Years and over | 0 (0.0%) | 0 (0.0%) |
Disability Class: Self-Care Difficulty
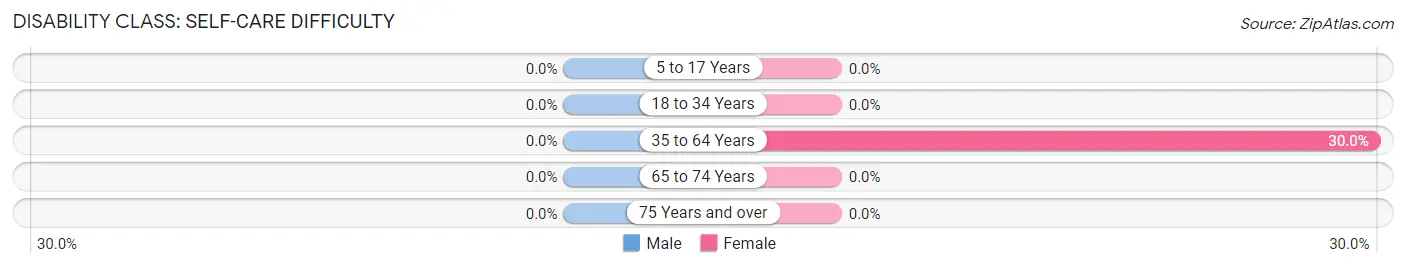
| Age Bracket | Male | Female |
| 5 to 17 Years | 0 (0.0%) | 0 (0.0%) |
| 18 to 34 Years | 0 (0.0%) | 0 (0.0%) |
| 35 to 64 Years | 0 (0.0%) | 6 (30.0%) |
| 65 to 74 Years | 0 (0.0%) | 0 (0.0%) |
| 75 Years and over | 0 (0.0%) | 0 (0.0%) |
Technology Access in Bass Lake
Computing Device Access in Bass Lake
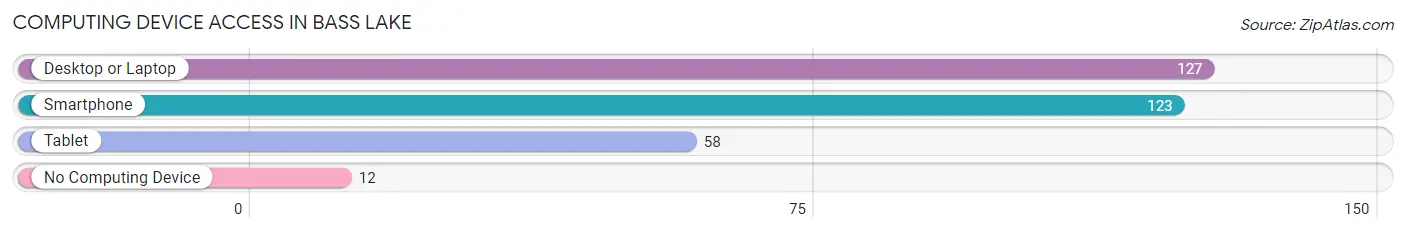
| Device Type | # Households | % Households |
| Desktop or Laptop | 127 | 91.4% |
| Smartphone | 123 | 88.5% |
| Tablet | 58 | 41.7% |
| No Computing Device | 12 | 8.6% |
| Total | 139 | 100.0% |
Internet Access in Bass Lake
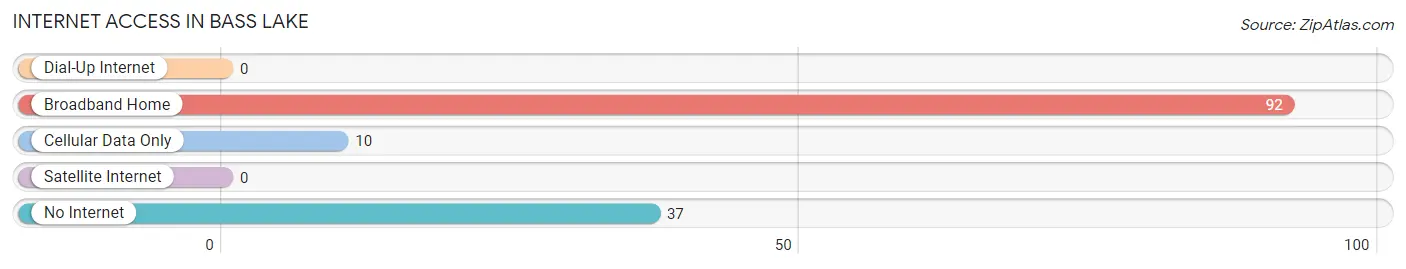
| Internet Type | # Households | % Households |
| Dial-Up Internet | 0 | 0.0% |
| Broadband Home | 92 | 66.2% |
| Cellular Data Only | 10 | 7.2% |
| Satellite Internet | 0 | 0.0% |
| No Internet | 37 | 26.6% |
| Total | 139 | 100.0% |
Bass Lake Summary
Bass Lake is a small, unincorporated community located in Madera County, California. It is situated in the Sierra Nevada Mountains, approximately 25 miles northeast of Fresno. The lake itself is a natural lake, formed by a glacier during the last ice age. It is a popular destination for fishing, camping, and other outdoor activities.
History
The area around Bass Lake has been inhabited for thousands of years. The first known inhabitants were the Mono Indians, who lived in the area for centuries before the arrival of Europeans. The first Europeans to explore the area were Spanish missionaries, who arrived in the late 1700s. They named the lake after a local chief, Chief Bass.
In the late 1800s, the area around Bass Lake was settled by ranchers and farmers. The lake was used for irrigation and to provide water for the local farms. In the early 1900s, the area became a popular tourist destination, with the first resort being built in 1912.
Geography
Bass Lake is located in the Sierra Nevada Mountains, at an elevation of 3,400 feet. The lake is approximately three miles long and one mile wide. It is surrounded by pine and oak forests, and is fed by several small streams. The lake is a popular destination for fishing, camping, and other outdoor activities.
Economy
The economy of Bass Lake is largely based on tourism. The lake is a popular destination for fishing, camping, and other outdoor activities. There are several resorts and lodges located around the lake, as well as restaurants and other businesses catering to tourists. The area is also home to several wineries, which produce a variety of wines.
Demographics
As of the 2010 census, the population of Bass Lake was 1,269. The racial makeup of the town was 94.3% White, 0.7% African American, 0.3% Native American, 0.7% Asian, 0.1% Pacific Islander, 1.2% from other races, and 2.1% from two or more races. The median household income was $45,000, and the median family income was $50,000. The per capita income was $20,000.
Conclusion
Bass Lake is a small, unincorporated community located in Madera County, California. It is situated in the Sierra Nevada Mountains, approximately 25 miles northeast of Fresno. The lake itself is a natural lake, formed by a glacier during the last ice age. It is a popular destination for fishing, camping, and other outdoor activities. The economy of Bass Lake is largely based on tourism, and the population of the town was 1,269 as of the 2010 census.
Common Questions
What is Per Capita Income in Bass Lake?
Per Capita income in Bass Lake is $69,702.
What is the Median Family Income in Bass Lake?
Median Family Income in Bass Lake is $145,833.
What is the Median Household income in Bass Lake?
Median Household Income in Bass Lake is $145,083.
What is Inequality or Gini Index in Bass Lake?
Inequality or Gini Index in Bass Lake is 0.49.
What is the Total Population of Bass Lake?
Total Population of Bass Lake is 318.
What is the Total Male Population of Bass Lake?
Total Male Population of Bass Lake is 202.
What is the Total Female Population of Bass Lake?
Total Female Population of Bass Lake is 116.
What is the Ratio of Males per 100 Females in Bass Lake?
There are 174.14 Males per 100 Females in Bass Lake.
What is the Ratio of Females per 100 Males in Bass Lake?
There are 57.43 Females per 100 Males in Bass Lake.
What is the Median Population Age in Bass Lake?
Median Population Age in Bass Lake is 64.5 Years.
What is the Average Family Size in Bass Lake
Average Family Size in Bass Lake is 2.4 People.
What is the Average Household Size in Bass Lake
Average Household Size in Bass Lake is 2.3 People.
How Large is the Labor Force in Bass Lake?
There are 111 People in the Labor Forcein in Bass Lake.
What is the Percentage of People in the Labor Force in Bass Lake?
38.8% of People are in the Labor Force in Bass Lake.