Big Creek, CA Map & Demographics
Big Creek Map
Big Creek Overview
$28,591
PER CAPITA INCOME
0.45
INEQUALITY / GINI INDEX
97
TOTAL POPULATION
58
MALE POPULATION
39
FEMALE POPULATION
148.72
MALES / 100 FEMALES
67.24
FEMALES / 100 MALES
47.7
MEDIAN AGE
3.6
AVG FAMILY SIZE
2.8
AVG HOUSEHOLD SIZE
27
LABOR FORCE [ PEOPLE ]
44.3%
PERCENT IN LABOR FORCE
14.8%
UNEMPLOYMENT RATE
Big Creek Zip Codes
Big Creek Area Codes
Income in Big Creek
Income Overview in Big Creek
| Characteristic | Number | Measure |
| Per Capita Income | 97 | $28,591 |
| Median Family Income | 24 | $0 |
| Mean Family Income | 24 | $60,138 |
| Median Household Income | 35 | $0 |
| Mean Household Income | 35 | $79,269 |
| Income Deficit | 24 | $0 |
| Wage / Income Gap (%) | 97 | 0.00% |
| Wage / Income Gap ($) | 97 | 100.00¢ per $1 |
| Gini / Inequality Index | 97 | 0.45 |
Earnings by Sex in Big Creek
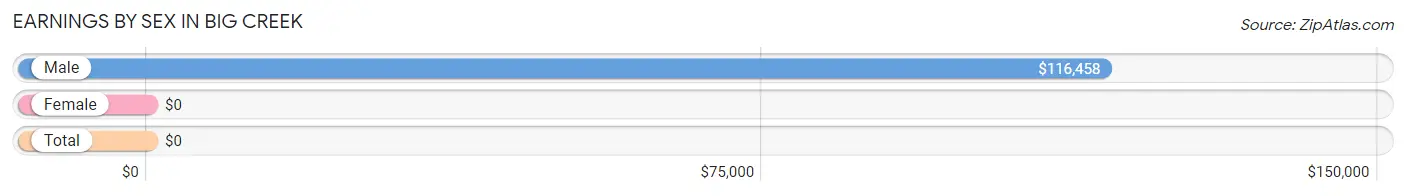
| Sex | Number | Average Earnings |
| Male | 15 (65.2%) | $116,458 |
| Female | 8 (34.8%) | $0 |
| Total | 23 (100.0%) | $0 |
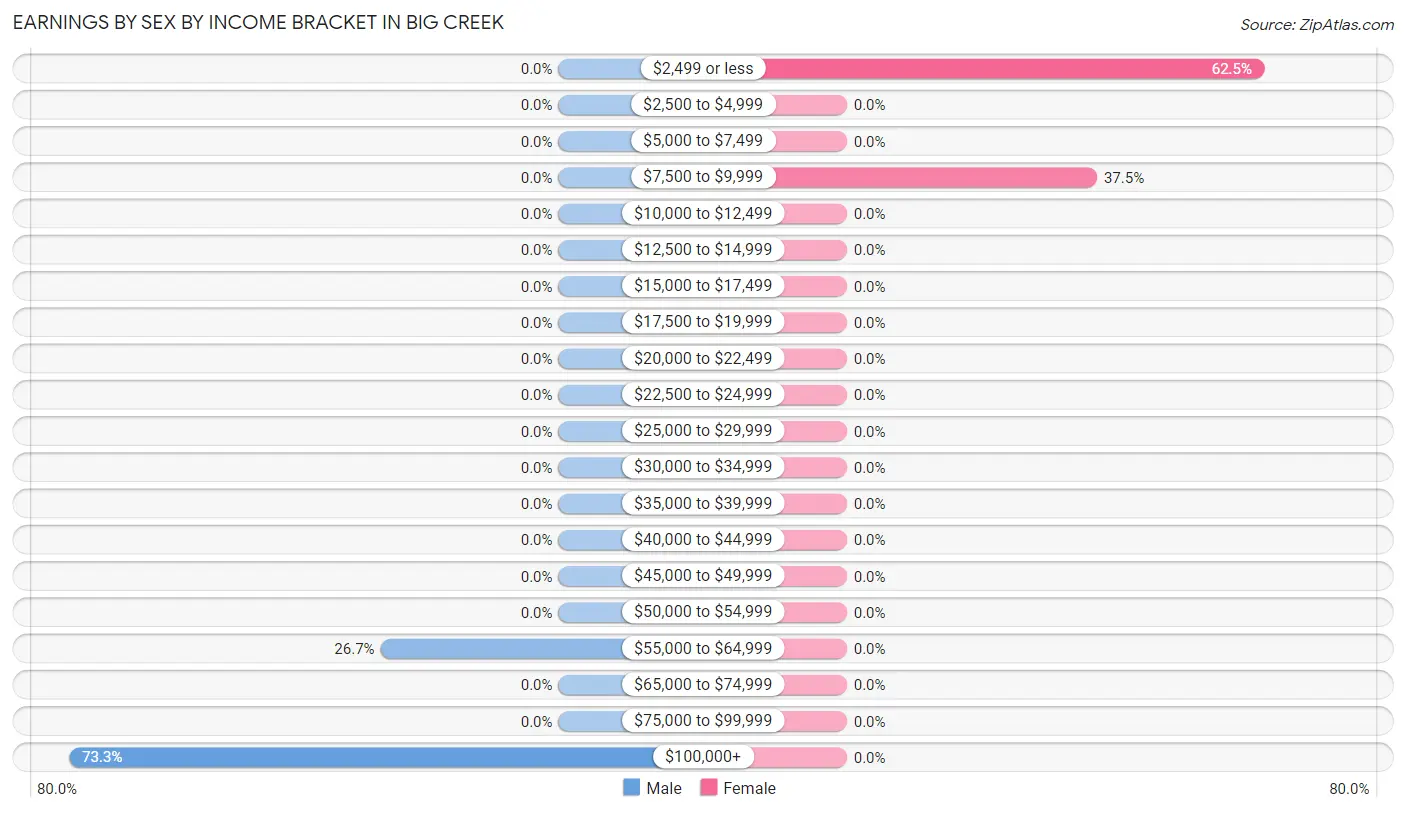
Earnings by Sex by Income Bracket in Big Creek
The most common earnings brackets in Big Creek are $100,000+ for men (11 | 73.3%) and $2,499 or less for women (5 | 62.5%).
| Income | Male | Female |
| $2,499 or less | 0 (0.0%) | 5 (62.5%) |
| $2,500 to $4,999 | 0 (0.0%) | 0 (0.0%) |
| $5,000 to $7,499 | 0 (0.0%) | 0 (0.0%) |
| $7,500 to $9,999 | 0 (0.0%) | 3 (37.5%) |
| $10,000 to $12,499 | 0 (0.0%) | 0 (0.0%) |
| $12,500 to $14,999 | 0 (0.0%) | 0 (0.0%) |
| $15,000 to $17,499 | 0 (0.0%) | 0 (0.0%) |
| $17,500 to $19,999 | 0 (0.0%) | 0 (0.0%) |
| $20,000 to $22,499 | 0 (0.0%) | 0 (0.0%) |
| $22,500 to $24,999 | 0 (0.0%) | 0 (0.0%) |
| $25,000 to $29,999 | 0 (0.0%) | 0 (0.0%) |
| $30,000 to $34,999 | 0 (0.0%) | 0 (0.0%) |
| $35,000 to $39,999 | 0 (0.0%) | 0 (0.0%) |
| $40,000 to $44,999 | 0 (0.0%) | 0 (0.0%) |
| $45,000 to $49,999 | 0 (0.0%) | 0 (0.0%) |
| $50,000 to $54,999 | 0 (0.0%) | 0 (0.0%) |
| $55,000 to $64,999 | 4 (26.7%) | 0 (0.0%) |
| $65,000 to $74,999 | 0 (0.0%) | 0 (0.0%) |
| $75,000 to $99,999 | 0 (0.0%) | 0 (0.0%) |
| $100,000+ | 11 (73.3%) | 0 (0.0%) |
| Total | 15 (100.0%) | 8 (100.0%) |
Earnings by Sex by Educational Attainment in Big Creek
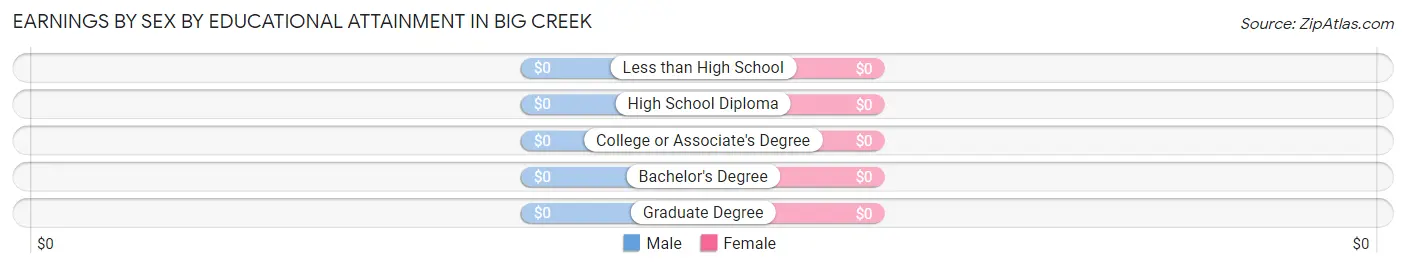
| Educational Attainment | Male Income | Female Income |
| Less than High School | - | - |
| High School Diploma | - | - |
| College or Associate's Degree | - | - |
| Bachelor's Degree | - | - |
| Graduate Degree | - | - |
| Total | $116,458 | $0 |
Family Income in Big Creek
Family Income Brackets in Big Creek
According to the Big Creek family income data, there are 11 families falling into the less than $10,000 income range, which is the most common income bracket and makes up 45.8% of all families.
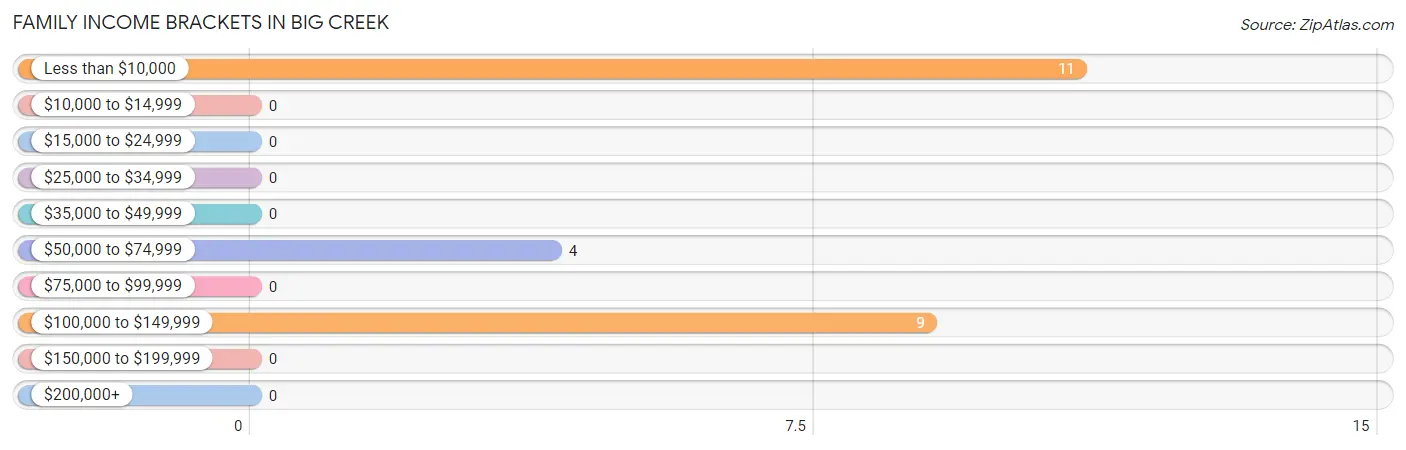
| Income Bracket | # Families | % Families |
| Less than $10,000 | 11 | 45.8% |
| $10,000 to $14,999 | 0 | 0.0% |
| $15,000 to $24,999 | 0 | 0.0% |
| $25,000 to $34,999 | 0 | 0.0% |
| $35,000 to $49,999 | 0 | 0.0% |
| $50,000 to $74,999 | 4 | 16.7% |
| $75,000 to $99,999 | 0 | 0.0% |
| $100,000 to $149,999 | 9 | 37.5% |
| $150,000 to $199,999 | 0 | 0.0% |
| $200,000+ | 0 | 0.0% |
Family Income by Famaliy Size in Big Creek
| Income Bracket | # Families | Median Income |
| 2-Person Families | 11 (45.8%) | $0 |
| 3-Person Families | 4 (16.7%) | $0 |
| 4-Person Families | 0 (0.0%) | $0 |
| 5-Person Families | 3 (12.5%) | $0 |
| 6-Person Families | 6 (25.0%) | $0 |
| 7+ Person Families | 0 (0.0%) | $0 |
| Total | 24 (100.0%) | $0 |
Family Income by Number of Earners in Big Creek
| Number of Earners | # Families | Median Income |
| No Earners | 11 (45.8%) | $0 |
| 1 Earner | 4 (16.7%) | $0 |
| 2 Earners | 9 (37.5%) | $0 |
| 3+ Earners | 0 (0.0%) | $0 |
| Total | 24 (100.0%) | $0 |
Household Income in Big Creek
Household Income Brackets in Big Creek
With 11 households falling in the category, the less than $10,000 income range is the most frequent in Big Creek, accounting for 31.4% of all households.
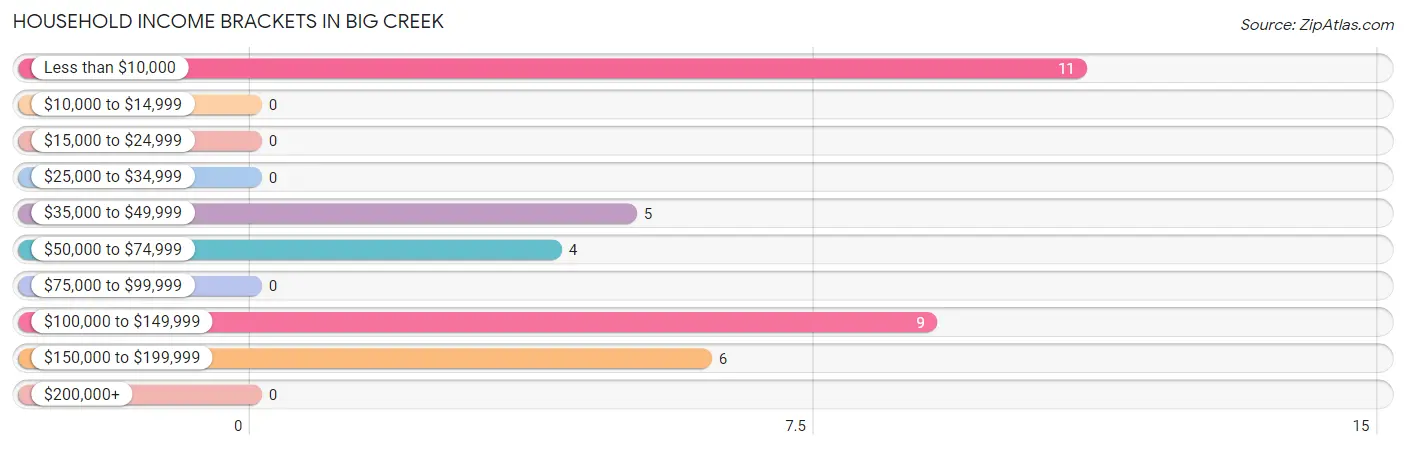
| Income Bracket | # Households | % Households |
| Less than $10,000 | 11 | 31.4% |
| $10,000 to $14,999 | 0 | 0.0% |
| $15,000 to $24,999 | 0 | 0.0% |
| $25,000 to $34,999 | 0 | 0.0% |
| $35,000 to $49,999 | 5 | 14.3% |
| $50,000 to $74,999 | 4 | 11.4% |
| $75,000 to $99,999 | 0 | 0.0% |
| $100,000 to $149,999 | 9 | 25.7% |
| $150,000 to $199,999 | 6 | 17.1% |
| $200,000+ | 0 | 0.0% |
Household Income by Householder Age in Big Creek
| Income Bracket | # Households | Median Income |
| 15 to 24 Years | 0 (0.0%) | $0 |
| 25 to 44 Years | 3 (8.6%) | $0 |
| 45 to 64 Years | 17 (48.6%) | $0 |
| 65+ Years | 15 (42.9%) | $0 |
| Total | 35 (100.0%) | $0 |
Poverty in Big Creek
Income Below Poverty by Sex and Age in Big Creek
With 19.0% poverty level for males and 28.2% for females among the residents of Big Creek, 65 to 74 year old males and 55 to 64 year old females are the most vulnerable to poverty, with 11 males (64.7%) and 11 females (73.3%) in their respective age groups living below the poverty level.
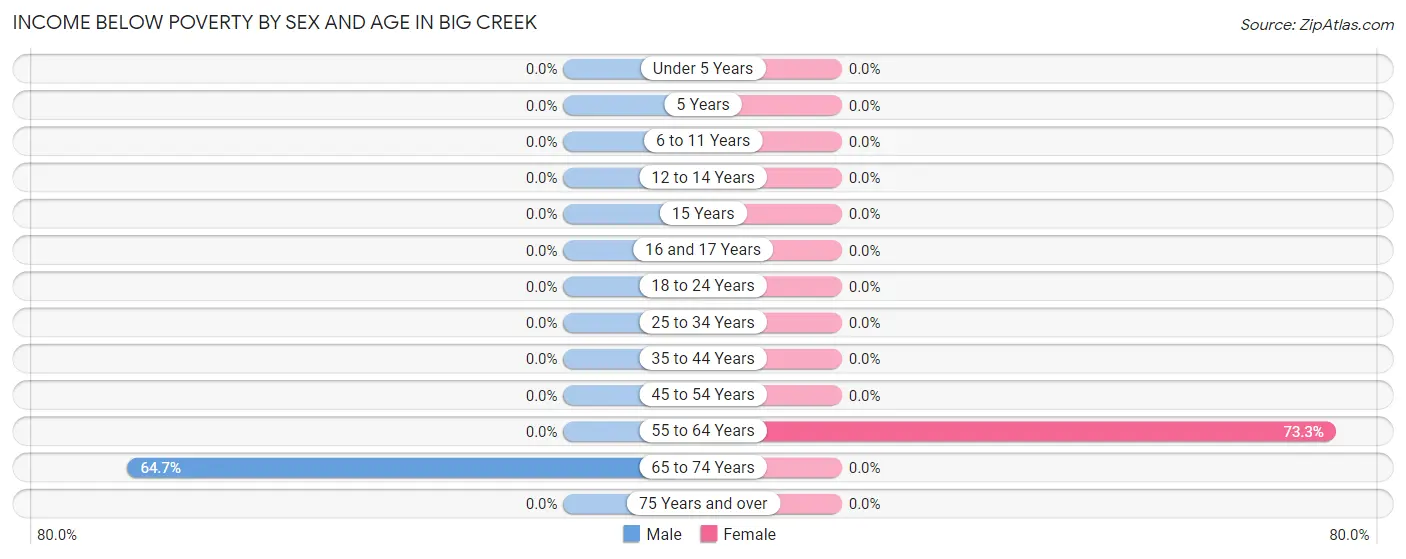
| Age Bracket | Male | Female |
| Under 5 Years | 0 (0.0%) | 0 (0.0%) |
| 5 Years | 0 (0.0%) | 0 (0.0%) |
| 6 to 11 Years | 0 (0.0%) | 0 (0.0%) |
| 12 to 14 Years | 0 (0.0%) | 0 (0.0%) |
| 15 Years | 0 (0.0%) | 0 (0.0%) |
| 16 and 17 Years | 0 (0.0%) | 0 (0.0%) |
| 18 to 24 Years | 0 (0.0%) | 0 (0.0%) |
| 25 to 34 Years | 0 (0.0%) | 0 (0.0%) |
| 35 to 44 Years | 0 (0.0%) | 0 (0.0%) |
| 45 to 54 Years | 0 (0.0%) | 0 (0.0%) |
| 55 to 64 Years | 0 (0.0%) | 11 (73.3%) |
| 65 to 74 Years | 11 (64.7%) | 0 (0.0%) |
| 75 Years and over | 0 (0.0%) | 0 (0.0%) |
| Total | 11 (19.0%) | 11 (28.2%) |
Income Above Poverty by Sex and Age in Big Creek
According to the poverty statistics in Big Creek, males aged 5 years and females aged 12 to 14 years are the age groups that are most secure financially, with 100.0% of males and 100.0% of females in these age groups living above the poverty line.
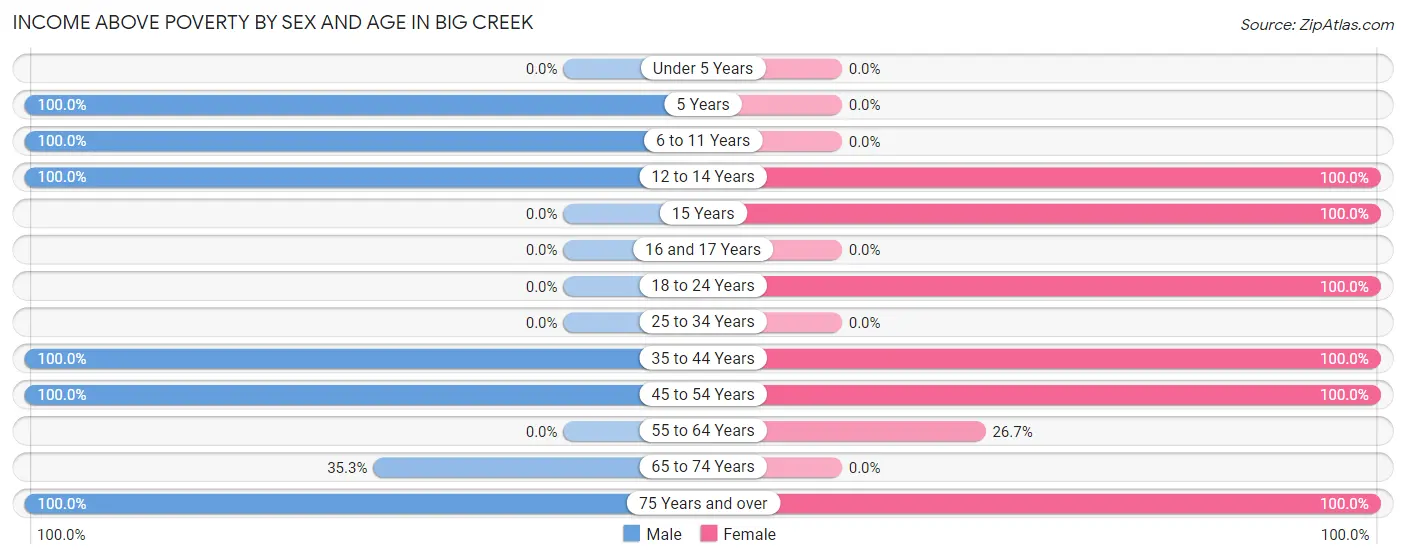
| Age Bracket | Male | Female |
| Under 5 Years | 0 (0.0%) | 0 (0.0%) |
| 5 Years | 6 (100.0%) | 0 (0.0%) |
| 6 to 11 Years | 16 (100.0%) | 0 (0.0%) |
| 12 to 14 Years | 6 (100.0%) | 4 (100.0%) |
| 15 Years | 0 (0.0%) | 4 (100.0%) |
| 16 and 17 Years | 0 (0.0%) | 0 (0.0%) |
| 18 to 24 Years | 0 (0.0%) | 3 (100.0%) |
| 25 to 34 Years | 0 (0.0%) | 0 (0.0%) |
| 35 to 44 Years | 3 (100.0%) | 3 (100.0%) |
| 45 to 54 Years | 6 (100.0%) | 5 (100.0%) |
| 55 to 64 Years | 0 (0.0%) | 4 (26.7%) |
| 65 to 74 Years | 6 (35.3%) | 0 (0.0%) |
| 75 Years and over | 4 (100.0%) | 5 (100.0%) |
| Total | 47 (81.0%) | 28 (71.8%) |
Income Below Poverty Among Married-Couple Families in Big Creek
The poverty statistics for married-couple families in Big Creek show that 45.8% or 11 of the total 24 families live below the poverty line. Families with no children have the highest poverty rate of 73.3%, comprising of 11 families. On the other hand, families with 3 or 4 children have the lowest poverty rate of 0.0%, which includes 0 families.
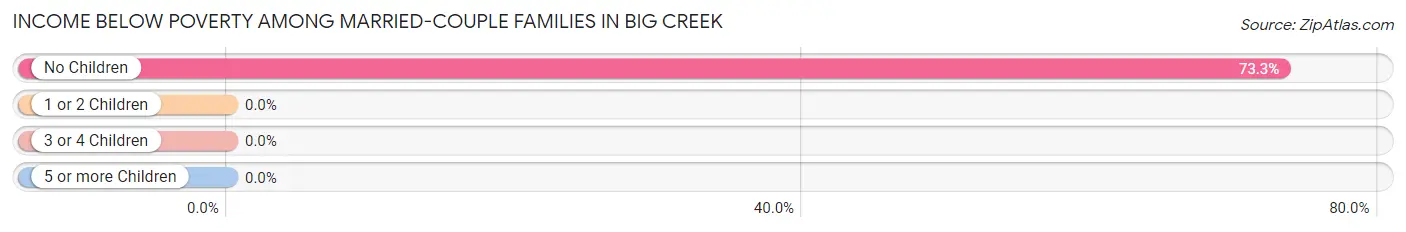
| Children | Above Poverty | Below Poverty |
| No Children | 4 (26.7%) | 11 (73.3%) |
| 1 or 2 Children | 0 (0.0%) | 0 (0.0%) |
| 3 or 4 Children | 9 (100.0%) | 0 (0.0%) |
| 5 or more Children | 0 (0.0%) | 0 (0.0%) |
| Total | 13 (54.2%) | 11 (45.8%) |
Income Below Poverty Among Single-Parent Households in Big Creek
| Children | Single Father | Single Mother |
| No Children | 0 (0.0%) | 0 (0.0%) |
| 1 or 2 Children | 0 (0.0%) | 0 (0.0%) |
| 3 or 4 Children | 0 (0.0%) | 0 (0.0%) |
| 5 or more Children | 0 (0.0%) | 0 (0.0%) |
| Total | 0 (0.0%) | 0 (0.0%) |
Income Below Poverty Among Married-Couple vs Single-Parent Households in Big Creek
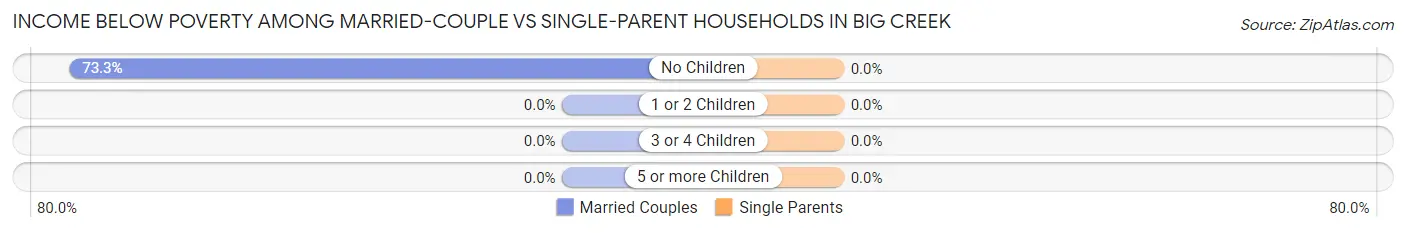
| Children | Married-Couple Families | Single-Parent Households |
| No Children | 11 (73.3%) | 0 (0.0%) |
| 1 or 2 Children | 0 (0.0%) | 0 (0.0%) |
| 3 or 4 Children | 0 (0.0%) | 0 (0.0%) |
| 5 or more Children | 0 (0.0%) | 0 (0.0%) |
| Total | 11 (45.8%) | 0 (0.0%) |
Race in Big Creek
The most populous races in Big Creek are White / Caucasian (86 | 88.7%), and Native / Alaskan (11 | 11.3%).
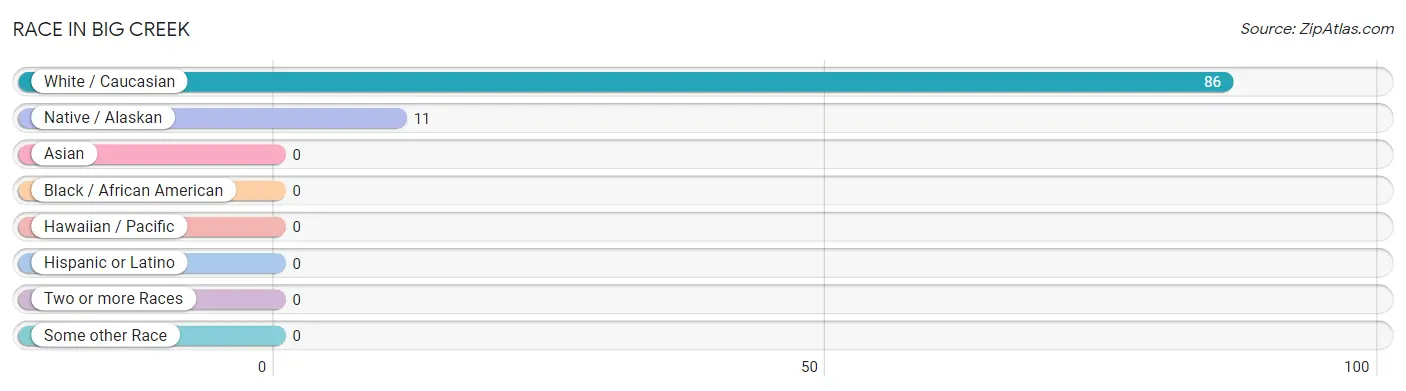
| Race | # Population | % Population |
| Asian | 0 | 0.0% |
| Black / African American | 0 | 0.0% |
| Hawaiian / Pacific | 0 | 0.0% |
| Hispanic or Latino | 0 | 0.0% |
| Native / Alaskan | 11 | 11.3% |
| White / Caucasian | 86 | 88.7% |
| Two or more Races | 0 | 0.0% |
| Some other Race | 0 | 0.0% |
| Total | 97 | 100.0% |
Ancestry in Big Creek
The most populous ancestries reported in Big Creek are German (68 | 70.1%), Irish (35 | 36.1%), French Canadian (14 | 14.4%), Polish (4 | 4.1%), and Russian (2 | 2.1%), together accounting for 126.8% of all Big Creek residents.
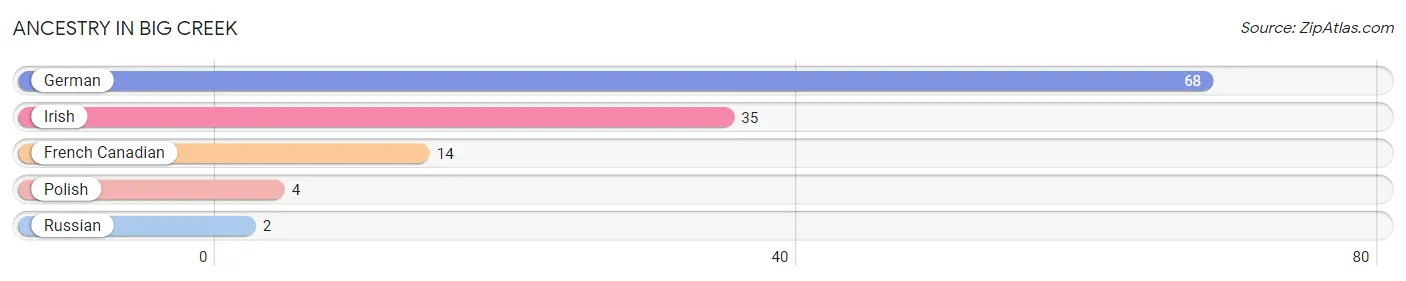
| Ancestry | # Population | % Population |
| French Canadian | 14 | 14.4% |
| German | 68 | 70.1% |
| Irish | 35 | 36.1% |
| Polish | 4 | 4.1% |
| Russian | 2 | 2.1% | View All 5 Rows |
Immigrants in Big Creek

| Immigration Origin | # Population | % Population | View All 0 Rows |
Sex and Age in Big Creek
Sex and Age in Big Creek
The most populous age groups in Big Creek are 65 to 69 Years (17 | 29.3%) for men and 60 to 64 Years (15 | 38.5%) for women.
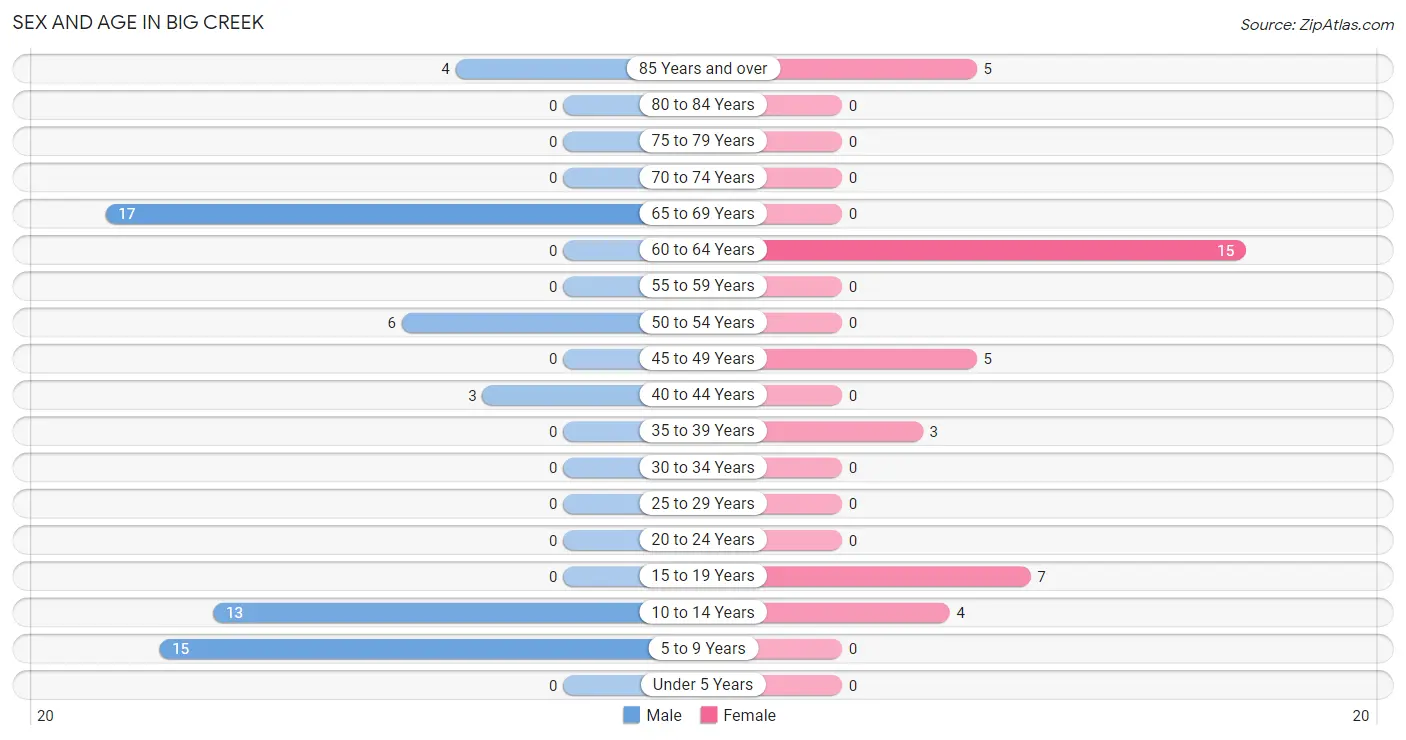
| Age Bracket | Male | Female |
| Under 5 Years | 0 (0.0%) | 0 (0.0%) |
| 5 to 9 Years | 15 (25.9%) | 0 (0.0%) |
| 10 to 14 Years | 13 (22.4%) | 4 (10.3%) |
| 15 to 19 Years | 0 (0.0%) | 7 (17.9%) |
| 20 to 24 Years | 0 (0.0%) | 0 (0.0%) |
| 25 to 29 Years | 0 (0.0%) | 0 (0.0%) |
| 30 to 34 Years | 0 (0.0%) | 0 (0.0%) |
| 35 to 39 Years | 0 (0.0%) | 3 (7.7%) |
| 40 to 44 Years | 3 (5.2%) | 0 (0.0%) |
| 45 to 49 Years | 0 (0.0%) | 5 (12.8%) |
| 50 to 54 Years | 6 (10.3%) | 0 (0.0%) |
| 55 to 59 Years | 0 (0.0%) | 0 (0.0%) |
| 60 to 64 Years | 0 (0.0%) | 15 (38.5%) |
| 65 to 69 Years | 17 (29.3%) | 0 (0.0%) |
| 70 to 74 Years | 0 (0.0%) | 0 (0.0%) |
| 75 to 79 Years | 0 (0.0%) | 0 (0.0%) |
| 80 to 84 Years | 0 (0.0%) | 0 (0.0%) |
| 85 Years and over | 4 (6.9%) | 5 (12.8%) |
| Total | 58 (100.0%) | 39 (100.0%) |
Families and Households in Big Creek
Median Family Size in Big Creek
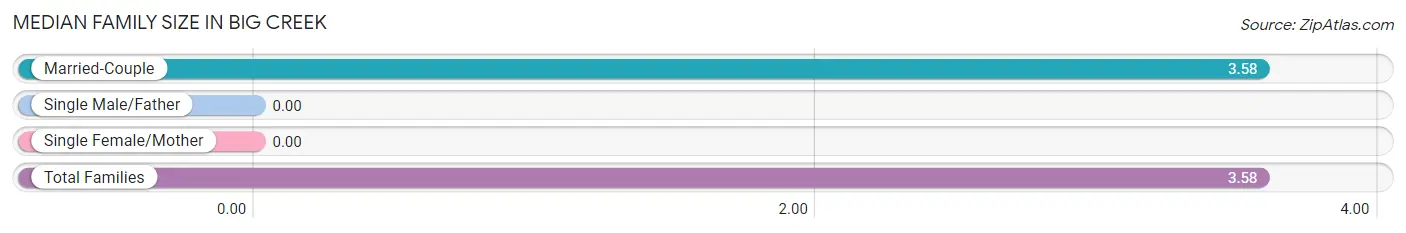
| Family Type | # Families | Family Size |
| Married-Couple | 24 (100.0%) | 3.58 |
| Single Male/Father | 0 (0.0%) | - |
| Single Female/Mother | 0 (0.0%) | - |
| Total Families | 24 (100.0%) | 3.58 |
Median Household Size in Big Creek
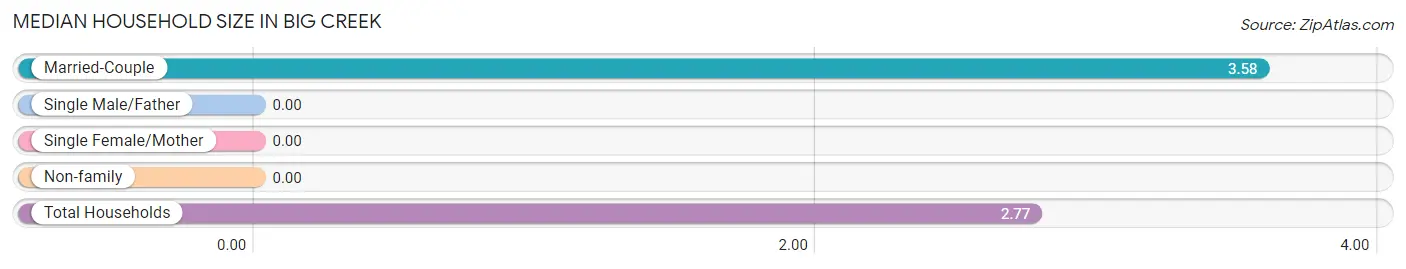
| Household Type | # Households | Household Size |
| Married-Couple | 24 (68.6%) | 3.58 |
| Single Male/Father | 0 (0.0%) | - |
| Single Female/Mother | 0 (0.0%) | - |
| Non-family | 11 (31.4%) | - |
| Total Households | 35 (100.0%) | 2.77 |
Household Size by Marriage Status in Big Creek
Out of a total of 35 households in Big Creek, 24 (68.6%) are family households, while 11 (31.4%) are nonfamily households. The most numerous type of family households are 2-person households, comprising 11, and the most common type of nonfamily households are 1-person households, comprising 11.
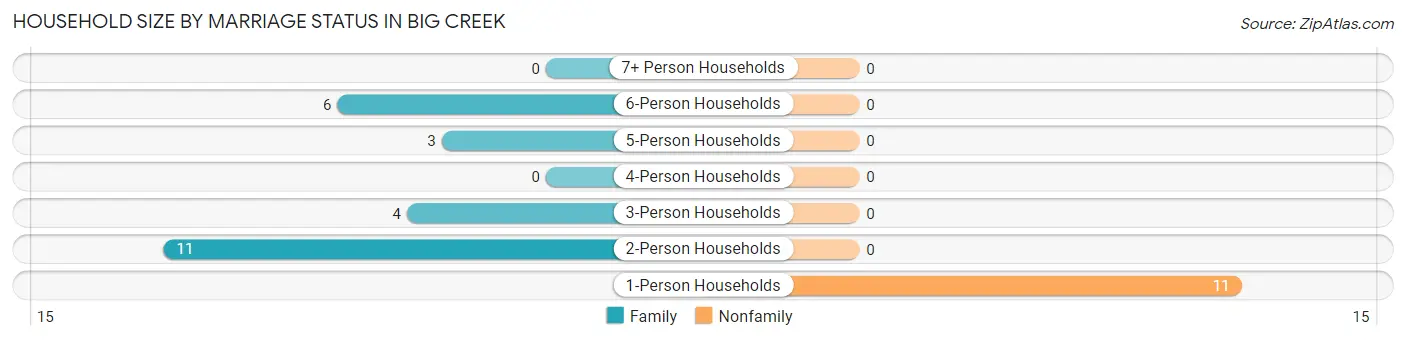
| Household Size | Family Households | Nonfamily Households |
| 1-Person Households | - | 11 (31.4%) |
| 2-Person Households | 11 (31.4%) | 0 (0.0%) |
| 3-Person Households | 4 (11.4%) | 0 (0.0%) |
| 4-Person Households | 0 (0.0%) | 0 (0.0%) |
| 5-Person Households | 3 (8.6%) | 0 (0.0%) |
| 6-Person Households | 6 (17.1%) | 0 (0.0%) |
| 7+ Person Households | 0 (0.0%) | 0 (0.0%) |
| Total | 24 (68.6%) | 11 (31.4%) |
Female Fertility in Big Creek
Fertility by Age in Big Creek
| Age Bracket | Women with Births | Births / 1,000 Women |
| 15 to 19 years | 0 (0.0%) | 0.0 |
| 20 to 34 years | 0 (0.0%) | 0.0 |
| 35 to 50 years | 0 (0.0%) | 0.0 |
| Total | 0 (0.0%) | 0.0 |
Fertility by Age by Marriage Status in Big Creek
| Age Bracket | Married | Unmarried |
| 15 to 19 years | 0 (0.0%) | 0 (0.0%) |
| 20 to 34 years | 0 (0.0%) | 0 (0.0%) |
| 35 to 50 years | 0 (0.0%) | 0 (0.0%) |
| Total | 0 (0.0%) | 0 (0.0%) |
Fertility by Education in Big Creek
| Educational Attainment | Women with Births | Births / 1,000 Women |
| Less than High School | 0 (0.0%) | 0.0 |
| High School Diploma | 0 (0.0%) | 0.0 |
| College or Associate's Degree | 0 (0.0%) | 0.0 |
| Bachelor's Degree | 0 (0.0%) | 0.0 |
| Graduate Degree | 0 (0.0%) | 0.0 |
| Total | 0 (0.0%) | 0.0 |
Fertility by Education by Marriage Status in Big Creek
| Educational Attainment | Married | Unmarried |
| Less than High School | 0 (0.0%) | 0 (0.0%) |
| High School Diploma | 0 (0.0%) | 0 (0.0%) |
| College or Associate's Degree | 0 (0.0%) | 0 (0.0%) |
| Bachelor's Degree | 0 (0.0%) | 0 (0.0%) |
| Graduate Degree | 0 (0.0%) | 0 (0.0%) |
| Total | 0 (0.0%) | 0 (0.0%) |
Employment Characteristics in Big Creek
Employment by Class of Employer in Big Creek
Among the 23 employed individuals in Big Creek, private company employees (18 | 78.3%), and state government employees (5 | 21.7%) make up the most common classes of employment.
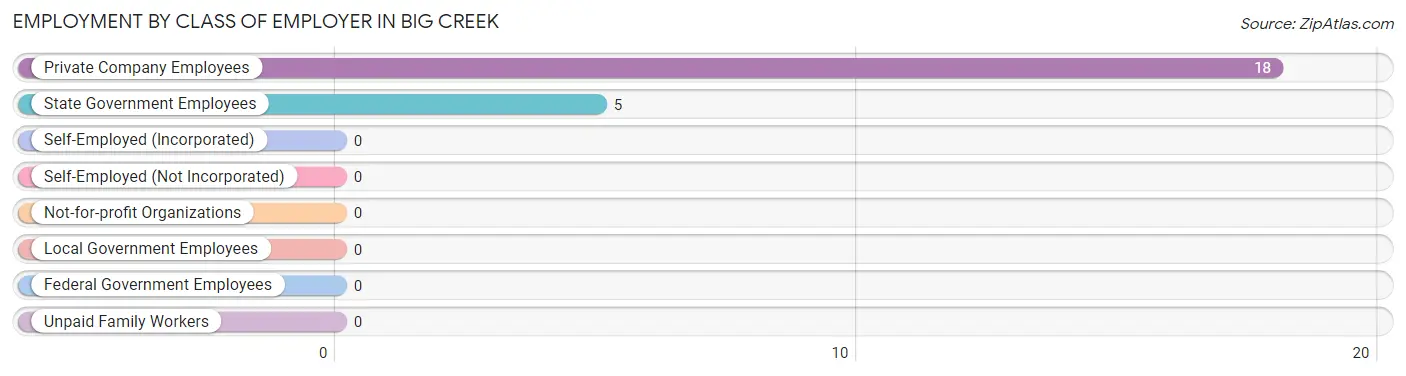
| Employer Class | # Employees | % Employees |
| Private Company Employees | 18 | 78.3% |
| Self-Employed (Incorporated) | 0 | 0.0% |
| Self-Employed (Not Incorporated) | 0 | 0.0% |
| Not-for-profit Organizations | 0 | 0.0% |
| Local Government Employees | 0 | 0.0% |
| State Government Employees | 5 | 21.7% |
| Federal Government Employees | 0 | 0.0% |
| Unpaid Family Workers | 0 | 0.0% |
| Total | 23 | 100.0% |
Employment Status by Age in Big Creek
According to the labor force statistics for Big Creek, out of the total population over 16 years of age (61), 44.3% or 27 individuals are in the labor force, with 14.8% or 4 of them unemployed. The age group with the highest labor force participation rate is 35 to 44 years, with 100.0% or 6 individuals in the labor force. Within the labor force, the 60 to 64 years age range has the highest percentage of unemployed individuals, with 100.0% or 4 of them being unemployed.
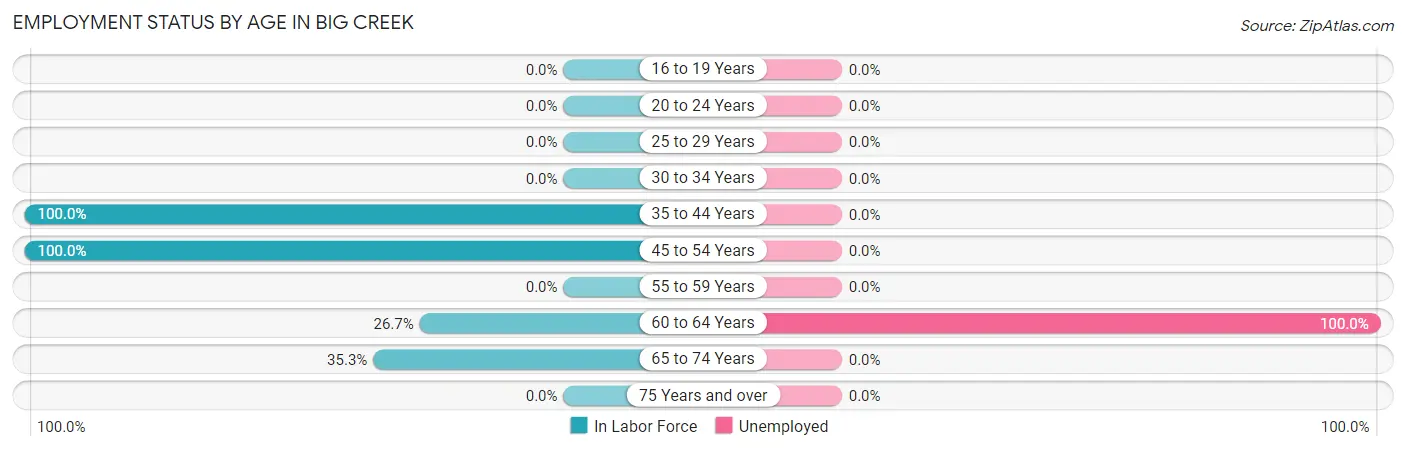
| Age Bracket | In Labor Force | Unemployed |
| 16 to 19 Years | 0 (0.0%) | 0 (0.0%) |
| 20 to 24 Years | 0 (0.0%) | 0 (0.0%) |
| 25 to 29 Years | 0 (0.0%) | 0 (0.0%) |
| 30 to 34 Years | 0 (0.0%) | 0 (0.0%) |
| 35 to 44 Years | 6 (100.0%) | 0 (0.0%) |
| 45 to 54 Years | 11 (100.0%) | 0 (0.0%) |
| 55 to 59 Years | 0 (0.0%) | 0 (0.0%) |
| 60 to 64 Years | 4 (26.7%) | 4 (100.0%) |
| 65 to 74 Years | 6 (35.3%) | 0 (0.0%) |
| 75 Years and over | 0 (0.0%) | 0 (0.0%) |
| Total | 27 (44.3%) | 4 (14.8%) |
Employment Status by Educational Attainment in Big Creek
According to labor force statistics for Big Creek, 65.6% of individuals (21) out of the total population between 25 and 64 years of age (32) are in the labor force, with 19.0% or 4 of them being unemployed. The group with the highest labor force participation rate are those with the educational attainment of high school diploma, with 100.0% or 6 individuals in the labor force. Within the labor force, individuals with college / associate degree education have the highest percentage of unemployment, with 100.0% or 4 of them being unemployed.
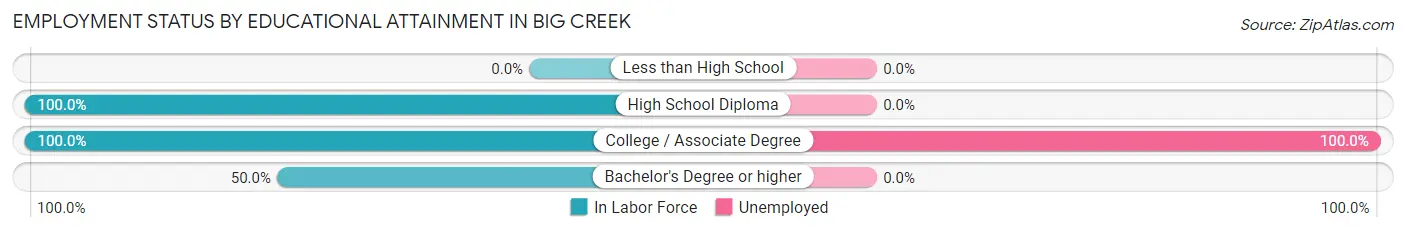
| Educational Attainment | In Labor Force | Unemployed |
| Less than High School | 0 (0.0%) | 0 (0.0%) |
| High School Diploma | 6 (100.0%) | 0 (0.0%) |
| College / Associate Degree | 4 (100.0%) | 4 (100.0%) |
| Bachelor's Degree or higher | 11 (50.0%) | 0 (0.0%) |
| Total | 21 (65.6%) | 6 (19.0%) |
Employment Occupations by Sex in Big Creek
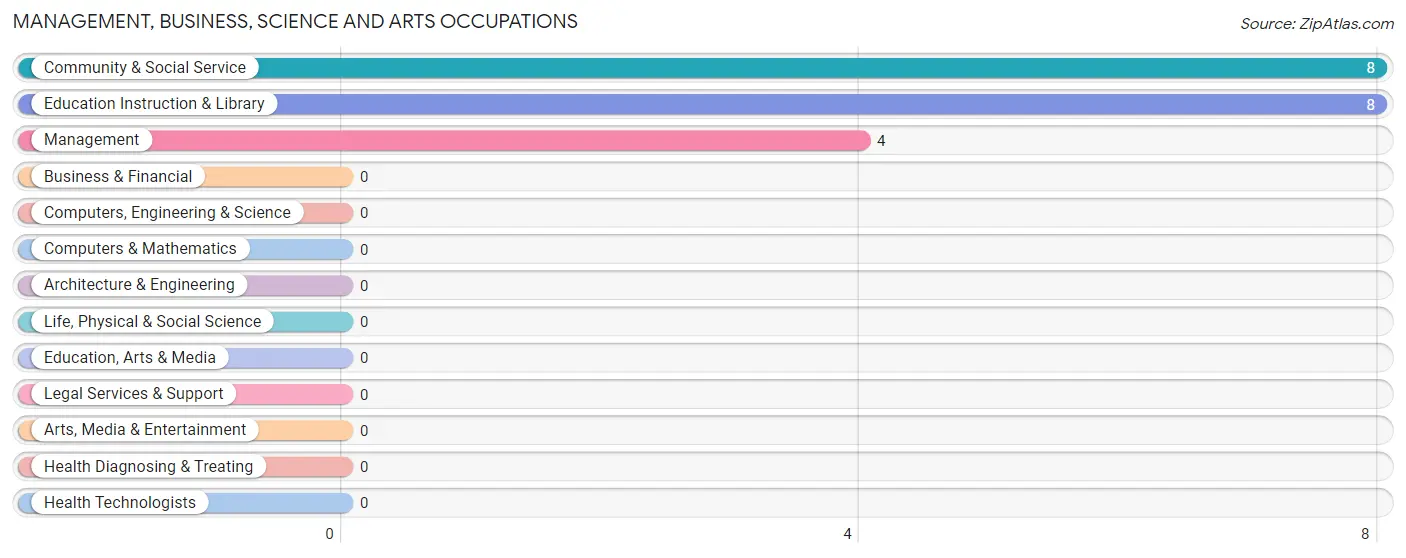
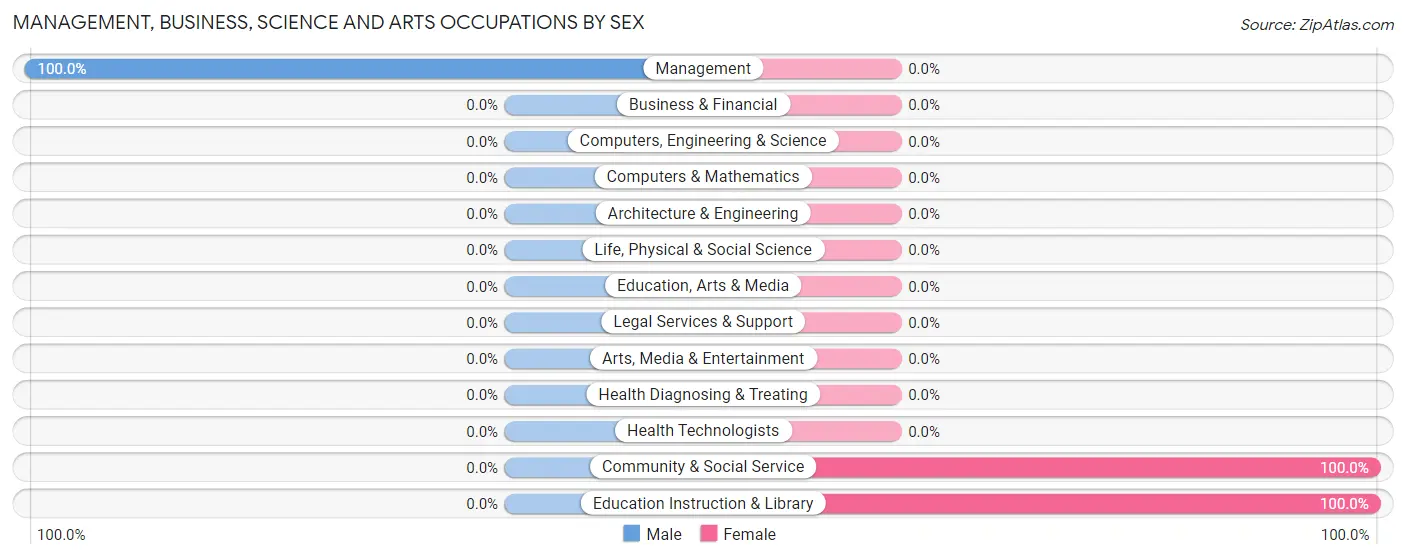
Management, Business, Science and Arts Occupations
The most common Management, Business, Science and Arts occupations in Big Creek are Community & Social Service (8 | 34.8%), Education Instruction & Library (8 | 34.8%), and Management (4 | 17.4%).
Management, Business, Science and Arts Occupations by Sex
| Occupation | Male | Female |
| Management | 4 (100.0%) | 0 (0.0%) |
| Business & Financial | 0 (0.0%) | 0 (0.0%) |
| Computers, Engineering & Science | 0 (0.0%) | 0 (0.0%) |
| Computers & Mathematics | 0 (0.0%) | 0 (0.0%) |
| Architecture & Engineering | 0 (0.0%) | 0 (0.0%) |
| Life, Physical & Social Science | 0 (0.0%) | 0 (0.0%) |
| Community & Social Service | 0 (0.0%) | 8 (100.0%) |
| Education, Arts & Media | 0 (0.0%) | 0 (0.0%) |
| Legal Services & Support | 0 (0.0%) | 0 (0.0%) |
| Education Instruction & Library | 0 (0.0%) | 8 (100.0%) |
| Arts, Media & Entertainment | 0 (0.0%) | 0 (0.0%) |
| Health Diagnosing & Treating | 0 (0.0%) | 0 (0.0%) |
| Health Technologists | 0 (0.0%) | 0 (0.0%) |
| Total (Category) | 4 (33.3%) | 8 (66.7%) |
| Total (Overall) | 15 (65.2%) | 8 (34.8%) |
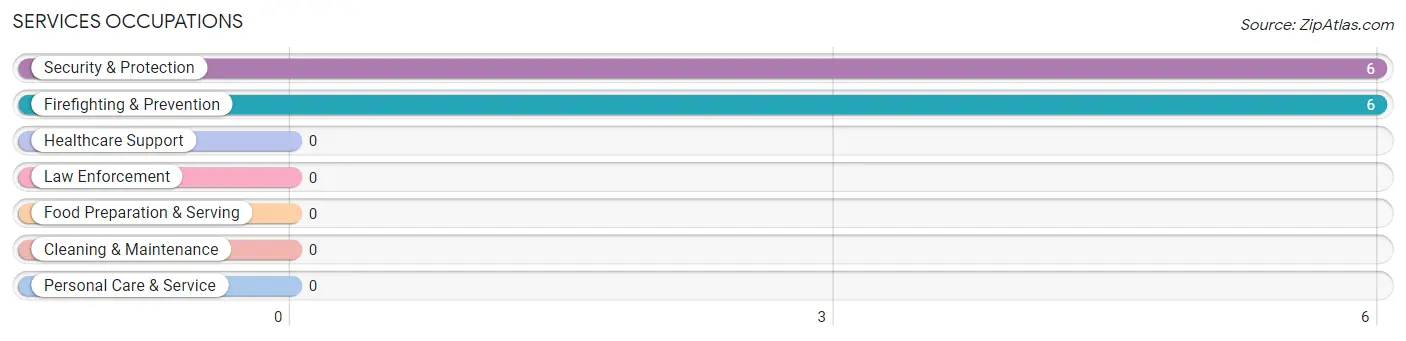
Services Occupations
The most common Services occupations in Big Creek are Security & Protection (6 | 26.1%), and Firefighting & Prevention (6 | 26.1%).
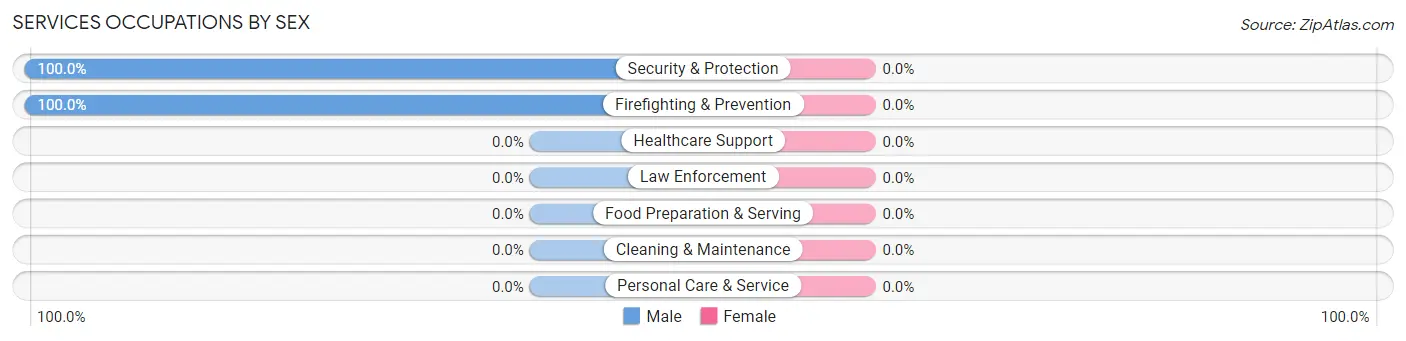
Services Occupations by Sex
| Occupation | Male | Female |
| Healthcare Support | 0 (0.0%) | 0 (0.0%) |
| Security & Protection | 6 (100.0%) | 0 (0.0%) |
| Firefighting & Prevention | 6 (100.0%) | 0 (0.0%) |
| Law Enforcement | 0 (0.0%) | 0 (0.0%) |
| Food Preparation & Serving | 0 (0.0%) | 0 (0.0%) |
| Cleaning & Maintenance | 0 (0.0%) | 0 (0.0%) |
| Personal Care & Service | 0 (0.0%) | 0 (0.0%) |
| Total (Category) | 6 (100.0%) | 0 (0.0%) |
| Total (Overall) | 15 (65.2%) | 8 (34.8%) |
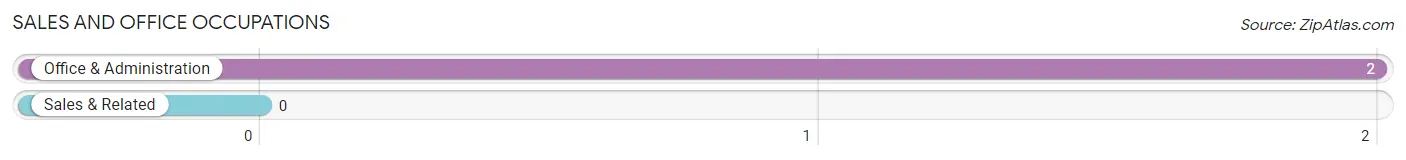
Sales and Office Occupations
The most common Sales and Office occupations in Big Creek are , and Office & Administration (2 | 8.7%).
Sales and Office Occupations by Sex

| Occupation | Male | Female |
| Sales & Related | 0 (0.0%) | 0 (0.0%) |
| Office & Administration | 2 (100.0%) | 0 (0.0%) |
| Total (Category) | 2 (100.0%) | 0 (0.0%) |
| Total (Overall) | 15 (65.2%) | 8 (34.8%) |
Natural Resources, Construction and Maintenance Occupations
Natural Resources, Construction and Maintenance Occupations by Sex
| Occupation | Male | Female |
| Farming, Fishing & Forestry | 0 (0.0%) | 0 (0.0%) |
| Construction & Extraction | 0 (0.0%) | 0 (0.0%) |
| Installation, Maintenance & Repair | 0 (0.0%) | 0 (0.0%) |
| Total (Category) | 0 (0.0%) | 0 (0.0%) |
| Total (Overall) | 15 (65.2%) | 8 (34.8%) |
Production, Transportation and Moving Occupations
The most common Production, Transportation and Moving occupations in Big Creek are , and Production (3 | 13.0%).
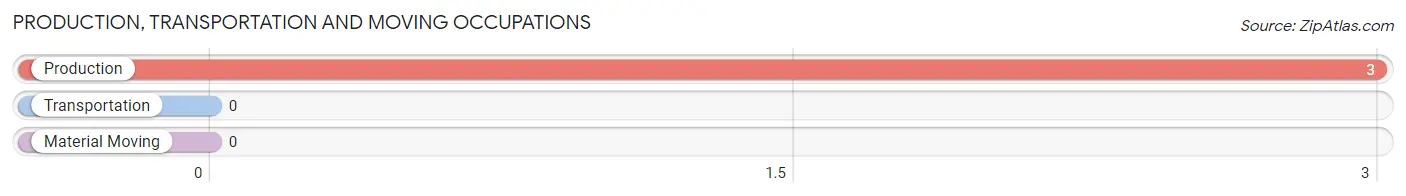
Production, Transportation and Moving Occupations by Sex
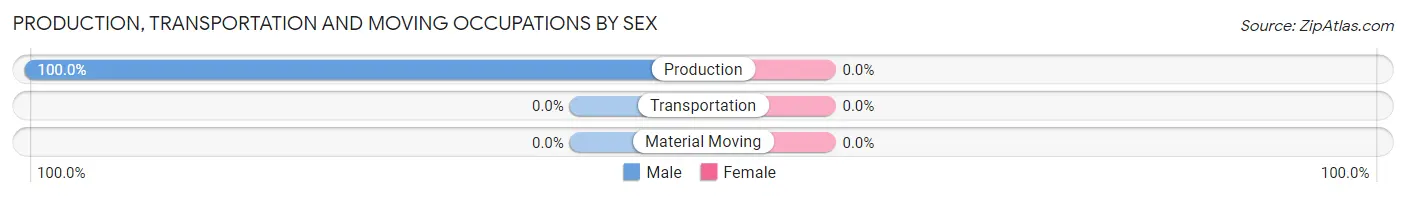
| Occupation | Male | Female |
| Production | 3 (100.0%) | 0 (0.0%) |
| Transportation | 0 (0.0%) | 0 (0.0%) |
| Material Moving | 0 (0.0%) | 0 (0.0%) |
| Total (Category) | 3 (100.0%) | 0 (0.0%) |
| Total (Overall) | 15 (65.2%) | 8 (34.8%) |
Employment Industries by Sex in Big Creek
Employment Industries in Big Creek
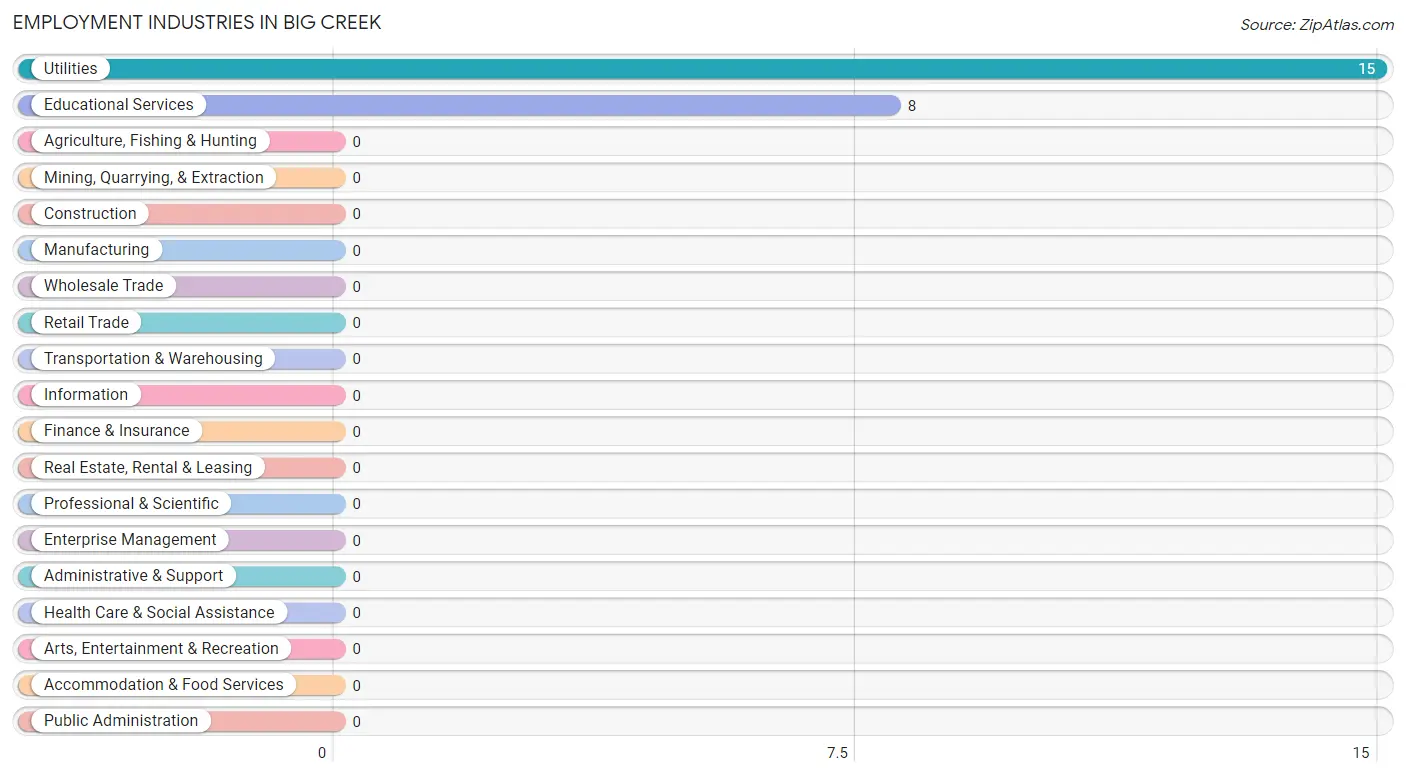
The major employment industries in Big Creek include Utilities (15 | 65.2%), and Educational Services (8 | 34.8%).
Employment Industries by Sex in Big Creek
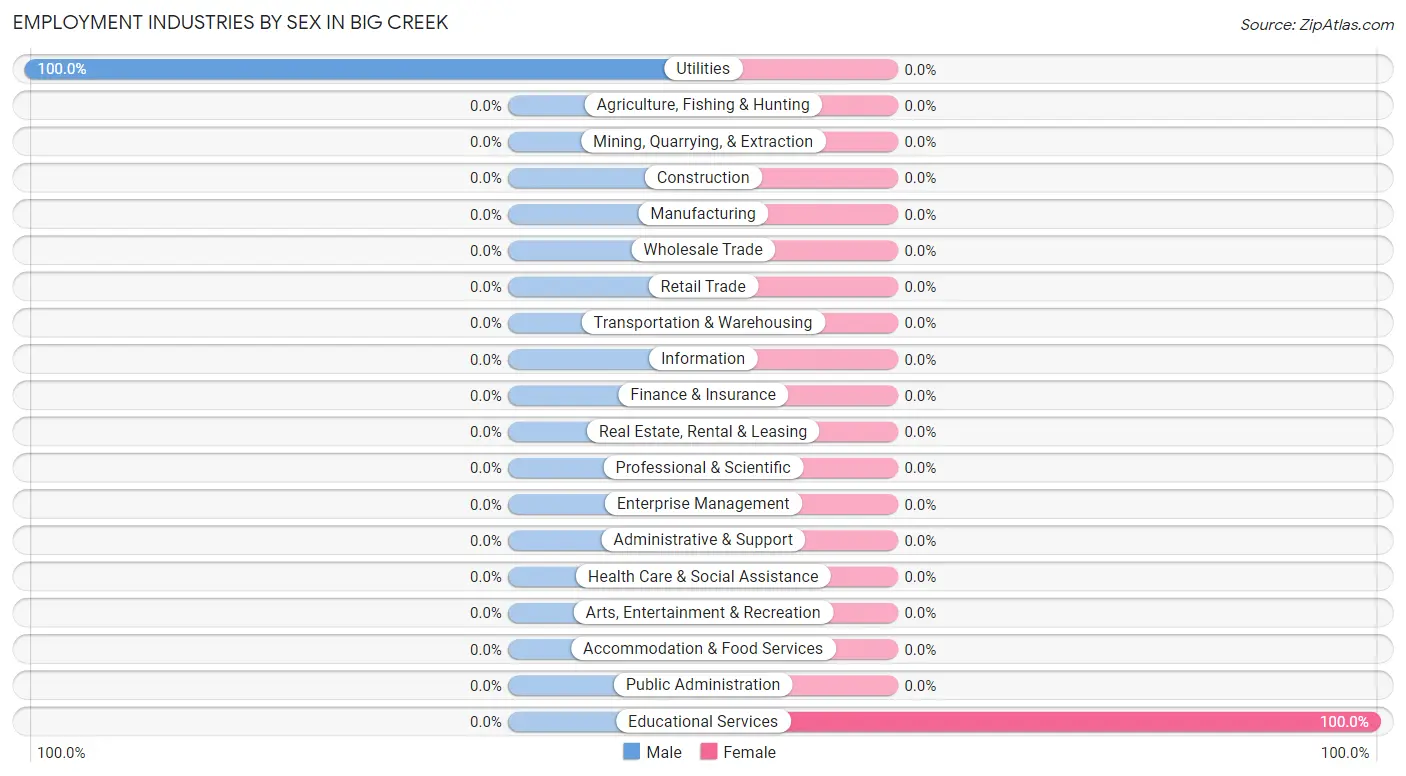
| Industry | Male | Female |
| Agriculture, Fishing & Hunting | 0 (0.0%) | 0 (0.0%) |
| Mining, Quarrying, & Extraction | 0 (0.0%) | 0 (0.0%) |
| Construction | 0 (0.0%) | 0 (0.0%) |
| Manufacturing | 0 (0.0%) | 0 (0.0%) |
| Wholesale Trade | 0 (0.0%) | 0 (0.0%) |
| Retail Trade | 0 (0.0%) | 0 (0.0%) |
| Transportation & Warehousing | 0 (0.0%) | 0 (0.0%) |
| Utilities | 15 (100.0%) | 0 (0.0%) |
| Information | 0 (0.0%) | 0 (0.0%) |
| Finance & Insurance | 0 (0.0%) | 0 (0.0%) |
| Real Estate, Rental & Leasing | 0 (0.0%) | 0 (0.0%) |
| Professional & Scientific | 0 (0.0%) | 0 (0.0%) |
| Enterprise Management | 0 (0.0%) | 0 (0.0%) |
| Administrative & Support | 0 (0.0%) | 0 (0.0%) |
| Educational Services | 0 (0.0%) | 8 (100.0%) |
| Health Care & Social Assistance | 0 (0.0%) | 0 (0.0%) |
| Arts, Entertainment & Recreation | 0 (0.0%) | 0 (0.0%) |
| Accommodation & Food Services | 0 (0.0%) | 0 (0.0%) |
| Public Administration | 0 (0.0%) | 0 (0.0%) |
| Total | 15 (65.2%) | 8 (34.8%) |
Education in Big Creek
School Enrollment in Big Creek
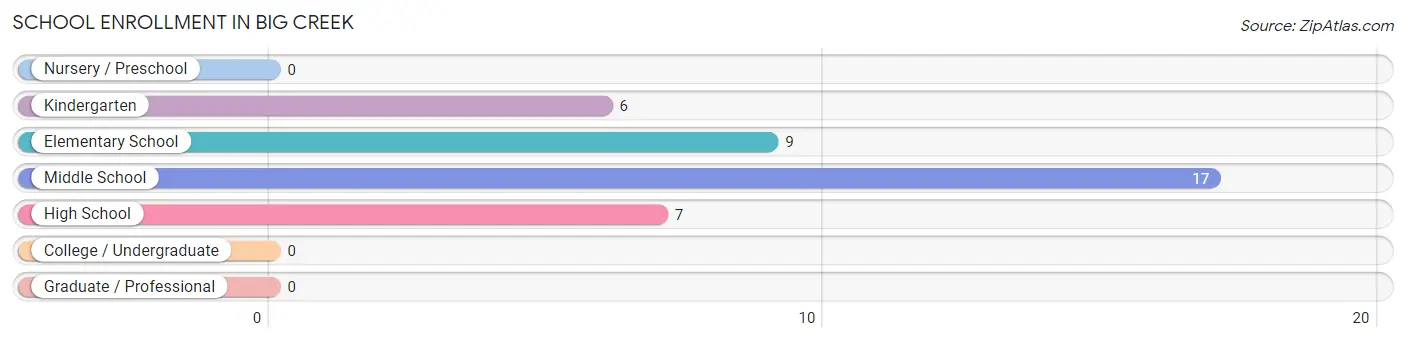
The most common levels of schooling among the 39 students in Big Creek are middle school (17 | 43.6%), elementary school (9 | 23.1%), and high school (7 | 17.9%).
| School Level | # Students | % Students |
| Nursery / Preschool | 0 | 0.0% |
| Kindergarten | 6 | 15.4% |
| Elementary School | 9 | 23.1% |
| Middle School | 17 | 43.6% |
| High School | 7 | 17.9% |
| College / Undergraduate | 0 | 0.0% |
| Graduate / Professional | 0 | 0.0% |
| Total | 39 | 100.0% |
School Enrollment by Age by Funding Source in Big Creek
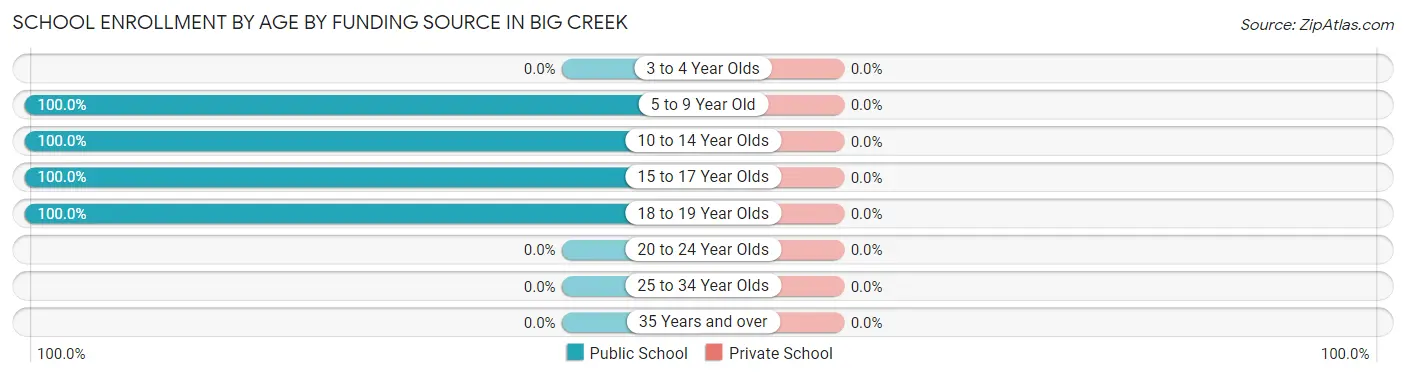
| Age Bracket | Public School | Private School |
| 3 to 4 Year Olds | 0 (0.0%) | 0 (0.0%) |
| 5 to 9 Year Old | 15 (100.0%) | 0 (0.0%) |
| 10 to 14 Year Olds | 17 (100.0%) | 0 (0.0%) |
| 15 to 17 Year Olds | 4 (100.0%) | 0 (0.0%) |
| 18 to 19 Year Olds | 3 (100.0%) | 0 (0.0%) |
| 20 to 24 Year Olds | 0 (0.0%) | 0 (0.0%) |
| 25 to 34 Year Olds | 0 (0.0%) | 0 (0.0%) |
| 35 Years and over | 0 (0.0%) | 0 (0.0%) |
| Total | 39 (100.0%) | 0 (0.0%) |
Educational Attainment by Field of Study in Big Creek
Education (16 | 53.3%), business (7 | 23.3%), bio, nature & agricultural (4 | 13.3%), and social sciences (3 | 10.0%) are the most common fields of study among 30 individuals in Big Creek who have obtained a bachelor's degree or higher.
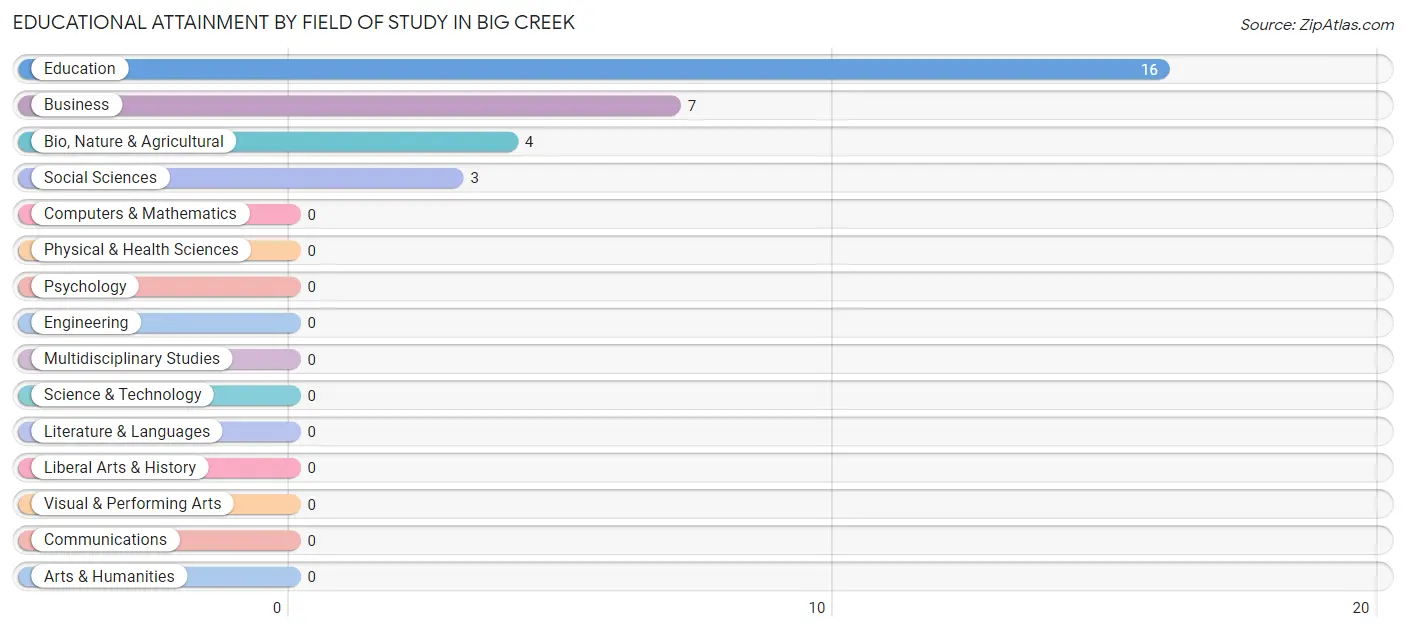
| Field of Study | # Graduates | % Graduates |
| Computers & Mathematics | 0 | 0.0% |
| Bio, Nature & Agricultural | 4 | 13.3% |
| Physical & Health Sciences | 0 | 0.0% |
| Psychology | 0 | 0.0% |
| Social Sciences | 3 | 10.0% |
| Engineering | 0 | 0.0% |
| Multidisciplinary Studies | 0 | 0.0% |
| Science & Technology | 0 | 0.0% |
| Business | 7 | 23.3% |
| Education | 16 | 53.3% |
| Literature & Languages | 0 | 0.0% |
| Liberal Arts & History | 0 | 0.0% |
| Visual & Performing Arts | 0 | 0.0% |
| Communications | 0 | 0.0% |
| Arts & Humanities | 0 | 0.0% |
| Total | 30 | 100.0% |
Transportation & Commute in Big Creek
Vehicle Availability by Sex in Big Creek
The most prevalent vehicle ownership categories in Big Creek are males with 3 vehicles (10, accounting for 66.7%) and females with 3 vehicles (5, making up 125.0%).
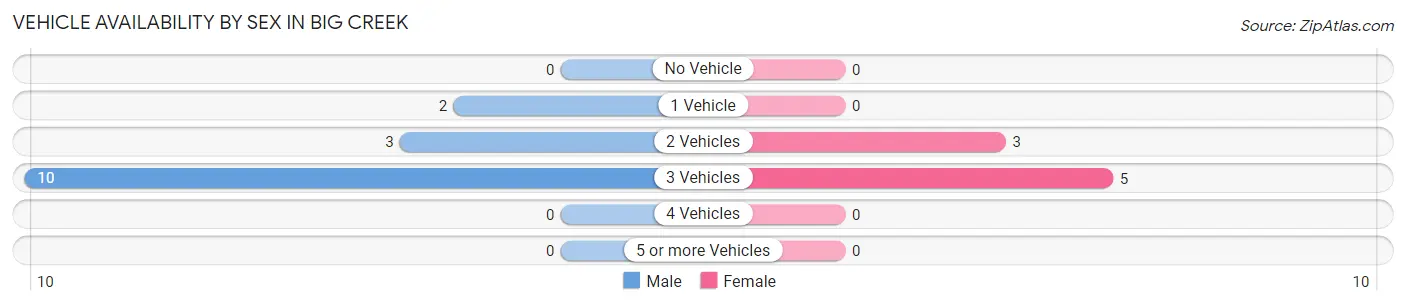
| Vehicles Available | Male | Female |
| No Vehicle | 0 (0.0%) | 0 (0.0%) |
| 1 Vehicle | 2 (13.3%) | 0 (0.0%) |
| 2 Vehicles | 3 (20.0%) | 3 (37.5%) |
| 3 Vehicles | 10 (66.7%) | 5 (62.5%) |
| 4 Vehicles | 0 (0.0%) | 0 (0.0%) |
| 5 or more Vehicles | 0 (0.0%) | 0 (0.0%) |
| Total | 15 (100.0%) | 8 (100.0%) |
Commute Time in Big Creek
The most frequently occuring commute durations in Big Creek are less than 5 minutes (18 commuters, 78.3%), 45 to 59 minutes (3 commuters, 13.0%), and 5 to 9 minutes (2 commuters, 8.7%).
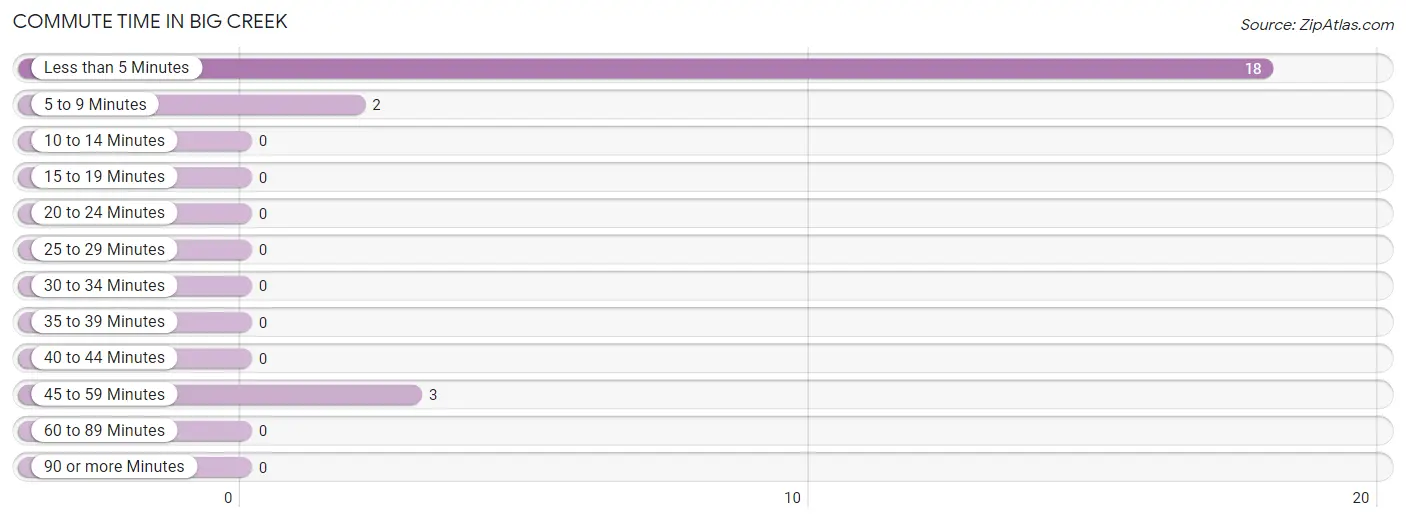
| Commute Time | # Commuters | % Commuters |
| Less than 5 Minutes | 18 | 78.3% |
| 5 to 9 Minutes | 2 | 8.7% |
| 10 to 14 Minutes | 0 | 0.0% |
| 15 to 19 Minutes | 0 | 0.0% |
| 20 to 24 Minutes | 0 | 0.0% |
| 25 to 29 Minutes | 0 | 0.0% |
| 30 to 34 Minutes | 0 | 0.0% |
| 35 to 39 Minutes | 0 | 0.0% |
| 40 to 44 Minutes | 0 | 0.0% |
| 45 to 59 Minutes | 3 | 13.0% |
| 60 to 89 Minutes | 0 | 0.0% |
| 90 or more Minutes | 0 | 0.0% |
Commute Time by Sex in Big Creek
The most common commute times in Big Creek are less than 5 minutes (13 commuters, 86.7%) for males and less than 5 minutes (5 commuters, 62.5%) for females.
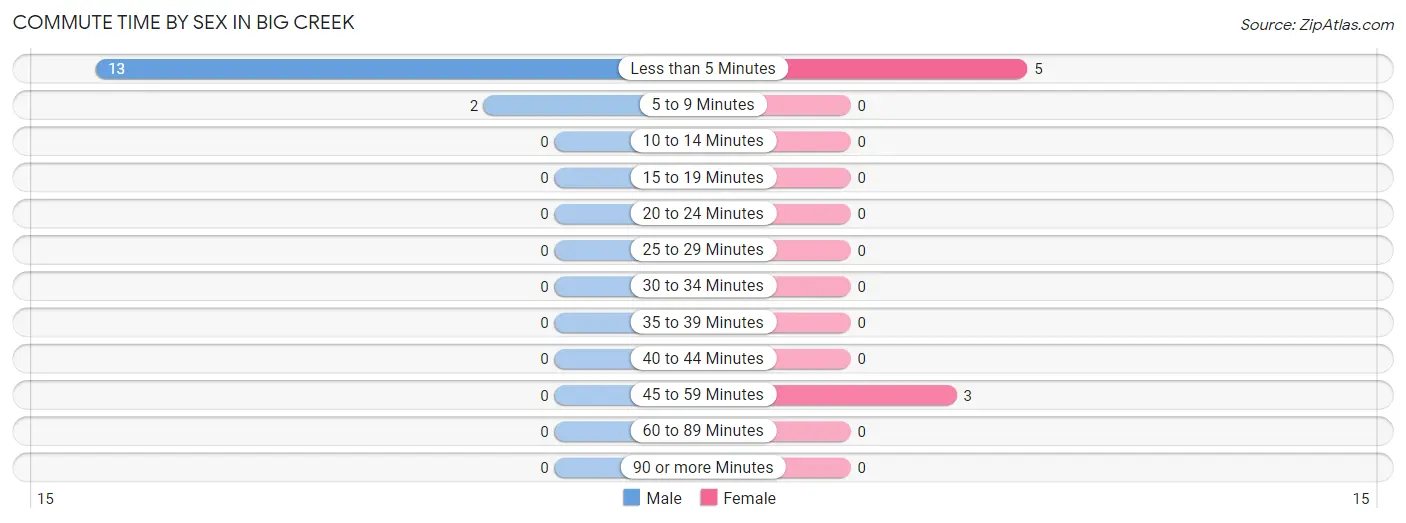
| Commute Time | Male | Female |
| Less than 5 Minutes | 13 (86.7%) | 5 (62.5%) |
| 5 to 9 Minutes | 2 (13.3%) | 0 (0.0%) |
| 10 to 14 Minutes | 0 (0.0%) | 0 (0.0%) |
| 15 to 19 Minutes | 0 (0.0%) | 0 (0.0%) |
| 20 to 24 Minutes | 0 (0.0%) | 0 (0.0%) |
| 25 to 29 Minutes | 0 (0.0%) | 0 (0.0%) |
| 30 to 34 Minutes | 0 (0.0%) | 0 (0.0%) |
| 35 to 39 Minutes | 0 (0.0%) | 0 (0.0%) |
| 40 to 44 Minutes | 0 (0.0%) | 0 (0.0%) |
| 45 to 59 Minutes | 0 (0.0%) | 3 (37.5%) |
| 60 to 89 Minutes | 0 (0.0%) | 0 (0.0%) |
| 90 or more Minutes | 0 (0.0%) | 0 (0.0%) |
Time of Departure to Work by Sex in Big Creek
The most frequent times of departure to work in Big Creek are 6:30 AM to 6:59 AM (13, 86.7%) for males and 8:00 AM to 8:29 AM (5, 62.5%) for females.
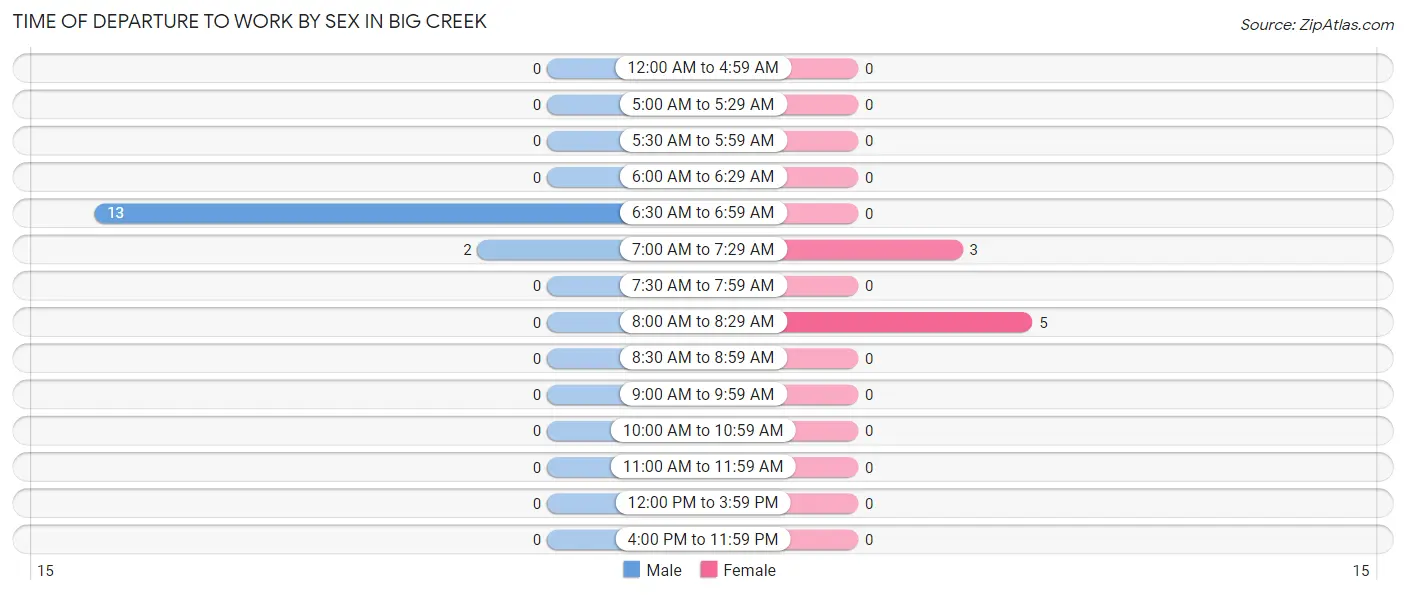
| Time of Departure | Male | Female |
| 12:00 AM to 4:59 AM | 0 (0.0%) | 0 (0.0%) |
| 5:00 AM to 5:29 AM | 0 (0.0%) | 0 (0.0%) |
| 5:30 AM to 5:59 AM | 0 (0.0%) | 0 (0.0%) |
| 6:00 AM to 6:29 AM | 0 (0.0%) | 0 (0.0%) |
| 6:30 AM to 6:59 AM | 13 (86.7%) | 0 (0.0%) |
| 7:00 AM to 7:29 AM | 2 (13.3%) | 3 (37.5%) |
| 7:30 AM to 7:59 AM | 0 (0.0%) | 0 (0.0%) |
| 8:00 AM to 8:29 AM | 0 (0.0%) | 5 (62.5%) |
| 8:30 AM to 8:59 AM | 0 (0.0%) | 0 (0.0%) |
| 9:00 AM to 9:59 AM | 0 (0.0%) | 0 (0.0%) |
| 10:00 AM to 10:59 AM | 0 (0.0%) | 0 (0.0%) |
| 11:00 AM to 11:59 AM | 0 (0.0%) | 0 (0.0%) |
| 12:00 PM to 3:59 PM | 0 (0.0%) | 0 (0.0%) |
| 4:00 PM to 11:59 PM | 0 (0.0%) | 0 (0.0%) |
| Total | 15 (100.0%) | 8 (100.0%) |
Housing Occupancy in Big Creek
Occupancy by Ownership in Big Creek
Of the total 35 dwellings in Big Creek, owner-occupied units account for 20 (57.1%), while renter-occupied units make up 15 (42.9%).
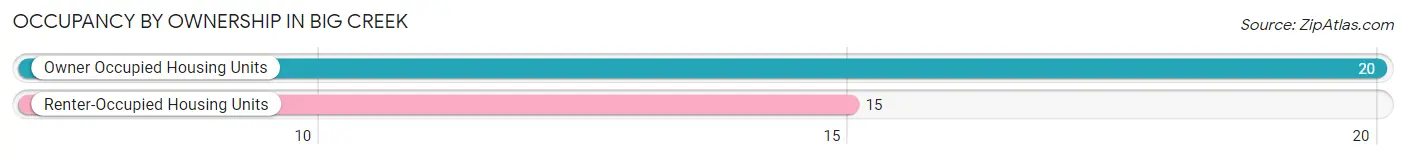
| Occupancy | # Housing Units | % Housing Units |
| Owner Occupied Housing Units | 20 | 57.1% |
| Renter-Occupied Housing Units | 15 | 42.9% |
| Total Occupied Housing Units | 35 | 100.0% |
Occupancy by Household Size in Big Creek
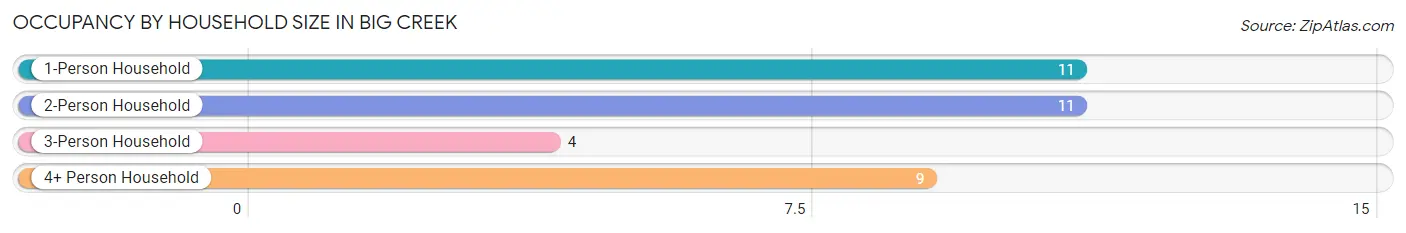
| Household Size | # Housing Units | % Housing Units |
| 1-Person Household | 11 | 31.4% |
| 2-Person Household | 11 | 31.4% |
| 3-Person Household | 4 | 11.4% |
| 4+ Person Household | 9 | 25.7% |
| Total Housing Units | 35 | 100.0% |
Occupancy by Ownership by Household Size in Big Creek
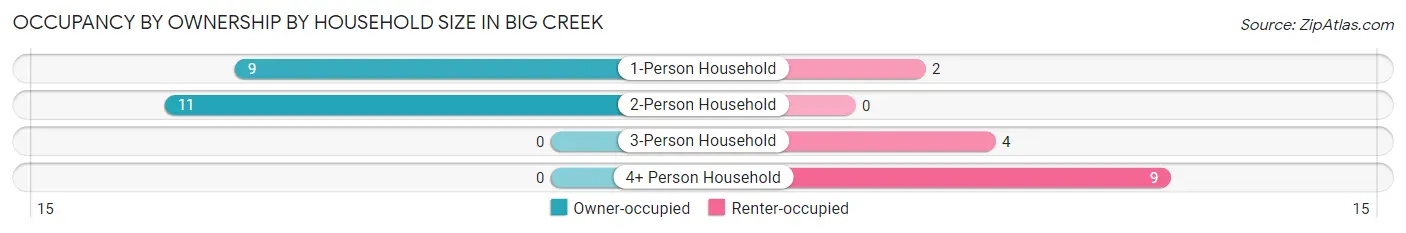
| Household Size | Owner-occupied | Renter-occupied |
| 1-Person Household | 9 (81.8%) | 2 (18.2%) |
| 2-Person Household | 11 (100.0%) | 0 (0.0%) |
| 3-Person Household | 0 (0.0%) | 4 (100.0%) |
| 4+ Person Household | 0 (0.0%) | 9 (100.0%) |
| Total Housing Units | 20 (57.1%) | 15 (42.9%) |
Occupancy by Educational Attainment in Big Creek
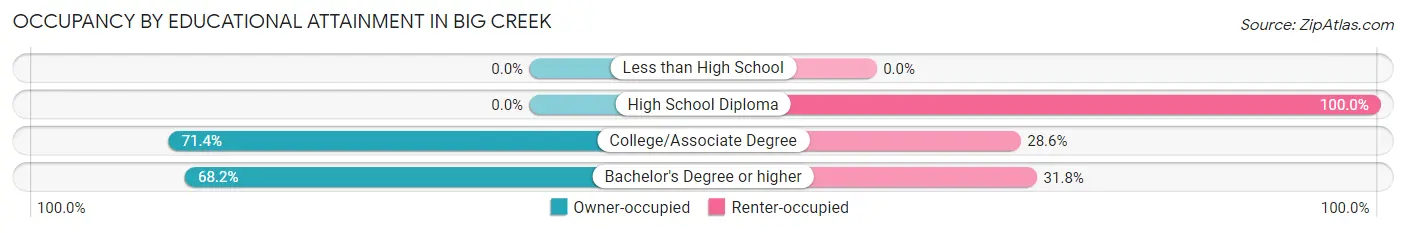
| Household Size | Owner-occupied | Renter-occupied |
| Less than High School | 0 (0.0%) | 0 (0.0%) |
| High School Diploma | 0 (0.0%) | 6 (100.0%) |
| College/Associate Degree | 5 (71.4%) | 2 (28.6%) |
| Bachelor's Degree or higher | 15 (68.2%) | 7 (31.8%) |
Occupancy by Age of Householder in Big Creek
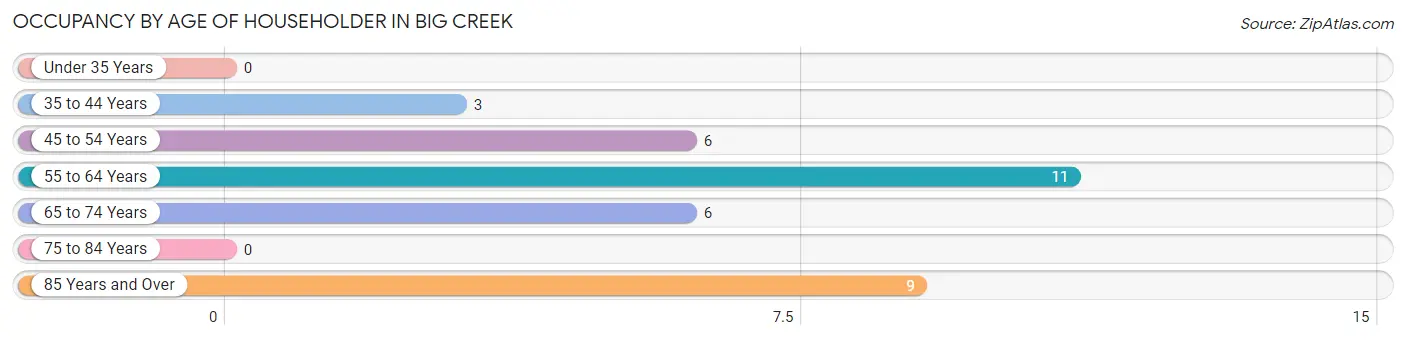
| Age Bracket | # Households | % Households |
| Under 35 Years | 0 | 0.0% |
| 35 to 44 Years | 3 | 8.6% |
| 45 to 54 Years | 6 | 17.1% |
| 55 to 64 Years | 11 | 31.4% |
| 65 to 74 Years | 6 | 17.1% |
| 75 to 84 Years | 0 | 0.0% |
| 85 Years and Over | 9 | 25.7% |
| Total | 35 | 100.0% |
Housing Finances in Big Creek
Median Income by Occupancy in Big Creek
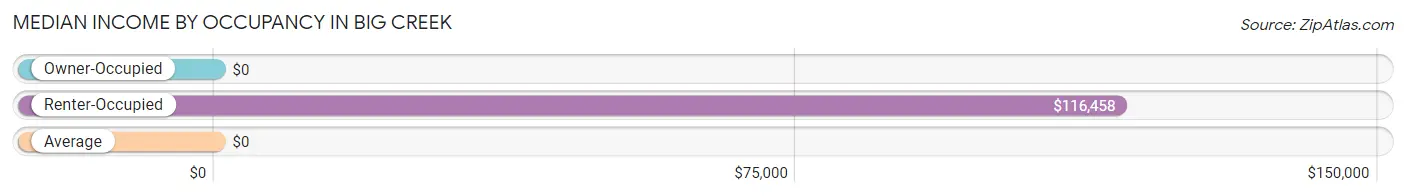
| Occupancy Type | # Households | Median Income |
| Owner-Occupied | 20 (57.1%) | $0 |
| Renter-Occupied | 15 (42.9%) | $116,458 |
| Average | 35 (100.0%) | $0 |
Occupancy by Householder Income Bracket in Big Creek
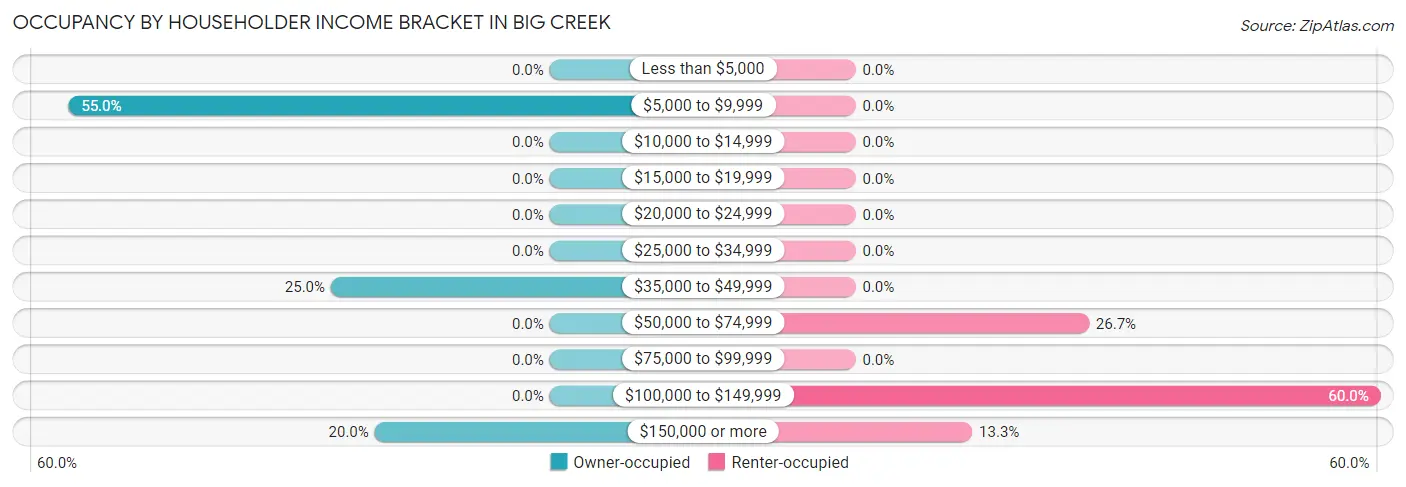
| Income Bracket | Owner-occupied | Renter-occupied |
| Less than $5,000 | 0 (0.0%) | 0 (0.0%) |
| $5,000 to $9,999 | 11 (55.0%) | 0 (0.0%) |
| $10,000 to $14,999 | 0 (0.0%) | 0 (0.0%) |
| $15,000 to $19,999 | 0 (0.0%) | 0 (0.0%) |
| $20,000 to $24,999 | 0 (0.0%) | 0 (0.0%) |
| $25,000 to $34,999 | 0 (0.0%) | 0 (0.0%) |
| $35,000 to $49,999 | 5 (25.0%) | 0 (0.0%) |
| $50,000 to $74,999 | 0 (0.0%) | 4 (26.7%) |
| $75,000 to $99,999 | 0 (0.0%) | 0 (0.0%) |
| $100,000 to $149,999 | 0 (0.0%) | 9 (60.0%) |
| $150,000 or more | 4 (20.0%) | 2 (13.3%) |
| Total | 20 (100.0%) | 15 (100.0%) |
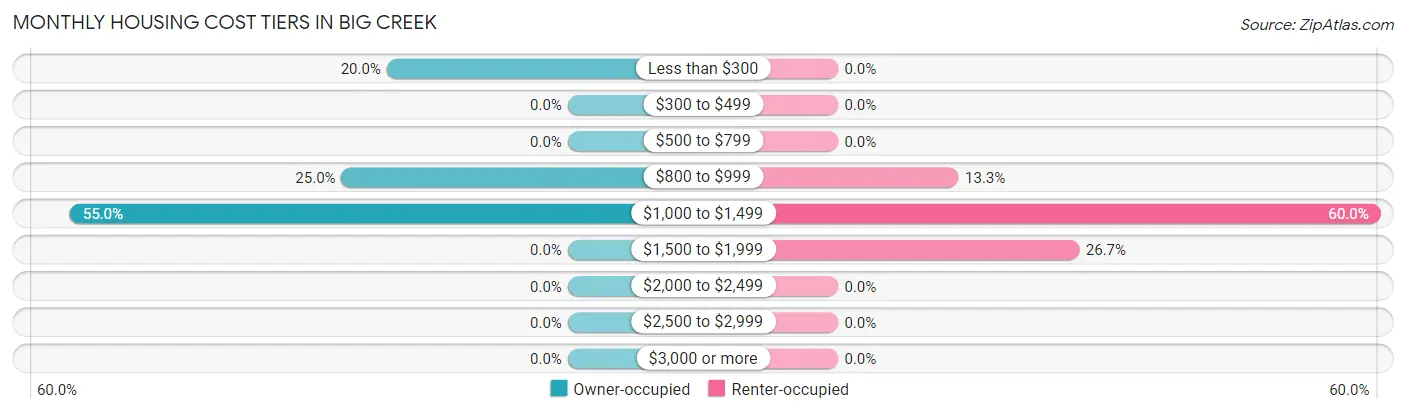
Monthly Housing Cost Tiers in Big Creek
| Monthly Cost | Owner-occupied | Renter-occupied |
| Less than $300 | 4 (20.0%) | 0 (0.0%) |
| $300 to $499 | 0 (0.0%) | 0 (0.0%) |
| $500 to $799 | 0 (0.0%) | 0 (0.0%) |
| $800 to $999 | 5 (25.0%) | 2 (13.3%) |
| $1,000 to $1,499 | 11 (55.0%) | 9 (60.0%) |
| $1,500 to $1,999 | 0 (0.0%) | 4 (26.7%) |
| $2,000 to $2,499 | 0 (0.0%) | 0 (0.0%) |
| $2,500 to $2,999 | 0 (0.0%) | 0 (0.0%) |
| $3,000 or more | 0 (0.0%) | 0 (0.0%) |
| Total | 20 (100.0%) | 15 (100.0%) |
Physical Housing Characteristics in Big Creek
Housing Structures in Big Creek
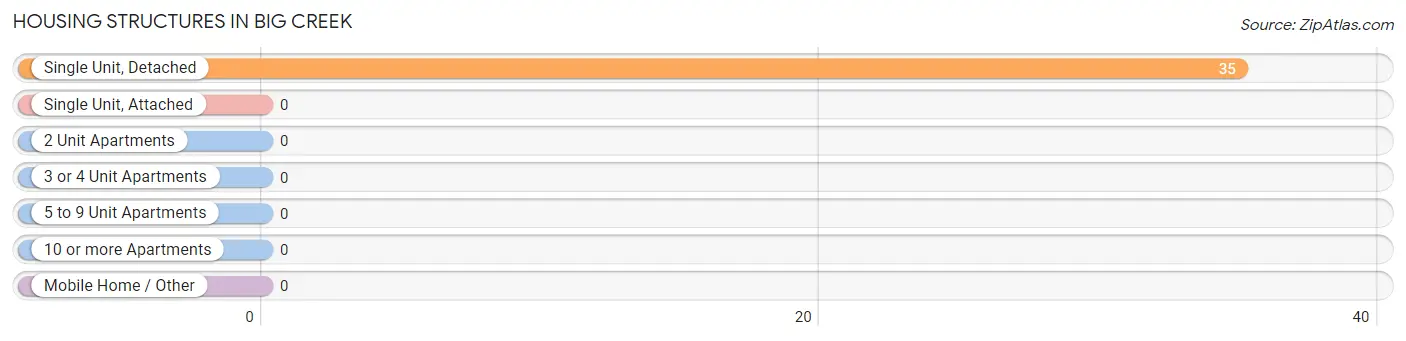
| Structure Type | # Housing Units | % Housing Units |
| Single Unit, Detached | 35 | 100.0% |
| Single Unit, Attached | 0 | 0.0% |
| 2 Unit Apartments | 0 | 0.0% |
| 3 or 4 Unit Apartments | 0 | 0.0% |
| 5 to 9 Unit Apartments | 0 | 0.0% |
| 10 or more Apartments | 0 | 0.0% |
| Mobile Home / Other | 0 | 0.0% |
| Total | 35 | 100.0% |
Housing Structures by Occupancy in Big Creek
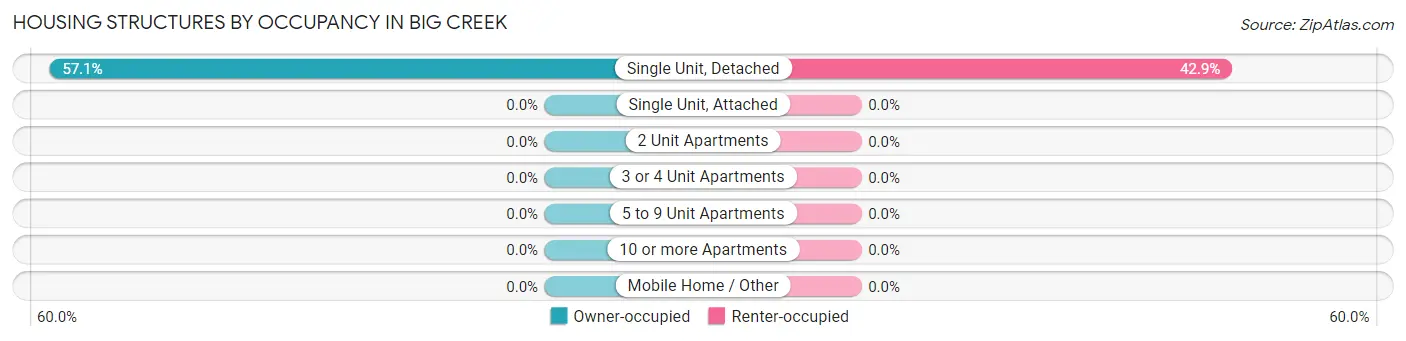
| Structure Type | Owner-occupied | Renter-occupied |
| Single Unit, Detached | 20 (57.1%) | 15 (42.9%) |
| Single Unit, Attached | 0 (0.0%) | 0 (0.0%) |
| 2 Unit Apartments | 0 (0.0%) | 0 (0.0%) |
| 3 or 4 Unit Apartments | 0 (0.0%) | 0 (0.0%) |
| 5 to 9 Unit Apartments | 0 (0.0%) | 0 (0.0%) |
| 10 or more Apartments | 0 (0.0%) | 0 (0.0%) |
| Mobile Home / Other | 0 (0.0%) | 0 (0.0%) |
| Total | 20 (57.1%) | 15 (42.9%) |
Housing Structures by Number of Rooms in Big Creek
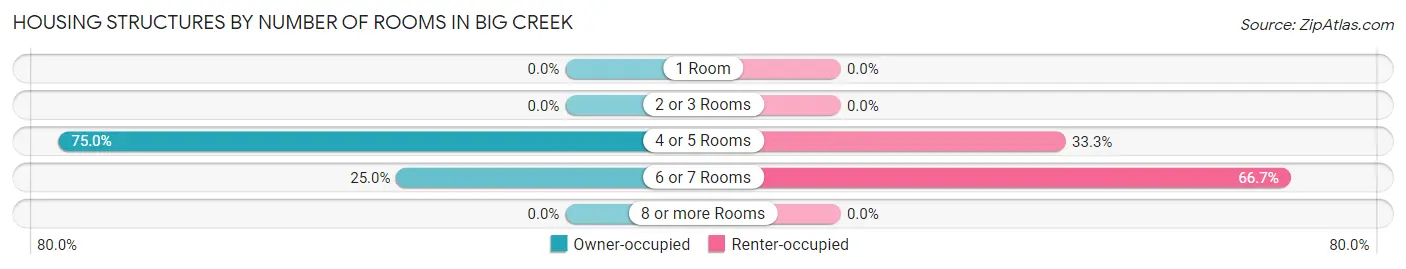
| Number of Rooms | Owner-occupied | Renter-occupied |
| 1 Room | 0 (0.0%) | 0 (0.0%) |
| 2 or 3 Rooms | 0 (0.0%) | 0 (0.0%) |
| 4 or 5 Rooms | 15 (75.0%) | 5 (33.3%) |
| 6 or 7 Rooms | 5 (25.0%) | 10 (66.7%) |
| 8 or more Rooms | 0 (0.0%) | 0 (0.0%) |
| Total | 20 (100.0%) | 15 (100.0%) |
Housing Structure by Heating Type in Big Creek
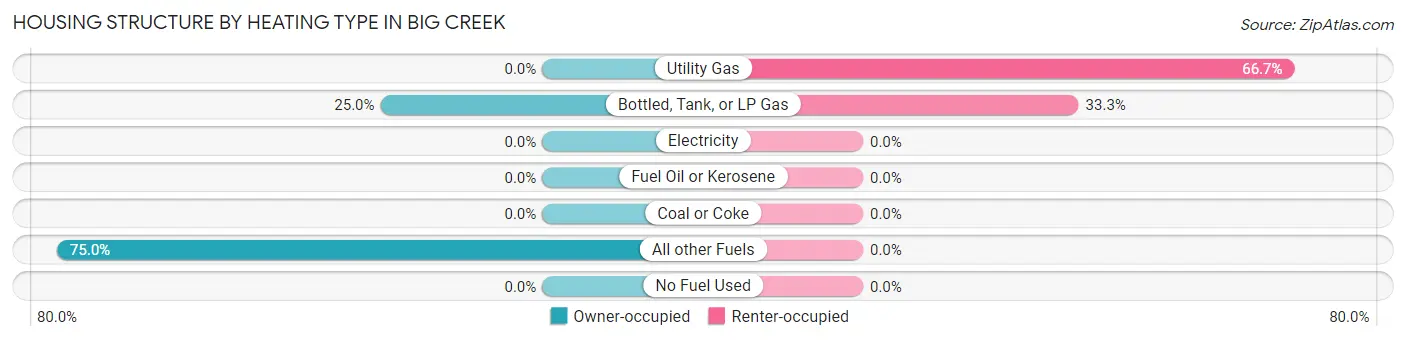
| Heating Type | Owner-occupied | Renter-occupied |
| Utility Gas | 0 (0.0%) | 10 (66.7%) |
| Bottled, Tank, or LP Gas | 5 (25.0%) | 5 (33.3%) |
| Electricity | 0 (0.0%) | 0 (0.0%) |
| Fuel Oil or Kerosene | 0 (0.0%) | 0 (0.0%) |
| Coal or Coke | 0 (0.0%) | 0 (0.0%) |
| All other Fuels | 15 (75.0%) | 0 (0.0%) |
| No Fuel Used | 0 (0.0%) | 0 (0.0%) |
| Total | 20 (100.0%) | 15 (100.0%) |
Household Vehicle Usage in Big Creek
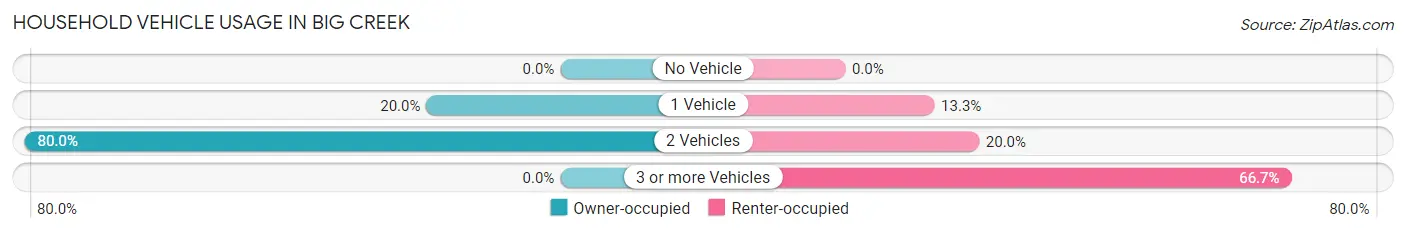
| Vehicles per Household | Owner-occupied | Renter-occupied |
| No Vehicle | 0 (0.0%) | 0 (0.0%) |
| 1 Vehicle | 4 (20.0%) | 2 (13.3%) |
| 2 Vehicles | 16 (80.0%) | 3 (20.0%) |
| 3 or more Vehicles | 0 (0.0%) | 10 (66.7%) |
| Total | 20 (100.0%) | 15 (100.0%) |
Real Estate & Mortgages in Big Creek
Real Estate and Mortgage Overview in Big Creek
| Characteristic | Without Mortgage | With Mortgage |
| Housing Units | 9 | 11 |
| Median Property Value | - | - |
| Median Household Income | - | - |
| Monthly Housing Costs | - | - |
| Real Estate Taxes | - | - |
Property Value by Mortgage Status in Big Creek
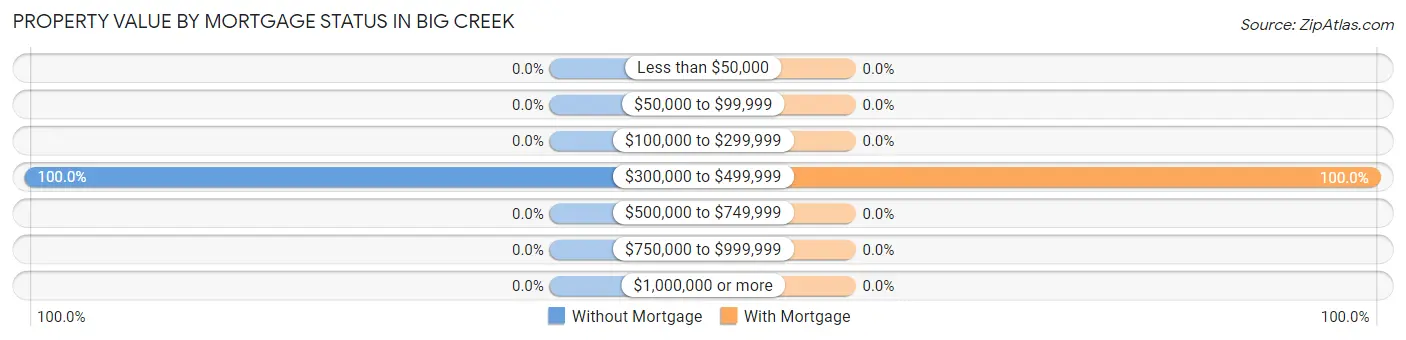
| Property Value | Without Mortgage | With Mortgage |
| Less than $50,000 | 0 (0.0%) | 0 (0.0%) |
| $50,000 to $99,999 | 0 (0.0%) | 0 (0.0%) |
| $100,000 to $299,999 | 0 (0.0%) | 0 (0.0%) |
| $300,000 to $499,999 | 9 (100.0%) | 11 (100.0%) |
| $500,000 to $749,999 | 0 (0.0%) | 0 (0.0%) |
| $750,000 to $999,999 | 0 (0.0%) | 0 (0.0%) |
| $1,000,000 or more | 0 (0.0%) | 0 (0.0%) |
| Total | 9 (100.0%) | 11 (100.0%) |
Household Income by Mortgage Status in Big Creek
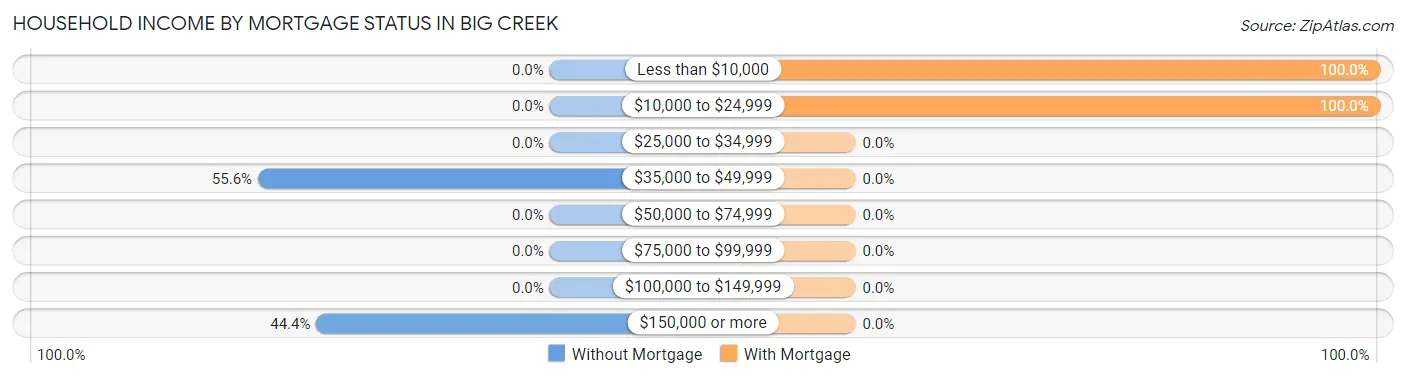
| Household Income | Without Mortgage | With Mortgage |
| Less than $10,000 | 0 (0.0%) | 11 (100.0%) |
| $10,000 to $24,999 | 0 (0.0%) | 11 (100.0%) |
| $25,000 to $34,999 | 0 (0.0%) | 0 (0.0%) |
| $35,000 to $49,999 | 5 (55.6%) | 0 (0.0%) |
| $50,000 to $74,999 | 0 (0.0%) | 0 (0.0%) |
| $75,000 to $99,999 | 0 (0.0%) | 0 (0.0%) |
| $100,000 to $149,999 | 0 (0.0%) | 0 (0.0%) |
| $150,000 or more | 4 (44.4%) | 0 (0.0%) |
| Total | 9 (100.0%) | 11 (100.0%) |
Property Value to Household Income Ratio in Big Creek
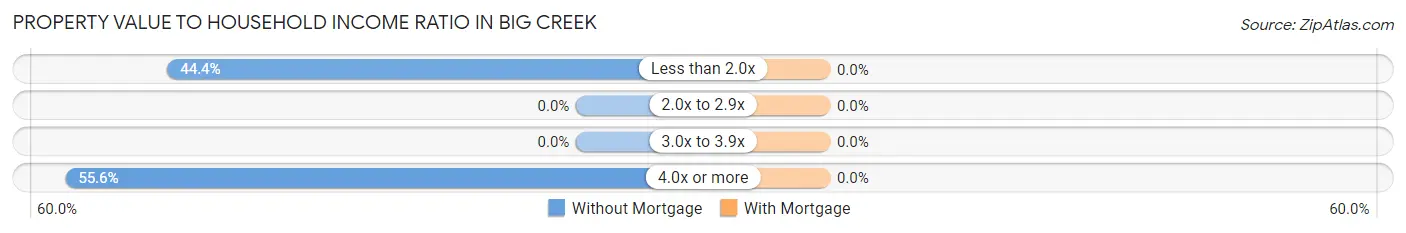
| Value-to-Income Ratio | Without Mortgage | With Mortgage |
| Less than 2.0x | 4 (44.4%) | 0 (0.0%) |
| 2.0x to 2.9x | 0 (0.0%) | 0 (0.0%) |
| 3.0x to 3.9x | 0 (0.0%) | 0 (0.0%) |
| 4.0x or more | 5 (55.6%) | 0 (0.0%) |
| Total | 9 (100.0%) | 11 (100.0%) |
Real Estate Taxes by Mortgage Status in Big Creek
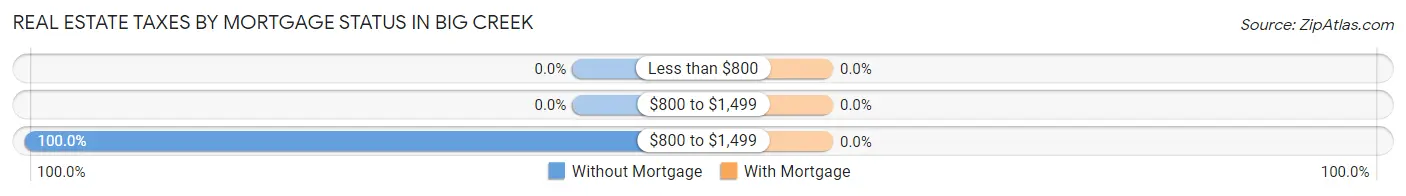
| Property Taxes | Without Mortgage | With Mortgage |
| Less than $800 | 0 (0.0%) | 0 (0.0%) |
| $800 to $1,499 | 0 (0.0%) | 0 (0.0%) |
| $800 to $1,499 | 9 (100.0%) | 0 (0.0%) |
| Total | 9 (100.0%) | 11 (100.0%) |
Health & Disability in Big Creek
Health Insurance Coverage by Age in Big Creek
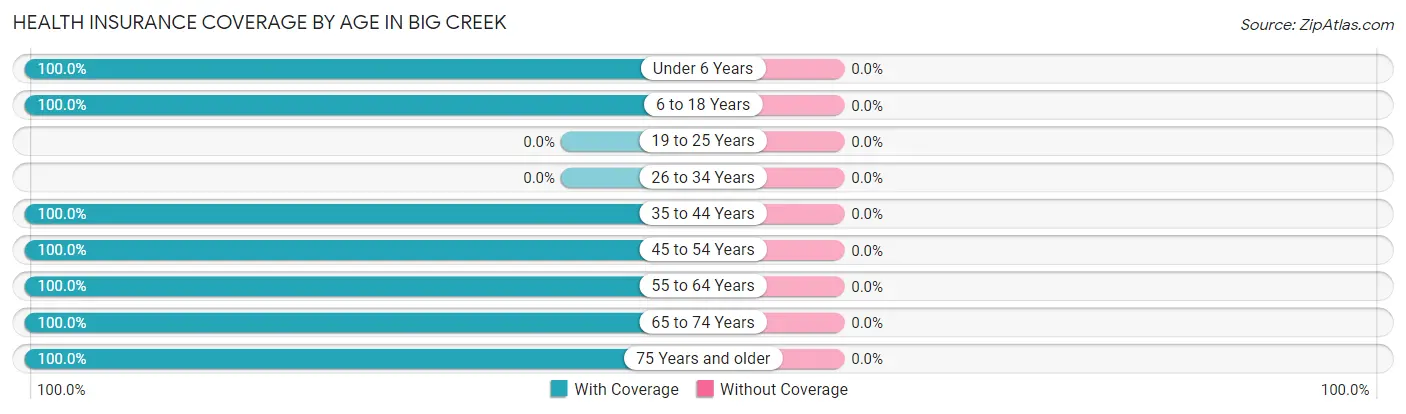
| Age Bracket | With Coverage | Without Coverage |
| Under 6 Years | 6 (100.0%) | 0 (0.0%) |
| 6 to 18 Years | 33 (100.0%) | 0 (0.0%) |
| 19 to 25 Years | 0 (0.0%) | 0 (0.0%) |
| 26 to 34 Years | 0 (0.0%) | 0 (0.0%) |
| 35 to 44 Years | 6 (100.0%) | 0 (0.0%) |
| 45 to 54 Years | 11 (100.0%) | 0 (0.0%) |
| 55 to 64 Years | 15 (100.0%) | 0 (0.0%) |
| 65 to 74 Years | 17 (100.0%) | 0 (0.0%) |
| 75 Years and older | 9 (100.0%) | 0 (0.0%) |
| Total | 97 (100.0%) | 0 (0.0%) |
Health Insurance Coverage by Citizenship Status in Big Creek
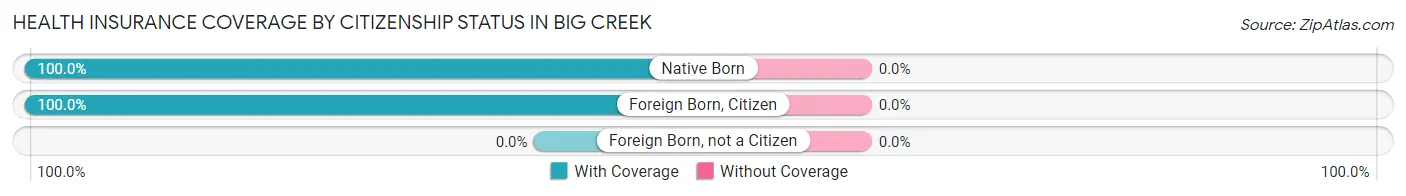
| Citizenship Status | With Coverage | Without Coverage |
| Native Born | 6 (100.0%) | 0 (0.0%) |
| Foreign Born, Citizen | 33 (100.0%) | 0 (0.0%) |
| Foreign Born, not a Citizen | 0 (0.0%) | 0 (0.0%) |
Health Insurance Coverage by Household Income in Big Creek
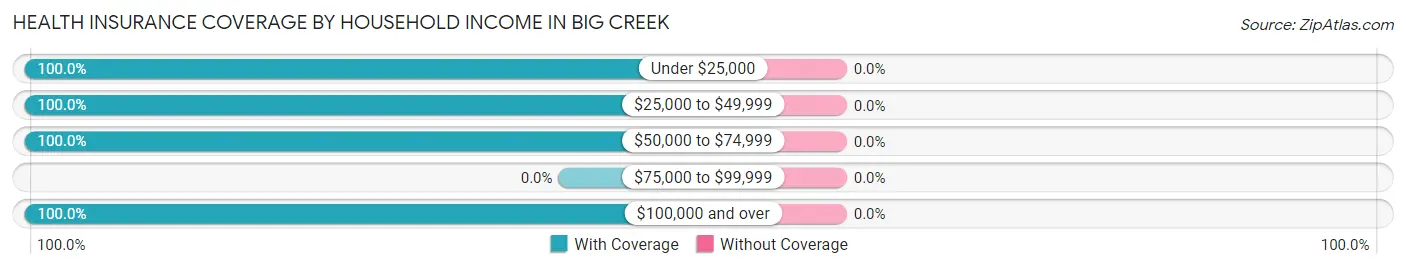
| Household Income | With Coverage | Without Coverage |
| Under $25,000 | 22 (100.0%) | 0 (0.0%) |
| $25,000 to $49,999 | 5 (100.0%) | 0 (0.0%) |
| $50,000 to $74,999 | 11 (100.0%) | 0 (0.0%) |
| $75,000 to $99,999 | 0 (0.0%) | 0 (0.0%) |
| $100,000 and over | 59 (100.0%) | 0 (0.0%) |
Public vs Private Health Insurance Coverage by Age in Big Creek
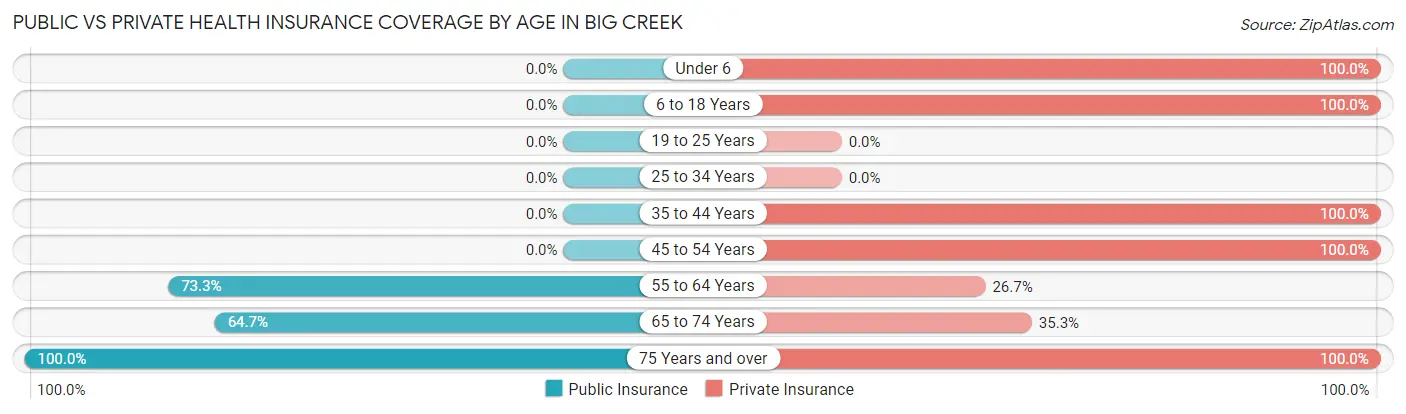
| Age Bracket | Public Insurance | Private Insurance |
| Under 6 | 0 (0.0%) | 6 (100.0%) |
| 6 to 18 Years | 0 (0.0%) | 33 (100.0%) |
| 19 to 25 Years | 0 (0.0%) | 0 (0.0%) |
| 25 to 34 Years | 0 (0.0%) | 0 (0.0%) |
| 35 to 44 Years | 0 (0.0%) | 6 (100.0%) |
| 45 to 54 Years | 0 (0.0%) | 11 (100.0%) |
| 55 to 64 Years | 11 (73.3%) | 4 (26.7%) |
| 65 to 74 Years | 11 (64.7%) | 6 (35.3%) |
| 75 Years and over | 9 (100.0%) | 9 (100.0%) |
| Total | 31 (32.0%) | 75 (77.3%) |
Disability Status by Sex by Age in Big Creek
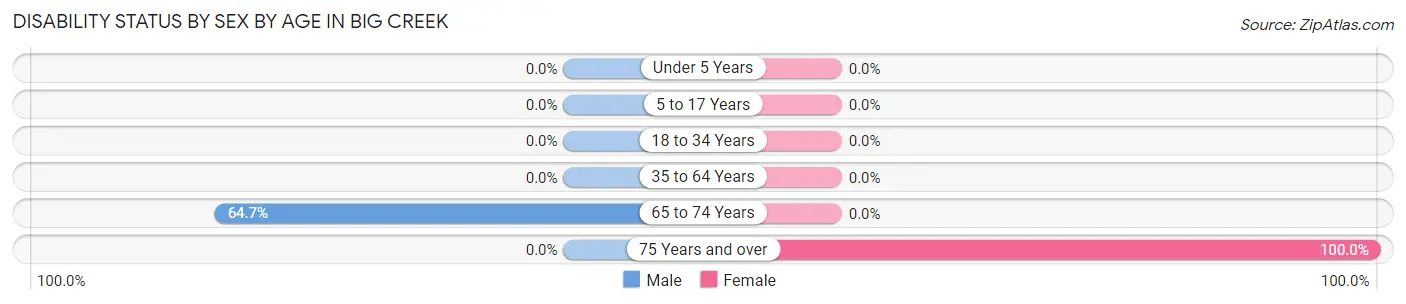
| Age Bracket | Male | Female |
| Under 5 Years | 0 (0.0%) | 0 (0.0%) |
| 5 to 17 Years | 0 (0.0%) | 0 (0.0%) |
| 18 to 34 Years | 0 (0.0%) | 0 (0.0%) |
| 35 to 64 Years | 0 (0.0%) | 0 (0.0%) |
| 65 to 74 Years | 11 (64.7%) | 0 (0.0%) |
| 75 Years and over | 0 (0.0%) | 5 (100.0%) |
Disability Class by Sex by Age in Big Creek
Disability Class: Hearing Difficulty
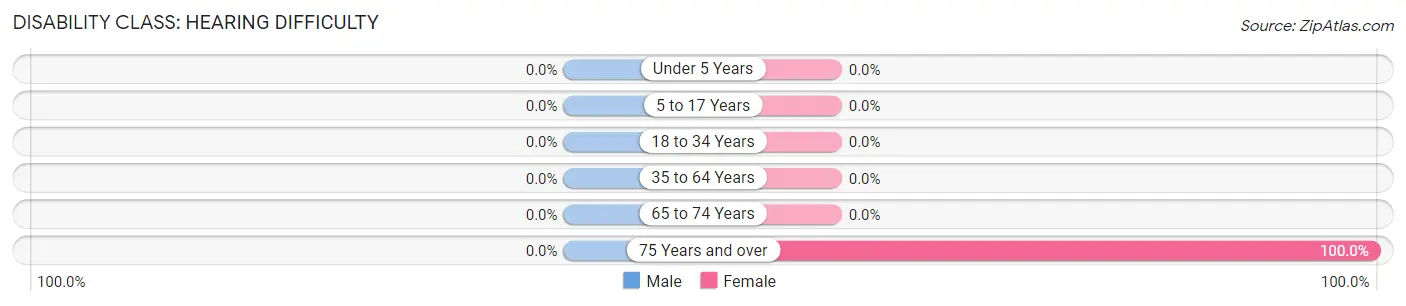
| Age Bracket | Male | Female |
| Under 5 Years | 0 (0.0%) | 0 (0.0%) |
| 5 to 17 Years | 0 (0.0%) | 0 (0.0%) |
| 18 to 34 Years | 0 (0.0%) | 0 (0.0%) |
| 35 to 64 Years | 0 (0.0%) | 0 (0.0%) |
| 65 to 74 Years | 0 (0.0%) | 0 (0.0%) |
| 75 Years and over | 0 (0.0%) | 5 (100.0%) |
Disability Class: Vision Difficulty
| Age Bracket | Male | Female |
| Under 5 Years | 0 (0.0%) | 0 (0.0%) |
| 5 to 17 Years | 0 (0.0%) | 0 (0.0%) |
| 18 to 34 Years | 0 (0.0%) | 0 (0.0%) |
| 35 to 64 Years | 0 (0.0%) | 0 (0.0%) |
| 65 to 74 Years | 0 (0.0%) | 0 (0.0%) |
| 75 Years and over | 0 (0.0%) | 0 (0.0%) |
Disability Class: Cognitive Difficulty
| Age Bracket | Male | Female |
| 5 to 17 Years | 0 (0.0%) | 0 (0.0%) |
| 18 to 34 Years | 0 (0.0%) | 0 (0.0%) |
| 35 to 64 Years | 0 (0.0%) | 0 (0.0%) |
| 65 to 74 Years | 0 (0.0%) | 0 (0.0%) |
| 75 Years and over | 0 (0.0%) | 0 (0.0%) |
Disability Class: Ambulatory Difficulty
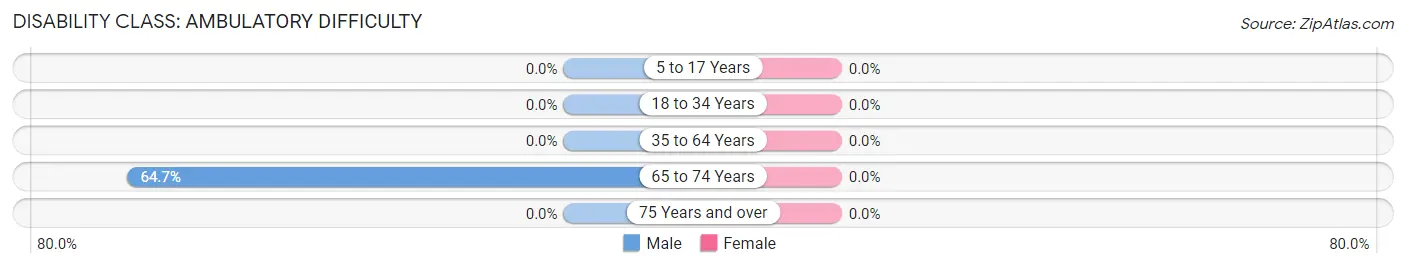
| Age Bracket | Male | Female |
| 5 to 17 Years | 0 (0.0%) | 0 (0.0%) |
| 18 to 34 Years | 0 (0.0%) | 0 (0.0%) |
| 35 to 64 Years | 0 (0.0%) | 0 (0.0%) |
| 65 to 74 Years | 11 (64.7%) | 0 (0.0%) |
| 75 Years and over | 0 (0.0%) | 0 (0.0%) |
Disability Class: Self-Care Difficulty
| Age Bracket | Male | Female |
| 5 to 17 Years | 0 (0.0%) | 0 (0.0%) |
| 18 to 34 Years | 0 (0.0%) | 0 (0.0%) |
| 35 to 64 Years | 0 (0.0%) | 0 (0.0%) |
| 65 to 74 Years | 0 (0.0%) | 0 (0.0%) |
| 75 Years and over | 0 (0.0%) | 0 (0.0%) |
Technology Access in Big Creek
Computing Device Access in Big Creek
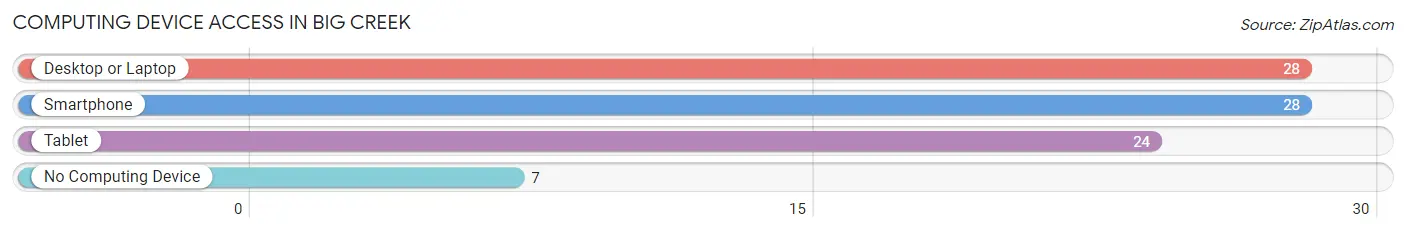
| Device Type | # Households | % Households |
| Desktop or Laptop | 28 | 80.0% |
| Smartphone | 28 | 80.0% |
| Tablet | 24 | 68.6% |
| No Computing Device | 7 | 20.0% |
| Total | 35 | 100.0% |
Internet Access in Big Creek
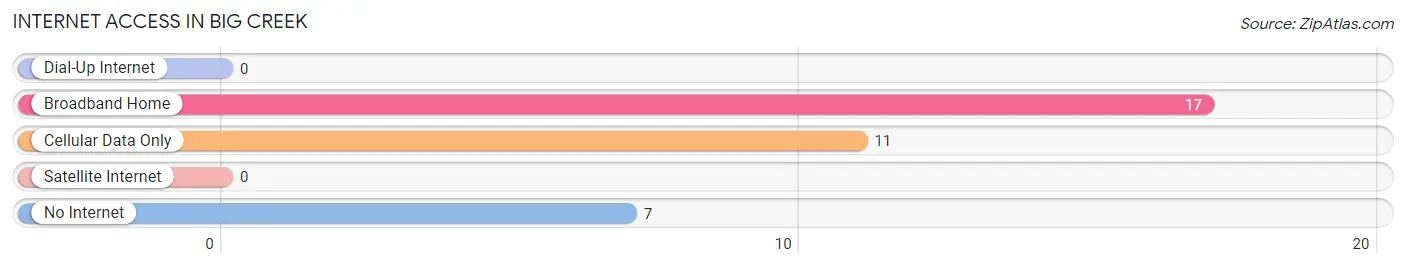
| Internet Type | # Households | % Households |
| Dial-Up Internet | 0 | 0.0% |
| Broadband Home | 17 | 48.6% |
| Cellular Data Only | 11 | 31.4% |
| Satellite Internet | 0 | 0.0% |
| No Internet | 7 | 20.0% |
| Total | 35 | 100.0% |
Big Creek Summary
Big Creek, California is a small unincorporated community located in Fresno County, California. It is situated in the Sierra Nevada Mountains, approximately 25 miles east of Fresno. The community is located in the San Joaquin Valley, and is surrounded by the Sequoia National Forest. Big Creek is a popular destination for outdoor recreation, and is home to a variety of wildlife.
History
Big Creek was first settled in the late 1800s by miners and loggers. The area was originally known as “Big Creek Camp” and was a popular destination for miners and loggers looking to make a living in the area. The town was officially established in 1891 and was named after the nearby creek.
In the early 1900s, the town was home to a variety of businesses, including a general store, a post office, a hotel, and a saloon. The town also had a school, which was built in 1910.
In the 1920s, the town began to decline as the mining and logging industries moved away from the area. The town was eventually abandoned in the 1940s.
Geography
Big Creek is located in the Sierra Nevada Mountains, approximately 25 miles east of Fresno. The town is situated in the San Joaquin Valley, and is surrounded by the Sequoia National Forest. The town is located at an elevation of 4,000 feet, and is home to a variety of wildlife, including deer, bear, and mountain lions.
The climate in Big Creek is generally mild, with temperatures ranging from the mid-50s in the winter to the mid-80s in the summer. The area receives an average of 20 inches of precipitation per year, with most of it falling in the winter months.
Economy
The economy of Big Creek is largely based on tourism. The town is a popular destination for outdoor recreation, and is home to a variety of activities, including camping, fishing, hiking, and mountain biking. The town is also home to a variety of restaurants and shops.
Demographics
As of the 2010 census, the population of Big Creek was 545. The racial makeup of the town was 95.2% White, 0.7% African American, 0.2% Native American, 0.2% Asian, 0.2% Pacific Islander, and 3.7% from other races. The median household income in Big Creek was $37,500, and the median age was 44.
Big Creek is a small, rural community with a strong sense of community. The town is home to a variety of businesses, and is a popular destination for outdoor recreation. The town is also home to a variety of wildlife, and is a great place to live for those looking for a peaceful, rural lifestyle.
Common Questions
What is Per Capita Income in Big Creek?
Per Capita income in Big Creek is $28,591.
What is Inequality or Gini Index in Big Creek?
Inequality or Gini Index in Big Creek is 0.45.
What is the Total Population of Big Creek?
Total Population of Big Creek is 97.
What is the Total Male Population of Big Creek?
Total Male Population of Big Creek is 58.
What is the Total Female Population of Big Creek?
Total Female Population of Big Creek is 39.
What is the Ratio of Males per 100 Females in Big Creek?
There are 148.72 Males per 100 Females in Big Creek.
What is the Ratio of Females per 100 Males in Big Creek?
There are 67.24 Females per 100 Males in Big Creek.
What is the Median Population Age in Big Creek?
Median Population Age in Big Creek is 47.7 Years.
What is the Average Family Size in Big Creek
Average Family Size in Big Creek is 3.6 People.
What is the Average Household Size in Big Creek
Average Household Size in Big Creek is 2.8 People.
How Large is the Labor Force in Big Creek?
There are 27 People in the Labor Forcein in Big Creek.
What is the Percentage of People in the Labor Force in Big Creek?
44.3% of People are in the Labor Force in Big Creek.
What is the Unemployment Rate in Big Creek?
Unemployment Rate in Big Creek is 14.8%.