Yuman vs Immigrants from Eastern Europe No Vehicles in Household
COMPARE
Yuman
Immigrants from Eastern Europe
No Vehicles in Household
No Vehicles in Household Comparison
Yuman
Immigrants from Eastern Europe
14.9%
NO VEHICLES IN HOUSEHOLD
0.0/ 100
METRIC RATING
300th/ 347
METRIC RANK
13.6%
NO VEHICLES IN HOUSEHOLD
0.0/ 100
METRIC RATING
285th/ 347
METRIC RANK
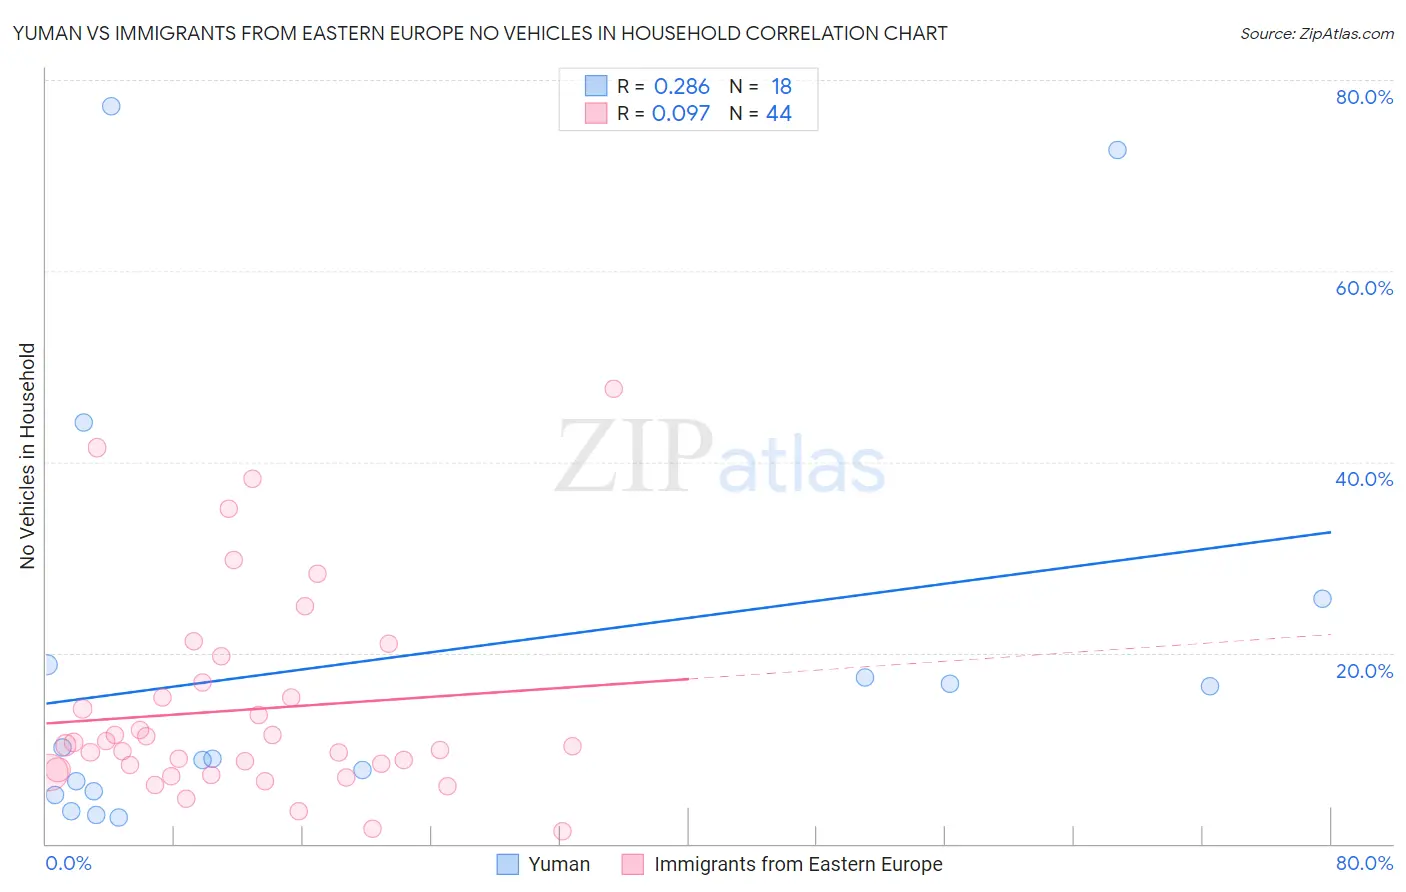
Yuman vs Immigrants from Eastern Europe No Vehicles in Household Correlation Chart
The statistical analysis conducted on geographies consisting of 40,640,909 people shows a weak positive correlation between the proportion of Yuman and percentage of households with no vehicle available in the United States with a correlation coefficient (R) of 0.286 and weighted average of 14.9%. Similarly, the statistical analysis conducted on geographies consisting of 473,883,384 people shows a slight positive correlation between the proportion of Immigrants from Eastern Europe and percentage of households with no vehicle available in the United States with a correlation coefficient (R) of 0.097 and weighted average of 13.6%, a difference of 9.2%.
No Vehicles in Household Correlation Summary
| Measurement | Yuman | Immigrants from Eastern Europe |
| Minimum | 2.8% | 1.3% |
| Maximum | 77.3% | 47.6% |
| Range | 74.5% | 46.3% |
| Mean | 19.5% | 14.0% |
| Median | 9.5% | 10.3% |
| Interquartile 25% (IQ1) | 5.5% | 7.6% |
| Interquartile 75% (IQ3) | 18.8% | 16.1% |
| Interquartile Range (IQR) | 13.3% | 8.5% |
| Standard Deviation (Sample) | 22.6% | 10.6% |
| Standard Deviation (Population) | 21.9% | 10.5% |
Demographics Similar to Yuman and Immigrants from Eastern Europe by No Vehicles in Household
In terms of no vehicles in household, the demographic groups most similar to Yuman are Immigrants from Ukraine (14.9%, a difference of 0.0%), Haitian (14.9%, a difference of 0.48%), Immigrants from Greece (14.7%, a difference of 1.1%), Moroccan (14.7%, a difference of 1.3%), and Immigrants from Panama (14.6%, a difference of 1.4%). Similarly, the demographic groups most similar to Immigrants from Eastern Europe are Immigrants from Malaysia (13.6%, a difference of 0.050%), Immigrants from Kazakhstan (13.6%, a difference of 0.30%), Immigrants from Eastern Asia (13.5%, a difference of 0.33%), Colville (13.7%, a difference of 0.66%), and Immigrants from Ireland (13.7%, a difference of 0.87%).
| Demographics | Rating | Rank | No Vehicles in Household |
| Immigrants | Eastern Asia | 0.0 /100 | #282 | Tragic 13.5% |
| Immigrants | Kazakhstan | 0.0 /100 | #283 | Tragic 13.6% |
| Immigrants | Malaysia | 0.0 /100 | #284 | Tragic 13.6% |
| Immigrants | Eastern Europe | 0.0 /100 | #285 | Tragic 13.6% |
| Colville | 0.0 /100 | #286 | Tragic 13.7% |
| Immigrants | Ireland | 0.0 /100 | #287 | Tragic 13.7% |
| Hopi | 0.0 /100 | #288 | Tragic 13.7% |
| Immigrants | Australia | 0.0 /100 | #289 | Tragic 13.8% |
| Indians (Asian) | 0.0 /100 | #290 | Tragic 14.1% |
| Okinawans | 0.0 /100 | #291 | Tragic 14.1% |
| Pima | 0.0 /100 | #292 | Tragic 14.1% |
| Immigrants | Jamaica | 0.0 /100 | #293 | Tragic 14.2% |
| Belizeans | 0.0 /100 | #294 | Tragic 14.3% |
| Paraguayans | 0.0 /100 | #295 | Tragic 14.4% |
| Immigrants | Spain | 0.0 /100 | #296 | Tragic 14.5% |
| Immigrants | Panama | 0.0 /100 | #297 | Tragic 14.6% |
| Moroccans | 0.0 /100 | #298 | Tragic 14.7% |
| Immigrants | Greece | 0.0 /100 | #299 | Tragic 14.7% |
| Yuman | 0.0 /100 | #300 | Tragic 14.9% |
| Immigrants | Ukraine | 0.0 /100 | #301 | Tragic 14.9% |
| Haitians | 0.0 /100 | #302 | Tragic 14.9% |