Immigrants from Belize vs Immigrants from Kuwait No Vehicles in Household
COMPARE
Immigrants from Belize
Immigrants from Kuwait
No Vehicles in Household
No Vehicles in Household Comparison
Immigrants from Belize
Immigrants from Kuwait
15.4%
NO VEHICLES IN HOUSEHOLD
0.0/ 100
METRIC RATING
306th/ 347
METRIC RANK
9.4%
NO VEHICLES IN HOUSEHOLD
95.1/ 100
METRIC RATING
111th/ 347
METRIC RANK
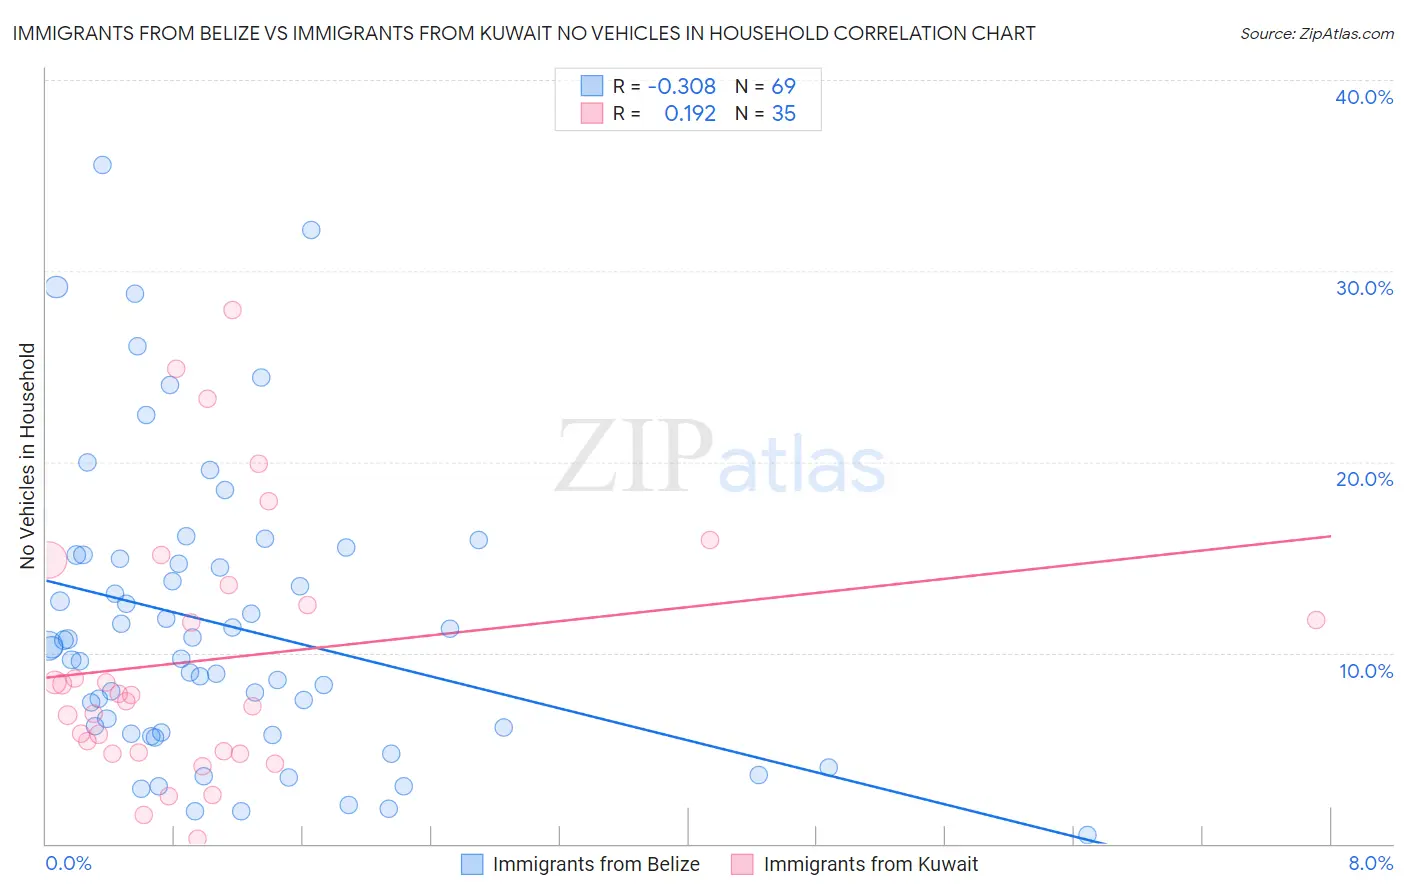
Immigrants from Belize vs Immigrants from Kuwait No Vehicles in Household Correlation Chart
The statistical analysis conducted on geographies consisting of 130,253,773 people shows a mild negative correlation between the proportion of Immigrants from Belize and percentage of households with no vehicle available in the United States with a correlation coefficient (R) of -0.308 and weighted average of 15.4%. Similarly, the statistical analysis conducted on geographies consisting of 136,758,114 people shows a poor positive correlation between the proportion of Immigrants from Kuwait and percentage of households with no vehicle available in the United States with a correlation coefficient (R) of 0.192 and weighted average of 9.4%, a difference of 64.1%.
No Vehicles in Household Correlation Summary
| Measurement | Immigrants from Belize | Immigrants from Kuwait |
| Minimum | 0.48% | 0.29% |
| Maximum | 35.6% | 27.9% |
| Range | 35.1% | 27.7% |
| Mean | 11.4% | 9.7% |
| Median | 10.3% | 7.8% |
| Interquartile 25% (IQ1) | 5.8% | 4.8% |
| Interquartile 75% (IQ3) | 15.0% | 13.5% |
| Interquartile Range (IQR) | 9.3% | 8.8% |
| Standard Deviation (Sample) | 7.7% | 6.8% |
| Standard Deviation (Population) | 7.6% | 6.7% |
Similar Demographics by No Vehicles in Household
Demographics Similar to Immigrants from Belize by No Vehicles in Household
In terms of no vehicles in household, the demographic groups most similar to Immigrants from Belize are Immigrants from Haiti (15.4%, a difference of 0.13%), U.S. Virgin Islander (15.4%, a difference of 0.17%), Puerto Rican (15.5%, a difference of 0.82%), Immigrants from China (15.2%, a difference of 1.3%), and Cape Verdean (15.6%, a difference of 1.4%).
| Demographics | Rating | Rank | No Vehicles in Household |
| Immigrants | Greece | 0.0 /100 | #299 | Tragic 14.7% |
| Yuman | 0.0 /100 | #300 | Tragic 14.9% |
| Immigrants | Ukraine | 0.0 /100 | #301 | Tragic 14.9% |
| Haitians | 0.0 /100 | #302 | Tragic 14.9% |
| Immigrants | Western Africa | 0.0 /100 | #303 | Tragic 15.0% |
| Immigrants | Russia | 0.0 /100 | #304 | Tragic 15.1% |
| Immigrants | China | 0.0 /100 | #305 | Tragic 15.2% |
| Immigrants | Belize | 0.0 /100 | #306 | Tragic 15.4% |
| Immigrants | Haiti | 0.0 /100 | #307 | Tragic 15.4% |
| U.S. Virgin Islanders | 0.0 /100 | #308 | Tragic 15.4% |
| Puerto Ricans | 0.0 /100 | #309 | Tragic 15.5% |
| Cape Verdeans | 0.0 /100 | #310 | Tragic 15.6% |
| Immigrants | Israel | 0.0 /100 | #311 | Tragic 15.6% |
| Alaskan Athabascans | 0.0 /100 | #312 | Tragic 15.6% |
| Tohono O'odham | 0.0 /100 | #313 | Tragic 15.6% |
Demographics Similar to Immigrants from Kuwait by No Vehicles in Household
In terms of no vehicles in household, the demographic groups most similar to Immigrants from Kuwait are Armenian (9.4%, a difference of 0.090%), Immigrants from Netherlands (9.4%, a difference of 0.18%), Serbian (9.4%, a difference of 0.61%), Navajo (9.4%, a difference of 0.68%), and Japanese (9.4%, a difference of 0.74%).
| Demographics | Rating | Rank | No Vehicles in Household |
| Zimbabweans | 98.0 /100 | #104 | Exceptional 9.0% |
| Spanish Americans | 97.9 /100 | #105 | Exceptional 9.1% |
| Laotians | 97.8 /100 | #106 | Exceptional 9.1% |
| Hispanics or Latinos | 97.7 /100 | #107 | Exceptional 9.1% |
| Mexican American Indians | 97.6 /100 | #108 | Exceptional 9.1% |
| Maltese | 97.6 /100 | #109 | Exceptional 9.1% |
| Delaware | 97.2 /100 | #110 | Exceptional 9.2% |
| Immigrants | Kuwait | 95.1 /100 | #111 | Exceptional 9.4% |
| Armenians | 95.0 /100 | #112 | Exceptional 9.4% |
| Immigrants | Netherlands | 94.8 /100 | #113 | Exceptional 9.4% |
| Serbians | 94.3 /100 | #114 | Exceptional 9.4% |
| Navajo | 94.2 /100 | #115 | Exceptional 9.4% |
| Japanese | 94.1 /100 | #116 | Exceptional 9.4% |
| Chippewa | 93.8 /100 | #117 | Exceptional 9.4% |
| Greeks | 92.9 /100 | #118 | Exceptional 9.5% |