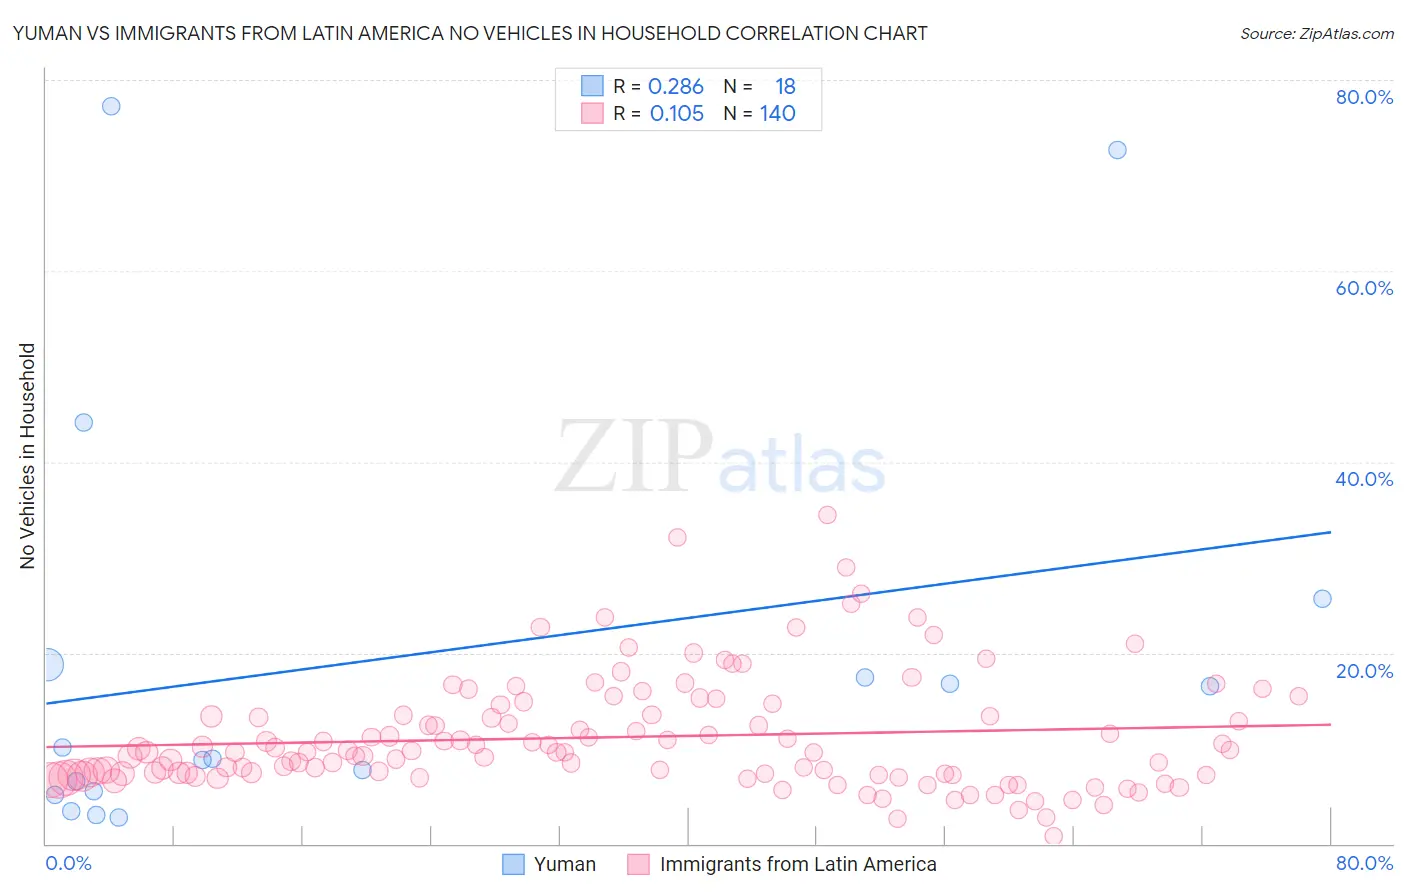
Yuman vs Immigrants from Latin America No Vehicles in Household
COMPARE
Yuman
Immigrants from Latin America
No Vehicles in Household
No Vehicles in Household Comparison
Yuman
Immigrants from Latin America
14.9%
NO VEHICLES IN HOUSEHOLD
0.0/ 100
METRIC RATING
300th/ 347
METRIC RANK
10.4%
NO VEHICLES IN HOUSEHOLD
53.2/ 100
METRIC RATING
170th/ 347
METRIC RANK
Yuman vs Immigrants from Latin America No Vehicles in Household Correlation Chart
The statistical analysis conducted on geographies consisting of 40,640,909 people shows a weak positive correlation between the proportion of Yuman and percentage of households with no vehicle available in the United States with a correlation coefficient (R) of 0.286 and weighted average of 14.9%. Similarly, the statistical analysis conducted on geographies consisting of 543,017,545 people shows a poor positive correlation between the proportion of Immigrants from Latin America and percentage of households with no vehicle available in the United States with a correlation coefficient (R) of 0.105 and weighted average of 10.4%, a difference of 43.3%.
No Vehicles in Household Correlation Summary
| Measurement | Yuman | Immigrants from Latin America |
| Minimum | 2.8% | 0.80% |
| Maximum | 77.3% | 34.4% |
| Range | 74.5% | 33.6% |
| Mean | 19.5% | 11.2% |
| Median | 9.5% | 9.6% |
| Interquartile 25% (IQ1) | 5.5% | 7.2% |
| Interquartile 75% (IQ3) | 18.8% | 13.5% |
| Interquartile Range (IQR) | 13.3% | 6.2% |
| Standard Deviation (Sample) | 22.6% | 5.9% |
| Standard Deviation (Population) | 21.9% | 5.9% |
Similar Demographics by No Vehicles in Household
Demographics Similar to Yuman by No Vehicles in Household
In terms of no vehicles in household, the demographic groups most similar to Yuman are Immigrants from Ukraine (14.9%, a difference of 0.0%), Haitian (14.9%, a difference of 0.48%), Immigrants from Western Africa (15.0%, a difference of 1.0%), Immigrants from Greece (14.7%, a difference of 1.1%), and Moroccan (14.7%, a difference of 1.3%).
| Demographics | Rating | Rank | No Vehicles in Household |
| Immigrants | Jamaica | 0.0 /100 | #293 | Tragic 14.2% |
| Belizeans | 0.0 /100 | #294 | Tragic 14.3% |
| Paraguayans | 0.0 /100 | #295 | Tragic 14.4% |
| Immigrants | Spain | 0.0 /100 | #296 | Tragic 14.5% |
| Immigrants | Panama | 0.0 /100 | #297 | Tragic 14.6% |
| Moroccans | 0.0 /100 | #298 | Tragic 14.7% |
| Immigrants | Greece | 0.0 /100 | #299 | Tragic 14.7% |
| Yuman | 0.0 /100 | #300 | Tragic 14.9% |
| Immigrants | Ukraine | 0.0 /100 | #301 | Tragic 14.9% |
| Haitians | 0.0 /100 | #302 | Tragic 14.9% |
| Immigrants | Western Africa | 0.0 /100 | #303 | Tragic 15.0% |
| Immigrants | Russia | 0.0 /100 | #304 | Tragic 15.1% |
| Immigrants | China | 0.0 /100 | #305 | Tragic 15.2% |
| Immigrants | Belize | 0.0 /100 | #306 | Tragic 15.4% |
| Immigrants | Haiti | 0.0 /100 | #307 | Tragic 15.4% |
Demographics Similar to Immigrants from Latin America by No Vehicles in Household
In terms of no vehicles in household, the demographic groups most similar to Immigrants from Latin America are Hmong (10.4%, a difference of 0.060%), Lumbee (10.3%, a difference of 0.21%), Brazilian (10.4%, a difference of 0.21%), Filipino (10.4%, a difference of 0.42%), and Immigrants from Sudan (10.4%, a difference of 0.43%).
| Demographics | Rating | Rank | No Vehicles in Household |
| Immigrants | Cambodia | 63.7 /100 | #163 | Good 10.2% |
| South Africans | 61.1 /100 | #164 | Good 10.2% |
| Comanche | 60.8 /100 | #165 | Good 10.2% |
| Immigrants | Costa Rica | 60.5 /100 | #166 | Good 10.3% |
| Immigrants | Saudi Arabia | 58.8 /100 | #167 | Average 10.3% |
| Indonesians | 56.7 /100 | #168 | Average 10.3% |
| Lumbee | 54.7 /100 | #169 | Average 10.3% |
| Immigrants | Latin America | 53.2 /100 | #170 | Average 10.4% |
| Hmong | 52.7 /100 | #171 | Average 10.4% |
| Brazilians | 51.7 /100 | #172 | Average 10.4% |
| Filipinos | 50.1 /100 | #173 | Average 10.4% |
| Immigrants | Sudan | 50.0 /100 | #174 | Average 10.4% |
| Immigrants | Burma/Myanmar | 49.1 /100 | #175 | Average 10.4% |
| French American Indians | 49.1 /100 | #176 | Average 10.4% |
| Immigrants | El Salvador | 49.1 /100 | #177 | Average 10.4% |