Yaqui vs Delaware Disability Age Over 75
COMPARE
Yaqui
Delaware
Disability Age Over 75
Disability Age Over 75 Comparison
Yaqui
Delaware
49.8%
DISABILITY AGE OVER 75
0.0/ 100
METRIC RATING
288th/ 347
METRIC RANK
47.5%
DISABILITY AGE OVER 75
39.1/ 100
METRIC RATING
183rd/ 347
METRIC RANK
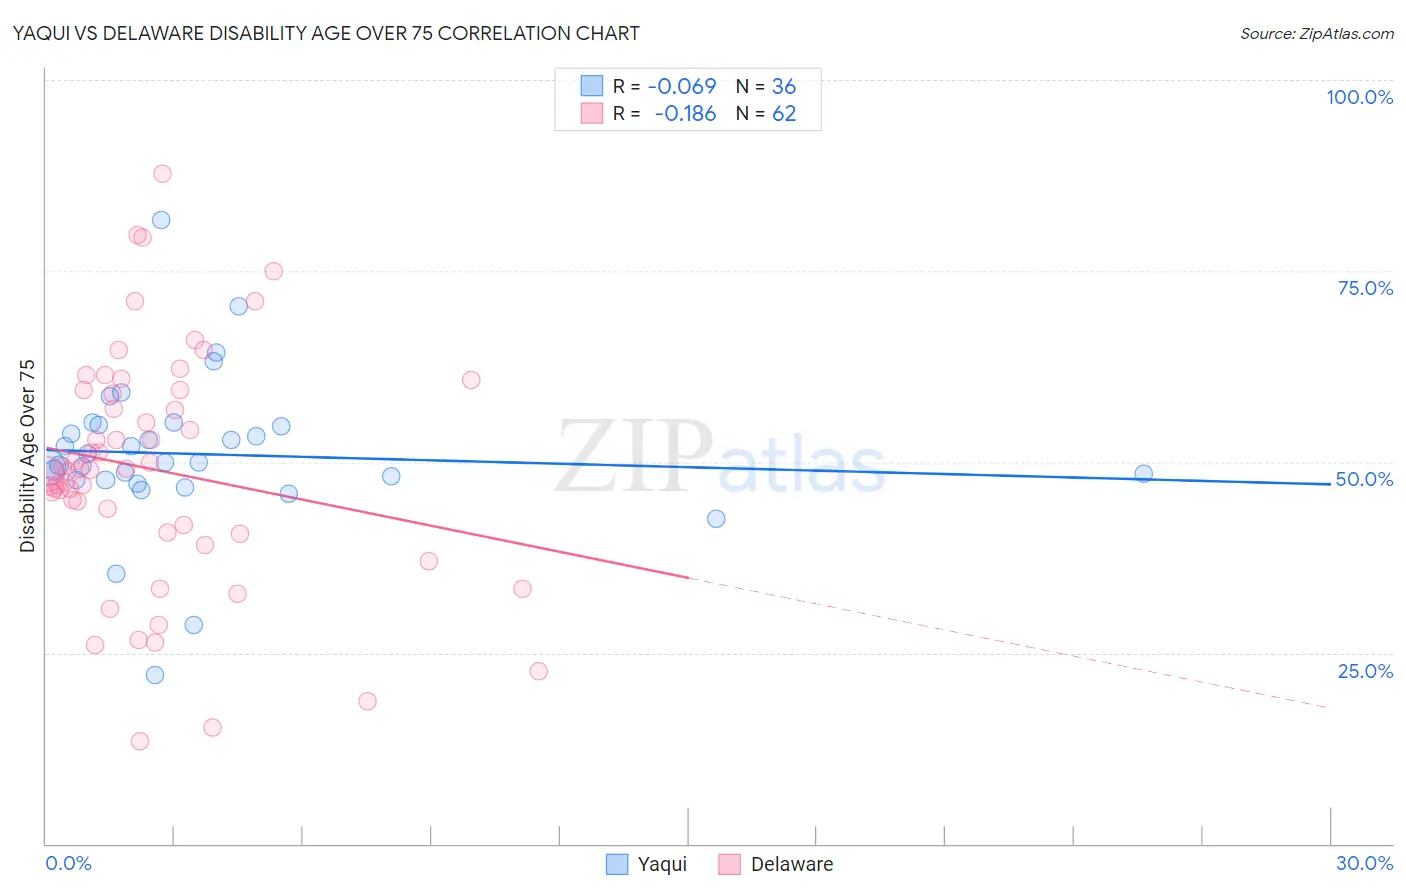
Yaqui vs Delaware Disability Age Over 75 Correlation Chart
The statistical analysis conducted on geographies consisting of 107,650,566 people shows a slight negative correlation between the proportion of Yaqui and percentage of population with a disability over the age of 75 in the United States with a correlation coefficient (R) of -0.069 and weighted average of 49.8%. Similarly, the statistical analysis conducted on geographies consisting of 96,205,722 people shows a poor negative correlation between the proportion of Delaware and percentage of population with a disability over the age of 75 in the United States with a correlation coefficient (R) of -0.186 and weighted average of 47.5%, a difference of 4.9%.
Disability Age Over 75 Correlation Summary
| Measurement | Yaqui | Delaware |
| Minimum | 22.1% | 13.3% |
| Maximum | 81.7% | 87.7% |
| Range | 59.5% | 74.4% |
| Mean | 51.0% | 49.0% |
| Median | 50.0% | 49.0% |
| Interquartile 25% (IQ1) | 47.6% | 40.8% |
| Interquartile 75% (IQ3) | 54.8% | 59.4% |
| Interquartile Range (IQR) | 7.1% | 18.6% |
| Standard Deviation (Sample) | 10.2% | 15.5% |
| Standard Deviation (Population) | 10.1% | 15.4% |
Similar Demographics by Disability Age Over 75
Demographics Similar to Yaqui by Disability Age Over 75
In terms of disability age over 75, the demographic groups most similar to Yaqui are Sioux (49.7%, a difference of 0.050%), Osage (49.8%, a difference of 0.080%), Puget Sound Salish (49.8%, a difference of 0.090%), Arapaho (49.8%, a difference of 0.090%), and Shoshone (49.9%, a difference of 0.16%).
| Demographics | Rating | Rank | Disability Age Over 75 |
| Belizeans | 0.0 /100 | #281 | Tragic 49.4% |
| Blacks/African Americans | 0.0 /100 | #282 | Tragic 49.5% |
| Samoans | 0.0 /100 | #283 | Tragic 49.5% |
| Immigrants | Latin America | 0.0 /100 | #284 | Tragic 49.5% |
| Crow | 0.0 /100 | #285 | Tragic 49.6% |
| Immigrants | Belize | 0.0 /100 | #286 | Tragic 49.6% |
| Sioux | 0.0 /100 | #287 | Tragic 49.7% |
| Yaqui | 0.0 /100 | #288 | Tragic 49.8% |
| Osage | 0.0 /100 | #289 | Tragic 49.8% |
| Puget Sound Salish | 0.0 /100 | #290 | Tragic 49.8% |
| Arapaho | 0.0 /100 | #291 | Tragic 49.8% |
| Shoshone | 0.0 /100 | #292 | Tragic 49.9% |
| Spanish American Indians | 0.0 /100 | #293 | Tragic 49.9% |
| Immigrants | Cambodia | 0.0 /100 | #294 | Tragic 50.0% |
| Spanish Americans | 0.0 /100 | #295 | Tragic 50.0% |
Demographics Similar to Delaware by Disability Age Over 75
In terms of disability age over 75, the demographic groups most similar to Delaware are Immigrants from Moldova (47.4%, a difference of 0.020%), Immigrants from Kazakhstan (47.4%, a difference of 0.030%), Sierra Leonean (47.4%, a difference of 0.060%), Immigrants from Ecuador (47.4%, a difference of 0.060%), and Cuban (47.4%, a difference of 0.070%).
| Demographics | Rating | Rank | Disability Age Over 75 |
| Ecuadorians | 46.7 /100 | #176 | Average 47.4% |
| Haitians | 44.6 /100 | #177 | Average 47.4% |
| Cubans | 42.1 /100 | #178 | Average 47.4% |
| Sierra Leoneans | 41.7 /100 | #179 | Average 47.4% |
| Immigrants | Ecuador | 41.7 /100 | #180 | Average 47.4% |
| Immigrants | Kazakhstan | 40.4 /100 | #181 | Average 47.4% |
| Immigrants | Moldova | 39.9 /100 | #182 | Fair 47.4% |
| Delaware | 39.1 /100 | #183 | Fair 47.5% |
| Immigrants | Nigeria | 34.0 /100 | #184 | Fair 47.5% |
| Ghanaians | 33.0 /100 | #185 | Fair 47.5% |
| Sudanese | 32.0 /100 | #186 | Fair 47.5% |
| Immigrants | Sudan | 31.8 /100 | #187 | Fair 47.5% |
| Basques | 30.9 /100 | #188 | Fair 47.6% |
| Immigrants | Kenya | 30.8 /100 | #189 | Fair 47.6% |
| Somalis | 29.5 /100 | #190 | Fair 47.6% |