White/Caucasian vs Yup'ik Unemployment Among Youth under 25 years
COMPARE
White/Caucasian
Yup'ik
Unemployment Among Youth under 25 years
Unemployment Among Youth under 25 years Comparison
Whites/Caucasians
Yup'ik
11.2%
UNEMPLOYMENT AMONG YOUTH UNDER 25 YEARS
96.9/ 100
METRIC RATING
77th/ 347
METRIC RANK
23.7%
UNEMPLOYMENT AMONG YOUTH UNDER 25 YEARS
0.0/ 100
METRIC RATING
347th/ 347
METRIC RANK
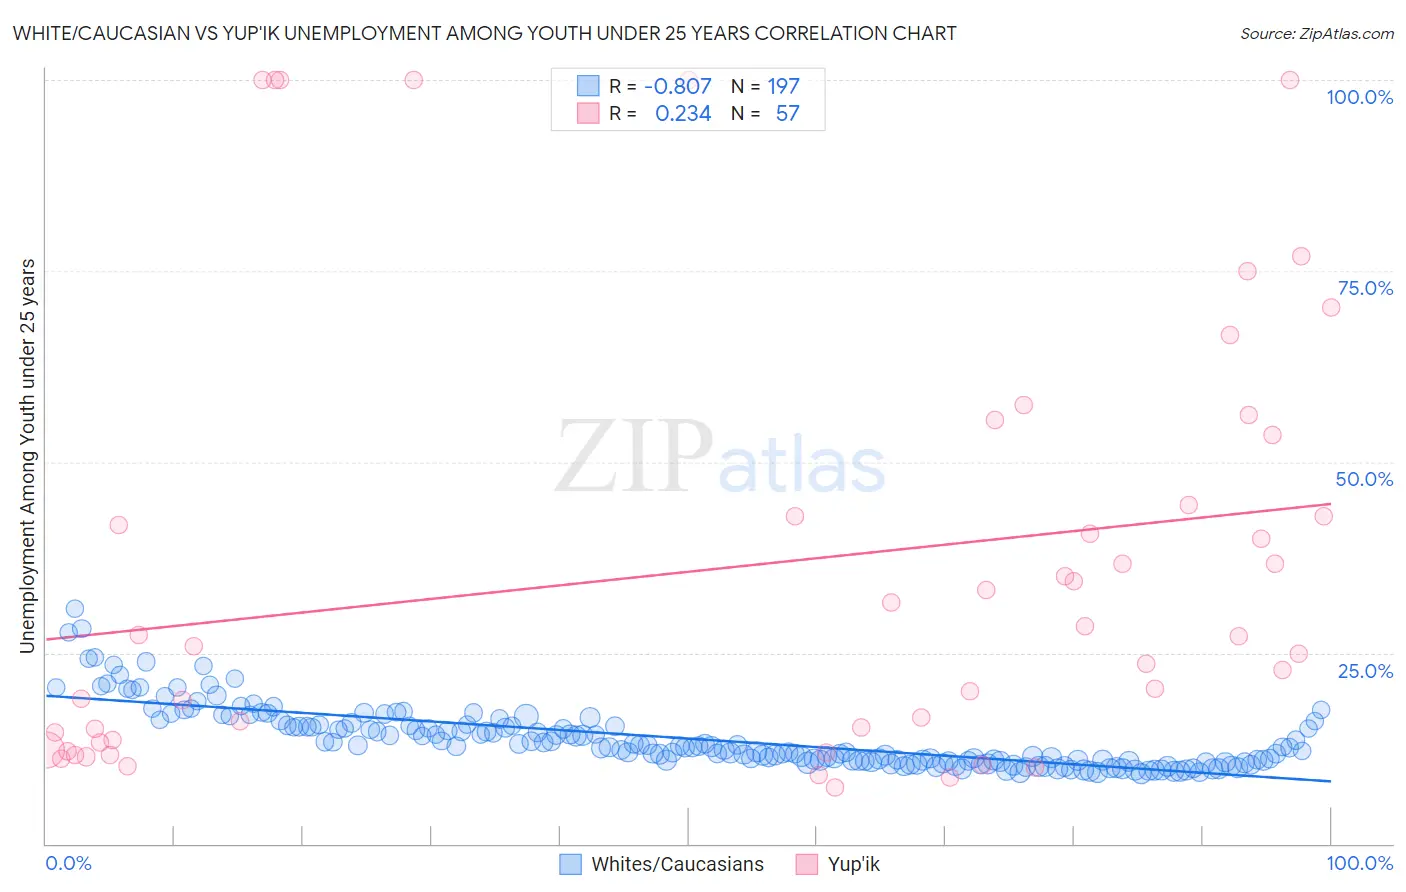
White/Caucasian vs Yup'ik Unemployment Among Youth under 25 years Correlation Chart
The statistical analysis conducted on geographies consisting of 555,079,229 people shows a very strong negative correlation between the proportion of Whites/Caucasians and unemployment rate among youth under the age of 25 in the United States with a correlation coefficient (R) of -0.807 and weighted average of 11.2%. Similarly, the statistical analysis conducted on geographies consisting of 39,847,863 people shows a weak positive correlation between the proportion of Yup'ik and unemployment rate among youth under the age of 25 in the United States with a correlation coefficient (R) of 0.234 and weighted average of 23.7%, a difference of 112.2%.
Unemployment Among Youth under 25 years Correlation Summary
| Measurement | White/Caucasian | Yup'ik |
| Minimum | 9.2% | 7.3% |
| Maximum | 30.8% | 100.0% |
| Range | 21.5% | 92.7% |
| Mean | 13.7% | 36.3% |
| Median | 12.7% | 27.1% |
| Interquartile 25% (IQ1) | 10.8% | 13.4% |
| Interquartile 75% (IQ3) | 15.5% | 49.0% |
| Interquartile Range (IQR) | 4.7% | 35.5% |
| Standard Deviation (Sample) | 4.0% | 28.4% |
| Standard Deviation (Population) | 3.9% | 28.1% |
Similar Demographics by Unemployment Among Youth under 25 years
Demographics Similar to Whites/Caucasians by Unemployment Among Youth under 25 years
In terms of unemployment among youth under 25 years, the demographic groups most similar to Whites/Caucasians are German Russian (11.2%, a difference of 0.050%), Immigrants from Nicaragua (11.2%, a difference of 0.060%), Immigrants from Canada (11.2%, a difference of 0.070%), French (11.2%, a difference of 0.080%), and New Zealander (11.2%, a difference of 0.11%).
| Demographics | Rating | Rank | Unemployment Among Youth under 25 years |
| Slavs | 97.5 /100 | #70 | Exceptional 11.2% |
| Bhutanese | 97.4 /100 | #71 | Exceptional 11.2% |
| Immigrants | Australia | 97.3 /100 | #72 | Exceptional 11.2% |
| Creek | 97.2 /100 | #73 | Exceptional 11.2% |
| New Zealanders | 97.2 /100 | #74 | Exceptional 11.2% |
| French | 97.1 /100 | #75 | Exceptional 11.2% |
| German Russians | 97.0 /100 | #76 | Exceptional 11.2% |
| Whites/Caucasians | 96.9 /100 | #77 | Exceptional 11.2% |
| Immigrants | Nicaragua | 96.7 /100 | #78 | Exceptional 11.2% |
| Immigrants | Canada | 96.7 /100 | #79 | Exceptional 11.2% |
| Immigrants | Bulgaria | 96.4 /100 | #80 | Exceptional 11.2% |
| Icelanders | 96.3 /100 | #81 | Exceptional 11.2% |
| Northern Europeans | 96.2 /100 | #82 | Exceptional 11.2% |
| Bolivians | 96.1 /100 | #83 | Exceptional 11.2% |
| French Canadians | 95.9 /100 | #84 | Exceptional 11.2% |
Demographics Similar to Yup'ik by Unemployment Among Youth under 25 years
In terms of unemployment among youth under 25 years, the demographic groups most similar to Yup'ik are Inupiat (22.0%, a difference of 8.0%), Hopi (21.5%, a difference of 10.6%), Crow (20.1%, a difference of 18.4%), Navajo (18.6%, a difference of 27.6%), and Puerto Rican (18.4%, a difference of 29.0%).
| Demographics | Rating | Rank | Unemployment Among Youth under 25 years |
| Guyanese | 0.0 /100 | #333 | Tragic 15.9% |
| Immigrants | Guyana | 0.0 /100 | #334 | Tragic 15.9% |
| Immigrants | St. Vincent and the Grenadines | 0.0 /100 | #335 | Tragic 16.1% |
| Pima | 0.0 /100 | #336 | Tragic 16.2% |
| Arapaho | 0.0 /100 | #337 | Tragic 16.3% |
| Yuman | 0.0 /100 | #338 | Tragic 16.3% |
| Tsimshian | 0.0 /100 | #339 | Tragic 16.5% |
| Colville | 0.0 /100 | #340 | Tragic 16.8% |
| Paiute | 0.0 /100 | #341 | Tragic 17.6% |
| Puerto Ricans | 0.0 /100 | #342 | Tragic 18.4% |
| Navajo | 0.0 /100 | #343 | Tragic 18.6% |
| Crow | 0.0 /100 | #344 | Tragic 20.1% |
| Hopi | 0.0 /100 | #345 | Tragic 21.5% |
| Inupiat | 0.0 /100 | #346 | Tragic 22.0% |
| Yup'ik | 0.0 /100 | #347 | Tragic 23.7% |