Tsimshian vs Potawatomi Unemployment Among Ages 25 to 29 years
COMPARE
Tsimshian
Potawatomi
Unemployment Among Ages 25 to 29 years
Unemployment Among Ages 25 to 29 years Comparison
Tsimshian
Potawatomi
8.0%
UNEMPLOYMENT AMONG AGES 25 TO 29 YEARS
0.0/ 100
METRIC RATING
305th/ 347
METRIC RANK
7.1%
UNEMPLOYMENT AMONG AGES 25 TO 29 YEARS
1.3/ 100
METRIC RATING
239th/ 347
METRIC RANK
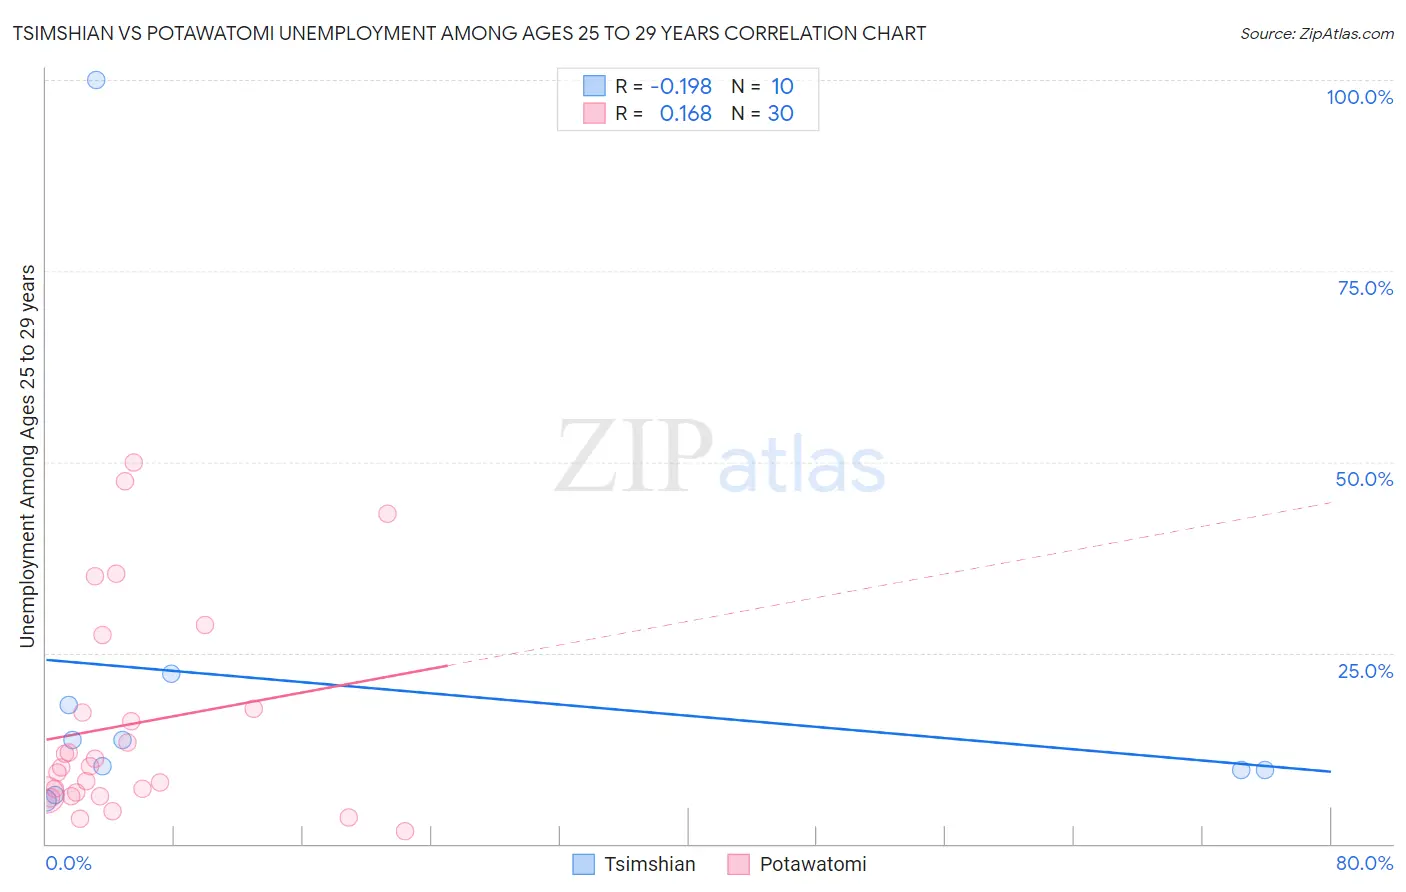
Tsimshian vs Potawatomi Unemployment Among Ages 25 to 29 years Correlation Chart
The statistical analysis conducted on geographies consisting of 15,388,943 people shows a poor negative correlation between the proportion of Tsimshian and unemployment rate among population between the ages 25 and 29 in the United States with a correlation coefficient (R) of -0.198 and weighted average of 8.0%. Similarly, the statistical analysis conducted on geographies consisting of 114,824,106 people shows a poor positive correlation between the proportion of Potawatomi and unemployment rate among population between the ages 25 and 29 in the United States with a correlation coefficient (R) of 0.168 and weighted average of 7.1%, a difference of 13.3%.
Unemployment Among Ages 25 to 29 years Correlation Summary
| Measurement | Tsimshian | Potawatomi |
| Minimum | 5.7% | 1.7% |
| Maximum | 100.0% | 50.0% |
| Range | 94.3% | 48.3% |
| Mean | 20.9% | 15.7% |
| Median | 11.9% | 10.1% |
| Interquartile 25% (IQ1) | 9.6% | 6.3% |
| Interquartile 75% (IQ3) | 18.2% | 17.6% |
| Interquartile Range (IQR) | 8.6% | 11.3% |
| Standard Deviation (Sample) | 28.3% | 13.8% |
| Standard Deviation (Population) | 26.8% | 13.5% |
Similar Demographics by Unemployment Among Ages 25 to 29 years
Demographics Similar to Tsimshian by Unemployment Among Ages 25 to 29 years
In terms of unemployment among ages 25 to 29 years, the demographic groups most similar to Tsimshian are Haitian (8.0%, a difference of 0.080%), Immigrants from Barbados (8.0%, a difference of 0.24%), Cajun (8.0%, a difference of 0.26%), Immigrants from Yemen (8.0%, a difference of 0.48%), and Immigrants from Jamaica (8.1%, a difference of 0.66%).
| Demographics | Rating | Rank | Unemployment Among Ages 25 to 29 years |
| Immigrants | Trinidad and Tobago | 0.0 /100 | #298 | Tragic 7.9% |
| Barbadians | 0.0 /100 | #299 | Tragic 7.9% |
| Central American Indians | 0.0 /100 | #300 | Tragic 7.9% |
| West Indians | 0.0 /100 | #301 | Tragic 7.9% |
| Jamaicans | 0.0 /100 | #302 | Tragic 7.9% |
| Immigrants | Yemen | 0.0 /100 | #303 | Tragic 8.0% |
| Cajuns | 0.0 /100 | #304 | Tragic 8.0% |
| Tsimshian | 0.0 /100 | #305 | Tragic 8.0% |
| Haitians | 0.0 /100 | #306 | Tragic 8.0% |
| Immigrants | Barbados | 0.0 /100 | #307 | Tragic 8.0% |
| Immigrants | Jamaica | 0.0 /100 | #308 | Tragic 8.1% |
| Immigrants | Haiti | 0.0 /100 | #309 | Tragic 8.1% |
| U.S. Virgin Islanders | 0.0 /100 | #310 | Tragic 8.1% |
| Immigrants | Azores | 0.0 /100 | #311 | Tragic 8.1% |
| Dutch West Indians | 0.0 /100 | #312 | Tragic 8.2% |
Demographics Similar to Potawatomi by Unemployment Among Ages 25 to 29 years
In terms of unemployment among ages 25 to 29 years, the demographic groups most similar to Potawatomi are Native Hawaiian (7.1%, a difference of 0.030%), Immigrants from Sierra Leone (7.1%, a difference of 0.070%), Spanish American Indian (7.1%, a difference of 0.34%), Honduran (7.1%, a difference of 0.46%), and Yaqui (7.1%, a difference of 0.46%).
| Demographics | Rating | Rank | Unemployment Among Ages 25 to 29 years |
| Spanish Americans | 2.7 /100 | #232 | Tragic 7.0% |
| Immigrants | Honduras | 2.4 /100 | #233 | Tragic 7.0% |
| French Canadians | 2.4 /100 | #234 | Tragic 7.0% |
| Panamanians | 2.1 /100 | #235 | Tragic 7.0% |
| Cape Verdeans | 1.9 /100 | #236 | Tragic 7.0% |
| Puget Sound Salish | 1.8 /100 | #237 | Tragic 7.1% |
| Hondurans | 1.8 /100 | #238 | Tragic 7.1% |
| Potawatomi | 1.3 /100 | #239 | Tragic 7.1% |
| Native Hawaiians | 1.3 /100 | #240 | Tragic 7.1% |
| Immigrants | Sierra Leone | 1.3 /100 | #241 | Tragic 7.1% |
| Spanish American Indians | 1.1 /100 | #242 | Tragic 7.1% |
| Yaqui | 1.0 /100 | #243 | Tragic 7.1% |
| Immigrants | Nonimmigrants | 0.9 /100 | #244 | Tragic 7.1% |
| Guatemalans | 0.9 /100 | #245 | Tragic 7.1% |
| Immigrants | Uzbekistan | 0.7 /100 | #246 | Tragic 7.2% |