Macedonian vs New Zealander 4 or more Vehicles in Household
COMPARE
Macedonian
New Zealander
4 or more Vehicles in Household
4 or more Vehicles in Household Comparison
Macedonians
New Zealanders
5.5%
4 OR MORE VEHICLES IN HOUSEHOLD
0.6/ 100
METRIC RATING
273rd/ 347
METRIC RANK
6.5%
4 OR MORE VEHICLES IN HOUSEHOLD
73.3/ 100
METRIC RATING
150th/ 347
METRIC RANK
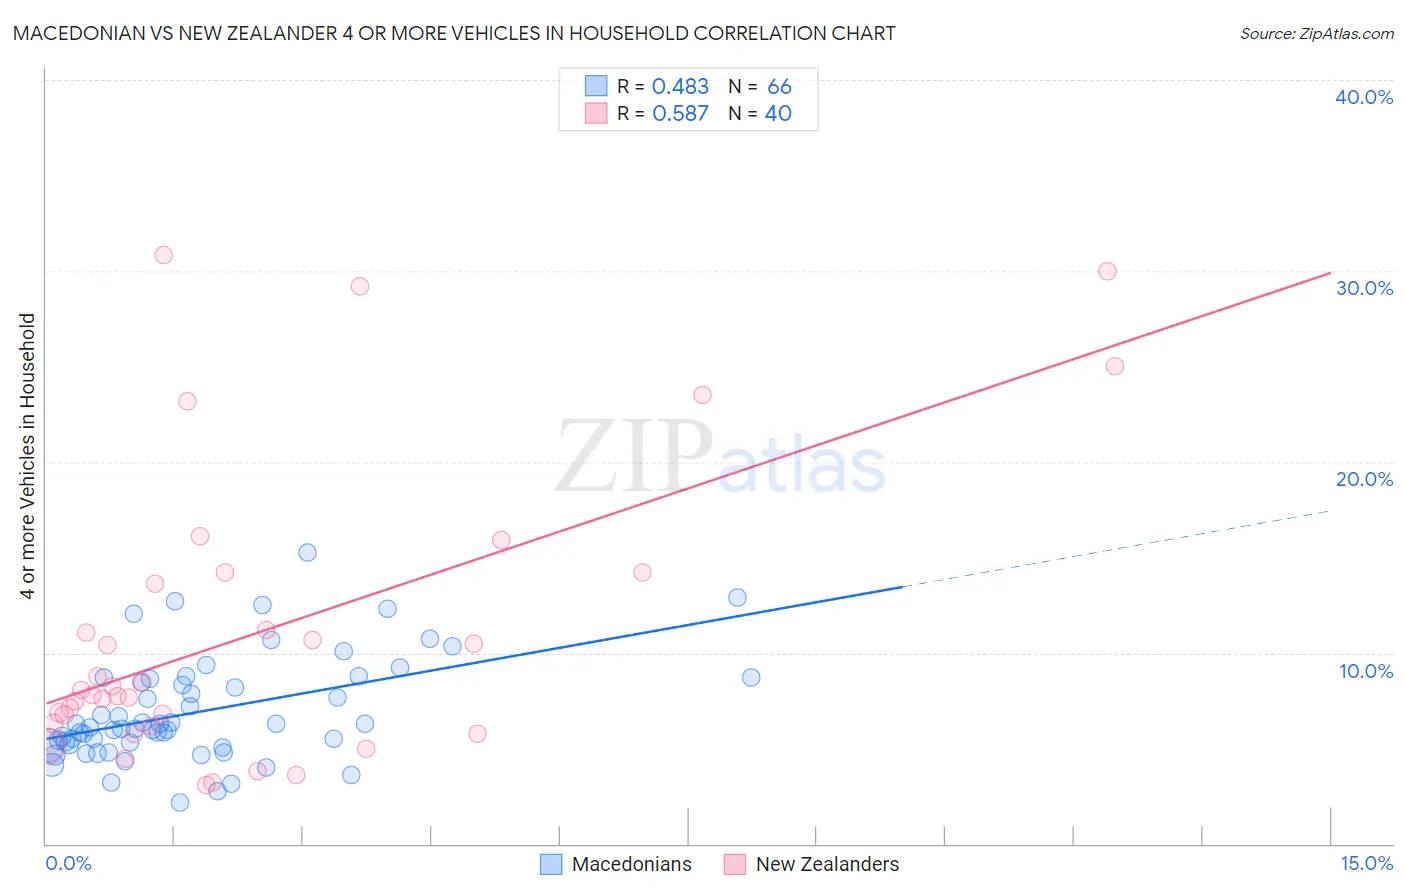
Macedonian vs New Zealander 4 or more Vehicles in Household Correlation Chart
The statistical analysis conducted on geographies consisting of 131,939,711 people shows a moderate positive correlation between the proportion of Macedonians and percentage of households with 4 or more vehicles available in the United States with a correlation coefficient (R) of 0.483 and weighted average of 5.5%. Similarly, the statistical analysis conducted on geographies consisting of 106,639,386 people shows a substantial positive correlation between the proportion of New Zealanders and percentage of households with 4 or more vehicles available in the United States with a correlation coefficient (R) of 0.587 and weighted average of 6.5%, a difference of 17.9%.
4 or more Vehicles in Household Correlation Summary
| Measurement | Macedonian | New Zealander |
| Minimum | 2.1% | 3.1% |
| Maximum | 15.3% | 30.9% |
| Range | 13.1% | 27.8% |
| Mean | 6.9% | 11.0% |
| Median | 6.1% | 7.9% |
| Interquartile 25% (IQ1) | 5.2% | 6.2% |
| Interquartile 75% (IQ3) | 8.7% | 13.9% |
| Interquartile Range (IQR) | 3.5% | 7.7% |
| Standard Deviation (Sample) | 2.7% | 7.6% |
| Standard Deviation (Population) | 2.7% | 7.5% |
Similar Demographics by 4 or more Vehicles in Household
Demographics Similar to Macedonians by 4 or more Vehicles in Household
In terms of 4 or more vehicles in household, the demographic groups most similar to Macedonians are Immigrants from Kazakhstan (5.5%, a difference of 0.030%), Black/African American (5.5%, a difference of 0.12%), Immigrants from Sudan (5.5%, a difference of 0.23%), Cambodian (5.5%, a difference of 0.24%), and Immigrants from Latvia (5.5%, a difference of 0.25%).
| Demographics | Rating | Rank | 4 or more Vehicles in Household |
| Immigrants | Nepal | 0.9 /100 | #266 | Tragic 5.6% |
| Immigrants | Ukraine | 0.9 /100 | #267 | Tragic 5.6% |
| Colombians | 0.7 /100 | #268 | Tragic 5.5% |
| Carpatho Rusyns | 0.7 /100 | #269 | Tragic 5.5% |
| Okinawans | 0.6 /100 | #270 | Tragic 5.5% |
| Immigrants | Sudan | 0.6 /100 | #271 | Tragic 5.5% |
| Immigrants | Kazakhstan | 0.6 /100 | #272 | Tragic 5.5% |
| Macedonians | 0.6 /100 | #273 | Tragic 5.5% |
| Blacks/African Americans | 0.6 /100 | #274 | Tragic 5.5% |
| Cambodians | 0.5 /100 | #275 | Tragic 5.5% |
| Immigrants | Latvia | 0.5 /100 | #276 | Tragic 5.5% |
| Immigrants | Bulgaria | 0.5 /100 | #277 | Tragic 5.5% |
| Immigrants | Eastern Europe | 0.4 /100 | #278 | Tragic 5.4% |
| Immigrants | Uruguay | 0.3 /100 | #279 | Tragic 5.4% |
| Alsatians | 0.3 /100 | #280 | Tragic 5.4% |
Demographics Similar to New Zealanders by 4 or more Vehicles in Household
In terms of 4 or more vehicles in household, the demographic groups most similar to New Zealanders are Immigrants from Jordan (6.5%, a difference of 0.040%), Greek (6.5%, a difference of 0.040%), Immigrants from Iran (6.5%, a difference of 0.080%), Immigrants from Costa Rica (6.5%, a difference of 0.13%), and Immigrants from Hong Kong (6.5%, a difference of 0.14%).
| Demographics | Rating | Rank | 4 or more Vehicles in Household |
| Immigrants | Canada | 78.6 /100 | #143 | Good 6.5% |
| Immigrants | North America | 78.5 /100 | #144 | Good 6.5% |
| Croatians | 77.8 /100 | #145 | Good 6.5% |
| Immigrants | Costa Rica | 74.4 /100 | #146 | Good 6.5% |
| Immigrants | Iran | 73.9 /100 | #147 | Good 6.5% |
| Immigrants | Jordan | 73.7 /100 | #148 | Good 6.5% |
| Greeks | 73.6 /100 | #149 | Good 6.5% |
| New Zealanders | 73.3 /100 | #150 | Good 6.5% |
| Immigrants | Hong Kong | 72.2 /100 | #151 | Good 6.5% |
| Yuman | 72.1 /100 | #152 | Good 6.5% |
| Immigrants | Armenia | 71.2 /100 | #153 | Good 6.5% |
| Central American Indians | 71.1 /100 | #154 | Good 6.5% |
| Iroquois | 70.4 /100 | #155 | Good 6.5% |
| Iranians | 69.9 /100 | #156 | Good 6.5% |
| Peruvians | 69.4 /100 | #157 | Good 6.5% |