Tongan vs Estonian Unemployment Among Ages 16 to 19 years
COMPARE
Tongan
Estonian
Unemployment Among Ages 16 to 19 years
Unemployment Among Ages 16 to 19 years Comparison
Tongans
Estonians
15.9%
UNEMPLOYMENT AMONG AGES 16 TO 19 YEARS
100.0/ 100
METRIC RATING
24th/ 347
METRIC RANK
17.0%
UNEMPLOYMENT AMONG AGES 16 TO 19 YEARS
94.3/ 100
METRIC RATING
106th/ 347
METRIC RANK
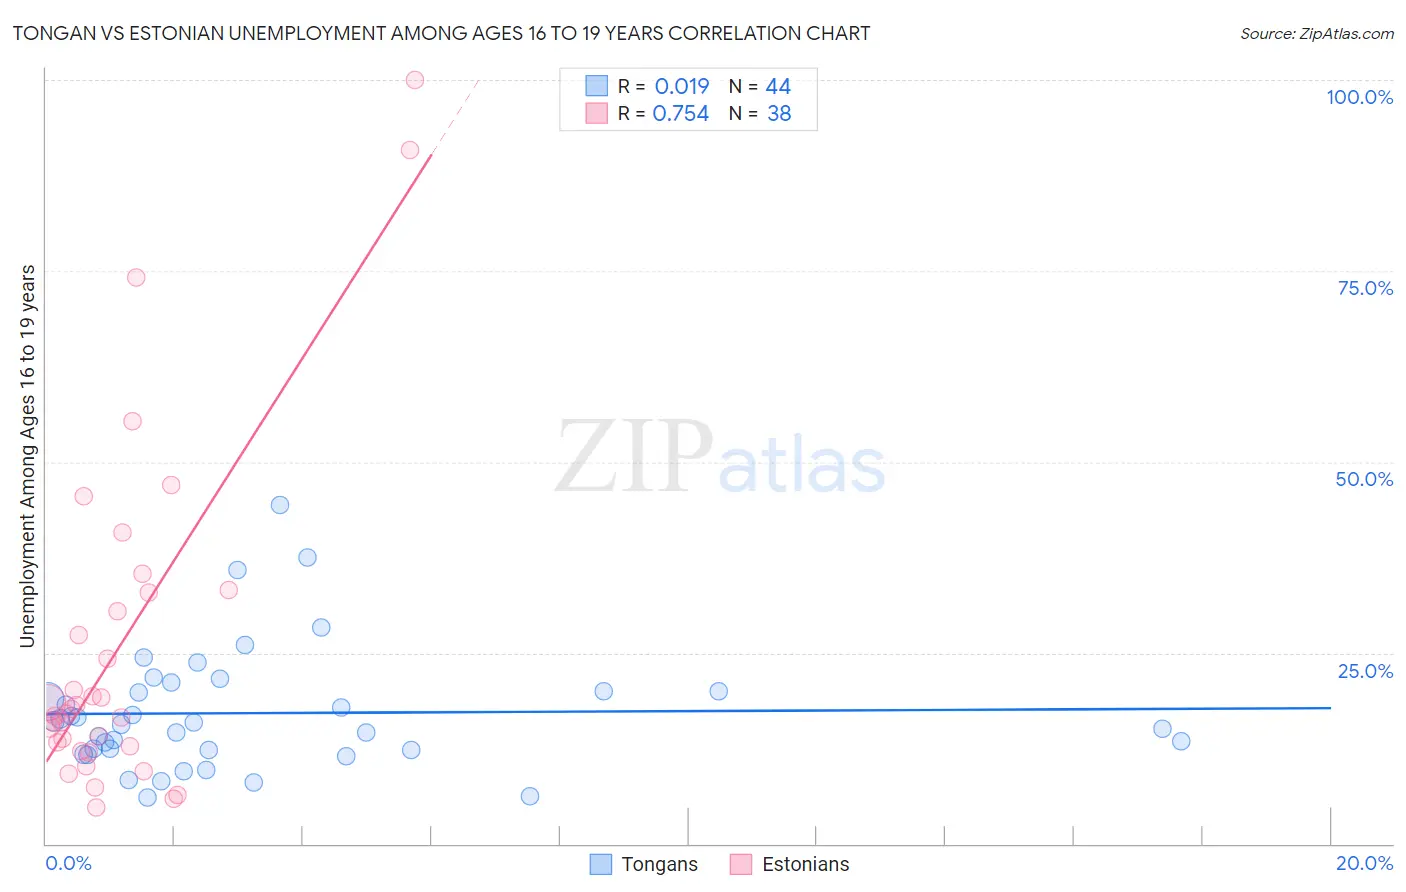
Tongan vs Estonian Unemployment Among Ages 16 to 19 years Correlation Chart
The statistical analysis conducted on geographies consisting of 101,140,263 people shows no correlation between the proportion of Tongans and unemployment rate among population between the ages 16 and 19 in the United States with a correlation coefficient (R) of 0.019 and weighted average of 15.9%. Similarly, the statistical analysis conducted on geographies consisting of 120,320,445 people shows a strong positive correlation between the proportion of Estonians and unemployment rate among population between the ages 16 and 19 in the United States with a correlation coefficient (R) of 0.754 and weighted average of 17.0%, a difference of 6.8%.
Unemployment Among Ages 16 to 19 years Correlation Summary
| Measurement | Tongan | Estonian |
| Minimum | 6.1% | 4.7% |
| Maximum | 44.3% | 100.0% |
| Range | 38.2% | 95.3% |
| Mean | 17.1% | 25.7% |
| Median | 15.8% | 17.4% |
| Interquartile 25% (IQ1) | 12.2% | 12.7% |
| Interquartile 75% (IQ3) | 20.0% | 32.9% |
| Interquartile Range (IQR) | 7.8% | 20.2% |
| Standard Deviation (Sample) | 8.0% | 22.3% |
| Standard Deviation (Population) | 7.9% | 22.0% |
Similar Demographics by Unemployment Among Ages 16 to 19 years
Demographics Similar to Tongans by Unemployment Among Ages 16 to 19 years
In terms of unemployment among ages 16 to 19 years, the demographic groups most similar to Tongans are Filipino (15.9%, a difference of 0.10%), Belgian (15.9%, a difference of 0.15%), Dutch (15.9%, a difference of 0.16%), Finnish (15.9%, a difference of 0.19%), and Immigrants from Taiwan (15.8%, a difference of 0.56%).
| Demographics | Rating | Rank | Unemployment Among Ages 16 to 19 years |
| Somalis | 100.0 /100 | #17 | Exceptional 15.7% |
| Thais | 100.0 /100 | #18 | Exceptional 15.7% |
| Swiss | 100.0 /100 | #19 | Exceptional 15.8% |
| Sudanese | 100.0 /100 | #20 | Exceptional 15.8% |
| Immigrants | Taiwan | 100.0 /100 | #21 | Exceptional 15.8% |
| Finns | 100.0 /100 | #22 | Exceptional 15.9% |
| Belgians | 100.0 /100 | #23 | Exceptional 15.9% |
| Tongans | 100.0 /100 | #24 | Exceptional 15.9% |
| Filipinos | 100.0 /100 | #25 | Exceptional 15.9% |
| Dutch | 100.0 /100 | #26 | Exceptional 15.9% |
| Immigrants | Sudan | 99.9 /100 | #27 | Exceptional 16.0% |
| Jordanians | 99.9 /100 | #28 | Exceptional 16.0% |
| Chinese | 99.9 /100 | #29 | Exceptional 16.0% |
| Kenyans | 99.9 /100 | #30 | Exceptional 16.1% |
| English | 99.9 /100 | #31 | Exceptional 16.1% |
Demographics Similar to Estonians by Unemployment Among Ages 16 to 19 years
In terms of unemployment among ages 16 to 19 years, the demographic groups most similar to Estonians are Immigrants from Bulgaria (17.0%, a difference of 0.0%), Immigrants from Brazil (17.0%, a difference of 0.030%), Malaysian (17.0%, a difference of 0.030%), Palestinian (17.0%, a difference of 0.050%), and Italian (17.0%, a difference of 0.050%).
| Demographics | Rating | Rank | Unemployment Among Ages 16 to 19 years |
| Immigrants | Lithuania | 94.9 /100 | #99 | Exceptional 17.0% |
| Immigrants | Thailand | 94.7 /100 | #100 | Exceptional 17.0% |
| Immigrants | Saudi Arabia | 94.7 /100 | #101 | Exceptional 17.0% |
| Immigrants | Pakistan | 94.6 /100 | #102 | Exceptional 17.0% |
| Palestinians | 94.6 /100 | #103 | Exceptional 17.0% |
| Italians | 94.5 /100 | #104 | Exceptional 17.0% |
| Immigrants | Bulgaria | 94.3 /100 | #105 | Exceptional 17.0% |
| Estonians | 94.3 /100 | #106 | Exceptional 17.0% |
| Immigrants | Brazil | 94.2 /100 | #107 | Exceptional 17.0% |
| Malaysians | 94.2 /100 | #108 | Exceptional 17.0% |
| Iranians | 94.1 /100 | #109 | Exceptional 17.0% |
| Immigrants | Netherlands | 93.9 /100 | #110 | Exceptional 17.0% |
| Immigrants | Asia | 93.9 /100 | #111 | Exceptional 17.0% |
| Immigrants | Iraq | 93.7 /100 | #112 | Exceptional 17.0% |
| Icelanders | 93.4 /100 | #113 | Exceptional 17.0% |