Tohono O'odham vs Chippewa 4 or more Vehicles in Household
COMPARE
Tohono O'odham
Chippewa
4 or more Vehicles in Household
4 or more Vehicles in Household Comparison
Tohono O'odham
Chippewa
6.6%
4 OR MORE VEHICLES IN HOUSEHOLD
86.7/ 100
METRIC RATING
135th/ 347
METRIC RANK
7.6%
4 OR MORE VEHICLES IN HOUSEHOLD
100.0/ 100
METRIC RATING
62nd/ 347
METRIC RANK
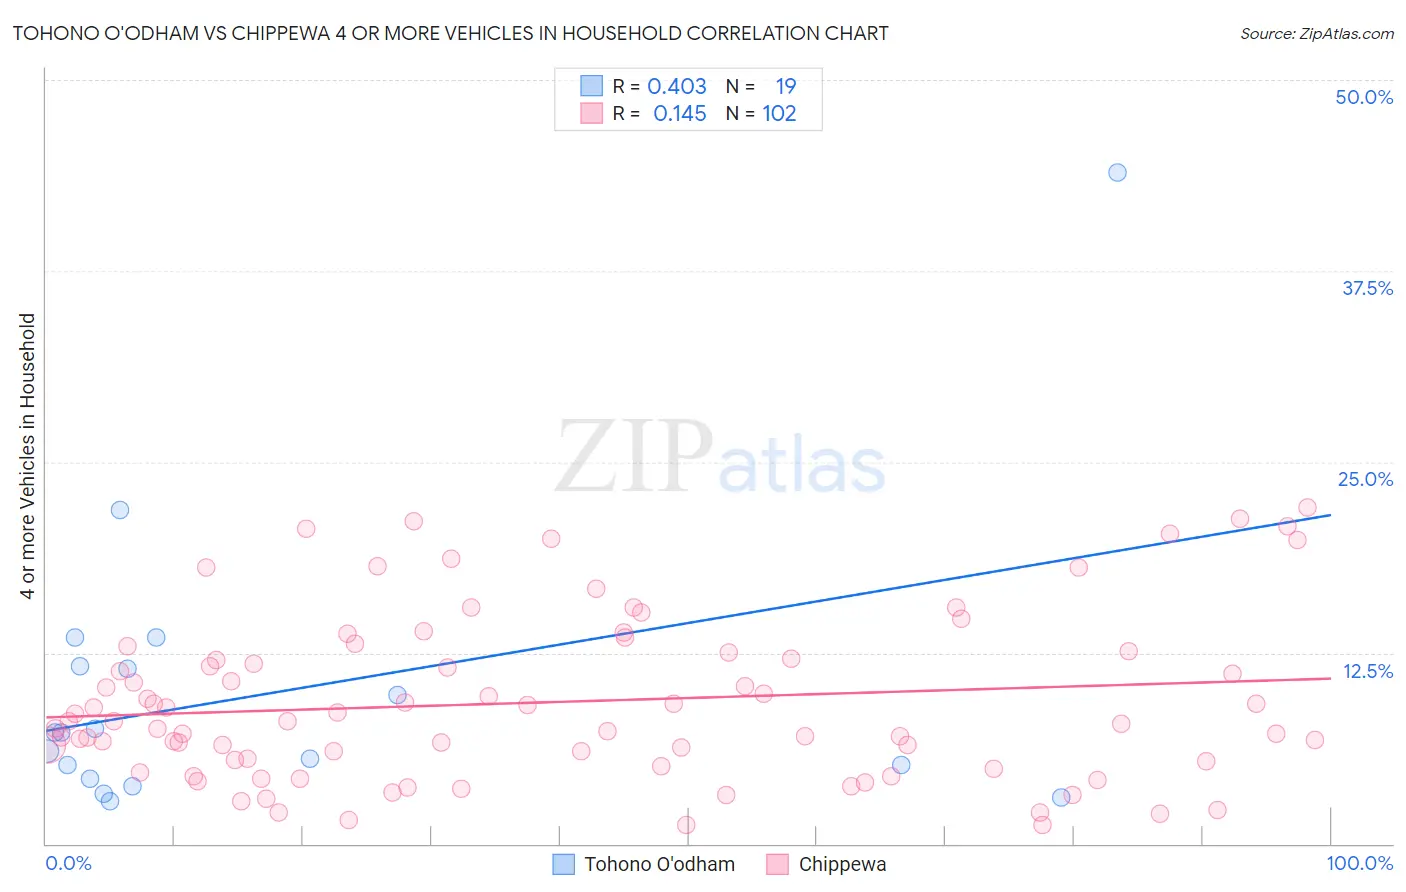
Tohono O'odham vs Chippewa 4 or more Vehicles in Household Correlation Chart
The statistical analysis conducted on geographies consisting of 58,702,005 people shows a moderate positive correlation between the proportion of Tohono O'odham and percentage of households with 4 or more vehicles available in the United States with a correlation coefficient (R) of 0.403 and weighted average of 6.6%. Similarly, the statistical analysis conducted on geographies consisting of 214,617,305 people shows a poor positive correlation between the proportion of Chippewa and percentage of households with 4 or more vehicles available in the United States with a correlation coefficient (R) of 0.145 and weighted average of 7.6%, a difference of 14.2%.
4 or more Vehicles in Household Correlation Summary
| Measurement | Tohono O'odham | Chippewa |
| Minimum | 2.8% | 1.2% |
| Maximum | 43.9% | 22.0% |
| Range | 41.1% | 20.8% |
| Mean | 9.8% | 9.3% |
| Median | 7.3% | 8.0% |
| Interquartile 25% (IQ1) | 4.3% | 5.4% |
| Interquartile 75% (IQ3) | 11.6% | 12.5% |
| Interquartile Range (IQR) | 7.3% | 7.1% |
| Standard Deviation (Sample) | 9.5% | 5.3% |
| Standard Deviation (Population) | 9.3% | 5.3% |
Similar Demographics by 4 or more Vehicles in Household
Demographics Similar to Tohono O'odham by 4 or more Vehicles in Household
In terms of 4 or more vehicles in household, the demographic groups most similar to Tohono O'odham are Ottawa (6.6%, a difference of 0.030%), Armenian (6.6%, a difference of 0.050%), Luxembourger (6.6%, a difference of 0.070%), Immigrants from Netherlands (6.6%, a difference of 0.24%), and French Canadian (6.6%, a difference of 0.27%).
| Demographics | Rating | Rank | 4 or more Vehicles in Household |
| Immigrants | Bolivia | 92.5 /100 | #128 | Exceptional 6.7% |
| Immigrants | England | 92.0 /100 | #129 | Exceptional 6.7% |
| Immigrants | Scotland | 89.0 /100 | #130 | Excellent 6.7% |
| Maltese | 88.4 /100 | #131 | Excellent 6.7% |
| Immigrants | Netherlands | 87.8 /100 | #132 | Excellent 6.6% |
| Armenians | 86.9 /100 | #133 | Excellent 6.6% |
| Ottawa | 86.9 /100 | #134 | Excellent 6.6% |
| Tohono O'odham | 86.7 /100 | #135 | Excellent 6.6% |
| Luxembourgers | 86.4 /100 | #136 | Excellent 6.6% |
| French Canadians | 85.4 /100 | #137 | Excellent 6.6% |
| Italians | 84.5 /100 | #138 | Excellent 6.6% |
| Jordanians | 82.1 /100 | #139 | Excellent 6.6% |
| Slavs | 81.6 /100 | #140 | Excellent 6.6% |
| Australians | 80.8 /100 | #141 | Excellent 6.6% |
| Immigrants | Iraq | 79.4 /100 | #142 | Good 6.5% |
Demographics Similar to Chippewa by 4 or more Vehicles in Household
In terms of 4 or more vehicles in household, the demographic groups most similar to Chippewa are Immigrants from Micronesia (7.6%, a difference of 0.010%), Bangladeshi (7.6%, a difference of 0.25%), European (7.6%, a difference of 0.26%), Immigrants from the Azores (7.5%, a difference of 0.29%), and Spaniard (7.6%, a difference of 0.52%).
| Demographics | Rating | Rank | 4 or more Vehicles in Household |
| Immigrants | Oceania | 100.0 /100 | #55 | Exceptional 7.6% |
| English | 100.0 /100 | #56 | Exceptional 7.6% |
| Pennsylvania Germans | 100.0 /100 | #57 | Exceptional 7.6% |
| Swedes | 100.0 /100 | #58 | Exceptional 7.6% |
| Hispanics or Latinos | 100.0 /100 | #59 | Exceptional 7.6% |
| Spaniards | 100.0 /100 | #60 | Exceptional 7.6% |
| Europeans | 100.0 /100 | #61 | Exceptional 7.6% |
| Chippewa | 100.0 /100 | #62 | Exceptional 7.6% |
| Immigrants | Micronesia | 100.0 /100 | #63 | Exceptional 7.6% |
| Bangladeshis | 100.0 /100 | #64 | Exceptional 7.6% |
| Immigrants | Azores | 100.0 /100 | #65 | Exceptional 7.5% |
| Immigrants | Taiwan | 99.9 /100 | #66 | Exceptional 7.5% |
| Americans | 99.9 /100 | #67 | Exceptional 7.5% |
| Welsh | 99.9 /100 | #68 | Exceptional 7.5% |
| Germans | 99.9 /100 | #69 | Exceptional 7.5% |