Tlingit-Haida vs Immigrants from Romania 1 or more Vehicles in Household
COMPARE
Tlingit-Haida
Immigrants from Romania
1 or more Vehicles in Household
1 or more Vehicles in Household Comparison
Tlingit-Haida
Immigrants from Romania
90.1%
1 OR MORE VEHICLES IN HOUSEHOLD
74.3/ 100
METRIC RATING
152nd/ 347
METRIC RANK
88.7%
1 OR MORE VEHICLES IN HOUSEHOLD
5.4/ 100
METRIC RATING
229th/ 347
METRIC RANK
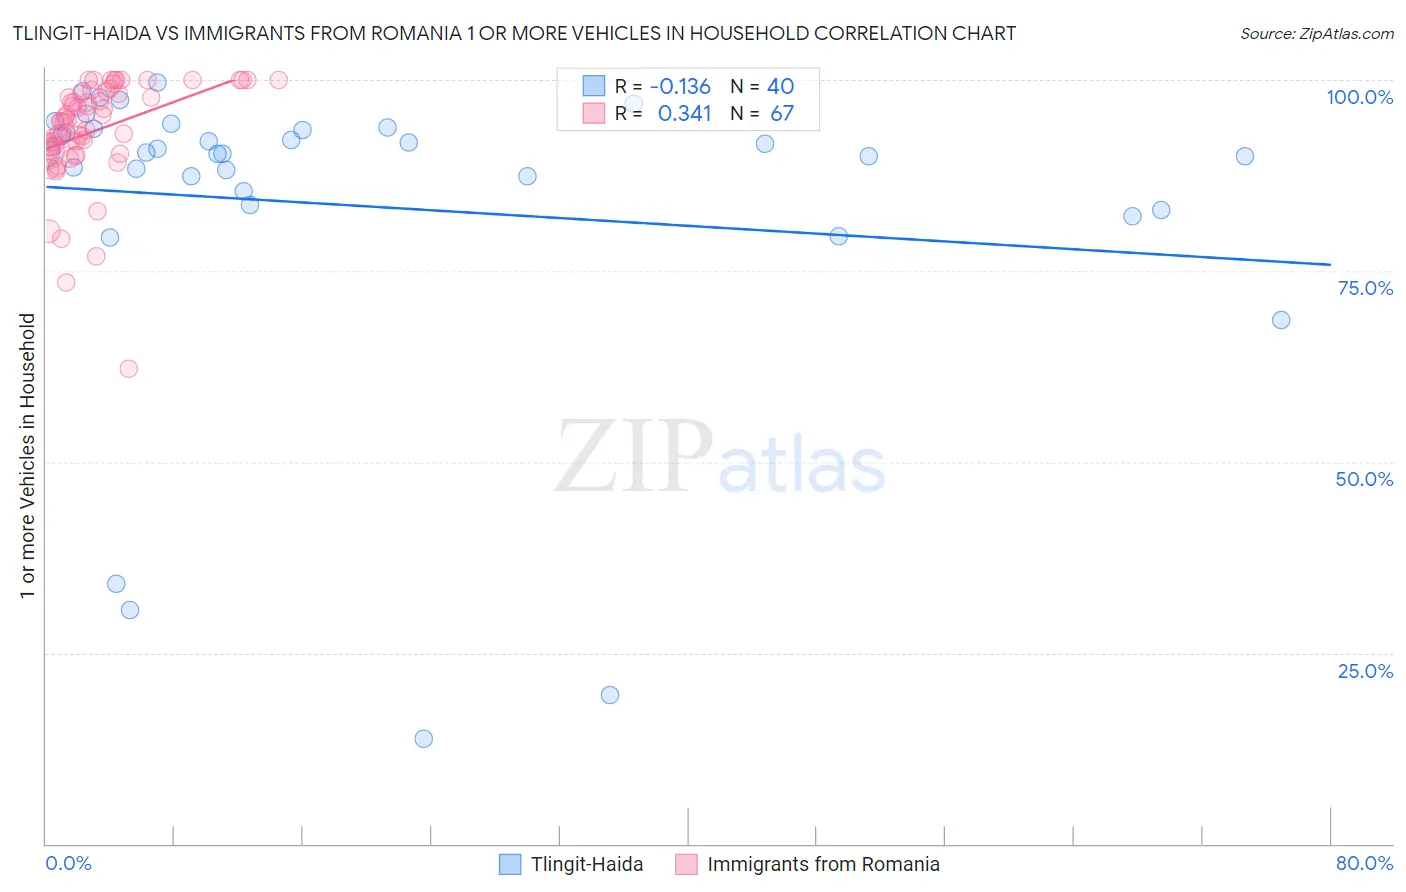
Tlingit-Haida vs Immigrants from Romania 1 or more Vehicles in Household Correlation Chart
The statistical analysis conducted on geographies consisting of 60,855,419 people shows a poor negative correlation between the proportion of Tlingit-Haida and percentage of households with 1 or more vehicles available in the United States with a correlation coefficient (R) of -0.136 and weighted average of 90.1%. Similarly, the statistical analysis conducted on geographies consisting of 256,889,891 people shows a mild positive correlation between the proportion of Immigrants from Romania and percentage of households with 1 or more vehicles available in the United States with a correlation coefficient (R) of 0.341 and weighted average of 88.7%, a difference of 1.5%.
1 or more Vehicles in Household Correlation Summary
| Measurement | Tlingit-Haida | Immigrants from Romania |
| Minimum | 13.7% | 62.3% |
| Maximum | 99.6% | 100.0% |
| Range | 85.9% | 37.7% |
| Mean | 83.5% | 93.3% |
| Median | 90.3% | 94.7% |
| Interquartile 25% (IQ1) | 84.6% | 91.1% |
| Interquartile 75% (IQ3) | 93.5% | 98.3% |
| Interquartile Range (IQR) | 9.0% | 7.1% |
| Standard Deviation (Sample) | 21.0% | 6.9% |
| Standard Deviation (Population) | 20.7% | 6.9% |
Similar Demographics by 1 or more Vehicles in Household
Demographics Similar to Tlingit-Haida by 1 or more Vehicles in Household
In terms of 1 or more vehicles in household, the demographic groups most similar to Tlingit-Haida are New Zealander (90.1%, a difference of 0.010%), Immigrants from Uganda (90.1%, a difference of 0.010%), Immigrants (90.1%, a difference of 0.010%), Immigrants from Bosnia and Herzegovina (90.1%, a difference of 0.020%), and Immigrants from Micronesia (90.1%, a difference of 0.030%).
| Demographics | Rating | Rank | 1 or more Vehicles in Household |
| Sioux | 81.3 /100 | #145 | Excellent 90.2% |
| Bahamians | 80.5 /100 | #146 | Excellent 90.2% |
| Chileans | 79.8 /100 | #147 | Good 90.2% |
| Immigrants | Eastern Africa | 78.2 /100 | #148 | Good 90.1% |
| Immigrants | Nicaragua | 76.7 /100 | #149 | Good 90.1% |
| Immigrants | Micronesia | 75.9 /100 | #150 | Good 90.1% |
| Immigrants | Bosnia and Herzegovina | 75.4 /100 | #151 | Good 90.1% |
| Tlingit-Haida | 74.3 /100 | #152 | Good 90.1% |
| New Zealanders | 73.8 /100 | #153 | Good 90.1% |
| Immigrants | Uganda | 73.8 /100 | #154 | Good 90.1% |
| Immigrants | Immigrants | 73.6 /100 | #155 | Good 90.1% |
| Australians | 72.4 /100 | #156 | Good 90.0% |
| Immigrants | Congo | 71.2 /100 | #157 | Good 90.0% |
| Brazilians | 71.0 /100 | #158 | Good 90.0% |
| South Africans | 69.7 /100 | #159 | Good 90.0% |
Demographics Similar to Immigrants from Romania by 1 or more Vehicles in Household
In terms of 1 or more vehicles in household, the demographic groups most similar to Immigrants from Romania are Immigrants from Norway (88.7%, a difference of 0.010%), Immigrants from Sierra Leone (88.7%, a difference of 0.010%), Cheyenne (88.7%, a difference of 0.020%), Ute (88.7%, a difference of 0.020%), and Russian (88.7%, a difference of 0.030%).
| Demographics | Rating | Rank | 1 or more Vehicles in Household |
| Uruguayans | 7.0 /100 | #222 | Tragic 88.8% |
| Immigrants | South America | 7.0 /100 | #223 | Tragic 88.8% |
| Immigrants | Hong Kong | 6.2 /100 | #224 | Tragic 88.7% |
| Cree | 6.0 /100 | #225 | Tragic 88.7% |
| Cheyenne | 5.7 /100 | #226 | Tragic 88.7% |
| Ute | 5.6 /100 | #227 | Tragic 88.7% |
| Immigrants | Norway | 5.5 /100 | #228 | Tragic 88.7% |
| Immigrants | Romania | 5.4 /100 | #229 | Tragic 88.7% |
| Immigrants | Sierra Leone | 5.2 /100 | #230 | Tragic 88.7% |
| Russians | 5.0 /100 | #231 | Tragic 88.7% |
| Immigrants | Japan | 4.9 /100 | #232 | Tragic 88.7% |
| Houma | 4.8 /100 | #233 | Tragic 88.6% |
| Immigrants | Peru | 4.7 /100 | #234 | Tragic 88.6% |
| Paiute | 4.6 /100 | #235 | Tragic 88.6% |
| Immigrants | Pakistan | 4.5 /100 | #236 | Tragic 88.6% |