Immigrants from Haiti vs Immigrants from Romania 1 or more Vehicles in Household
COMPARE
Immigrants from Haiti
Immigrants from Romania
1 or more Vehicles in Household
1 or more Vehicles in Household Comparison
Immigrants from Haiti
Immigrants from Romania
84.7%
1 OR MORE VEHICLES IN HOUSEHOLD
0.0/ 100
METRIC RATING
309th/ 347
METRIC RANK
88.7%
1 OR MORE VEHICLES IN HOUSEHOLD
5.4/ 100
METRIC RATING
229th/ 347
METRIC RANK
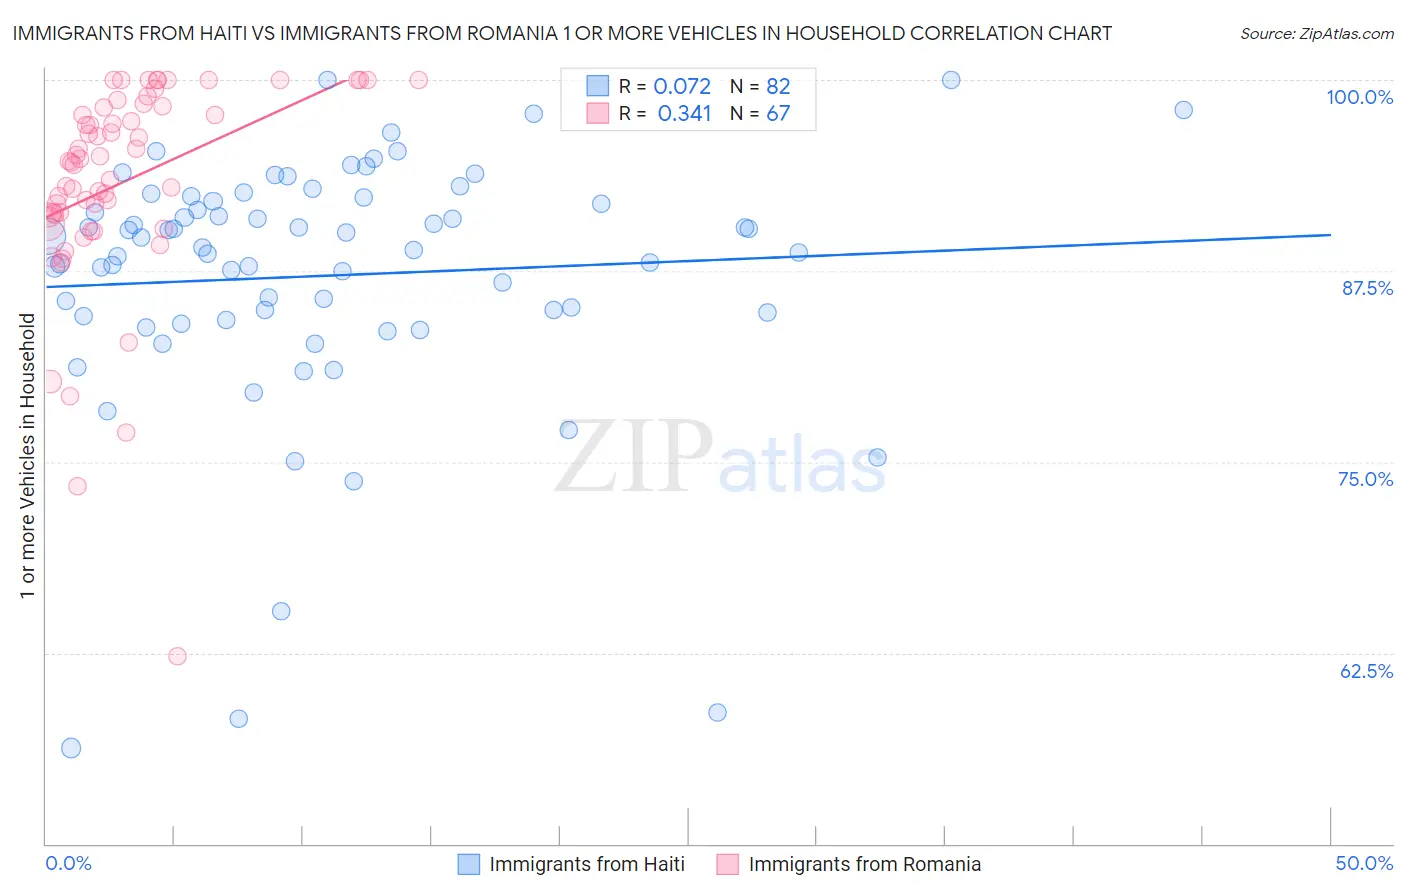
Immigrants from Haiti vs Immigrants from Romania 1 or more Vehicles in Household Correlation Chart
The statistical analysis conducted on geographies consisting of 225,185,798 people shows a slight positive correlation between the proportion of Immigrants from Haiti and percentage of households with 1 or more vehicles available in the United States with a correlation coefficient (R) of 0.072 and weighted average of 84.7%. Similarly, the statistical analysis conducted on geographies consisting of 256,889,891 people shows a mild positive correlation between the proportion of Immigrants from Romania and percentage of households with 1 or more vehicles available in the United States with a correlation coefficient (R) of 0.341 and weighted average of 88.7%, a difference of 4.8%.
1 or more Vehicles in Household Correlation Summary
| Measurement | Immigrants from Haiti | Immigrants from Romania |
| Minimum | 56.3% | 62.3% |
| Maximum | 100.0% | 100.0% |
| Range | 43.7% | 37.7% |
| Mean | 87.2% | 93.3% |
| Median | 88.9% | 94.7% |
| Interquartile 25% (IQ1) | 84.5% | 91.1% |
| Interquartile 75% (IQ3) | 92.1% | 98.3% |
| Interquartile Range (IQR) | 7.5% | 7.1% |
| Standard Deviation (Sample) | 8.3% | 6.9% |
| Standard Deviation (Population) | 8.3% | 6.9% |
Similar Demographics by 1 or more Vehicles in Household
Demographics Similar to Immigrants from Haiti by 1 or more Vehicles in Household
In terms of 1 or more vehicles in household, the demographic groups most similar to Immigrants from Haiti are Immigrants from Belize (84.7%, a difference of 0.010%), U.S. Virgin Islander (84.6%, a difference of 0.030%), Tohono O'odham (84.7%, a difference of 0.040%), Puerto Rican (84.6%, a difference of 0.070%), and Cape Verdean (84.5%, a difference of 0.18%).
| Demographics | Rating | Rank | 1 or more Vehicles in Household |
| Moroccans | 0.0 /100 | #302 | Tragic 85.4% |
| Immigrants | Greece | 0.0 /100 | #303 | Tragic 85.4% |
| Immigrants | Ukraine | 0.0 /100 | #304 | Tragic 85.2% |
| Immigrants | China | 0.0 /100 | #305 | Tragic 84.9% |
| Immigrants | Western Africa | 0.0 /100 | #306 | Tragic 84.9% |
| Tohono O'odham | 0.0 /100 | #307 | Tragic 84.7% |
| Immigrants | Belize | 0.0 /100 | #308 | Tragic 84.7% |
| Immigrants | Haiti | 0.0 /100 | #309 | Tragic 84.7% |
| U.S. Virgin Islanders | 0.0 /100 | #310 | Tragic 84.6% |
| Puerto Ricans | 0.0 /100 | #311 | Tragic 84.6% |
| Cape Verdeans | 0.0 /100 | #312 | Tragic 84.5% |
| Immigrants | Israel | 0.0 /100 | #313 | Tragic 84.5% |
| Albanians | 0.0 /100 | #314 | Tragic 84.4% |
| Cypriots | 0.0 /100 | #315 | Tragic 84.4% |
| Alaska Natives | 0.0 /100 | #316 | Tragic 83.8% |
Demographics Similar to Immigrants from Romania by 1 or more Vehicles in Household
In terms of 1 or more vehicles in household, the demographic groups most similar to Immigrants from Romania are Immigrants from Norway (88.7%, a difference of 0.010%), Immigrants from Sierra Leone (88.7%, a difference of 0.010%), Cheyenne (88.7%, a difference of 0.020%), Ute (88.7%, a difference of 0.020%), and Russian (88.7%, a difference of 0.030%).
| Demographics | Rating | Rank | 1 or more Vehicles in Household |
| Uruguayans | 7.0 /100 | #222 | Tragic 88.8% |
| Immigrants | South America | 7.0 /100 | #223 | Tragic 88.8% |
| Immigrants | Hong Kong | 6.2 /100 | #224 | Tragic 88.7% |
| Cree | 6.0 /100 | #225 | Tragic 88.7% |
| Cheyenne | 5.7 /100 | #226 | Tragic 88.7% |
| Ute | 5.6 /100 | #227 | Tragic 88.7% |
| Immigrants | Norway | 5.5 /100 | #228 | Tragic 88.7% |
| Immigrants | Romania | 5.4 /100 | #229 | Tragic 88.7% |
| Immigrants | Sierra Leone | 5.2 /100 | #230 | Tragic 88.7% |
| Russians | 5.0 /100 | #231 | Tragic 88.7% |
| Immigrants | Japan | 4.9 /100 | #232 | Tragic 88.7% |
| Houma | 4.8 /100 | #233 | Tragic 88.6% |
| Immigrants | Peru | 4.7 /100 | #234 | Tragic 88.6% |
| Paiute | 4.6 /100 | #235 | Tragic 88.6% |
| Immigrants | Pakistan | 4.5 /100 | #236 | Tragic 88.6% |