Jordanian vs Immigrants from Romania 1 or more Vehicles in Household
COMPARE
Jordanian
Immigrants from Romania
1 or more Vehicles in Household
1 or more Vehicles in Household Comparison
Jordanians
Immigrants from Romania
91.4%
1 OR MORE VEHICLES IN HOUSEHOLD
99.3/ 100
METRIC RATING
84th/ 347
METRIC RANK
88.7%
1 OR MORE VEHICLES IN HOUSEHOLD
5.4/ 100
METRIC RATING
229th/ 347
METRIC RANK
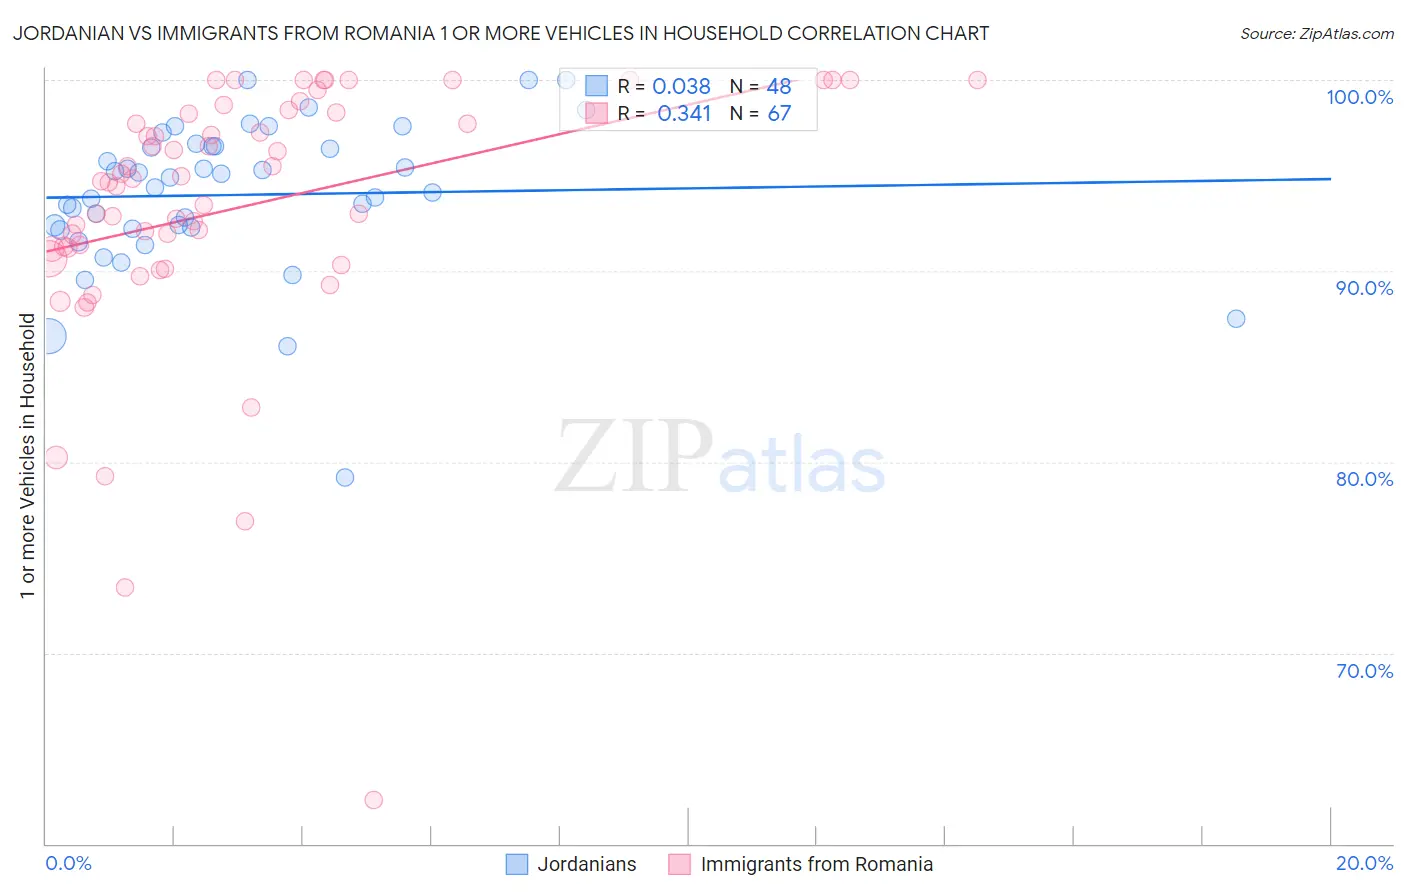
Jordanian vs Immigrants from Romania 1 or more Vehicles in Household Correlation Chart
The statistical analysis conducted on geographies consisting of 166,397,972 people shows no correlation between the proportion of Jordanians and percentage of households with 1 or more vehicles available in the United States with a correlation coefficient (R) of 0.038 and weighted average of 91.4%. Similarly, the statistical analysis conducted on geographies consisting of 256,889,891 people shows a mild positive correlation between the proportion of Immigrants from Romania and percentage of households with 1 or more vehicles available in the United States with a correlation coefficient (R) of 0.341 and weighted average of 88.7%, a difference of 3.1%.
1 or more Vehicles in Household Correlation Summary
| Measurement | Jordanian | Immigrants from Romania |
| Minimum | 79.2% | 62.3% |
| Maximum | 100.0% | 100.0% |
| Range | 20.8% | 37.7% |
| Mean | 94.0% | 93.3% |
| Median | 94.6% | 94.7% |
| Interquartile 25% (IQ1) | 92.2% | 91.1% |
| Interquartile 75% (IQ3) | 96.5% | 98.3% |
| Interquartile Range (IQR) | 4.3% | 7.1% |
| Standard Deviation (Sample) | 3.9% | 6.9% |
| Standard Deviation (Population) | 3.9% | 6.9% |
Similar Demographics by 1 or more Vehicles in Household
Demographics Similar to Jordanians by 1 or more Vehicles in Household
In terms of 1 or more vehicles in household, the demographic groups most similar to Jordanians are Immigrants from England (91.4%, a difference of 0.010%), Tsimshian (91.4%, a difference of 0.010%), Immigrants from South Eastern Asia (91.4%, a difference of 0.020%), Lebanese (91.4%, a difference of 0.020%), and Osage (91.4%, a difference of 0.030%).
| Demographics | Rating | Rank | 1 or more Vehicles in Household |
| Immigrants | Philippines | 99.4 /100 | #77 | Exceptional 91.5% |
| Iranians | 99.4 /100 | #78 | Exceptional 91.5% |
| Immigrants | South Central Asia | 99.4 /100 | #79 | Exceptional 91.5% |
| Bolivians | 99.4 /100 | #80 | Exceptional 91.5% |
| Immigrants | South Eastern Asia | 99.3 /100 | #81 | Exceptional 91.4% |
| Lebanese | 99.3 /100 | #82 | Exceptional 91.4% |
| Immigrants | England | 99.3 /100 | #83 | Exceptional 91.4% |
| Jordanians | 99.3 /100 | #84 | Exceptional 91.4% |
| Tsimshian | 99.3 /100 | #85 | Exceptional 91.4% |
| Osage | 99.2 /100 | #86 | Exceptional 91.4% |
| Immigrants | Germany | 99.2 /100 | #87 | Exceptional 91.4% |
| Spanish Americans | 99.2 /100 | #88 | Exceptional 91.4% |
| Bangladeshis | 99.2 /100 | #89 | Exceptional 91.4% |
| Immigrants | Canada | 99.2 /100 | #90 | Exceptional 91.4% |
| Immigrants | Jordan | 99.2 /100 | #91 | Exceptional 91.4% |
Demographics Similar to Immigrants from Romania by 1 or more Vehicles in Household
In terms of 1 or more vehicles in household, the demographic groups most similar to Immigrants from Romania are Immigrants from Norway (88.7%, a difference of 0.010%), Immigrants from Sierra Leone (88.7%, a difference of 0.010%), Cheyenne (88.7%, a difference of 0.020%), Ute (88.7%, a difference of 0.020%), and Russian (88.7%, a difference of 0.030%).
| Demographics | Rating | Rank | 1 or more Vehicles in Household |
| Uruguayans | 7.0 /100 | #222 | Tragic 88.8% |
| Immigrants | South America | 7.0 /100 | #223 | Tragic 88.8% |
| Immigrants | Hong Kong | 6.2 /100 | #224 | Tragic 88.7% |
| Cree | 6.0 /100 | #225 | Tragic 88.7% |
| Cheyenne | 5.7 /100 | #226 | Tragic 88.7% |
| Ute | 5.6 /100 | #227 | Tragic 88.7% |
| Immigrants | Norway | 5.5 /100 | #228 | Tragic 88.7% |
| Immigrants | Romania | 5.4 /100 | #229 | Tragic 88.7% |
| Immigrants | Sierra Leone | 5.2 /100 | #230 | Tragic 88.7% |
| Russians | 5.0 /100 | #231 | Tragic 88.7% |
| Immigrants | Japan | 4.9 /100 | #232 | Tragic 88.7% |
| Houma | 4.8 /100 | #233 | Tragic 88.6% |
| Immigrants | Peru | 4.7 /100 | #234 | Tragic 88.6% |
| Paiute | 4.6 /100 | #235 | Tragic 88.6% |
| Immigrants | Pakistan | 4.5 /100 | #236 | Tragic 88.6% |