Taiwanese vs Immigrants from England No Vehicles in Household
COMPARE
Taiwanese
Immigrants from England
No Vehicles in Household
No Vehicles in Household Comparison
Taiwanese
Immigrants from England
11.7%
NO VEHICLES IN HOUSEHOLD
2.8/ 100
METRIC RATING
239th/ 347
METRIC RANK
8.7%
NO VEHICLES IN HOUSEHOLD
99.2/ 100
METRIC RATING
87th/ 347
METRIC RANK
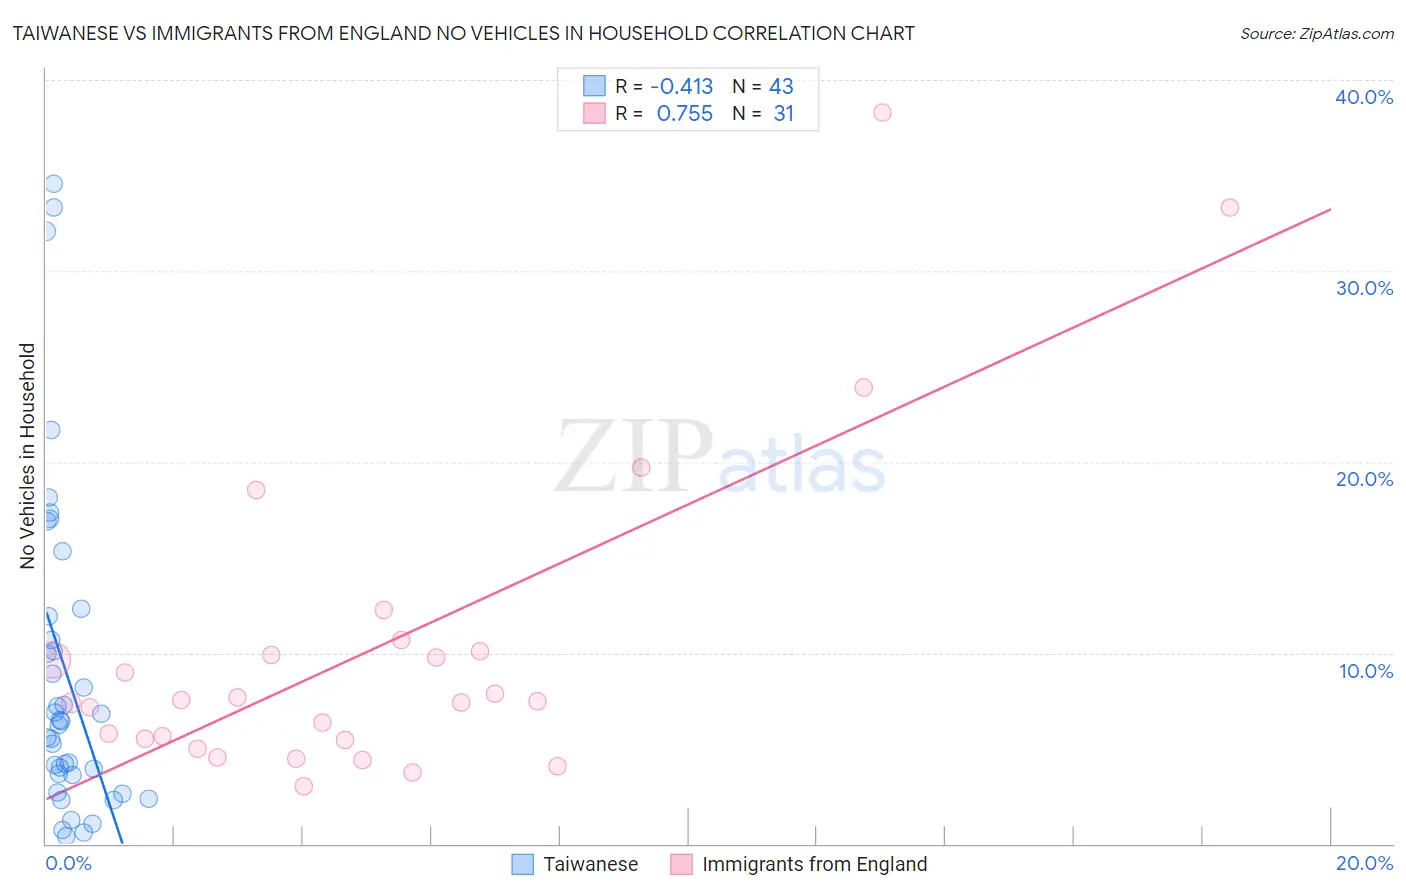
Taiwanese vs Immigrants from England No Vehicles in Household Correlation Chart
The statistical analysis conducted on geographies consisting of 31,685,560 people shows a moderate negative correlation between the proportion of Taiwanese and percentage of households with no vehicle available in the United States with a correlation coefficient (R) of -0.413 and weighted average of 11.7%. Similarly, the statistical analysis conducted on geographies consisting of 390,853,276 people shows a strong positive correlation between the proportion of Immigrants from England and percentage of households with no vehicle available in the United States with a correlation coefficient (R) of 0.755 and weighted average of 8.7%, a difference of 34.2%.
No Vehicles in Household Correlation Summary
| Measurement | Taiwanese | Immigrants from England |
| Minimum | 0.39% | 3.0% |
| Maximum | 34.6% | 38.3% |
| Range | 34.2% | 35.3% |
| Mean | 9.0% | 10.2% |
| Median | 6.4% | 7.5% |
| Interquartile 25% (IQ1) | 3.6% | 5.4% |
| Interquartile 75% (IQ3) | 11.9% | 10.1% |
| Interquartile Range (IQR) | 8.3% | 4.6% |
| Standard Deviation (Sample) | 8.6% | 8.3% |
| Standard Deviation (Population) | 8.5% | 8.2% |
Similar Demographics by No Vehicles in Household
Demographics Similar to Taiwanese by No Vehicles in Household
In terms of no vehicles in household, the demographic groups most similar to Taiwanese are Immigrants (11.7%, a difference of 0.060%), Eastern European (11.7%, a difference of 0.070%), Turkish (11.7%, a difference of 0.18%), Russian (11.6%, a difference of 0.46%), and Ute (11.6%, a difference of 0.51%).
| Demographics | Rating | Rank | No Vehicles in Household |
| Immigrants | Turkey | 4.8 /100 | #232 | Tragic 11.5% |
| Houma | 4.7 /100 | #233 | Tragic 11.5% |
| Immigrants | Peru | 4.5 /100 | #234 | Tragic 11.5% |
| Kiowa | 4.0 /100 | #235 | Tragic 11.5% |
| Cree | 3.5 /100 | #236 | Tragic 11.6% |
| Ute | 3.3 /100 | #237 | Tragic 11.6% |
| Russians | 3.2 /100 | #238 | Tragic 11.6% |
| Taiwanese | 2.8 /100 | #239 | Tragic 11.7% |
| Immigrants | Immigrants | 2.7 /100 | #240 | Tragic 11.7% |
| Eastern Europeans | 2.7 /100 | #241 | Tragic 11.7% |
| Turks | 2.6 /100 | #242 | Tragic 11.7% |
| Cheyenne | 2.4 /100 | #243 | Tragic 11.7% |
| Immigrants | Portugal | 2.2 /100 | #244 | Tragic 11.7% |
| Immigrants | Honduras | 2.1 /100 | #245 | Tragic 11.8% |
| Menominee | 2.0 /100 | #246 | Tragic 11.8% |
Demographics Similar to Immigrants from England by No Vehicles in Household
In terms of no vehicles in household, the demographic groups most similar to Immigrants from England are Osage (8.7%, a difference of 0.12%), Bangladeshi (8.7%, a difference of 0.22%), Immigrants from Cuba (8.7%, a difference of 0.26%), Lebanese (8.7%, a difference of 0.33%), and Bhutanese (8.7%, a difference of 0.35%).
| Demographics | Rating | Rank | No Vehicles in Household |
| Bolivians | 99.4 /100 | #80 | Exceptional 8.6% |
| Tsimshian | 99.4 /100 | #81 | Exceptional 8.6% |
| Immigrants | South Eastern Asia | 99.4 /100 | #82 | Exceptional 8.6% |
| Italians | 99.4 /100 | #83 | Exceptional 8.6% |
| Immigrants | Jordan | 99.3 /100 | #84 | Exceptional 8.7% |
| Lebanese | 99.3 /100 | #85 | Exceptional 8.7% |
| Bangladeshis | 99.3 /100 | #86 | Exceptional 8.7% |
| Immigrants | England | 99.2 /100 | #87 | Exceptional 8.7% |
| Osage | 99.2 /100 | #88 | Exceptional 8.7% |
| Immigrants | Cuba | 99.2 /100 | #89 | Exceptional 8.7% |
| Bhutanese | 99.2 /100 | #90 | Exceptional 8.7% |
| Immigrants | Germany | 99.1 /100 | #91 | Exceptional 8.7% |
| Immigrants | Canada | 99.1 /100 | #92 | Exceptional 8.7% |
| Immigrants | North America | 99.1 /100 | #93 | Exceptional 8.7% |
| Austrians | 98.9 /100 | #94 | Exceptional 8.8% |