Palestinian vs Immigrants from England No Vehicles in Household
COMPARE
Palestinian
Immigrants from England
No Vehicles in Household
No Vehicles in Household Comparison
Palestinians
Immigrants from England
8.3%
NO VEHICLES IN HOUSEHOLD
99.7/ 100
METRIC RATING
66th/ 347
METRIC RANK
8.7%
NO VEHICLES IN HOUSEHOLD
99.2/ 100
METRIC RATING
87th/ 347
METRIC RANK
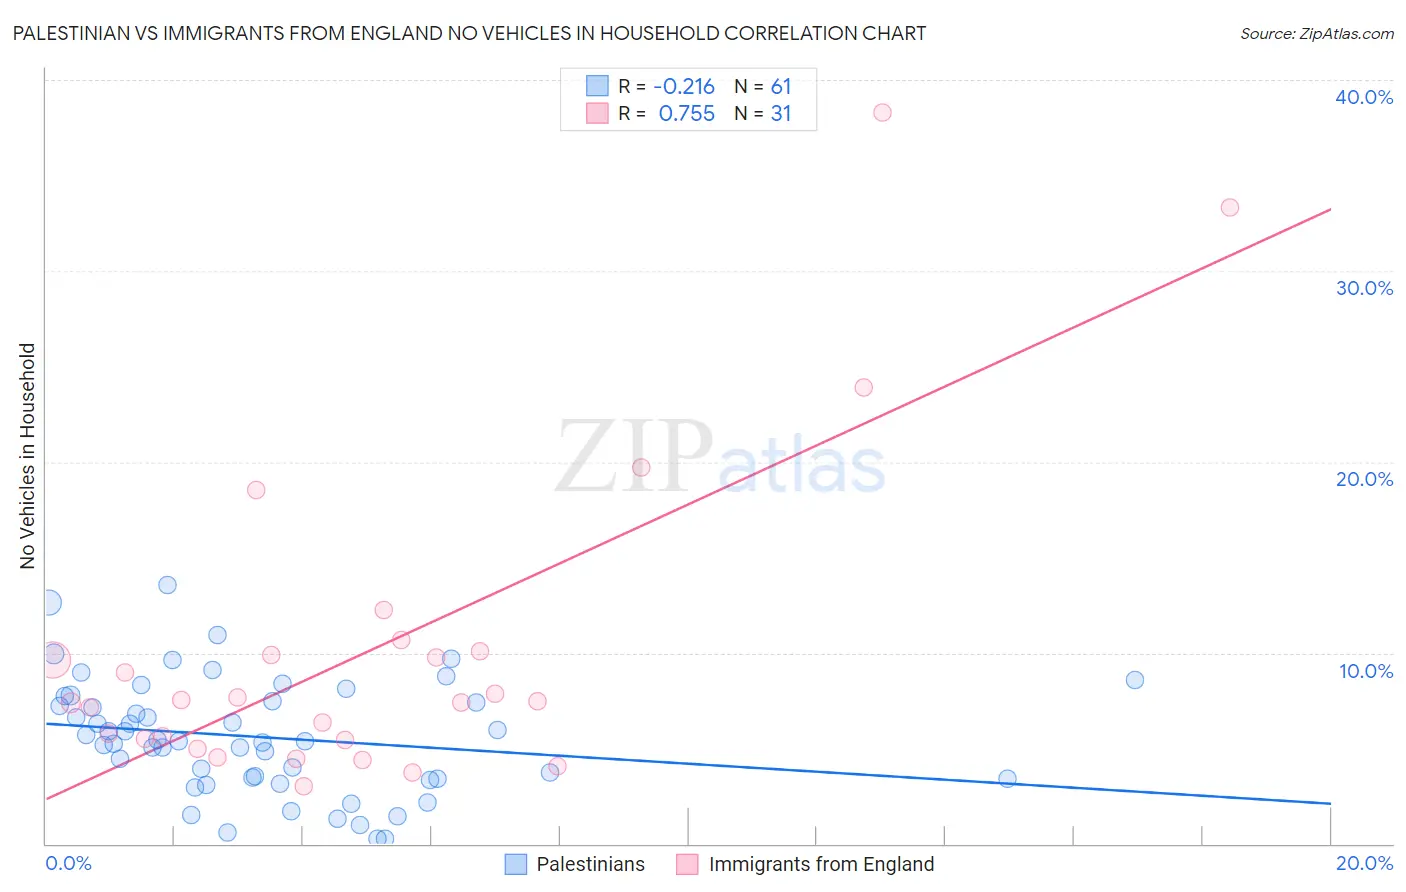
Palestinian vs Immigrants from England No Vehicles in Household Correlation Chart
The statistical analysis conducted on geographies consisting of 216,223,800 people shows a weak negative correlation between the proportion of Palestinians and percentage of households with no vehicle available in the United States with a correlation coefficient (R) of -0.216 and weighted average of 8.3%. Similarly, the statistical analysis conducted on geographies consisting of 390,853,276 people shows a strong positive correlation between the proportion of Immigrants from England and percentage of households with no vehicle available in the United States with a correlation coefficient (R) of 0.755 and weighted average of 8.7%, a difference of 4.2%.
No Vehicles in Household Correlation Summary
| Measurement | Palestinian | Immigrants from England |
| Minimum | 0.29% | 3.0% |
| Maximum | 13.6% | 38.3% |
| Range | 13.3% | 35.3% |
| Mean | 5.6% | 10.2% |
| Median | 5.4% | 7.5% |
| Interquartile 25% (IQ1) | 3.4% | 5.4% |
| Interquartile 75% (IQ3) | 7.6% | 10.1% |
| Interquartile Range (IQR) | 4.2% | 4.6% |
| Standard Deviation (Sample) | 3.0% | 8.3% |
| Standard Deviation (Population) | 3.0% | 8.2% |
Similar Demographics by No Vehicles in Household
Demographics Similar to Palestinians by No Vehicles in Household
In terms of no vehicles in household, the demographic groups most similar to Palestinians are Immigrants from Scotland (8.3%, a difference of 0.010%), Canadian (8.3%, a difference of 0.11%), Immigrants from Iran (8.4%, a difference of 0.41%), Spaniard (8.4%, a difference of 0.46%), and Croatian (8.3%, a difference of 0.86%).
| Demographics | Rating | Rank | No Vehicles in Household |
| Immigrants | India | 99.8 /100 | #59 | Exceptional 8.2% |
| Immigrants | Laos | 99.8 /100 | #60 | Exceptional 8.2% |
| Thais | 99.8 /100 | #61 | Exceptional 8.2% |
| Chinese | 99.8 /100 | #62 | Exceptional 8.2% |
| Slovaks | 99.8 /100 | #63 | Exceptional 8.3% |
| Croatians | 99.8 /100 | #64 | Exceptional 8.3% |
| Canadians | 99.7 /100 | #65 | Exceptional 8.3% |
| Palestinians | 99.7 /100 | #66 | Exceptional 8.3% |
| Immigrants | Scotland | 99.7 /100 | #67 | Exceptional 8.3% |
| Immigrants | Iran | 99.7 /100 | #68 | Exceptional 8.4% |
| Spaniards | 99.7 /100 | #69 | Exceptional 8.4% |
| Cajuns | 99.6 /100 | #70 | Exceptional 8.4% |
| Immigrants | Lebanon | 99.6 /100 | #71 | Exceptional 8.4% |
| Lithuanians | 99.6 /100 | #72 | Exceptional 8.4% |
| Poles | 99.6 /100 | #73 | Exceptional 8.4% |
Demographics Similar to Immigrants from England by No Vehicles in Household
In terms of no vehicles in household, the demographic groups most similar to Immigrants from England are Osage (8.7%, a difference of 0.12%), Bangladeshi (8.7%, a difference of 0.22%), Immigrants from Cuba (8.7%, a difference of 0.26%), Lebanese (8.7%, a difference of 0.33%), and Bhutanese (8.7%, a difference of 0.35%).
| Demographics | Rating | Rank | No Vehicles in Household |
| Bolivians | 99.4 /100 | #80 | Exceptional 8.6% |
| Tsimshian | 99.4 /100 | #81 | Exceptional 8.6% |
| Immigrants | South Eastern Asia | 99.4 /100 | #82 | Exceptional 8.6% |
| Italians | 99.4 /100 | #83 | Exceptional 8.6% |
| Immigrants | Jordan | 99.3 /100 | #84 | Exceptional 8.7% |
| Lebanese | 99.3 /100 | #85 | Exceptional 8.7% |
| Bangladeshis | 99.3 /100 | #86 | Exceptional 8.7% |
| Immigrants | England | 99.2 /100 | #87 | Exceptional 8.7% |
| Osage | 99.2 /100 | #88 | Exceptional 8.7% |
| Immigrants | Cuba | 99.2 /100 | #89 | Exceptional 8.7% |
| Bhutanese | 99.2 /100 | #90 | Exceptional 8.7% |
| Immigrants | Germany | 99.1 /100 | #91 | Exceptional 8.7% |
| Immigrants | Canada | 99.1 /100 | #92 | Exceptional 8.7% |
| Immigrants | North America | 99.1 /100 | #93 | Exceptional 8.7% |
| Austrians | 98.9 /100 | #94 | Exceptional 8.8% |