European vs Immigrants from Grenada 1 or more Vehicles in Household
COMPARE
European
Immigrants from Grenada
1 or more Vehicles in Household
1 or more Vehicles in Household Comparison
Europeans
Immigrants from Grenada
93.0%
1 OR MORE VEHICLES IN HOUSEHOLD
100.0/ 100
METRIC RATING
17th/ 347
METRIC RANK
62.7%
1 OR MORE VEHICLES IN HOUSEHOLD
0.0/ 100
METRIC RATING
346th/ 347
METRIC RANK
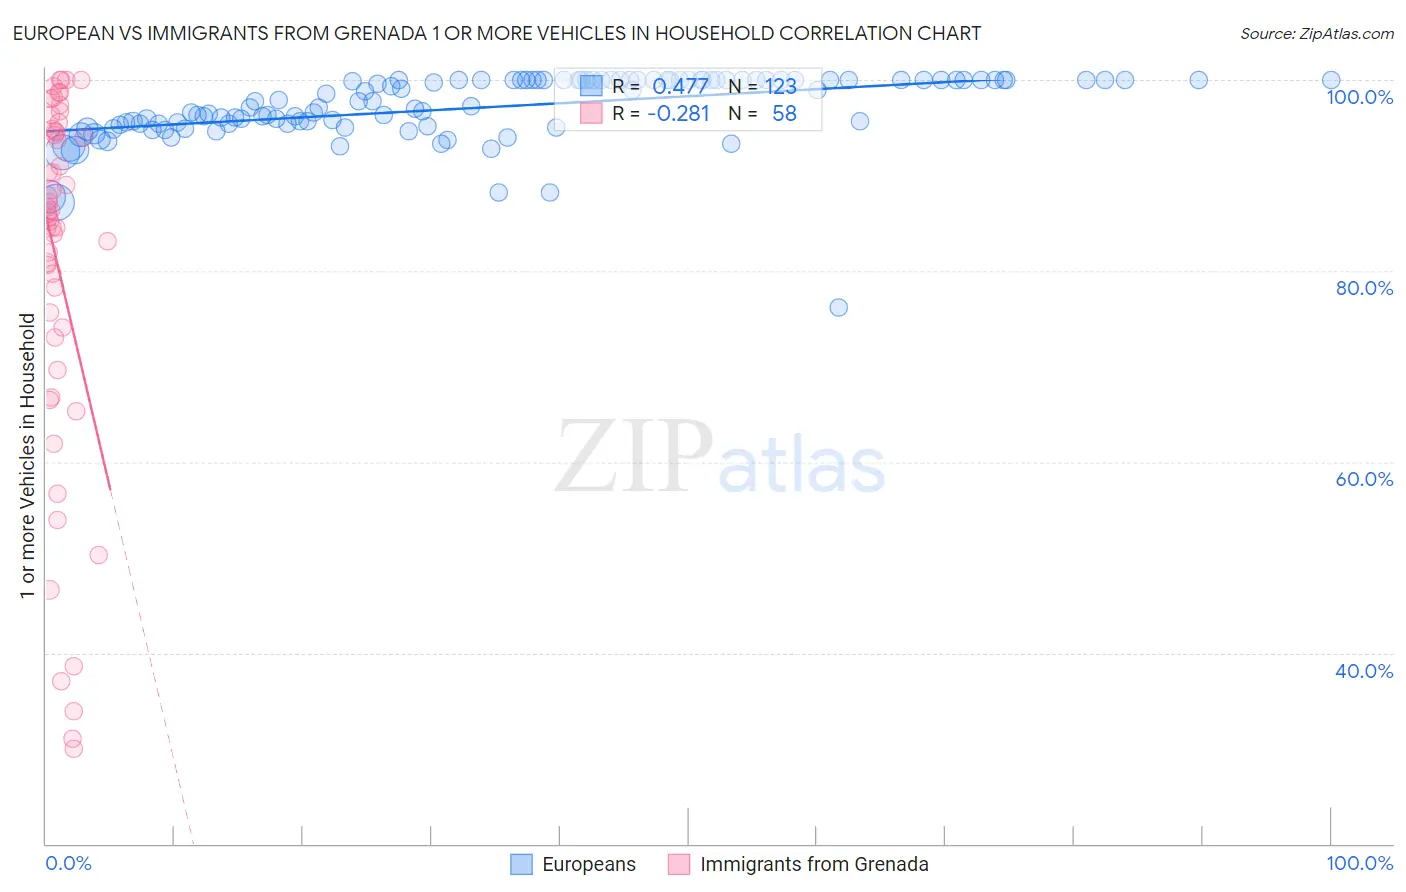
European vs Immigrants from Grenada 1 or more Vehicles in Household Correlation Chart
The statistical analysis conducted on geographies consisting of 561,342,518 people shows a moderate positive correlation between the proportion of Europeans and percentage of households with 1 or more vehicles available in the United States with a correlation coefficient (R) of 0.477 and weighted average of 93.0%. Similarly, the statistical analysis conducted on geographies consisting of 67,200,374 people shows a weak negative correlation between the proportion of Immigrants from Grenada and percentage of households with 1 or more vehicles available in the United States with a correlation coefficient (R) of -0.281 and weighted average of 62.7%, a difference of 48.4%.
1 or more Vehicles in Household Correlation Summary
| Measurement | European | Immigrants from Grenada |
| Minimum | 76.1% | 30.0% |
| Maximum | 100.0% | 100.0% |
| Range | 23.9% | 70.0% |
| Mean | 97.1% | 80.2% |
| Median | 97.8% | 85.9% |
| Interquartile 25% (IQ1) | 95.4% | 73.0% |
| Interquartile 75% (IQ3) | 100.0% | 94.7% |
| Interquartile Range (IQR) | 4.6% | 21.6% |
| Standard Deviation (Sample) | 3.5% | 19.4% |
| Standard Deviation (Population) | 3.5% | 19.2% |
Similar Demographics by 1 or more Vehicles in Household
Demographics Similar to Europeans by 1 or more Vehicles in Household
In terms of 1 or more vehicles in household, the demographic groups most similar to Europeans are Mexican (93.0%, a difference of 0.030%), Assyrian/Chaldean/Syriac (93.0%, a difference of 0.030%), Irish (93.1%, a difference of 0.040%), Welsh (93.0%, a difference of 0.040%), and White/Caucasian (93.1%, a difference of 0.090%).
| Demographics | Rating | Rank | 1 or more Vehicles in Household |
| Dutch | 100.0 /100 | #10 | Exceptional 93.3% |
| Czechs | 100.0 /100 | #11 | Exceptional 93.3% |
| Scandinavians | 100.0 /100 | #12 | Exceptional 93.1% |
| Whites/Caucasians | 100.0 /100 | #13 | Exceptional 93.1% |
| Irish | 100.0 /100 | #14 | Exceptional 93.1% |
| Mexicans | 100.0 /100 | #15 | Exceptional 93.0% |
| Assyrians/Chaldeans/Syriacs | 100.0 /100 | #16 | Exceptional 93.0% |
| Europeans | 100.0 /100 | #17 | Exceptional 93.0% |
| Welsh | 100.0 /100 | #18 | Exceptional 93.0% |
| Tongans | 100.0 /100 | #19 | Exceptional 92.9% |
| Arapaho | 100.0 /100 | #20 | Exceptional 92.7% |
| Ottawa | 100.0 /100 | #21 | Exceptional 92.7% |
| French | 100.0 /100 | #22 | Exceptional 92.7% |
| Nepalese | 100.0 /100 | #23 | Exceptional 92.6% |
| Yaqui | 100.0 /100 | #24 | Exceptional 92.6% |
Demographics Similar to Immigrants from Grenada by 1 or more Vehicles in Household
In terms of 1 or more vehicles in household, the demographic groups most similar to Immigrants from Grenada are Immigrants from St. Vincent and the Grenadines (64.7%, a difference of 3.2%), Yup'ik (58.4%, a difference of 7.2%), Immigrants from Dominican Republic (68.6%, a difference of 9.5%), British West Indian (70.4%, a difference of 12.2%), and Immigrants from Guyana (70.6%, a difference of 12.6%).
| Demographics | Rating | Rank | 1 or more Vehicles in Household |
| Immigrants | Ecuador | 0.0 /100 | #333 | Tragic 76.2% |
| Immigrants | Bangladesh | 0.0 /100 | #334 | Tragic 74.3% |
| Barbadians | 0.0 /100 | #335 | Tragic 74.0% |
| Vietnamese | 0.0 /100 | #336 | Tragic 73.8% |
| Immigrants | Uzbekistan | 0.0 /100 | #337 | Tragic 73.4% |
| Inupiat | 0.0 /100 | #338 | Tragic 71.5% |
| Guyanese | 0.0 /100 | #339 | Tragic 70.8% |
| Dominicans | 0.0 /100 | #340 | Tragic 70.7% |
| Immigrants | Barbados | 0.0 /100 | #341 | Tragic 70.6% |
| Immigrants | Guyana | 0.0 /100 | #342 | Tragic 70.6% |
| British West Indians | 0.0 /100 | #343 | Tragic 70.4% |
| Immigrants | Dominican Republic | 0.0 /100 | #344 | Tragic 68.6% |
| Immigrants | St. Vincent and the Grenadines | 0.0 /100 | #345 | Tragic 64.7% |
| Immigrants | Grenada | 0.0 /100 | #346 | Tragic 62.7% |
| Yup'ik | 0.0 /100 | #347 | Tragic 58.4% |